Clinton, NJ
Clinton Map
Clinton Overview
2,775
TOTAL POPULATION
1,385
MALE POPULATION
1,390
FEMALE POPULATION
99.64
MALES / 100 FEMALES
100.36
FEMALES / 100 MALES
40.0
MEDIAN AGE
3.0
AVG FAMILY SIZE
2.5
AVG HOUSEHOLD SIZE
$61,403
PER CAPITA INCOME
$160,000
AVG FAMILY INCOME
$137,688
AVG HOUSEHOLD INCOME
34.4%
WAGE / INCOME GAP [ % ]
65.6¢/ $1
WAGE / INCOME GAP [ $ ]
0.39
INEQUALITY / GINI INDEX
1,630
LABOR FORCE [ PEOPLE ]
72.2%
PERCENT IN LABOR FORCE
3.6%
UNEMPLOYMENT RATE
Clinton Zip Codes
Clinton Area Codes
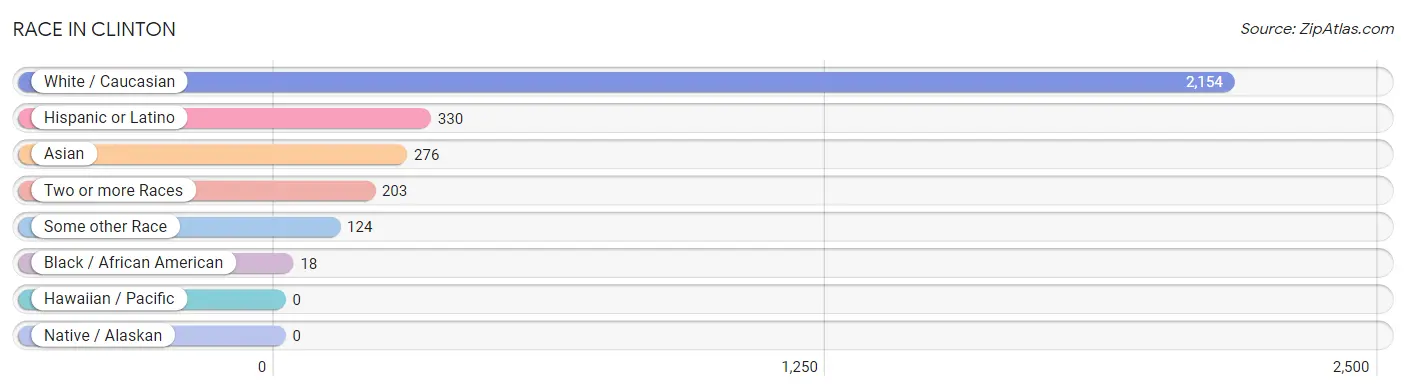
Race in Clinton
The most populous races in Clinton are White / Caucasian (2,154 | 77.6%), Hispanic or Latino (330 | 11.9%), and Asian (276 | 10.0%).
| Race | # Population | % Population |
| Asian | 276 | 10.0% |
| Black / African American | 18 | 0.6% |
| Hawaiian / Pacific | 0 | 0.0% |
| Hispanic or Latino | 330 | 11.9% |
| Native / Alaskan | 0 | 0.0% |
| White / Caucasian | 2,154 | 77.6% |
| Two or more Races | 203 | 7.3% |
| Some other Race | 124 | 4.5% |
| Total | 2,775 | 100.0% |
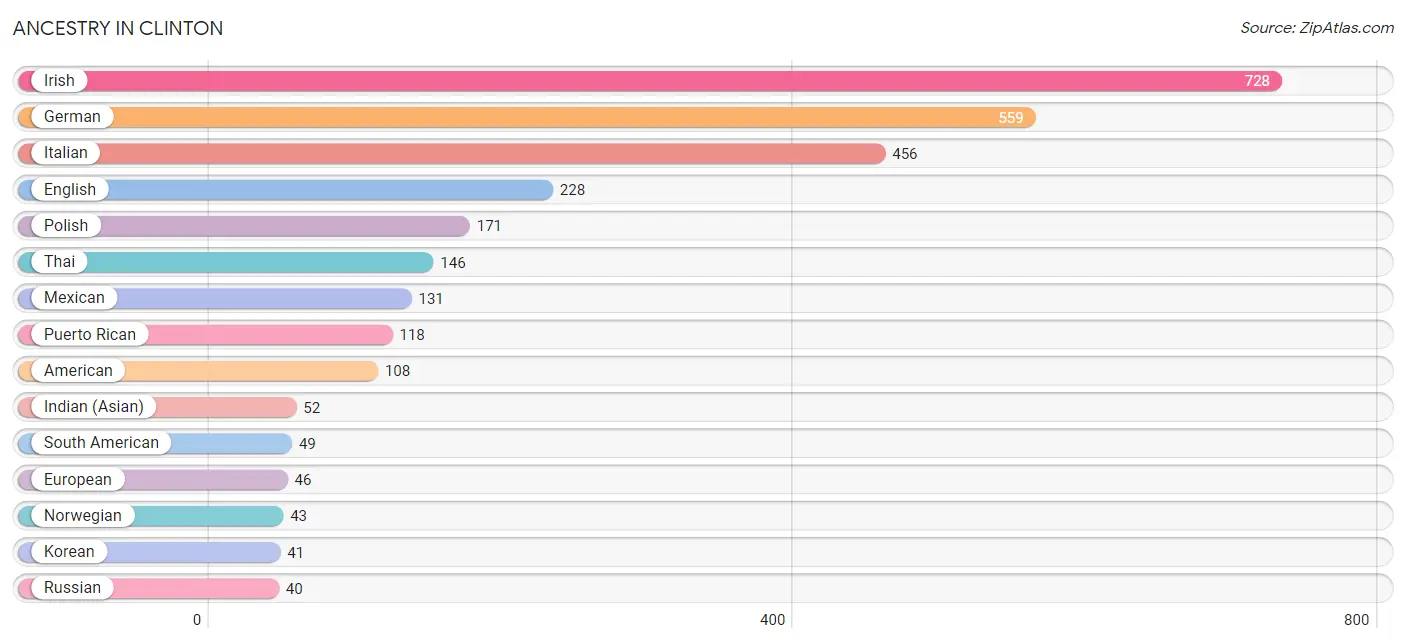
Ancestry in Clinton
The most populous ancestries reported in Clinton are Irish (728 | 26.2%), German (559 | 20.1%), Italian (456 | 16.4%), English (228 | 8.2%), and Polish (171 | 6.2%), together accounting for 77.2% of all Clinton residents.
| Ancestry | # Population | % Population |
| African | 1 | 0.0% |
| American | 108 | 3.9% |
| Austrian | 19 | 0.7% |
| British | 5 | 0.2% |
| Burmese | 6 | 0.2% |
| Carpatho Rusyn | 7 | 0.3% |
| Colombian | 18 | 0.6% |
| Cuban | 24 | 0.9% |
| Czech | 14 | 0.5% |
| Dutch | 34 | 1.2% |
| Eastern European | 5 | 0.2% |
| English | 228 | 8.2% |
| European | 46 | 1.7% |
| Filipino | 29 | 1.1% |
| French | 32 | 1.1% |
| German | 559 | 20.1% |
| Greek | 11 | 0.4% |
| Hungarian | 29 | 1.1% |
| Indian (Asian) | 52 | 1.9% |
| Irish | 728 | 26.2% |
| Italian | 456 | 16.4% |
| Korean | 41 | 1.5% |
| Lithuanian | 11 | 0.4% |
| Mexican | 131 | 4.7% |
| Norwegian | 43 | 1.5% |
| Polish | 171 | 6.2% |
| Portuguese | 5 | 0.2% |
| Puerto Rican | 118 | 4.3% |
| Russian | 40 | 1.4% |
| Scandinavian | 17 | 0.6% |
| Scotch-Irish | 32 | 1.1% |
| Scottish | 17 | 0.6% |
| Slovak | 5 | 0.2% |
| South American | 49 | 1.8% |
| Subsaharan African | 16 | 0.6% |
| Swedish | 36 | 1.3% |
| Swiss | 19 | 0.7% |
| Thai | 146 | 5.3% |
| Ukrainian | 7 | 0.3% |
| Uruguayan | 27 | 1.0% |
| Venezuelan | 4 | 0.1% |
| Welsh | 40 | 1.4% |
| Zimbabwean | 1 | 0.0% | View All 43 Rows |
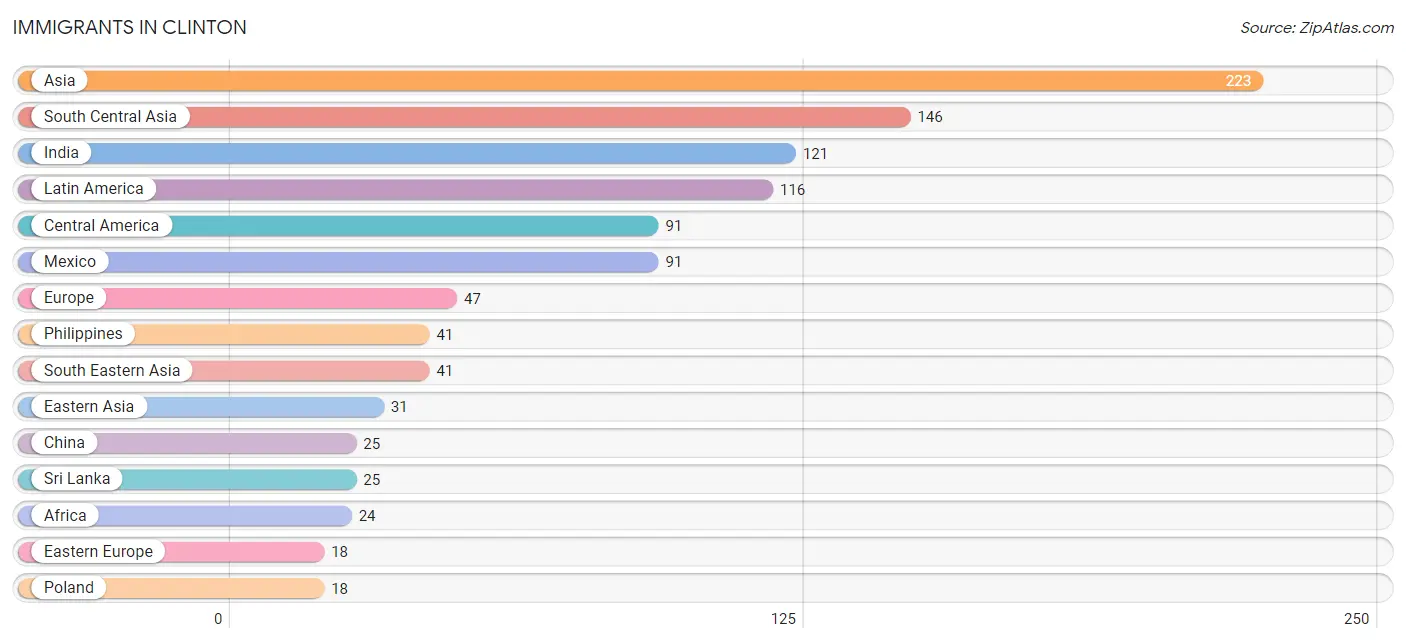
Immigrants in Clinton
The most numerous immigrant groups reported in Clinton came from Asia (223 | 8.0%), South Central Asia (146 | 5.3%), India (121 | 4.4%), Latin America (116 | 4.2%), and Central America (91 | 3.3%), together accounting for 25.1% of all Clinton residents.
| Immigration Origin | # Population | % Population |
| Africa | 24 | 0.9% |
| Asia | 223 | 8.0% |
| Barbados | 3 | 0.1% |
| Canada | 5 | 0.2% |
| Caribbean | 16 | 0.6% |
| Central America | 91 | 3.3% |
| China | 25 | 0.9% |
| Colombia | 5 | 0.2% |
| Cuba | 13 | 0.5% |
| Eastern Africa | 15 | 0.5% |
| Eastern Asia | 31 | 1.1% |
| Eastern Europe | 18 | 0.6% |
| Europe | 47 | 1.7% |
| France | 4 | 0.1% |
| Ghana | 9 | 0.3% |
| India | 121 | 4.4% |
| Ireland | 5 | 0.2% |
| Italy | 6 | 0.2% |
| Korea | 6 | 0.2% |
| Latin America | 116 | 4.2% |
| Mexico | 91 | 3.3% |
| Northern Europe | 14 | 0.5% |
| Philippines | 41 | 1.5% |
| Poland | 18 | 0.6% |
| Portugal | 5 | 0.2% |
| South America | 9 | 0.3% |
| South Central Asia | 146 | 5.3% |
| South Eastern Asia | 41 | 1.5% |
| Southern Europe | 11 | 0.4% |
| Sri Lanka | 25 | 0.9% |
| Taiwan | 17 | 0.6% |
| Venezuela | 4 | 0.1% |
| Western Africa | 9 | 0.3% |
| Western Europe | 4 | 0.1% |
| Zimbabwe | 1 | 0.0% | View All 35 Rows |
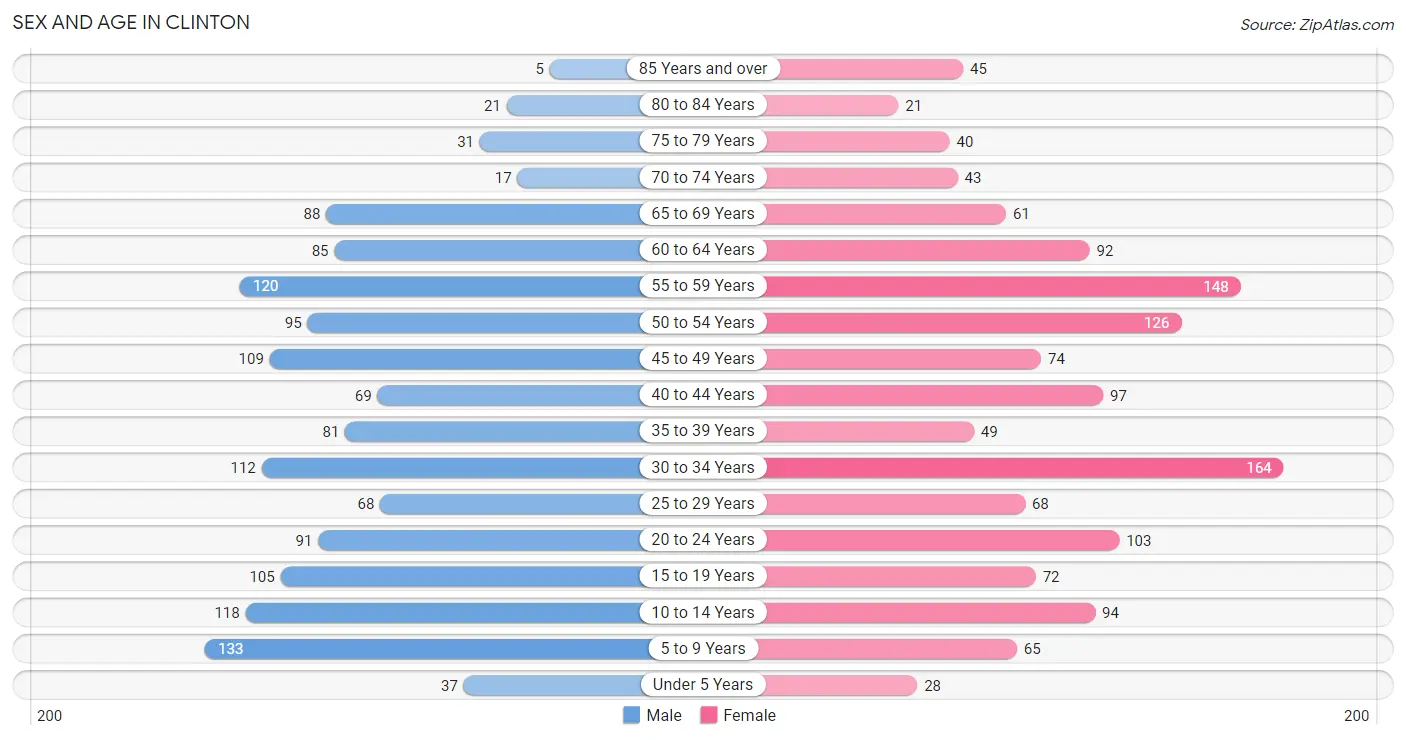
Sex and Age in Clinton
Sex and Age in Clinton
The most populous age groups in Clinton are 5 to 9 Years (133 | 9.6%) for men and 30 to 34 Years (164 | 11.8%) for women.
| Age Bracket | Male | Female |
| Under 5 Years | 37 (2.7%) | 28 (2.0%) |
| 5 to 9 Years | 133 (9.6%) | 65 (4.7%) |
| 10 to 14 Years | 118 (8.5%) | 94 (6.8%) |
| 15 to 19 Years | 105 (7.6%) | 72 (5.2%) |
| 20 to 24 Years | 91 (6.6%) | 103 (7.4%) |
| 25 to 29 Years | 68 (4.9%) | 68 (4.9%) |
| 30 to 34 Years | 112 (8.1%) | 164 (11.8%) |
| 35 to 39 Years | 81 (5.9%) | 49 (3.5%) |
| 40 to 44 Years | 69 (5.0%) | 97 (7.0%) |
| 45 to 49 Years | 109 (7.9%) | 74 (5.3%) |
| 50 to 54 Years | 95 (6.9%) | 126 (9.1%) |
| 55 to 59 Years | 120 (8.7%) | 148 (10.6%) |
| 60 to 64 Years | 85 (6.1%) | 92 (6.6%) |
| 65 to 69 Years | 88 (6.4%) | 61 (4.4%) |
| 70 to 74 Years | 17 (1.2%) | 43 (3.1%) |
| 75 to 79 Years | 31 (2.2%) | 40 (2.9%) |
| 80 to 84 Years | 21 (1.5%) | 21 (1.5%) |
| 85 Years and over | 5 (0.4%) | 45 (3.2%) |
| Total | 1,385 (100.0%) | 1,390 (100.0%) |
Families and Households in Clinton
Median Family Size in Clinton
The median family size in Clinton is 3.05 persons per family, with married-couple families (615 | 79.2%) accounting for the largest median family size of 3.13 persons per family. On the other hand, single male/father families (72 | 9.3%) represent the smallest median family size with 2.53 persons per family.
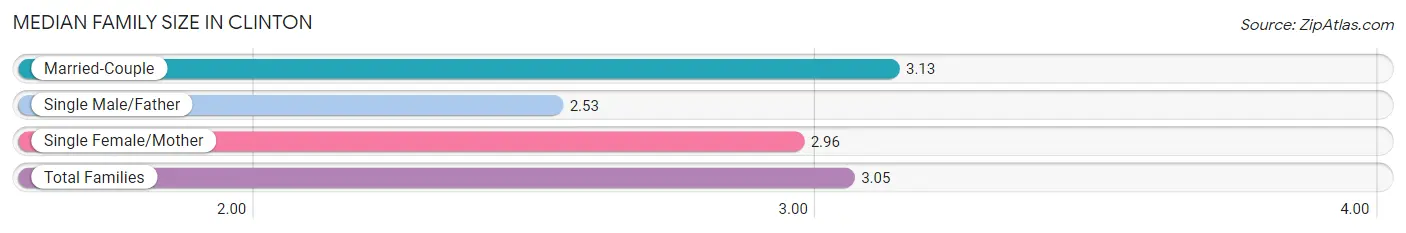
| Family Type | # Families | Family Size |
| Married-Couple | 615 (79.2%) | 3.13 |
| Single Male/Father | 72 (9.3%) | 2.53 |
| Single Female/Mother | 89 (11.5%) | 2.96 |
| Total Families | 776 (100.0%) | 3.05 |
Median Household Size in Clinton
The median household size in Clinton is 2.54 persons per household, with married-couple households (615 | 56.4%) accounting for the largest median household size of 3.15 persons per household. non-family households (315 | 28.9%) represent the smallest median household size with 1.20 persons per household.
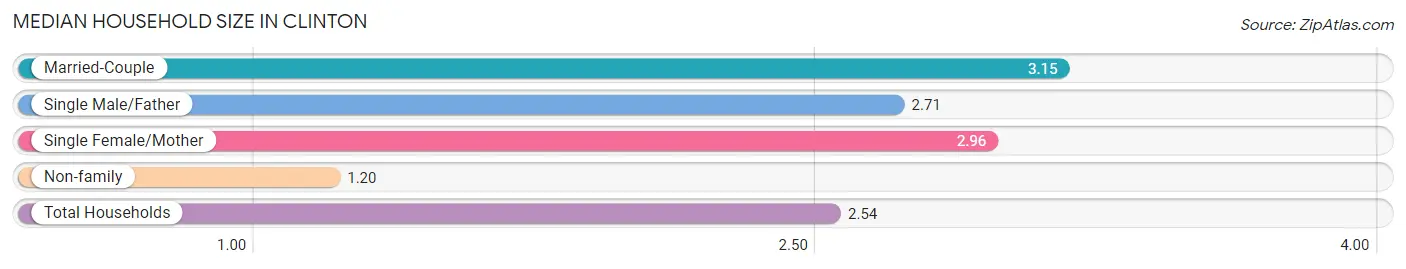
| Household Type | # Households | Household Size |
| Married-Couple | 615 (56.4%) | 3.15 |
| Single Male/Father | 72 (6.6%) | 2.71 |
| Single Female/Mother | 89 (8.2%) | 2.96 |
| Non-family | 315 (28.9%) | 1.20 |
| Total Households | 1,091 (100.0%) | 2.54 |
Household Size by Marriage Status in Clinton
Out of a total of 1,091 households in Clinton, 776 (71.1%) are family households, while 315 (28.9%) are nonfamily households. The most numerous type of family households are 2-person households, comprising 367, and the most common type of nonfamily households are 1-person households, comprising 263.
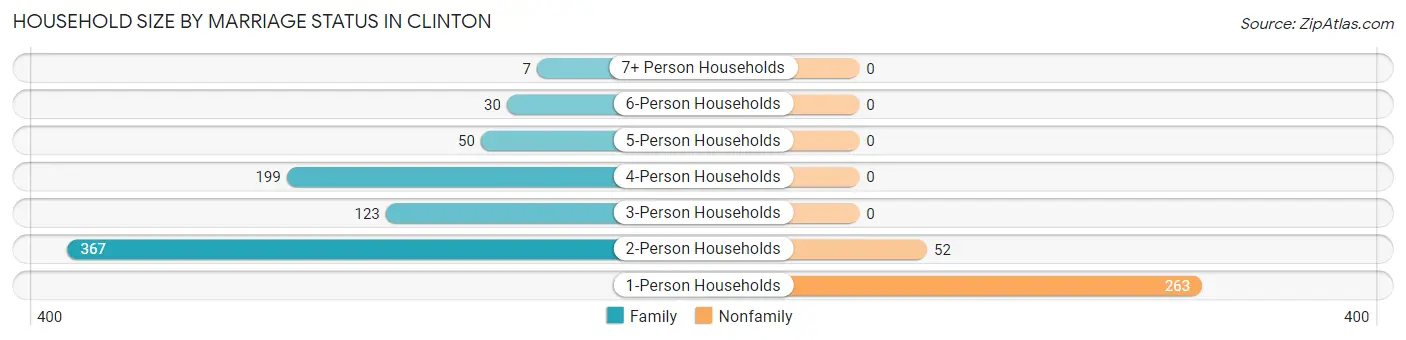
| Household Size | Family Households | Nonfamily Households |
| 1-Person Households | - | 263 (24.1%) |
| 2-Person Households | 367 (33.6%) | 52 (4.8%) |
| 3-Person Households | 123 (11.3%) | 0 (0.0%) |
| 4-Person Households | 199 (18.2%) | 0 (0.0%) |
| 5-Person Households | 50 (4.6%) | 0 (0.0%) |
| 6-Person Households | 30 (2.8%) | 0 (0.0%) |
| 7+ Person Households | 7 (0.6%) | 0 (0.0%) |
| Total | 776 (71.1%) | 315 (28.9%) |
Female Fertility in Clinton
Fertility by Age in Clinton
Average fertility rate in Clinton is 17.0 births per 1,000 women. Women in the age bracket of 20 to 34 years have the highest fertility rate with 33.0 births per 1,000 women. Women in the age bracket of 20 to 34 years acount for 100.0% of all women with births.
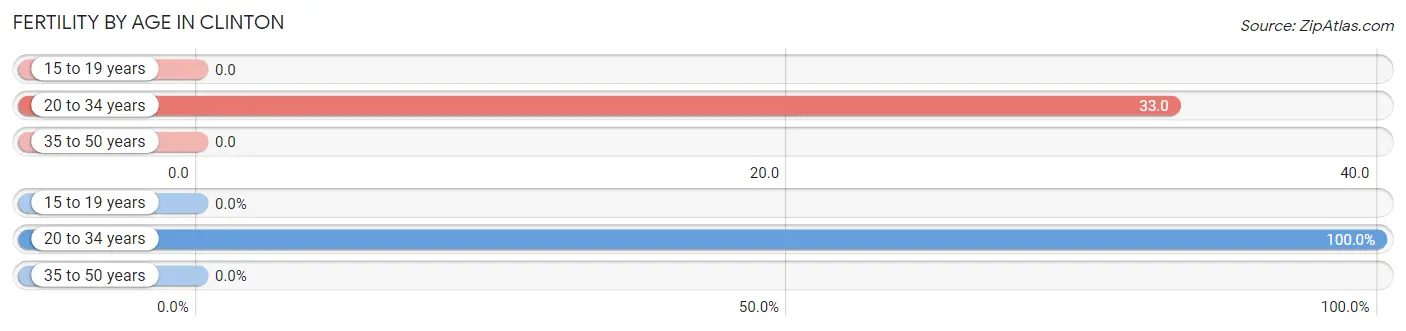
| Age Bracket | Women with Births | Births / 1,000 Women |
| 15 to 19 years | 0 (0.0%) | 0.0 |
| 20 to 34 years | 11 (100.0%) | 33.0 |
| 35 to 50 years | 0 (0.0%) | 0.0 |
| Total | 11 (100.0%) | 17.0 |
Fertility by Age by Marriage Status in Clinton
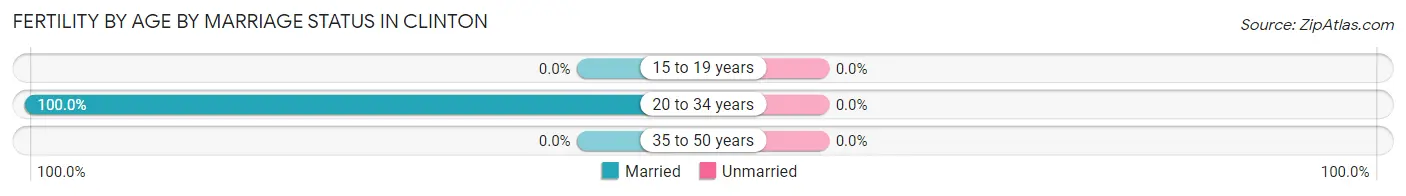
| Age Bracket | Married | Unmarried |
| 15 to 19 years | 0 (0.0%) | 0 (0.0%) |
| 20 to 34 years | 11 (100.0%) | 0 (0.0%) |
| 35 to 50 years | 0 (0.0%) | 0 (0.0%) |
| Total | 11 (100.0%) | 0 (0.0%) |
Fertility by Education in Clinton
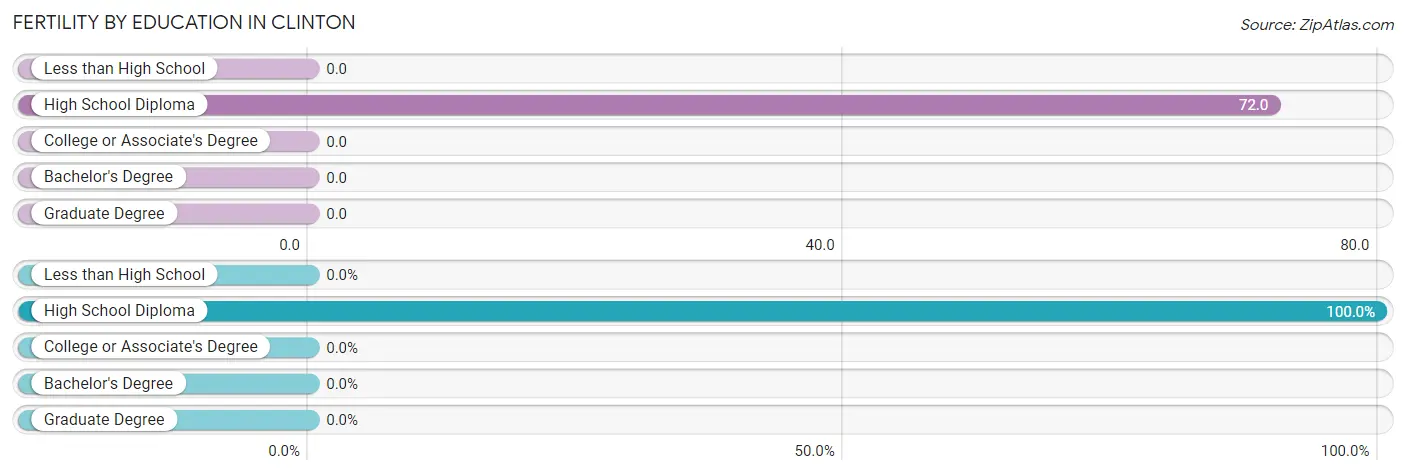
| Educational Attainment | Women with Births | Births / 1,000 Women |
| Less than High School | 0 (0.0%) | 0.0 |
| High School Diploma | 11 (100.0%) | 72.0 |
| College or Associate's Degree | 0 (0.0%) | 0.0 |
| Bachelor's Degree | 0 (0.0%) | 0.0 |
| Graduate Degree | 0 (0.0%) | 0.0 |
| Total | 11 (100.0%) | 17.0 |
Fertility by Education by Marriage Status in Clinton
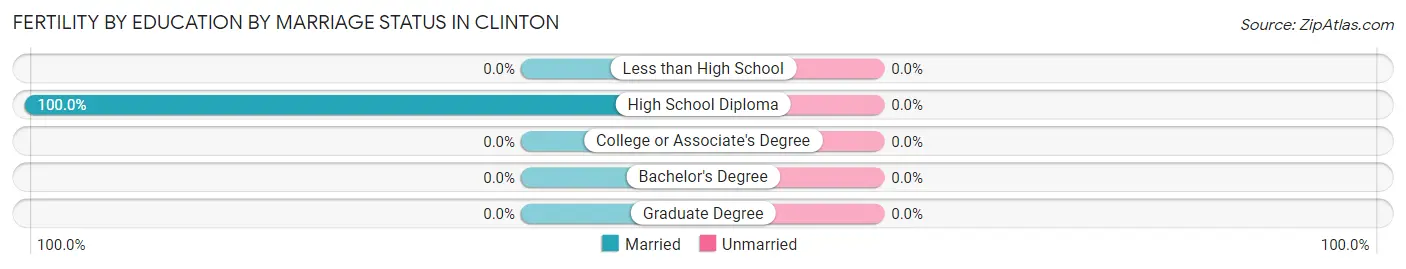
| Educational Attainment | Married | Unmarried |
| Less than High School | 0 (0.0%) | 0 (0.0%) |
| High School Diploma | 11 (100.0%) | 0 (0.0%) |
| College or Associate's Degree | 0 (0.0%) | 0 (0.0%) |
| Bachelor's Degree | 0 (0.0%) | 0 (0.0%) |
| Graduate Degree | 0 (0.0%) | 0 (0.0%) |
| Total | 11 (100.0%) | 0 (0.0%) |
Income in Clinton
Income Overview in Clinton
Per Capita Income in Clinton is $61,403, while median incomes of families and households are $160,000 and $137,688 respectively.
| Characteristic | Number | Measure |
| Per Capita Income | 2,775 | $61,403 |
| Median Family Income | 776 | $160,000 |
| Mean Family Income | 776 | $188,077 |
| Median Household Income | 1,091 | $137,688 |
| Mean Household Income | 1,091 | $158,451 |
| Income Deficit | 776 | $0 |
| Wage / Income Gap (%) | 2,775 | 34.36% |
| Wage / Income Gap ($) | 2,775 | 65.64¢ per $1 |
| Gini / Inequality Index | 2,775 | 0.39 |
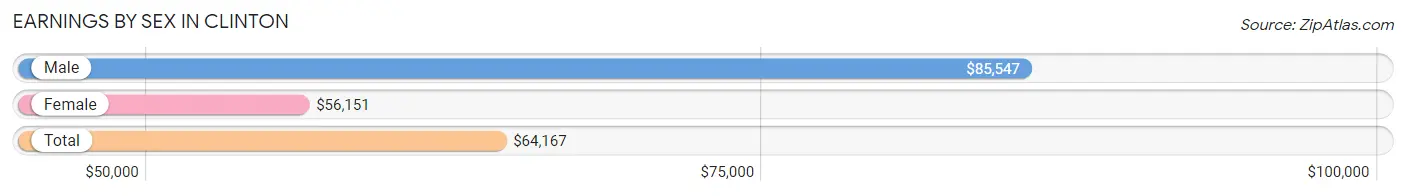
Earnings by Sex in Clinton
Average Earnings in Clinton are $64,167, $85,547 for men and $56,151 for women, a difference of 34.4%.
| Sex | Number | Average Earnings |
| Male | 841 (49.2%) | $85,547 |
| Female | 869 (50.8%) | $56,151 |
| Total | 1,710 (100.0%) | $64,167 |
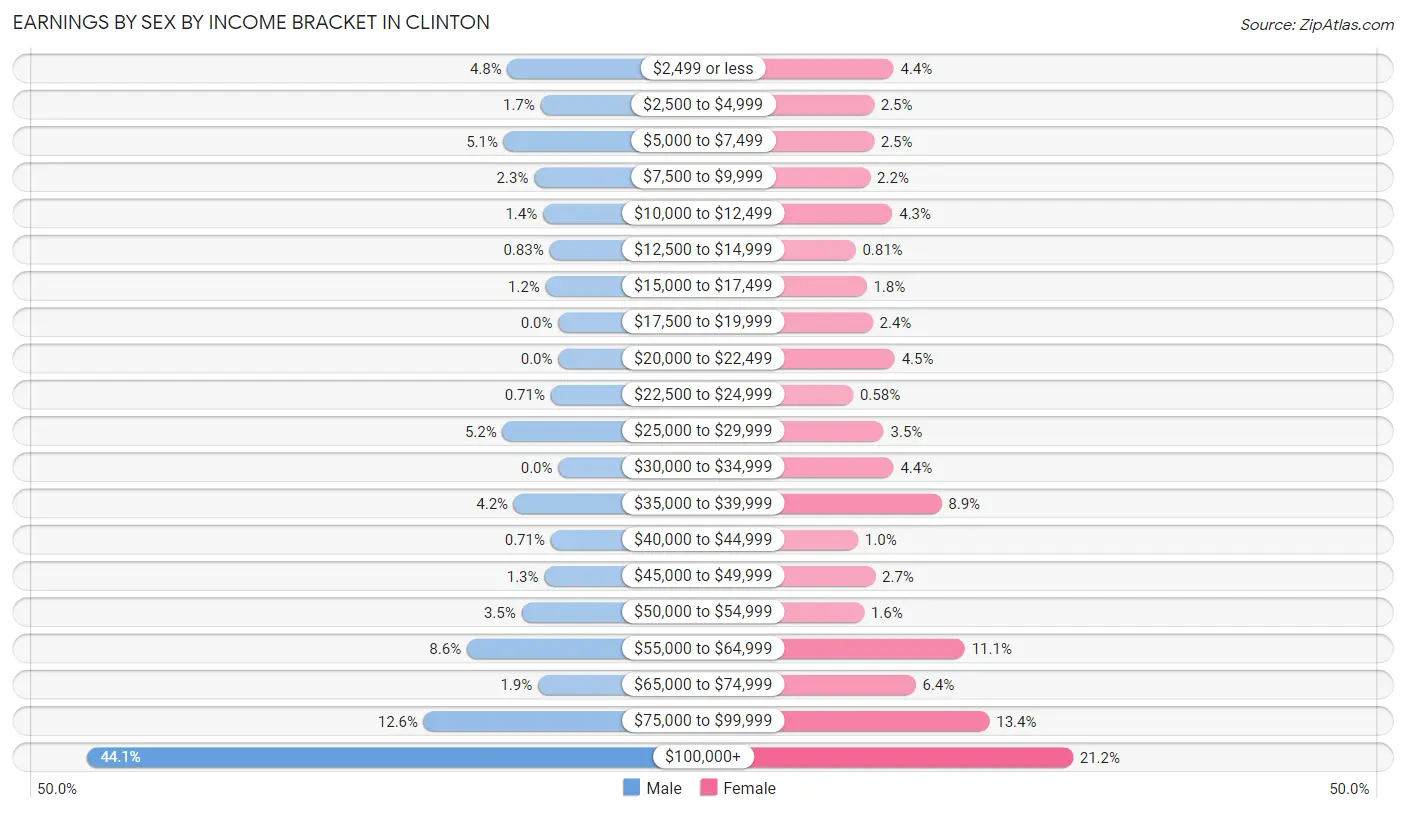
Earnings by Sex by Income Bracket in Clinton
The most common earnings brackets in Clinton are $100,000+ for men (371 | 44.1%) and $100,000+ for women (184 | 21.2%).
| Income | Male | Female |
| $2,499 or less | 40 (4.8%) | 38 (4.4%) |
| $2,500 to $4,999 | 14 (1.7%) | 22 (2.5%) |
| $5,000 to $7,499 | 43 (5.1%) | 22 (2.5%) |
| $7,500 to $9,999 | 19 (2.3%) | 19 (2.2%) |
| $10,000 to $12,499 | 12 (1.4%) | 37 (4.3%) |
| $12,500 to $14,999 | 7 (0.8%) | 7 (0.8%) |
| $15,000 to $17,499 | 10 (1.2%) | 16 (1.8%) |
| $17,500 to $19,999 | 0 (0.0%) | 21 (2.4%) |
| $20,000 to $22,499 | 0 (0.0%) | 39 (4.5%) |
| $22,500 to $24,999 | 6 (0.7%) | 5 (0.6%) |
| $25,000 to $29,999 | 44 (5.2%) | 30 (3.5%) |
| $30,000 to $34,999 | 0 (0.0%) | 38 (4.4%) |
| $35,000 to $39,999 | 35 (4.2%) | 77 (8.9%) |
| $40,000 to $44,999 | 6 (0.7%) | 9 (1.0%) |
| $45,000 to $49,999 | 11 (1.3%) | 23 (2.6%) |
| $50,000 to $54,999 | 29 (3.5%) | 14 (1.6%) |
| $55,000 to $64,999 | 72 (8.6%) | 96 (11.1%) |
| $65,000 to $74,999 | 16 (1.9%) | 56 (6.4%) |
| $75,000 to $99,999 | 106 (12.6%) | 116 (13.4%) |
| $100,000+ | 371 (44.1%) | 184 (21.2%) |
| Total | 841 (100.0%) | 869 (100.0%) |
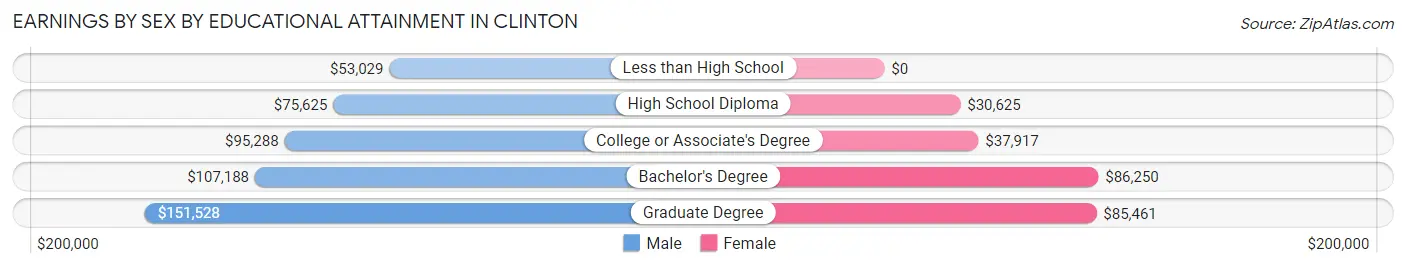
Earnings by Sex by Educational Attainment in Clinton
Average earnings in Clinton are $106,184 for men and $61,118 for women, a difference of 42.4%. Men with an educational attainment of graduate degree enjoy the highest average annual earnings of $151,528, while those with less than high school education earn the least with $53,029. Women with an educational attainment of bachelor's degree earn the most with the average annual earnings of $86,250, while those with high school diploma education have the smallest earnings of $30,625.
| Educational Attainment | Male Income | Female Income |
| Less than High School | $53,029 | $0 |
| High School Diploma | $75,625 | $30,625 |
| College or Associate's Degree | $95,288 | $37,917 |
| Bachelor's Degree | $107,188 | $86,250 |
| Graduate Degree | $151,528 | $85,461 |
| Total | $106,184 | $61,118 |
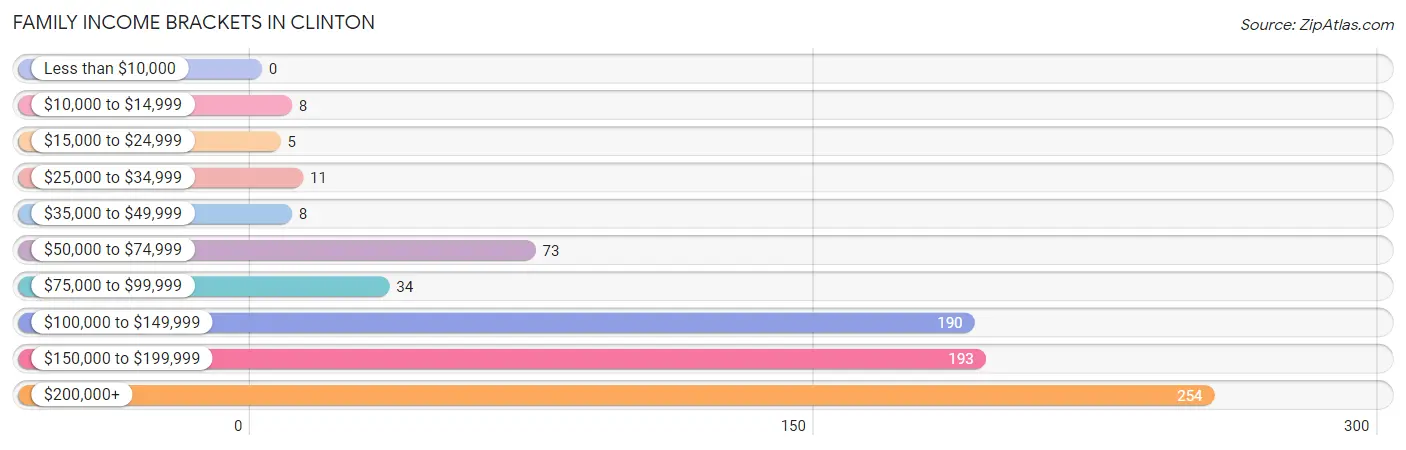
Family Income in Clinton
Family Income Brackets in Clinton
According to the Clinton family income data, there are 254 families falling into the $200,000+ income range, which is the most common income bracket and makes up 32.7% of all families.
| Income Bracket | # Families | % Families |
| Less than $10,000 | 0 | 0.0% |
| $10,000 to $14,999 | 8 | 1.0% |
| $15,000 to $24,999 | 5 | 0.6% |
| $25,000 to $34,999 | 11 | 1.4% |
| $35,000 to $49,999 | 8 | 1.0% |
| $50,000 to $74,999 | 73 | 9.4% |
| $75,000 to $99,999 | 34 | 4.4% |
| $100,000 to $149,999 | 190 | 24.5% |
| $150,000 to $199,999 | 193 | 24.9% |
| $200,000+ | 254 | 32.7% |
Family Income by Famaliy Size in Clinton
5-person families (68 | 8.8%) account for the highest median family income in Clinton with $181,923 per family, while 2-person families (373 | 48.1%) have the highest median income of $78,693 per family member.
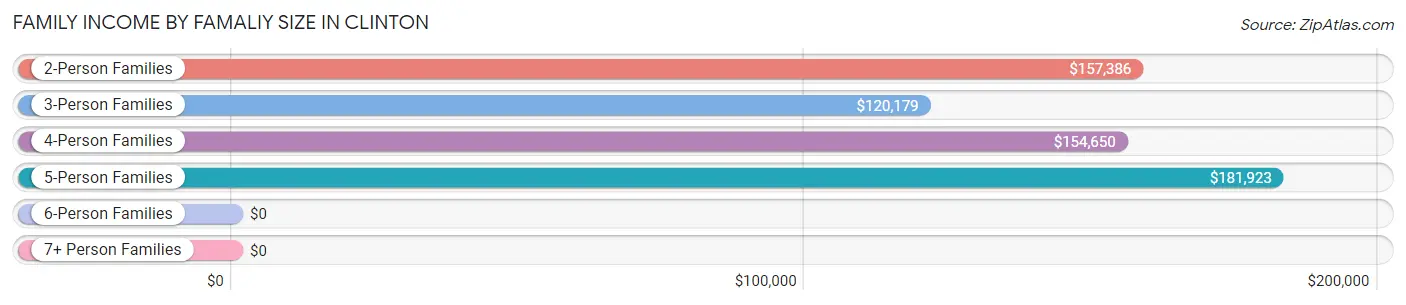
| Income Bracket | # Families | Median Income |
| 2-Person Families | 373 (48.1%) | $157,386 |
| 3-Person Families | 121 (15.6%) | $120,179 |
| 4-Person Families | 195 (25.1%) | $154,650 |
| 5-Person Families | 68 (8.8%) | $181,923 |
| 6-Person Families | 12 (1.5%) | $0 |
| 7+ Person Families | 7 (0.9%) | $0 |
| Total | 776 (100.0%) | $160,000 |
Family Income by Number of Earners in Clinton
The median family income in Clinton is $160,000, with families comprising 3+ earners (77) having the highest median family income of $250,001, while families with no earners (27) have the lowest median family income of $106,563, accounting for 9.9% and 3.5% of families, respectively.
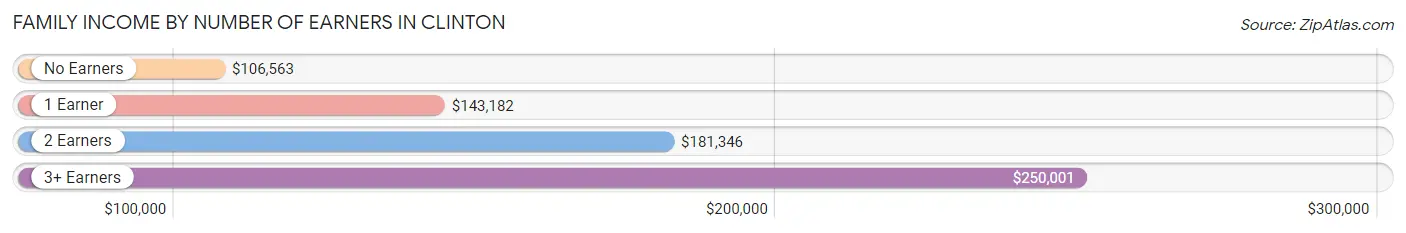
| Number of Earners | # Families | Median Income |
| No Earners | 27 (3.5%) | $106,563 |
| 1 Earner | 194 (25.0%) | $143,182 |
| 2 Earners | 478 (61.6%) | $181,346 |
| 3+ Earners | 77 (9.9%) | $250,001 |
| Total | 776 (100.0%) | $160,000 |
Household Income in Clinton
Household Income Brackets in Clinton
With 283 households falling in the category, the $200,000+ income range is the most frequent in Clinton, accounting for 25.9% of all households. In contrast, only 22 households (2.0%) fall into the less than $10,000 income bracket, making it the least populous group.
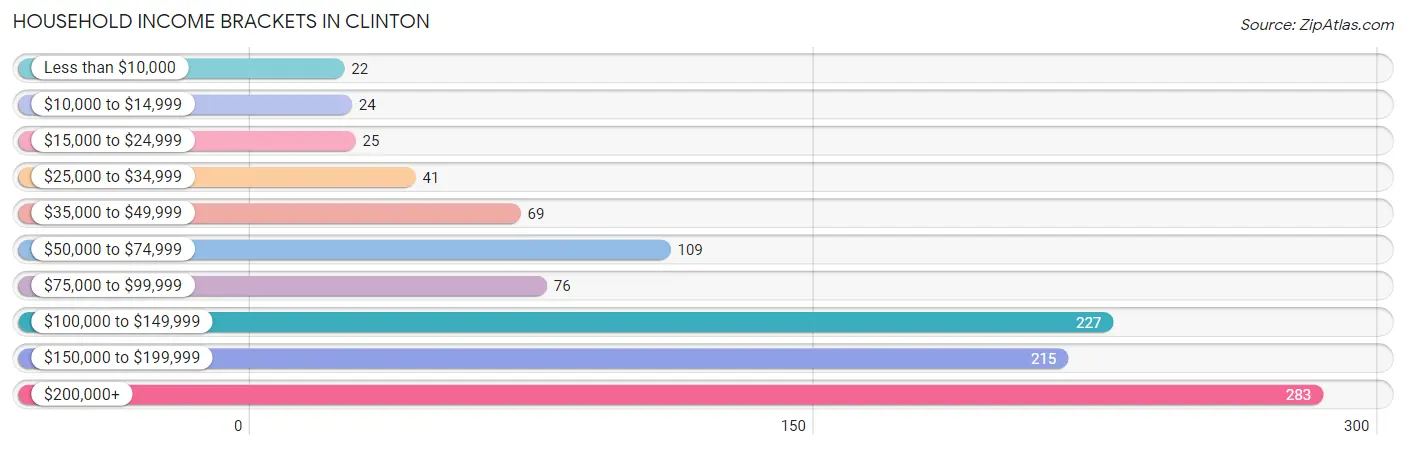
| Income Bracket | # Households | % Households |
| Less than $10,000 | 22 | 2.0% |
| $10,000 to $14,999 | 24 | 2.2% |
| $15,000 to $24,999 | 25 | 2.3% |
| $25,000 to $34,999 | 41 | 3.8% |
| $35,000 to $49,999 | 69 | 6.3% |
| $50,000 to $74,999 | 109 | 10.0% |
| $75,000 to $99,999 | 76 | 7.0% |
| $100,000 to $149,999 | 227 | 20.8% |
| $150,000 to $199,999 | 215 | 19.7% |
| $200,000+ | 283 | 25.9% |
Household Income by Householder Age in Clinton
The median household income in Clinton is $137,688, with the highest median household income of $153,164 found in the 25 to 44 years age bracket for the primary householder. A total of 261 households (23.9%) fall into this category. Meanwhile, the 15 to 24 years age bracket for the primary householder has the lowest median household income of $0, with 13 households (1.2%) in this group.
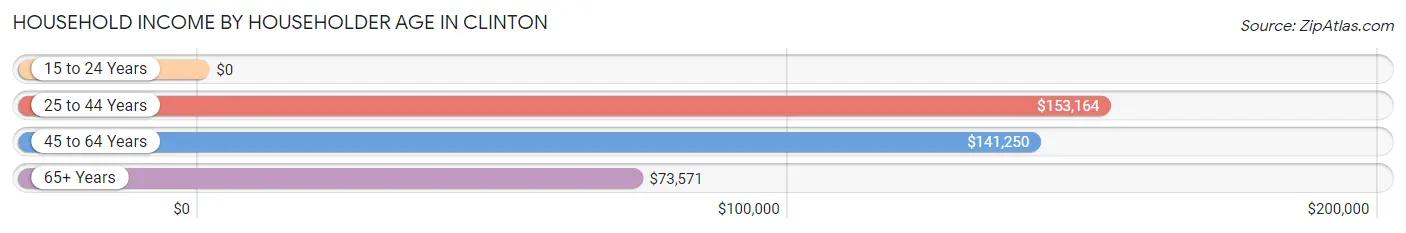
| Income Bracket | # Households | Median Income |
| 15 to 24 Years | 13 (1.2%) | $0 |
| 25 to 44 Years | 261 (23.9%) | $153,164 |
| 45 to 64 Years | 557 (51.0%) | $141,250 |
| 65+ Years | 260 (23.8%) | $73,571 |
| Total | 1,091 (100.0%) | $137,688 |
Poverty in Clinton
Income Below Poverty by Sex and Age in Clinton
With 1.3% poverty level for males and 3.5% for females among the residents of Clinton, under 5 year old males and under 5 year old females are the most vulnerable to poverty, with 7 males (18.9%) and 7 females (25.0%) in their respective age groups living below the poverty level.
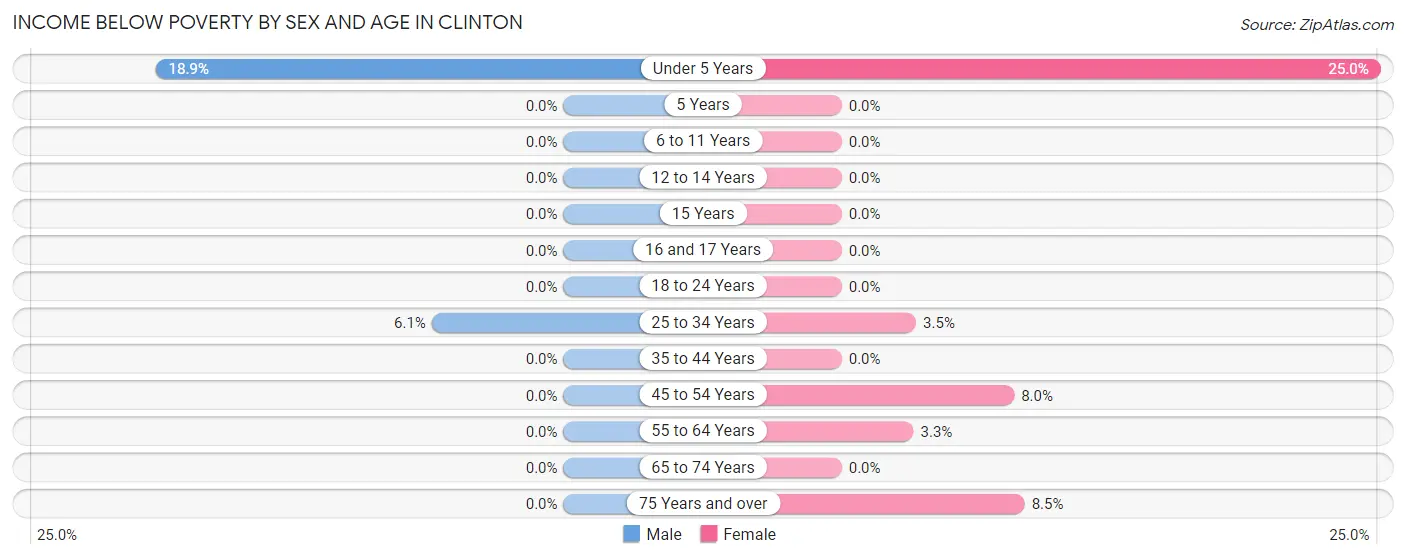
| Age Bracket | Male | Female |
| Under 5 Years | 7 (18.9%) | 7 (25.0%) |
| 5 Years | 0 (0.0%) | 0 (0.0%) |
| 6 to 11 Years | 0 (0.0%) | 0 (0.0%) |
| 12 to 14 Years | 0 (0.0%) | 0 (0.0%) |
| 15 Years | 0 (0.0%) | 0 (0.0%) |
| 16 and 17 Years | 0 (0.0%) | 0 (0.0%) |
| 18 to 24 Years | 0 (0.0%) | 0 (0.0%) |
| 25 to 34 Years | 11 (6.1%) | 8 (3.5%) |
| 35 to 44 Years | 0 (0.0%) | 0 (0.0%) |
| 45 to 54 Years | 0 (0.0%) | 16 (8.0%) |
| 55 to 64 Years | 0 (0.0%) | 8 (3.3%) |
| 65 to 74 Years | 0 (0.0%) | 0 (0.0%) |
| 75 Years and over | 0 (0.0%) | 9 (8.5%) |
| Total | 18 (1.3%) | 48 (3.5%) |
Income Above Poverty by Sex and Age in Clinton
According to the poverty statistics in Clinton, males aged 5 years and females aged 5 years are the age groups that are most secure financially, with 100.0% of males and 100.0% of females in these age groups living above the poverty line.
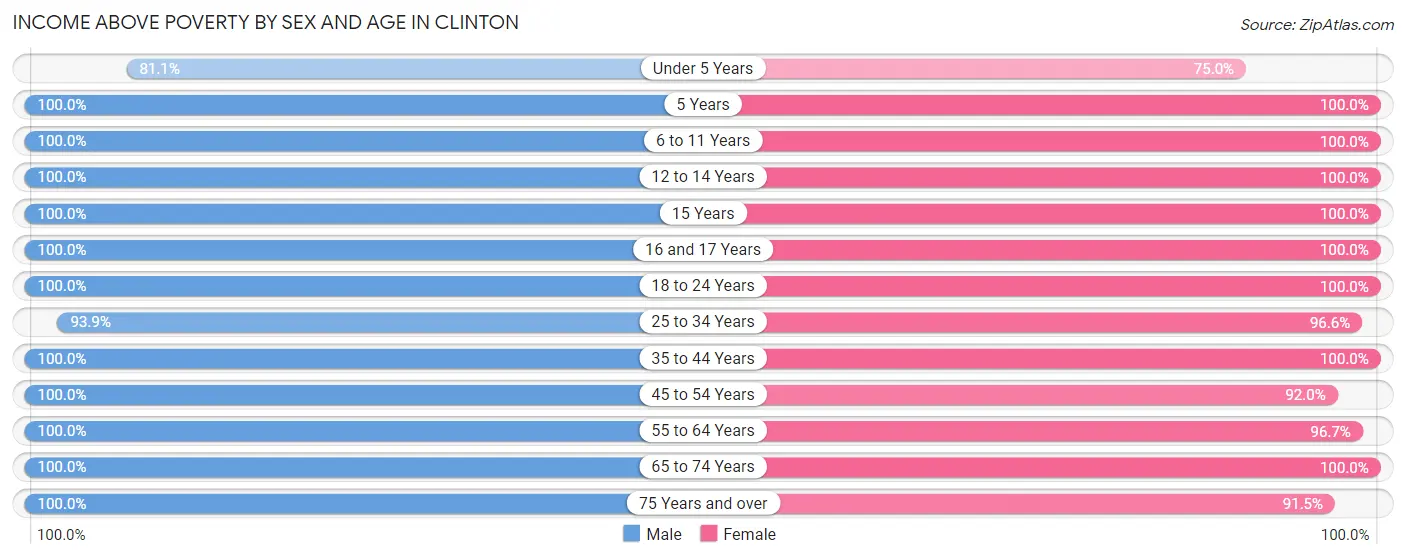
| Age Bracket | Male | Female |
| Under 5 Years | 30 (81.1%) | 21 (75.0%) |
| 5 Years | 35 (100.0%) | 31 (100.0%) |
| 6 to 11 Years | 111 (100.0%) | 63 (100.0%) |
| 12 to 14 Years | 105 (100.0%) | 65 (100.0%) |
| 15 Years | 25 (100.0%) | 18 (100.0%) |
| 16 and 17 Years | 49 (100.0%) | 34 (100.0%) |
| 18 to 24 Years | 122 (100.0%) | 123 (100.0%) |
| 25 to 34 Years | 169 (93.9%) | 224 (96.6%) |
| 35 to 44 Years | 150 (100.0%) | 146 (100.0%) |
| 45 to 54 Years | 204 (100.0%) | 184 (92.0%) |
| 55 to 64 Years | 205 (100.0%) | 232 (96.7%) |
| 65 to 74 Years | 105 (100.0%) | 104 (100.0%) |
| 75 Years and over | 57 (100.0%) | 97 (91.5%) |
| Total | 1,367 (98.7%) | 1,342 (96.6%) |
Income Below Poverty Among Married-Couple Families in Clinton
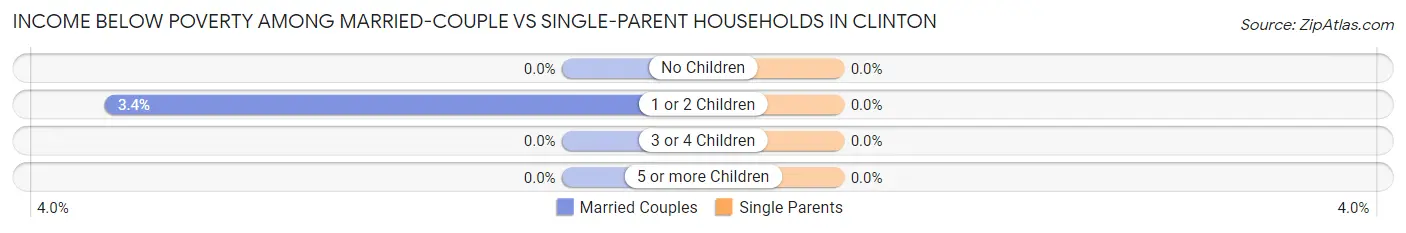
The poverty statistics for married-couple families in Clinton show that 1.3% or 8 of the total 615 families live below the poverty line. Families with 1 or 2 children have the highest poverty rate of 3.4%, comprising of 8 families. On the other hand, families with no children have the lowest poverty rate of 0.0%, which includes 0 families.
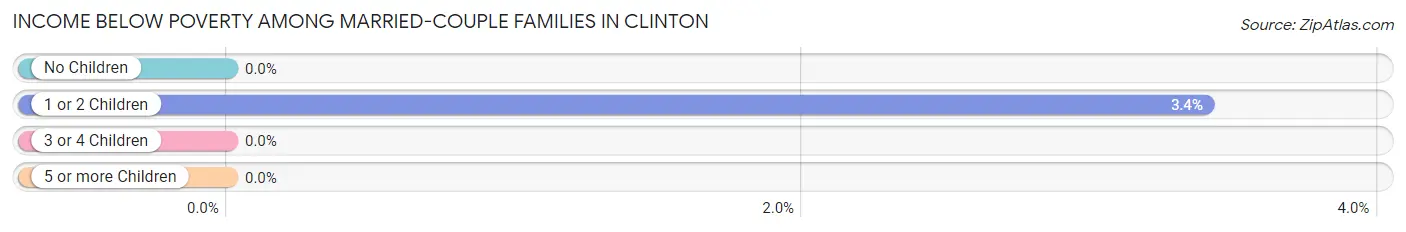
| Children | Above Poverty | Below Poverty |
| No Children | 343 (100.0%) | 0 (0.0%) |
| 1 or 2 Children | 227 (96.6%) | 8 (3.4%) |
| 3 or 4 Children | 37 (100.0%) | 0 (0.0%) |
| 5 or more Children | 0 (0.0%) | 0 (0.0%) |
| Total | 607 (98.7%) | 8 (1.3%) |
Income Below Poverty Among Single-Parent Households in Clinton
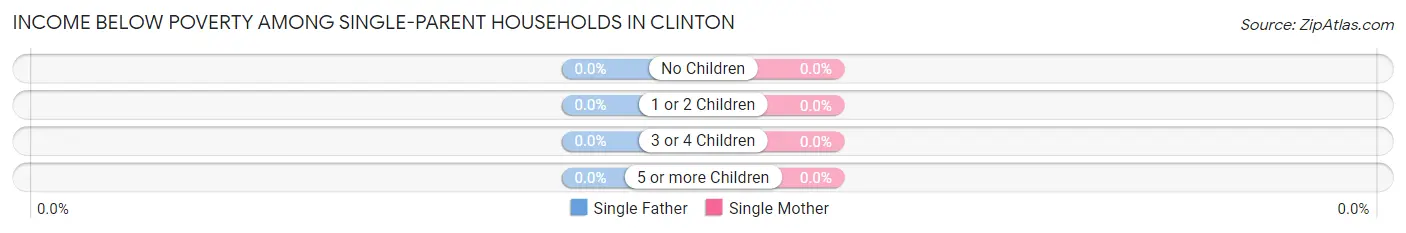
| Children | Single Father | Single Mother |
| No Children | 0 (0.0%) | 0 (0.0%) |
| 1 or 2 Children | 0 (0.0%) | 0 (0.0%) |
| 3 or 4 Children | 0 (0.0%) | 0 (0.0%) |
| 5 or more Children | 0 (0.0%) | 0 (0.0%) |
| Total | 0 (0.0%) | 0 (0.0%) |
Income Below Poverty Among Married-Couple vs Single-Parent Households in Clinton
| Children | Married-Couple Families | Single-Parent Households |
| No Children | 0 (0.0%) | 0 (0.0%) |
| 1 or 2 Children | 8 (3.4%) | 0 (0.0%) |
| 3 or 4 Children | 0 (0.0%) | 0 (0.0%) |
| 5 or more Children | 0 (0.0%) | 0 (0.0%) |
| Total | 8 (1.3%) | 0 (0.0%) |
Employment Characteristics in Clinton
Employment by Class of Employer in Clinton
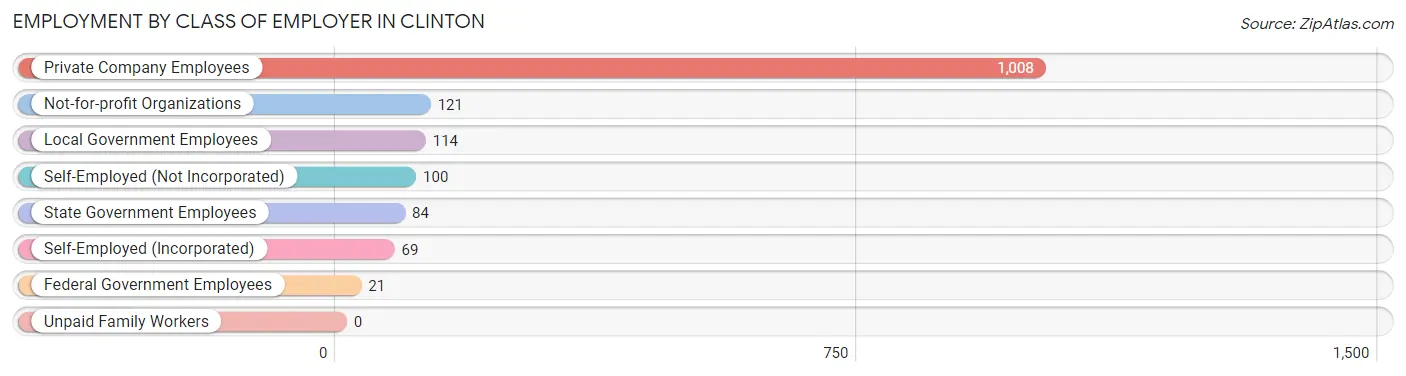
Among the 1,517 employed individuals in Clinton, private company employees (1,008 | 66.4%), not-for-profit organizations (121 | 8.0%), and local government employees (114 | 7.5%) make up the most common classes of employment.
| Employer Class | # Employees | % Employees |
| Private Company Employees | 1,008 | 66.4% |
| Self-Employed (Incorporated) | 69 | 4.5% |
| Self-Employed (Not Incorporated) | 100 | 6.6% |
| Not-for-profit Organizations | 121 | 8.0% |
| Local Government Employees | 114 | 7.5% |
| State Government Employees | 84 | 5.5% |
| Federal Government Employees | 21 | 1.4% |
| Unpaid Family Workers | 0 | 0.0% |
| Total | 1,517 | 100.0% |
Employment Status by Age in Clinton
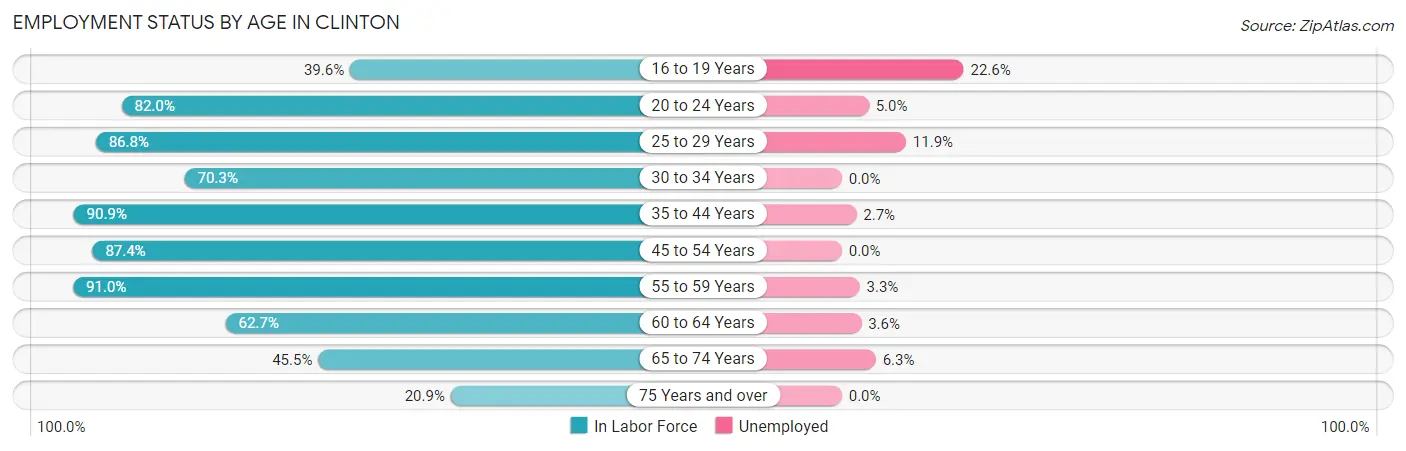
According to the labor force statistics for Clinton, out of the total population over 16 years of age (2,257), 72.2% or 1,630 individuals are in the labor force, with 3.6% or 59 of them unemployed. The age group with the highest labor force participation rate is 55 to 59 years, with 91.0% or 244 individuals in the labor force. Within the labor force, the 16 to 19 years age range has the highest percentage of unemployed individuals, with 22.6% or 12 of them being unemployed.
| Age Bracket | In Labor Force | Unemployed |
| 16 to 19 Years | 53 (39.6%) | 12 (22.6%) |
| 20 to 24 Years | 159 (82.0%) | 8 (5.0%) |
| 25 to 29 Years | 118 (86.8%) | 14 (11.9%) |
| 30 to 34 Years | 194 (70.3%) | 0 (0.0%) |
| 35 to 44 Years | 269 (90.9%) | 7 (2.7%) |
| 45 to 54 Years | 353 (87.4%) | 0 (0.0%) |
| 55 to 59 Years | 244 (91.0%) | 8 (3.3%) |
| 60 to 64 Years | 111 (62.7%) | 4 (3.6%) |
| 65 to 74 Years | 95 (45.5%) | 6 (6.3%) |
| 75 Years and over | 34 (20.9%) | 0 (0.0%) |
| Total | 1,630 (72.2%) | 59 (3.6%) |
Employment Status by Educational Attainment in Clinton
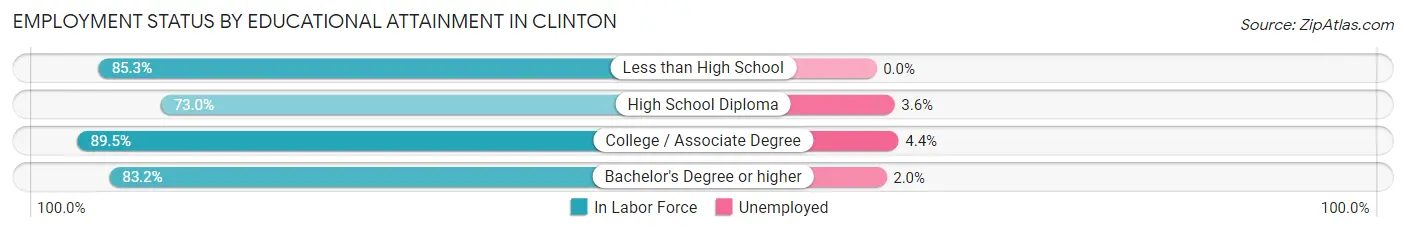
According to labor force statistics for Clinton, 82.8% of individuals (1,289) out of the total population between 25 and 64 years of age (1,557) are in the labor force, with 2.6% or 34 of them being unemployed. The group with the highest labor force participation rate are those with the educational attainment of college / associate degree, with 89.5% or 263 individuals in the labor force. Within the labor force, individuals with college / associate degree education have the highest percentage of unemployment, with 4.4% or 12 of them being unemployed.
| Educational Attainment | In Labor Force | Unemployed |
| Less than High School | 81 (85.3%) | 0 (0.0%) |
| High School Diploma | 192 (73.0%) | 9 (3.6%) |
| College / Associate Degree | 263 (89.5%) | 13 (4.4%) |
| Bachelor's Degree or higher | 753 (83.2%) | 18 (2.0%) |
| Total | 1,289 (82.8%) | 40 (2.6%) |
Employment Occupations by Sex in Clinton
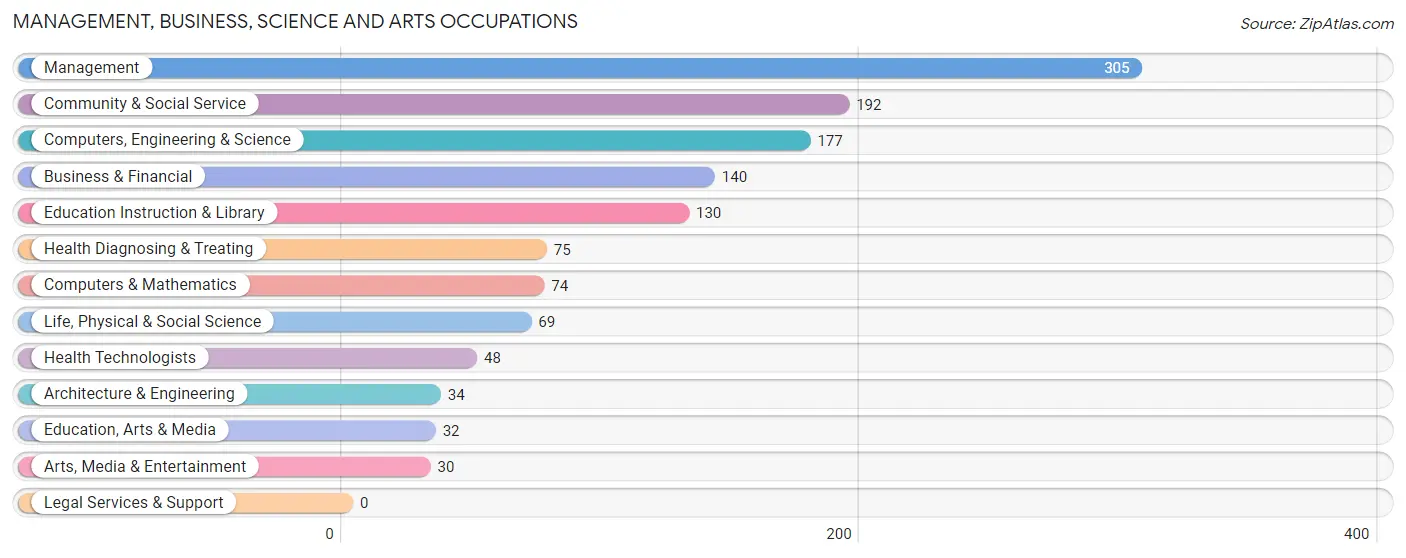
Management, Business, Science and Arts Occupations
The most common Management, Business, Science and Arts occupations in Clinton are Management (305 | 19.6%), Community & Social Service (192 | 12.3%), Computers, Engineering & Science (177 | 11.4%), Business & Financial (140 | 9.0%), and Education Instruction & Library (130 | 8.3%).
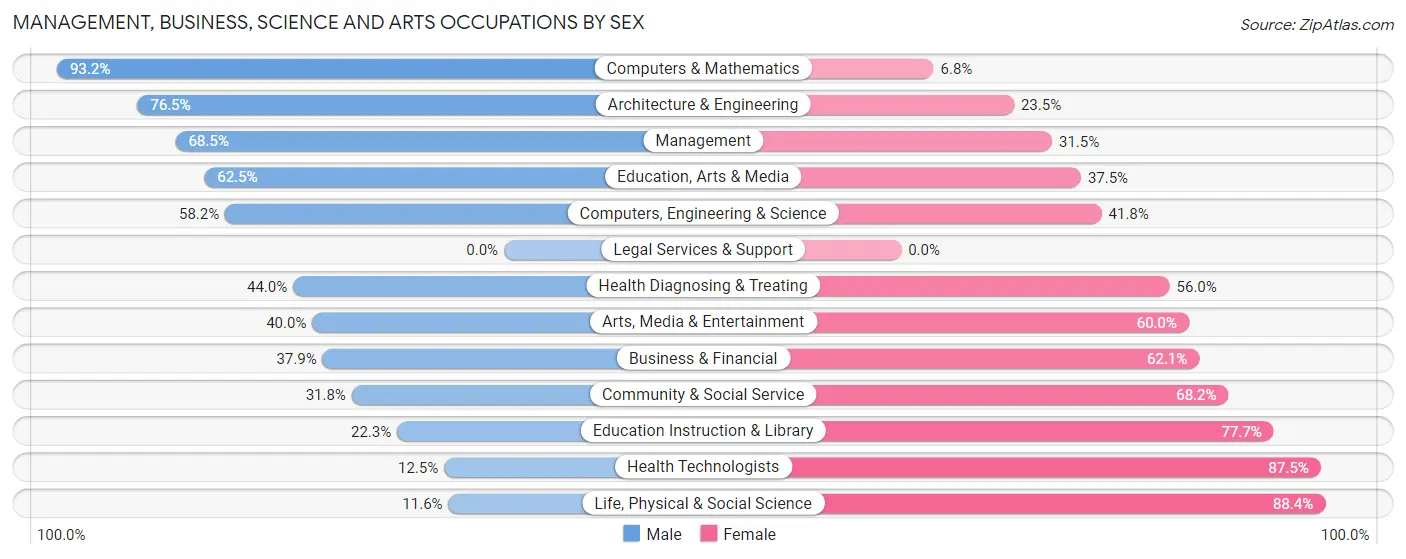
Management, Business, Science and Arts Occupations by Sex
Within the Management, Business, Science and Arts occupations in Clinton, the most male-oriented occupations are Computers & Mathematics (93.2%), Architecture & Engineering (76.5%), and Management (68.5%), while the most female-oriented occupations are Life, Physical & Social Science (88.4%), Health Technologists (87.5%), and Education Instruction & Library (77.7%).
| Occupation | Male | Female |
| Management | 209 (68.5%) | 96 (31.5%) |
| Business & Financial | 53 (37.9%) | 87 (62.1%) |
| Computers, Engineering & Science | 103 (58.2%) | 74 (41.8%) |
| Computers & Mathematics | 69 (93.2%) | 5 (6.8%) |
| Architecture & Engineering | 26 (76.5%) | 8 (23.5%) |
| Life, Physical & Social Science | 8 (11.6%) | 61 (88.4%) |
| Community & Social Service | 61 (31.8%) | 131 (68.2%) |
| Education, Arts & Media | 20 (62.5%) | 12 (37.5%) |
| Legal Services & Support | 0 (0.0%) | 0 (0.0%) |
| Education Instruction & Library | 29 (22.3%) | 101 (77.7%) |
| Arts, Media & Entertainment | 12 (40.0%) | 18 (60.0%) |
| Health Diagnosing & Treating | 33 (44.0%) | 42 (56.0%) |
| Health Technologists | 6 (12.5%) | 42 (87.5%) |
| Total (Category) | 459 (51.6%) | 430 (48.4%) |
| Total (Overall) | 775 (49.7%) | 785 (50.3%) |
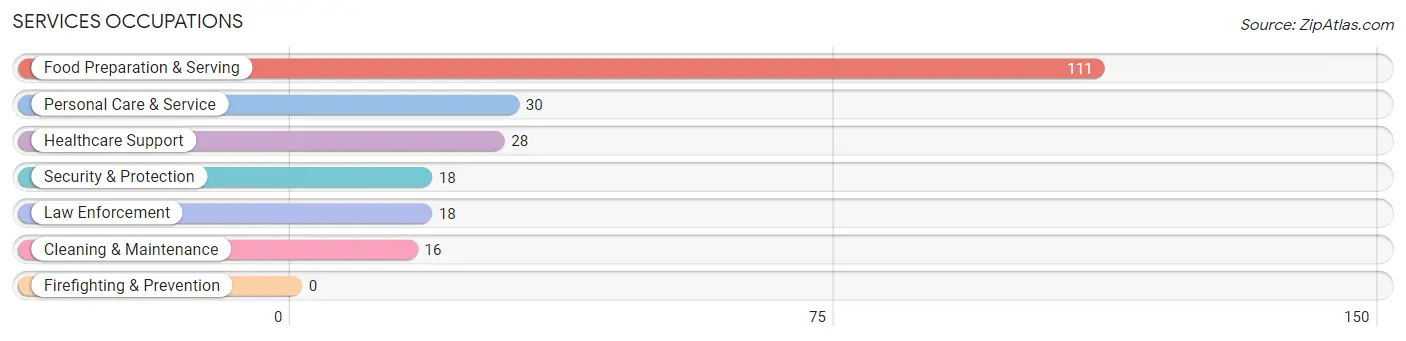
Services Occupations
The most common Services occupations in Clinton are Food Preparation & Serving (111 | 7.1%), Personal Care & Service (30 | 1.9%), Healthcare Support (28 | 1.8%), Security & Protection (18 | 1.1%), and Law Enforcement (18 | 1.1%).
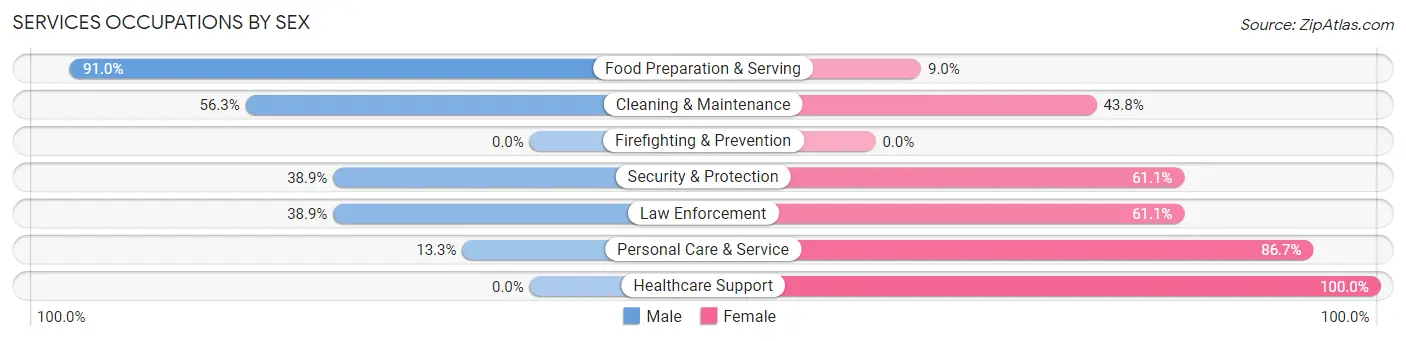
Services Occupations by Sex
Within the Services occupations in Clinton, the most male-oriented occupations are Food Preparation & Serving (91.0%), Cleaning & Maintenance (56.2%), and Security & Protection (38.9%), while the most female-oriented occupations are Healthcare Support (100.0%), Personal Care & Service (86.7%), and Security & Protection (61.1%).
| Occupation | Male | Female |
| Healthcare Support | 0 (0.0%) | 28 (100.0%) |
| Security & Protection | 7 (38.9%) | 11 (61.1%) |
| Firefighting & Prevention | 0 (0.0%) | 0 (0.0%) |
| Law Enforcement | 7 (38.9%) | 11 (61.1%) |
| Food Preparation & Serving | 101 (91.0%) | 10 (9.0%) |
| Cleaning & Maintenance | 9 (56.2%) | 7 (43.8%) |
| Personal Care & Service | 4 (13.3%) | 26 (86.7%) |
| Total (Category) | 121 (59.6%) | 82 (40.4%) |
| Total (Overall) | 775 (49.7%) | 785 (50.3%) |
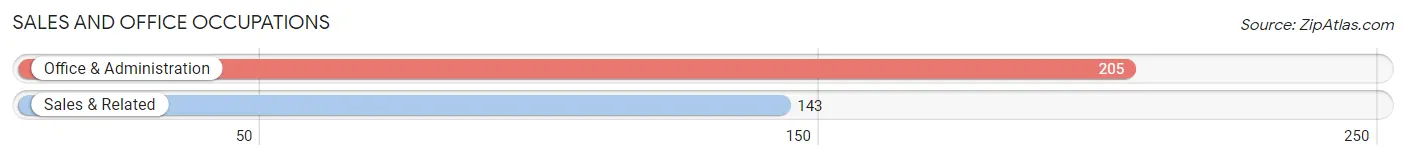
Sales and Office Occupations
The most common Sales and Office occupations in Clinton are Office & Administration (205 | 13.1%), and Sales & Related (143 | 9.2%).
Sales and Office Occupations by Sex
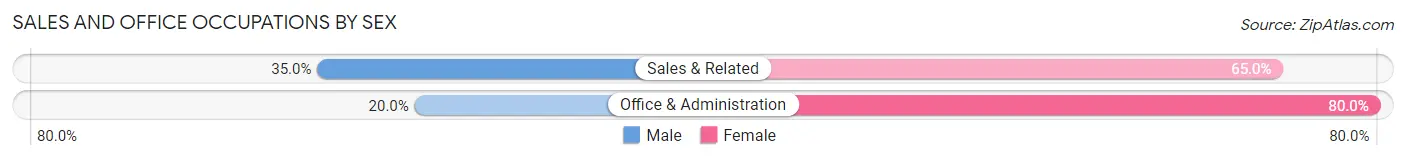
| Occupation | Male | Female |
| Sales & Related | 50 (35.0%) | 93 (65.0%) |
| Office & Administration | 41 (20.0%) | 164 (80.0%) |
| Total (Category) | 91 (26.2%) | 257 (73.9%) |
| Total (Overall) | 775 (49.7%) | 785 (50.3%) |
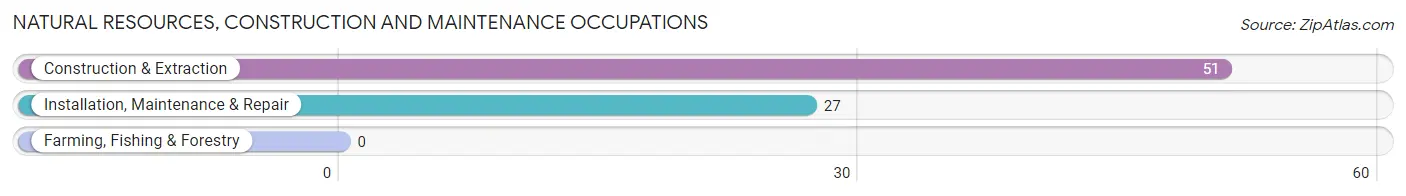
Natural Resources, Construction and Maintenance Occupations
The most common Natural Resources, Construction and Maintenance occupations in Clinton are Construction & Extraction (51 | 3.3%), and Installation, Maintenance & Repair (27 | 1.7%).
Natural Resources, Construction and Maintenance Occupations by Sex
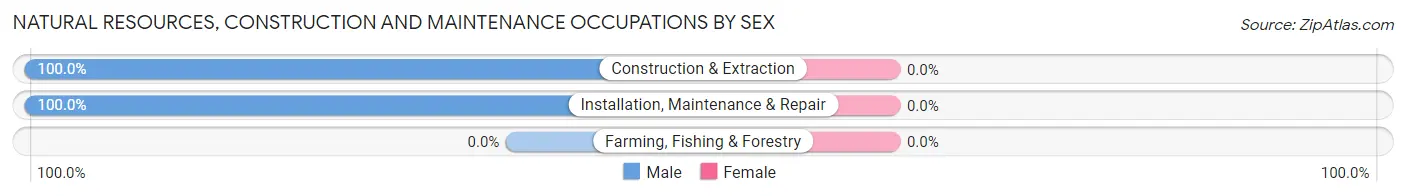
| Occupation | Male | Female |
| Farming, Fishing & Forestry | 0 (0.0%) | 0 (0.0%) |
| Construction & Extraction | 51 (100.0%) | 0 (0.0%) |
| Installation, Maintenance & Repair | 27 (100.0%) | 0 (0.0%) |
| Total (Category) | 78 (100.0%) | 0 (0.0%) |
| Total (Overall) | 775 (49.7%) | 785 (50.3%) |
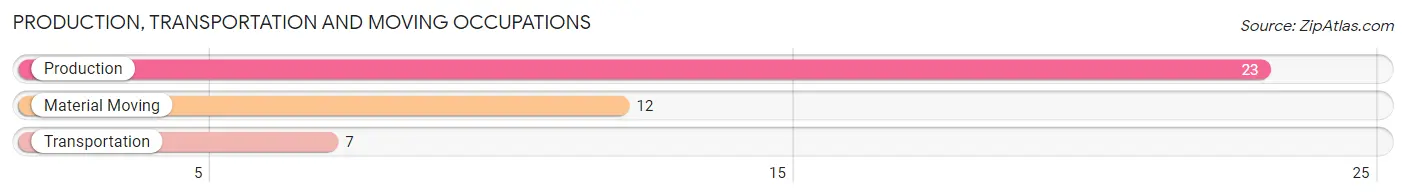
Production, Transportation and Moving Occupations
The most common Production, Transportation and Moving occupations in Clinton are Production (23 | 1.5%), Material Moving (12 | 0.8%), and Transportation (7 | 0.4%).
Production, Transportation and Moving Occupations by Sex
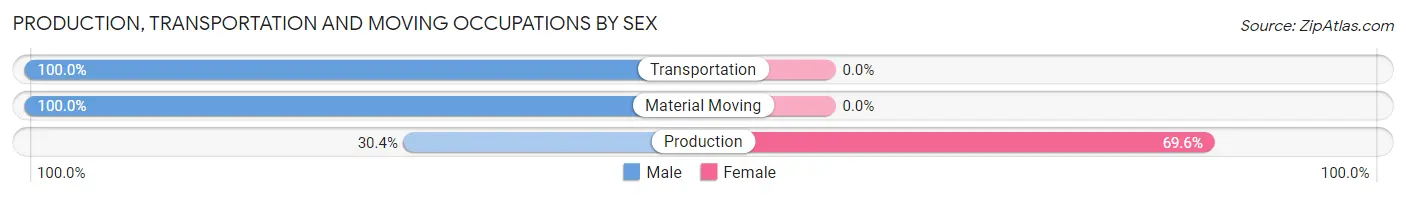
| Occupation | Male | Female |
| Production | 7 (30.4%) | 16 (69.6%) |
| Transportation | 7 (100.0%) | 0 (0.0%) |
| Material Moving | 12 (100.0%) | 0 (0.0%) |
| Total (Category) | 26 (61.9%) | 16 (38.1%) |
| Total (Overall) | 775 (49.7%) | 785 (50.3%) |
Employment Industries by Sex in Clinton
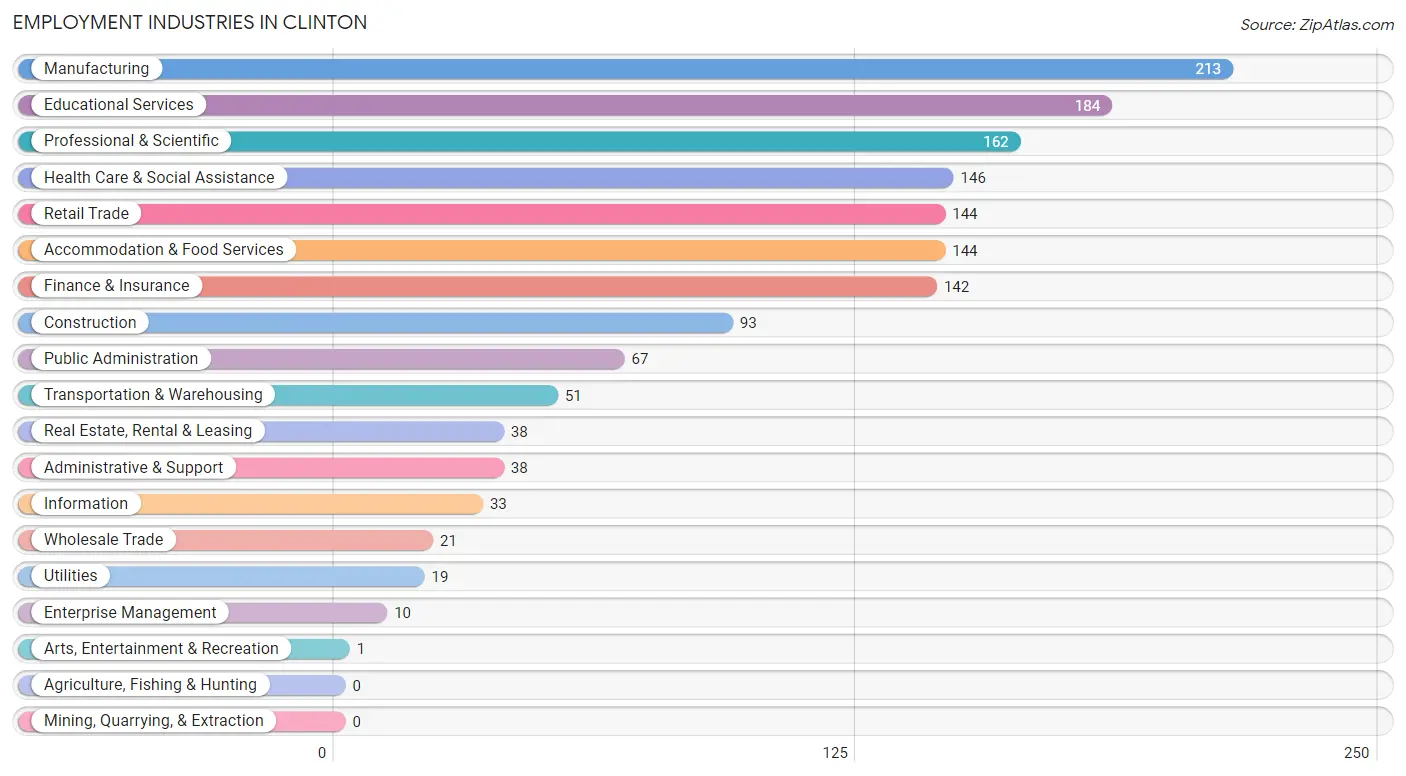
Employment Industries in Clinton
The major employment industries in Clinton include Manufacturing (213 | 13.7%), Educational Services (184 | 11.8%), Professional & Scientific (162 | 10.4%), Health Care & Social Assistance (146 | 9.4%), and Retail Trade (144 | 9.2%).
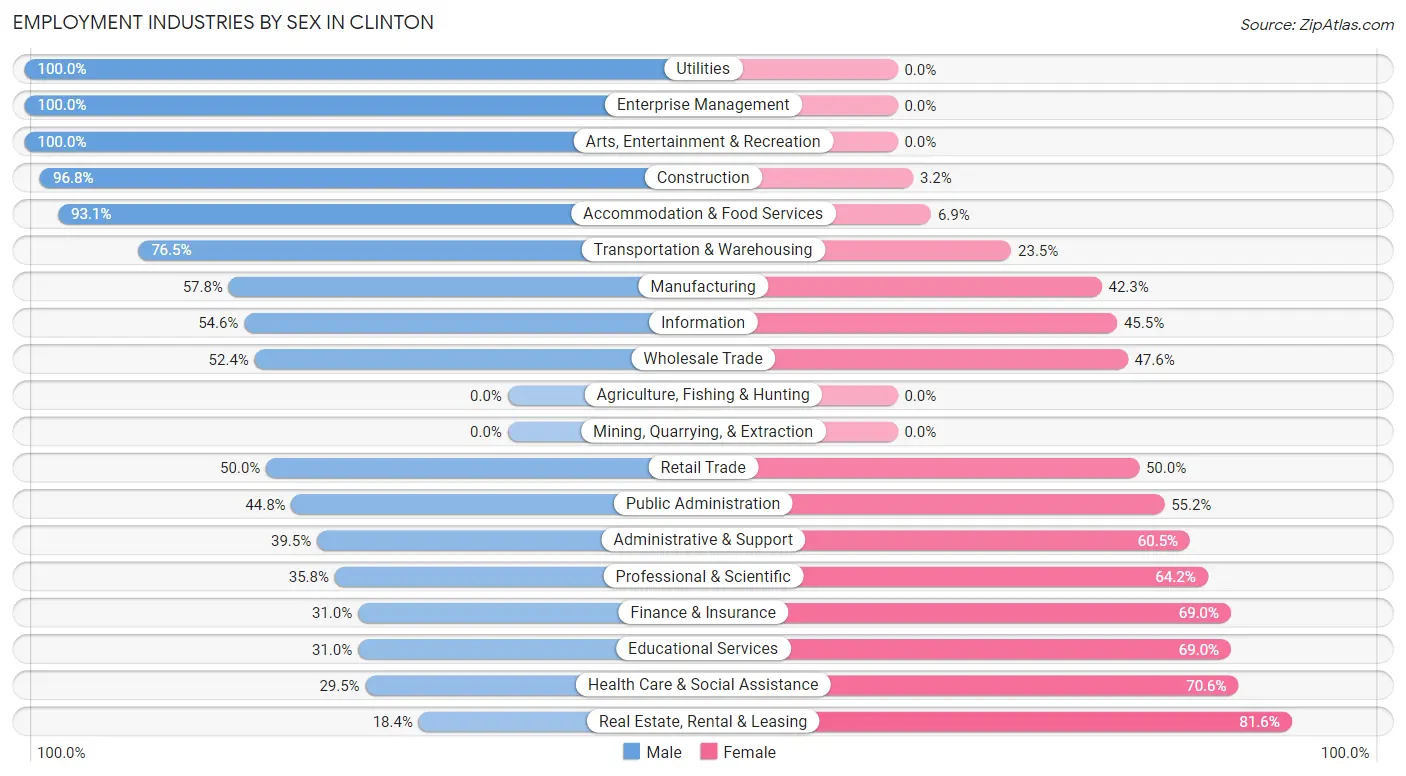
Employment Industries by Sex in Clinton
The Clinton industries that see more men than women are Utilities (100.0%), Enterprise Management (100.0%), and Arts, Entertainment & Recreation (100.0%), whereas the industries that tend to have a higher number of women are Real Estate, Rental & Leasing (81.6%), Health Care & Social Assistance (70.6%), and Educational Services (69.0%).
| Industry | Male | Female |
| Agriculture, Fishing & Hunting | 0 (0.0%) | 0 (0.0%) |
| Mining, Quarrying, & Extraction | 0 (0.0%) | 0 (0.0%) |
| Construction | 90 (96.8%) | 3 (3.2%) |
| Manufacturing | 123 (57.8%) | 90 (42.2%) |
| Wholesale Trade | 11 (52.4%) | 10 (47.6%) |
| Retail Trade | 72 (50.0%) | 72 (50.0%) |
| Transportation & Warehousing | 39 (76.5%) | 12 (23.5%) |
| Utilities | 19 (100.0%) | 0 (0.0%) |
| Information | 18 (54.5%) | 15 (45.5%) |
| Finance & Insurance | 44 (31.0%) | 98 (69.0%) |
| Real Estate, Rental & Leasing | 7 (18.4%) | 31 (81.6%) |
| Professional & Scientific | 58 (35.8%) | 104 (64.2%) |
| Enterprise Management | 10 (100.0%) | 0 (0.0%) |
| Administrative & Support | 15 (39.5%) | 23 (60.5%) |
| Educational Services | 57 (31.0%) | 127 (69.0%) |
| Health Care & Social Assistance | 43 (29.4%) | 103 (70.6%) |
| Arts, Entertainment & Recreation | 1 (100.0%) | 0 (0.0%) |
| Accommodation & Food Services | 134 (93.1%) | 10 (6.9%) |
| Public Administration | 30 (44.8%) | 37 (55.2%) |
| Total | 775 (49.7%) | 785 (50.3%) |
Education in Clinton
School Enrollment in Clinton
The most common levels of schooling among the 703 students in Clinton are high school (180 | 25.6%), middle school (172 | 24.5%), and college / undergraduate (127 | 18.1%).
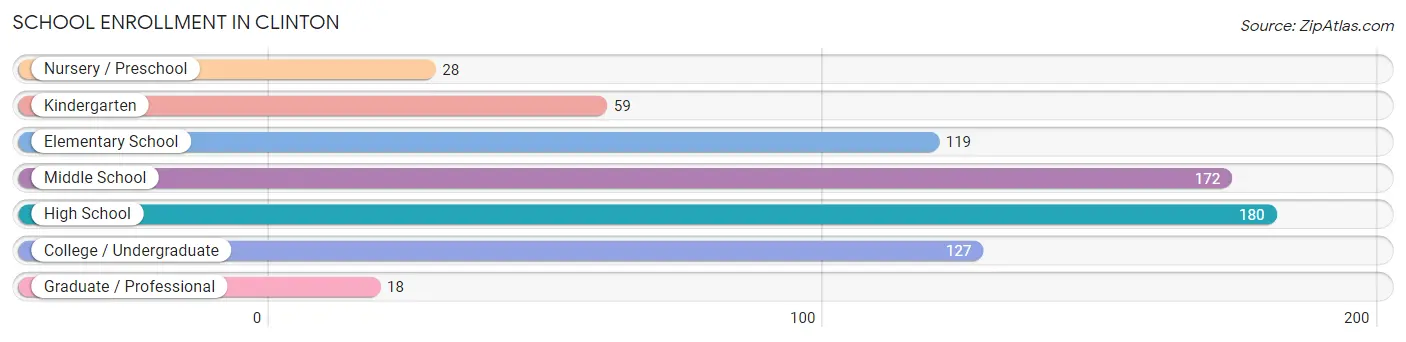
| School Level | # Students | % Students |
| Nursery / Preschool | 28 | 4.0% |
| Kindergarten | 59 | 8.4% |
| Elementary School | 119 | 16.9% |
| Middle School | 172 | 24.5% |
| High School | 180 | 25.6% |
| College / Undergraduate | 127 | 18.1% |
| Graduate / Professional | 18 | 2.6% |
| Total | 703 | 100.0% |
School Enrollment by Age by Funding Source in Clinton
Out of a total of 703 students who are enrolled in schools in Clinton, 50 (7.1%) attend a private institution, while the remaining 653 (92.9%) are enrolled in public schools. The age group of 3 to 4 year olds has the highest likelihood of being enrolled in private schools, with 10 (62.5% in the age bracket) enrolled. Conversely, the age group of 5 to 9 year old has the lowest likelihood of being enrolled in a private school, with 185 (100.0% in the age bracket) attending a public institution.
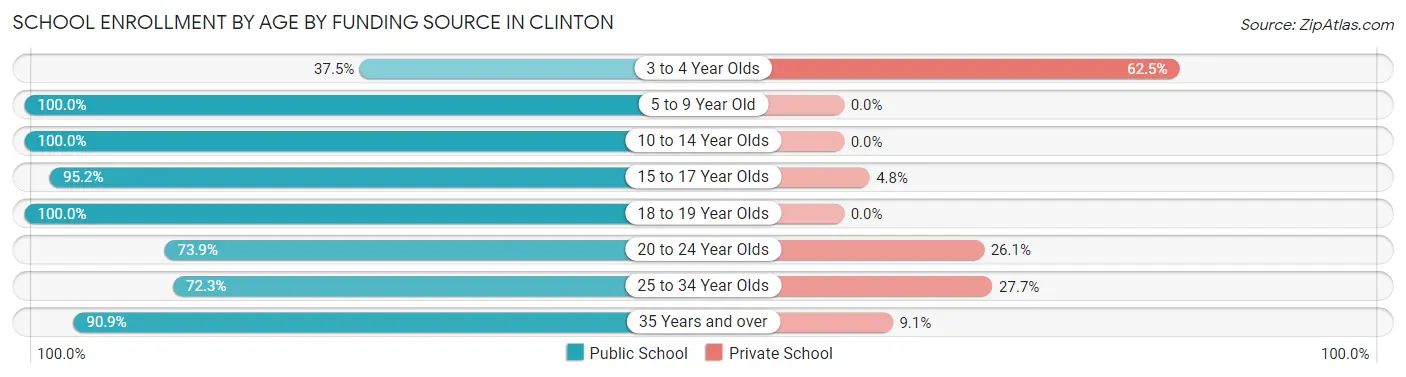
| Age Bracket | Public School | Private School |
| 3 to 4 Year Olds | 6 (37.5%) | 10 (62.5%) |
| 5 to 9 Year Old | 185 (100.0%) | 0 (0.0%) |
| 10 to 14 Year Olds | 193 (100.0%) | 0 (0.0%) |
| 15 to 17 Year Olds | 120 (95.2%) | 6 (4.8%) |
| 18 to 19 Year Olds | 34 (100.0%) | 0 (0.0%) |
| 20 to 24 Year Olds | 51 (73.9%) | 18 (26.1%) |
| 25 to 34 Year Olds | 34 (72.3%) | 13 (27.7%) |
| 35 Years and over | 30 (90.9%) | 3 (9.1%) |
| Total | 653 (92.9%) | 50 (7.1%) |
Educational Attainment by Field of Study in Clinton
Business (228 | 20.5%), computers & mathematics (128 | 11.5%), bio, nature & agricultural (101 | 9.1%), social sciences (97 | 8.7%), and education (92 | 8.3%) are the most common fields of study among 1,111 individuals in Clinton who have obtained a bachelor's degree or higher.
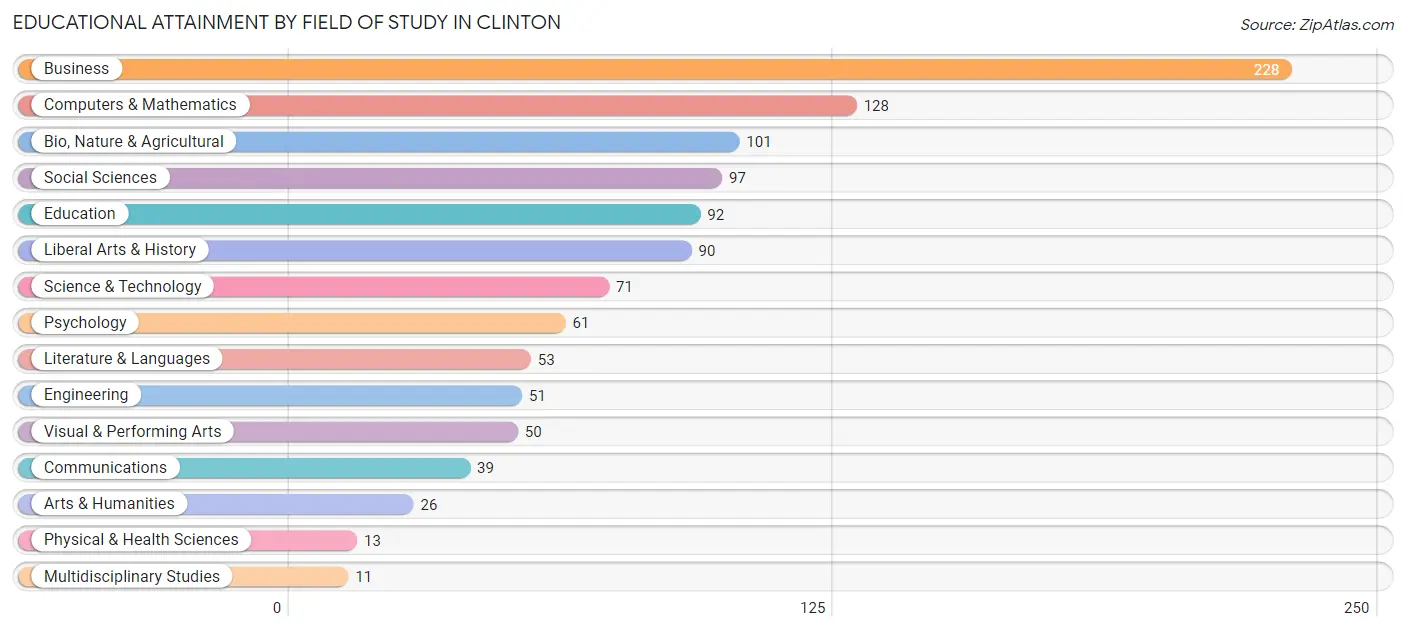
| Field of Study | # Graduates | % Graduates |
| Computers & Mathematics | 128 | 11.5% |
| Bio, Nature & Agricultural | 101 | 9.1% |
| Physical & Health Sciences | 13 | 1.2% |
| Psychology | 61 | 5.5% |
| Social Sciences | 97 | 8.7% |
| Engineering | 51 | 4.6% |
| Multidisciplinary Studies | 11 | 1.0% |
| Science & Technology | 71 | 6.4% |
| Business | 228 | 20.5% |
| Education | 92 | 8.3% |
| Literature & Languages | 53 | 4.8% |
| Liberal Arts & History | 90 | 8.1% |
| Visual & Performing Arts | 50 | 4.5% |
| Communications | 39 | 3.5% |
| Arts & Humanities | 26 | 2.3% |
| Total | 1,111 | 100.0% |
Transportation & Commute in Clinton
Vehicle Availability by Sex in Clinton
The most prevalent vehicle ownership categories in Clinton are males with 2 vehicles (317, accounting for 41.8%) and females with 2 vehicles (359, making up 41.8%).
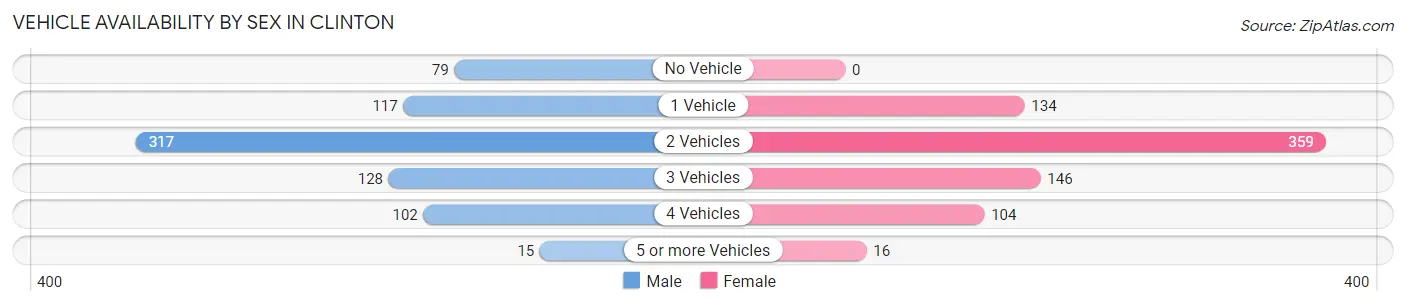
| Vehicles Available | Male | Female |
| No Vehicle | 79 (10.4%) | 0 (0.0%) |
| 1 Vehicle | 117 (15.4%) | 134 (17.6%) |
| 2 Vehicles | 317 (41.8%) | 359 (47.3%) |
| 3 Vehicles | 128 (16.9%) | 146 (19.2%) |
| 4 Vehicles | 102 (13.5%) | 104 (13.7%) |
| 5 or more Vehicles | 15 (2.0%) | 16 (2.1%) |
| Total | 758 (100.0%) | 759 (100.0%) |
Commute Time in Clinton
The most frequently occuring commute durations in Clinton are 45 to 59 minutes (247 commuters, 19.8%), 5 to 9 minutes (151 commuters, 12.1%), and 10 to 14 minutes (146 commuters, 11.7%).
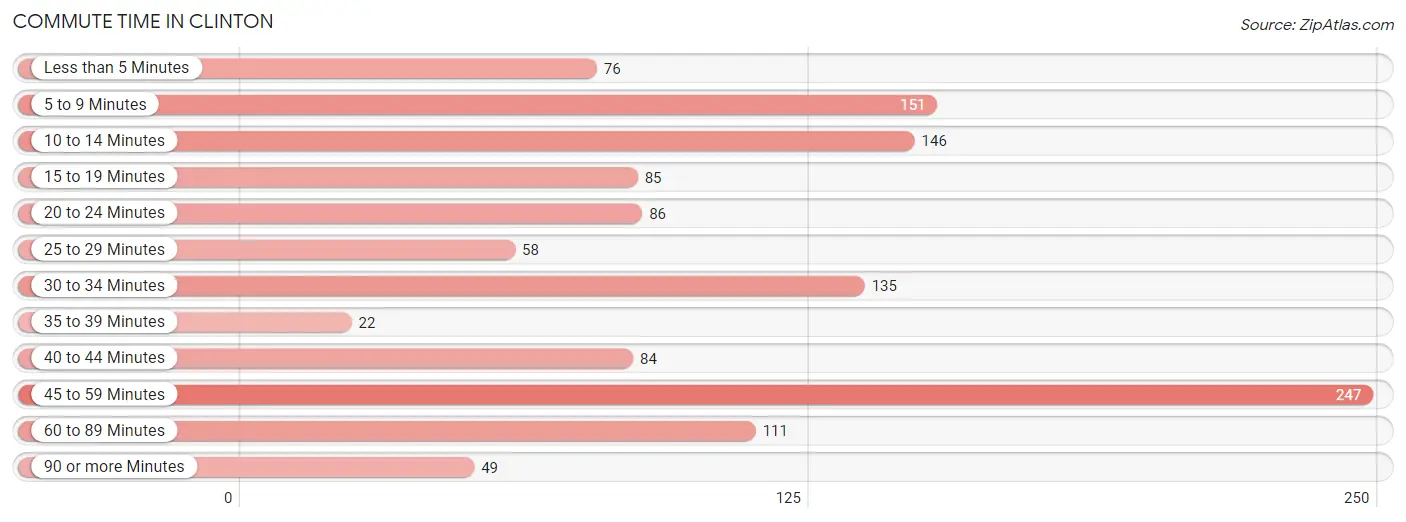
| Commute Time | # Commuters | % Commuters |
| Less than 5 Minutes | 76 | 6.1% |
| 5 to 9 Minutes | 151 | 12.1% |
| 10 to 14 Minutes | 146 | 11.7% |
| 15 to 19 Minutes | 85 | 6.8% |
| 20 to 24 Minutes | 86 | 6.9% |
| 25 to 29 Minutes | 58 | 4.6% |
| 30 to 34 Minutes | 135 | 10.8% |
| 35 to 39 Minutes | 22 | 1.8% |
| 40 to 44 Minutes | 84 | 6.7% |
| 45 to 59 Minutes | 247 | 19.8% |
| 60 to 89 Minutes | 111 | 8.9% |
| 90 or more Minutes | 49 | 3.9% |
Commute Time by Sex in Clinton
The most common commute times in Clinton are 45 to 59 minutes (117 commuters, 18.0%) for males and 45 to 59 minutes (130 commuters, 21.7%) for females.
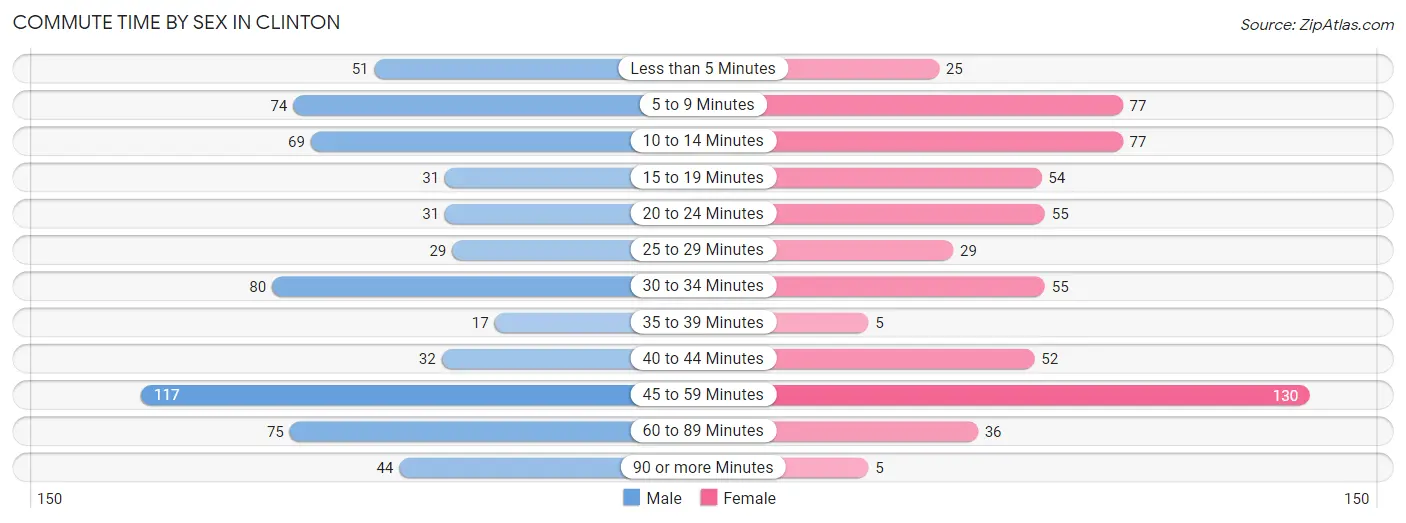
| Commute Time | Male | Female |
| Less than 5 Minutes | 51 (7.9%) | 25 (4.2%) |
| 5 to 9 Minutes | 74 (11.4%) | 77 (12.8%) |
| 10 to 14 Minutes | 69 (10.6%) | 77 (12.8%) |
| 15 to 19 Minutes | 31 (4.8%) | 54 (9.0%) |
| 20 to 24 Minutes | 31 (4.8%) | 55 (9.2%) |
| 25 to 29 Minutes | 29 (4.5%) | 29 (4.8%) |
| 30 to 34 Minutes | 80 (12.3%) | 55 (9.2%) |
| 35 to 39 Minutes | 17 (2.6%) | 5 (0.8%) |
| 40 to 44 Minutes | 32 (4.9%) | 52 (8.7%) |
| 45 to 59 Minutes | 117 (18.0%) | 130 (21.7%) |
| 60 to 89 Minutes | 75 (11.5%) | 36 (6.0%) |
| 90 or more Minutes | 44 (6.8%) | 5 (0.8%) |
Time of Departure to Work by Sex in Clinton
The most frequent times of departure to work in Clinton are 7:30 AM to 7:59 AM (102, 15.7%) for males and 8:30 AM to 8:59 AM (157, 26.2%) for females.
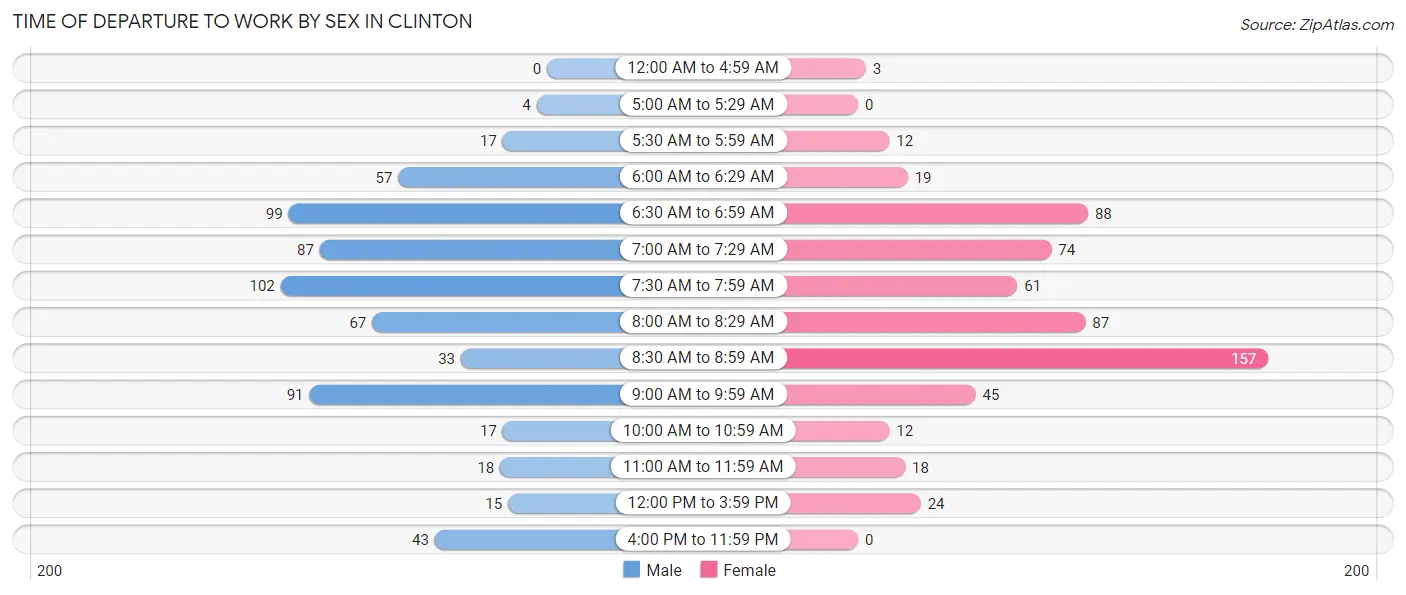
| Time of Departure | Male | Female |
| 12:00 AM to 4:59 AM | 0 (0.0%) | 3 (0.5%) |
| 5:00 AM to 5:29 AM | 4 (0.6%) | 0 (0.0%) |
| 5:30 AM to 5:59 AM | 17 (2.6%) | 12 (2.0%) |
| 6:00 AM to 6:29 AM | 57 (8.8%) | 19 (3.2%) |
| 6:30 AM to 6:59 AM | 99 (15.2%) | 88 (14.7%) |
| 7:00 AM to 7:29 AM | 87 (13.4%) | 74 (12.3%) |
| 7:30 AM to 7:59 AM | 102 (15.7%) | 61 (10.2%) |
| 8:00 AM to 8:29 AM | 67 (10.3%) | 87 (14.5%) |
| 8:30 AM to 8:59 AM | 33 (5.1%) | 157 (26.2%) |
| 9:00 AM to 9:59 AM | 91 (14.0%) | 45 (7.5%) |
| 10:00 AM to 10:59 AM | 17 (2.6%) | 12 (2.0%) |
| 11:00 AM to 11:59 AM | 18 (2.8%) | 18 (3.0%) |
| 12:00 PM to 3:59 PM | 15 (2.3%) | 24 (4.0%) |
| 4:00 PM to 11:59 PM | 43 (6.6%) | 0 (0.0%) |
| Total | 650 (100.0%) | 600 (100.0%) |
Housing Occupancy in Clinton
Occupancy by Ownership in Clinton
Of the total 1,091 dwellings in Clinton, owner-occupied units account for 774 (70.9%), while renter-occupied units make up 317 (29.1%).
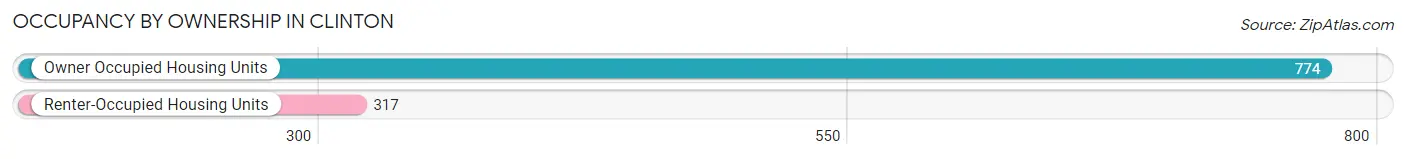
| Occupancy | # Housing Units | % Housing Units |
| Owner Occupied Housing Units | 774 | 70.9% |
| Renter-Occupied Housing Units | 317 | 29.1% |
| Total Occupied Housing Units | 1,091 | 100.0% |
Occupancy by Household Size in Clinton
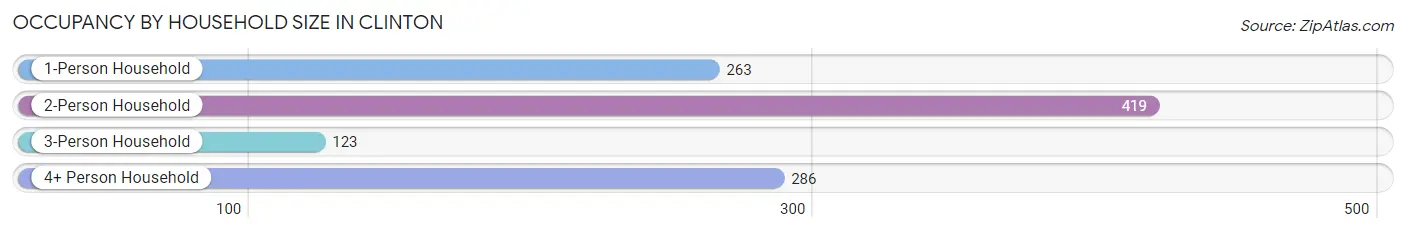
| Household Size | # Housing Units | % Housing Units |
| 1-Person Household | 263 | 24.1% |
| 2-Person Household | 419 | 38.4% |
| 3-Person Household | 123 | 11.3% |
| 4+ Person Household | 286 | 26.2% |
| Total Housing Units | 1,091 | 100.0% |
Occupancy by Ownership by Household Size in Clinton
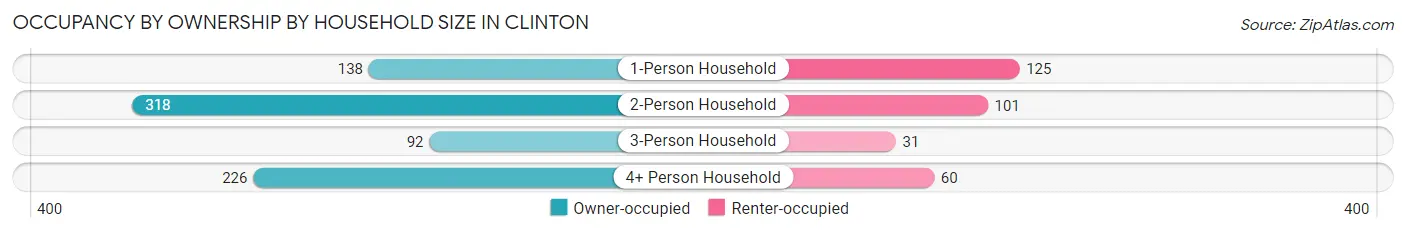
| Household Size | Owner-occupied | Renter-occupied |
| 1-Person Household | 138 (52.5%) | 125 (47.5%) |
| 2-Person Household | 318 (75.9%) | 101 (24.1%) |
| 3-Person Household | 92 (74.8%) | 31 (25.2%) |
| 4+ Person Household | 226 (79.0%) | 60 (21.0%) |
| Total Housing Units | 774 (70.9%) | 317 (29.1%) |
Occupancy by Educational Attainment in Clinton
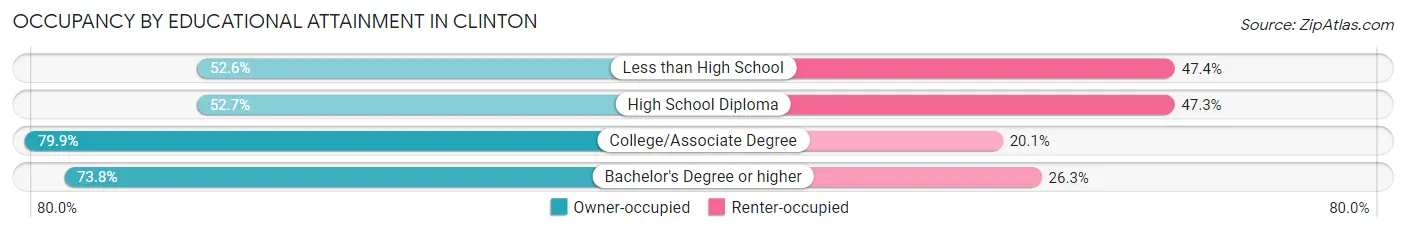
| Household Size | Owner-occupied | Renter-occupied |
| Less than High School | 20 (52.6%) | 18 (47.4%) |
| High School Diploma | 98 (52.7%) | 88 (47.3%) |
| College/Associate Degree | 215 (79.9%) | 54 (20.1%) |
| Bachelor's Degree or higher | 441 (73.8%) | 157 (26.3%) |
Occupancy by Age of Householder in Clinton
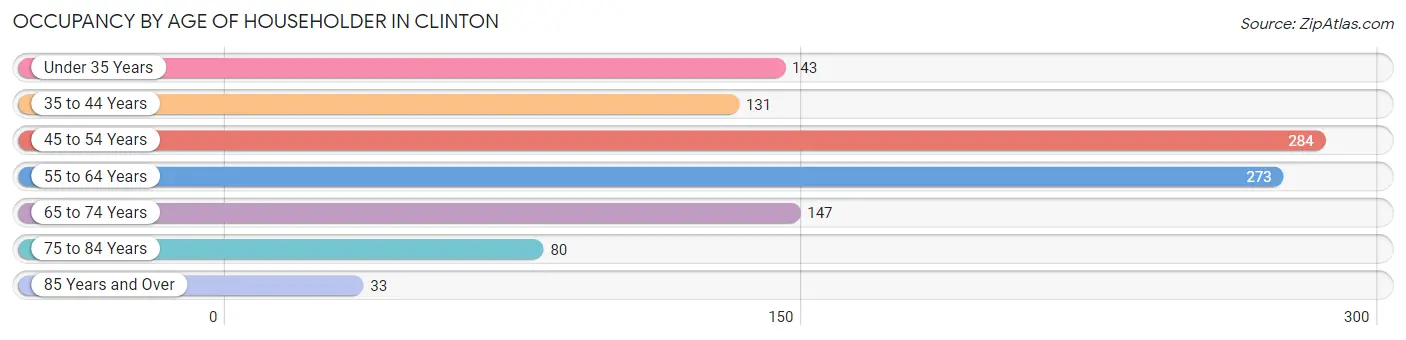
| Age Bracket | # Households | % Households |
| Under 35 Years | 143 | 13.1% |
| 35 to 44 Years | 131 | 12.0% |
| 45 to 54 Years | 284 | 26.0% |
| 55 to 64 Years | 273 | 25.0% |
| 65 to 74 Years | 147 | 13.5% |
| 75 to 84 Years | 80 | 7.3% |
| 85 Years and Over | 33 | 3.0% |
| Total | 1,091 | 100.0% |
Housing Finances in Clinton
Median Income by Occupancy in Clinton
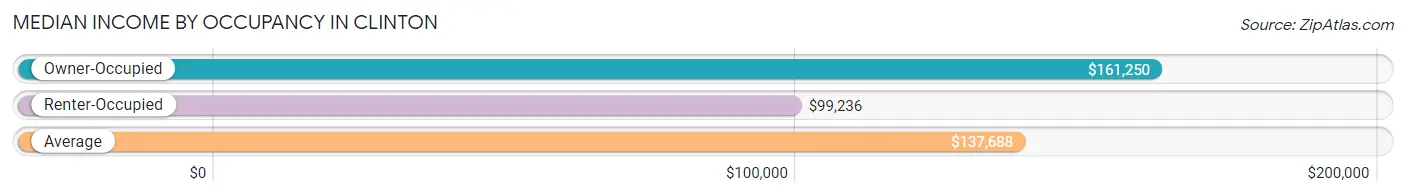
| Occupancy Type | # Households | Median Income |
| Owner-Occupied | 774 (70.9%) | $161,250 |
| Renter-Occupied | 317 (29.1%) | $99,236 |
| Average | 1,091 (100.0%) | $137,688 |
Occupancy by Householder Income Bracket in Clinton
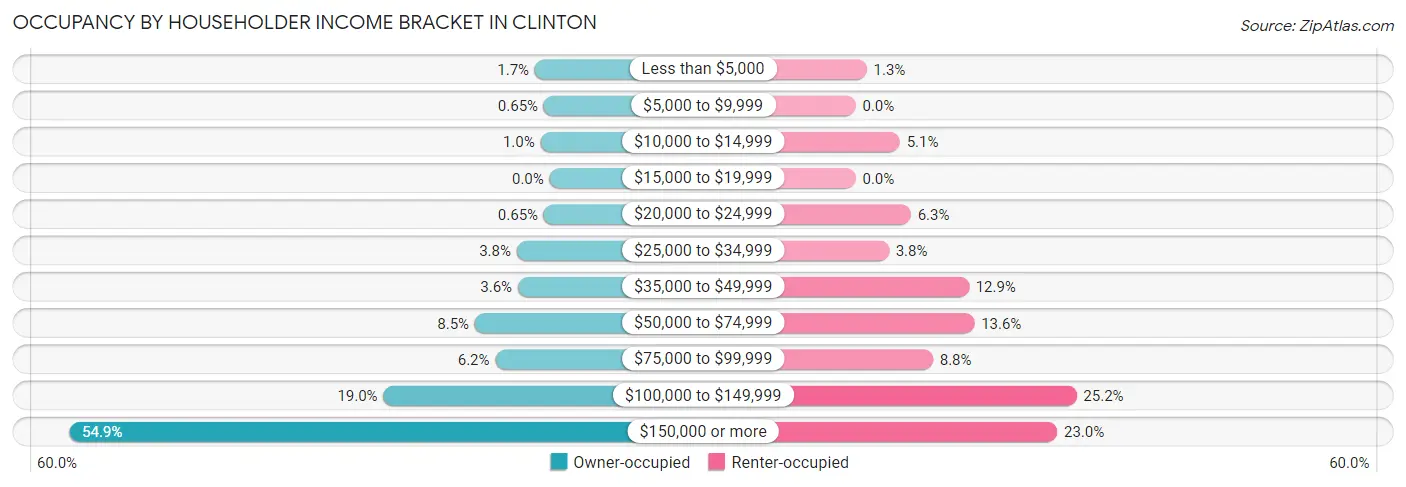
| Income Bracket | Owner-occupied | Renter-occupied |
| Less than $5,000 | 13 (1.7%) | 4 (1.3%) |
| $5,000 to $9,999 | 5 (0.6%) | 0 (0.0%) |
| $10,000 to $14,999 | 8 (1.0%) | 16 (5.1%) |
| $15,000 to $19,999 | 0 (0.0%) | 0 (0.0%) |
| $20,000 to $24,999 | 5 (0.6%) | 20 (6.3%) |
| $25,000 to $34,999 | 29 (3.7%) | 12 (3.8%) |
| $35,000 to $49,999 | 28 (3.6%) | 41 (12.9%) |
| $50,000 to $74,999 | 66 (8.5%) | 43 (13.6%) |
| $75,000 to $99,999 | 48 (6.2%) | 28 (8.8%) |
| $100,000 to $149,999 | 147 (19.0%) | 80 (25.2%) |
| $150,000 or more | 425 (54.9%) | 73 (23.0%) |
| Total | 774 (100.0%) | 317 (100.0%) |
Monthly Housing Cost Tiers in Clinton
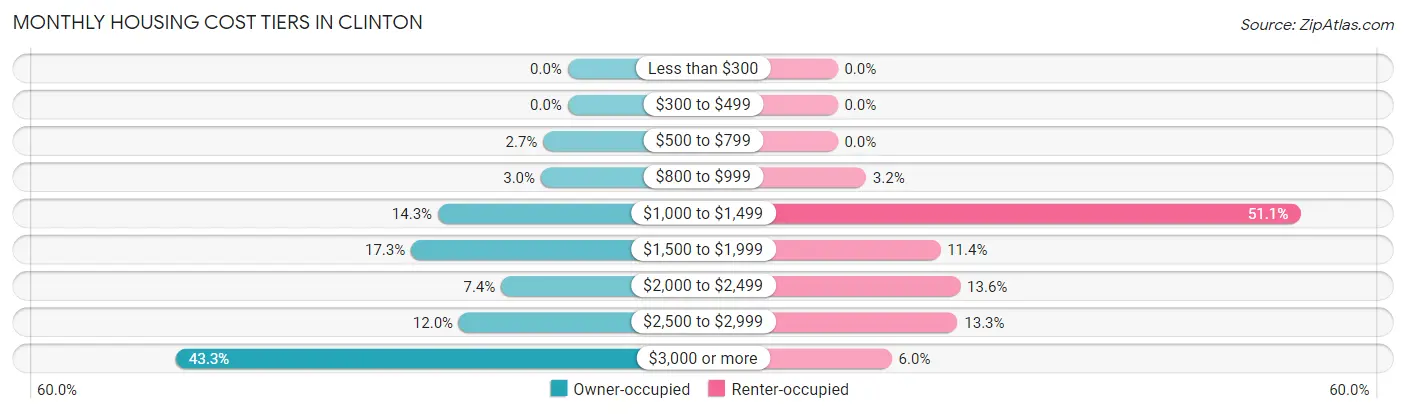
| Monthly Cost | Owner-occupied | Renter-occupied |
| Less than $300 | 0 (0.0%) | 0 (0.0%) |
| $300 to $499 | 0 (0.0%) | 0 (0.0%) |
| $500 to $799 | 21 (2.7%) | 0 (0.0%) |
| $800 to $999 | 23 (3.0%) | 10 (3.2%) |
| $1,000 to $1,499 | 111 (14.3%) | 162 (51.1%) |
| $1,500 to $1,999 | 134 (17.3%) | 36 (11.4%) |
| $2,000 to $2,499 | 57 (7.4%) | 43 (13.6%) |
| $2,500 to $2,999 | 93 (12.0%) | 42 (13.3%) |
| $3,000 or more | 335 (43.3%) | 19 (6.0%) |
| Total | 774 (100.0%) | 317 (100.0%) |
Physical Housing Characteristics in Clinton
Housing Structures in Clinton
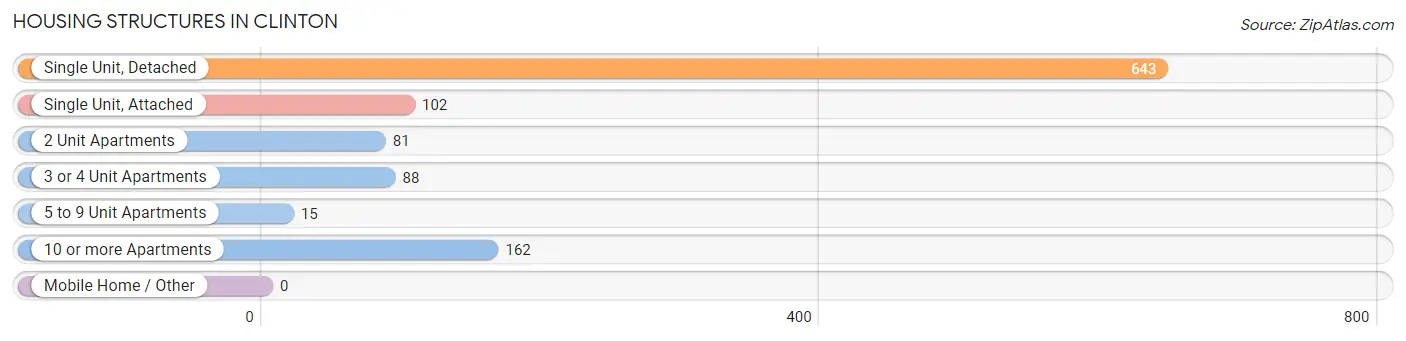
| Structure Type | # Housing Units | % Housing Units |
| Single Unit, Detached | 643 | 58.9% |
| Single Unit, Attached | 102 | 9.3% |
| 2 Unit Apartments | 81 | 7.4% |
| 3 or 4 Unit Apartments | 88 | 8.1% |
| 5 to 9 Unit Apartments | 15 | 1.4% |
| 10 or more Apartments | 162 | 14.8% |
| Mobile Home / Other | 0 | 0.0% |
| Total | 1,091 | 100.0% |
Housing Structures by Occupancy in Clinton
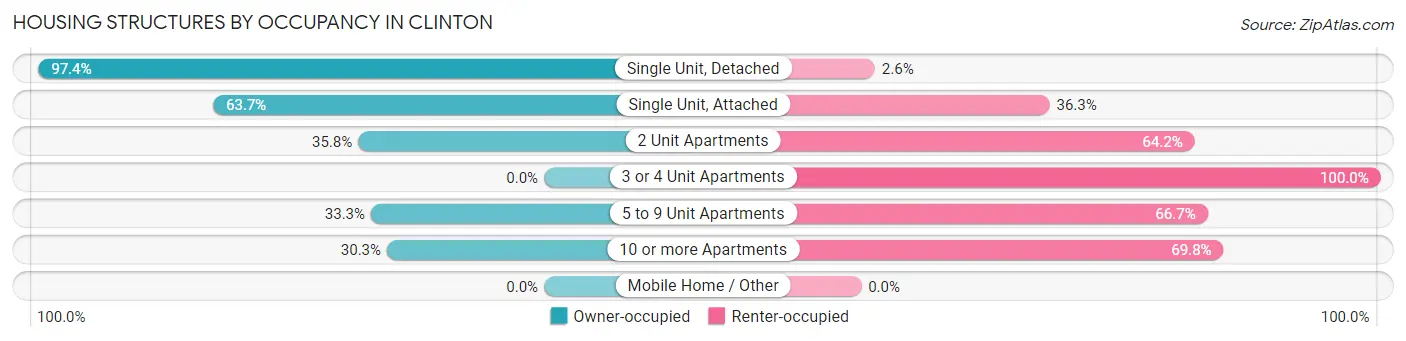
| Structure Type | Owner-occupied | Renter-occupied |
| Single Unit, Detached | 626 (97.4%) | 17 (2.6%) |
| Single Unit, Attached | 65 (63.7%) | 37 (36.3%) |
| 2 Unit Apartments | 29 (35.8%) | 52 (64.2%) |
| 3 or 4 Unit Apartments | 0 (0.0%) | 88 (100.0%) |
| 5 to 9 Unit Apartments | 5 (33.3%) | 10 (66.7%) |
| 10 or more Apartments | 49 (30.2%) | 113 (69.8%) |
| Mobile Home / Other | 0 (0.0%) | 0 (0.0%) |
| Total | 774 (70.9%) | 317 (29.1%) |
Housing Structures by Number of Rooms in Clinton
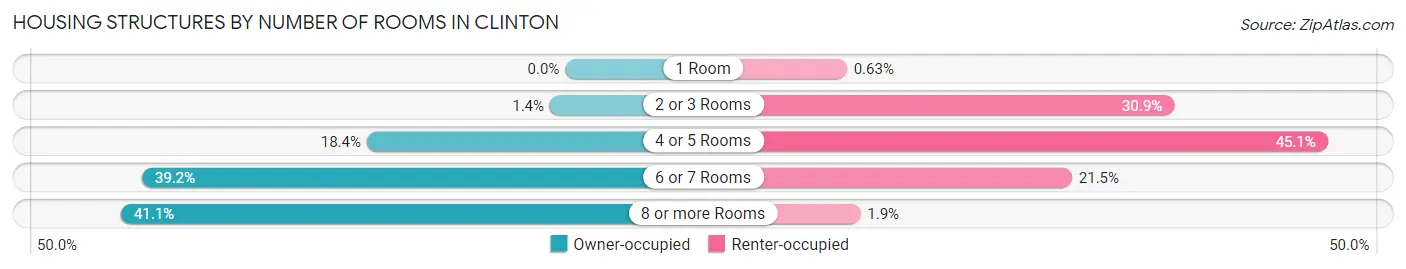
| Number of Rooms | Owner-occupied | Renter-occupied |
| 1 Room | 0 (0.0%) | 2 (0.6%) |
| 2 or 3 Rooms | 11 (1.4%) | 98 (30.9%) |
| 4 or 5 Rooms | 142 (18.3%) | 143 (45.1%) |
| 6 or 7 Rooms | 303 (39.2%) | 68 (21.4%) |
| 8 or more Rooms | 318 (41.1%) | 6 (1.9%) |
| Total | 774 (100.0%) | 317 (100.0%) |
Housing Structure by Heating Type in Clinton
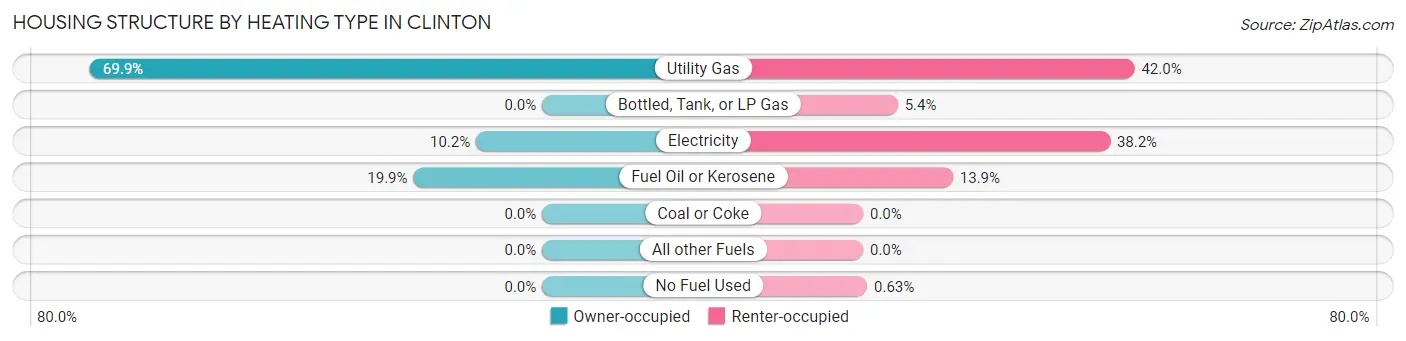
| Heating Type | Owner-occupied | Renter-occupied |
| Utility Gas | 541 (69.9%) | 133 (42.0%) |
| Bottled, Tank, or LP Gas | 0 (0.0%) | 17 (5.4%) |
| Electricity | 79 (10.2%) | 121 (38.2%) |
| Fuel Oil or Kerosene | 154 (19.9%) | 44 (13.9%) |
| Coal or Coke | 0 (0.0%) | 0 (0.0%) |
| All other Fuels | 0 (0.0%) | 0 (0.0%) |
| No Fuel Used | 0 (0.0%) | 2 (0.6%) |
| Total | 774 (100.0%) | 317 (100.0%) |
Household Vehicle Usage in Clinton
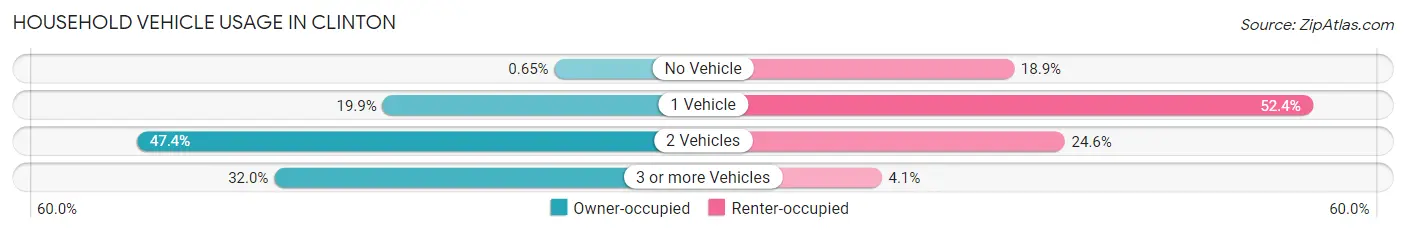
| Vehicles per Household | Owner-occupied | Renter-occupied |
| No Vehicle | 5 (0.6%) | 60 (18.9%) |
| 1 Vehicle | 154 (19.9%) | 166 (52.4%) |
| 2 Vehicles | 367 (47.4%) | 78 (24.6%) |
| 3 or more Vehicles | 248 (32.0%) | 13 (4.1%) |
| Total | 774 (100.0%) | 317 (100.0%) |
Real Estate & Mortgages in Clinton
Real Estate and Mortgage Overview in Clinton
| Characteristic | Without Mortgage | With Mortgage |
| Housing Units | 226 | 548 |
| Median Property Value | $367,700 | $438,000 |
| Median Household Income | $156,667 | $303 |
| Monthly Housing Costs | $1,501 | $335 |
| Real Estate Taxes | $10,001 | $0 |
Property Value by Mortgage Status in Clinton
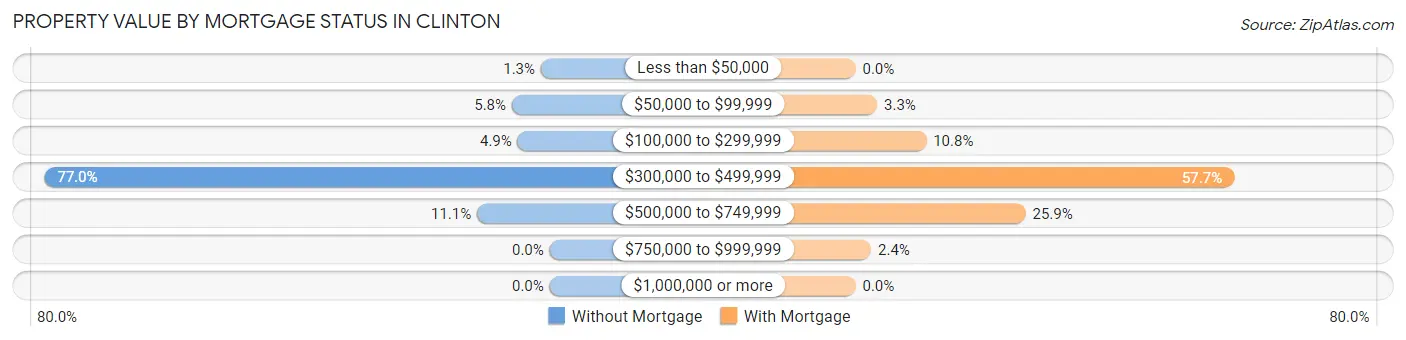
| Property Value | Without Mortgage | With Mortgage |
| Less than $50,000 | 3 (1.3%) | 0 (0.0%) |
| $50,000 to $99,999 | 13 (5.8%) | 18 (3.3%) |
| $100,000 to $299,999 | 11 (4.9%) | 59 (10.8%) |
| $300,000 to $499,999 | 174 (77.0%) | 316 (57.7%) |
| $500,000 to $749,999 | 25 (11.1%) | 142 (25.9%) |
| $750,000 to $999,999 | 0 (0.0%) | 13 (2.4%) |
| $1,000,000 or more | 0 (0.0%) | 0 (0.0%) |
| Total | 226 (100.0%) | 548 (100.0%) |
Household Income by Mortgage Status in Clinton
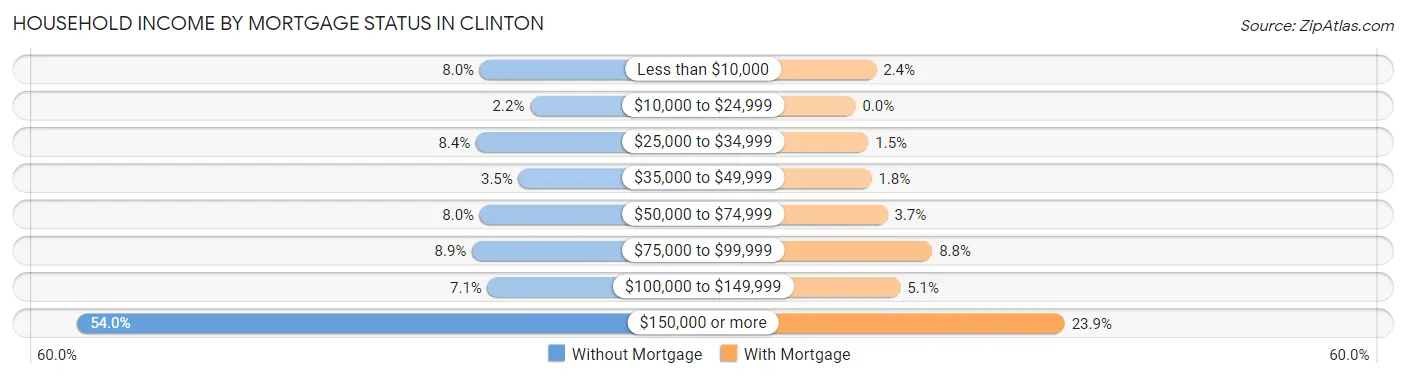
| Household Income | Without Mortgage | With Mortgage |
| Less than $10,000 | 18 (8.0%) | 13 (2.4%) |
| $10,000 to $24,999 | 5 (2.2%) | 0 (0.0%) |
| $25,000 to $34,999 | 19 (8.4%) | 8 (1.5%) |
| $35,000 to $49,999 | 8 (3.5%) | 10 (1.8%) |
| $50,000 to $74,999 | 18 (8.0%) | 20 (3.6%) |
| $75,000 to $99,999 | 20 (8.8%) | 48 (8.8%) |
| $100,000 to $149,999 | 16 (7.1%) | 28 (5.1%) |
| $150,000 or more | 122 (54.0%) | 131 (23.9%) |
| Total | 226 (100.0%) | 548 (100.0%) |
Property Value to Household Income Ratio in Clinton
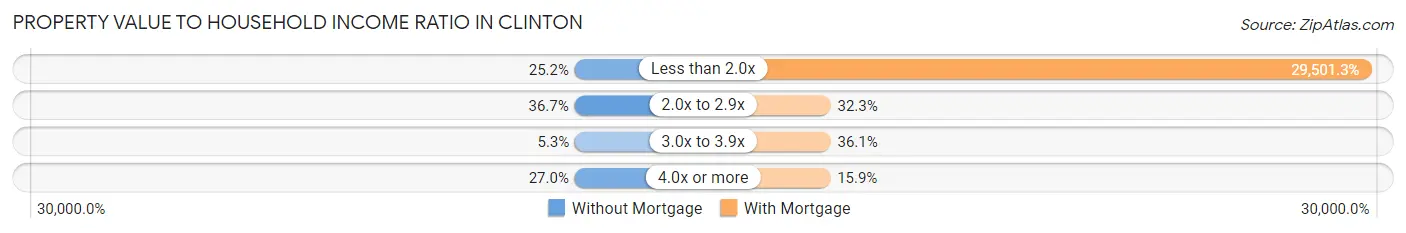
| Value-to-Income Ratio | Without Mortgage | With Mortgage |
| Less than 2.0x | 57 (25.2%) | 161,667 (29,501.3%) |
| 2.0x to 2.9x | 83 (36.7%) | 177 (32.3%) |
| 3.0x to 3.9x | 12 (5.3%) | 198 (36.1%) |
| 4.0x or more | 61 (27.0%) | 87 (15.9%) |
| Total | 226 (100.0%) | 548 (100.0%) |
Real Estate Taxes by Mortgage Status in Clinton
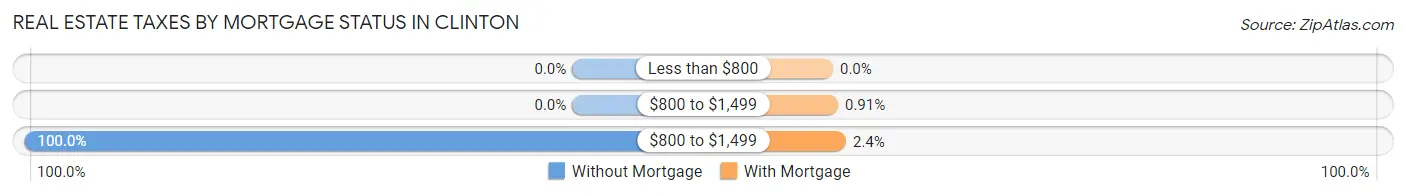
| Property Taxes | Without Mortgage | With Mortgage |
| Less than $800 | 0 (0.0%) | 0 (0.0%) |
| $800 to $1,499 | 0 (0.0%) | 5 (0.9%) |
| $800 to $1,499 | 226 (100.0%) | 13 (2.4%) |
| Total | 226 (100.0%) | 548 (100.0%) |
Health & Disability in Clinton
Health Insurance Coverage by Age in Clinton
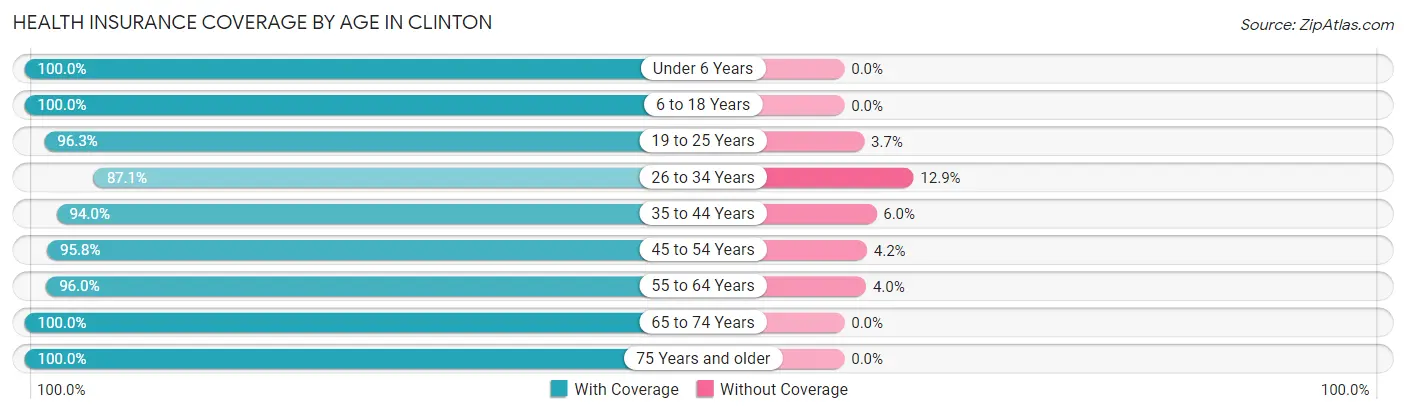
| Age Bracket | With Coverage | Without Coverage |
| Under 6 Years | 131 (100.0%) | 0 (0.0%) |
| 6 to 18 Years | 504 (100.0%) | 0 (0.0%) |
| 19 to 25 Years | 234 (96.3%) | 9 (3.7%) |
| 26 to 34 Years | 331 (87.1%) | 49 (12.9%) |
| 35 to 44 Years | 268 (94.0%) | 17 (6.0%) |
| 45 to 54 Years | 387 (95.8%) | 17 (4.2%) |
| 55 to 64 Years | 427 (96.0%) | 18 (4.0%) |
| 65 to 74 Years | 209 (100.0%) | 0 (0.0%) |
| 75 Years and older | 163 (100.0%) | 0 (0.0%) |
| Total | 2,654 (96.0%) | 110 (4.0%) |
Health Insurance Coverage by Citizenship Status in Clinton
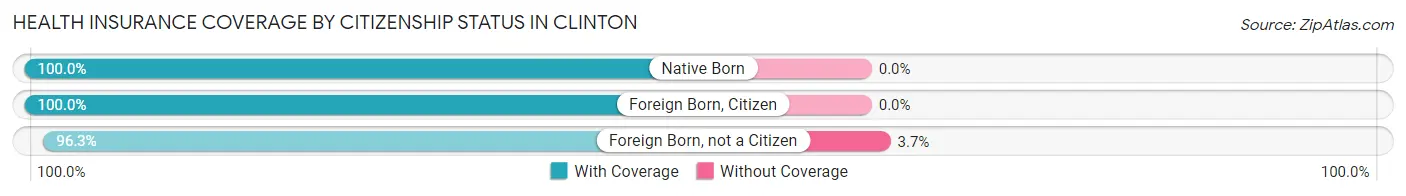
| Citizenship Status | With Coverage | Without Coverage |
| Native Born | 131 (100.0%) | 0 (0.0%) |
| Foreign Born, Citizen | 504 (100.0%) | 0 (0.0%) |
| Foreign Born, not a Citizen | 234 (96.3%) | 9 (3.7%) |
Health Insurance Coverage by Household Income in Clinton
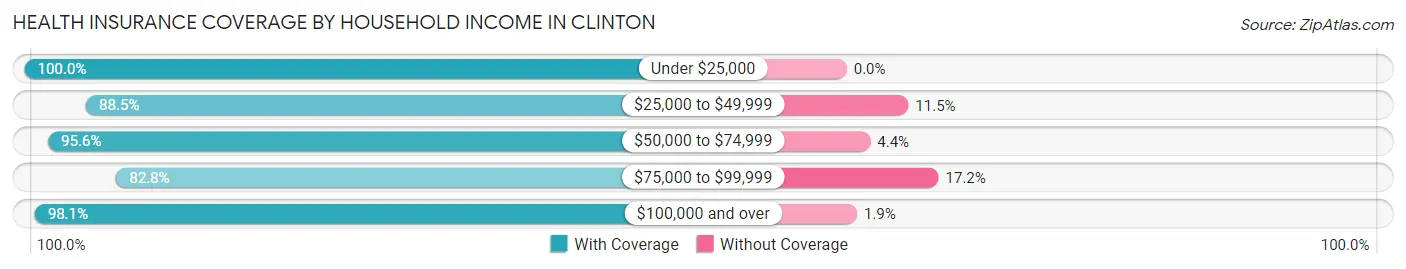
| Household Income | With Coverage | Without Coverage |
| Under $25,000 | 94 (100.0%) | 0 (0.0%) |
| $25,000 to $49,999 | 138 (88.5%) | 18 (11.5%) |
| $50,000 to $74,999 | 217 (95.6%) | 10 (4.4%) |
| $75,000 to $99,999 | 207 (82.8%) | 43 (17.2%) |
| $100,000 and over | 1,997 (98.1%) | 39 (1.9%) |
Public vs Private Health Insurance Coverage by Age in Clinton
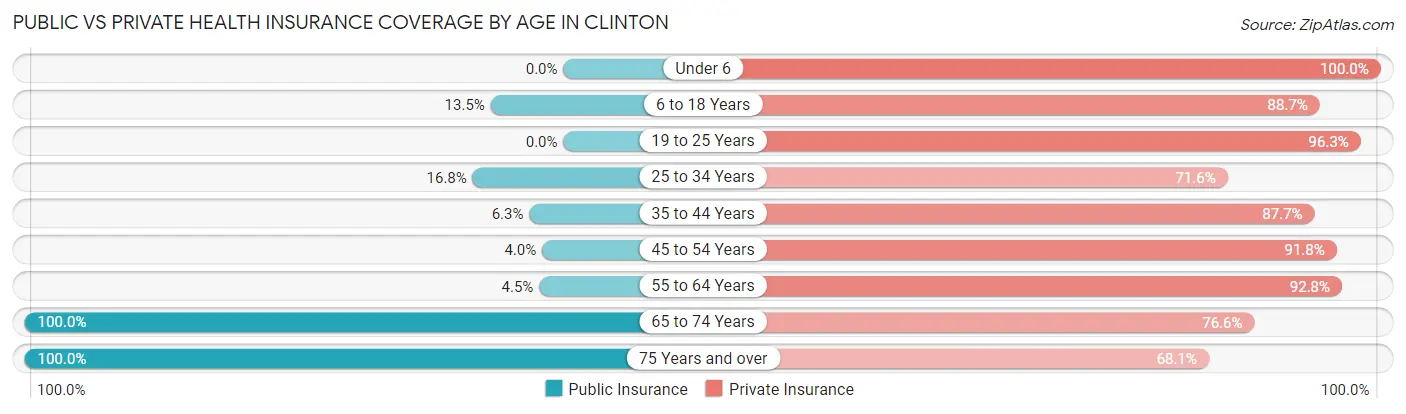
| Age Bracket | Public Insurance | Private Insurance |
| Under 6 | 0 (0.0%) | 131 (100.0%) |
| 6 to 18 Years | 68 (13.5%) | 447 (88.7%) |
| 19 to 25 Years | 0 (0.0%) | 234 (96.3%) |
| 25 to 34 Years | 64 (16.8%) | 272 (71.6%) |
| 35 to 44 Years | 18 (6.3%) | 250 (87.7%) |
| 45 to 54 Years | 16 (4.0%) | 371 (91.8%) |
| 55 to 64 Years | 20 (4.5%) | 413 (92.8%) |
| 65 to 74 Years | 209 (100.0%) | 160 (76.6%) |
| 75 Years and over | 163 (100.0%) | 111 (68.1%) |
| Total | 558 (20.2%) | 2,389 (86.4%) |
Disability Status by Sex by Age in Clinton
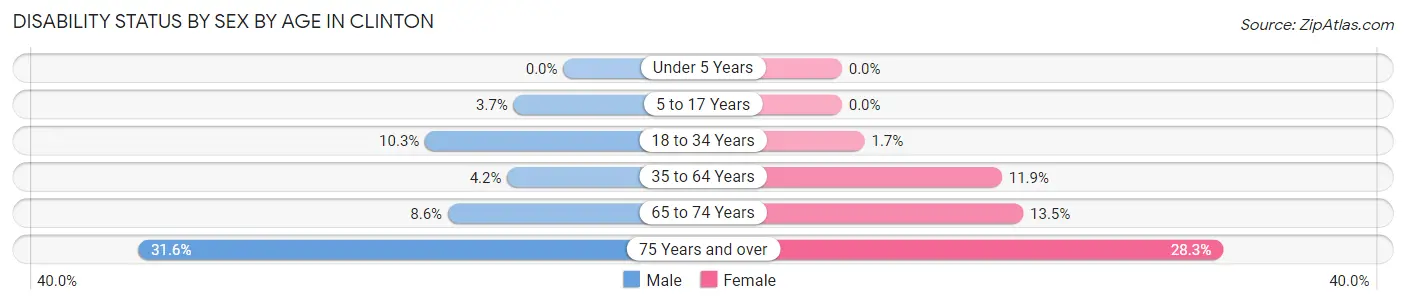
| Age Bracket | Male | Female |
| Under 5 Years | 0 (0.0%) | 0 (0.0%) |
| 5 to 17 Years | 12 (3.7%) | 0 (0.0%) |
| 18 to 34 Years | 31 (10.3%) | 6 (1.7%) |
| 35 to 64 Years | 23 (4.2%) | 69 (11.9%) |
| 65 to 74 Years | 9 (8.6%) | 14 (13.5%) |
| 75 Years and over | 18 (31.6%) | 30 (28.3%) |
Disability Class by Sex by Age in Clinton
Disability Class: Hearing Difficulty
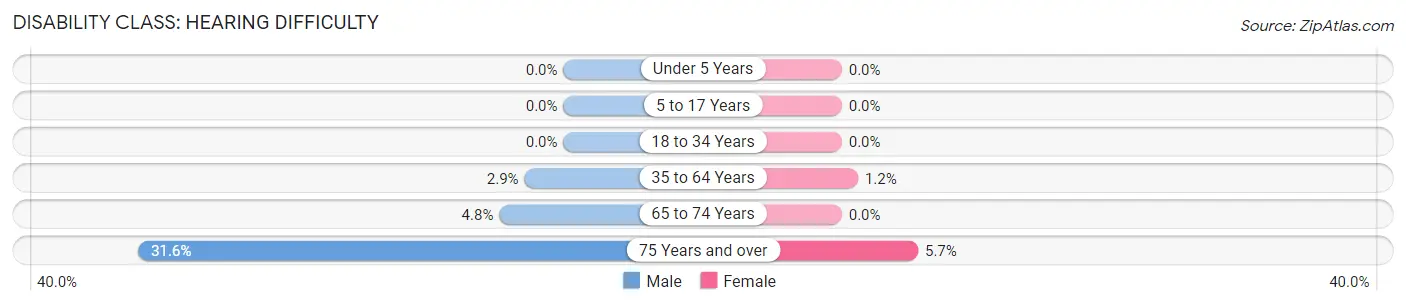
| Age Bracket | Male | Female |
| Under 5 Years | 0 (0.0%) | 0 (0.0%) |
| 5 to 17 Years | 0 (0.0%) | 0 (0.0%) |
| 18 to 34 Years | 0 (0.0%) | 0 (0.0%) |
| 35 to 64 Years | 16 (2.9%) | 7 (1.2%) |
| 65 to 74 Years | 5 (4.8%) | 0 (0.0%) |
| 75 Years and over | 18 (31.6%) | 6 (5.7%) |
Disability Class: Vision Difficulty
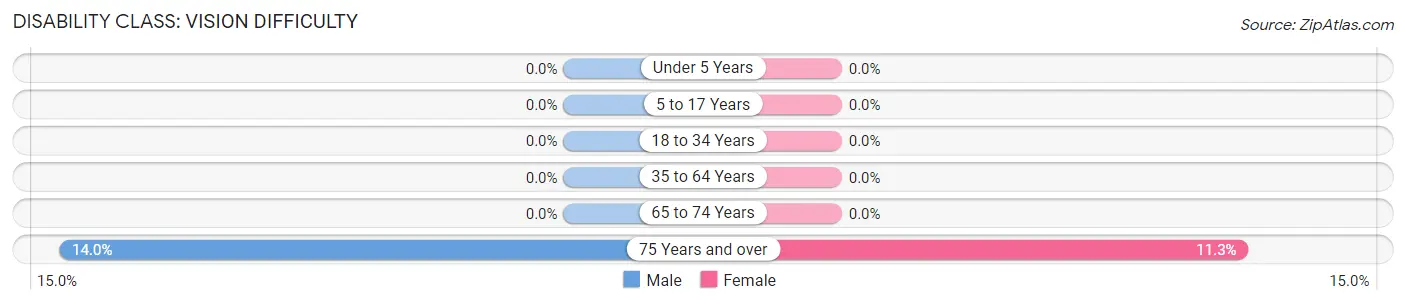
| Age Bracket | Male | Female |
| Under 5 Years | 0 (0.0%) | 0 (0.0%) |
| 5 to 17 Years | 0 (0.0%) | 0 (0.0%) |
| 18 to 34 Years | 0 (0.0%) | 0 (0.0%) |
| 35 to 64 Years | 0 (0.0%) | 0 (0.0%) |
| 65 to 74 Years | 0 (0.0%) | 0 (0.0%) |
| 75 Years and over | 8 (14.0%) | 12 (11.3%) |
Disability Class: Cognitive Difficulty
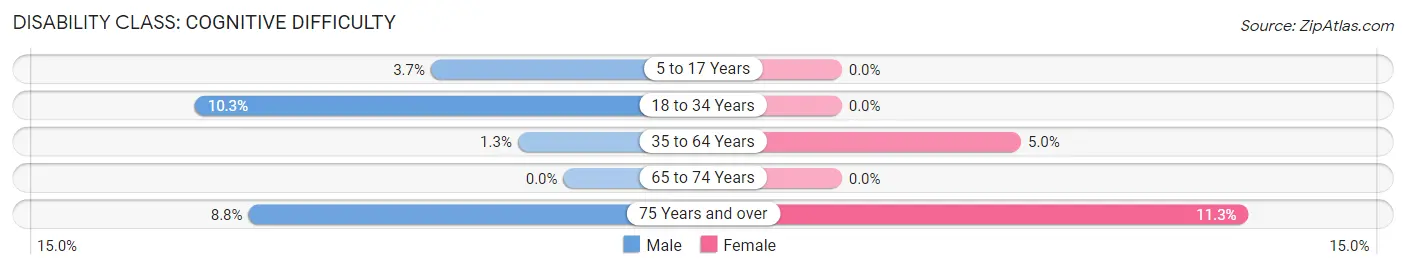
| Age Bracket | Male | Female |
| 5 to 17 Years | 12 (3.7%) | 0 (0.0%) |
| 18 to 34 Years | 31 (10.3%) | 0 (0.0%) |
| 35 to 64 Years | 7 (1.3%) | 29 (5.0%) |
| 65 to 74 Years | 0 (0.0%) | 0 (0.0%) |
| 75 Years and over | 5 (8.8%) | 12 (11.3%) |
Disability Class: Ambulatory Difficulty
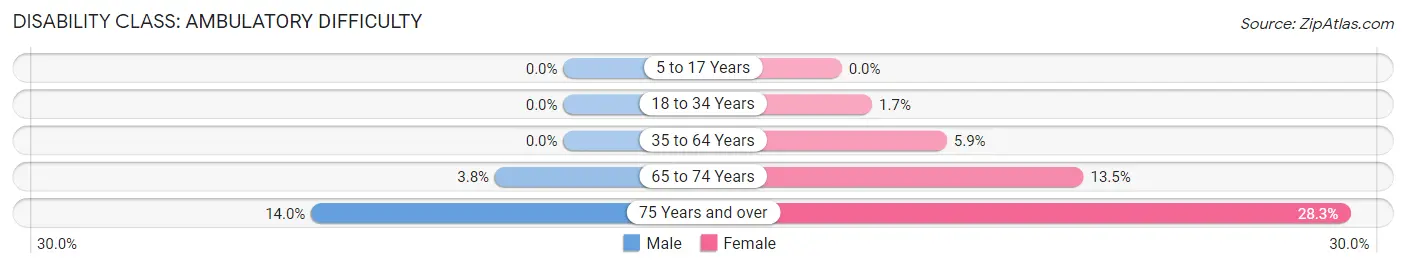
| Age Bracket | Male | Female |
| 5 to 17 Years | 0 (0.0%) | 0 (0.0%) |
| 18 to 34 Years | 0 (0.0%) | 6 (1.7%) |
| 35 to 64 Years | 0 (0.0%) | 34 (5.9%) |
| 65 to 74 Years | 4 (3.8%) | 14 (13.5%) |
| 75 Years and over | 8 (14.0%) | 30 (28.3%) |
Disability Class: Self-Care Difficulty
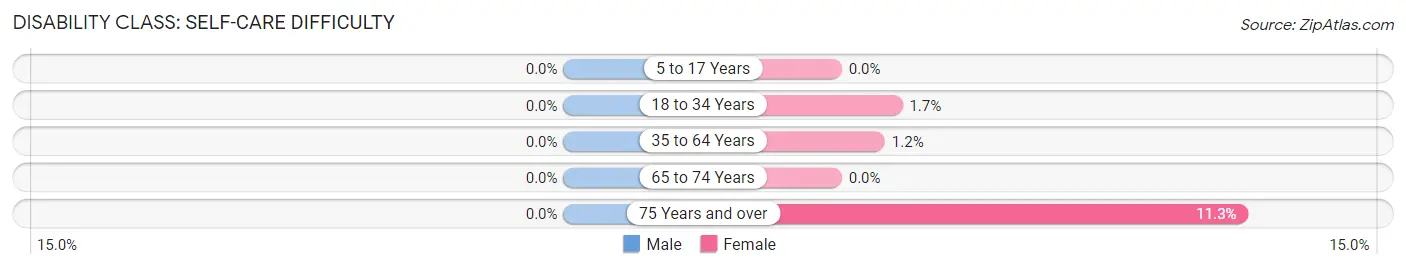
| Age Bracket | Male | Female |
| 5 to 17 Years | 0 (0.0%) | 0 (0.0%) |
| 18 to 34 Years | 0 (0.0%) | 6 (1.7%) |
| 35 to 64 Years | 0 (0.0%) | 7 (1.2%) |
| 65 to 74 Years | 0 (0.0%) | 0 (0.0%) |
| 75 Years and over | 0 (0.0%) | 12 (11.3%) |
Technology Access in Clinton
Computing Device Access in Clinton
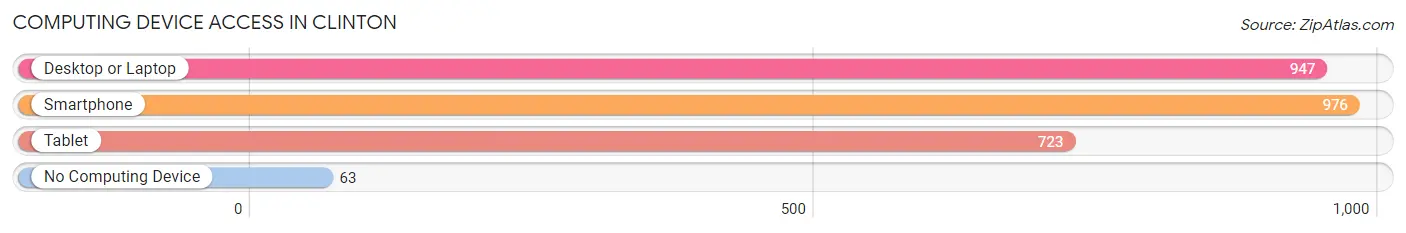
| Device Type | # Households | % Households |
| Desktop or Laptop | 947 | 86.8% |
| Smartphone | 976 | 89.5% |
| Tablet | 723 | 66.3% |
| No Computing Device | 63 | 5.8% |
| Total | 1,091 | 100.0% |
Internet Access in Clinton
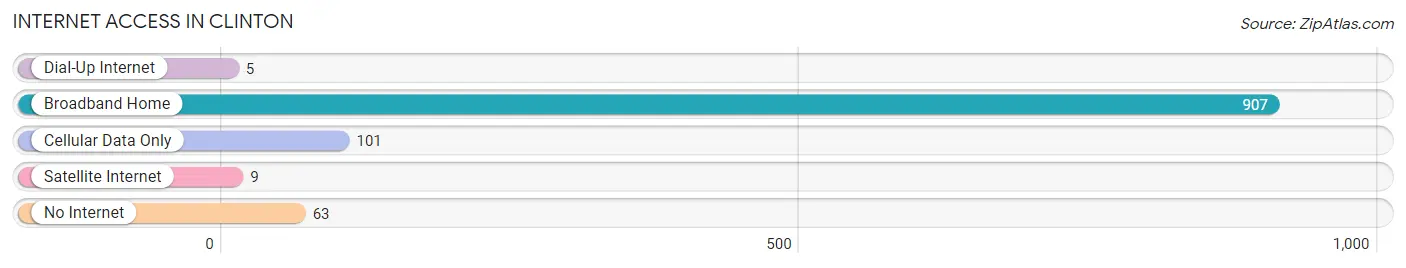
| Internet Type | # Households | % Households |
| Dial-Up Internet | 5 | 0.5% |
| Broadband Home | 907 | 83.1% |
| Cellular Data Only | 101 | 9.3% |
| Satellite Internet | 9 | 0.8% |
| No Internet | 63 | 5.8% |
| Total | 1,091 | 100.0% |
Clinton Summary
Clinton, NJ is a small town located in Hunterdon County, New Jersey. It is situated on the banks of the South Branch of the Raritan River, approximately 25 miles northwest of Trenton. The town was founded in 1822 and is named after the seventh Governor of New Jersey, DeWitt Clinton. As of the 2010 census, the population of Clinton was 2,731.
History
The area that is now Clinton was originally inhabited by the Lenape Native Americans. The first European settlers arrived in the area in the late 17th century. The town was officially founded in 1822 and was named after DeWitt Clinton, the seventh Governor of New Jersey.
In the 19th century, Clinton was a thriving agricultural community. The town was known for its production of apples, peaches, and other fruits. The town also had several mills, including a grist mill, a saw mill, and a paper mill.
In the early 20th century, Clinton began to experience a period of growth and development. The town was connected to the rest of the state by the Delaware, Lackawanna and Western Railroad. The town also had several factories, including a silk mill, a glove factory, and a paper mill.
Geography
Clinton is located in Hunterdon County, New Jersey. It is situated on the banks of the South Branch of the Raritan River, approximately 25 miles northwest of Trenton. The town has a total area of 2.2 square miles, all of which is land.
The town is located in the Raritan Valley, a region of rolling hills and valleys. The town is bordered by Lebanon Township to the north, Franklin Township to the east, Union Township to the south, and High Bridge to the west.
Economy
The economy of Clinton is largely based on agriculture and tourism. The town is home to several farms, which produce a variety of fruits and vegetables. The town also has several wineries and breweries, which attract tourists from all over the region.
The town also has several small businesses, including restaurants, shops, and other services. The town is also home to several manufacturing companies, including a paper mill and a glove factory.
Demographics
As of the 2010 census, the population of Clinton was 2,731. The racial makeup of the town was 94.3% White, 2.2% African American, 0.3% Native American, 1.2% Asian, 0.1% Pacific Islander, 0.9% from other races, and 1.0% from two or more races. Hispanic or Latino of any race were 4.2% of the population.
The median household income in Clinton was $76,250, and the median family income was $87,500. The per capita income for the town was $35,945. About 4.2% of families and 5.3% of the population were below the poverty line, including 6.2% of those under age 18 and 4.2% of those age 65 or over.
Common Questions
What is the Total Population of Clinton?
Total Population of Clinton is 2,775.
What is the Total Male Population of Clinton?
Total Male Population of Clinton is 1,385.
What is the Total Female Population of Clinton?
Total Female Population of Clinton is 1,390.
What is the Ratio of Males per 100 Females in Clinton?
There are 99.64 Males per 100 Females in Clinton.
What is the Ratio of Females per 100 Males in Clinton?
There are 100.36 Females per 100 Males in Clinton.
What is the Median Population Age in Clinton?
Median Population Age in Clinton is 40.0 Years.
What is the Average Family Size in Clinton
Average Family Size in Clinton is 3.0 People.
What is the Average Household Size in Clinton
Average Household Size in Clinton is 2.5 People.
What is Per Capita Income in Clinton?
Per Capita income in Clinton is $61,403.
What is the Median Family Income in Clinton?
Median Family Income in Clinton is $160,000.
What is the Median Household income in Clinton?
Median Household Income in Clinton is $137,688.
What is Income or Wage Gap in Clinton?
Income or Wage Gap in Clinton is 34.4%.
Women in Clinton earn 65.6 cents for every dollar earned by a man.
What is Inequality or Gini Index in Clinton?
Inequality or Gini Index in Clinton is 0.39.
How Large is the Labor Force in Clinton?
There are 1,630 People in the Labor Forcein in Clinton.
What is the Percentage of People in the Labor Force in Clinton?
72.2% of People are in the Labor Force in Clinton.
What is the Unemployment Rate in Clinton?
Unemployment Rate in Clinton is 3.6%.