Woodlynne borough, NJ
Woodlynne borough Overview
2,904
TOTAL POPULATION
1,495
MALE POPULATION
1,409
FEMALE POPULATION
106.10
MALES / 100 FEMALES
94.25
FEMALES / 100 MALES
32.7
MEDIAN AGE
3.8
AVG FAMILY SIZE
3.5
AVG HOUSEHOLD SIZE
$23,156
PER CAPITA INCOME
$64,750
AVG FAMILY INCOME
$68,125
AVG HOUSEHOLD INCOME
12.4%
WAGE / INCOME GAP [ % ]
87.6¢/ $1
WAGE / INCOME GAP [ $ ]
0.38
INEQUALITY / GINI INDEX
1,455
LABOR FORCE [ PEOPLE ]
69.6%
PERCENT IN LABOR FORCE
10.4%
UNEMPLOYMENT RATE
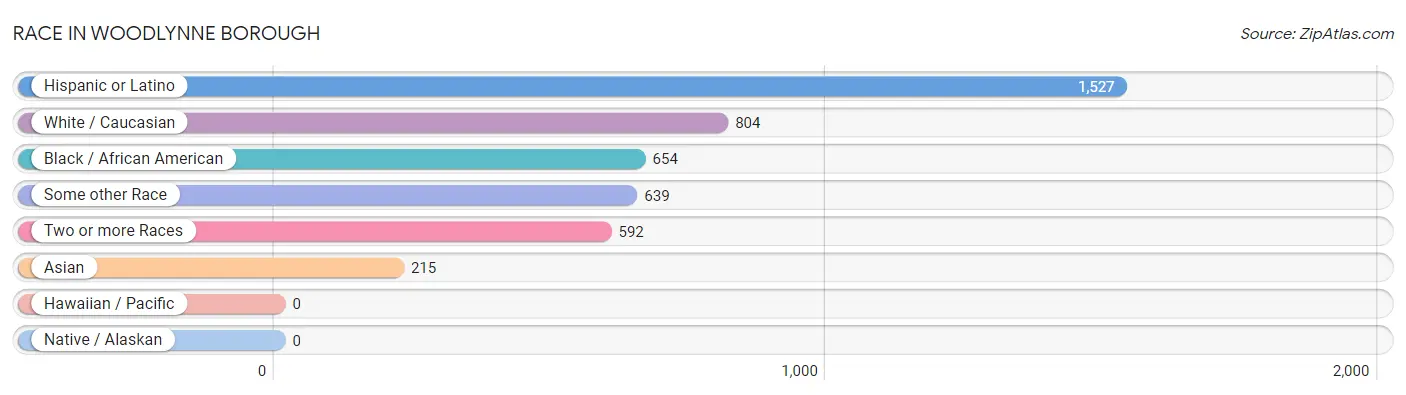
Race in Woodlynne borough
The most populous races in Woodlynne borough are Hispanic or Latino (1,527 | 52.6%), White / Caucasian (804 | 27.7%), and Black / African American (654 | 22.5%).
| Race | # Population | % Population |
| Asian | 215 | 7.4% |
| Black / African American | 654 | 22.5% |
| Hawaiian / Pacific | 0 | 0.0% |
| Hispanic or Latino | 1,527 | 52.6% |
| Native / Alaskan | 0 | 0.0% |
| White / Caucasian | 804 | 27.7% |
| Two or more Races | 592 | 20.4% |
| Some other Race | 639 | 22.0% |
| Total | 2,904 | 100.0% |
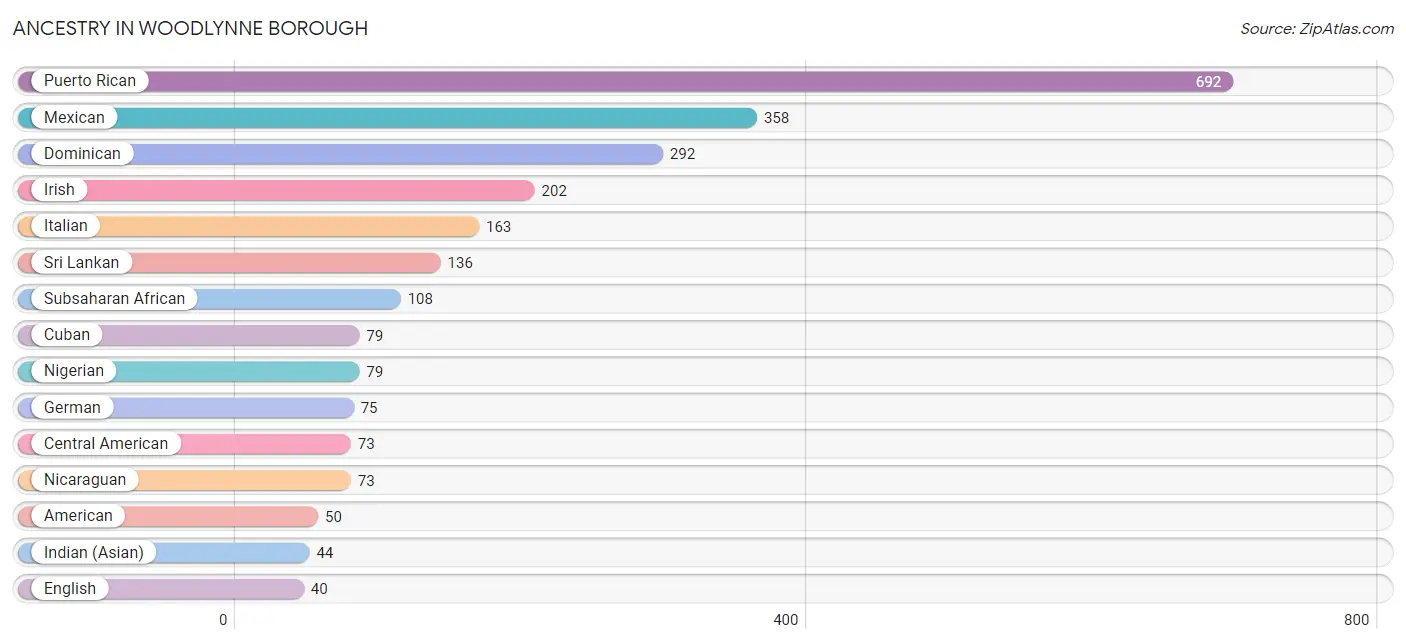
Ancestry in Woodlynne borough
The most populous ancestries reported in Woodlynne borough are Puerto Rican (692 | 23.8%), Mexican (358 | 12.3%), Dominican (292 | 10.1%), Irish (202 | 7.0%), and Italian (163 | 5.6%), together accounting for 58.8% of all Woodlynne borough residents.
| Ancestry | # Population | % Population |
| African | 22 | 0.8% |
| American | 50 | 1.7% |
| Arab | 16 | 0.5% |
| British | 6 | 0.2% |
| Central American | 73 | 2.5% |
| Cuban | 79 | 2.7% |
| Dominican | 292 | 10.1% |
| Dutch | 17 | 0.6% |
| Eastern European | 17 | 0.6% |
| English | 40 | 1.4% |
| Ethiopian | 7 | 0.2% |
| French | 4 | 0.1% |
| French Canadian | 1 | 0.0% |
| German | 75 | 2.6% |
| Greek | 8 | 0.3% |
| Indian (Asian) | 44 | 1.5% |
| Irish | 202 | 7.0% |
| Italian | 163 | 5.6% |
| Jamaican | 11 | 0.4% |
| Japanese | 35 | 1.2% |
| Lebanese | 16 | 0.5% |
| Malaysian | 35 | 1.2% |
| Mexican | 358 | 12.3% |
| Nicaraguan | 73 | 2.5% |
| Nigerian | 79 | 2.7% |
| Polish | 24 | 0.8% |
| Puerto Rican | 692 | 23.8% |
| Scandinavian | 13 | 0.4% |
| Scotch-Irish | 9 | 0.3% |
| Scottish | 40 | 1.4% |
| Sri Lankan | 136 | 4.7% |
| Subsaharan African | 108 | 3.7% |
| Thai | 7 | 0.2% |
| Welsh | 11 | 0.4% | View All 34 Rows |
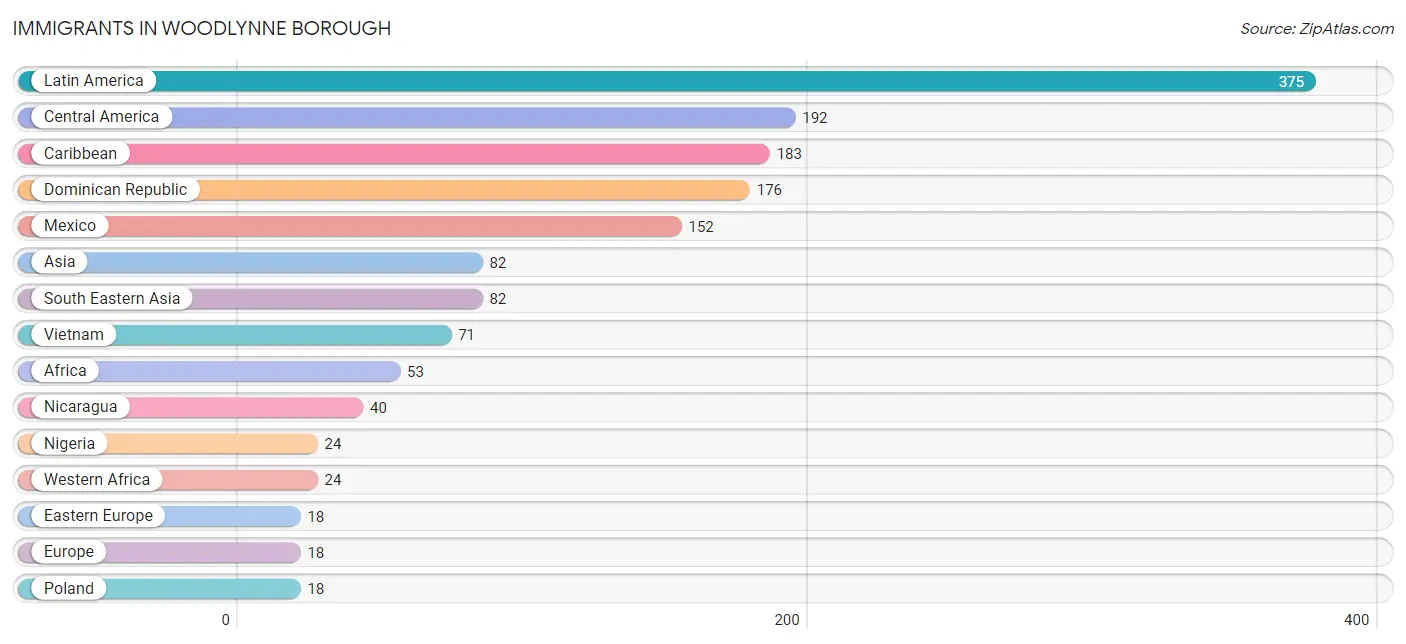
Immigrants in Woodlynne borough
The most numerous immigrant groups reported in Woodlynne borough came from Latin America (375 | 12.9%), Central America (192 | 6.6%), Caribbean (183 | 6.3%), Dominican Republic (176 | 6.1%), and Mexico (152 | 5.2%), together accounting for 37.1% of all Woodlynne borough residents.
| Immigration Origin | # Population | % Population |
| Africa | 53 | 1.8% |
| Asia | 82 | 2.8% |
| Canada | 4 | 0.1% |
| Caribbean | 183 | 6.3% |
| Central America | 192 | 6.6% |
| Dominican Republic | 176 | 6.1% |
| Eastern Africa | 17 | 0.6% |
| Eastern Europe | 18 | 0.6% |
| Egypt | 12 | 0.4% |
| Eritrea | 10 | 0.3% |
| Ethiopia | 7 | 0.2% |
| Europe | 18 | 0.6% |
| Latin America | 375 | 12.9% |
| Mexico | 152 | 5.2% |
| Nicaragua | 40 | 1.4% |
| Nigeria | 24 | 0.8% |
| Northern Africa | 12 | 0.4% |
| Poland | 18 | 0.6% |
| South Eastern Asia | 82 | 2.8% |
| Thailand | 11 | 0.4% |
| Trinidad and Tobago | 7 | 0.2% |
| Vietnam | 71 | 2.4% |
| Western Africa | 24 | 0.8% | View All 23 Rows |
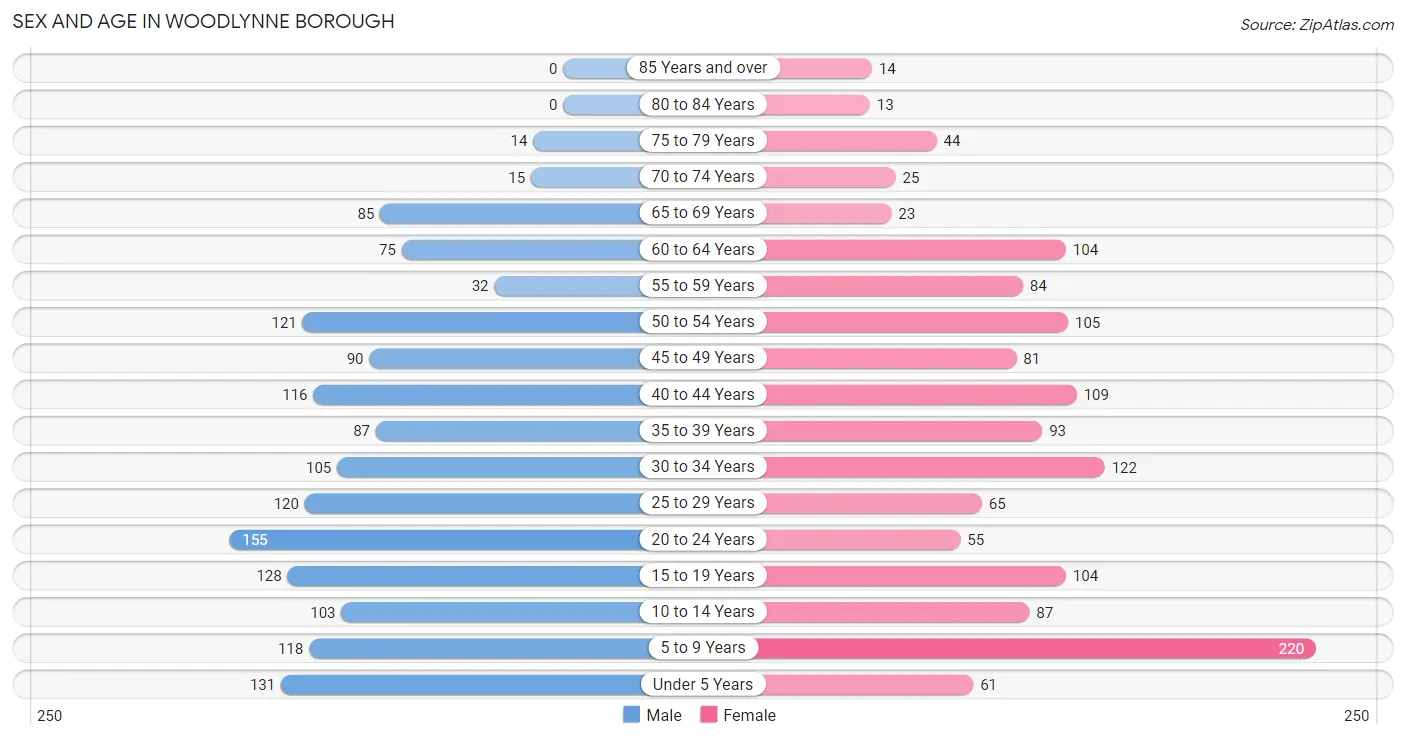
Sex and Age in Woodlynne borough
Sex and Age in Woodlynne borough
The most populous age groups in Woodlynne borough are 20 to 24 Years (155 | 10.4%) for men and 5 to 9 Years (220 | 15.6%) for women.
| Age Bracket | Male | Female |
| Under 5 Years | 131 (8.8%) | 61 (4.3%) |
| 5 to 9 Years | 118 (7.9%) | 220 (15.6%) |
| 10 to 14 Years | 103 (6.9%) | 87 (6.2%) |
| 15 to 19 Years | 128 (8.6%) | 104 (7.4%) |
| 20 to 24 Years | 155 (10.4%) | 55 (3.9%) |
| 25 to 29 Years | 120 (8.0%) | 65 (4.6%) |
| 30 to 34 Years | 105 (7.0%) | 122 (8.7%) |
| 35 to 39 Years | 87 (5.8%) | 93 (6.6%) |
| 40 to 44 Years | 116 (7.8%) | 109 (7.7%) |
| 45 to 49 Years | 90 (6.0%) | 81 (5.8%) |
| 50 to 54 Years | 121 (8.1%) | 105 (7.4%) |
| 55 to 59 Years | 32 (2.1%) | 84 (6.0%) |
| 60 to 64 Years | 75 (5.0%) | 104 (7.4%) |
| 65 to 69 Years | 85 (5.7%) | 23 (1.6%) |
| 70 to 74 Years | 15 (1.0%) | 25 (1.8%) |
| 75 to 79 Years | 14 (0.9%) | 44 (3.1%) |
| 80 to 84 Years | 0 (0.0%) | 13 (0.9%) |
| 85 Years and over | 0 (0.0%) | 14 (1.0%) |
| Total | 1,495 (100.0%) | 1,409 (100.0%) |
Families and Households in Woodlynne borough
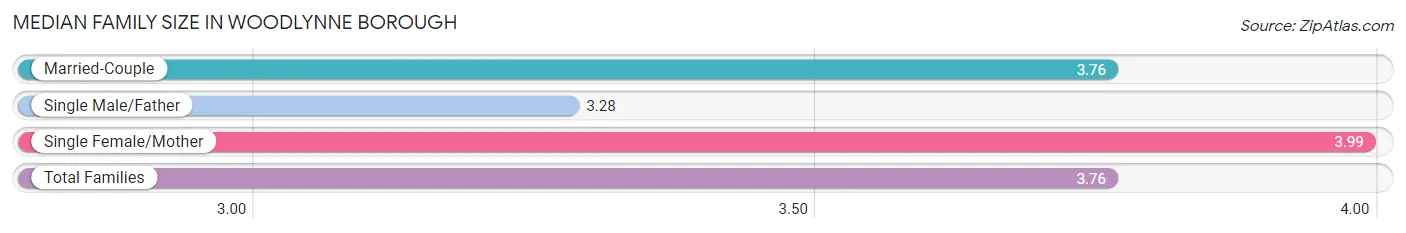
Median Family Size in Woodlynne borough
The median family size in Woodlynne borough is 3.76 persons per family, with single female/mother families (310 | 46.7%) accounting for the largest median family size of 3.99 persons per family. On the other hand, single male/father families (148 | 22.3%) represent the smallest median family size with 3.28 persons per family.
| Family Type | # Families | Family Size |
| Married-Couple | 206 (31.0%) | 3.76 |
| Single Male/Father | 148 (22.3%) | 3.28 |
| Single Female/Mother | 310 (46.7%) | 3.99 |
| Total Families | 664 (100.0%) | 3.76 |
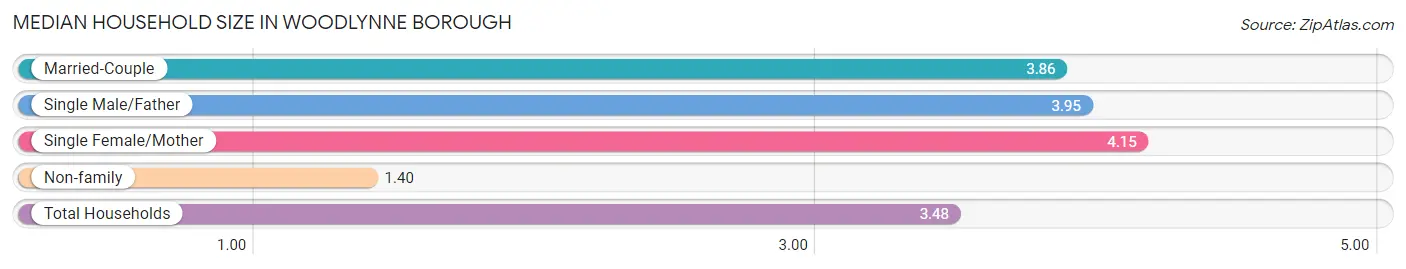
Median Household Size in Woodlynne borough
The median household size in Woodlynne borough is 3.48 persons per household, with single female/mother households (310 | 37.2%) accounting for the largest median household size of 4.15 persons per household. non-family households (170 | 20.4%) represent the smallest median household size with 1.40 persons per household.
| Household Type | # Households | Household Size |
| Married-Couple | 206 (24.7%) | 3.86 |
| Single Male/Father | 148 (17.7%) | 3.95 |
| Single Female/Mother | 310 (37.2%) | 4.15 |
| Non-family | 170 (20.4%) | 1.40 |
| Total Households | 834 (100.0%) | 3.48 |
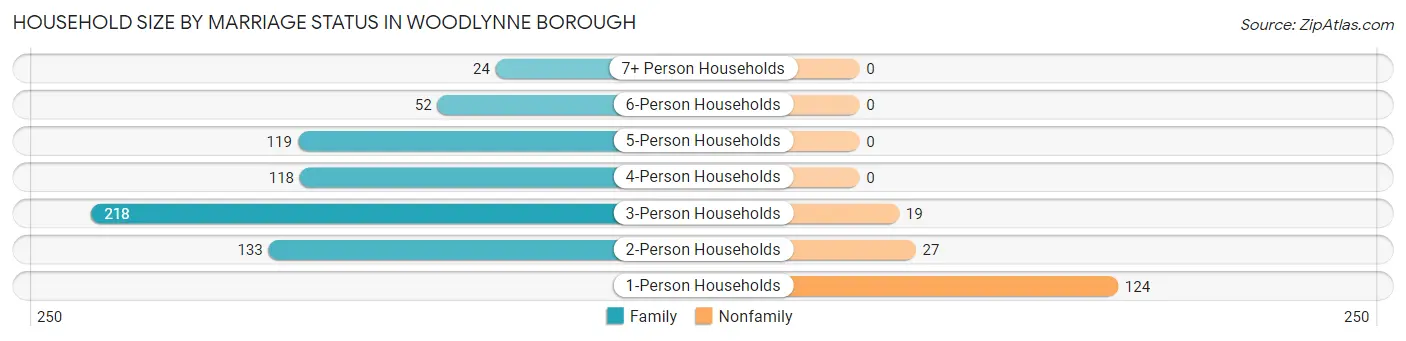
Household Size by Marriage Status in Woodlynne borough
Out of a total of 834 households in Woodlynne borough, 664 (79.6%) are family households, while 170 (20.4%) are nonfamily households. The most numerous type of family households are 3-person households, comprising 218, and the most common type of nonfamily households are 1-person households, comprising 124.
| Household Size | Family Households | Nonfamily Households |
| 1-Person Households | - | 124 (14.9%) |
| 2-Person Households | 133 (16.0%) | 27 (3.2%) |
| 3-Person Households | 218 (26.1%) | 19 (2.3%) |
| 4-Person Households | 118 (14.1%) | 0 (0.0%) |
| 5-Person Households | 119 (14.3%) | 0 (0.0%) |
| 6-Person Households | 52 (6.2%) | 0 (0.0%) |
| 7+ Person Households | 24 (2.9%) | 0 (0.0%) |
| Total | 664 (79.6%) | 170 (20.4%) |
Female Fertility in Woodlynne borough
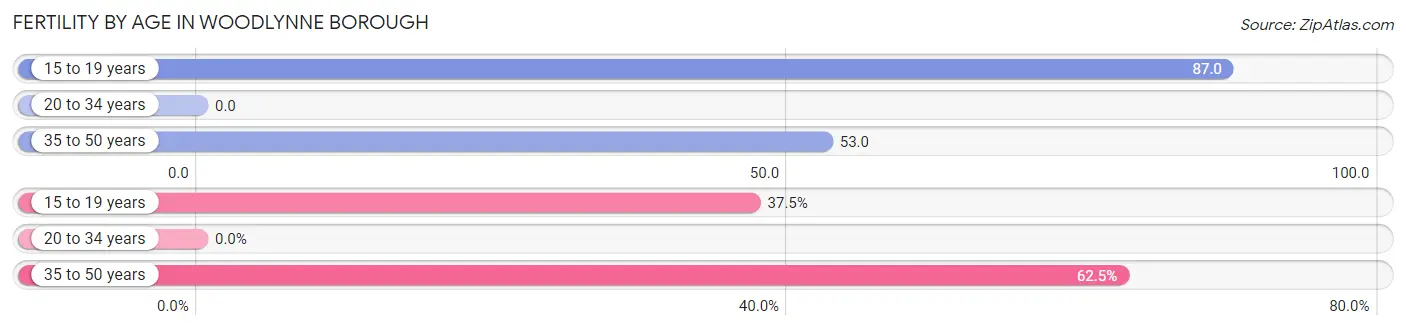
Fertility by Age in Woodlynne borough
Average fertility rate in Woodlynne borough is 38.0 births per 1,000 women. Women in the age bracket of 15 to 19 years have the highest fertility rate with 87.0 births per 1,000 women. Women in the age bracket of 35 to 50 years acount for 62.5% of all women with births.
| Age Bracket | Women with Births | Births / 1,000 Women |
| 15 to 19 years | 9 (37.5%) | 87.0 |
| 20 to 34 years | 0 (0.0%) | 0.0 |
| 35 to 50 years | 15 (62.5%) | 53.0 |
| Total | 24 (100.0%) | 38.0 |
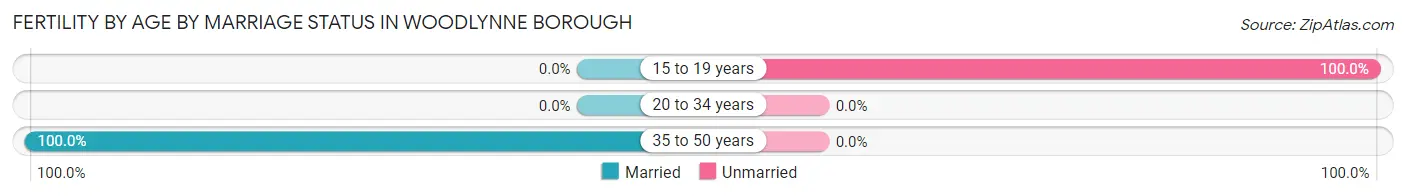
Fertility by Age by Marriage Status in Woodlynne borough
62.5% of women with births (24) in Woodlynne borough are married. The highest percentage of unmarried women with births falls into 15 to 19 years age bracket with 100.0% of them unmarried at the time of birth, while the lowest percentage of unmarried women with births belong to 35 to 50 years age bracket with 0.0% of them unmarried.
| Age Bracket | Married | Unmarried |
| 15 to 19 years | 0 (0.0%) | 9 (100.0%) |
| 20 to 34 years | 0 (0.0%) | 0 (0.0%) |
| 35 to 50 years | 15 (100.0%) | 0 (0.0%) |
| Total | 15 (62.5%) | 9 (37.5%) |
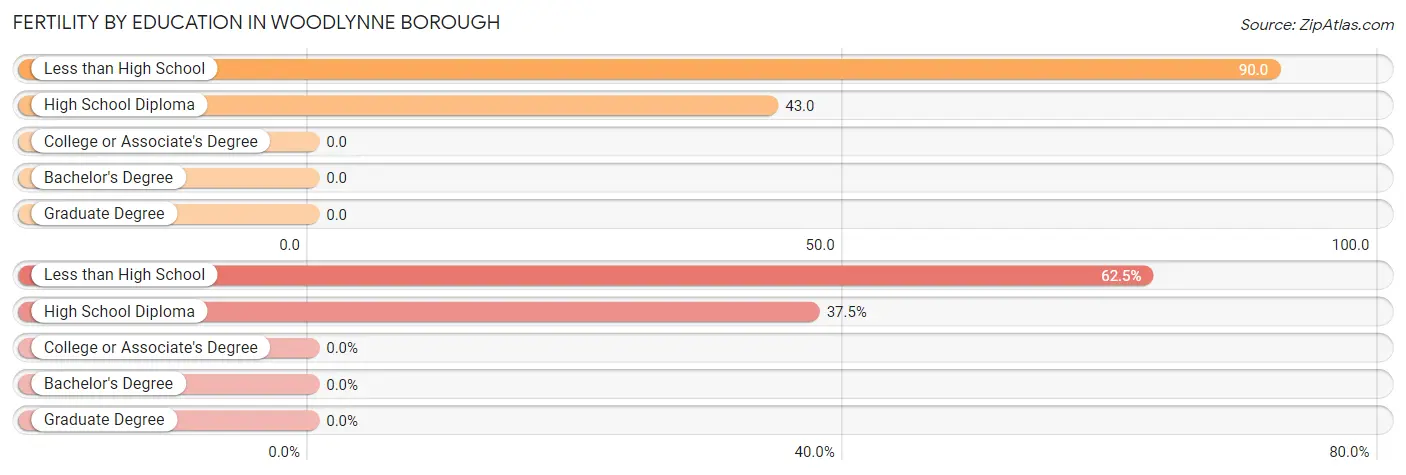
Fertility by Education in Woodlynne borough
| Educational Attainment | Women with Births | Births / 1,000 Women |
| Less than High School | 15 (62.5%) | 90.0 |
| High School Diploma | 9 (37.5%) | 43.0 |
| College or Associate's Degree | 0 (0.0%) | 0.0 |
| Bachelor's Degree | 0 (0.0%) | 0.0 |
| Graduate Degree | 0 (0.0%) | 0.0 |
| Total | 24 (100.0%) | 38.0 |
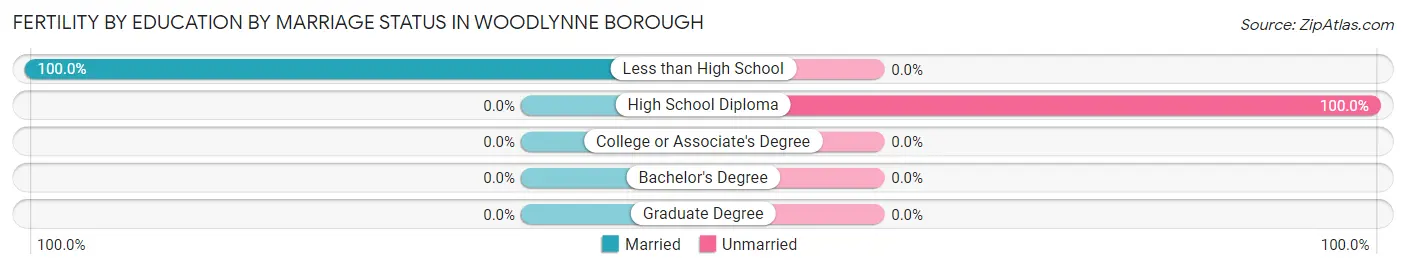
Fertility by Education by Marriage Status in Woodlynne borough
37.5% of women with births in Woodlynne borough are unmarried. Women with the educational attainment of less than high school are most likely to be married with 100.0% of them married at childbirth, while women with the educational attainment of high school diploma are least likely to be married with 100.0% of them unmarried at childbirth.
| Educational Attainment | Married | Unmarried |
| Less than High School | 15 (100.0%) | 0 (0.0%) |
| High School Diploma | 0 (0.0%) | 9 (100.0%) |
| College or Associate's Degree | 0 (0.0%) | 0 (0.0%) |
| Bachelor's Degree | 0 (0.0%) | 0 (0.0%) |
| Graduate Degree | 0 (0.0%) | 0 (0.0%) |
| Total | 15 (62.5%) | 9 (37.5%) |
Income in Woodlynne borough
Income Overview in Woodlynne borough
Per Capita Income in Woodlynne borough is $23,156, while median incomes of families and households are $64,750 and $68,125 respectively.
| Characteristic | Number | Measure |
| Per Capita Income | 2,904 | $23,156 |
| Median Family Income | 664 | $64,750 |
| Mean Family Income | 664 | $75,659 |
| Median Household Income | 834 | $68,125 |
| Mean Household Income | 834 | $77,154 |
| Income Deficit | 664 | $0 |
| Wage / Income Gap (%) | 2,904 | 12.40% |
| Wage / Income Gap ($) | 2,904 | 87.60¢ per $1 |
| Gini / Inequality Index | 2,904 | 0.38 |
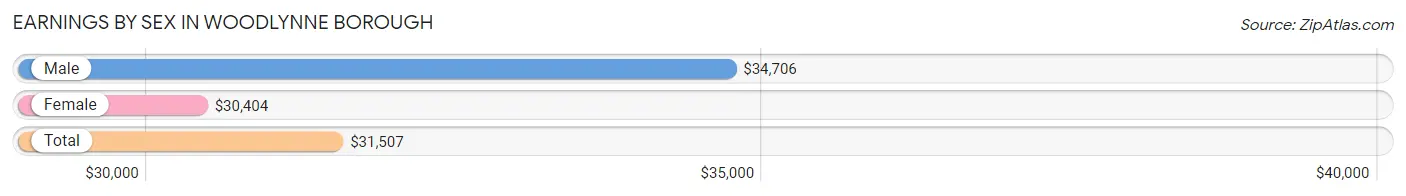
Earnings by Sex in Woodlynne borough
Average Earnings in Woodlynne borough are $31,507, $34,706 for men and $30,404 for women, a difference of 12.4%.
| Sex | Number | Average Earnings |
| Male | 836 (58.7%) | $34,706 |
| Female | 589 (41.3%) | $30,404 |
| Total | 1,425 (100.0%) | $31,507 |
Earnings by Sex by Income Bracket in Woodlynne borough
The most common earnings brackets in Woodlynne borough are $75,000 to $99,999 for men (129 | 15.4%) and $55,000 to $64,999 for women (107 | 18.2%).
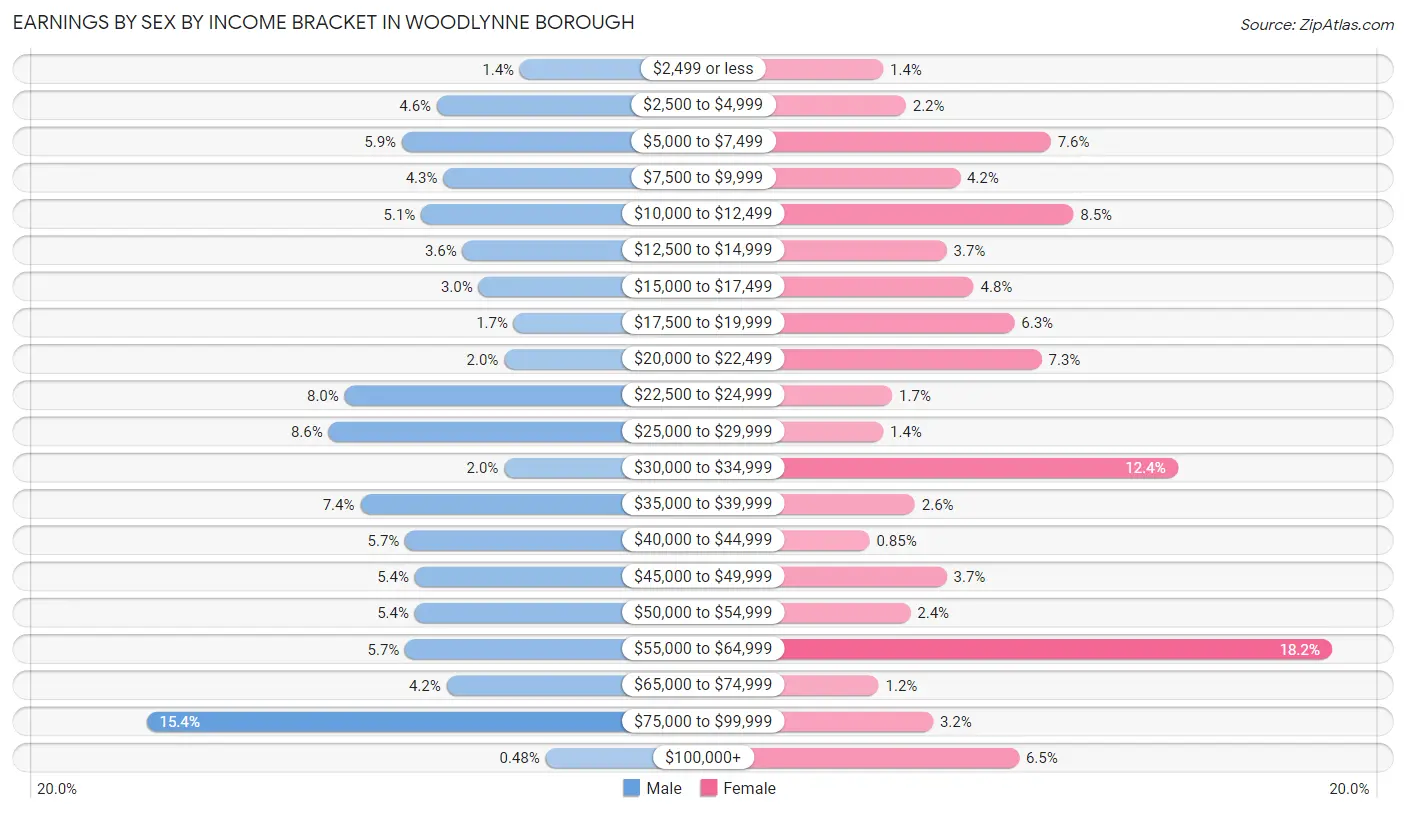
| Income | Male | Female |
| $2,499 or less | 12 (1.4%) | 8 (1.4%) |
| $2,500 to $4,999 | 38 (4.5%) | 13 (2.2%) |
| $5,000 to $7,499 | 49 (5.9%) | 45 (7.6%) |
| $7,500 to $9,999 | 36 (4.3%) | 25 (4.2%) |
| $10,000 to $12,499 | 43 (5.1%) | 50 (8.5%) |
| $12,500 to $14,999 | 30 (3.6%) | 22 (3.7%) |
| $15,000 to $17,499 | 25 (3.0%) | 28 (4.8%) |
| $17,500 to $19,999 | 14 (1.7%) | 37 (6.3%) |
| $20,000 to $22,499 | 17 (2.0%) | 43 (7.3%) |
| $22,500 to $24,999 | 67 (8.0%) | 10 (1.7%) |
| $25,000 to $29,999 | 72 (8.6%) | 8 (1.4%) |
| $30,000 to $34,999 | 17 (2.0%) | 73 (12.4%) |
| $35,000 to $39,999 | 62 (7.4%) | 15 (2.5%) |
| $40,000 to $44,999 | 48 (5.7%) | 5 (0.9%) |
| $45,000 to $49,999 | 45 (5.4%) | 22 (3.7%) |
| $50,000 to $54,999 | 45 (5.4%) | 14 (2.4%) |
| $55,000 to $64,999 | 48 (5.7%) | 107 (18.2%) |
| $65,000 to $74,999 | 35 (4.2%) | 7 (1.2%) |
| $75,000 to $99,999 | 129 (15.4%) | 19 (3.2%) |
| $100,000+ | 4 (0.5%) | 38 (6.5%) |
| Total | 836 (100.0%) | 589 (100.0%) |
Earnings by Sex by Educational Attainment in Woodlynne borough
Average earnings in Woodlynne borough are $39,844 for men and $32,426 for women, a difference of 18.6%. Men with an educational attainment of bachelor's degree enjoy the highest average annual earnings of $57,321, while those with high school diploma education earn the least with $28,125. Women with an educational attainment of graduate degree earn the most with the average annual earnings of $112,917, while those with high school diploma education have the smallest earnings of $31,360.
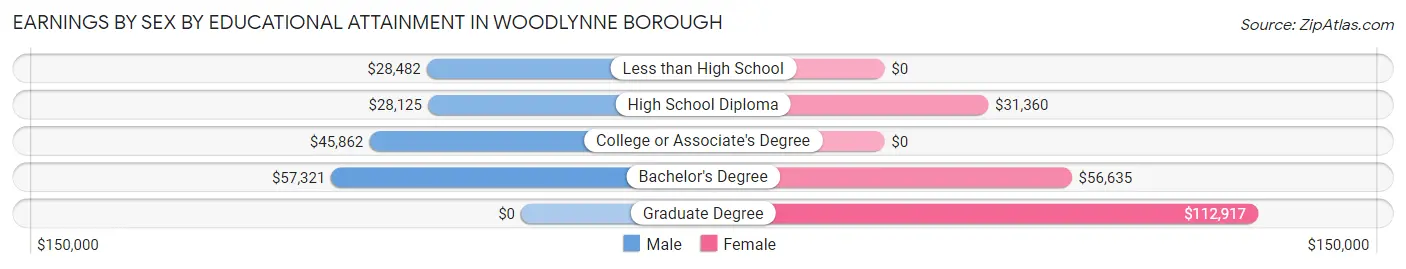
| Educational Attainment | Male Income | Female Income |
| Less than High School | $28,482 | $0 |
| High School Diploma | $28,125 | $31,360 |
| College or Associate's Degree | $45,862 | $0 |
| Bachelor's Degree | $57,321 | $56,635 |
| Graduate Degree | - | - |
| Total | $39,844 | $32,426 |
Family Income in Woodlynne borough
Family Income Brackets in Woodlynne borough
According to the Woodlynne borough family income data, there are 172 families falling into the $50,000 to $74,999 income range, which is the most common income bracket and makes up 25.9% of all families.
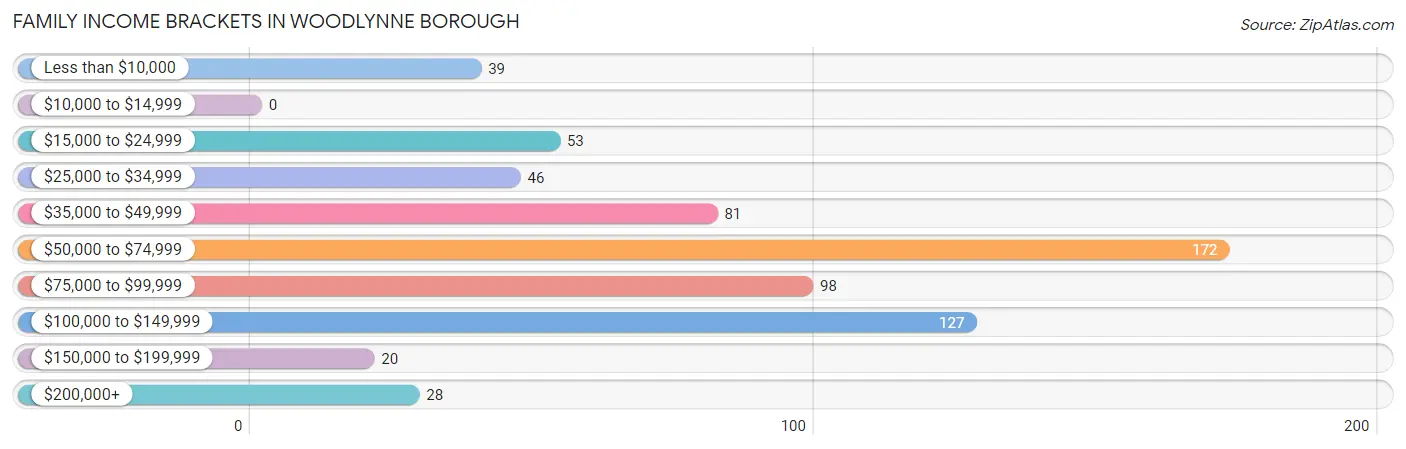
| Income Bracket | # Families | % Families |
| Less than $10,000 | 39 | 5.9% |
| $10,000 to $14,999 | 0 | 0.0% |
| $15,000 to $24,999 | 53 | 8.0% |
| $25,000 to $34,999 | 46 | 6.9% |
| $35,000 to $49,999 | 81 | 12.2% |
| $50,000 to $74,999 | 172 | 25.9% |
| $75,000 to $99,999 | 98 | 14.8% |
| $100,000 to $149,999 | 127 | 19.1% |
| $150,000 to $199,999 | 20 | 3.0% |
| $200,000+ | 28 | 4.2% |
Family Income by Famaliy Size in Woodlynne borough
6-person families (65 | 9.8%) account for the highest median family income in Woodlynne borough with $118,977 per family, while 2-person families (153 | 23.0%) have the highest median income of $28,807 per family member.
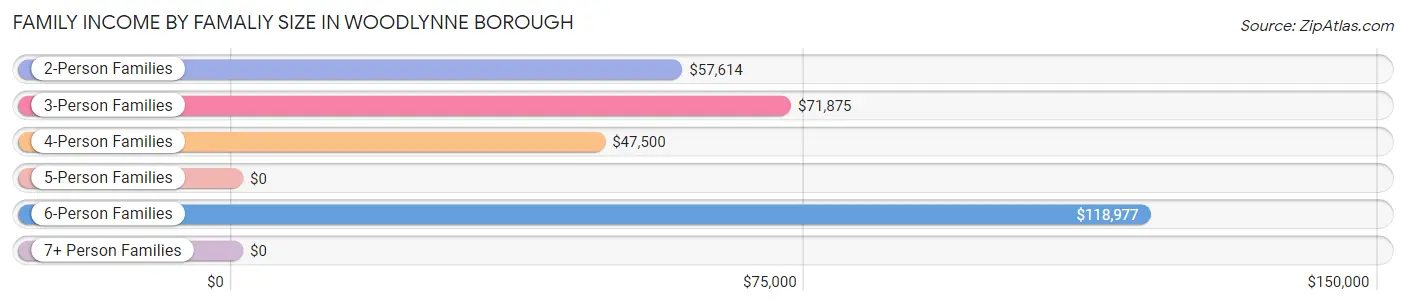
| Income Bracket | # Families | Median Income |
| 2-Person Families | 153 (23.0%) | $57,614 |
| 3-Person Families | 258 (38.9%) | $71,875 |
| 4-Person Families | 118 (17.8%) | $47,500 |
| 5-Person Families | 61 (9.2%) | $0 |
| 6-Person Families | 65 (9.8%) | $118,977 |
| 7+ Person Families | 9 (1.4%) | $0 |
| Total | 664 (100.0%) | $64,750 |
Family Income by Number of Earners in Woodlynne borough
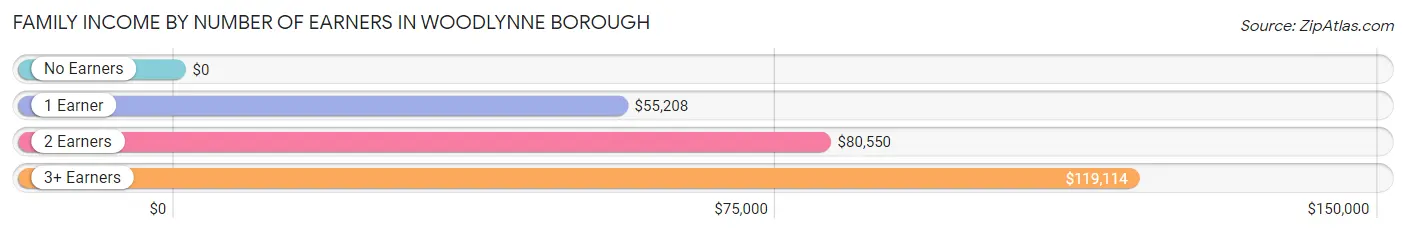
| Number of Earners | # Families | Median Income |
| No Earners | 71 (10.7%) | $0 |
| 1 Earner | 263 (39.6%) | $55,208 |
| 2 Earners | 139 (20.9%) | $80,550 |
| 3+ Earners | 191 (28.8%) | $119,114 |
| Total | 664 (100.0%) | $64,750 |
Household Income in Woodlynne borough
Household Income Brackets in Woodlynne borough
With 179 households falling in the category, the $50,000 to $74,999 income range is the most frequent in Woodlynne borough, accounting for 21.5% of all households.
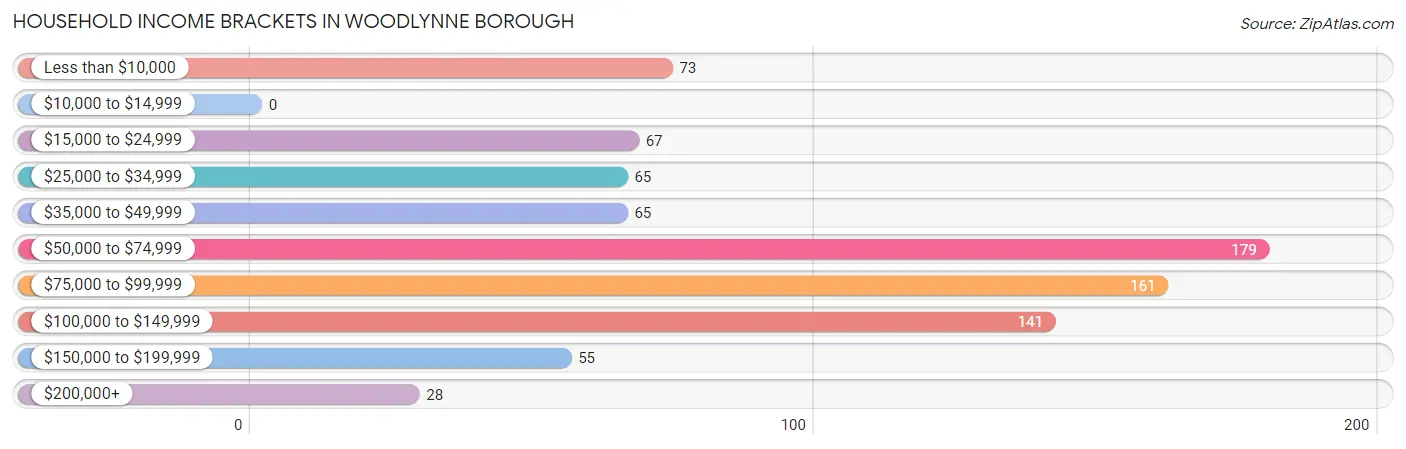
| Income Bracket | # Households | % Households |
| Less than $10,000 | 73 | 8.8% |
| $10,000 to $14,999 | 0 | 0.0% |
| $15,000 to $24,999 | 67 | 8.0% |
| $25,000 to $34,999 | 65 | 7.8% |
| $35,000 to $49,999 | 65 | 7.8% |
| $50,000 to $74,999 | 179 | 21.5% |
| $75,000 to $99,999 | 161 | 19.3% |
| $100,000 to $149,999 | 141 | 16.9% |
| $150,000 to $199,999 | 55 | 6.6% |
| $200,000+ | 28 | 3.4% |
Household Income by Householder Age in Woodlynne borough
The median household income in Woodlynne borough is $68,125, with the highest median household income of $77,143 found in the 65+ years age bracket for the primary householder. A total of 110 households (13.2%) fall into this category.
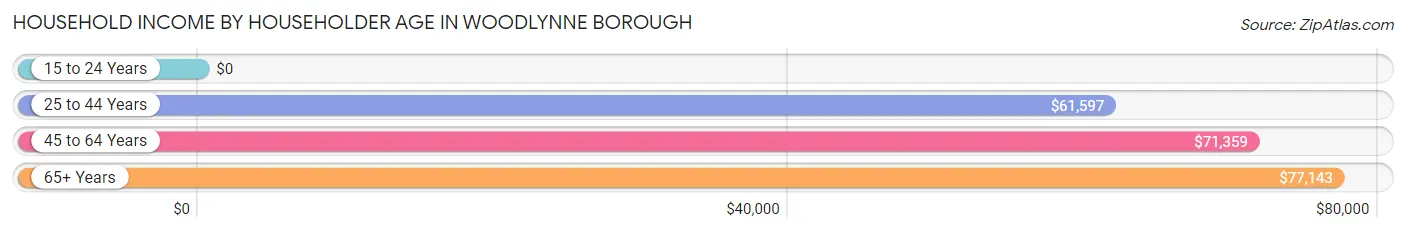
| Income Bracket | # Households | Median Income |
| 15 to 24 Years | 0 (0.0%) | $0 |
| 25 to 44 Years | 285 (34.2%) | $61,597 |
| 45 to 64 Years | 439 (52.6%) | $71,359 |
| 65+ Years | 110 (13.2%) | $77,143 |
| Total | 834 (100.0%) | $68,125 |
Poverty in Woodlynne borough
Income Below Poverty by Sex and Age in Woodlynne borough
With 17.6% poverty level for males and 19.4% for females among the residents of Woodlynne borough, 75 year old and over males and under 5 year old females are the most vulnerable to poverty, with 14 males (100.0%) and 38 females (62.3%) in their respective age groups living below the poverty level.
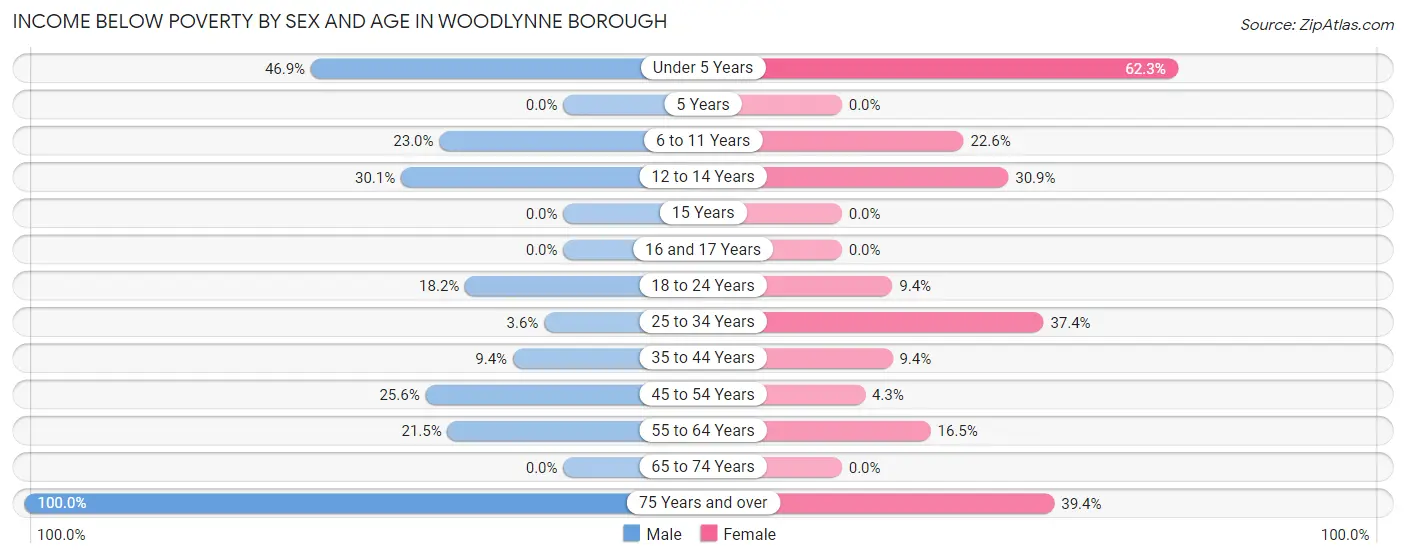
| Age Bracket | Male | Female |
| Under 5 Years | 52 (46.9%) | 38 (62.3%) |
| 5 Years | 0 (0.0%) | 0 (0.0%) |
| 6 to 11 Years | 29 (23.0%) | 54 (22.6%) |
| 12 to 14 Years | 25 (30.1%) | 17 (30.9%) |
| 15 Years | 0 (0.0%) | 0 (0.0%) |
| 16 and 17 Years | 0 (0.0%) | 0 (0.0%) |
| 18 to 24 Years | 35 (18.2%) | 6 (9.4%) |
| 25 to 34 Years | 8 (3.6%) | 70 (37.4%) |
| 35 to 44 Years | 19 (9.4%) | 19 (9.4%) |
| 45 to 54 Years | 54 (25.6%) | 8 (4.3%) |
| 55 to 64 Years | 23 (21.5%) | 31 (16.5%) |
| 65 to 74 Years | 0 (0.0%) | 0 (0.0%) |
| 75 Years and over | 14 (100.0%) | 28 (39.4%) |
| Total | 259 (17.6%) | 271 (19.4%) |
Income Above Poverty by Sex and Age in Woodlynne borough
According to the poverty statistics in Woodlynne borough, males aged 5 years and females aged 15 years are the age groups that are most secure financially, with 100.0% of males and 100.0% of females in these age groups living above the poverty line.
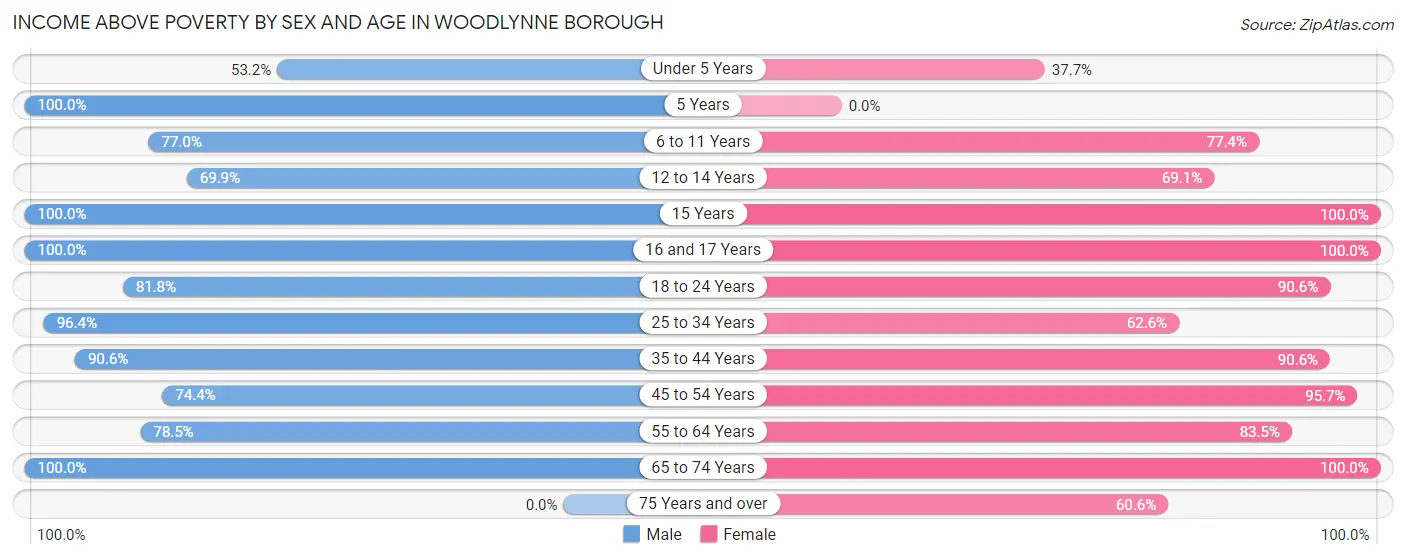
| Age Bracket | Male | Female |
| Under 5 Years | 59 (53.1%) | 23 (37.7%) |
| 5 Years | 10 (100.0%) | 0 (0.0%) |
| 6 to 11 Years | 97 (77.0%) | 185 (77.4%) |
| 12 to 14 Years | 58 (69.9%) | 38 (69.1%) |
| 15 Years | 60 (100.0%) | 34 (100.0%) |
| 16 and 17 Years | 31 (100.0%) | 61 (100.0%) |
| 18 to 24 Years | 157 (81.8%) | 58 (90.6%) |
| 25 to 34 Years | 217 (96.4%) | 117 (62.6%) |
| 35 to 44 Years | 184 (90.6%) | 183 (90.6%) |
| 45 to 54 Years | 157 (74.4%) | 178 (95.7%) |
| 55 to 64 Years | 84 (78.5%) | 157 (83.5%) |
| 65 to 74 Years | 100 (100.0%) | 48 (100.0%) |
| 75 Years and over | 0 (0.0%) | 43 (60.6%) |
| Total | 1,214 (82.4%) | 1,125 (80.6%) |
Income Below Poverty Among Married-Couple Families in Woodlynne borough
The poverty statistics for married-couple families in Woodlynne borough show that 9.2% or 19 of the total 206 families live below the poverty line. Families with 3 or 4 children have the highest poverty rate of 44.0%, comprising of 11 families. On the other hand, families with 1 or 2 children have the lowest poverty rate of 0.0%, which includes 0 families.
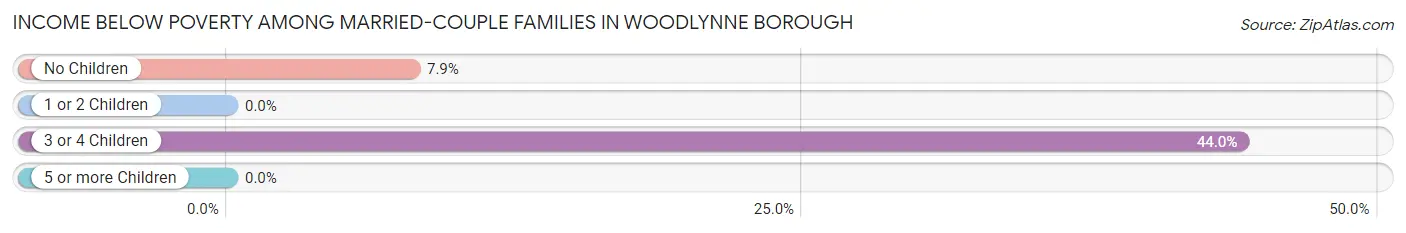
| Children | Above Poverty | Below Poverty |
| No Children | 93 (92.1%) | 8 (7.9%) |
| 1 or 2 Children | 80 (100.0%) | 0 (0.0%) |
| 3 or 4 Children | 14 (56.0%) | 11 (44.0%) |
| 5 or more Children | 0 (0.0%) | 0 (0.0%) |
| Total | 187 (90.8%) | 19 (9.2%) |
Income Below Poverty Among Single-Parent Households in Woodlynne borough
According to the poverty data in Woodlynne borough, 14.9% or 22 single-father households and 21.9% or 68 single-mother households are living below the poverty line. Among single-father households, those with 3 or 4 children have the highest poverty rate, with 11 households (100.0%) experiencing poverty. Likewise, among single-mother households, those with 1 or 2 children have the highest poverty rate, with 49 households (67.1%) falling below the poverty line.
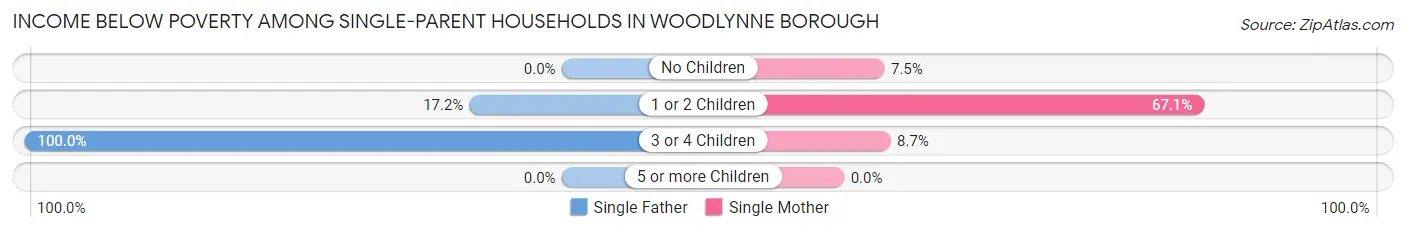
| Children | Single Father | Single Mother |
| No Children | 0 (0.0%) | 10 (7.5%) |
| 1 or 2 Children | 11 (17.2%) | 49 (67.1%) |
| 3 or 4 Children | 11 (100.0%) | 9 (8.6%) |
| 5 or more Children | 0 (0.0%) | 0 (0.0%) |
| Total | 22 (14.9%) | 68 (21.9%) |
Income Below Poverty Among Married-Couple vs Single-Parent Households in Woodlynne borough
The poverty data for Woodlynne borough shows that 19 of the married-couple family households (9.2%) and 90 of the single-parent households (19.7%) are living below the poverty level. Within the married-couple family households, those with 3 or 4 children have the highest poverty rate, with 11 households (44.0%) falling below the poverty line. Among the single-parent households, those with 1 or 2 children have the highest poverty rate, with 60 household (43.8%) living below poverty.
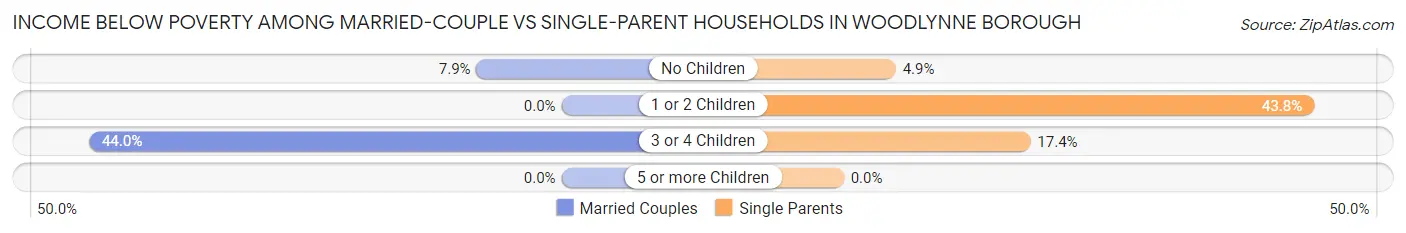
| Children | Married-Couple Families | Single-Parent Households |
| No Children | 8 (7.9%) | 10 (4.9%) |
| 1 or 2 Children | 0 (0.0%) | 60 (43.8%) |
| 3 or 4 Children | 11 (44.0%) | 20 (17.4%) |
| 5 or more Children | 0 (0.0%) | 0 (0.0%) |
| Total | 19 (9.2%) | 90 (19.7%) |
Employment Characteristics in Woodlynne borough
Employment by Class of Employer in Woodlynne borough
Among the 1,295 employed individuals in Woodlynne borough, private company employees (1,062 | 82.0%), not-for-profit organizations (89 | 6.9%), and self-employed (not incorporated) (53 | 4.1%) make up the most common classes of employment.
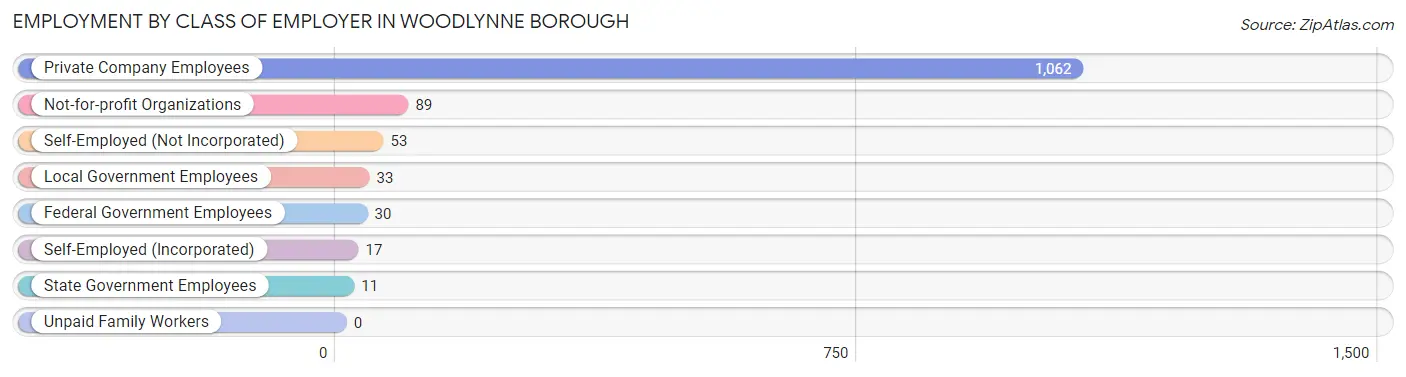
| Employer Class | # Employees | % Employees |
| Private Company Employees | 1,062 | 82.0% |
| Self-Employed (Incorporated) | 17 | 1.3% |
| Self-Employed (Not Incorporated) | 53 | 4.1% |
| Not-for-profit Organizations | 89 | 6.9% |
| Local Government Employees | 33 | 2.5% |
| State Government Employees | 11 | 0.9% |
| Federal Government Employees | 30 | 2.3% |
| Unpaid Family Workers | 0 | 0.0% |
| Total | 1,295 | 100.0% |
Employment Status by Age in Woodlynne borough
According to the labor force statistics for Woodlynne borough, out of the total population over 16 years of age (2,090), 69.6% or 1,455 individuals are in the labor force, with 10.4% or 151 of them unemployed. The age group with the highest labor force participation rate is 30 to 34 years, with 95.2% or 216 individuals in the labor force. Within the labor force, the 60 to 64 years age range has the highest percentage of unemployed individuals, with 36.3% or 29 of them being unemployed.
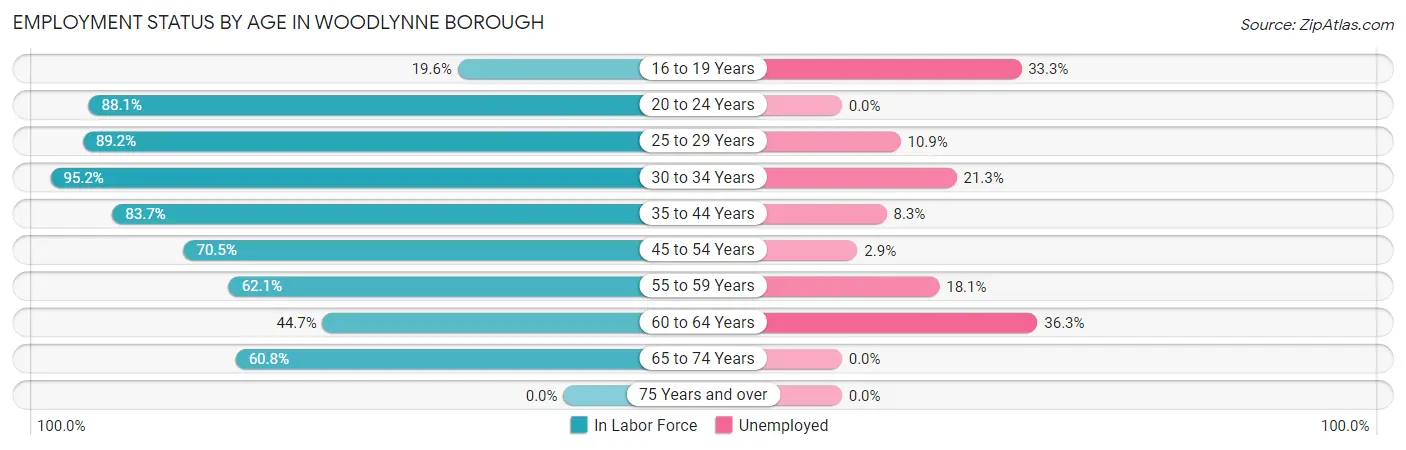
| Age Bracket | In Labor Force | Unemployed |
| 16 to 19 Years | 27 (19.6%) | 9 (33.3%) |
| 20 to 24 Years | 185 (88.1%) | 0 (0.0%) |
| 25 to 29 Years | 165 (89.2%) | 18 (10.9%) |
| 30 to 34 Years | 216 (95.2%) | 46 (21.3%) |
| 35 to 44 Years | 339 (83.7%) | 28 (8.3%) |
| 45 to 54 Years | 280 (70.5%) | 8 (2.9%) |
| 55 to 59 Years | 72 (62.1%) | 13 (18.1%) |
| 60 to 64 Years | 80 (44.7%) | 29 (36.3%) |
| 65 to 74 Years | 90 (60.8%) | 0 (0.0%) |
| 75 Years and over | 0 (0.0%) | 0 (0.0%) |
| Total | 1,455 (69.6%) | 151 (10.4%) |
Employment Status by Educational Attainment in Woodlynne borough
According to labor force statistics for Woodlynne borough, 76.3% of individuals (1,151) out of the total population between 25 and 64 years of age (1,509) are in the labor force, with 12.3% or 142 of them being unemployed. The group with the highest labor force participation rate are those with the educational attainment of bachelor's degree or higher, with 91.7% or 177 individuals in the labor force. Within the labor force, individuals with college / associate degree education have the highest percentage of unemployment, with 27.9% or 70 of them being unemployed.
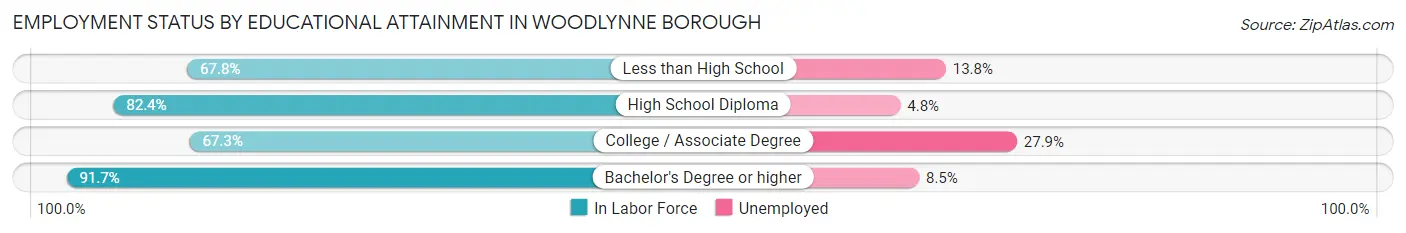
| Educational Attainment | In Labor Force | Unemployed |
| Less than High School | 246 (67.8%) | 50 (13.8%) |
| High School Diploma | 478 (82.4%) | 28 (4.8%) |
| College / Associate Degree | 251 (67.3%) | 104 (27.9%) |
| Bachelor's Degree or higher | 177 (91.7%) | 16 (8.5%) |
| Total | 1,151 (76.3%) | 186 (12.3%) |
Employment Occupations by Sex in Woodlynne borough
Management, Business, Science and Arts Occupations
The most common Management, Business, Science and Arts occupations in Woodlynne borough are Management (95 | 7.3%), Business & Financial (86 | 6.6%), Community & Social Service (26 | 2.0%), Education Instruction & Library (26 | 2.0%), and Health Diagnosing & Treating (13 | 1.0%).
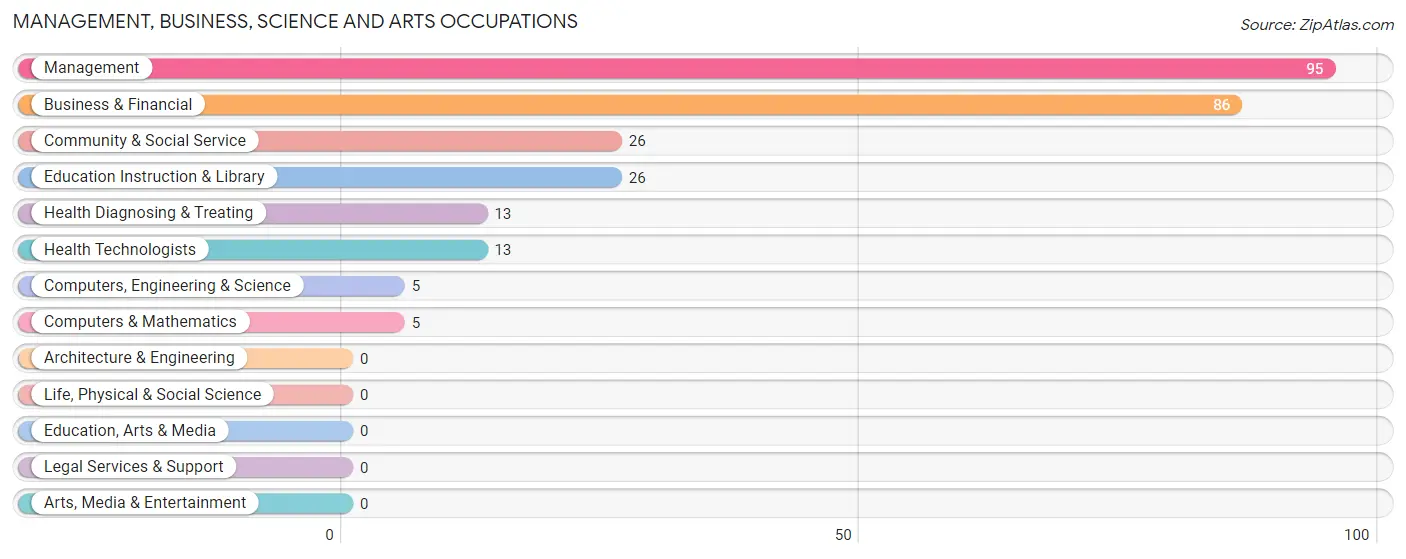
Management, Business, Science and Arts Occupations by Sex
Within the Management, Business, Science and Arts occupations in Woodlynne borough, the most male-oriented occupations are Computers, Engineering & Science (100.0%), Computers & Mathematics (100.0%), and Management (64.2%), while the most female-oriented occupations are Community & Social Service (100.0%), Education Instruction & Library (100.0%), and Health Diagnosing & Treating (100.0%).
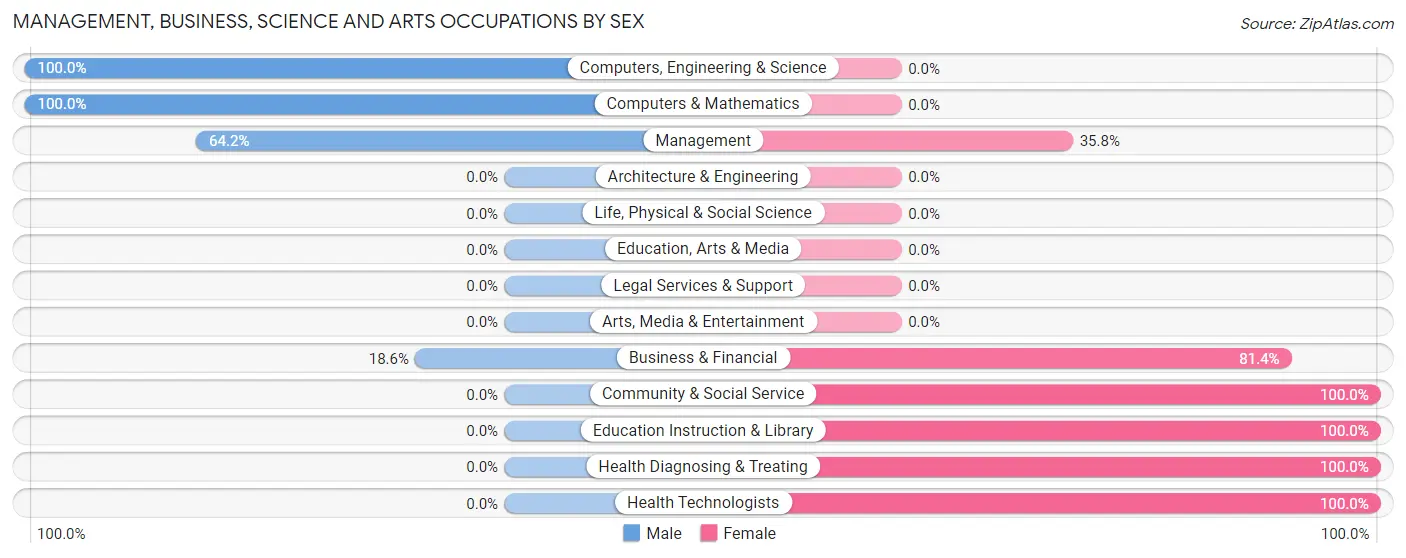
| Occupation | Male | Female |
| Management | 61 (64.2%) | 34 (35.8%) |
| Business & Financial | 16 (18.6%) | 70 (81.4%) |
| Computers, Engineering & Science | 5 (100.0%) | 0 (0.0%) |
| Computers & Mathematics | 5 (100.0%) | 0 (0.0%) |
| Architecture & Engineering | 0 (0.0%) | 0 (0.0%) |
| Life, Physical & Social Science | 0 (0.0%) | 0 (0.0%) |
| Community & Social Service | 0 (0.0%) | 26 (100.0%) |
| Education, Arts & Media | 0 (0.0%) | 0 (0.0%) |
| Legal Services & Support | 0 (0.0%) | 0 (0.0%) |
| Education Instruction & Library | 0 (0.0%) | 26 (100.0%) |
| Arts, Media & Entertainment | 0 (0.0%) | 0 (0.0%) |
| Health Diagnosing & Treating | 0 (0.0%) | 13 (100.0%) |
| Health Technologists | 0 (0.0%) | 13 (100.0%) |
| Total (Category) | 82 (36.4%) | 143 (63.6%) |
| Total (Overall) | 798 (61.2%) | 505 (38.8%) |
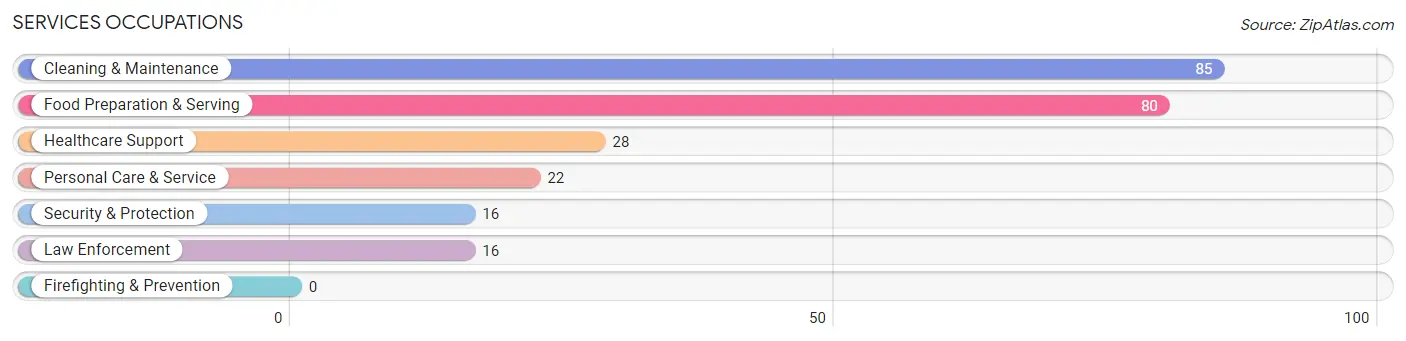
Services Occupations
The most common Services occupations in Woodlynne borough are Cleaning & Maintenance (85 | 6.5%), Food Preparation & Serving (80 | 6.1%), Healthcare Support (28 | 2.1%), Personal Care & Service (22 | 1.7%), and Security & Protection (16 | 1.2%).
Services Occupations by Sex
Within the Services occupations in Woodlynne borough, the most male-oriented occupations are Security & Protection (100.0%), Law Enforcement (100.0%), and Food Preparation & Serving (88.7%), while the most female-oriented occupations are Healthcare Support (100.0%), Personal Care & Service (59.1%), and Cleaning & Maintenance (28.2%).
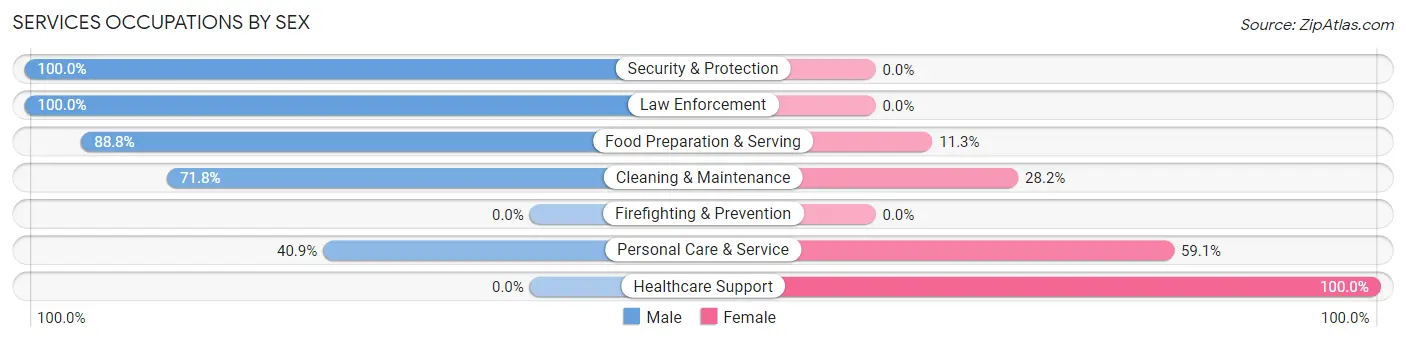
| Occupation | Male | Female |
| Healthcare Support | 0 (0.0%) | 28 (100.0%) |
| Security & Protection | 16 (100.0%) | 0 (0.0%) |
| Firefighting & Prevention | 0 (0.0%) | 0 (0.0%) |
| Law Enforcement | 16 (100.0%) | 0 (0.0%) |
| Food Preparation & Serving | 71 (88.7%) | 9 (11.3%) |
| Cleaning & Maintenance | 61 (71.8%) | 24 (28.2%) |
| Personal Care & Service | 9 (40.9%) | 13 (59.1%) |
| Total (Category) | 157 (68.0%) | 74 (32.0%) |
| Total (Overall) | 798 (61.2%) | 505 (38.8%) |
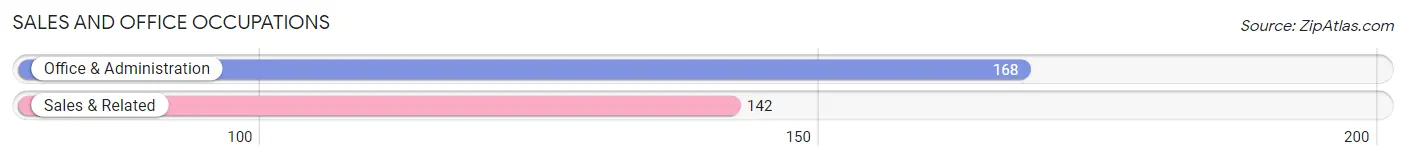
Sales and Office Occupations
The most common Sales and Office occupations in Woodlynne borough are Office & Administration (168 | 12.9%), and Sales & Related (142 | 10.9%).
Sales and Office Occupations by Sex
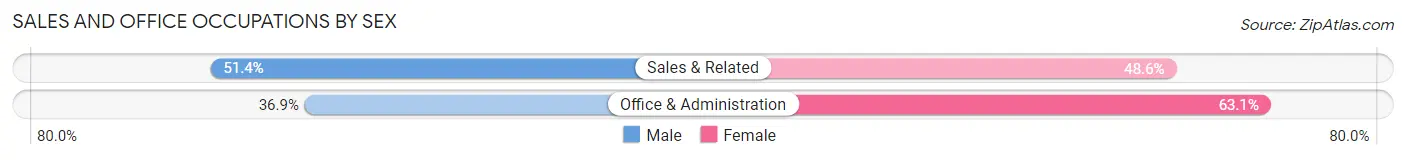
| Occupation | Male | Female |
| Sales & Related | 73 (51.4%) | 69 (48.6%) |
| Office & Administration | 62 (36.9%) | 106 (63.1%) |
| Total (Category) | 135 (43.5%) | 175 (56.5%) |
| Total (Overall) | 798 (61.2%) | 505 (38.8%) |
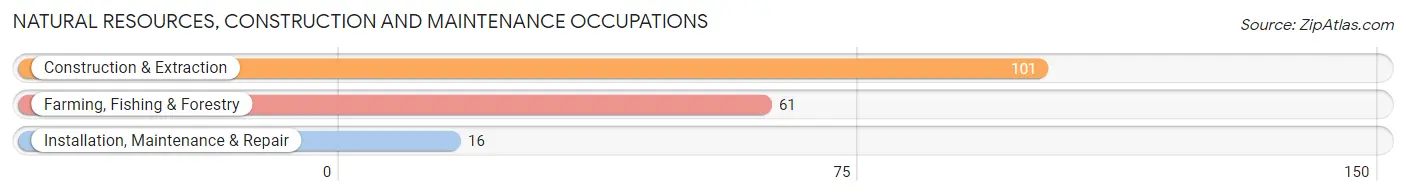
Natural Resources, Construction and Maintenance Occupations
The most common Natural Resources, Construction and Maintenance occupations in Woodlynne borough are Construction & Extraction (101 | 7.7%), Farming, Fishing & Forestry (61 | 4.7%), and Installation, Maintenance & Repair (16 | 1.2%).
Natural Resources, Construction and Maintenance Occupations by Sex
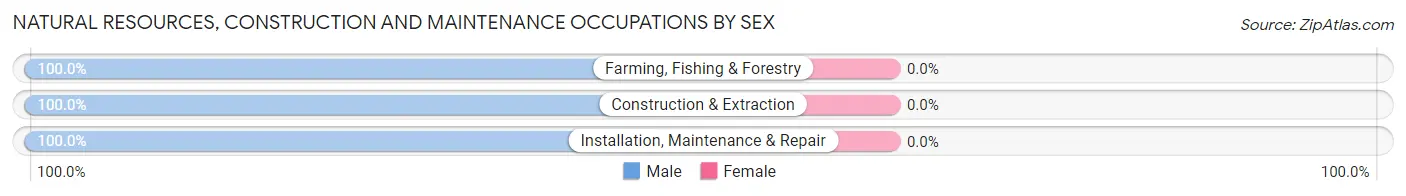
| Occupation | Male | Female |
| Farming, Fishing & Forestry | 61 (100.0%) | 0 (0.0%) |
| Construction & Extraction | 101 (100.0%) | 0 (0.0%) |
| Installation, Maintenance & Repair | 16 (100.0%) | 0 (0.0%) |
| Total (Category) | 178 (100.0%) | 0 (0.0%) |
| Total (Overall) | 798 (61.2%) | 505 (38.8%) |
Production, Transportation and Moving Occupations
The most common Production, Transportation and Moving occupations in Woodlynne borough are Material Moving (203 | 15.6%), Production (78 | 6.0%), and Transportation (78 | 6.0%).
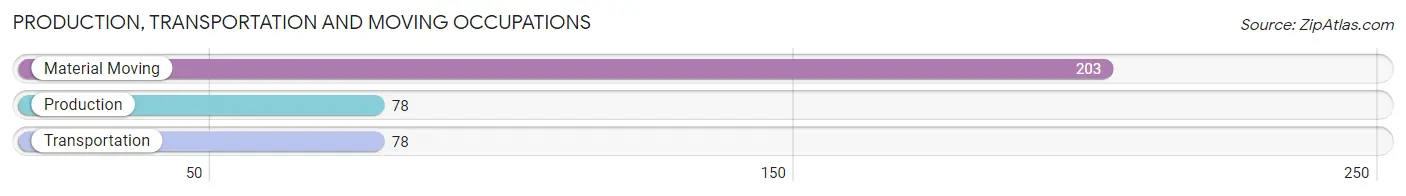
Production, Transportation and Moving Occupations by Sex
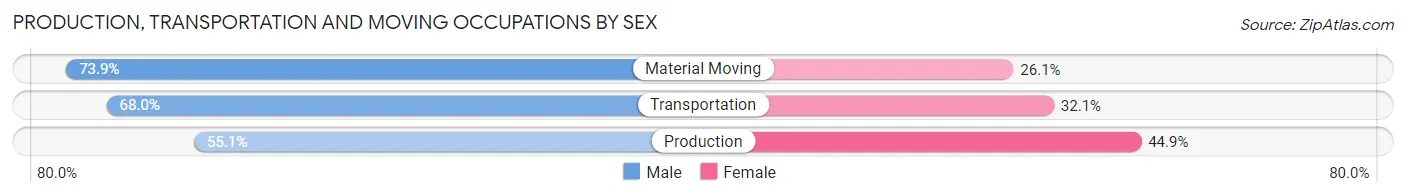
| Occupation | Male | Female |
| Production | 43 (55.1%) | 35 (44.9%) |
| Transportation | 53 (67.9%) | 25 (32.1%) |
| Material Moving | 150 (73.9%) | 53 (26.1%) |
| Total (Category) | 246 (68.5%) | 113 (31.5%) |
| Total (Overall) | 798 (61.2%) | 505 (38.8%) |
Employment Industries by Sex in Woodlynne borough
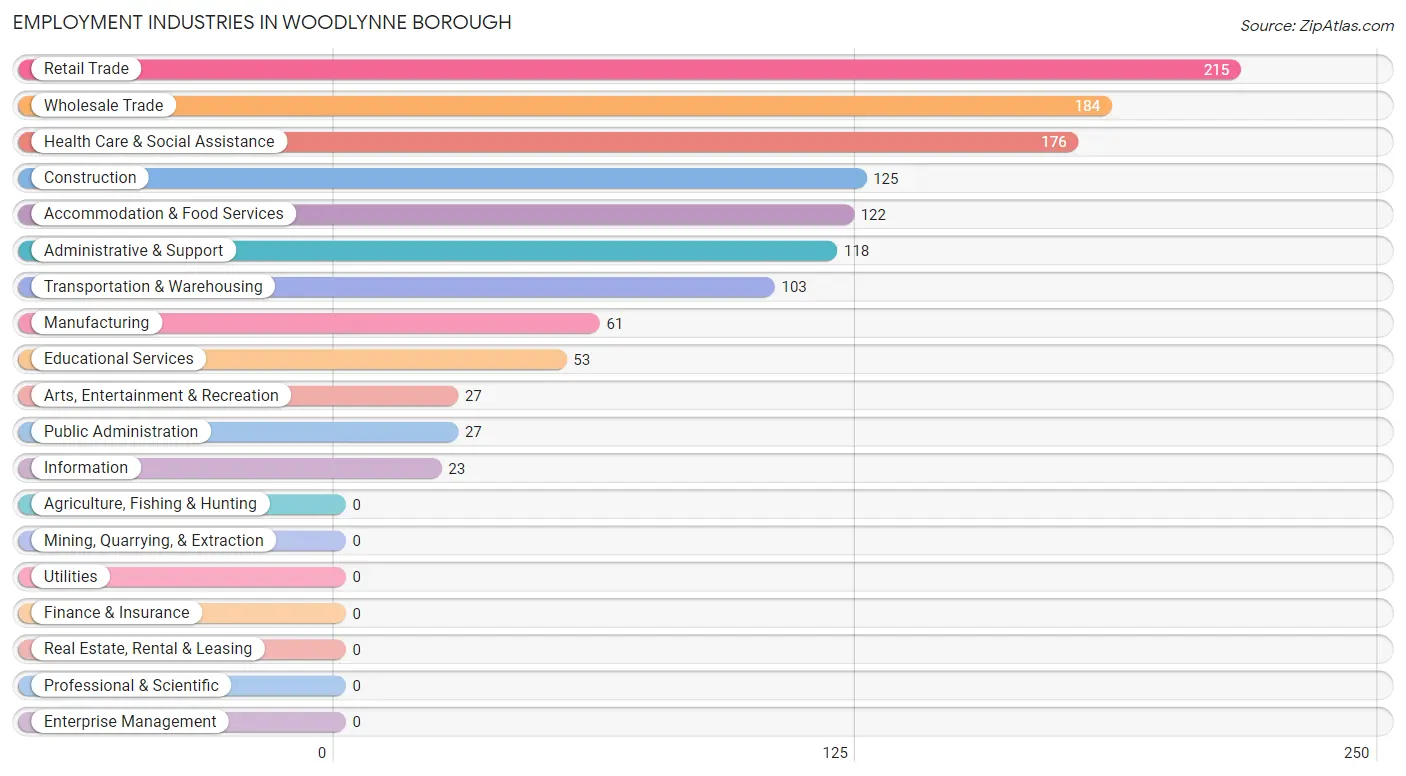
Employment Industries in Woodlynne borough
The major employment industries in Woodlynne borough include Retail Trade (215 | 16.5%), Wholesale Trade (184 | 14.1%), Health Care & Social Assistance (176 | 13.5%), Construction (125 | 9.6%), and Accommodation & Food Services (122 | 9.4%).
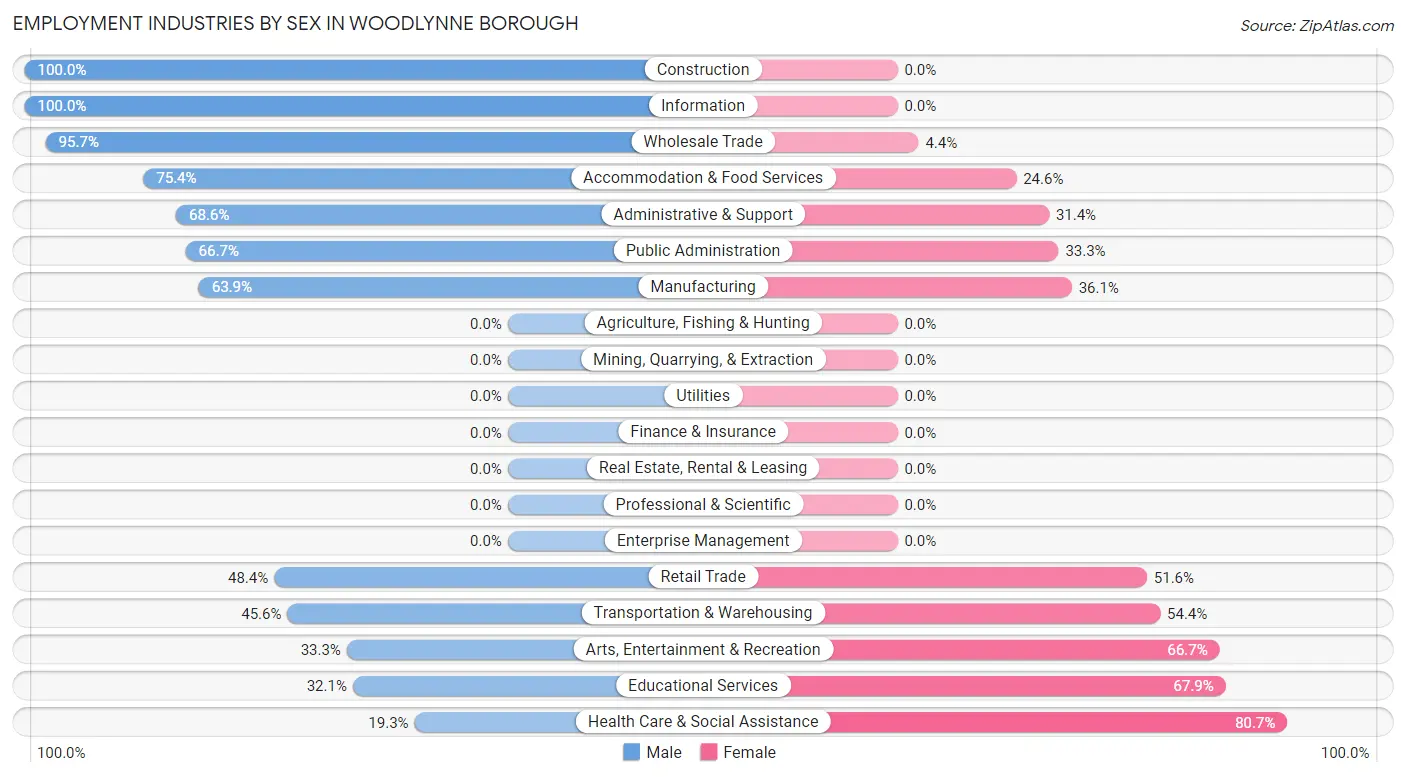
Employment Industries by Sex in Woodlynne borough
The Woodlynne borough industries that see more men than women are Construction (100.0%), Information (100.0%), and Wholesale Trade (95.7%), whereas the industries that tend to have a higher number of women are Health Care & Social Assistance (80.7%), Educational Services (67.9%), and Arts, Entertainment & Recreation (66.7%).
| Industry | Male | Female |
| Agriculture, Fishing & Hunting | 0 (0.0%) | 0 (0.0%) |
| Mining, Quarrying, & Extraction | 0 (0.0%) | 0 (0.0%) |
| Construction | 125 (100.0%) | 0 (0.0%) |
| Manufacturing | 39 (63.9%) | 22 (36.1%) |
| Wholesale Trade | 176 (95.7%) | 8 (4.3%) |
| Retail Trade | 104 (48.4%) | 111 (51.6%) |
| Transportation & Warehousing | 47 (45.6%) | 56 (54.4%) |
| Utilities | 0 (0.0%) | 0 (0.0%) |
| Information | 23 (100.0%) | 0 (0.0%) |
| Finance & Insurance | 0 (0.0%) | 0 (0.0%) |
| Real Estate, Rental & Leasing | 0 (0.0%) | 0 (0.0%) |
| Professional & Scientific | 0 (0.0%) | 0 (0.0%) |
| Enterprise Management | 0 (0.0%) | 0 (0.0%) |
| Administrative & Support | 81 (68.6%) | 37 (31.4%) |
| Educational Services | 17 (32.1%) | 36 (67.9%) |
| Health Care & Social Assistance | 34 (19.3%) | 142 (80.7%) |
| Arts, Entertainment & Recreation | 9 (33.3%) | 18 (66.7%) |
| Accommodation & Food Services | 92 (75.4%) | 30 (24.6%) |
| Public Administration | 18 (66.7%) | 9 (33.3%) |
| Total | 798 (61.2%) | 505 (38.8%) |
Education in Woodlynne borough
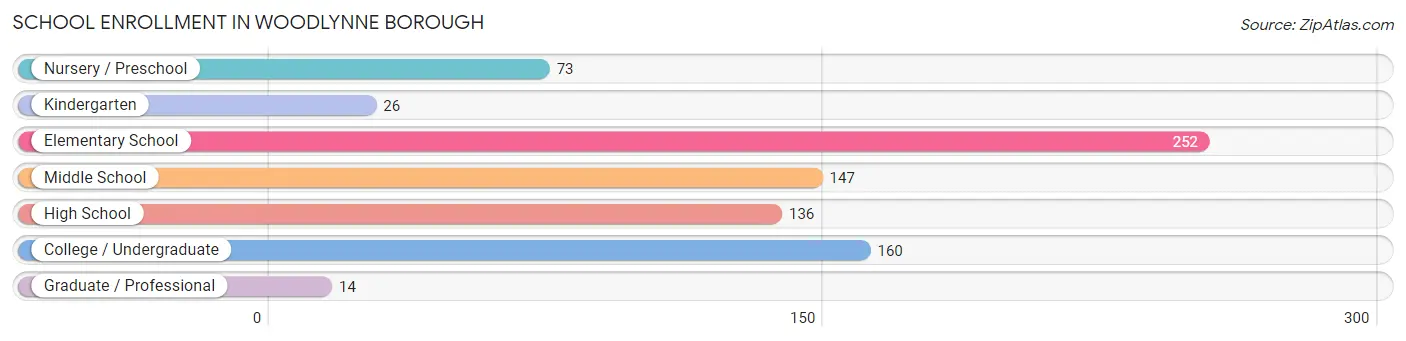
School Enrollment in Woodlynne borough
The most common levels of schooling among the 808 students in Woodlynne borough are elementary school (252 | 31.2%), college / undergraduate (160 | 19.8%), and middle school (147 | 18.2%).
| School Level | # Students | % Students |
| Nursery / Preschool | 73 | 9.0% |
| Kindergarten | 26 | 3.2% |
| Elementary School | 252 | 31.2% |
| Middle School | 147 | 18.2% |
| High School | 136 | 16.8% |
| College / Undergraduate | 160 | 19.8% |
| Graduate / Professional | 14 | 1.7% |
| Total | 808 | 100.0% |
School Enrollment by Age by Funding Source in Woodlynne borough
Out of a total of 808 students who are enrolled in schools in Woodlynne borough, 146 (18.1%) attend a private institution, while the remaining 662 (81.9%) are enrolled in public schools. The age group of 3 to 4 year olds has the highest likelihood of being enrolled in private schools, with 29 (46.0% in the age bracket) enrolled. Conversely, the age group of 15 to 17 year olds has the lowest likelihood of being enrolled in a private school, with 66 (100.0% in the age bracket) attending a public institution.
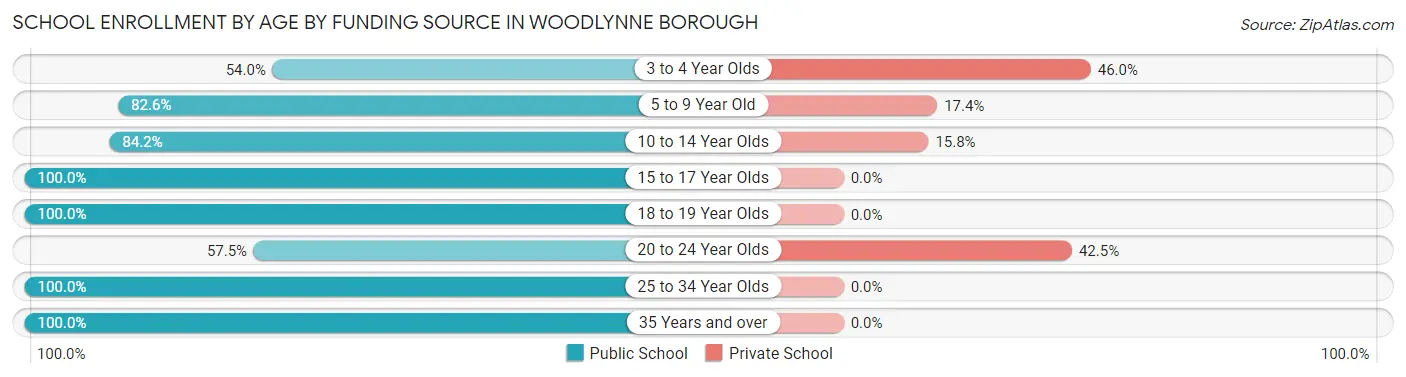
| Age Bracket | Public School | Private School |
| 3 to 4 Year Olds | 34 (54.0%) | 29 (46.0%) |
| 5 to 9 Year Old | 237 (82.6%) | 50 (17.4%) |
| 10 to 14 Year Olds | 160 (84.2%) | 30 (15.8%) |
| 15 to 17 Year Olds | 66 (100.0%) | 0 (0.0%) |
| 18 to 19 Year Olds | 37 (100.0%) | 0 (0.0%) |
| 20 to 24 Year Olds | 50 (57.5%) | 37 (42.5%) |
| 25 to 34 Year Olds | 21 (100.0%) | 0 (0.0%) |
| 35 Years and over | 57 (100.0%) | 0 (0.0%) |
| Total | 662 (81.9%) | 146 (18.1%) |
Educational Attainment by Field of Study in Woodlynne borough
Business (51 | 19.5%), science & technology (42 | 16.1%), bio, nature & agricultural (39 | 14.9%), education (37 | 14.2%), and computers & mathematics (34 | 13.0%) are the most common fields of study among 261 individuals in Woodlynne borough who have obtained a bachelor's degree or higher.
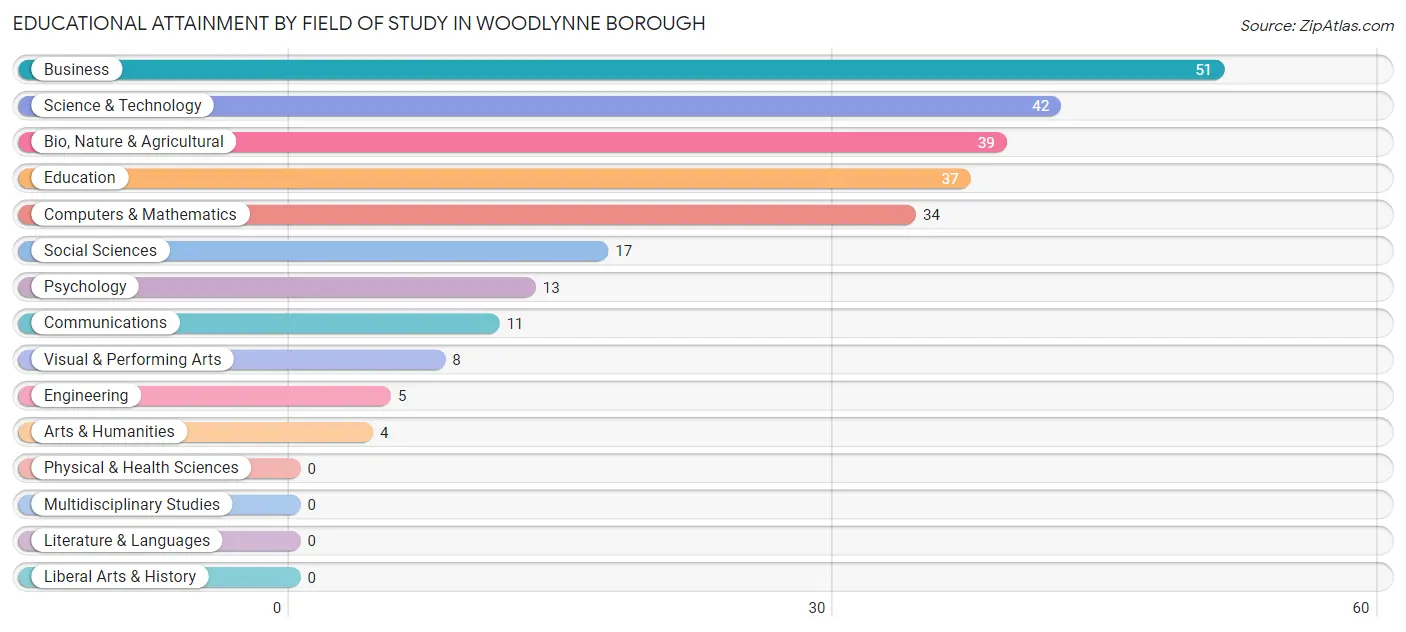
| Field of Study | # Graduates | % Graduates |
| Computers & Mathematics | 34 | 13.0% |
| Bio, Nature & Agricultural | 39 | 14.9% |
| Physical & Health Sciences | 0 | 0.0% |
| Psychology | 13 | 5.0% |
| Social Sciences | 17 | 6.5% |
| Engineering | 5 | 1.9% |
| Multidisciplinary Studies | 0 | 0.0% |
| Science & Technology | 42 | 16.1% |
| Business | 51 | 19.5% |
| Education | 37 | 14.2% |
| Literature & Languages | 0 | 0.0% |
| Liberal Arts & History | 0 | 0.0% |
| Visual & Performing Arts | 8 | 3.1% |
| Communications | 11 | 4.2% |
| Arts & Humanities | 4 | 1.5% |
| Total | 261 | 100.0% |
Transportation & Commute in Woodlynne borough
Vehicle Availability by Sex in Woodlynne borough
The most prevalent vehicle ownership categories in Woodlynne borough are males with 1 vehicle (289, accounting for 36.2%) and females with 1 vehicle (159, making up 58.2%).
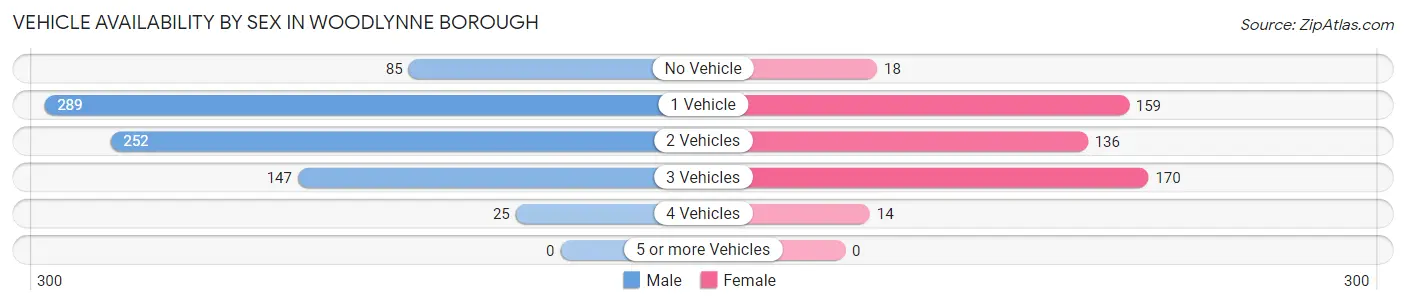
| Vehicles Available | Male | Female |
| No Vehicle | 85 (10.6%) | 18 (3.6%) |
| 1 Vehicle | 289 (36.2%) | 159 (32.0%) |
| 2 Vehicles | 252 (31.6%) | 136 (27.4%) |
| 3 Vehicles | 147 (18.4%) | 170 (34.2%) |
| 4 Vehicles | 25 (3.1%) | 14 (2.8%) |
| 5 or more Vehicles | 0 (0.0%) | 0 (0.0%) |
| Total | 798 (100.0%) | 497 (100.0%) |
Commute Time in Woodlynne borough
The most frequently occuring commute durations in Woodlynne borough are 10 to 14 minutes (209 commuters, 16.8%), 15 to 19 minutes (207 commuters, 16.7%), and 45 to 59 minutes (153 commuters, 12.3%).
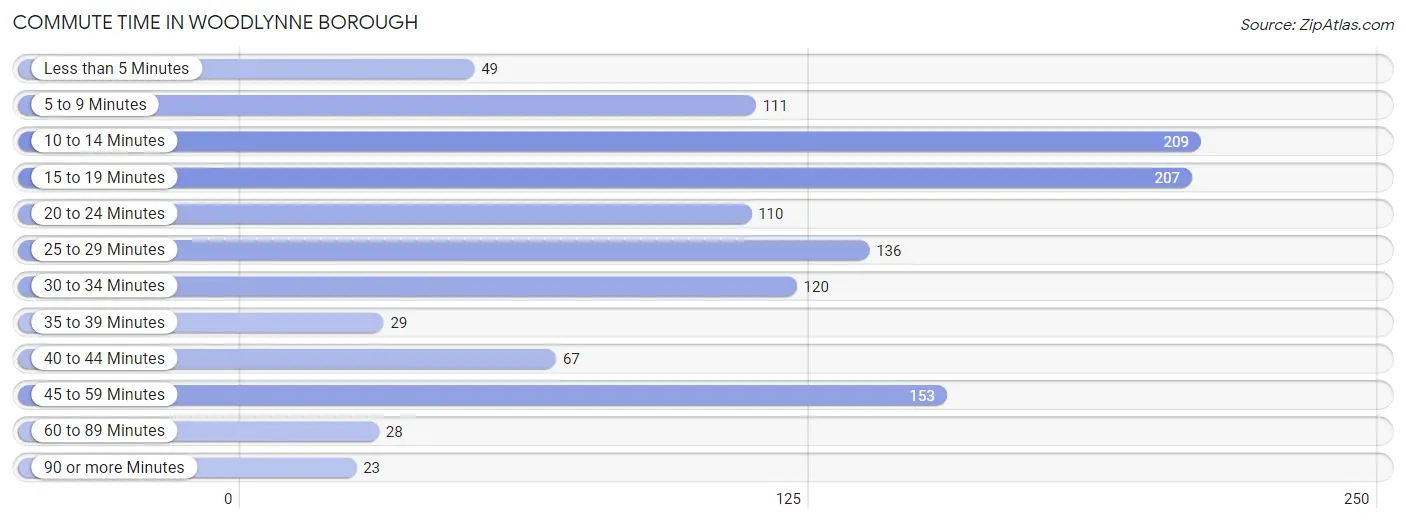
| Commute Time | # Commuters | % Commuters |
| Less than 5 Minutes | 49 | 4.0% |
| 5 to 9 Minutes | 111 | 8.9% |
| 10 to 14 Minutes | 209 | 16.8% |
| 15 to 19 Minutes | 207 | 16.7% |
| 20 to 24 Minutes | 110 | 8.9% |
| 25 to 29 Minutes | 136 | 11.0% |
| 30 to 34 Minutes | 120 | 9.7% |
| 35 to 39 Minutes | 29 | 2.3% |
| 40 to 44 Minutes | 67 | 5.4% |
| 45 to 59 Minutes | 153 | 12.3% |
| 60 to 89 Minutes | 28 | 2.2% |
| 90 or more Minutes | 23 | 1.8% |
Commute Time by Sex in Woodlynne borough
The most common commute times in Woodlynne borough are 15 to 19 minutes (158 commuters, 20.5%) for males and 10 to 14 minutes (87 commuters, 18.4%) for females.
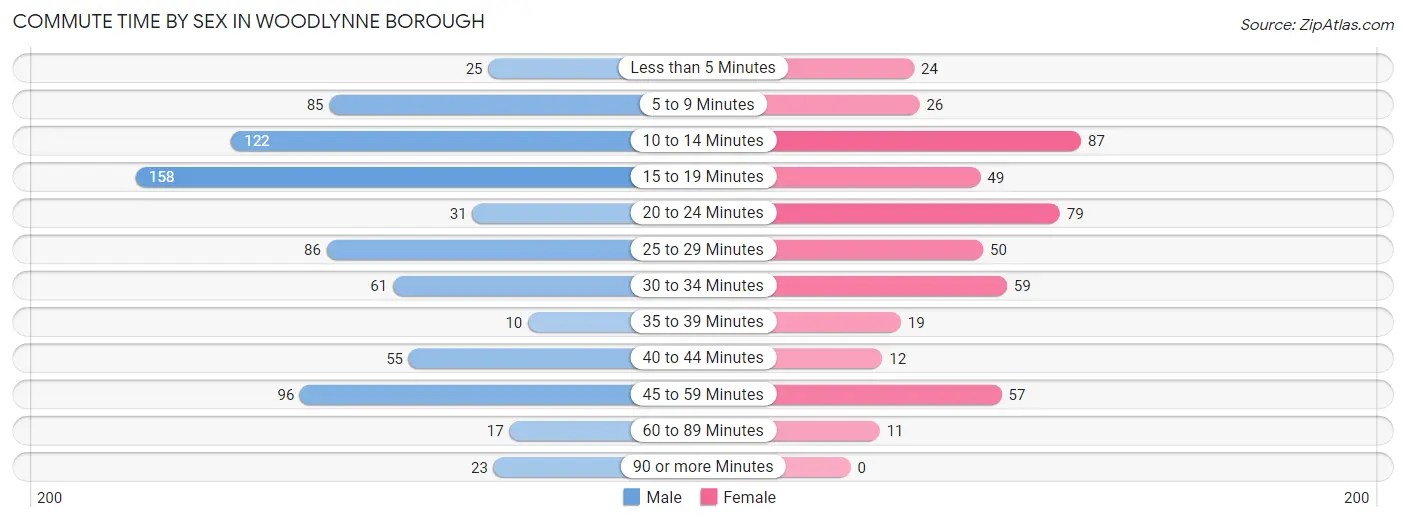
| Commute Time | Male | Female |
| Less than 5 Minutes | 25 (3.3%) | 24 (5.1%) |
| 5 to 9 Minutes | 85 (11.1%) | 26 (5.5%) |
| 10 to 14 Minutes | 122 (15.9%) | 87 (18.4%) |
| 15 to 19 Minutes | 158 (20.5%) | 49 (10.4%) |
| 20 to 24 Minutes | 31 (4.0%) | 79 (16.7%) |
| 25 to 29 Minutes | 86 (11.2%) | 50 (10.6%) |
| 30 to 34 Minutes | 61 (7.9%) | 59 (12.5%) |
| 35 to 39 Minutes | 10 (1.3%) | 19 (4.0%) |
| 40 to 44 Minutes | 55 (7.1%) | 12 (2.5%) |
| 45 to 59 Minutes | 96 (12.5%) | 57 (12.0%) |
| 60 to 89 Minutes | 17 (2.2%) | 11 (2.3%) |
| 90 or more Minutes | 23 (3.0%) | 0 (0.0%) |
Time of Departure to Work by Sex in Woodlynne borough
The most frequent times of departure to work in Woodlynne borough are 12:00 AM to 4:59 AM (181, 23.5%) for males and 6:00 AM to 6:29 AM (77, 16.3%) for females.
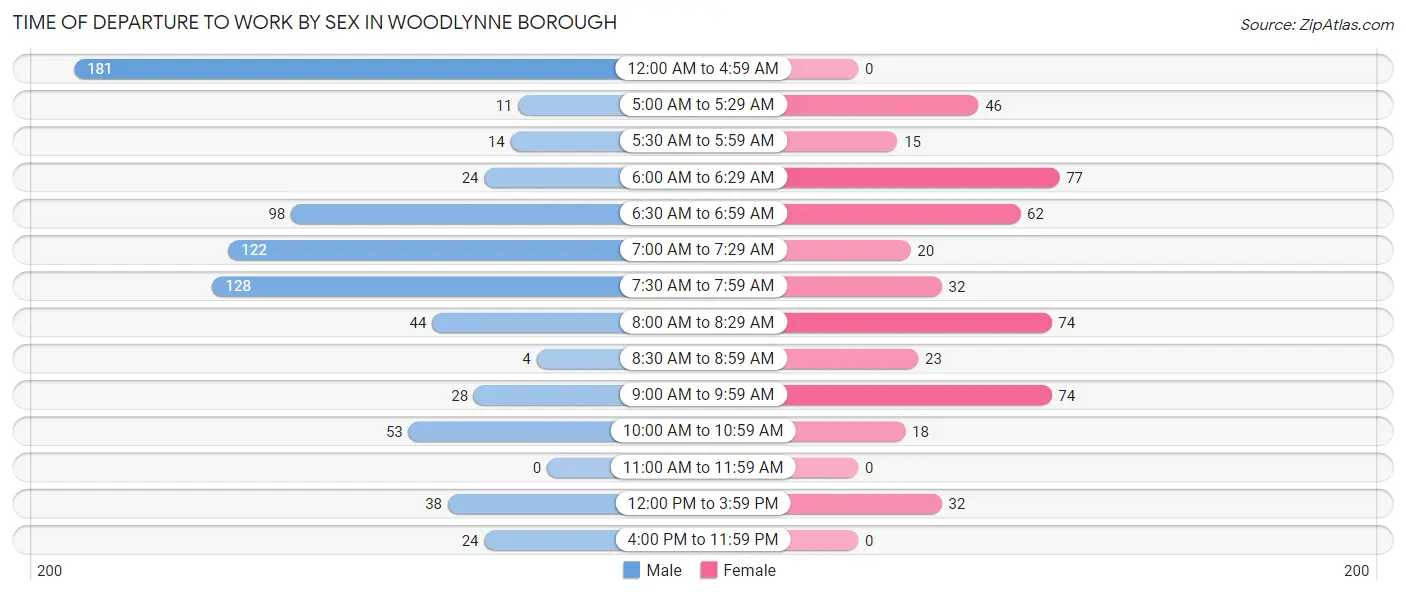
| Time of Departure | Male | Female |
| 12:00 AM to 4:59 AM | 181 (23.5%) | 0 (0.0%) |
| 5:00 AM to 5:29 AM | 11 (1.4%) | 46 (9.7%) |
| 5:30 AM to 5:59 AM | 14 (1.8%) | 15 (3.2%) |
| 6:00 AM to 6:29 AM | 24 (3.1%) | 77 (16.3%) |
| 6:30 AM to 6:59 AM | 98 (12.7%) | 62 (13.1%) |
| 7:00 AM to 7:29 AM | 122 (15.9%) | 20 (4.2%) |
| 7:30 AM to 7:59 AM | 128 (16.6%) | 32 (6.8%) |
| 8:00 AM to 8:29 AM | 44 (5.7%) | 74 (15.6%) |
| 8:30 AM to 8:59 AM | 4 (0.5%) | 23 (4.9%) |
| 9:00 AM to 9:59 AM | 28 (3.6%) | 74 (15.6%) |
| 10:00 AM to 10:59 AM | 53 (6.9%) | 18 (3.8%) |
| 11:00 AM to 11:59 AM | 0 (0.0%) | 0 (0.0%) |
| 12:00 PM to 3:59 PM | 38 (4.9%) | 32 (6.8%) |
| 4:00 PM to 11:59 PM | 24 (3.1%) | 0 (0.0%) |
| Total | 769 (100.0%) | 473 (100.0%) |
Housing Occupancy in Woodlynne borough
Occupancy by Ownership in Woodlynne borough
Of the total 834 dwellings in Woodlynne borough, owner-occupied units account for 430 (51.6%), while renter-occupied units make up 404 (48.4%).
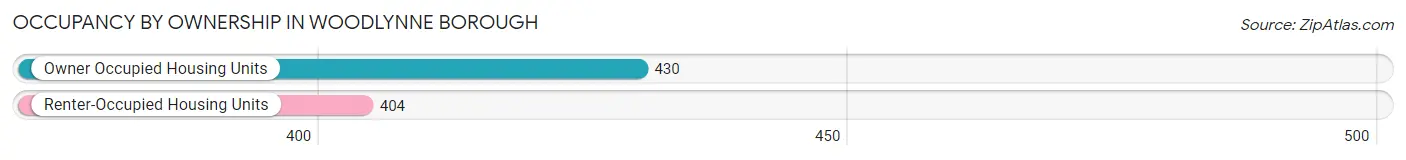
| Occupancy | # Housing Units | % Housing Units |
| Owner Occupied Housing Units | 430 | 51.6% |
| Renter-Occupied Housing Units | 404 | 48.4% |
| Total Occupied Housing Units | 834 | 100.0% |
Occupancy by Household Size in Woodlynne borough
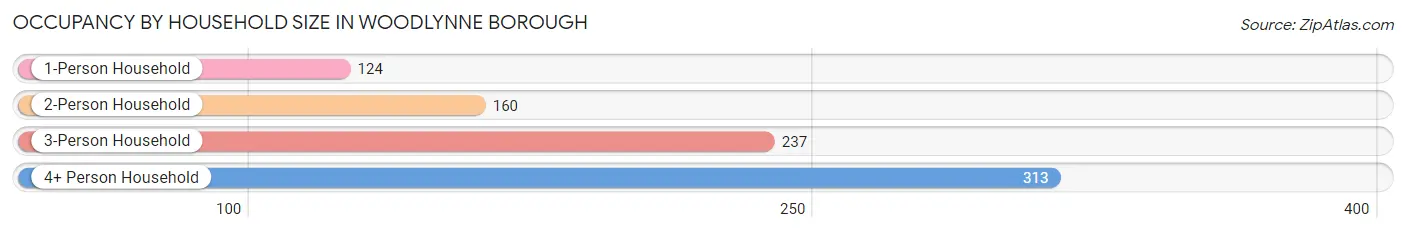
| Household Size | # Housing Units | % Housing Units |
| 1-Person Household | 124 | 14.9% |
| 2-Person Household | 160 | 19.2% |
| 3-Person Household | 237 | 28.4% |
| 4+ Person Household | 313 | 37.5% |
| Total Housing Units | 834 | 100.0% |
Occupancy by Ownership by Household Size in Woodlynne borough
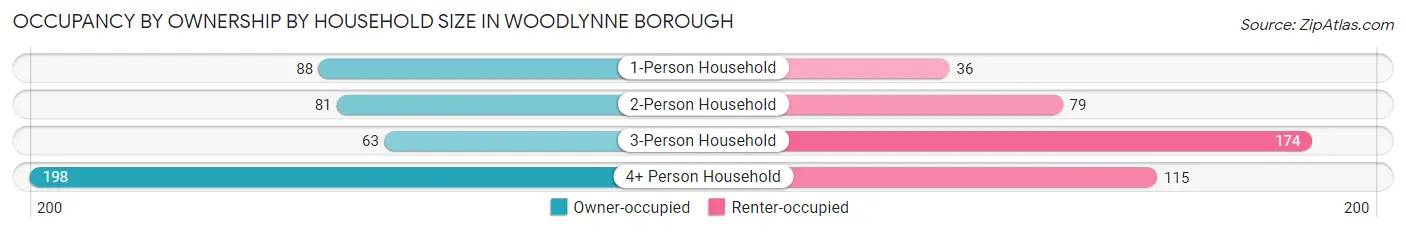
| Household Size | Owner-occupied | Renter-occupied |
| 1-Person Household | 88 (71.0%) | 36 (29.0%) |
| 2-Person Household | 81 (50.6%) | 79 (49.4%) |
| 3-Person Household | 63 (26.6%) | 174 (73.4%) |
| 4+ Person Household | 198 (63.3%) | 115 (36.7%) |
| Total Housing Units | 430 (51.6%) | 404 (48.4%) |
Occupancy by Educational Attainment in Woodlynne borough
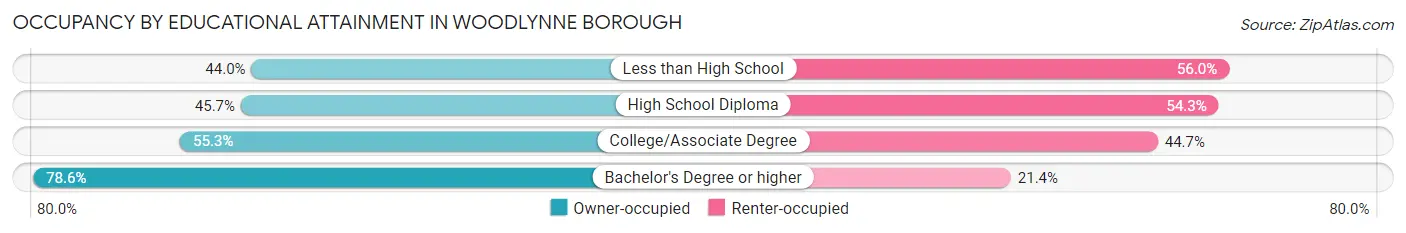
| Household Size | Owner-occupied | Renter-occupied |
| Less than High School | 107 (44.0%) | 136 (56.0%) |
| High School Diploma | 133 (45.7%) | 158 (54.3%) |
| College/Associate Degree | 109 (55.3%) | 88 (44.7%) |
| Bachelor's Degree or higher | 81 (78.6%) | 22 (21.4%) |
Occupancy by Age of Householder in Woodlynne borough
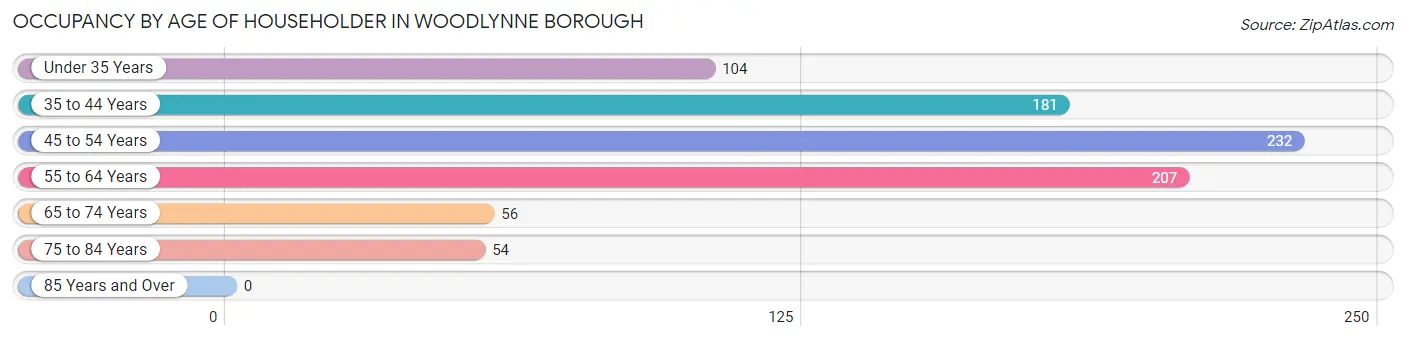
| Age Bracket | # Households | % Households |
| Under 35 Years | 104 | 12.5% |
| 35 to 44 Years | 181 | 21.7% |
| 45 to 54 Years | 232 | 27.8% |
| 55 to 64 Years | 207 | 24.8% |
| 65 to 74 Years | 56 | 6.7% |
| 75 to 84 Years | 54 | 6.5% |
| 85 Years and Over | 0 | 0.0% |
| Total | 834 | 100.0% |
Housing Finances in Woodlynne borough
Median Income by Occupancy in Woodlynne borough
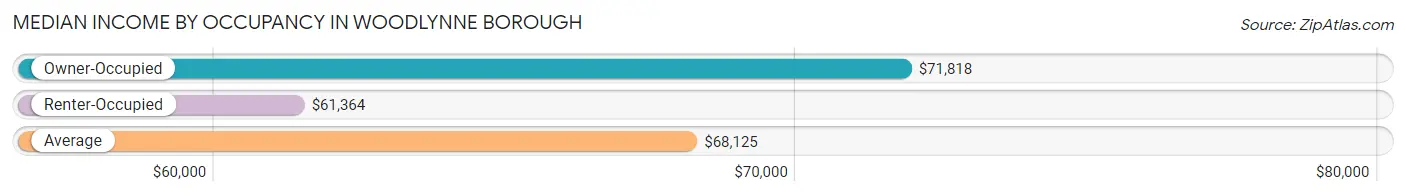
| Occupancy Type | # Households | Median Income |
| Owner-Occupied | 430 (51.6%) | $71,818 |
| Renter-Occupied | 404 (48.4%) | $61,364 |
| Average | 834 (100.0%) | $68,125 |
Occupancy by Householder Income Bracket in Woodlynne borough
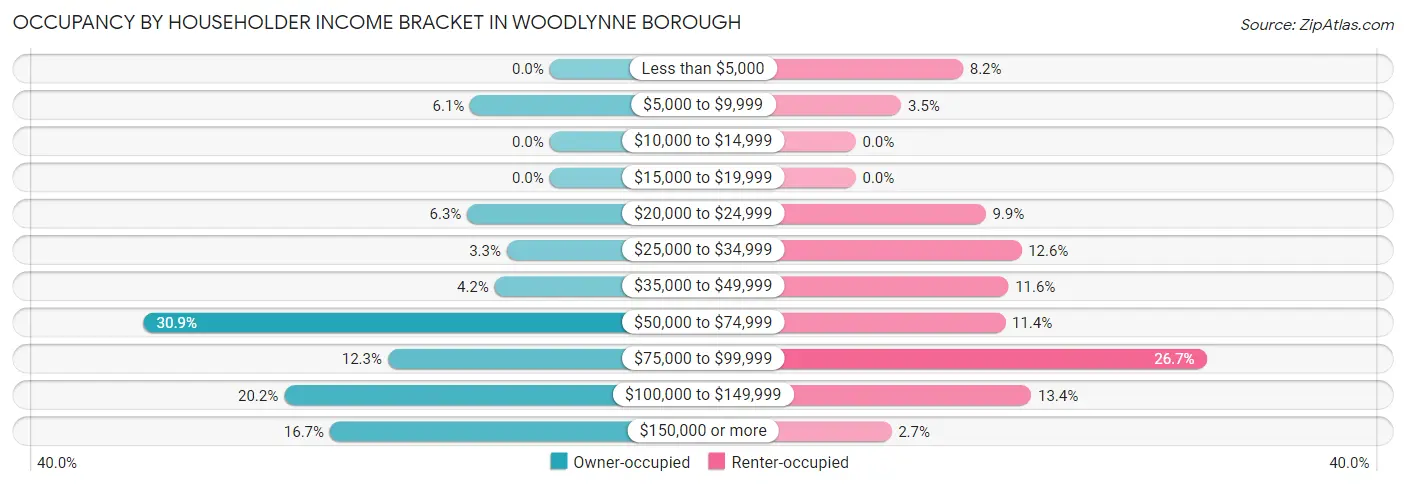
| Income Bracket | Owner-occupied | Renter-occupied |
| Less than $5,000 | 0 (0.0%) | 33 (8.2%) |
| $5,000 to $9,999 | 26 (6.0%) | 14 (3.5%) |
| $10,000 to $14,999 | 0 (0.0%) | 0 (0.0%) |
| $15,000 to $19,999 | 0 (0.0%) | 0 (0.0%) |
| $20,000 to $24,999 | 27 (6.3%) | 40 (9.9%) |
| $25,000 to $34,999 | 14 (3.3%) | 51 (12.6%) |
| $35,000 to $49,999 | 18 (4.2%) | 47 (11.6%) |
| $50,000 to $74,999 | 133 (30.9%) | 46 (11.4%) |
| $75,000 to $99,999 | 53 (12.3%) | 108 (26.7%) |
| $100,000 to $149,999 | 87 (20.2%) | 54 (13.4%) |
| $150,000 or more | 72 (16.7%) | 11 (2.7%) |
| Total | 430 (100.0%) | 404 (100.0%) |
Monthly Housing Cost Tiers in Woodlynne borough
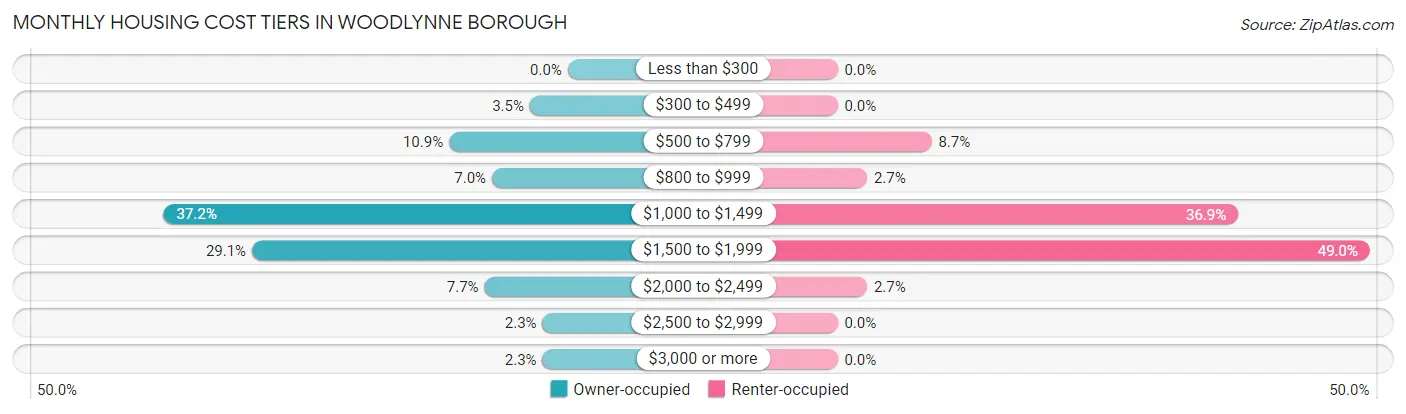
| Monthly Cost | Owner-occupied | Renter-occupied |
| Less than $300 | 0 (0.0%) | 0 (0.0%) |
| $300 to $499 | 15 (3.5%) | 0 (0.0%) |
| $500 to $799 | 47 (10.9%) | 35 (8.7%) |
| $800 to $999 | 30 (7.0%) | 11 (2.7%) |
| $1,000 to $1,499 | 160 (37.2%) | 149 (36.9%) |
| $1,500 to $1,999 | 125 (29.1%) | 198 (49.0%) |
| $2,000 to $2,499 | 33 (7.7%) | 11 (2.7%) |
| $2,500 to $2,999 | 10 (2.3%) | 0 (0.0%) |
| $3,000 or more | 10 (2.3%) | 0 (0.0%) |
| Total | 430 (100.0%) | 404 (100.0%) |
Physical Housing Characteristics in Woodlynne borough
Housing Structures in Woodlynne borough
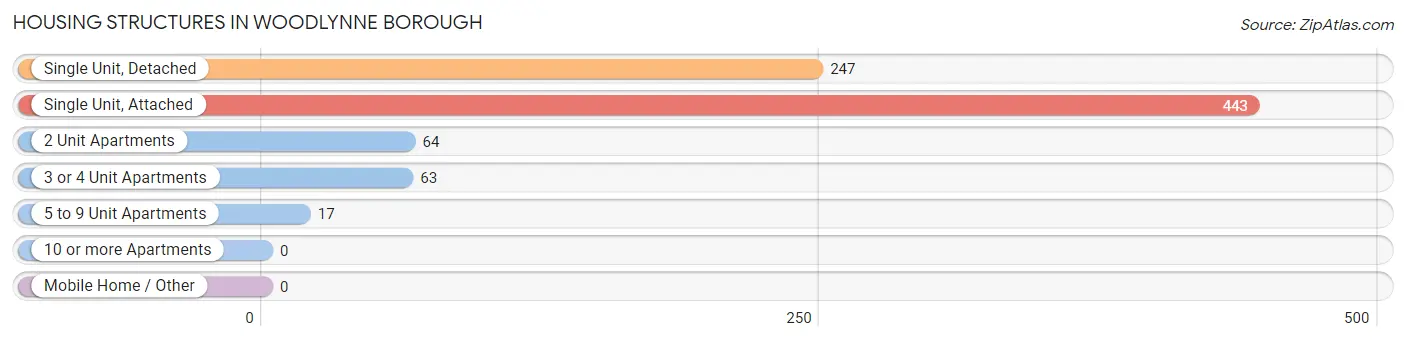
| Structure Type | # Housing Units | % Housing Units |
| Single Unit, Detached | 247 | 29.6% |
| Single Unit, Attached | 443 | 53.1% |
| 2 Unit Apartments | 64 | 7.7% |
| 3 or 4 Unit Apartments | 63 | 7.5% |
| 5 to 9 Unit Apartments | 17 | 2.0% |
| 10 or more Apartments | 0 | 0.0% |
| Mobile Home / Other | 0 | 0.0% |
| Total | 834 | 100.0% |
Housing Structures by Occupancy in Woodlynne borough
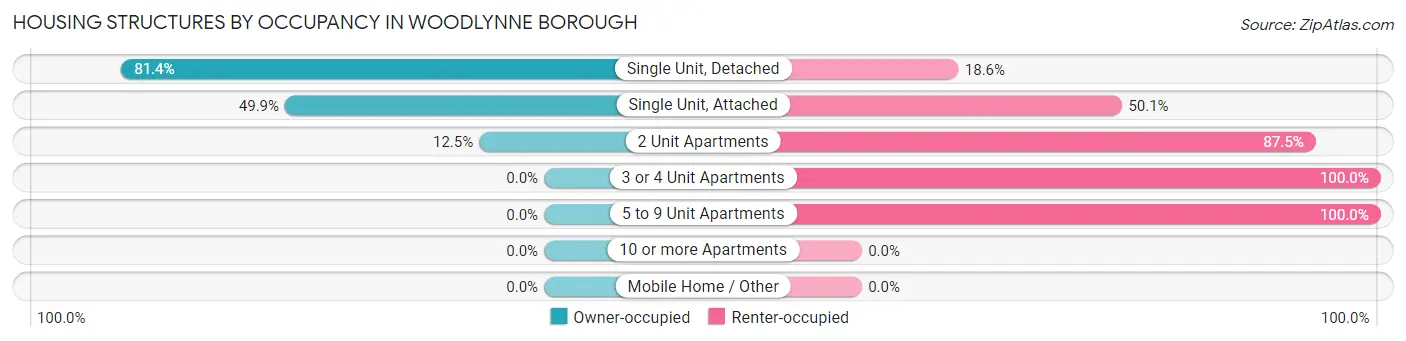
| Structure Type | Owner-occupied | Renter-occupied |
| Single Unit, Detached | 201 (81.4%) | 46 (18.6%) |
| Single Unit, Attached | 221 (49.9%) | 222 (50.1%) |
| 2 Unit Apartments | 8 (12.5%) | 56 (87.5%) |
| 3 or 4 Unit Apartments | 0 (0.0%) | 63 (100.0%) |
| 5 to 9 Unit Apartments | 0 (0.0%) | 17 (100.0%) |
| 10 or more Apartments | 0 (0.0%) | 0 (0.0%) |
| Mobile Home / Other | 0 (0.0%) | 0 (0.0%) |
| Total | 430 (51.6%) | 404 (48.4%) |
Housing Structures by Number of Rooms in Woodlynne borough
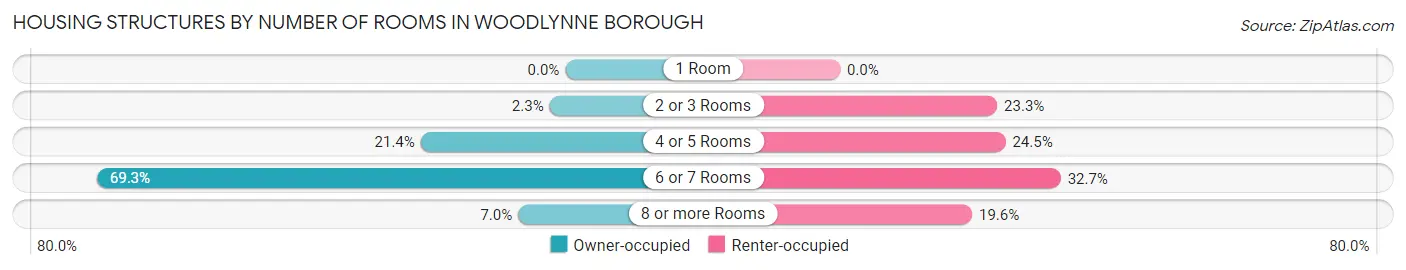
| Number of Rooms | Owner-occupied | Renter-occupied |
| 1 Room | 0 (0.0%) | 0 (0.0%) |
| 2 or 3 Rooms | 10 (2.3%) | 94 (23.3%) |
| 4 or 5 Rooms | 92 (21.4%) | 99 (24.5%) |
| 6 or 7 Rooms | 298 (69.3%) | 132 (32.7%) |
| 8 or more Rooms | 30 (7.0%) | 79 (19.6%) |
| Total | 430 (100.0%) | 404 (100.0%) |
Housing Structure by Heating Type in Woodlynne borough
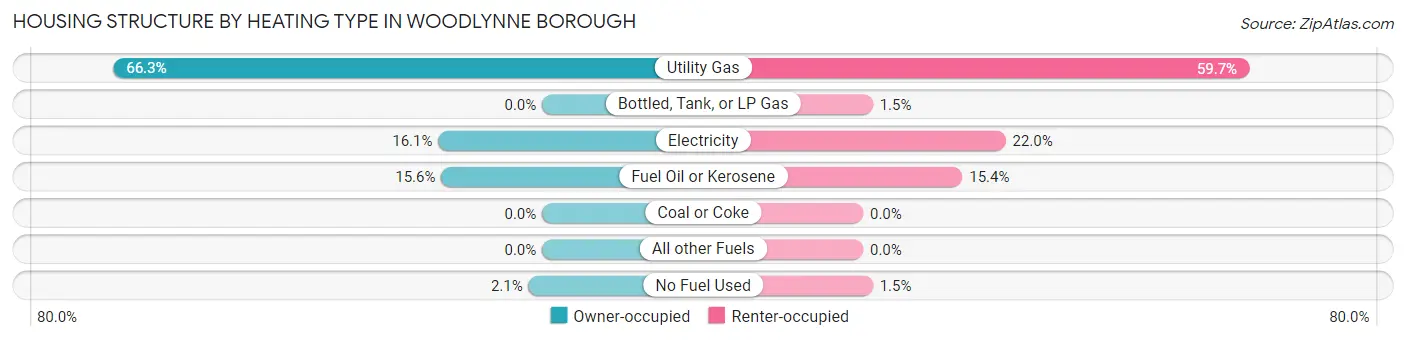
| Heating Type | Owner-occupied | Renter-occupied |
| Utility Gas | 285 (66.3%) | 241 (59.7%) |
| Bottled, Tank, or LP Gas | 0 (0.0%) | 6 (1.5%) |
| Electricity | 69 (16.1%) | 89 (22.0%) |
| Fuel Oil or Kerosene | 67 (15.6%) | 62 (15.3%) |
| Coal or Coke | 0 (0.0%) | 0 (0.0%) |
| All other Fuels | 0 (0.0%) | 0 (0.0%) |
| No Fuel Used | 9 (2.1%) | 6 (1.5%) |
| Total | 430 (100.0%) | 404 (100.0%) |
Household Vehicle Usage in Woodlynne borough
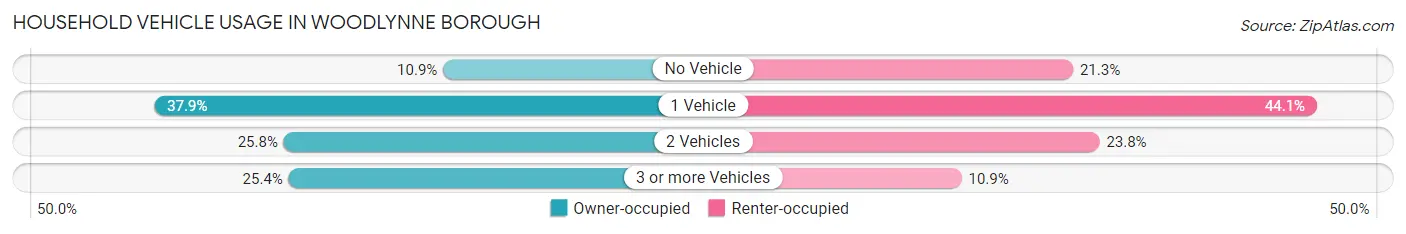
| Vehicles per Household | Owner-occupied | Renter-occupied |
| No Vehicle | 47 (10.9%) | 86 (21.3%) |
| 1 Vehicle | 163 (37.9%) | 178 (44.1%) |
| 2 Vehicles | 111 (25.8%) | 96 (23.8%) |
| 3 or more Vehicles | 109 (25.4%) | 44 (10.9%) |
| Total | 430 (100.0%) | 404 (100.0%) |
Real Estate & Mortgages in Woodlynne borough
Real Estate and Mortgage Overview in Woodlynne borough
| Characteristic | Without Mortgage | With Mortgage |
| Housing Units | 108 | 322 |
| Median Property Value | $97,000 | $119,200 |
| Median Household Income | $57,348 | $72 |
| Monthly Housing Costs | $753 | $10 |
| Real Estate Taxes | $4,719 | $0 |
Property Value by Mortgage Status in Woodlynne borough
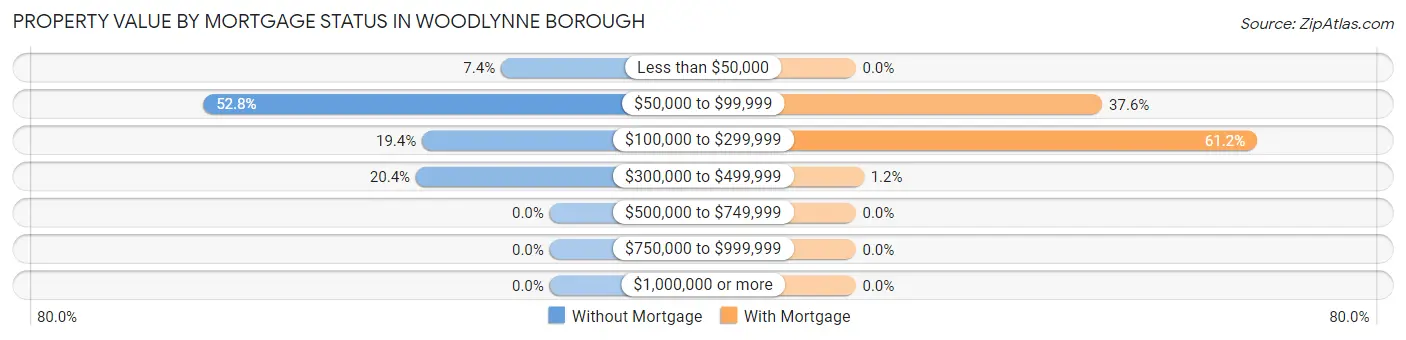
| Property Value | Without Mortgage | With Mortgage |
| Less than $50,000 | 8 (7.4%) | 0 (0.0%) |
| $50,000 to $99,999 | 57 (52.8%) | 121 (37.6%) |
| $100,000 to $299,999 | 21 (19.4%) | 197 (61.2%) |
| $300,000 to $499,999 | 22 (20.4%) | 4 (1.2%) |
| $500,000 to $749,999 | 0 (0.0%) | 0 (0.0%) |
| $750,000 to $999,999 | 0 (0.0%) | 0 (0.0%) |
| $1,000,000 or more | 0 (0.0%) | 0 (0.0%) |
| Total | 108 (100.0%) | 322 (100.0%) |
Household Income by Mortgage Status in Woodlynne borough
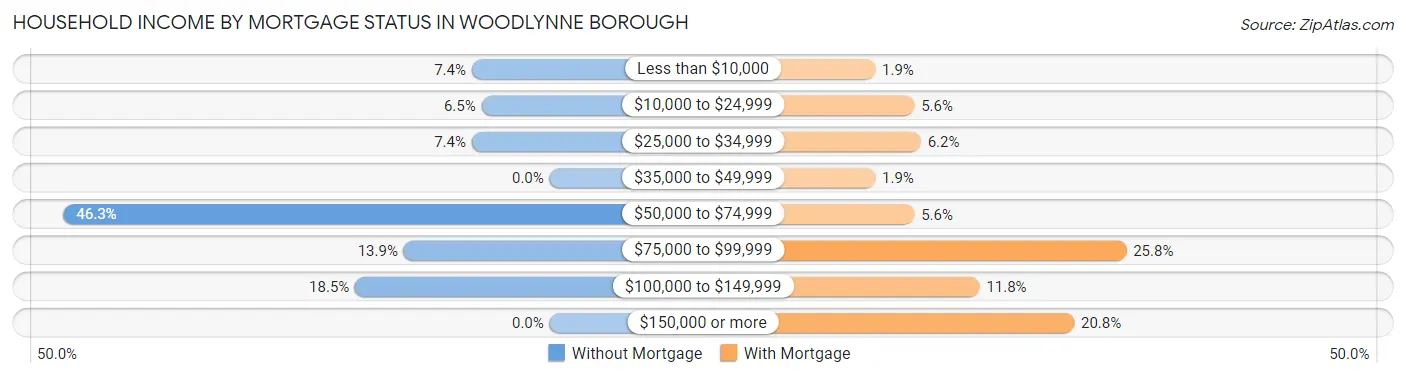
| Household Income | Without Mortgage | With Mortgage |
| Less than $10,000 | 8 (7.4%) | 6 (1.9%) |
| $10,000 to $24,999 | 7 (6.5%) | 18 (5.6%) |
| $25,000 to $34,999 | 8 (7.4%) | 20 (6.2%) |
| $35,000 to $49,999 | 0 (0.0%) | 6 (1.9%) |
| $50,000 to $74,999 | 50 (46.3%) | 18 (5.6%) |
| $75,000 to $99,999 | 15 (13.9%) | 83 (25.8%) |
| $100,000 to $149,999 | 20 (18.5%) | 38 (11.8%) |
| $150,000 or more | 0 (0.0%) | 67 (20.8%) |
| Total | 108 (100.0%) | 322 (100.0%) |
Property Value to Household Income Ratio in Woodlynne borough
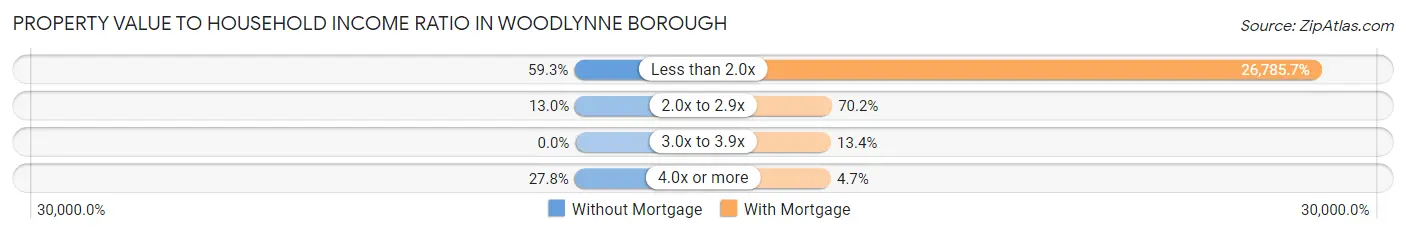
| Value-to-Income Ratio | Without Mortgage | With Mortgage |
| Less than 2.0x | 64 (59.3%) | 86,250 (26,785.7%) |
| 2.0x to 2.9x | 14 (13.0%) | 226 (70.2%) |
| 3.0x to 3.9x | 0 (0.0%) | 43 (13.4%) |
| 4.0x or more | 30 (27.8%) | 15 (4.7%) |
| Total | 108 (100.0%) | 322 (100.0%) |
Real Estate Taxes by Mortgage Status in Woodlynne borough
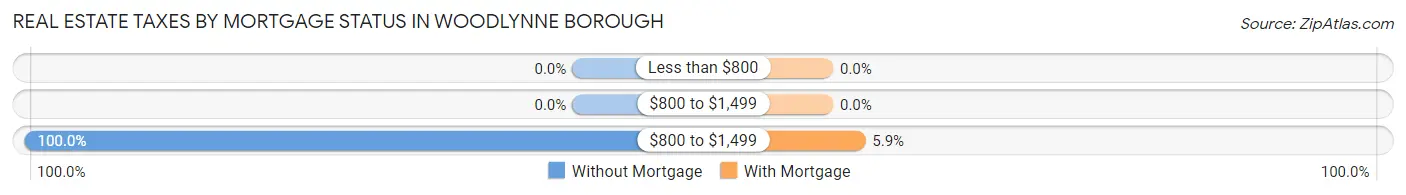
| Property Taxes | Without Mortgage | With Mortgage |
| Less than $800 | 0 (0.0%) | 0 (0.0%) |
| $800 to $1,499 | 0 (0.0%) | 0 (0.0%) |
| $800 to $1,499 | 108 (100.0%) | 19 (5.9%) |
| Total | 108 (100.0%) | 322 (100.0%) |
Health & Disability in Woodlynne borough
Health Insurance Coverage by Age in Woodlynne borough
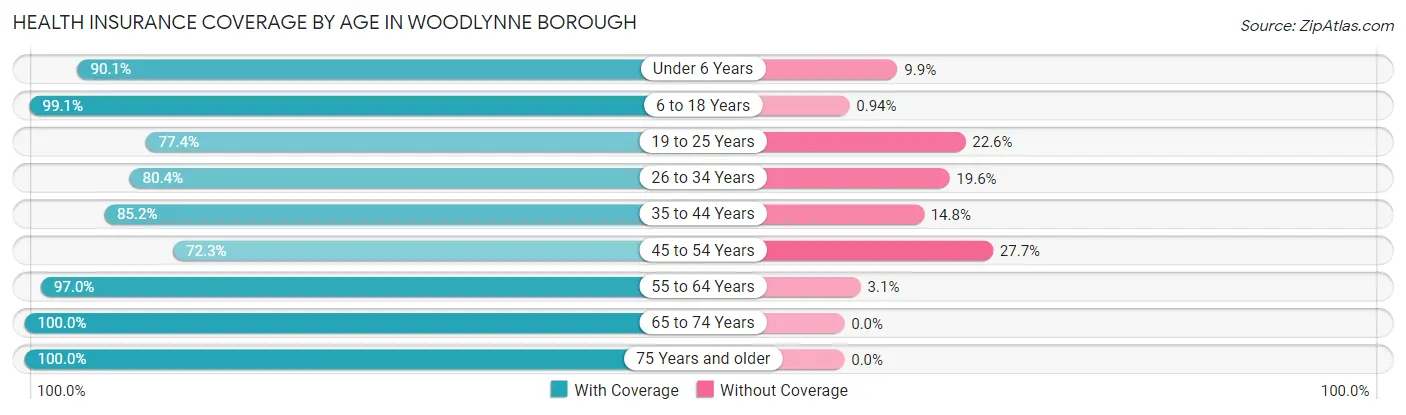
| Age Bracket | With Coverage | Without Coverage |
| Under 6 Years | 182 (90.1%) | 20 (9.9%) |
| 6 to 18 Years | 734 (99.1%) | 7 (0.9%) |
| 19 to 25 Years | 216 (77.4%) | 63 (22.6%) |
| 26 to 34 Years | 283 (80.4%) | 69 (19.6%) |
| 35 to 44 Years | 345 (85.2%) | 60 (14.8%) |
| 45 to 54 Years | 287 (72.3%) | 110 (27.7%) |
| 55 to 64 Years | 286 (97.0%) | 9 (3.0%) |
| 65 to 74 Years | 148 (100.0%) | 0 (0.0%) |
| 75 Years and older | 85 (100.0%) | 0 (0.0%) |
| Total | 2,566 (88.4%) | 338 (11.6%) |
Health Insurance Coverage by Citizenship Status in Woodlynne borough
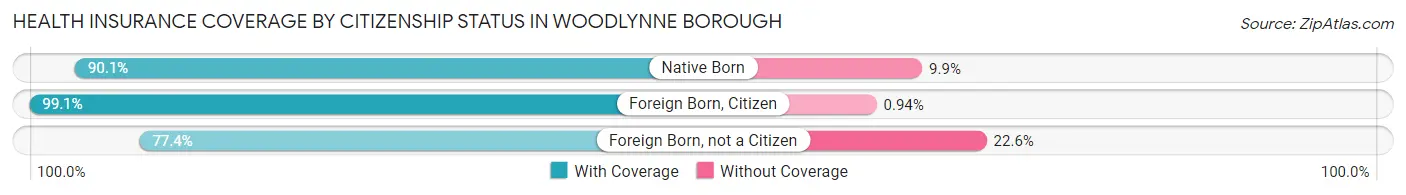
| Citizenship Status | With Coverage | Without Coverage |
| Native Born | 182 (90.1%) | 20 (9.9%) |
| Foreign Born, Citizen | 734 (99.1%) | 7 (0.9%) |
| Foreign Born, not a Citizen | 216 (77.4%) | 63 (22.6%) |
Health Insurance Coverage by Household Income in Woodlynne borough
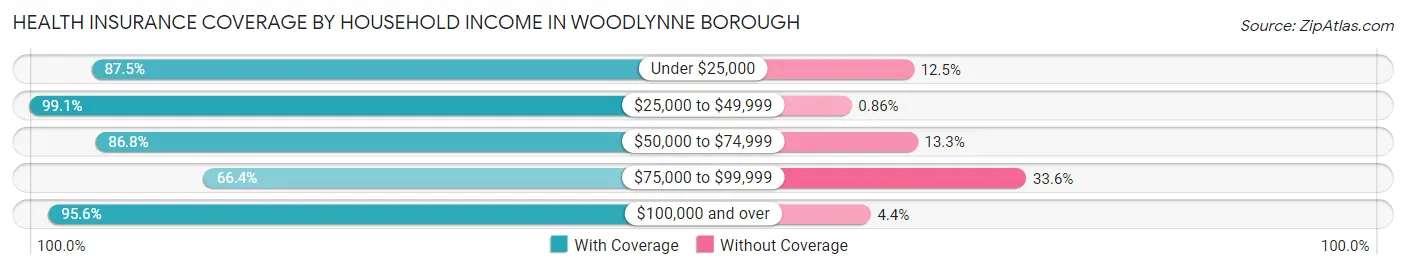
| Household Income | With Coverage | Without Coverage |
| Under $25,000 | 265 (87.5%) | 38 (12.5%) |
| $25,000 to $49,999 | 462 (99.1%) | 4 (0.9%) |
| $50,000 to $74,999 | 537 (86.8%) | 82 (13.3%) |
| $75,000 to $99,999 | 334 (66.4%) | 169 (33.6%) |
| $100,000 and over | 968 (95.6%) | 45 (4.4%) |
Public vs Private Health Insurance Coverage by Age in Woodlynne borough
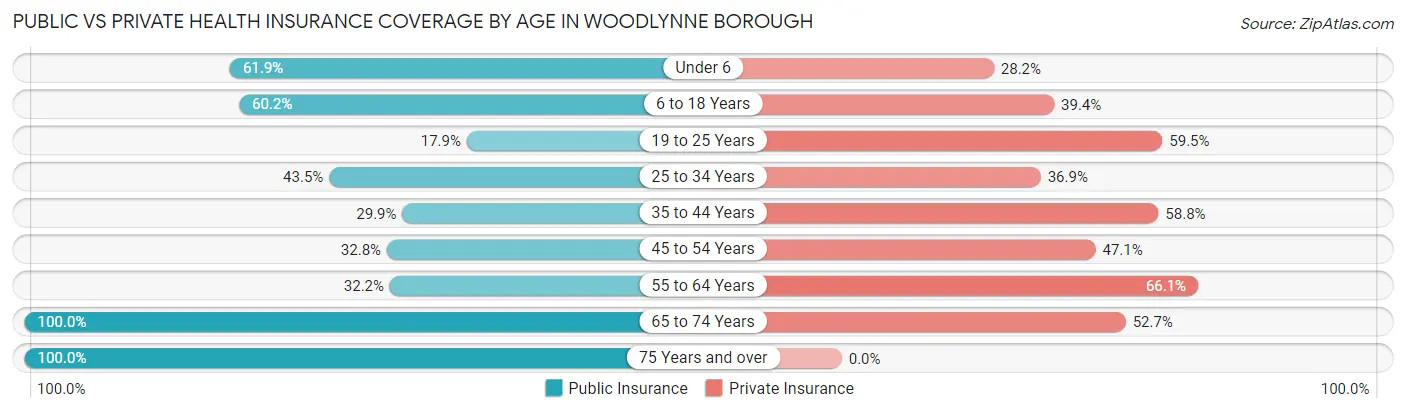
| Age Bracket | Public Insurance | Private Insurance |
| Under 6 | 125 (61.9%) | 57 (28.2%) |
| 6 to 18 Years | 446 (60.2%) | 292 (39.4%) |
| 19 to 25 Years | 50 (17.9%) | 166 (59.5%) |
| 25 to 34 Years | 153 (43.5%) | 130 (36.9%) |
| 35 to 44 Years | 121 (29.9%) | 238 (58.8%) |
| 45 to 54 Years | 130 (32.8%) | 187 (47.1%) |
| 55 to 64 Years | 95 (32.2%) | 195 (66.1%) |
| 65 to 74 Years | 148 (100.0%) | 78 (52.7%) |
| 75 Years and over | 85 (100.0%) | 0 (0.0%) |
| Total | 1,353 (46.6%) | 1,343 (46.3%) |
Disability Status by Sex by Age in Woodlynne borough
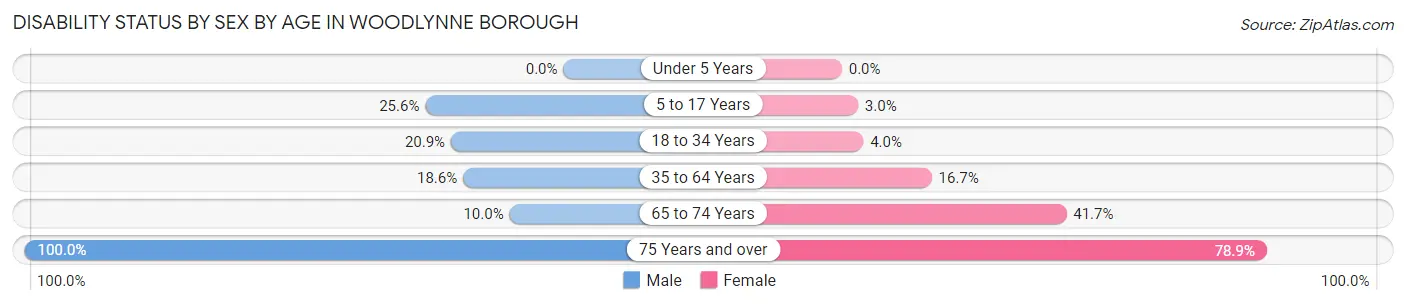
| Age Bracket | Male | Female |
| Under 5 Years | 0 (0.0%) | 0 (0.0%) |
| 5 to 17 Years | 80 (25.6%) | 12 (3.0%) |
| 18 to 34 Years | 87 (20.9%) | 10 (4.0%) |
| 35 to 64 Years | 97 (18.6%) | 96 (16.7%) |
| 65 to 74 Years | 10 (10.0%) | 20 (41.7%) |
| 75 Years and over | 14 (100.0%) | 56 (78.9%) |
Disability Class by Sex by Age in Woodlynne borough
Disability Class: Hearing Difficulty
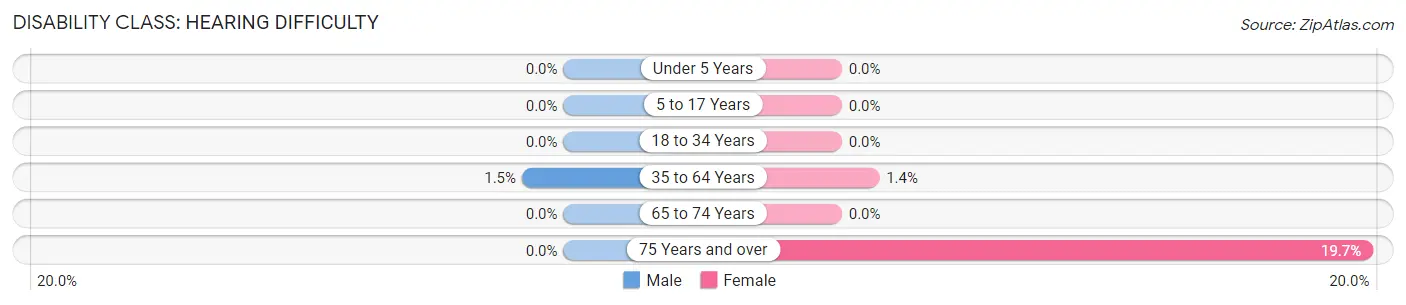
| Age Bracket | Male | Female |
| Under 5 Years | 0 (0.0%) | 0 (0.0%) |
| 5 to 17 Years | 0 (0.0%) | 0 (0.0%) |
| 18 to 34 Years | 0 (0.0%) | 0 (0.0%) |
| 35 to 64 Years | 8 (1.5%) | 8 (1.4%) |
| 65 to 74 Years | 0 (0.0%) | 0 (0.0%) |
| 75 Years and over | 0 (0.0%) | 14 (19.7%) |
Disability Class: Vision Difficulty
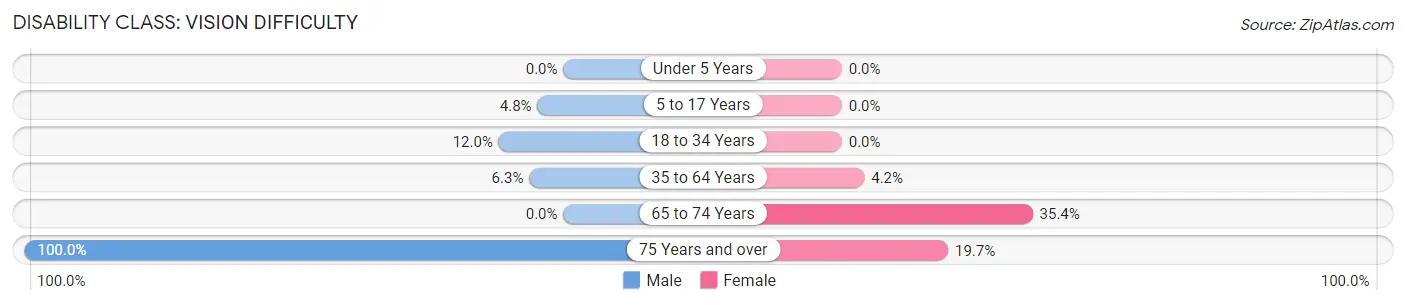
| Age Bracket | Male | Female |
| Under 5 Years | 0 (0.0%) | 0 (0.0%) |
| 5 to 17 Years | 15 (4.8%) | 0 (0.0%) |
| 18 to 34 Years | 50 (12.0%) | 0 (0.0%) |
| 35 to 64 Years | 33 (6.3%) | 24 (4.2%) |
| 65 to 74 Years | 0 (0.0%) | 17 (35.4%) |
| 75 Years and over | 14 (100.0%) | 14 (19.7%) |
Disability Class: Cognitive Difficulty
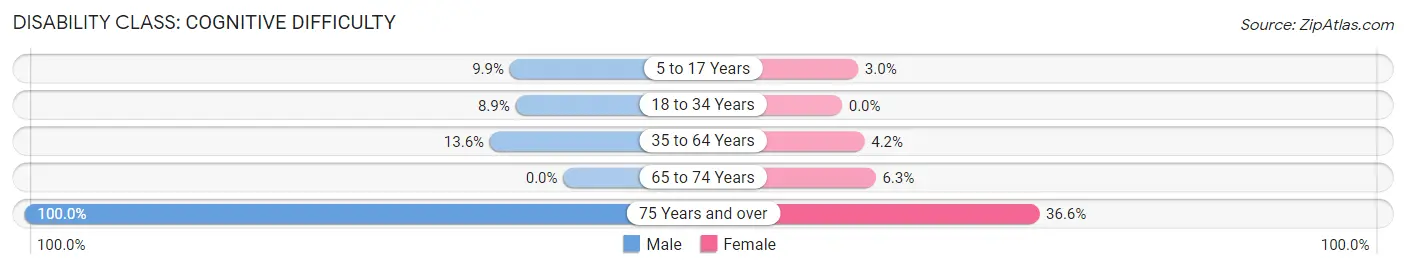
| Age Bracket | Male | Female |
| 5 to 17 Years | 31 (9.9%) | 12 (3.0%) |
| 18 to 34 Years | 37 (8.9%) | 0 (0.0%) |
| 35 to 64 Years | 71 (13.6%) | 24 (4.2%) |
| 65 to 74 Years | 0 (0.0%) | 3 (6.2%) |
| 75 Years and over | 14 (100.0%) | 26 (36.6%) |
Disability Class: Ambulatory Difficulty
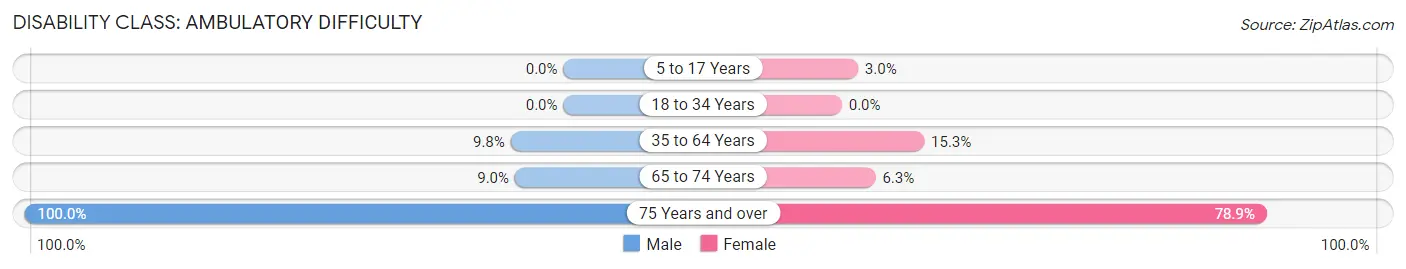
| Age Bracket | Male | Female |
| 5 to 17 Years | 0 (0.0%) | 12 (3.0%) |
| 18 to 34 Years | 0 (0.0%) | 0 (0.0%) |
| 35 to 64 Years | 51 (9.8%) | 88 (15.3%) |
| 65 to 74 Years | 9 (9.0%) | 3 (6.2%) |
| 75 Years and over | 14 (100.0%) | 56 (78.9%) |
Disability Class: Self-Care Difficulty
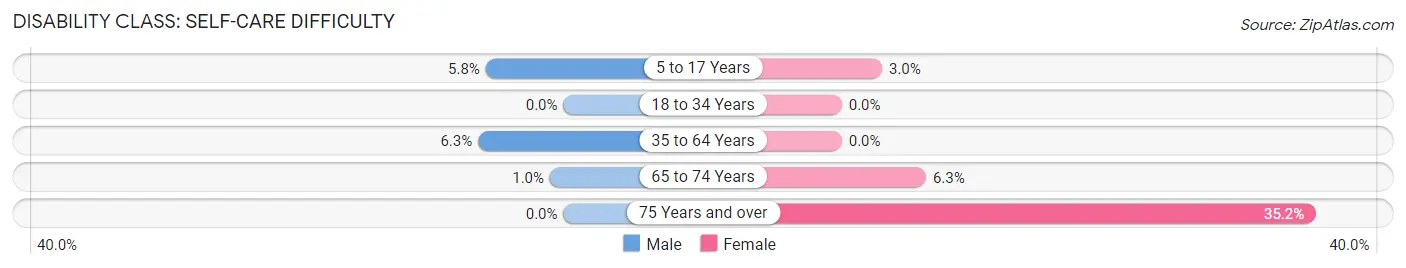
| Age Bracket | Male | Female |
| 5 to 17 Years | 18 (5.8%) | 12 (3.0%) |
| 18 to 34 Years | 0 (0.0%) | 0 (0.0%) |
| 35 to 64 Years | 33 (6.3%) | 0 (0.0%) |
| 65 to 74 Years | 1 (1.0%) | 3 (6.2%) |
| 75 Years and over | 0 (0.0%) | 25 (35.2%) |
Technology Access in Woodlynne borough
Computing Device Access in Woodlynne borough
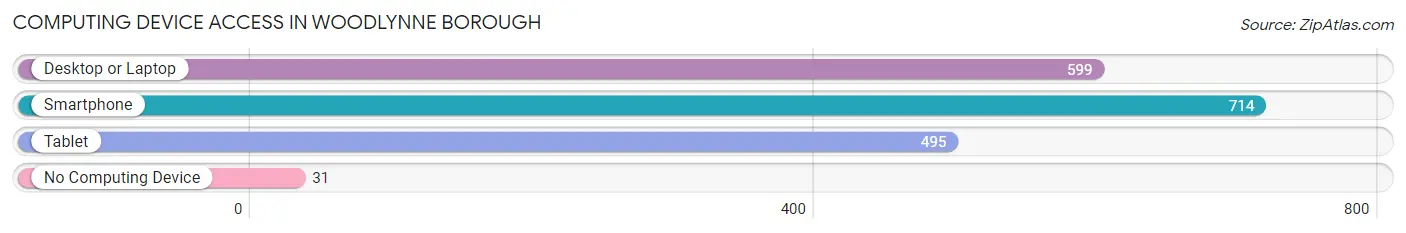
| Device Type | # Households | % Households |
| Desktop or Laptop | 599 | 71.8% |
| Smartphone | 714 | 85.6% |
| Tablet | 495 | 59.4% |
| No Computing Device | 31 | 3.7% |
| Total | 834 | 100.0% |
Internet Access in Woodlynne borough
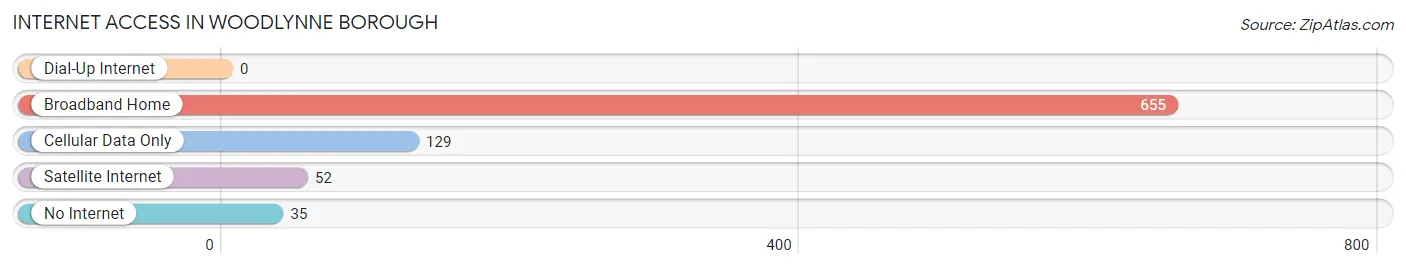
| Internet Type | # Households | % Households |
| Dial-Up Internet | 0 | 0.0% |
| Broadband Home | 655 | 78.5% |
| Cellular Data Only | 129 | 15.5% |
| Satellite Internet | 52 | 6.2% |
| No Internet | 35 | 4.2% |
| Total | 834 | 100.0% |
Woodlynne borough Summary
Woodlynne Borough is a small borough located in Camden County, New Jersey. It is bordered by the City of Camden to the north, Collingswood to the east, Haddon Township to the south, and Oaklyn to the west. The borough was incorporated in 1929 and is home to approximately 2,000 residents.
Geography
Woodlynne Borough is located in the Delaware Valley region of New Jersey. It is situated on the east side of the Cooper River, just south of the City of Camden. The borough is approximately 1.2 square miles in size and is made up of mostly residential neighborhoods. The terrain is mostly flat, with some hills in the northern part of the borough. The Cooper River forms the northern border of the borough and is a popular spot for fishing and boating.
Climate
Woodlynne Borough has a humid subtropical climate, with hot, humid summers and cold, wet winters. The average temperature in the summer is around 80 degrees Fahrenheit, while the average temperature in the winter is around 40 degrees Fahrenheit. The borough receives an average of 45 inches of precipitation per year, with most of it falling in the form of rain.
Demographics
As of the 2010 census, Woodlynne Borough had a population of 2,037 people. The racial makeup of the borough was 57.2% White, 33.2% African American, 0.3% Native American, 1.2% Asian, and 8.1% from other races. The median household income was $41,944, and the median family income was $50,938.
Economy
Woodlynne Borough has a small, but vibrant economy. The borough is home to several small businesses, including restaurants, retail stores, and professional services. The borough also has a few industrial parks, which provide jobs for many of the borough's residents. The largest employer in the borough is the Camden County Board of Education, which employs over 500 people.
Education
Woodlynne Borough is served by the Camden County Board of Education. The borough has two public schools, Woodlynne Elementary School and Woodlynne Middle School. The borough also has a private school, St. Joseph's Catholic School.
Conclusion
Woodlynne Borough is a small borough located in Camden County, New Jersey. It is bordered by the City of Camden to the north, Collingswood to the east, Haddon Township to the south, and Oaklyn to the west. The borough has a population of 2,037 people and is home to several small businesses. The borough is served by the Camden County Board of Education and has two public schools and one private school. Woodlynne Borough has a small, but vibrant economy and is a great place to live and work.
Common Questions
What is the Total Population of Woodlynne borough?
Total Population of Woodlynne borough is 2,904.
What is the Total Male Population of Woodlynne borough?
Total Male Population of Woodlynne borough is 1,495.
What is the Total Female Population of Woodlynne borough?
Total Female Population of Woodlynne borough is 1,409.
What is the Ratio of Males per 100 Females in Woodlynne borough?
There are 106.10 Males per 100 Females in Woodlynne borough.
What is the Ratio of Females per 100 Males in Woodlynne borough?
There are 94.25 Females per 100 Males in Woodlynne borough.
What is the Median Population Age in Woodlynne borough?
Median Population Age in Woodlynne borough is 32.7 Years.
What is the Average Family Size in Woodlynne borough
Average Family Size in Woodlynne borough is 3.8 People.
What is the Average Household Size in Woodlynne borough
Average Household Size in Woodlynne borough is 3.5 People.
What is Per Capita Income in Woodlynne borough?
Per Capita income in Woodlynne borough is $23,156.
What is the Median Family Income in Woodlynne borough?
Median Family Income in Woodlynne borough is $64,750.
What is the Median Household income in Woodlynne borough?
Median Household Income in Woodlynne borough is $68,125.
What is Income or Wage Gap in Woodlynne borough?
Income or Wage Gap in Woodlynne borough is 12.4%.
Women in Woodlynne borough earn 87.6 cents for every dollar earned by a man.
What is Inequality or Gini Index in Woodlynne borough?
Inequality or Gini Index in Woodlynne borough is 0.38.
How Large is the Labor Force in Woodlynne borough?
There are 1,455 People in the Labor Forcein in Woodlynne borough.
What is the Percentage of People in the Labor Force in Woodlynne borough?
69.6% of People are in the Labor Force in Woodlynne borough.
What is the Unemployment Rate in Woodlynne borough?
Unemployment Rate in Woodlynne borough is 10.4%.