Beachwood borough, NJ
Beachwood borough Overview
10,933
TOTAL POPULATION
5,344
MALE POPULATION
5,589
FEMALE POPULATION
95.62
MALES / 100 FEMALES
104.58
FEMALES / 100 MALES
42.1
MEDIAN AGE
3.1
AVG FAMILY SIZE
2.8
AVG HOUSEHOLD SIZE
$47,686
PER CAPITA INCOME
$110,114
AVG FAMILY INCOME
$99,099
AVG HOUSEHOLD INCOME
29.6%
WAGE / INCOME GAP [ % ]
70.4¢/ $1
WAGE / INCOME GAP [ $ ]
0.40
INEQUALITY / GINI INDEX
6,415
LABOR FORCE [ PEOPLE ]
71.5%
PERCENT IN LABOR FORCE
4.2%
UNEMPLOYMENT RATE
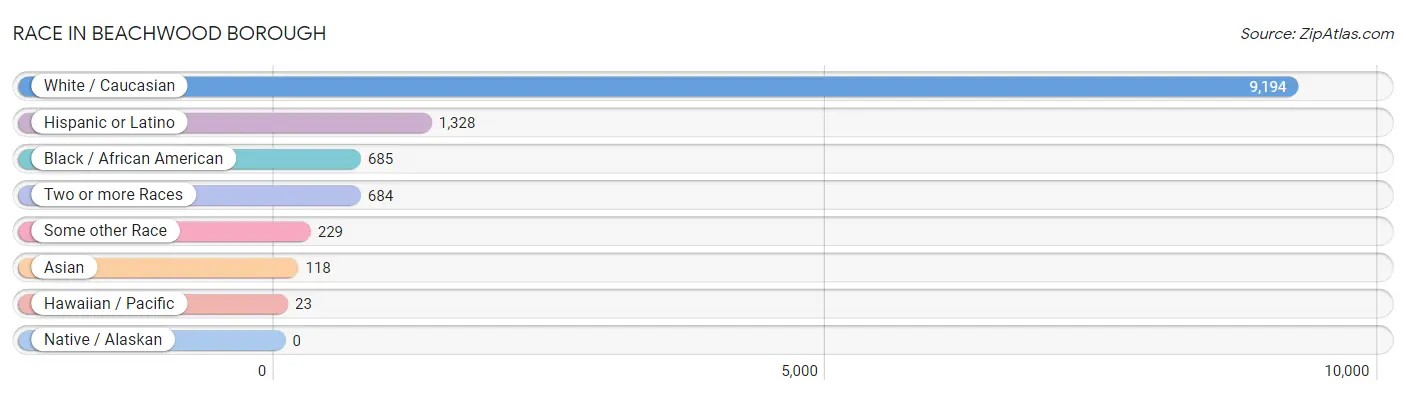
Race in Beachwood borough
The most populous races in Beachwood borough are White / Caucasian (9,194 | 84.1%), Hispanic or Latino (1,328 | 12.1%), and Black / African American (685 | 6.3%).
| Race | # Population | % Population |
| Asian | 118 | 1.1% |
| Black / African American | 685 | 6.3% |
| Hawaiian / Pacific | 23 | 0.2% |
| Hispanic or Latino | 1,328 | 12.1% |
| Native / Alaskan | 0 | 0.0% |
| White / Caucasian | 9,194 | 84.1% |
| Two or more Races | 684 | 6.3% |
| Some other Race | 229 | 2.1% |
| Total | 10,933 | 100.0% |
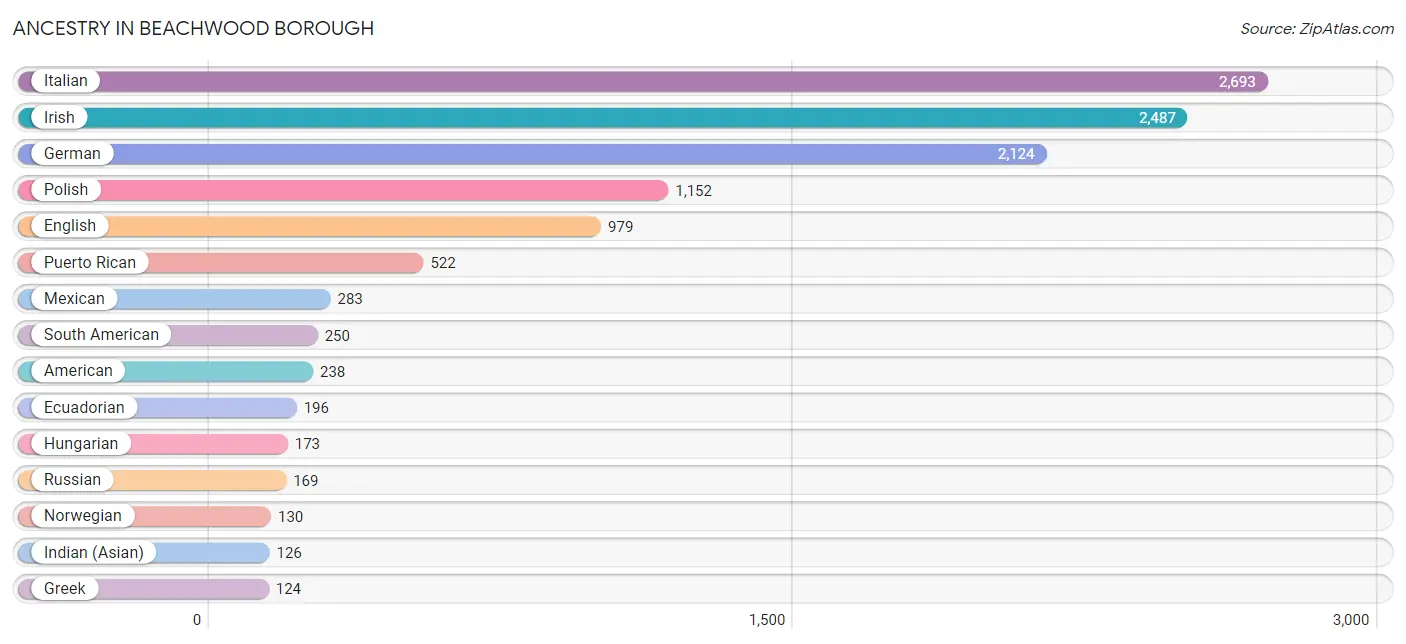
Ancestry in Beachwood borough
The most populous ancestries reported in Beachwood borough are Italian (2,693 | 24.6%), Irish (2,487 | 22.8%), German (2,124 | 19.4%), Polish (1,152 | 10.5%), and English (979 | 8.9%), together accounting for 86.3% of all Beachwood borough residents.
| Ancestry | # Population | % Population |
| African | 54 | 0.5% |
| American | 238 | 2.2% |
| Arab | 27 | 0.3% |
| Armenian | 19 | 0.2% |
| Austrian | 43 | 0.4% |
| British | 90 | 0.8% |
| Burmese | 14 | 0.1% |
| Central American | 72 | 0.7% |
| Cherokee | 12 | 0.1% |
| Colombian | 40 | 0.4% |
| Cuban | 103 | 0.9% |
| Czech | 22 | 0.2% |
| Czechoslovakian | 20 | 0.2% |
| Danish | 49 | 0.4% |
| Dominican | 74 | 0.7% |
| Dutch | 85 | 0.8% |
| Eastern European | 38 | 0.4% |
| Ecuadorian | 196 | 1.8% |
| Egyptian | 11 | 0.1% |
| English | 979 | 8.9% |
| European | 54 | 0.5% |
| Finnish | 11 | 0.1% |
| French | 99 | 0.9% |
| French Canadian | 10 | 0.1% |
| German | 2,124 | 19.4% |
| Greek | 124 | 1.1% |
| Guatemalan | 72 | 0.7% |
| Haitian | 35 | 0.3% |
| Hungarian | 173 | 1.6% |
| Indian (Asian) | 126 | 1.1% |
| Iranian | 13 | 0.1% |
| Irish | 2,487 | 22.8% |
| Israeli | 13 | 0.1% |
| Italian | 2,693 | 24.6% |
| Latvian | 39 | 0.4% |
| Lithuanian | 11 | 0.1% |
| Mexican | 283 | 2.6% |
| Mongolian | 33 | 0.3% |
| Native Hawaiian | 11 | 0.1% |
| Norwegian | 130 | 1.2% |
| Pennsylvania German | 9 | 0.1% |
| Peruvian | 14 | 0.1% |
| Polish | 1,152 | 10.5% |
| Portuguese | 69 | 0.6% |
| Puerto Rican | 522 | 4.8% |
| Russian | 169 | 1.5% |
| Samoan | 12 | 0.1% |
| Scandinavian | 55 | 0.5% |
| Scotch-Irish | 123 | 1.1% |
| Scottish | 105 | 1.0% |
| Serbian | 8 | 0.1% |
| Slavic | 12 | 0.1% |
| Slovak | 36 | 0.3% |
| Slovene | 1 | 0.0% |
| South American | 250 | 2.3% |
| Spanish | 21 | 0.2% |
| Subsaharan African | 54 | 0.5% |
| Swedish | 113 | 1.0% |
| Thai | 40 | 0.4% |
| Ukrainian | 59 | 0.5% |
| Welsh | 11 | 0.1% | View All 61 Rows |
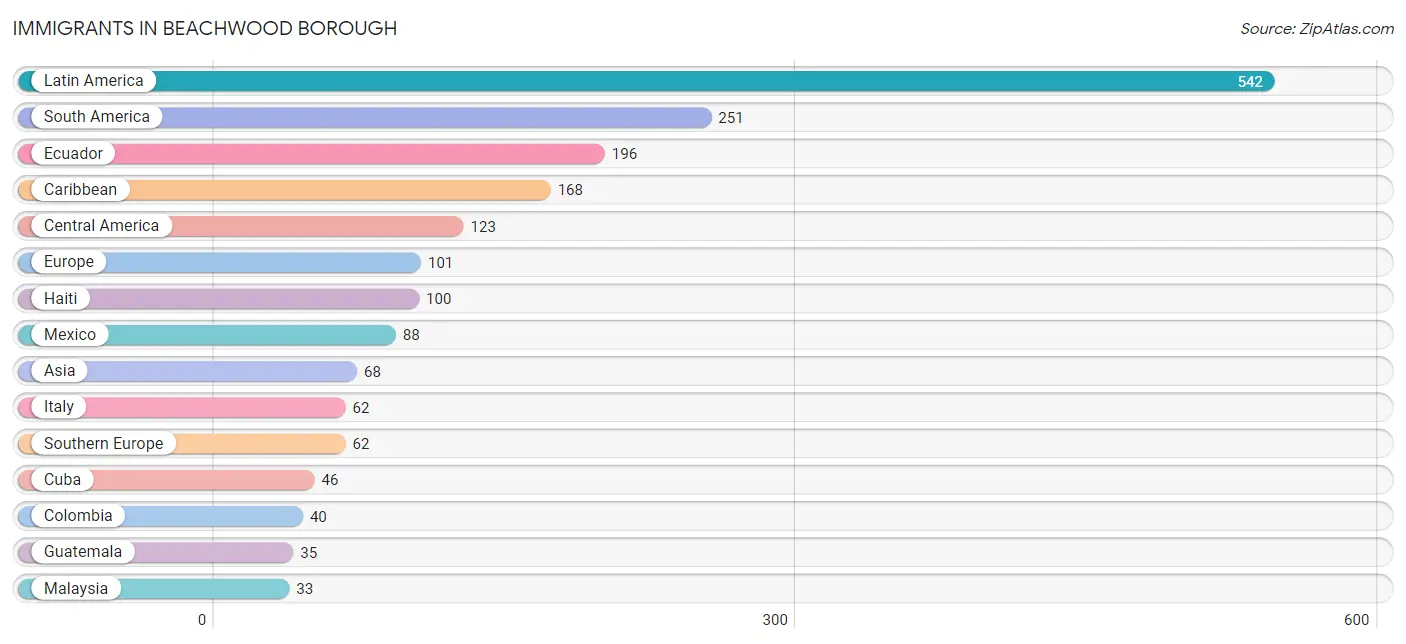
Immigrants in Beachwood borough
The most numerous immigrant groups reported in Beachwood borough came from Latin America (542 | 5.0%), South America (251 | 2.3%), Ecuador (196 | 1.8%), Caribbean (168 | 1.5%), and Central America (123 | 1.1%), together accounting for 11.7% of all Beachwood borough residents.
| Immigration Origin | # Population | % Population |
| Asia | 68 | 0.6% |
| Caribbean | 168 | 1.5% |
| Central America | 123 | 1.1% |
| China | 14 | 0.1% |
| Colombia | 40 | 0.4% |
| Cuba | 46 | 0.4% |
| Dominican Republic | 22 | 0.2% |
| Eastern Asia | 22 | 0.2% |
| Eastern Europe | 14 | 0.1% |
| Ecuador | 196 | 1.8% |
| England | 10 | 0.1% |
| Europe | 101 | 0.9% |
| Germany | 11 | 0.1% |
| Guatemala | 35 | 0.3% |
| Guyana | 15 | 0.1% |
| Haiti | 100 | 0.9% |
| India | 7 | 0.1% |
| Ireland | 4 | 0.0% |
| Italy | 62 | 0.6% |
| Japan | 8 | 0.1% |
| Latin America | 542 | 5.0% |
| Malaysia | 33 | 0.3% |
| Mexico | 88 | 0.8% |
| Northern Europe | 14 | 0.1% |
| Russia | 14 | 0.1% |
| South America | 251 | 2.3% |
| South Central Asia | 13 | 0.1% |
| South Eastern Asia | 33 | 0.3% |
| Southern Europe | 62 | 0.6% |
| Uzbekistan | 6 | 0.1% |
| Western Europe | 11 | 0.1% | View All 31 Rows |
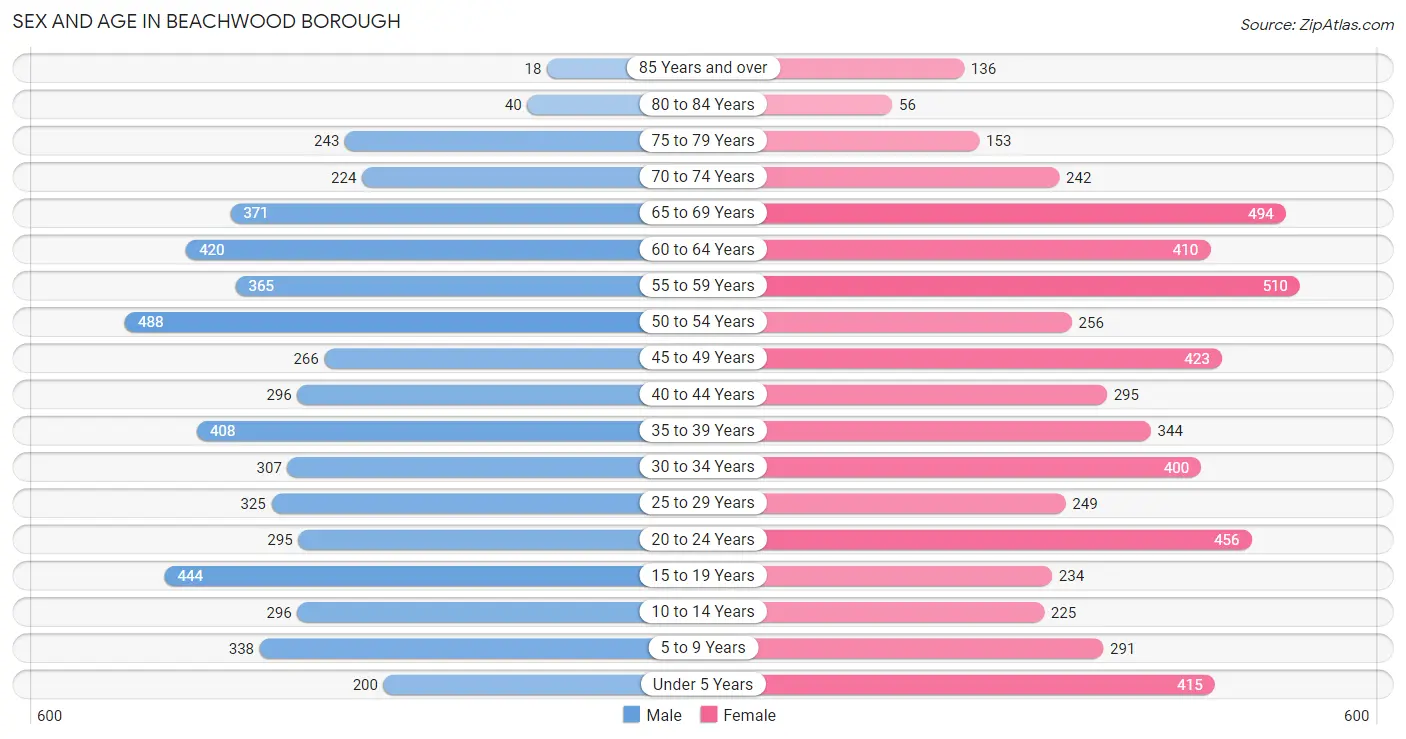
Sex and Age in Beachwood borough
Sex and Age in Beachwood borough
The most populous age groups in Beachwood borough are 50 to 54 Years (488 | 9.1%) for men and 55 to 59 Years (510 | 9.1%) for women.
| Age Bracket | Male | Female |
| Under 5 Years | 200 (3.7%) | 415 (7.4%) |
| 5 to 9 Years | 338 (6.3%) | 291 (5.2%) |
| 10 to 14 Years | 296 (5.5%) | 225 (4.0%) |
| 15 to 19 Years | 444 (8.3%) | 234 (4.2%) |
| 20 to 24 Years | 295 (5.5%) | 456 (8.2%) |
| 25 to 29 Years | 325 (6.1%) | 249 (4.5%) |
| 30 to 34 Years | 307 (5.7%) | 400 (7.2%) |
| 35 to 39 Years | 408 (7.6%) | 344 (6.1%) |
| 40 to 44 Years | 296 (5.5%) | 295 (5.3%) |
| 45 to 49 Years | 266 (5.0%) | 423 (7.6%) |
| 50 to 54 Years | 488 (9.1%) | 256 (4.6%) |
| 55 to 59 Years | 365 (6.8%) | 510 (9.1%) |
| 60 to 64 Years | 420 (7.9%) | 410 (7.3%) |
| 65 to 69 Years | 371 (6.9%) | 494 (8.8%) |
| 70 to 74 Years | 224 (4.2%) | 242 (4.3%) |
| 75 to 79 Years | 243 (4.5%) | 153 (2.7%) |
| 80 to 84 Years | 40 (0.7%) | 56 (1.0%) |
| 85 Years and over | 18 (0.3%) | 136 (2.4%) |
| Total | 5,344 (100.0%) | 5,589 (100.0%) |
Families and Households in Beachwood borough
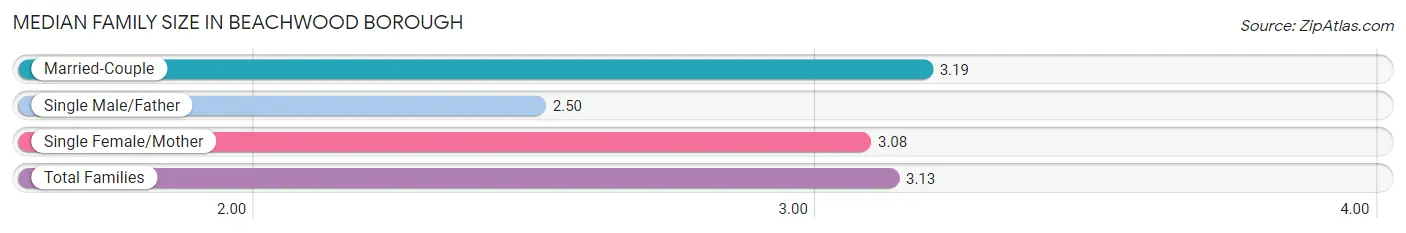
Median Family Size in Beachwood borough
The median family size in Beachwood borough is 3.13 persons per family, with married-couple families (2,261 | 75.0%) accounting for the largest median family size of 3.19 persons per family. On the other hand, single male/father families (159 | 5.3%) represent the smallest median family size with 2.50 persons per family.
| Family Type | # Families | Family Size |
| Married-Couple | 2,261 (75.0%) | 3.19 |
| Single Male/Father | 159 (5.3%) | 2.50 |
| Single Female/Mother | 593 (19.7%) | 3.08 |
| Total Families | 3,013 (100.0%) | 3.13 |
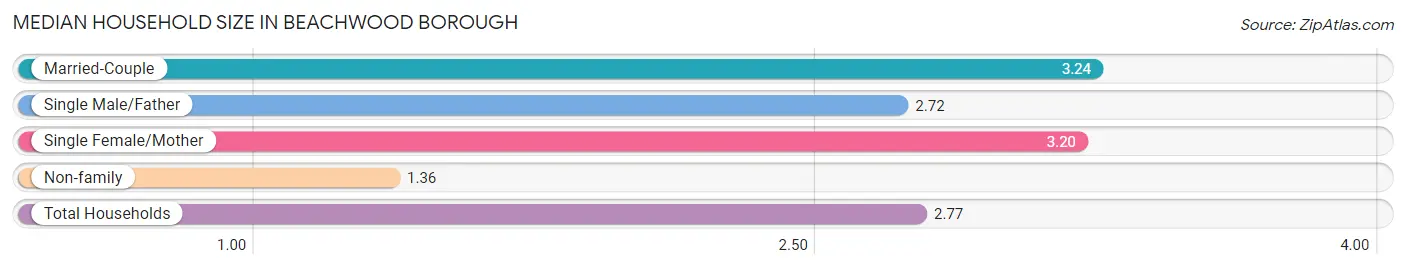
Median Household Size in Beachwood borough
The median household size in Beachwood borough is 2.77 persons per household, with married-couple households (2,261 | 57.5%) accounting for the largest median household size of 3.24 persons per household. non-family households (922 | 23.4%) represent the smallest median household size with 1.36 persons per household.
| Household Type | # Households | Household Size |
| Married-Couple | 2,261 (57.5%) | 3.24 |
| Single Male/Father | 159 (4.0%) | 2.72 |
| Single Female/Mother | 593 (15.1%) | 3.20 |
| Non-family | 922 (23.4%) | 1.36 |
| Total Households | 3,935 (100.0%) | 2.77 |
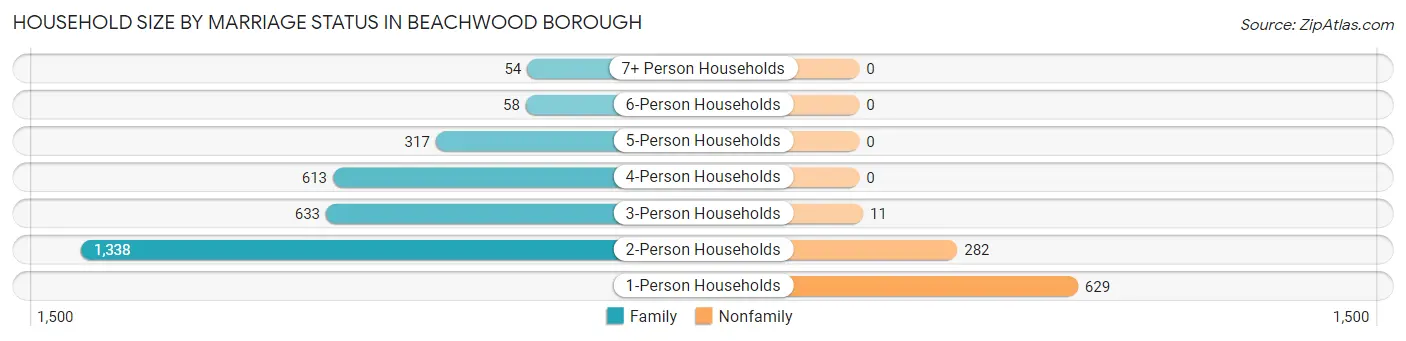
Household Size by Marriage Status in Beachwood borough
Out of a total of 3,935 households in Beachwood borough, 3,013 (76.6%) are family households, while 922 (23.4%) are nonfamily households. The most numerous type of family households are 2-person households, comprising 1,338, and the most common type of nonfamily households are 1-person households, comprising 629.
| Household Size | Family Households | Nonfamily Households |
| 1-Person Households | - | 629 (16.0%) |
| 2-Person Households | 1,338 (34.0%) | 282 (7.2%) |
| 3-Person Households | 633 (16.1%) | 11 (0.3%) |
| 4-Person Households | 613 (15.6%) | 0 (0.0%) |
| 5-Person Households | 317 (8.1%) | 0 (0.0%) |
| 6-Person Households | 58 (1.5%) | 0 (0.0%) |
| 7+ Person Households | 54 (1.4%) | 0 (0.0%) |
| Total | 3,013 (76.6%) | 922 (23.4%) |
Female Fertility in Beachwood borough
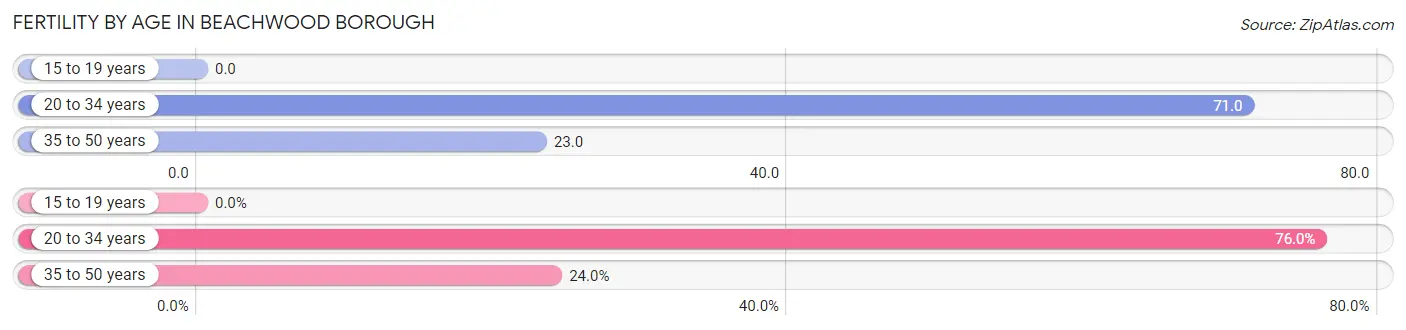
Fertility by Age in Beachwood borough
Average fertility rate in Beachwood borough is 43.0 births per 1,000 women. Women in the age bracket of 20 to 34 years have the highest fertility rate with 71.0 births per 1,000 women. Women in the age bracket of 20 to 34 years acount for 76.0% of all women with births.
| Age Bracket | Women with Births | Births / 1,000 Women |
| 15 to 19 years | 0 (0.0%) | 0.0 |
| 20 to 34 years | 79 (76.0%) | 71.0 |
| 35 to 50 years | 25 (24.0%) | 23.0 |
| Total | 104 (100.0%) | 43.0 |
Fertility by Age by Marriage Status in Beachwood borough
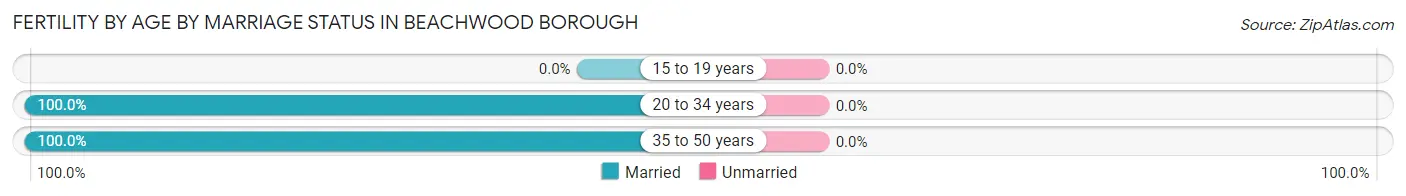
| Age Bracket | Married | Unmarried |
| 15 to 19 years | 0 (0.0%) | 0 (0.0%) |
| 20 to 34 years | 79 (100.0%) | 0 (0.0%) |
| 35 to 50 years | 25 (100.0%) | 0 (0.0%) |
| Total | 104 (100.0%) | 0 (0.0%) |
Fertility by Education in Beachwood borough
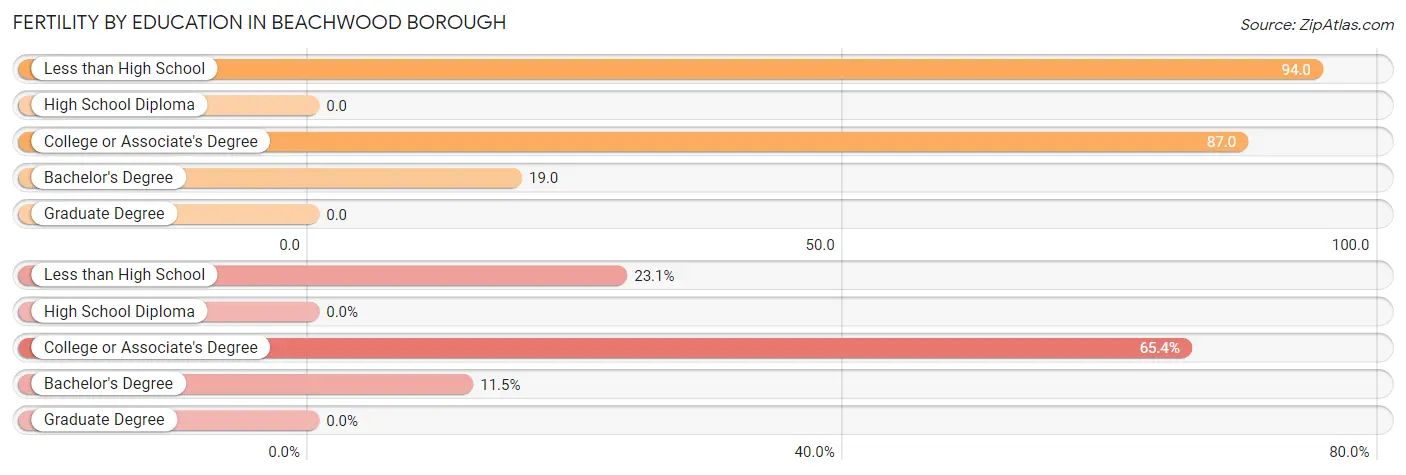
| Educational Attainment | Women with Births | Births / 1,000 Women |
| Less than High School | 24 (23.1%) | 94.0 |
| High School Diploma | 0 (0.0%) | 0.0 |
| College or Associate's Degree | 68 (65.4%) | 87.0 |
| Bachelor's Degree | 12 (11.5%) | 19.0 |
| Graduate Degree | 0 (0.0%) | 0.0 |
| Total | 104 (100.0%) | 43.0 |
Fertility by Education by Marriage Status in Beachwood borough
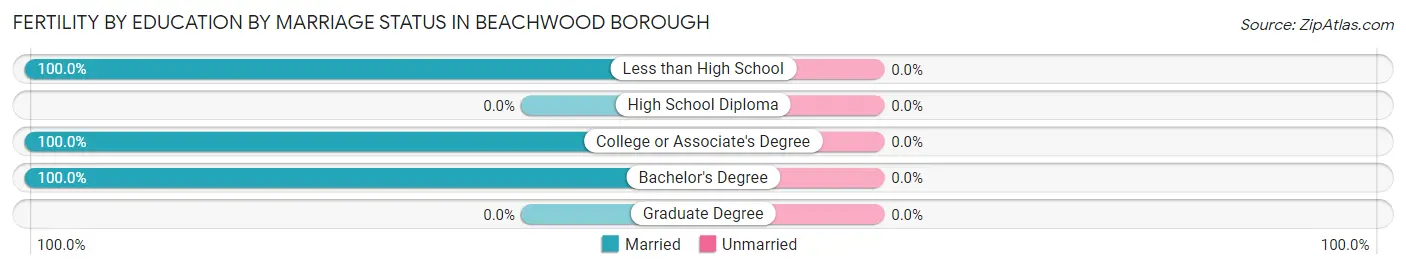
| Educational Attainment | Married | Unmarried |
| Less than High School | 24 (100.0%) | 0 (0.0%) |
| High School Diploma | 0 (0.0%) | 0 (0.0%) |
| College or Associate's Degree | 68 (100.0%) | 0 (0.0%) |
| Bachelor's Degree | 12 (100.0%) | 0 (0.0%) |
| Graduate Degree | 0 (0.0%) | 0 (0.0%) |
| Total | 104 (100.0%) | 0 (0.0%) |
Income in Beachwood borough
Income Overview in Beachwood borough
Per Capita Income in Beachwood borough is $47,686, while median incomes of families and households are $110,114 and $99,099 respectively.
| Characteristic | Number | Measure |
| Per Capita Income | 10,933 | $47,686 |
| Median Family Income | 3,013 | $110,114 |
| Mean Family Income | 3,013 | $125,970 |
| Median Household Income | 3,935 | $99,099 |
| Mean Household Income | 3,935 | $124,132 |
| Income Deficit | 3,013 | $0 |
| Wage / Income Gap (%) | 10,933 | 29.63% |
| Wage / Income Gap ($) | 10,933 | 70.37¢ per $1 |
| Gini / Inequality Index | 10,933 | 0.40 |
Earnings by Sex in Beachwood borough
Average Earnings in Beachwood borough are $46,031, $56,143 for men and $39,508 for women, a difference of 29.6%.
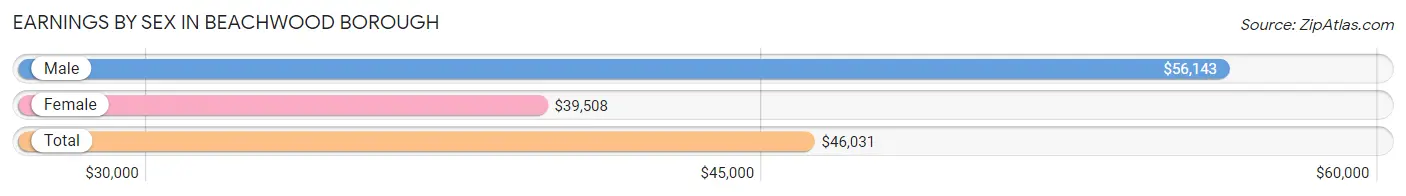
| Sex | Number | Average Earnings |
| Male | 3,087 (47.5%) | $56,143 |
| Female | 3,405 (52.4%) | $39,508 |
| Total | 6,492 (100.0%) | $46,031 |
Earnings by Sex by Income Bracket in Beachwood borough
The most common earnings brackets in Beachwood borough are $75,000 to $99,999 for men (563 | 18.2%) and $100,000+ for women (370 | 10.9%).
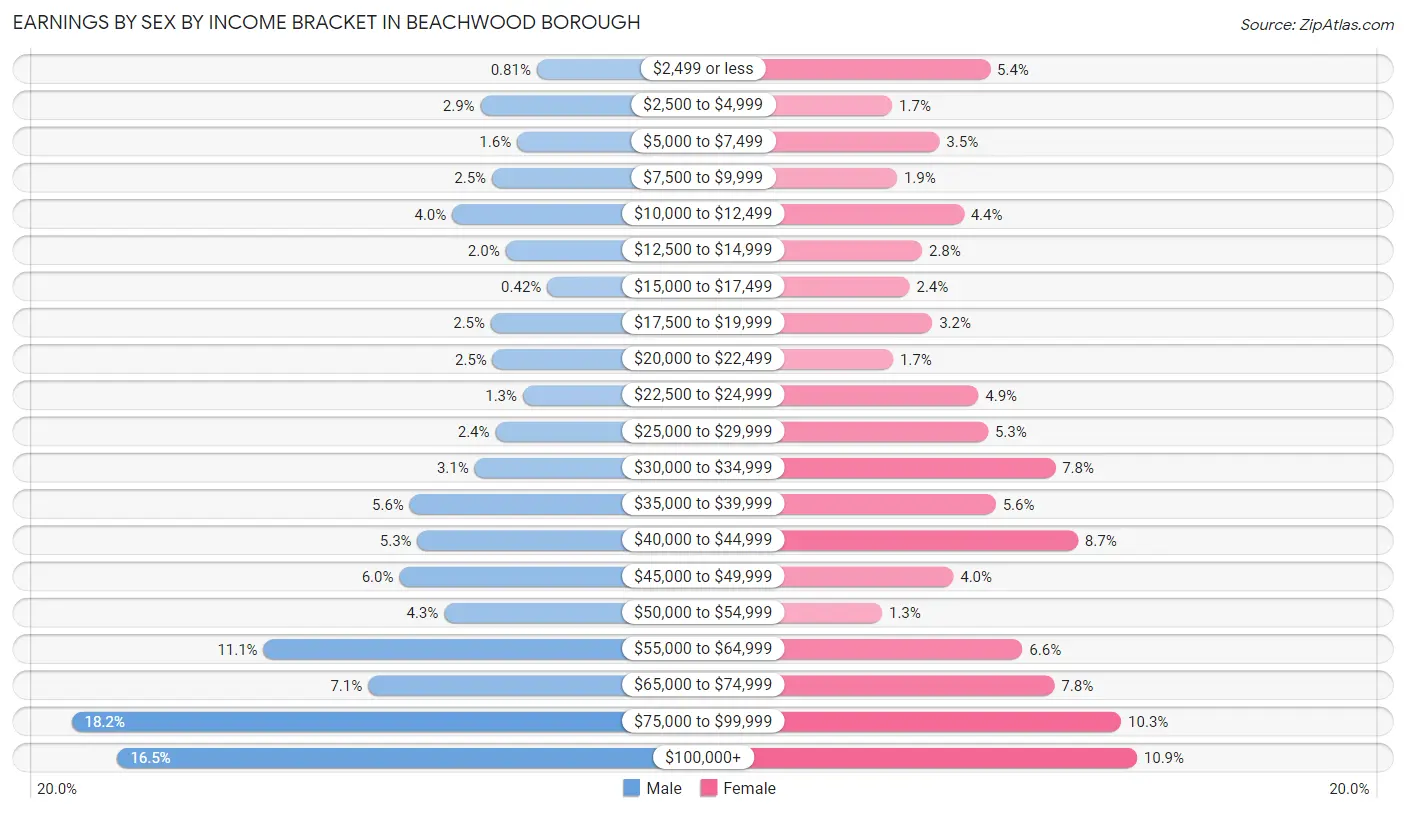
| Income | Male | Female |
| $2,499 or less | 25 (0.8%) | 183 (5.4%) |
| $2,500 to $4,999 | 90 (2.9%) | 58 (1.7%) |
| $5,000 to $7,499 | 48 (1.5%) | 118 (3.5%) |
| $7,500 to $9,999 | 77 (2.5%) | 64 (1.9%) |
| $10,000 to $12,499 | 123 (4.0%) | 149 (4.4%) |
| $12,500 to $14,999 | 61 (2.0%) | 96 (2.8%) |
| $15,000 to $17,499 | 13 (0.4%) | 80 (2.4%) |
| $17,500 to $19,999 | 78 (2.5%) | 109 (3.2%) |
| $20,000 to $22,499 | 76 (2.5%) | 59 (1.7%) |
| $22,500 to $24,999 | 41 (1.3%) | 168 (4.9%) |
| $25,000 to $29,999 | 73 (2.4%) | 180 (5.3%) |
| $30,000 to $34,999 | 97 (3.1%) | 266 (7.8%) |
| $35,000 to $39,999 | 172 (5.6%) | 190 (5.6%) |
| $40,000 to $44,999 | 163 (5.3%) | 295 (8.7%) |
| $45,000 to $49,999 | 184 (6.0%) | 136 (4.0%) |
| $50,000 to $54,999 | 132 (4.3%) | 45 (1.3%) |
| $55,000 to $64,999 | 341 (11.1%) | 224 (6.6%) |
| $65,000 to $74,999 | 220 (7.1%) | 265 (7.8%) |
| $75,000 to $99,999 | 563 (18.2%) | 350 (10.3%) |
| $100,000+ | 510 (16.5%) | 370 (10.9%) |
| Total | 3,087 (100.0%) | 3,405 (100.0%) |
Earnings by Sex by Educational Attainment in Beachwood borough
Average earnings in Beachwood borough are $62,164 for men and $42,242 for women, a difference of 32.1%. Men with an educational attainment of graduate degree enjoy the highest average annual earnings of $107,404, while those with less than high school education earn the least with $28,824. Women with an educational attainment of graduate degree earn the most with the average annual earnings of $77,857, while those with high school diploma education have the smallest earnings of $30,478.
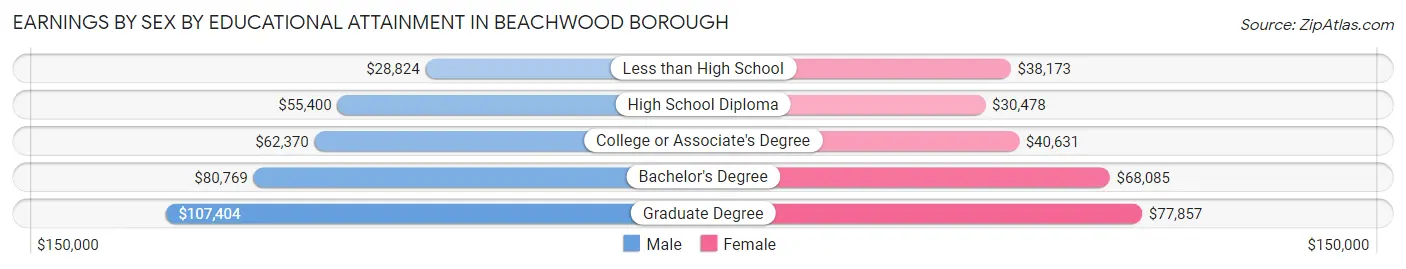
| Educational Attainment | Male Income | Female Income |
| Less than High School | $28,824 | $38,173 |
| High School Diploma | $55,400 | $30,478 |
| College or Associate's Degree | $62,370 | $40,631 |
| Bachelor's Degree | $80,769 | $68,085 |
| Graduate Degree | $107,404 | $77,857 |
| Total | $62,164 | $42,242 |
Family Income in Beachwood borough
Family Income Brackets in Beachwood borough
According to the Beachwood borough family income data, there are 832 families falling into the $100,000 to $149,999 income range, which is the most common income bracket and makes up 27.6% of all families.
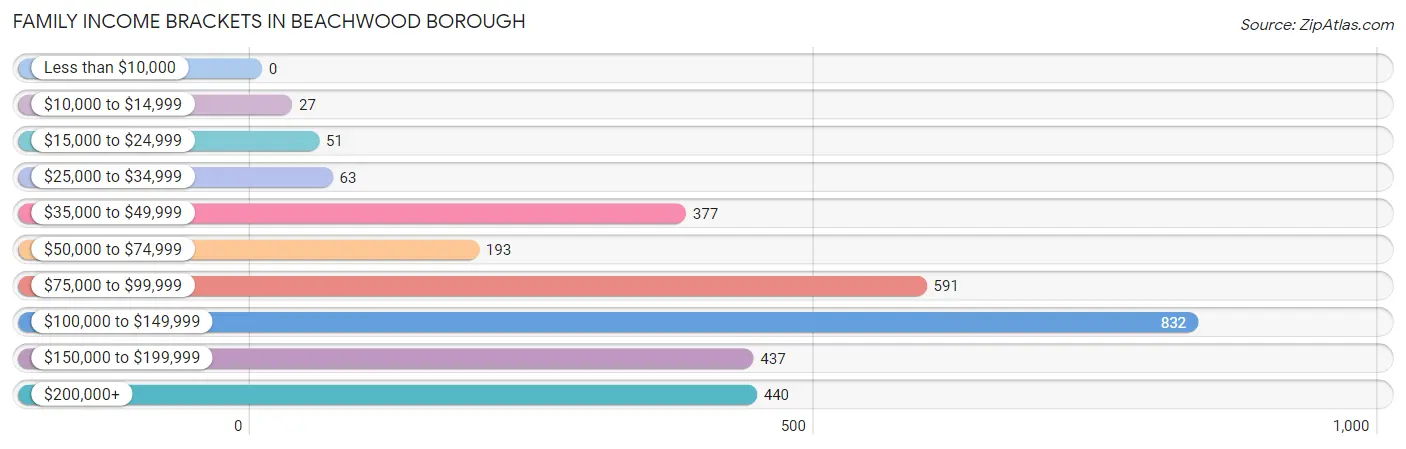
| Income Bracket | # Families | % Families |
| Less than $10,000 | 0 | 0.0% |
| $10,000 to $14,999 | 27 | 0.9% |
| $15,000 to $24,999 | 51 | 1.7% |
| $25,000 to $34,999 | 63 | 2.1% |
| $35,000 to $49,999 | 377 | 12.5% |
| $50,000 to $74,999 | 193 | 6.4% |
| $75,000 to $99,999 | 591 | 19.6% |
| $100,000 to $149,999 | 832 | 27.6% |
| $150,000 to $199,999 | 437 | 14.5% |
| $200,000+ | 440 | 14.6% |
Family Income by Famaliy Size in Beachwood borough
6-person families (52 | 1.7%) account for the highest median family income in Beachwood borough with $157,794 per family, while 3-person families (666 | 22.1%) have the highest median income of $45,764 per family member.
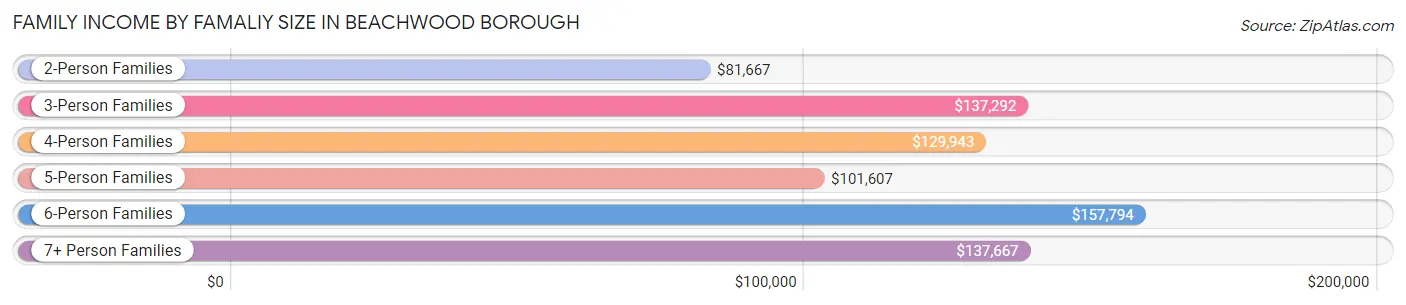
| Income Bracket | # Families | Median Income |
| 2-Person Families | 1,400 (46.5%) | $81,667 |
| 3-Person Families | 666 (22.1%) | $137,292 |
| 4-Person Families | 529 (17.6%) | $129,943 |
| 5-Person Families | 318 (10.5%) | $101,607 |
| 6-Person Families | 52 (1.7%) | $157,794 |
| 7+ Person Families | 48 (1.6%) | $137,667 |
| Total | 3,013 (100.0%) | $110,114 |
Family Income by Number of Earners in Beachwood borough
The median family income in Beachwood borough is $110,114, with families comprising 3+ earners (432) having the highest median family income of $183,077, while families with 1 earner (693) have the lowest median family income of $56,402, accounting for 14.3% and 23.0% of families, respectively.
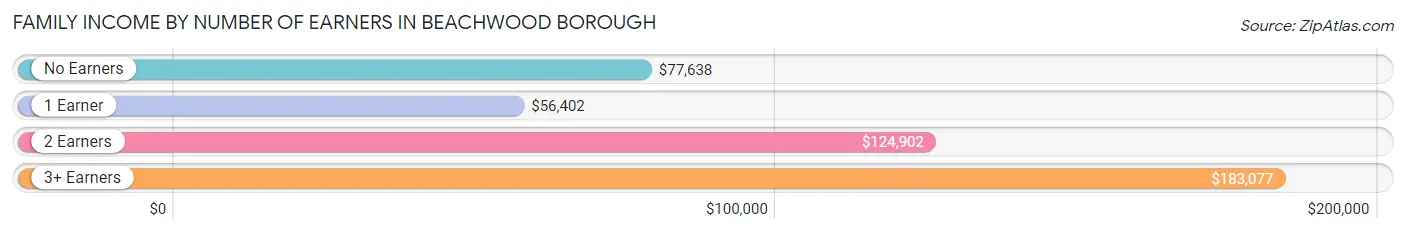
| Number of Earners | # Families | Median Income |
| No Earners | 356 (11.8%) | $77,638 |
| 1 Earner | 693 (23.0%) | $56,402 |
| 2 Earners | 1,532 (50.8%) | $124,902 |
| 3+ Earners | 432 (14.3%) | $183,077 |
| Total | 3,013 (100.0%) | $110,114 |
Household Income in Beachwood borough
Household Income Brackets in Beachwood borough
With 854 households falling in the category, the $100,000 to $149,999 income range is the most frequent in Beachwood borough, accounting for 21.7% of all households.
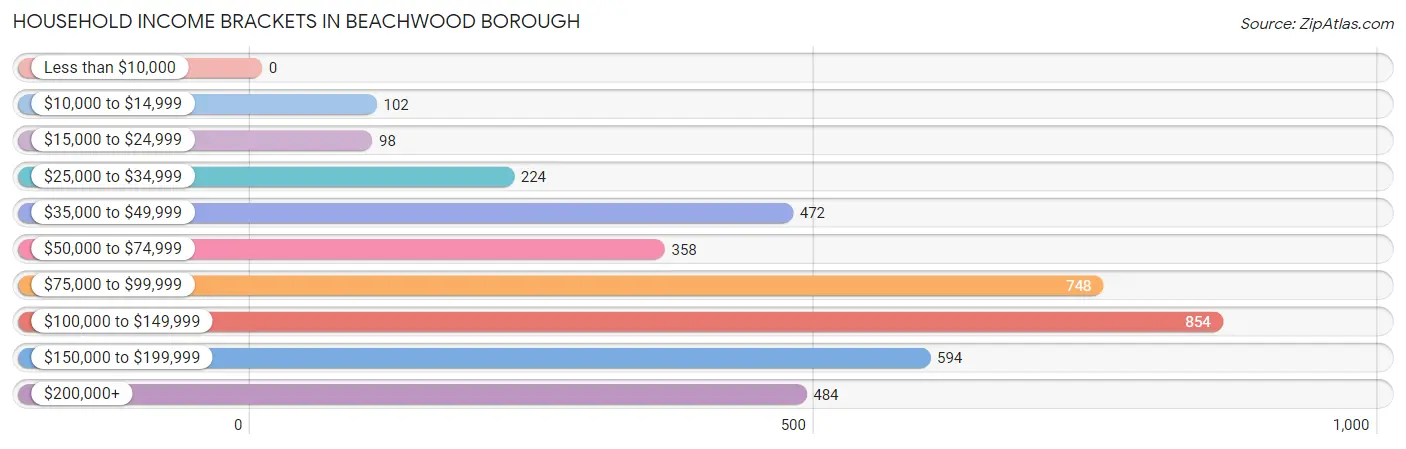
| Income Bracket | # Households | % Households |
| Less than $10,000 | 0 | 0.0% |
| $10,000 to $14,999 | 102 | 2.6% |
| $15,000 to $24,999 | 98 | 2.5% |
| $25,000 to $34,999 | 224 | 5.7% |
| $35,000 to $49,999 | 472 | 12.0% |
| $50,000 to $74,999 | 358 | 9.1% |
| $75,000 to $99,999 | 748 | 19.0% |
| $100,000 to $149,999 | 854 | 21.7% |
| $150,000 to $199,999 | 594 | 15.1% |
| $200,000+ | 484 | 12.3% |
Household Income by Householder Age in Beachwood borough
The median household income in Beachwood borough is $99,099, with the highest median household income of $122,102 found in the 45 to 64 years age bracket for the primary householder. A total of 1,733 households (44.0%) fall into this category. Meanwhile, the 15 to 24 years age bracket for the primary householder has the lowest median household income of $50,750, with 57 households (1.5%) in this group.
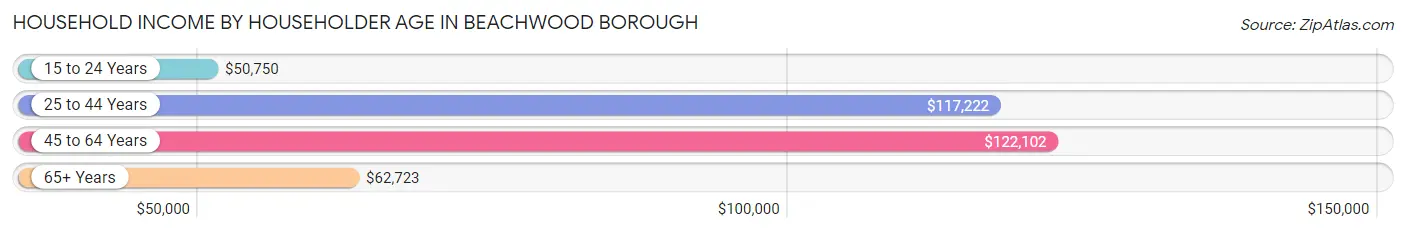
| Income Bracket | # Households | Median Income |
| 15 to 24 Years | 57 (1.5%) | $50,750 |
| 25 to 44 Years | 996 (25.3%) | $117,222 |
| 45 to 64 Years | 1,733 (44.0%) | $122,102 |
| 65+ Years | 1,149 (29.2%) | $62,723 |
| Total | 3,935 (100.0%) | $99,099 |
Poverty in Beachwood borough
Income Below Poverty by Sex and Age in Beachwood borough
With 5.7% poverty level for males and 4.3% for females among the residents of Beachwood borough, 15 year old males and 16 and 17 year old females are the most vulnerable to poverty, with 41 males (25.8%) and 17 females (14.7%) in their respective age groups living below the poverty level.
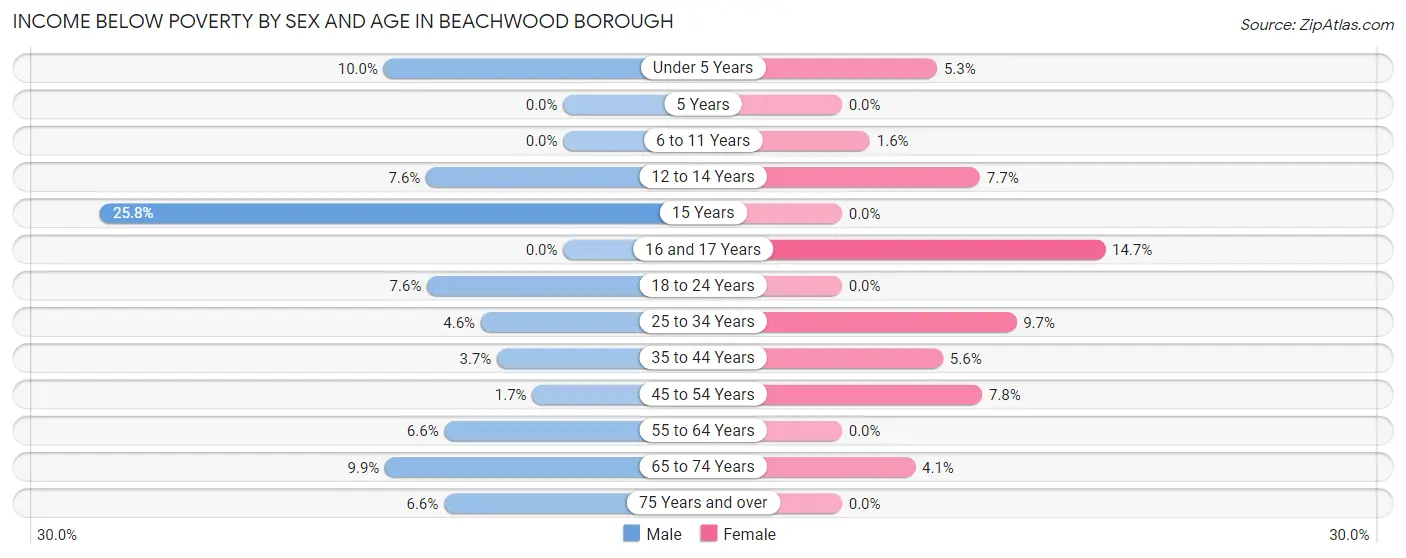
| Age Bracket | Male | Female |
| Under 5 Years | 20 (10.0%) | 22 (5.3%) |
| 5 Years | 0 (0.0%) | 0 (0.0%) |
| 6 to 11 Years | 0 (0.0%) | 5 (1.6%) |
| 12 to 14 Years | 11 (7.6%) | 15 (7.7%) |
| 15 Years | 41 (25.8%) | 0 (0.0%) |
| 16 and 17 Years | 0 (0.0%) | 17 (14.7%) |
| 18 to 24 Years | 35 (7.6%) | 0 (0.0%) |
| 25 to 34 Years | 29 (4.6%) | 63 (9.7%) |
| 35 to 44 Years | 26 (3.7%) | 36 (5.6%) |
| 45 to 54 Years | 13 (1.7%) | 53 (7.8%) |
| 55 to 64 Years | 52 (6.6%) | 0 (0.0%) |
| 65 to 74 Years | 59 (9.9%) | 30 (4.1%) |
| 75 Years and over | 20 (6.6%) | 0 (0.0%) |
| Total | 306 (5.7%) | 241 (4.3%) |
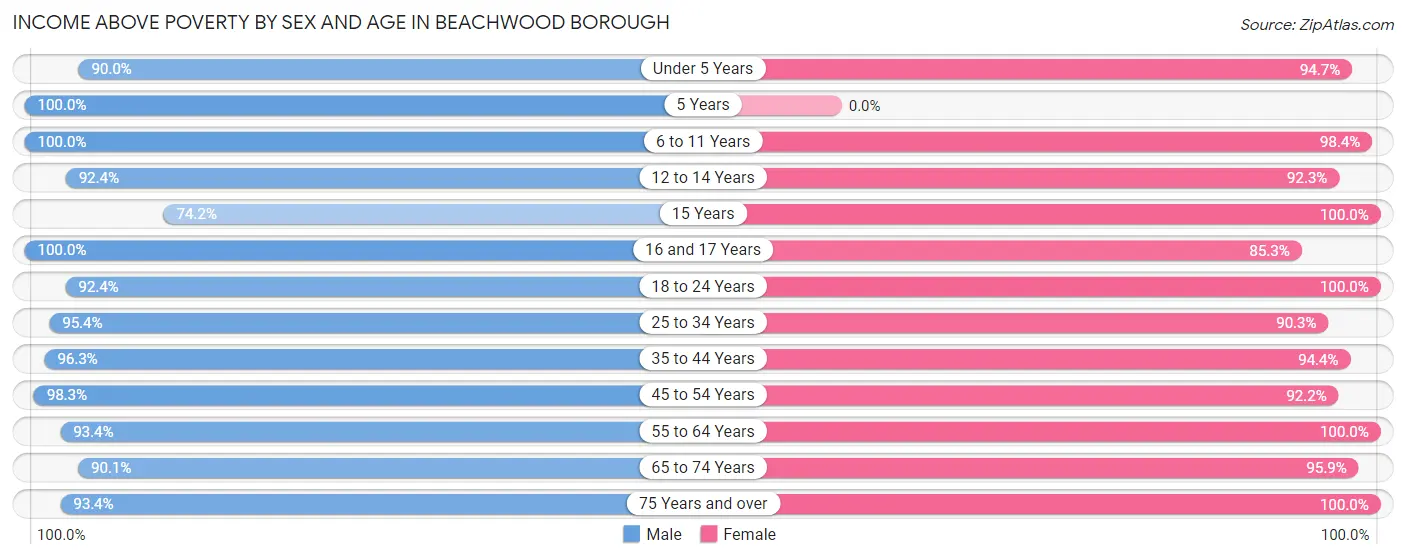
Income Above Poverty by Sex and Age in Beachwood borough
According to the poverty statistics in Beachwood borough, males aged 5 years and females aged 15 years are the age groups that are most secure financially, with 100.0% of males and 100.0% of females in these age groups living above the poverty line.
| Age Bracket | Male | Female |
| Under 5 Years | 180 (90.0%) | 393 (94.7%) |
| 5 Years | 69 (100.0%) | 0 (0.0%) |
| 6 to 11 Years | 421 (100.0%) | 316 (98.4%) |
| 12 to 14 Years | 133 (92.4%) | 180 (92.3%) |
| 15 Years | 118 (74.2%) | 37 (100.0%) |
| 16 and 17 Years | 118 (100.0%) | 99 (85.3%) |
| 18 to 24 Years | 427 (92.4%) | 537 (100.0%) |
| 25 to 34 Years | 603 (95.4%) | 586 (90.3%) |
| 35 to 44 Years | 678 (96.3%) | 603 (94.4%) |
| 45 to 54 Years | 741 (98.3%) | 626 (92.2%) |
| 55 to 64 Years | 733 (93.4%) | 920 (100.0%) |
| 65 to 74 Years | 536 (90.1%) | 706 (95.9%) |
| 75 Years and over | 281 (93.4%) | 345 (100.0%) |
| Total | 5,038 (94.3%) | 5,348 (95.7%) |
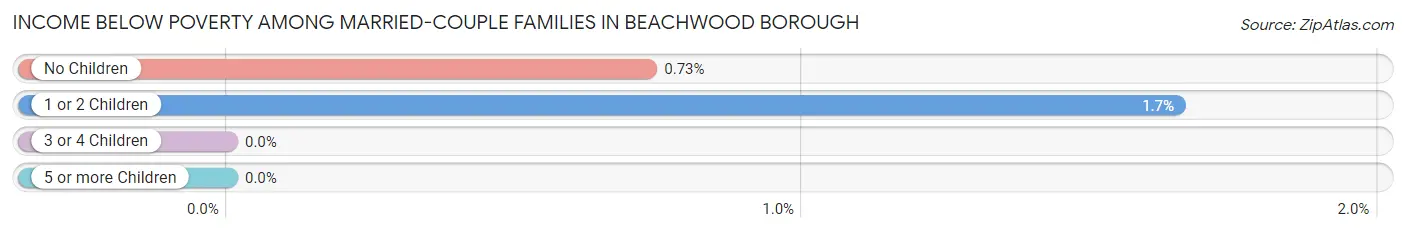
Income Below Poverty Among Married-Couple Families in Beachwood borough
The poverty statistics for married-couple families in Beachwood borough show that 1.0% or 22 of the total 2,261 families live below the poverty line. Families with 1 or 2 children have the highest poverty rate of 1.7%, comprising of 12 families. On the other hand, families with 3 or 4 children have the lowest poverty rate of 0.0%, which includes 0 families.
| Children | Above Poverty | Below Poverty |
| No Children | 1,362 (99.3%) | 10 (0.7%) |
| 1 or 2 Children | 714 (98.4%) | 12 (1.7%) |
| 3 or 4 Children | 148 (100.0%) | 0 (0.0%) |
| 5 or more Children | 15 (100.0%) | 0 (0.0%) |
| Total | 2,239 (99.0%) | 22 (1.0%) |
Income Below Poverty Among Single-Parent Households in Beachwood borough
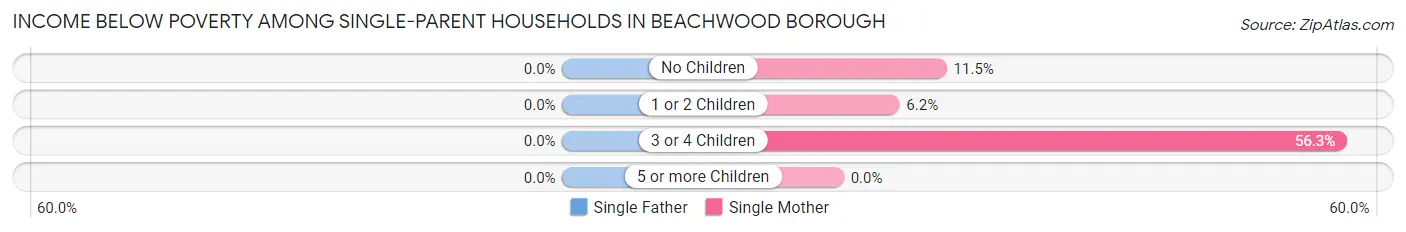
| Children | Single Father | Single Mother |
| No Children | 0 (0.0%) | 35 (11.5%) |
| 1 or 2 Children | 0 (0.0%) | 16 (6.2%) |
| 3 or 4 Children | 0 (0.0%) | 18 (56.2%) |
| 5 or more Children | 0 (0.0%) | 0 (0.0%) |
| Total | 0 (0.0%) | 69 (11.6%) |
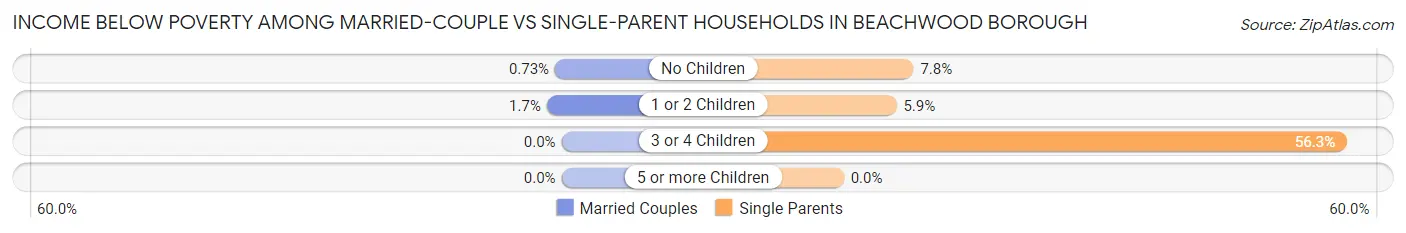
Income Below Poverty Among Married-Couple vs Single-Parent Households in Beachwood borough
The poverty data for Beachwood borough shows that 22 of the married-couple family households (1.0%) and 69 of the single-parent households (9.2%) are living below the poverty level. Within the married-couple family households, those with 1 or 2 children have the highest poverty rate, with 12 households (1.7%) falling below the poverty line. Among the single-parent households, those with 3 or 4 children have the highest poverty rate, with 18 household (56.2%) living below poverty.
| Children | Married-Couple Families | Single-Parent Households |
| No Children | 10 (0.7%) | 35 (7.8%) |
| 1 or 2 Children | 12 (1.7%) | 16 (5.9%) |
| 3 or 4 Children | 0 (0.0%) | 18 (56.2%) |
| 5 or more Children | 0 (0.0%) | 0 (0.0%) |
| Total | 22 (1.0%) | 69 (9.2%) |
Employment Characteristics in Beachwood borough
Employment by Class of Employer in Beachwood borough
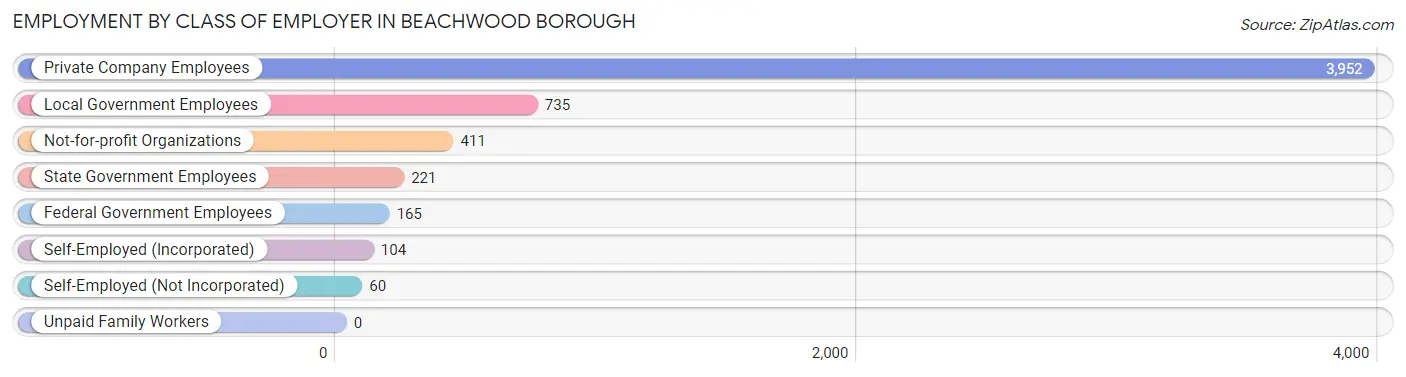
Among the 5,648 employed individuals in Beachwood borough, private company employees (3,952 | 70.0%), local government employees (735 | 13.0%), and not-for-profit organizations (411 | 7.3%) make up the most common classes of employment.
| Employer Class | # Employees | % Employees |
| Private Company Employees | 3,952 | 70.0% |
| Self-Employed (Incorporated) | 104 | 1.8% |
| Self-Employed (Not Incorporated) | 60 | 1.1% |
| Not-for-profit Organizations | 411 | 7.3% |
| Local Government Employees | 735 | 13.0% |
| State Government Employees | 221 | 3.9% |
| Federal Government Employees | 165 | 2.9% |
| Unpaid Family Workers | 0 | 0.0% |
| Total | 5,648 | 100.0% |
Employment Status by Age in Beachwood borough
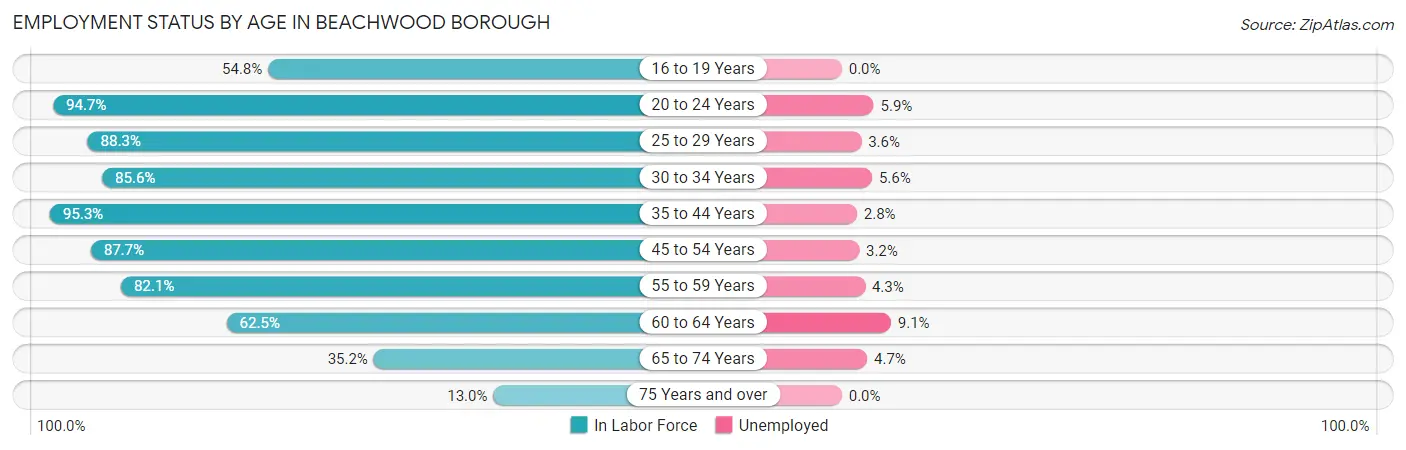
According to the labor force statistics for Beachwood borough, out of the total population over 16 years of age (8,972), 71.5% or 6,415 individuals are in the labor force, with 4.2% or 269 of them unemployed. The age group with the highest labor force participation rate is 35 to 44 years, with 95.3% or 1,280 individuals in the labor force. Within the labor force, the 60 to 64 years age range has the highest percentage of unemployed individuals, with 9.1% or 47 of them being unemployed.
| Age Bracket | In Labor Force | Unemployed |
| 16 to 19 Years | 264 (54.8%) | 0 (0.0%) |
| 20 to 24 Years | 711 (94.7%) | 42 (5.9%) |
| 25 to 29 Years | 507 (88.3%) | 18 (3.6%) |
| 30 to 34 Years | 605 (85.6%) | 34 (5.6%) |
| 35 to 44 Years | 1,280 (95.3%) | 36 (2.8%) |
| 45 to 54 Years | 1,257 (87.7%) | 40 (3.2%) |
| 55 to 59 Years | 718 (82.1%) | 31 (4.3%) |
| 60 to 64 Years | 519 (62.5%) | 47 (9.1%) |
| 65 to 74 Years | 469 (35.2%) | 22 (4.7%) |
| 75 Years and over | 84 (13.0%) | 0 (0.0%) |
| Total | 6,415 (71.5%) | 269 (4.2%) |
Employment Status by Educational Attainment in Beachwood borough
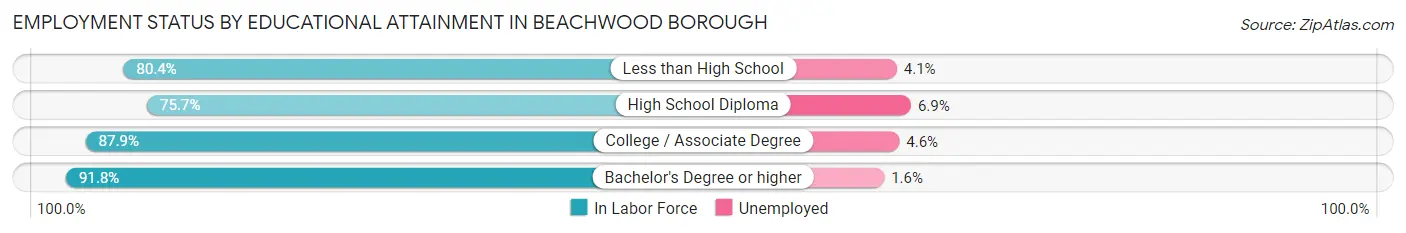
According to labor force statistics for Beachwood borough, 84.8% of individuals (4,886) out of the total population between 25 and 64 years of age (5,762) are in the labor force, with 4.2% or 205 of them being unemployed. The group with the highest labor force participation rate are those with the educational attainment of bachelor's degree or higher, with 91.8% or 1,618 individuals in the labor force. Within the labor force, individuals with high school diploma education have the highest percentage of unemployment, with 6.9% or 97 of them being unemployed.
| Educational Attainment | In Labor Force | Unemployed |
| Less than High School | 242 (80.4%) | 12 (4.1%) |
| High School Diploma | 1,399 (75.7%) | 128 (6.9%) |
| College / Associate Degree | 1,627 (87.9%) | 85 (4.6%) |
| Bachelor's Degree or higher | 1,618 (91.8%) | 28 (1.6%) |
| Total | 4,886 (84.8%) | 242 (4.2%) |
Employment Occupations by Sex in Beachwood borough
Management, Business, Science and Arts Occupations
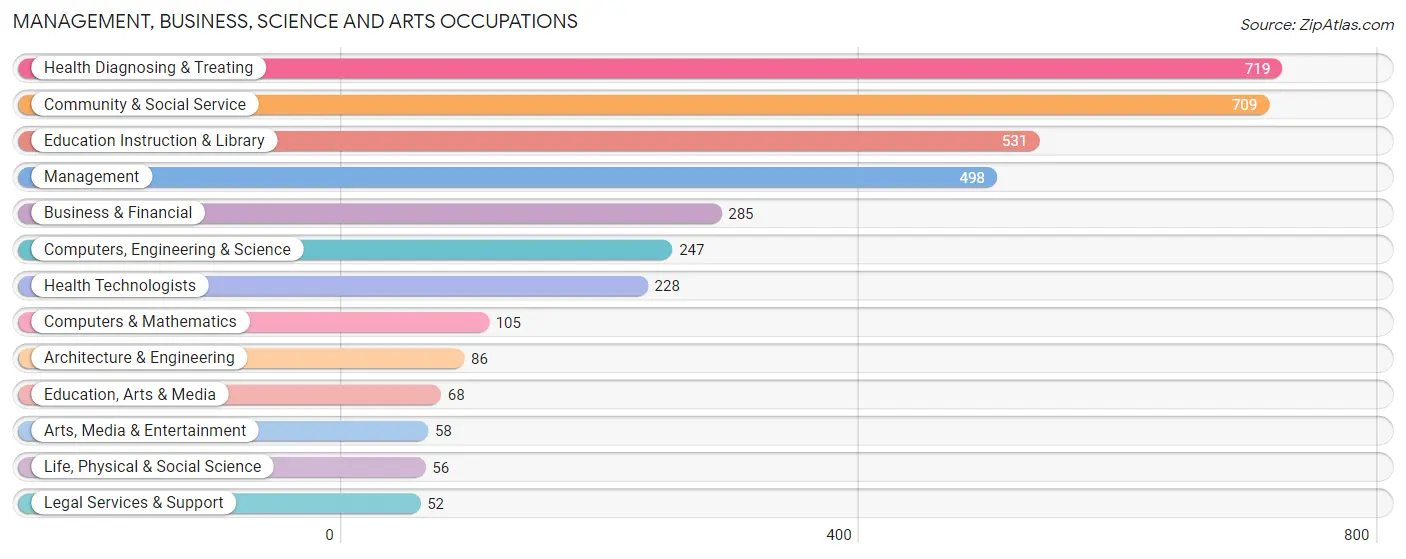
The most common Management, Business, Science and Arts occupations in Beachwood borough are Health Diagnosing & Treating (719 | 11.7%), Community & Social Service (709 | 11.6%), Education Instruction & Library (531 | 8.7%), Management (498 | 8.1%), and Business & Financial (285 | 4.6%).
Management, Business, Science and Arts Occupations by Sex
Within the Management, Business, Science and Arts occupations in Beachwood borough, the most male-oriented occupations are Computers & Mathematics (100.0%), Architecture & Engineering (89.5%), and Computers, Engineering & Science (81.8%), while the most female-oriented occupations are Education, Arts & Media (100.0%), Health Technologists (94.3%), and Health Diagnosing & Treating (87.3%).
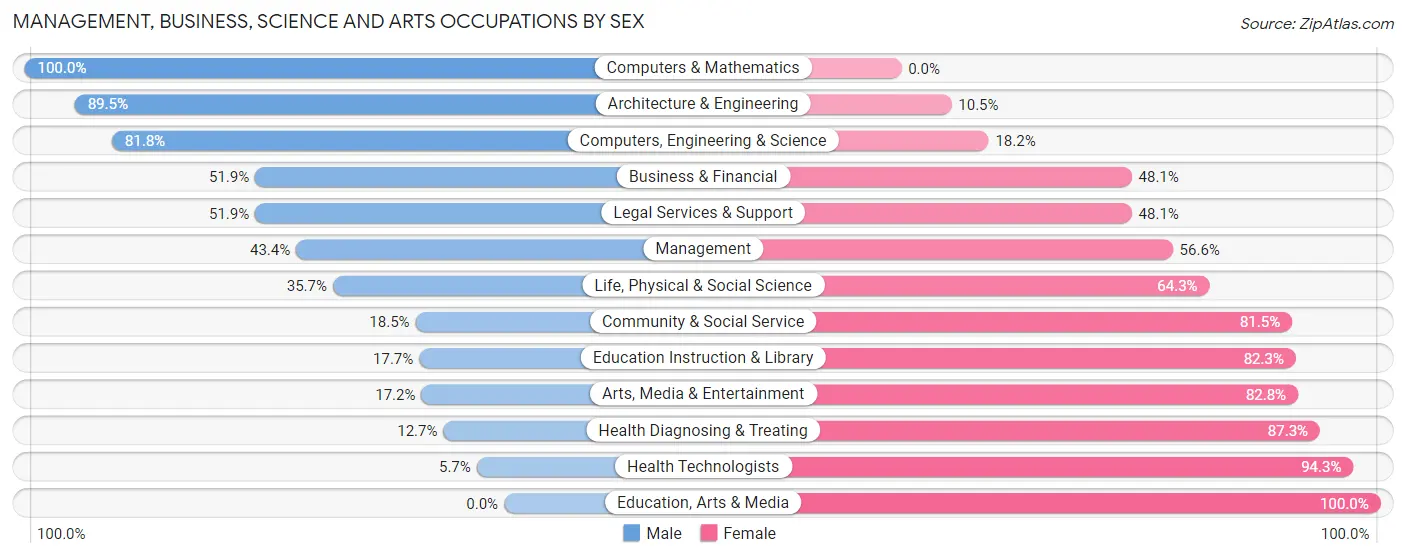
| Occupation | Male | Female |
| Management | 216 (43.4%) | 282 (56.6%) |
| Business & Financial | 148 (51.9%) | 137 (48.1%) |
| Computers, Engineering & Science | 202 (81.8%) | 45 (18.2%) |
| Computers & Mathematics | 105 (100.0%) | 0 (0.0%) |
| Architecture & Engineering | 77 (89.5%) | 9 (10.5%) |
| Life, Physical & Social Science | 20 (35.7%) | 36 (64.3%) |
| Community & Social Service | 131 (18.5%) | 578 (81.5%) |
| Education, Arts & Media | 0 (0.0%) | 68 (100.0%) |
| Legal Services & Support | 27 (51.9%) | 25 (48.1%) |
| Education Instruction & Library | 94 (17.7%) | 437 (82.3%) |
| Arts, Media & Entertainment | 10 (17.2%) | 48 (82.8%) |
| Health Diagnosing & Treating | 91 (12.7%) | 628 (87.3%) |
| Health Technologists | 13 (5.7%) | 215 (94.3%) |
| Total (Category) | 788 (32.1%) | 1,670 (67.9%) |
| Total (Overall) | 2,915 (47.5%) | 3,215 (52.4%) |
Services Occupations
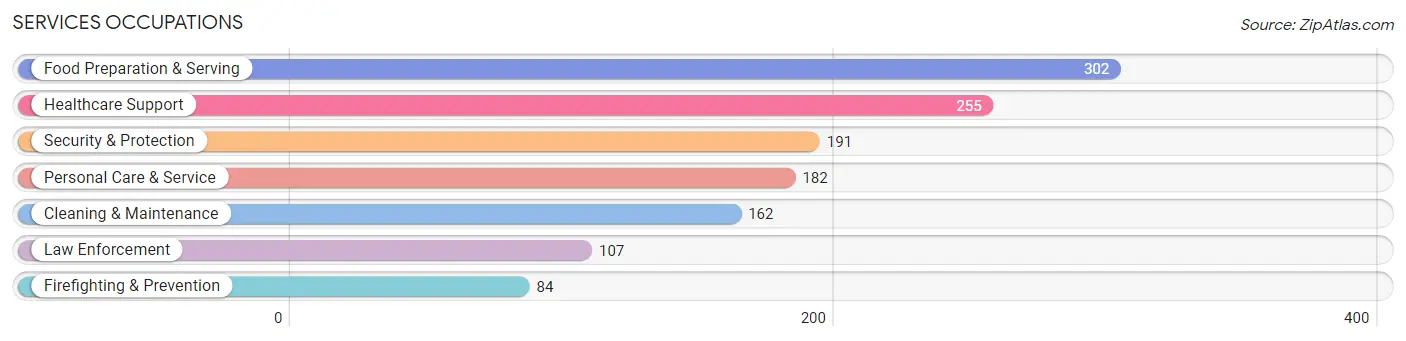
The most common Services occupations in Beachwood borough are Food Preparation & Serving (302 | 4.9%), Healthcare Support (255 | 4.2%), Security & Protection (191 | 3.1%), Personal Care & Service (182 | 3.0%), and Cleaning & Maintenance (162 | 2.6%).
Services Occupations by Sex
Within the Services occupations in Beachwood borough, the most male-oriented occupations are Firefighting & Prevention (100.0%), Security & Protection (85.3%), and Cleaning & Maintenance (81.5%), while the most female-oriented occupations are Personal Care & Service (100.0%), Food Preparation & Serving (79.5%), and Healthcare Support (68.6%).
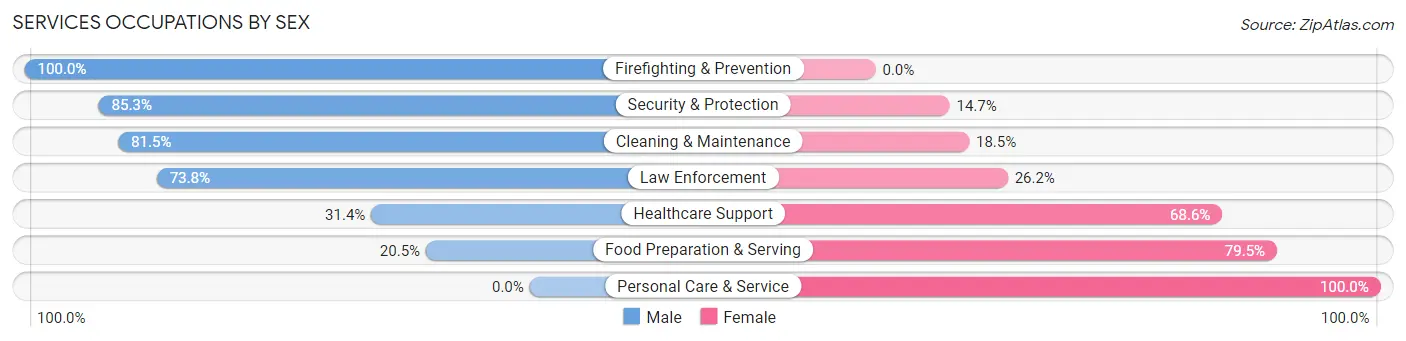
| Occupation | Male | Female |
| Healthcare Support | 80 (31.4%) | 175 (68.6%) |
| Security & Protection | 163 (85.3%) | 28 (14.7%) |
| Firefighting & Prevention | 84 (100.0%) | 0 (0.0%) |
| Law Enforcement | 79 (73.8%) | 28 (26.2%) |
| Food Preparation & Serving | 62 (20.5%) | 240 (79.5%) |
| Cleaning & Maintenance | 132 (81.5%) | 30 (18.5%) |
| Personal Care & Service | 0 (0.0%) | 182 (100.0%) |
| Total (Category) | 437 (40.0%) | 655 (60.0%) |
| Total (Overall) | 2,915 (47.5%) | 3,215 (52.4%) |
Sales and Office Occupations
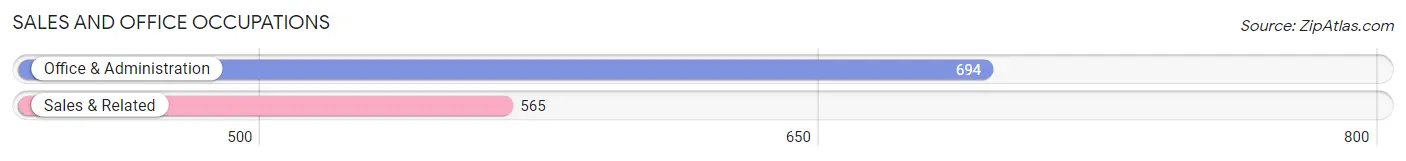
The most common Sales and Office occupations in Beachwood borough are Office & Administration (694 | 11.3%), and Sales & Related (565 | 9.2%).
Sales and Office Occupations by Sex
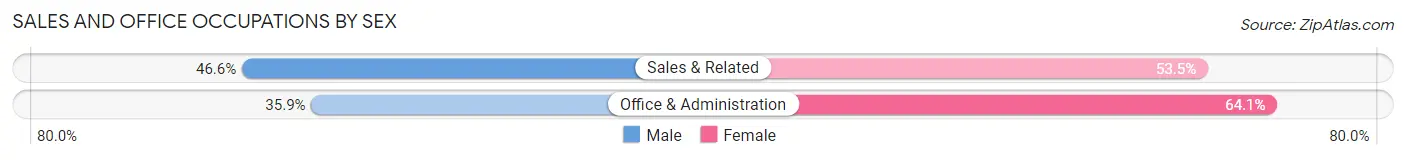
| Occupation | Male | Female |
| Sales & Related | 263 (46.6%) | 302 (53.4%) |
| Office & Administration | 249 (35.9%) | 445 (64.1%) |
| Total (Category) | 512 (40.7%) | 747 (59.3%) |
| Total (Overall) | 2,915 (47.5%) | 3,215 (52.4%) |
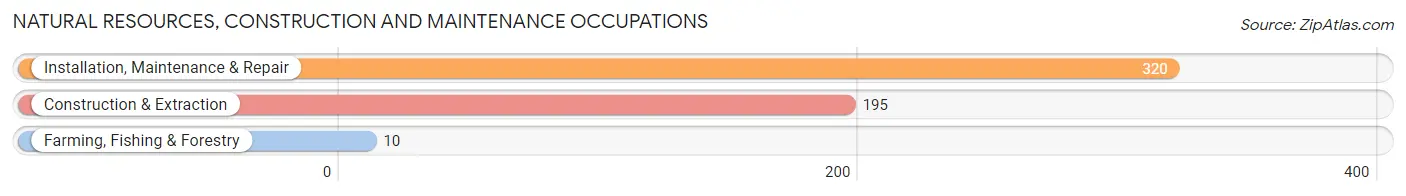
Natural Resources, Construction and Maintenance Occupations
The most common Natural Resources, Construction and Maintenance occupations in Beachwood borough are Installation, Maintenance & Repair (320 | 5.2%), Construction & Extraction (195 | 3.2%), and Farming, Fishing & Forestry (10 | 0.2%).
Natural Resources, Construction and Maintenance Occupations by Sex
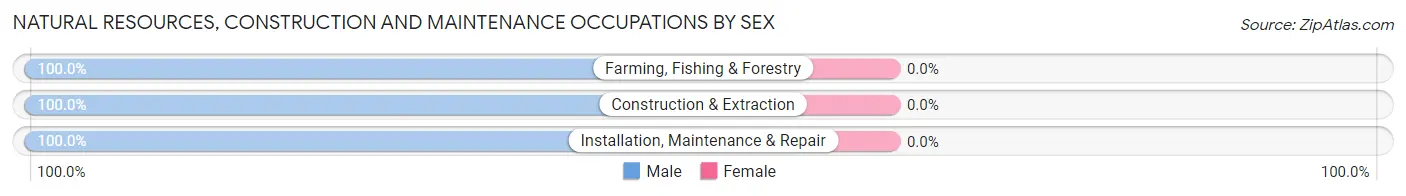
| Occupation | Male | Female |
| Farming, Fishing & Forestry | 10 (100.0%) | 0 (0.0%) |
| Construction & Extraction | 195 (100.0%) | 0 (0.0%) |
| Installation, Maintenance & Repair | 320 (100.0%) | 0 (0.0%) |
| Total (Category) | 525 (100.0%) | 0 (0.0%) |
| Total (Overall) | 2,915 (47.5%) | 3,215 (52.4%) |
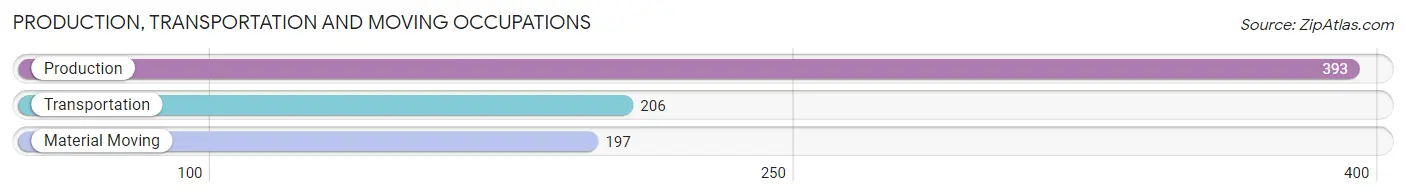
Production, Transportation and Moving Occupations
The most common Production, Transportation and Moving occupations in Beachwood borough are Production (393 | 6.4%), Transportation (206 | 3.4%), and Material Moving (197 | 3.2%).
Production, Transportation and Moving Occupations by Sex
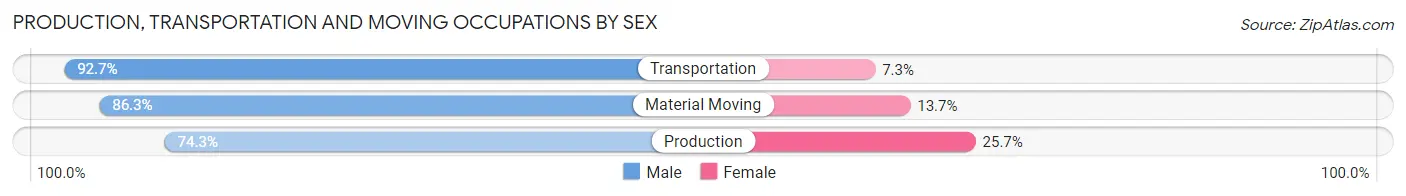
| Occupation | Male | Female |
| Production | 292 (74.3%) | 101 (25.7%) |
| Transportation | 191 (92.7%) | 15 (7.3%) |
| Material Moving | 170 (86.3%) | 27 (13.7%) |
| Total (Category) | 653 (82.0%) | 143 (18.0%) |
| Total (Overall) | 2,915 (47.5%) | 3,215 (52.4%) |
Employment Industries by Sex in Beachwood borough
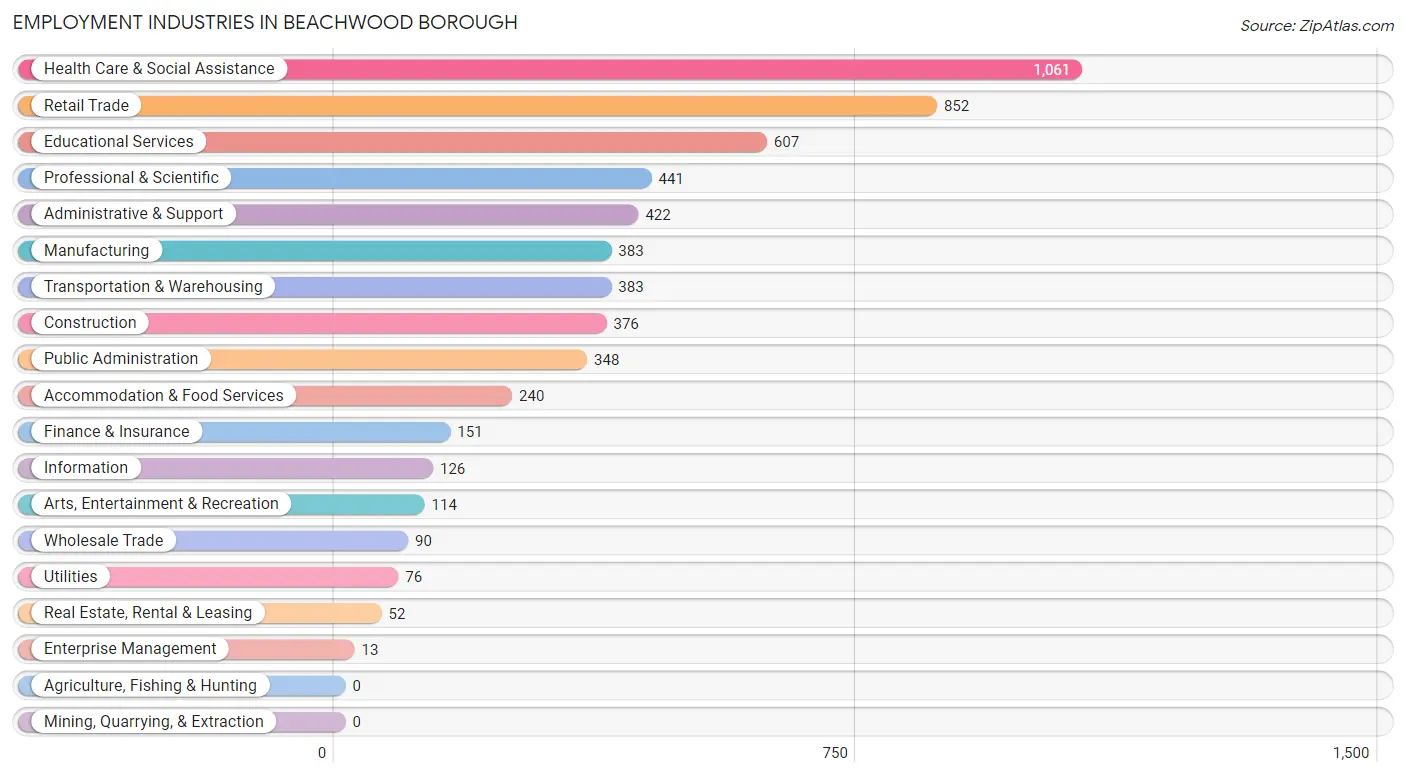
Employment Industries in Beachwood borough
The major employment industries in Beachwood borough include Health Care & Social Assistance (1,061 | 17.3%), Retail Trade (852 | 13.9%), Educational Services (607 | 9.9%), Professional & Scientific (441 | 7.2%), and Administrative & Support (422 | 6.9%).
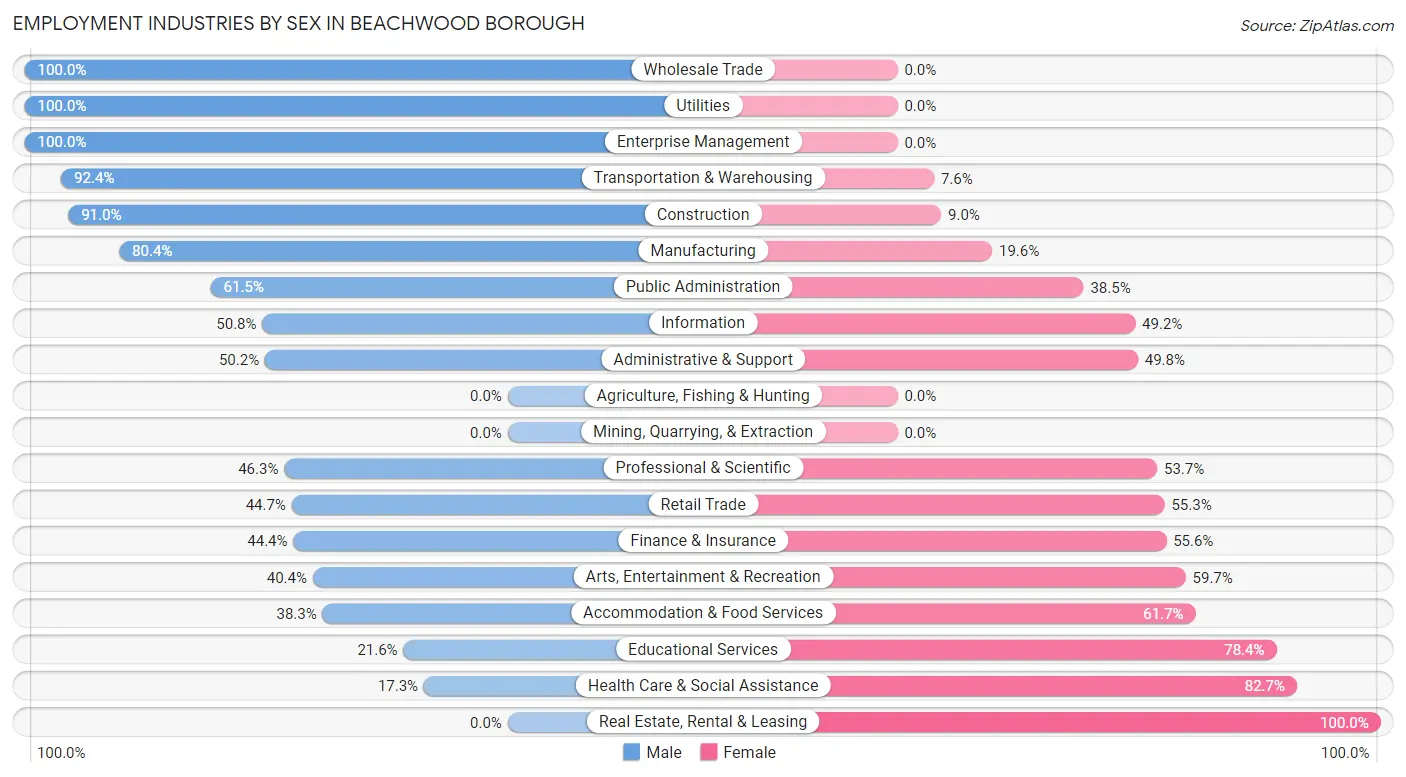
Employment Industries by Sex in Beachwood borough
The Beachwood borough industries that see more men than women are Wholesale Trade (100.0%), Utilities (100.0%), and Enterprise Management (100.0%), whereas the industries that tend to have a higher number of women are Real Estate, Rental & Leasing (100.0%), Health Care & Social Assistance (82.7%), and Educational Services (78.4%).
| Industry | Male | Female |
| Agriculture, Fishing & Hunting | 0 (0.0%) | 0 (0.0%) |
| Mining, Quarrying, & Extraction | 0 (0.0%) | 0 (0.0%) |
| Construction | 342 (91.0%) | 34 (9.0%) |
| Manufacturing | 308 (80.4%) | 75 (19.6%) |
| Wholesale Trade | 90 (100.0%) | 0 (0.0%) |
| Retail Trade | 381 (44.7%) | 471 (55.3%) |
| Transportation & Warehousing | 354 (92.4%) | 29 (7.6%) |
| Utilities | 76 (100.0%) | 0 (0.0%) |
| Information | 64 (50.8%) | 62 (49.2%) |
| Finance & Insurance | 67 (44.4%) | 84 (55.6%) |
| Real Estate, Rental & Leasing | 0 (0.0%) | 52 (100.0%) |
| Professional & Scientific | 204 (46.3%) | 237 (53.7%) |
| Enterprise Management | 13 (100.0%) | 0 (0.0%) |
| Administrative & Support | 212 (50.2%) | 210 (49.8%) |
| Educational Services | 131 (21.6%) | 476 (78.4%) |
| Health Care & Social Assistance | 184 (17.3%) | 877 (82.7%) |
| Arts, Entertainment & Recreation | 46 (40.4%) | 68 (59.7%) |
| Accommodation & Food Services | 92 (38.3%) | 148 (61.7%) |
| Public Administration | 214 (61.5%) | 134 (38.5%) |
| Total | 2,915 (47.5%) | 3,215 (52.4%) |
Education in Beachwood borough
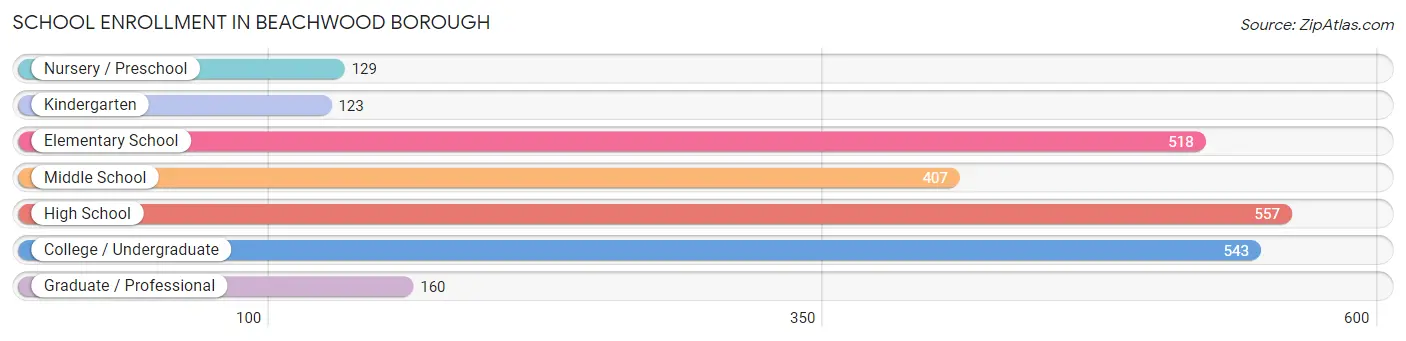
School Enrollment in Beachwood borough
The most common levels of schooling among the 2,437 students in Beachwood borough are high school (557 | 22.9%), college / undergraduate (543 | 22.3%), and elementary school (518 | 21.3%).
| School Level | # Students | % Students |
| Nursery / Preschool | 129 | 5.3% |
| Kindergarten | 123 | 5.1% |
| Elementary School | 518 | 21.3% |
| Middle School | 407 | 16.7% |
| High School | 557 | 22.9% |
| College / Undergraduate | 543 | 22.3% |
| Graduate / Professional | 160 | 6.6% |
| Total | 2,437 | 100.0% |
School Enrollment by Age by Funding Source in Beachwood borough
Out of a total of 2,437 students who are enrolled in schools in Beachwood borough, 256 (10.5%) attend a private institution, while the remaining 2,181 (89.5%) are enrolled in public schools. The age group of 3 to 4 year olds has the highest likelihood of being enrolled in private schools, with 71 (55.0% in the age bracket) enrolled. Conversely, the age group of 15 to 17 year olds has the lowest likelihood of being enrolled in a private school, with 415 (97.9% in the age bracket) attending a public institution.
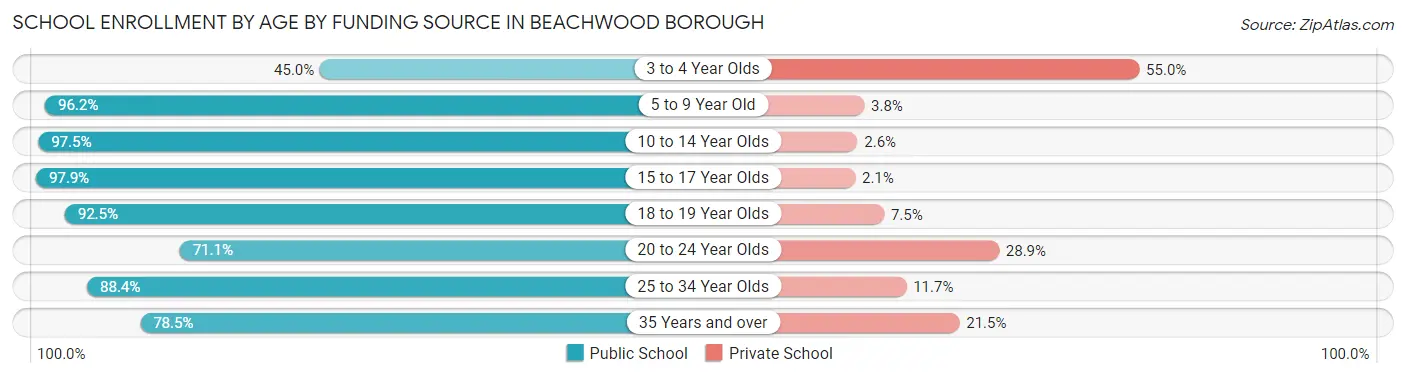
| Age Bracket | Public School | Private School |
| 3 to 4 Year Olds | 58 (45.0%) | 71 (55.0%) |
| 5 to 9 Year Old | 580 (96.2%) | 23 (3.8%) |
| 10 to 14 Year Olds | 496 (97.5%) | 13 (2.5%) |
| 15 to 17 Year Olds | 415 (97.9%) | 9 (2.1%) |
| 18 to 19 Year Olds | 185 (92.5%) | 15 (7.5%) |
| 20 to 24 Year Olds | 214 (71.1%) | 87 (28.9%) |
| 25 to 34 Year Olds | 182 (88.3%) | 24 (11.7%) |
| 35 Years and over | 51 (78.5%) | 14 (21.5%) |
| Total | 2,181 (89.5%) | 256 (10.5%) |
Educational Attainment by Field of Study in Beachwood borough
Business (518 | 21.5%), education (413 | 17.1%), science & technology (247 | 10.2%), arts & humanities (156 | 6.5%), and communications (152 | 6.3%) are the most common fields of study among 2,411 individuals in Beachwood borough who have obtained a bachelor's degree or higher.
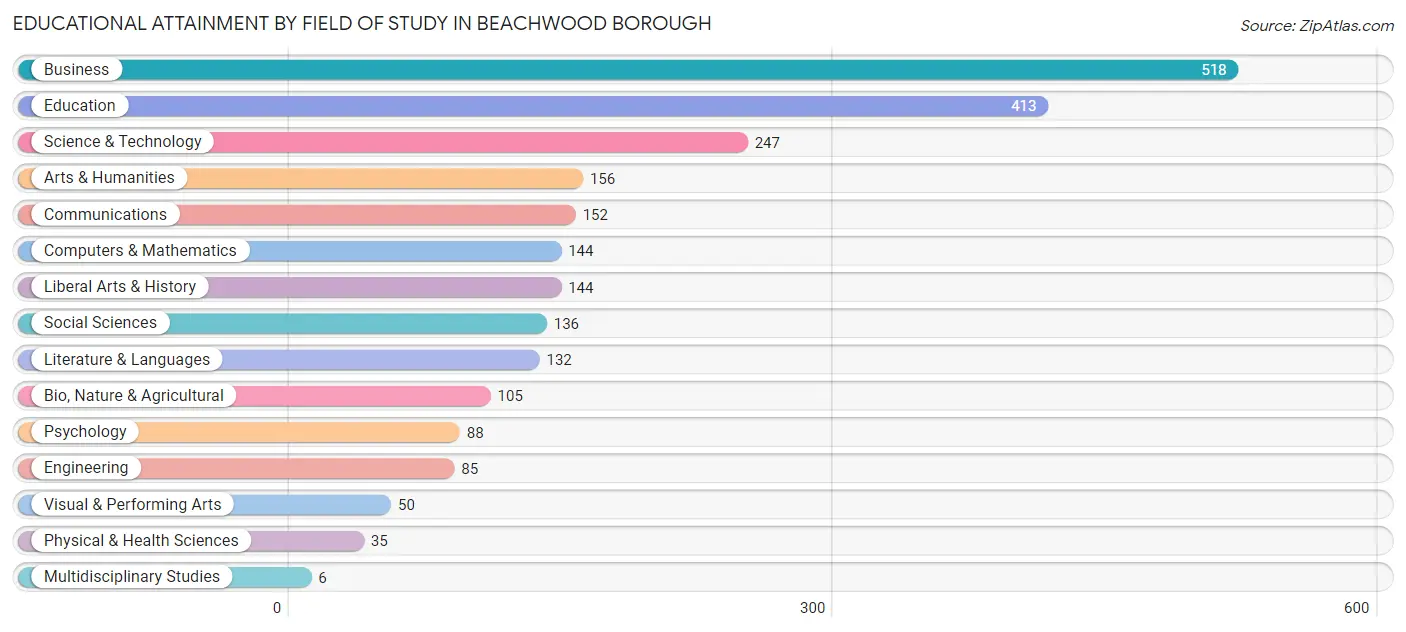
| Field of Study | # Graduates | % Graduates |
| Computers & Mathematics | 144 | 6.0% |
| Bio, Nature & Agricultural | 105 | 4.4% |
| Physical & Health Sciences | 35 | 1.5% |
| Psychology | 88 | 3.6% |
| Social Sciences | 136 | 5.6% |
| Engineering | 85 | 3.5% |
| Multidisciplinary Studies | 6 | 0.3% |
| Science & Technology | 247 | 10.2% |
| Business | 518 | 21.5% |
| Education | 413 | 17.1% |
| Literature & Languages | 132 | 5.5% |
| Liberal Arts & History | 144 | 6.0% |
| Visual & Performing Arts | 50 | 2.1% |
| Communications | 152 | 6.3% |
| Arts & Humanities | 156 | 6.5% |
| Total | 2,411 | 100.0% |
Transportation & Commute in Beachwood borough
Vehicle Availability by Sex in Beachwood borough
The most prevalent vehicle ownership categories in Beachwood borough are males with 2 vehicles (1,267, accounting for 44.7%) and females with 2 vehicles (1,047, making up 45.1%).
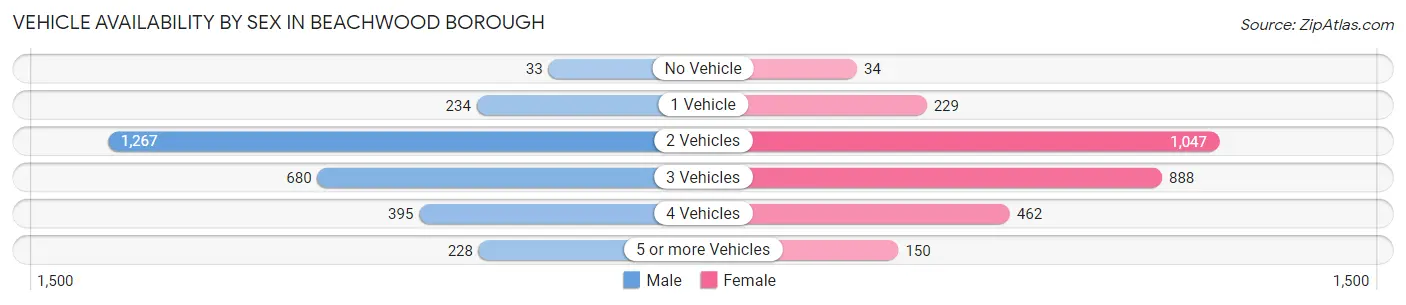
| Vehicles Available | Male | Female |
| No Vehicle | 33 (1.2%) | 34 (1.2%) |
| 1 Vehicle | 234 (8.3%) | 229 (8.2%) |
| 2 Vehicles | 1,267 (44.7%) | 1,047 (37.3%) |
| 3 Vehicles | 680 (24.0%) | 888 (31.6%) |
| 4 Vehicles | 395 (13.9%) | 462 (16.4%) |
| 5 or more Vehicles | 228 (8.0%) | 150 (5.3%) |
| Total | 2,837 (100.0%) | 2,810 (100.0%) |
Commute Time in Beachwood borough
The most frequently occuring commute durations in Beachwood borough are 15 to 19 minutes (772 commuters, 14.1%), 10 to 14 minutes (671 commuters, 12.2%), and 20 to 24 minutes (643 commuters, 11.7%).
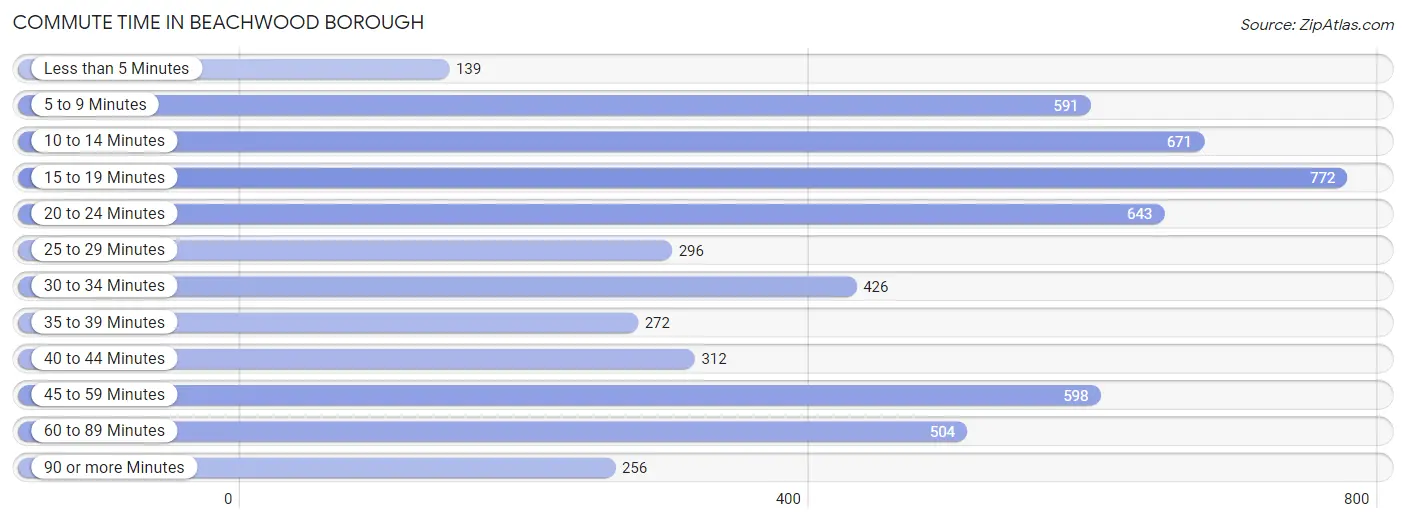
| Commute Time | # Commuters | % Commuters |
| Less than 5 Minutes | 139 | 2.5% |
| 5 to 9 Minutes | 591 | 10.8% |
| 10 to 14 Minutes | 671 | 12.2% |
| 15 to 19 Minutes | 772 | 14.1% |
| 20 to 24 Minutes | 643 | 11.7% |
| 25 to 29 Minutes | 296 | 5.4% |
| 30 to 34 Minutes | 426 | 7.8% |
| 35 to 39 Minutes | 272 | 5.0% |
| 40 to 44 Minutes | 312 | 5.7% |
| 45 to 59 Minutes | 598 | 10.9% |
| 60 to 89 Minutes | 504 | 9.2% |
| 90 or more Minutes | 256 | 4.7% |
Commute Time by Sex in Beachwood borough
The most common commute times in Beachwood borough are 45 to 59 minutes (459 commuters, 16.6%) for males and 15 to 19 minutes (439 commuters, 16.2%) for females.
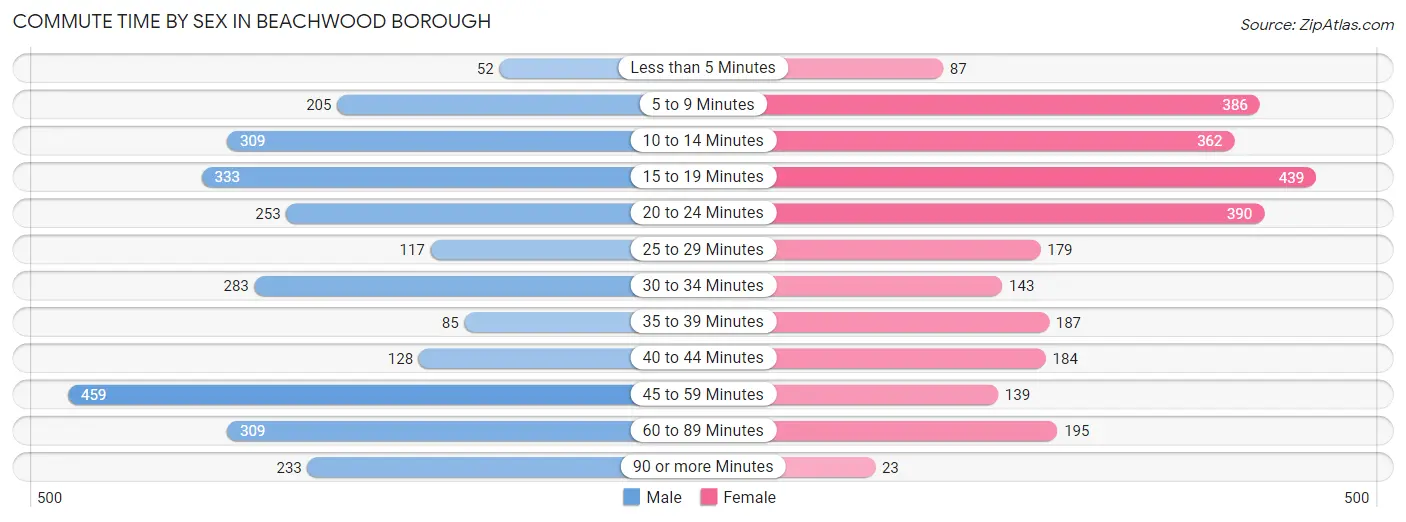
| Commute Time | Male | Female |
| Less than 5 Minutes | 52 (1.9%) | 87 (3.2%) |
| 5 to 9 Minutes | 205 (7.4%) | 386 (14.2%) |
| 10 to 14 Minutes | 309 (11.2%) | 362 (13.3%) |
| 15 to 19 Minutes | 333 (12.0%) | 439 (16.2%) |
| 20 to 24 Minutes | 253 (9.1%) | 390 (14.4%) |
| 25 to 29 Minutes | 117 (4.2%) | 179 (6.6%) |
| 30 to 34 Minutes | 283 (10.2%) | 143 (5.3%) |
| 35 to 39 Minutes | 85 (3.1%) | 187 (6.9%) |
| 40 to 44 Minutes | 128 (4.6%) | 184 (6.8%) |
| 45 to 59 Minutes | 459 (16.6%) | 139 (5.1%) |
| 60 to 89 Minutes | 309 (11.2%) | 195 (7.2%) |
| 90 or more Minutes | 233 (8.4%) | 23 (0.9%) |
Time of Departure to Work by Sex in Beachwood borough
The most frequent times of departure to work in Beachwood borough are 7:00 AM to 7:29 AM (443, 16.0%) for males and 7:00 AM to 7:29 AM (452, 16.7%) for females.
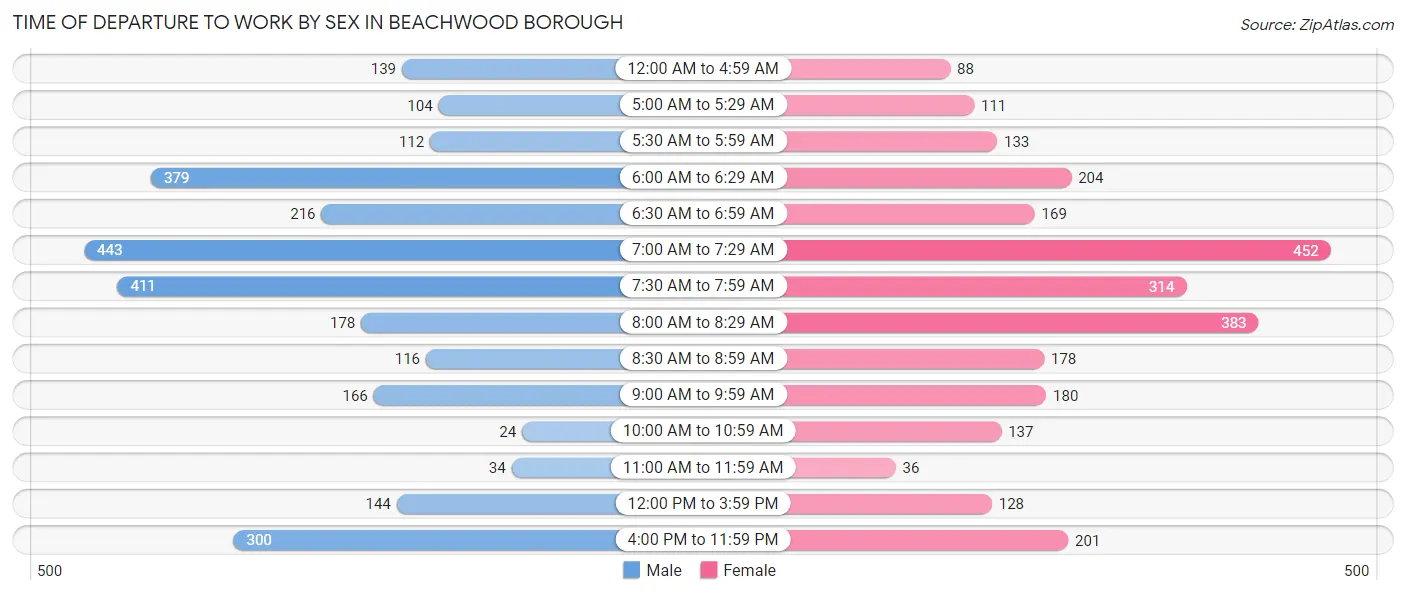
| Time of Departure | Male | Female |
| 12:00 AM to 4:59 AM | 139 (5.0%) | 88 (3.2%) |
| 5:00 AM to 5:29 AM | 104 (3.8%) | 111 (4.1%) |
| 5:30 AM to 5:59 AM | 112 (4.1%) | 133 (4.9%) |
| 6:00 AM to 6:29 AM | 379 (13.7%) | 204 (7.5%) |
| 6:30 AM to 6:59 AM | 216 (7.8%) | 169 (6.2%) |
| 7:00 AM to 7:29 AM | 443 (16.0%) | 452 (16.7%) |
| 7:30 AM to 7:59 AM | 411 (14.9%) | 314 (11.6%) |
| 8:00 AM to 8:29 AM | 178 (6.4%) | 383 (14.1%) |
| 8:30 AM to 8:59 AM | 116 (4.2%) | 178 (6.6%) |
| 9:00 AM to 9:59 AM | 166 (6.0%) | 180 (6.6%) |
| 10:00 AM to 10:59 AM | 24 (0.9%) | 137 (5.1%) |
| 11:00 AM to 11:59 AM | 34 (1.2%) | 36 (1.3%) |
| 12:00 PM to 3:59 PM | 144 (5.2%) | 128 (4.7%) |
| 4:00 PM to 11:59 PM | 300 (10.8%) | 201 (7.4%) |
| Total | 2,766 (100.0%) | 2,714 (100.0%) |
Housing Occupancy in Beachwood borough
Occupancy by Ownership in Beachwood borough
Of the total 3,935 dwellings in Beachwood borough, owner-occupied units account for 3,541 (90.0%), while renter-occupied units make up 394 (10.0%).
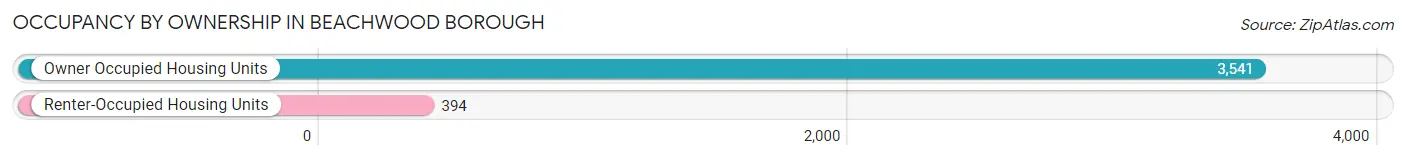
| Occupancy | # Housing Units | % Housing Units |
| Owner Occupied Housing Units | 3,541 | 90.0% |
| Renter-Occupied Housing Units | 394 | 10.0% |
| Total Occupied Housing Units | 3,935 | 100.0% |
Occupancy by Household Size in Beachwood borough
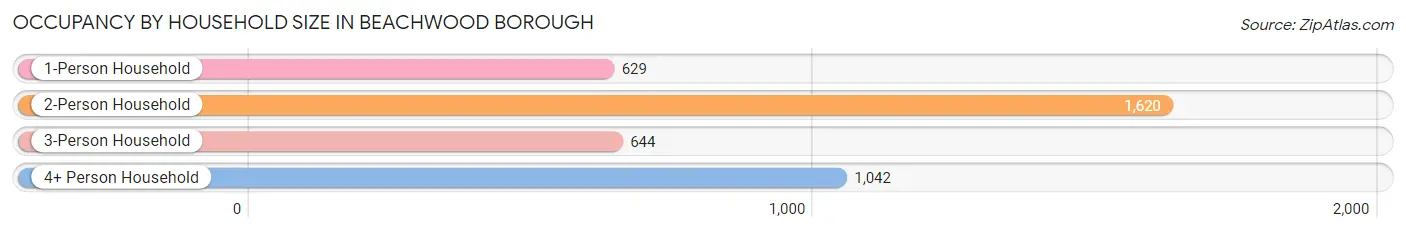
| Household Size | # Housing Units | % Housing Units |
| 1-Person Household | 629 | 16.0% |
| 2-Person Household | 1,620 | 41.2% |
| 3-Person Household | 644 | 16.4% |
| 4+ Person Household | 1,042 | 26.5% |
| Total Housing Units | 3,935 | 100.0% |
Occupancy by Ownership by Household Size in Beachwood borough
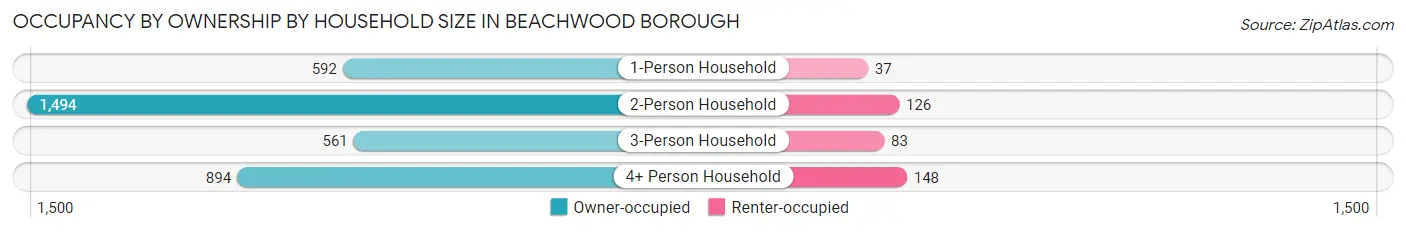
| Household Size | Owner-occupied | Renter-occupied |
| 1-Person Household | 592 (94.1%) | 37 (5.9%) |
| 2-Person Household | 1,494 (92.2%) | 126 (7.8%) |
| 3-Person Household | 561 (87.1%) | 83 (12.9%) |
| 4+ Person Household | 894 (85.8%) | 148 (14.2%) |
| Total Housing Units | 3,541 (90.0%) | 394 (10.0%) |
Occupancy by Educational Attainment in Beachwood borough
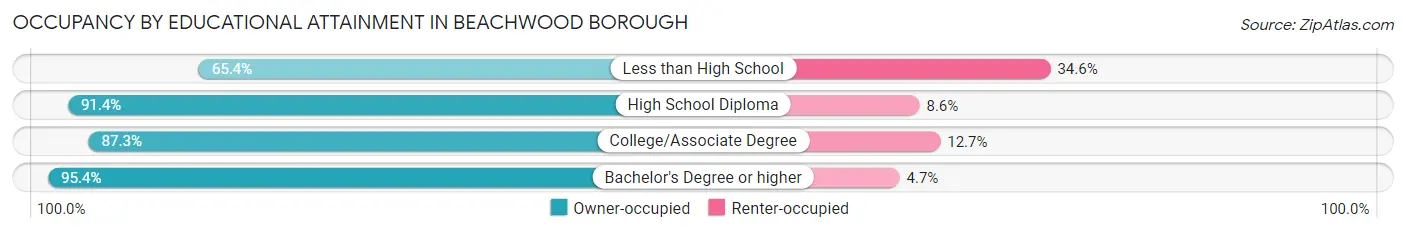
| Household Size | Owner-occupied | Renter-occupied |
| Less than High School | 89 (65.4%) | 47 (34.6%) |
| High School Diploma | 978 (91.4%) | 92 (8.6%) |
| College/Associate Degree | 1,387 (87.3%) | 202 (12.7%) |
| Bachelor's Degree or higher | 1,087 (95.4%) | 53 (4.6%) |
Occupancy by Age of Householder in Beachwood borough
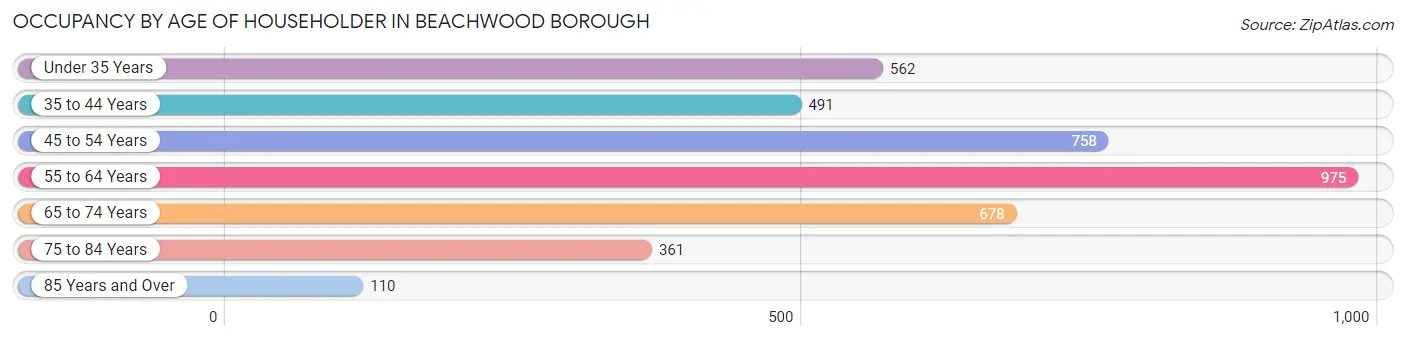
| Age Bracket | # Households | % Households |
| Under 35 Years | 562 | 14.3% |
| 35 to 44 Years | 491 | 12.5% |
| 45 to 54 Years | 758 | 19.3% |
| 55 to 64 Years | 975 | 24.8% |
| 65 to 74 Years | 678 | 17.2% |
| 75 to 84 Years | 361 | 9.2% |
| 85 Years and Over | 110 | 2.8% |
| Total | 3,935 | 100.0% |
Housing Finances in Beachwood borough
Median Income by Occupancy in Beachwood borough
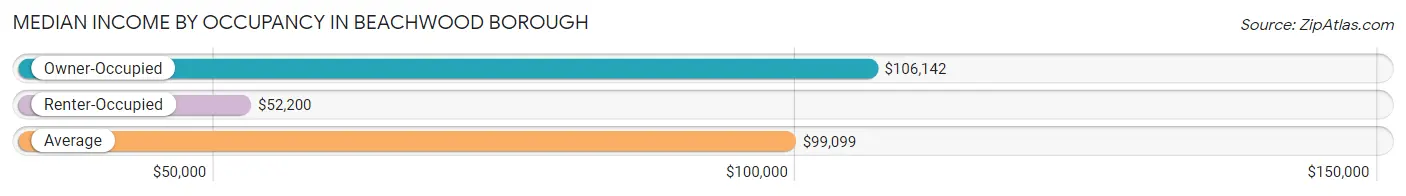
| Occupancy Type | # Households | Median Income |
| Owner-Occupied | 3,541 (90.0%) | $106,142 |
| Renter-Occupied | 394 (10.0%) | $52,200 |
| Average | 3,935 (100.0%) | $99,099 |
Occupancy by Householder Income Bracket in Beachwood borough
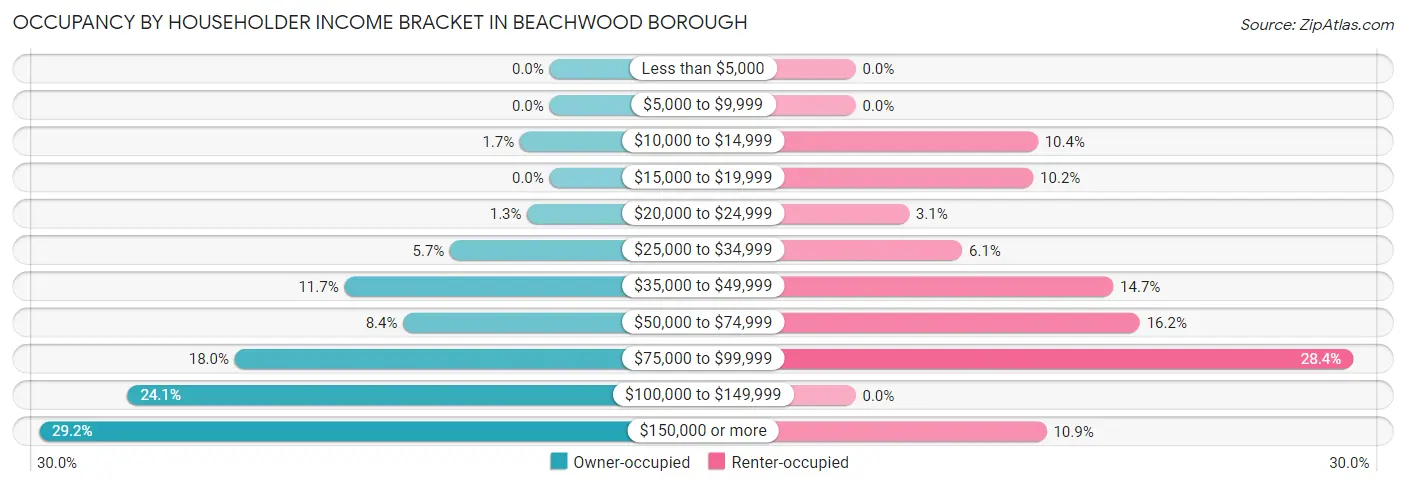
| Income Bracket | Owner-occupied | Renter-occupied |
| Less than $5,000 | 0 (0.0%) | 0 (0.0%) |
| $5,000 to $9,999 | 0 (0.0%) | 0 (0.0%) |
| $10,000 to $14,999 | 60 (1.7%) | 41 (10.4%) |
| $15,000 to $19,999 | 0 (0.0%) | 40 (10.2%) |
| $20,000 to $24,999 | 45 (1.3%) | 12 (3.0%) |
| $25,000 to $34,999 | 201 (5.7%) | 24 (6.1%) |
| $35,000 to $49,999 | 415 (11.7%) | 58 (14.7%) |
| $50,000 to $74,999 | 296 (8.4%) | 64 (16.2%) |
| $75,000 to $99,999 | 637 (18.0%) | 112 (28.4%) |
| $100,000 to $149,999 | 854 (24.1%) | 0 (0.0%) |
| $150,000 or more | 1,033 (29.2%) | 43 (10.9%) |
| Total | 3,541 (100.0%) | 394 (100.0%) |
Monthly Housing Cost Tiers in Beachwood borough
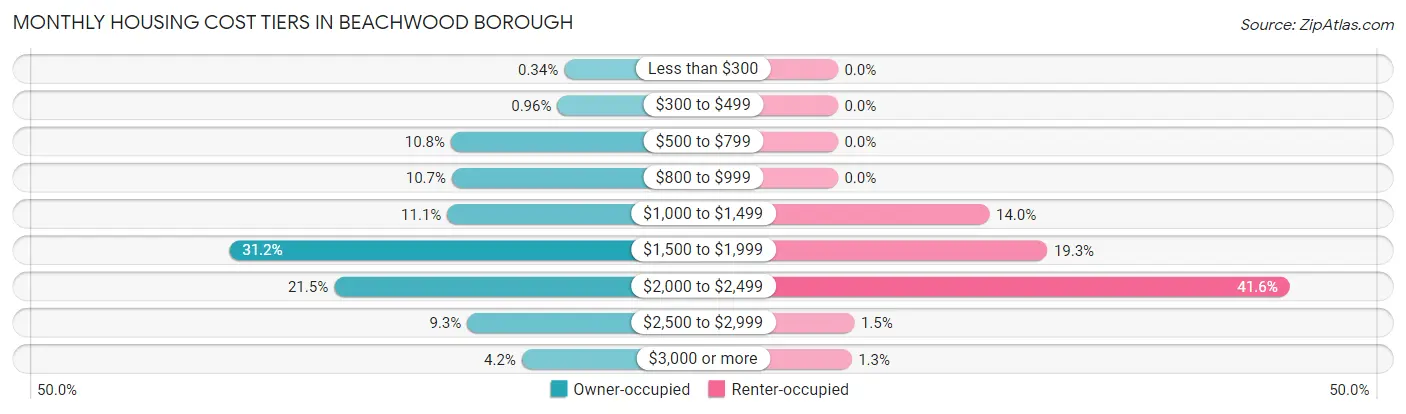
| Monthly Cost | Owner-occupied | Renter-occupied |
| Less than $300 | 12 (0.3%) | 0 (0.0%) |
| $300 to $499 | 34 (1.0%) | 0 (0.0%) |
| $500 to $799 | 381 (10.8%) | 0 (0.0%) |
| $800 to $999 | 378 (10.7%) | 0 (0.0%) |
| $1,000 to $1,499 | 393 (11.1%) | 55 (14.0%) |
| $1,500 to $1,999 | 1,103 (31.1%) | 76 (19.3%) |
| $2,000 to $2,499 | 762 (21.5%) | 164 (41.6%) |
| $2,500 to $2,999 | 328 (9.3%) | 6 (1.5%) |
| $3,000 or more | 150 (4.2%) | 5 (1.3%) |
| Total | 3,541 (100.0%) | 394 (100.0%) |
Physical Housing Characteristics in Beachwood borough
Housing Structures in Beachwood borough
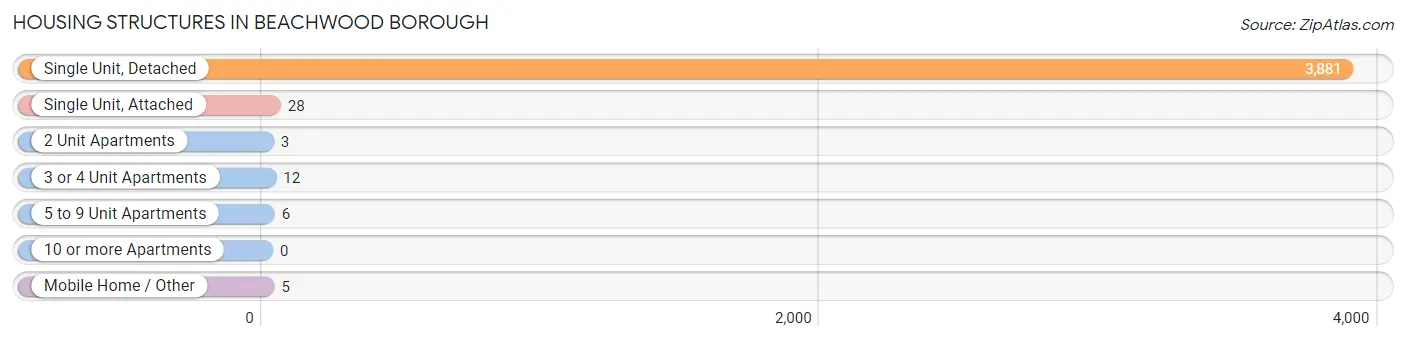
| Structure Type | # Housing Units | % Housing Units |
| Single Unit, Detached | 3,881 | 98.6% |
| Single Unit, Attached | 28 | 0.7% |
| 2 Unit Apartments | 3 | 0.1% |
| 3 or 4 Unit Apartments | 12 | 0.3% |
| 5 to 9 Unit Apartments | 6 | 0.2% |
| 10 or more Apartments | 0 | 0.0% |
| Mobile Home / Other | 5 | 0.1% |
| Total | 3,935 | 100.0% |
Housing Structures by Occupancy in Beachwood borough
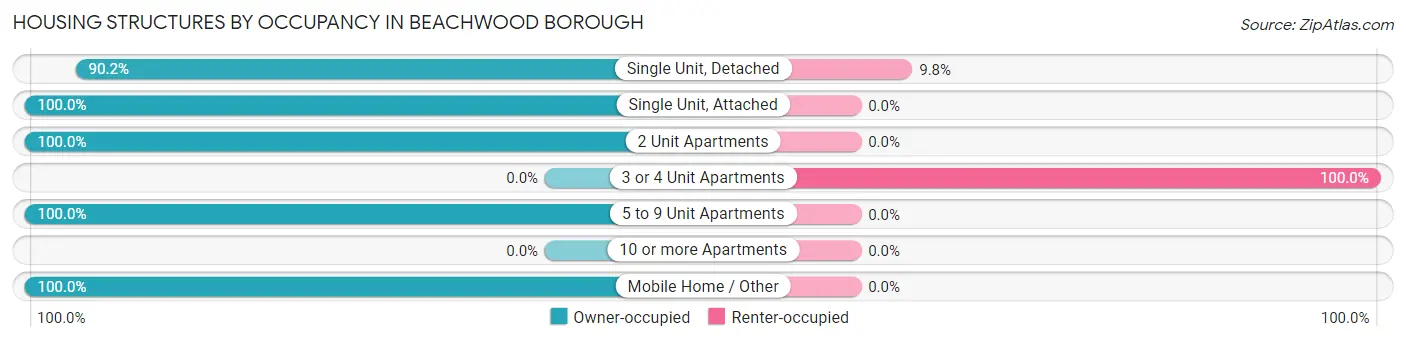
| Structure Type | Owner-occupied | Renter-occupied |
| Single Unit, Detached | 3,499 (90.2%) | 382 (9.8%) |
| Single Unit, Attached | 28 (100.0%) | 0 (0.0%) |
| 2 Unit Apartments | 3 (100.0%) | 0 (0.0%) |
| 3 or 4 Unit Apartments | 0 (0.0%) | 12 (100.0%) |
| 5 to 9 Unit Apartments | 6 (100.0%) | 0 (0.0%) |
| 10 or more Apartments | 0 (0.0%) | 0 (0.0%) |
| Mobile Home / Other | 5 (100.0%) | 0 (0.0%) |
| Total | 3,541 (90.0%) | 394 (10.0%) |
Housing Structures by Number of Rooms in Beachwood borough
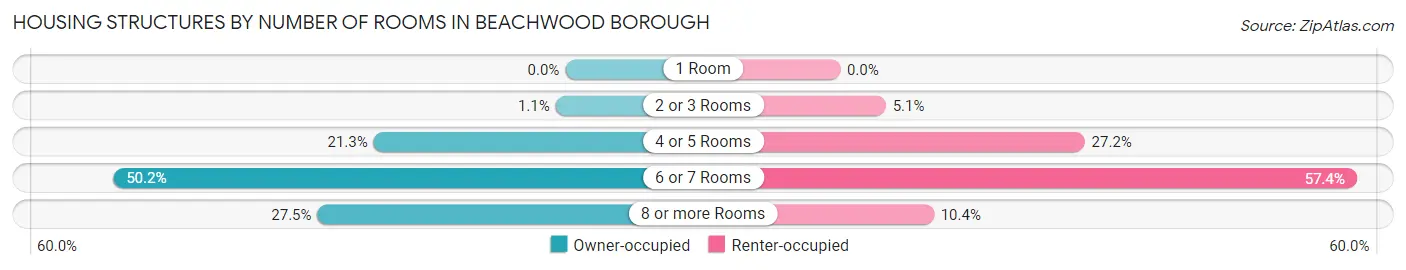
| Number of Rooms | Owner-occupied | Renter-occupied |
| 1 Room | 0 (0.0%) | 0 (0.0%) |
| 2 or 3 Rooms | 38 (1.1%) | 20 (5.1%) |
| 4 or 5 Rooms | 753 (21.3%) | 107 (27.2%) |
| 6 or 7 Rooms | 1,776 (50.2%) | 226 (57.4%) |
| 8 or more Rooms | 974 (27.5%) | 41 (10.4%) |
| Total | 3,541 (100.0%) | 394 (100.0%) |
Housing Structure by Heating Type in Beachwood borough
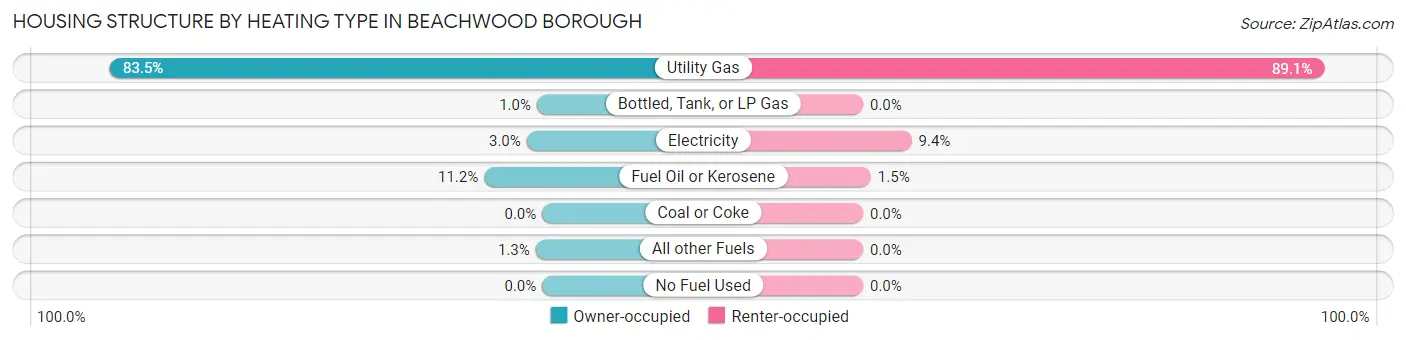
| Heating Type | Owner-occupied | Renter-occupied |
| Utility Gas | 2,957 (83.5%) | 351 (89.1%) |
| Bottled, Tank, or LP Gas | 36 (1.0%) | 0 (0.0%) |
| Electricity | 106 (3.0%) | 37 (9.4%) |
| Fuel Oil or Kerosene | 397 (11.2%) | 6 (1.5%) |
| Coal or Coke | 0 (0.0%) | 0 (0.0%) |
| All other Fuels | 45 (1.3%) | 0 (0.0%) |
| No Fuel Used | 0 (0.0%) | 0 (0.0%) |
| Total | 3,541 (100.0%) | 394 (100.0%) |
Household Vehicle Usage in Beachwood borough
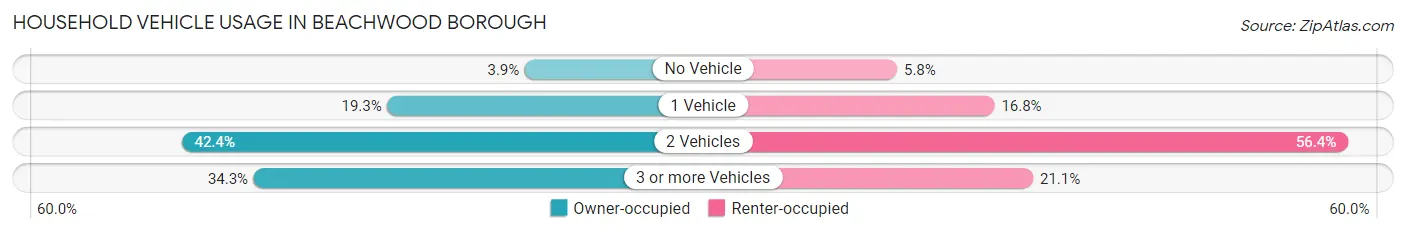
| Vehicles per Household | Owner-occupied | Renter-occupied |
| No Vehicle | 139 (3.9%) | 23 (5.8%) |
| 1 Vehicle | 685 (19.3%) | 66 (16.8%) |
| 2 Vehicles | 1,502 (42.4%) | 222 (56.4%) |
| 3 or more Vehicles | 1,215 (34.3%) | 83 (21.1%) |
| Total | 3,541 (100.0%) | 394 (100.0%) |
Real Estate & Mortgages in Beachwood borough
Real Estate and Mortgage Overview in Beachwood borough
| Characteristic | Without Mortgage | With Mortgage |
| Housing Units | 859 | 2,682 |
| Median Property Value | $268,300 | $285,800 |
| Median Household Income | $79,243 | $884 |
| Monthly Housing Costs | $818 | $150 |
| Real Estate Taxes | $5,841 | $48 |
Property Value by Mortgage Status in Beachwood borough
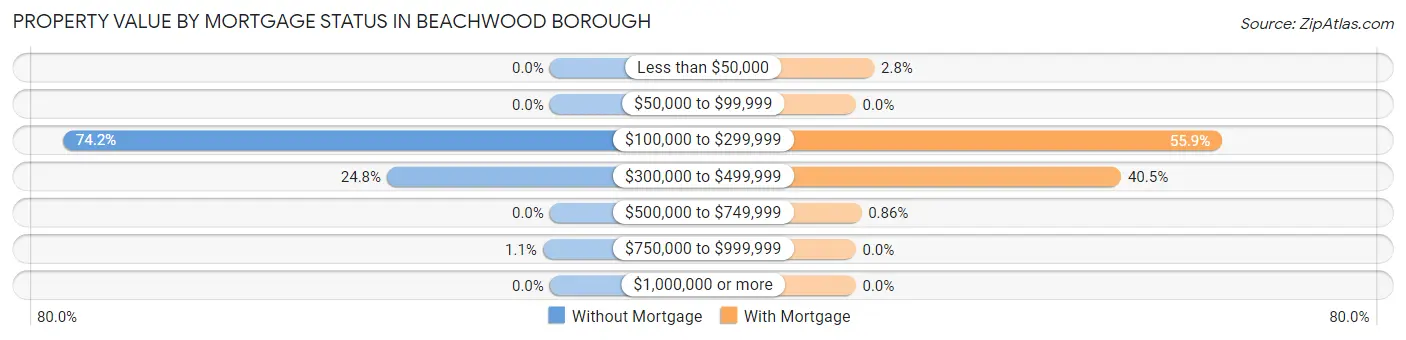
| Property Value | Without Mortgage | With Mortgage |
| Less than $50,000 | 0 (0.0%) | 76 (2.8%) |
| $50,000 to $99,999 | 0 (0.0%) | 0 (0.0%) |
| $100,000 to $299,999 | 637 (74.2%) | 1,498 (55.8%) |
| $300,000 to $499,999 | 213 (24.8%) | 1,085 (40.5%) |
| $500,000 to $749,999 | 0 (0.0%) | 23 (0.9%) |
| $750,000 to $999,999 | 9 (1.1%) | 0 (0.0%) |
| $1,000,000 or more | 0 (0.0%) | 0 (0.0%) |
| Total | 859 (100.0%) | 2,682 (100.0%) |
Household Income by Mortgage Status in Beachwood borough
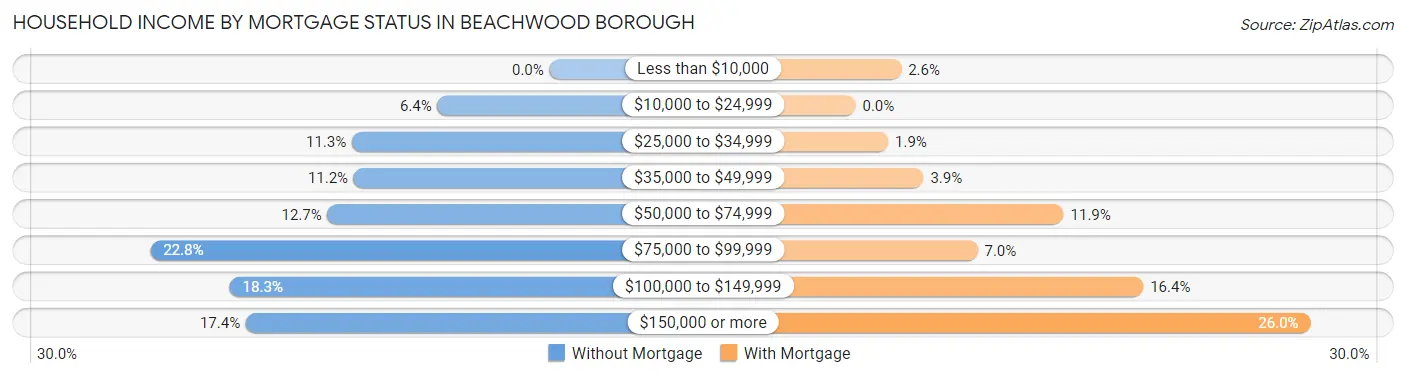
| Household Income | Without Mortgage | With Mortgage |
| Less than $10,000 | 0 (0.0%) | 70 (2.6%) |
| $10,000 to $24,999 | 55 (6.4%) | 0 (0.0%) |
| $25,000 to $34,999 | 97 (11.3%) | 50 (1.9%) |
| $35,000 to $49,999 | 96 (11.2%) | 104 (3.9%) |
| $50,000 to $74,999 | 109 (12.7%) | 319 (11.9%) |
| $75,000 to $99,999 | 196 (22.8%) | 187 (7.0%) |
| $100,000 to $149,999 | 157 (18.3%) | 441 (16.4%) |
| $150,000 or more | 149 (17.3%) | 697 (26.0%) |
| Total | 859 (100.0%) | 2,682 (100.0%) |
Property Value to Household Income Ratio in Beachwood borough
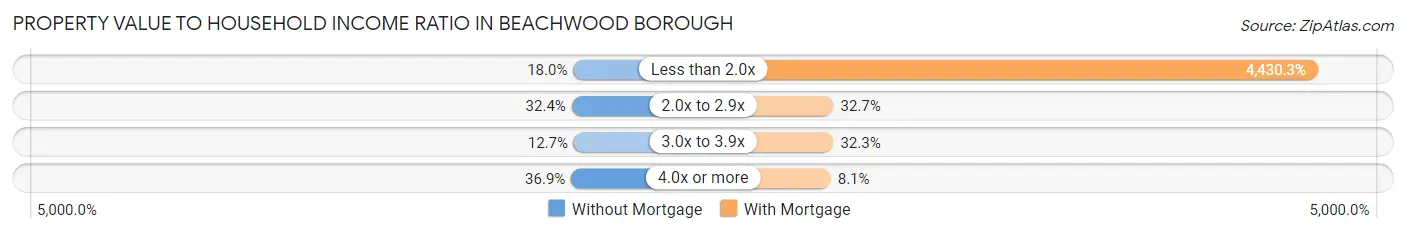
| Value-to-Income Ratio | Without Mortgage | With Mortgage |
| Less than 2.0x | 155 (18.0%) | 118,821 (4,430.3%) |
| 2.0x to 2.9x | 278 (32.4%) | 876 (32.7%) |
| 3.0x to 3.9x | 109 (12.7%) | 865 (32.3%) |
| 4.0x or more | 317 (36.9%) | 216 (8.1%) |
| Total | 859 (100.0%) | 2,682 (100.0%) |
Real Estate Taxes by Mortgage Status in Beachwood borough
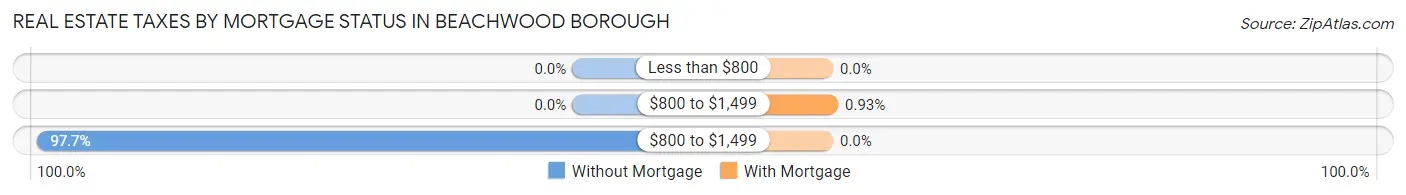
| Property Taxes | Without Mortgage | With Mortgage |
| Less than $800 | 0 (0.0%) | 0 (0.0%) |
| $800 to $1,499 | 0 (0.0%) | 25 (0.9%) |
| $800 to $1,499 | 839 (97.7%) | 0 (0.0%) |
| Total | 859 (100.0%) | 2,682 (100.0%) |
Health & Disability in Beachwood borough
Health Insurance Coverage by Age in Beachwood borough
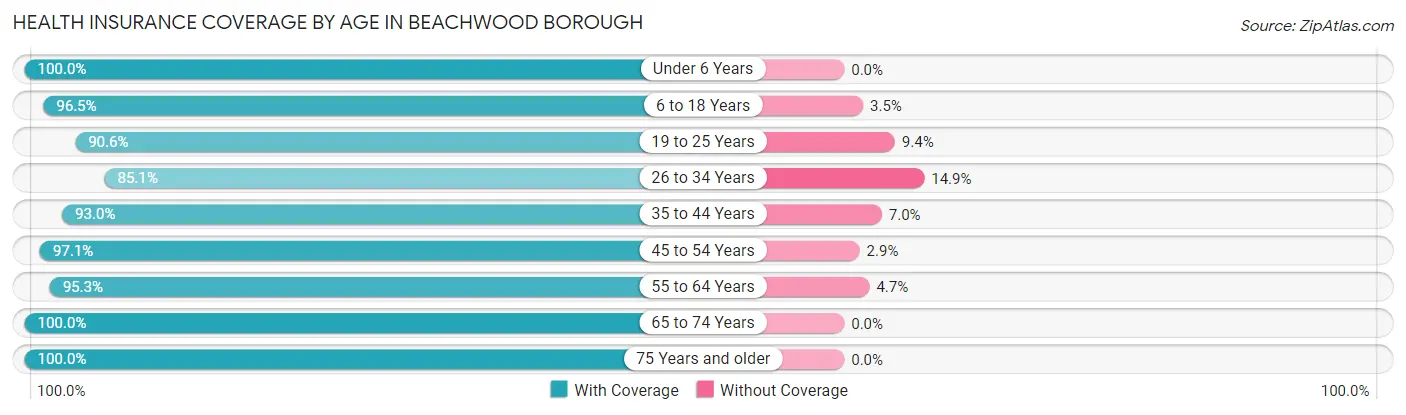
| Age Bracket | With Coverage | Without Coverage |
| Under 6 Years | 684 (100.0%) | 0 (0.0%) |
| 6 to 18 Years | 1,621 (96.5%) | 59 (3.5%) |
| 19 to 25 Years | 825 (90.6%) | 86 (9.4%) |
| 26 to 34 Years | 1,021 (85.1%) | 179 (14.9%) |
| 35 to 44 Years | 1,236 (93.0%) | 93 (7.0%) |
| 45 to 54 Years | 1,392 (97.1%) | 41 (2.9%) |
| 55 to 64 Years | 1,625 (95.3%) | 80 (4.7%) |
| 65 to 74 Years | 1,331 (100.0%) | 0 (0.0%) |
| 75 Years and older | 646 (100.0%) | 0 (0.0%) |
| Total | 10,381 (95.1%) | 538 (4.9%) |
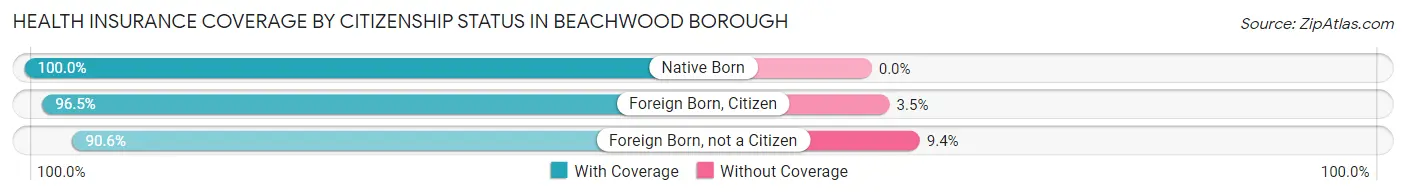
Health Insurance Coverage by Citizenship Status in Beachwood borough
| Citizenship Status | With Coverage | Without Coverage |
| Native Born | 684 (100.0%) | 0 (0.0%) |
| Foreign Born, Citizen | 1,621 (96.5%) | 59 (3.5%) |
| Foreign Born, not a Citizen | 825 (90.6%) | 86 (9.4%) |
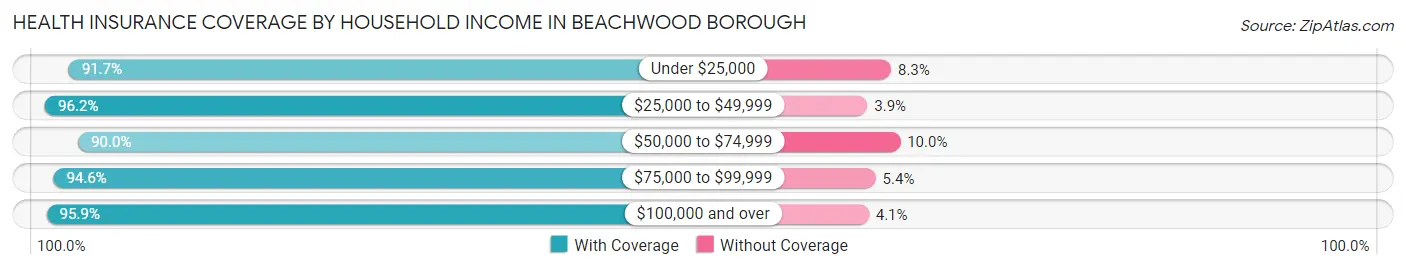
Health Insurance Coverage by Household Income in Beachwood borough
| Household Income | With Coverage | Without Coverage |
| Under $25,000 | 321 (91.7%) | 29 (8.3%) |
| $25,000 to $49,999 | 1,373 (96.2%) | 55 (3.8%) |
| $50,000 to $74,999 | 827 (90.0%) | 92 (10.0%) |
| $75,000 to $99,999 | 1,785 (94.6%) | 102 (5.4%) |
| $100,000 and over | 6,058 (95.9%) | 260 (4.1%) |
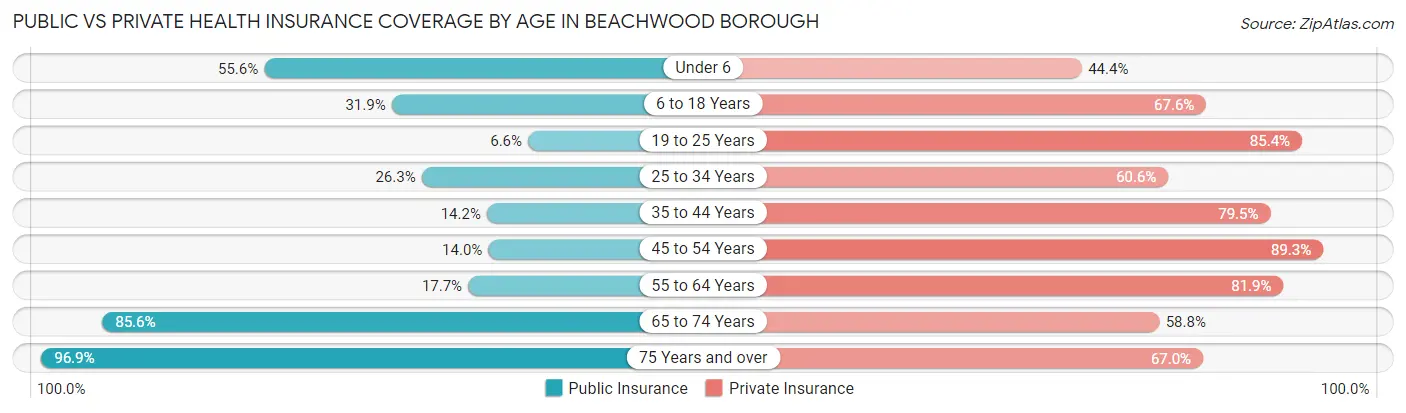
Public vs Private Health Insurance Coverage by Age in Beachwood borough
| Age Bracket | Public Insurance | Private Insurance |
| Under 6 | 380 (55.6%) | 304 (44.4%) |
| 6 to 18 Years | 536 (31.9%) | 1,136 (67.6%) |
| 19 to 25 Years | 60 (6.6%) | 778 (85.4%) |
| 25 to 34 Years | 316 (26.3%) | 727 (60.6%) |
| 35 to 44 Years | 189 (14.2%) | 1,057 (79.5%) |
| 45 to 54 Years | 200 (14.0%) | 1,280 (89.3%) |
| 55 to 64 Years | 302 (17.7%) | 1,397 (81.9%) |
| 65 to 74 Years | 1,139 (85.6%) | 783 (58.8%) |
| 75 Years and over | 626 (96.9%) | 433 (67.0%) |
| Total | 3,748 (34.3%) | 7,895 (72.3%) |
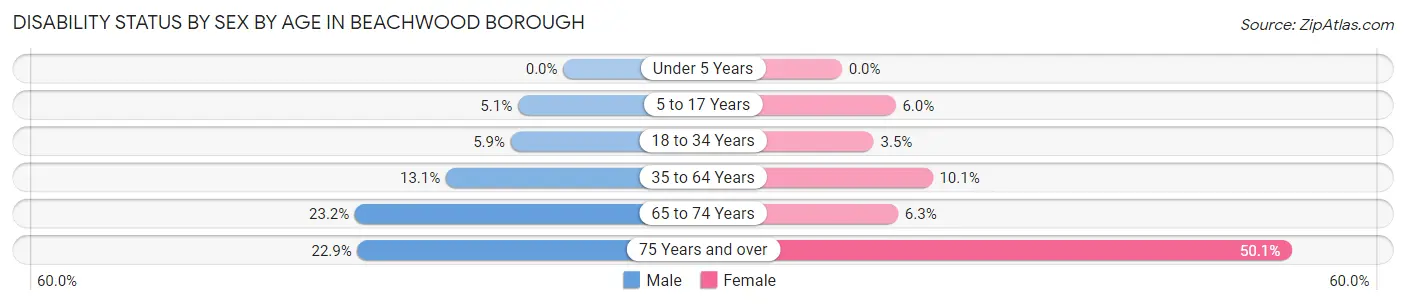
Disability Status by Sex by Age in Beachwood borough
| Age Bracket | Male | Female |
| Under 5 Years | 0 (0.0%) | 0 (0.0%) |
| 5 to 17 Years | 46 (5.1%) | 40 (6.0%) |
| 18 to 34 Years | 64 (5.9%) | 42 (3.5%) |
| 35 to 64 Years | 291 (13.1%) | 226 (10.1%) |
| 65 to 74 Years | 138 (23.2%) | 46 (6.2%) |
| 75 Years and over | 69 (22.9%) | 173 (50.1%) |
Disability Class by Sex by Age in Beachwood borough
Disability Class: Hearing Difficulty
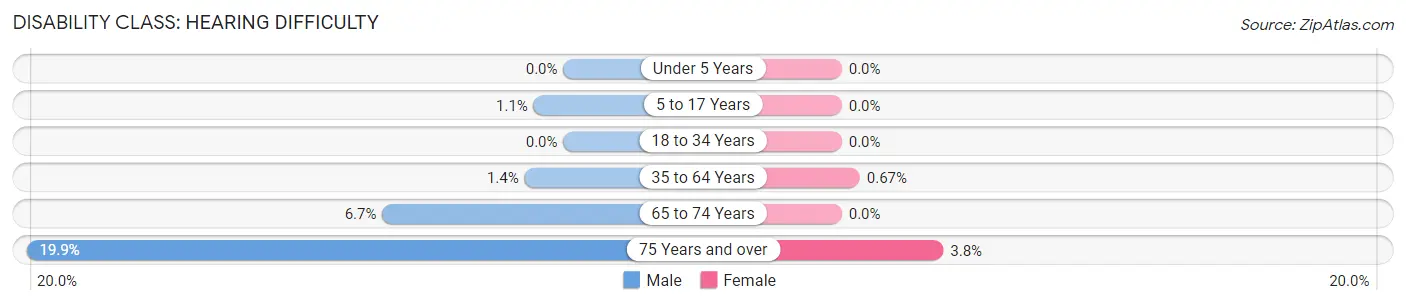
| Age Bracket | Male | Female |
| Under 5 Years | 0 (0.0%) | 0 (0.0%) |
| 5 to 17 Years | 10 (1.1%) | 0 (0.0%) |
| 18 to 34 Years | 0 (0.0%) | 0 (0.0%) |
| 35 to 64 Years | 32 (1.4%) | 15 (0.7%) |
| 65 to 74 Years | 40 (6.7%) | 0 (0.0%) |
| 75 Years and over | 60 (19.9%) | 13 (3.8%) |
Disability Class: Vision Difficulty
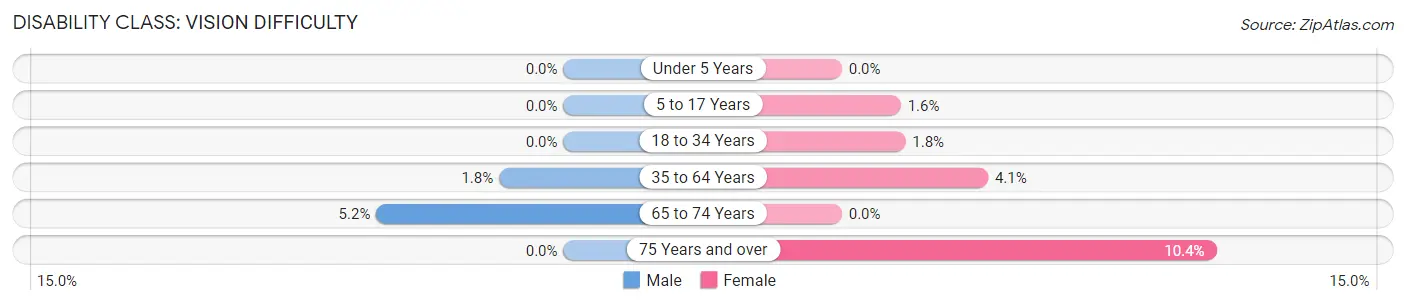
| Age Bracket | Male | Female |
| Under 5 Years | 0 (0.0%) | 0 (0.0%) |
| 5 to 17 Years | 0 (0.0%) | 11 (1.6%) |
| 18 to 34 Years | 0 (0.0%) | 21 (1.8%) |
| 35 to 64 Years | 40 (1.8%) | 91 (4.1%) |
| 65 to 74 Years | 31 (5.2%) | 0 (0.0%) |
| 75 Years and over | 0 (0.0%) | 36 (10.4%) |
Disability Class: Cognitive Difficulty
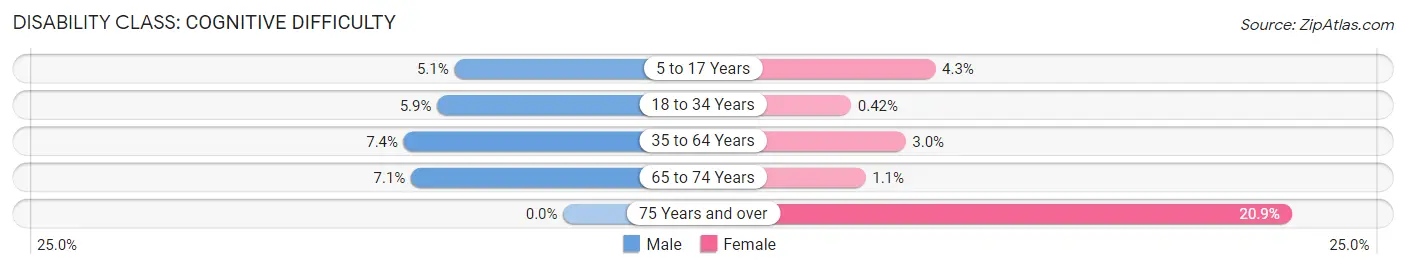
| Age Bracket | Male | Female |
| 5 to 17 Years | 46 (5.1%) | 29 (4.3%) |
| 18 to 34 Years | 64 (5.9%) | 5 (0.4%) |
| 35 to 64 Years | 165 (7.4%) | 66 (2.9%) |
| 65 to 74 Years | 42 (7.1%) | 8 (1.1%) |
| 75 Years and over | 0 (0.0%) | 72 (20.9%) |
Disability Class: Ambulatory Difficulty
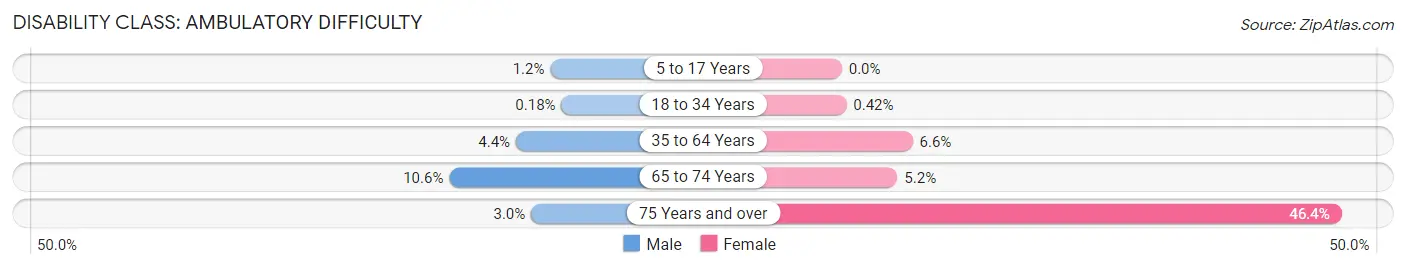
| Age Bracket | Male | Female |
| 5 to 17 Years | 11 (1.2%) | 0 (0.0%) |
| 18 to 34 Years | 2 (0.2%) | 5 (0.4%) |
| 35 to 64 Years | 98 (4.4%) | 147 (6.6%) |
| 65 to 74 Years | 63 (10.6%) | 38 (5.2%) |
| 75 Years and over | 9 (3.0%) | 160 (46.4%) |
Disability Class: Self-Care Difficulty
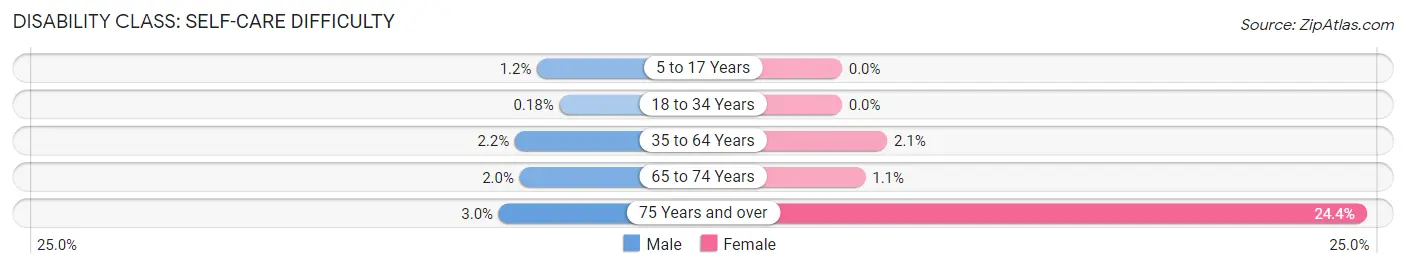
| Age Bracket | Male | Female |
| 5 to 17 Years | 11 (1.2%) | 0 (0.0%) |
| 18 to 34 Years | 2 (0.2%) | 0 (0.0%) |
| 35 to 64 Years | 50 (2.2%) | 47 (2.1%) |
| 65 to 74 Years | 12 (2.0%) | 8 (1.1%) |
| 75 Years and over | 9 (3.0%) | 84 (24.3%) |
Technology Access in Beachwood borough
Computing Device Access in Beachwood borough
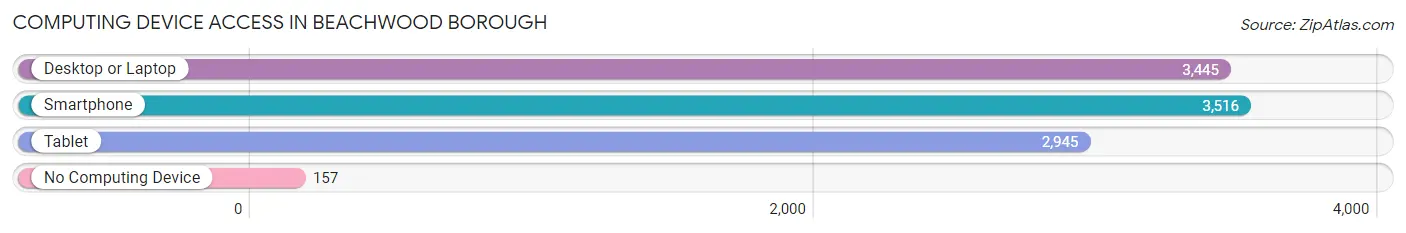
| Device Type | # Households | % Households |
| Desktop or Laptop | 3,445 | 87.5% |
| Smartphone | 3,516 | 89.3% |
| Tablet | 2,945 | 74.8% |
| No Computing Device | 157 | 4.0% |
| Total | 3,935 | 100.0% |
Internet Access in Beachwood borough
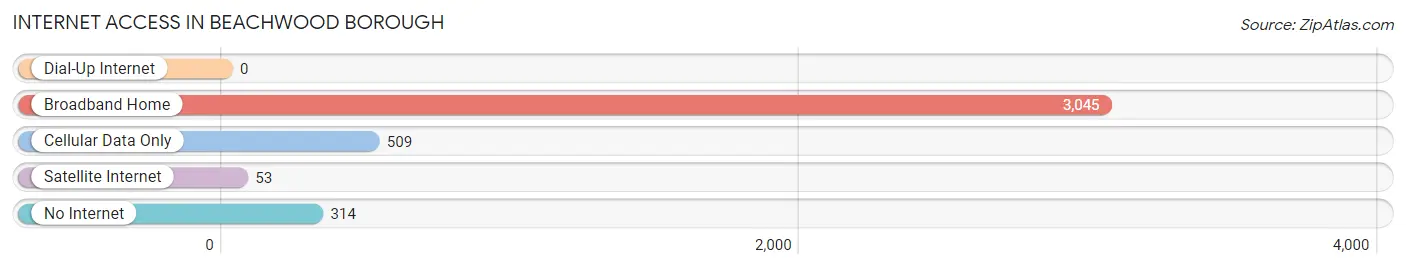
| Internet Type | # Households | % Households |
| Dial-Up Internet | 0 | 0.0% |
| Broadband Home | 3,045 | 77.4% |
| Cellular Data Only | 509 | 12.9% |
| Satellite Internet | 53 | 1.3% |
| No Internet | 314 | 8.0% |
| Total | 3,935 | 100.0% |
Beachwood borough Summary
Beachwood Borough is a small borough located in Ocean County, New Jersey. It is situated on the Barnegat Bay, and is part of the larger Toms River-Berkeley Township Metropolitan Statistical Area. The borough has a population of 11,045 as of the 2010 census, and is home to a diverse population of people from all walks of life.
Geography
Beachwood Borough is located in Ocean County, New Jersey, and is situated on the Barnegat Bay. It is bordered by Berkeley Township to the north, Toms River Township to the east, and Pine Beach to the south. The borough is approximately 4.5 square miles in size, and is home to a variety of natural features, including wetlands, forests, and beaches.
The borough is located in the humid subtropical climate zone, and experiences hot, humid summers and mild winters. The average temperature in the summer is around 75 degrees Fahrenheit, and the average temperature in the winter is around 40 degrees Fahrenheit. The average annual precipitation is around 45 inches.
Demographics
As of the 2010 census, Beachwood Borough had a population of 11,045. The racial makeup of the borough was 79.3% White, 11.2% African American, 0.3% Native American, 3.2% Asian, 0.1% Pacific Islander, 3.2% from other races, and 2.9% from two or more races. Hispanic or Latino of any race were 8.2% of the population.
The median household income in Beachwood Borough was $60,945 in 2019, and the median family income was $71,945. The per capita income was $30,945. About 6.2% of families and 8.2% of the population were below the poverty line, including 11.2% of those under age 18 and 5.2% of those age 65 or over.
Economy
Beachwood Borough is home to a variety of businesses, including retail stores, restaurants, and professional services. The borough is also home to a number of manufacturing and industrial businesses, including a plastics factory and a metal fabrication plant.
The borough is home to a number of tourist attractions, including the Beachwood Beach, the Beachwood Boardwalk, and the Beachwood Marina. The borough also hosts a number of festivals and events throughout the year, including the Beachwood Beach Festival and the Beachwood Arts and Crafts Festival.
History
Beachwood Borough was originally inhabited by the Lenape Native Americans. The area was first settled by Europeans in the late 17th century, and was incorporated as a borough in 1917.
The borough was originally a resort town, and was known for its beaches and boardwalk. The borough was also home to a number of amusement parks, including the Beachwood Amusement Park, which opened in the early 20th century.
In the late 20th century, the borough experienced a period of growth and development, as new businesses and residential developments were built. The borough is now home to a diverse population of people from all walks of life.
Common Questions
What is the Total Population of Beachwood borough?
Total Population of Beachwood borough is 10,933.
What is the Total Male Population of Beachwood borough?
Total Male Population of Beachwood borough is 5,344.
What is the Total Female Population of Beachwood borough?
Total Female Population of Beachwood borough is 5,589.
What is the Ratio of Males per 100 Females in Beachwood borough?
There are 95.62 Males per 100 Females in Beachwood borough.
What is the Ratio of Females per 100 Males in Beachwood borough?
There are 104.58 Females per 100 Males in Beachwood borough.
What is the Median Population Age in Beachwood borough?
Median Population Age in Beachwood borough is 42.1 Years.
What is the Average Family Size in Beachwood borough
Average Family Size in Beachwood borough is 3.1 People.
What is the Average Household Size in Beachwood borough
Average Household Size in Beachwood borough is 2.8 People.
What is Per Capita Income in Beachwood borough?
Per Capita income in Beachwood borough is $47,686.
What is the Median Family Income in Beachwood borough?
Median Family Income in Beachwood borough is $110,114.
What is the Median Household income in Beachwood borough?
Median Household Income in Beachwood borough is $99,099.
What is Income or Wage Gap in Beachwood borough?
Income or Wage Gap in Beachwood borough is 29.6%.
Women in Beachwood borough earn 70.4 cents for every dollar earned by a man.
What is Inequality or Gini Index in Beachwood borough?
Inequality or Gini Index in Beachwood borough is 0.40.
How Large is the Labor Force in Beachwood borough?
There are 6,415 People in the Labor Forcein in Beachwood borough.
What is the Percentage of People in the Labor Force in Beachwood borough?
71.5% of People are in the Labor Force in Beachwood borough.
What is the Unemployment Rate in Beachwood borough?
Unemployment Rate in Beachwood borough is 4.2%.