Lake Mohawk, NJ
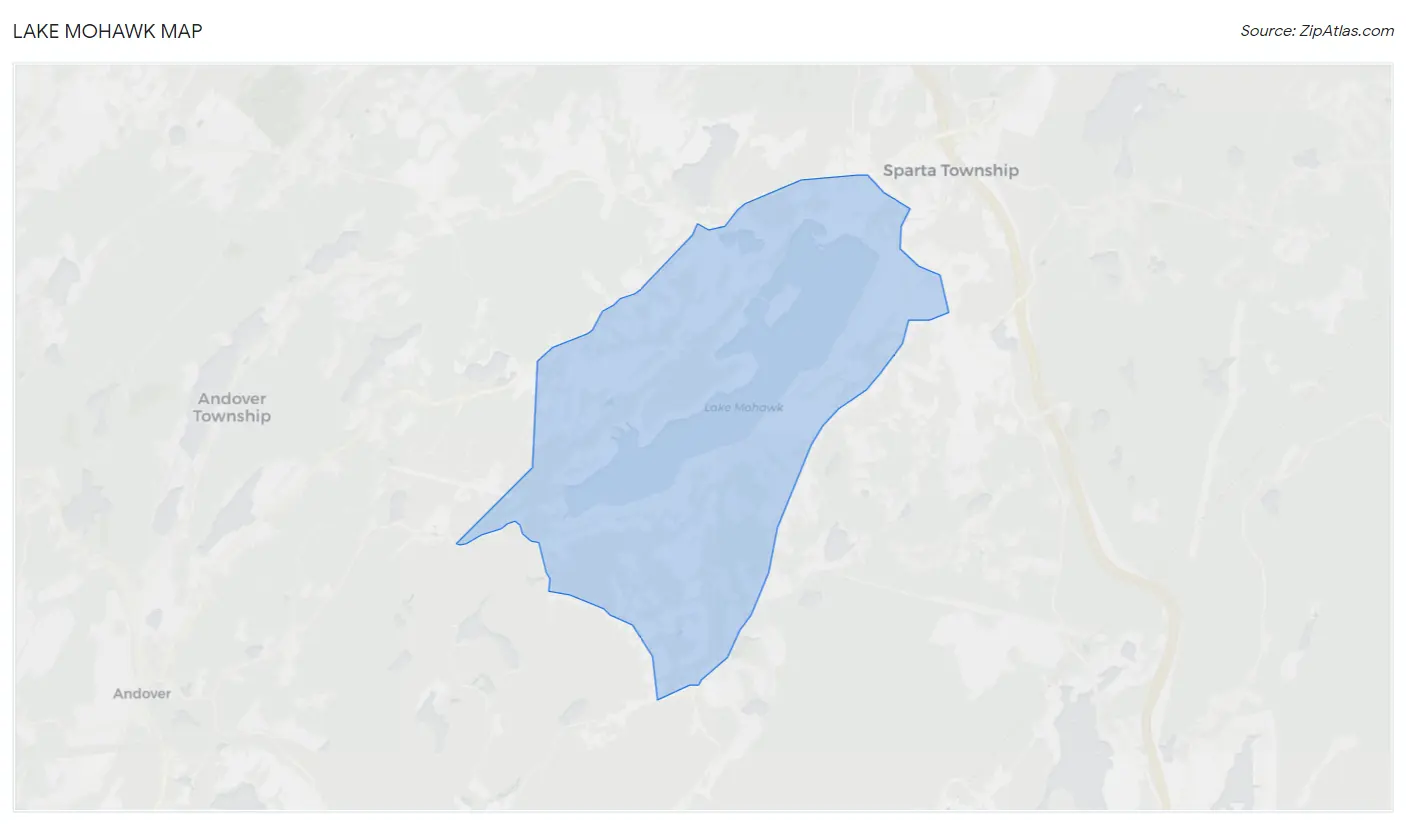
Lake Mohawk Map
Lake Mohawk Overview
9,703
TOTAL POPULATION
4,794
MALE POPULATION
4,909
FEMALE POPULATION
97.66
MALES / 100 FEMALES
102.40
FEMALES / 100 MALES
44.8
MEDIAN AGE
3.1
AVG FAMILY SIZE
2.5
AVG HOUSEHOLD SIZE
$66,203
PER CAPITA INCOME
$181,379
AVG FAMILY INCOME
$151,167
AVG HOUSEHOLD INCOME
27.3%
WAGE / INCOME GAP [ % ]
72.7¢/ $1
WAGE / INCOME GAP [ $ ]
0.38
INEQUALITY / GINI INDEX
5,173
LABOR FORCE [ PEOPLE ]
66.0%
PERCENT IN LABOR FORCE
1.9%
UNEMPLOYMENT RATE
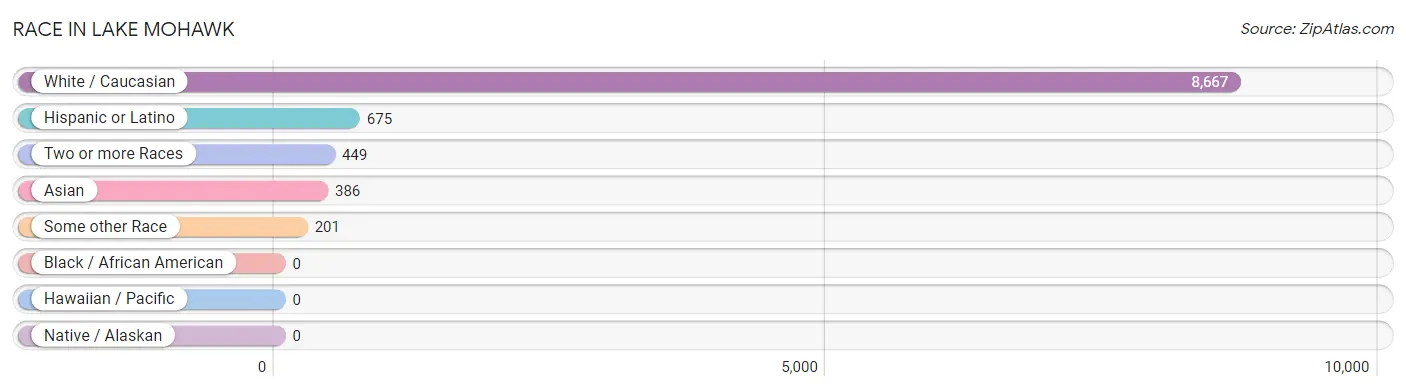
Race in Lake Mohawk
The most populous races in Lake Mohawk are White / Caucasian (8,667 | 89.3%), Hispanic or Latino (675 | 7.0%), and Two or more Races (449 | 4.6%).
| Race | # Population | % Population |
| Asian | 386 | 4.0% |
| Black / African American | 0 | 0.0% |
| Hawaiian / Pacific | 0 | 0.0% |
| Hispanic or Latino | 675 | 7.0% |
| Native / Alaskan | 0 | 0.0% |
| White / Caucasian | 8,667 | 89.3% |
| Two or more Races | 449 | 4.6% |
| Some other Race | 201 | 2.1% |
| Total | 9,703 | 100.0% |
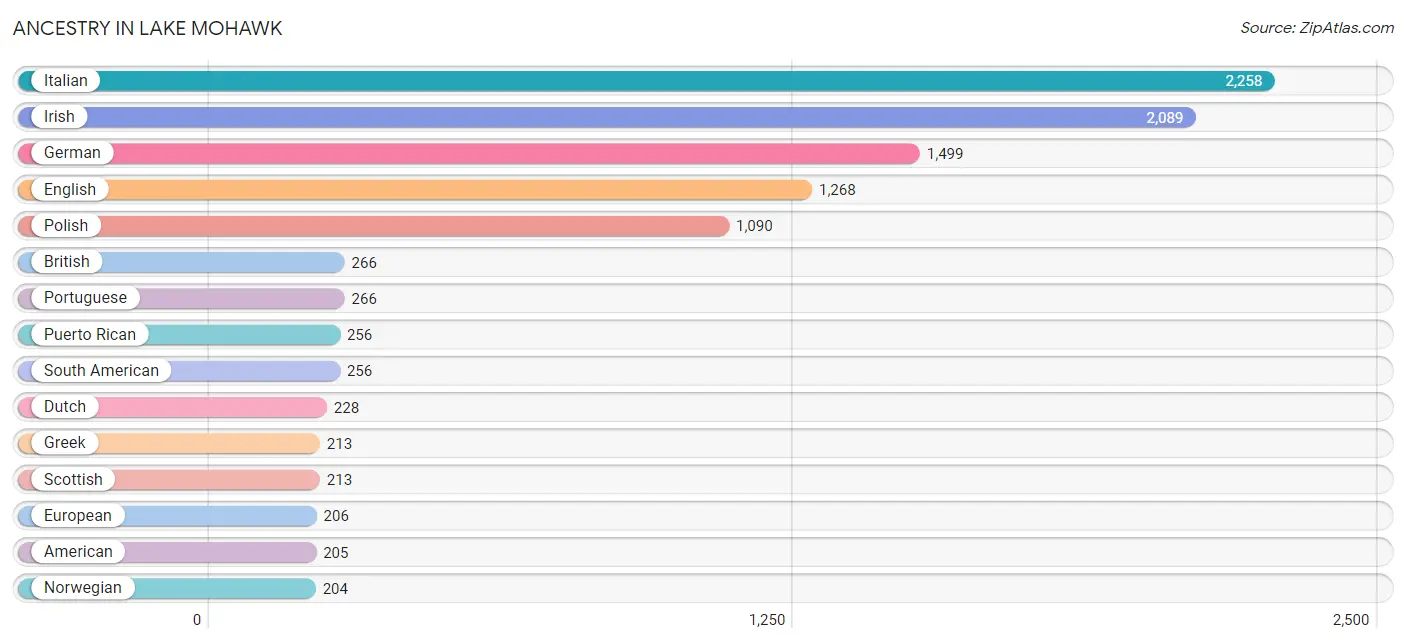
Ancestry in Lake Mohawk
The most populous ancestries reported in Lake Mohawk are Italian (2,258 | 23.3%), Irish (2,089 | 21.5%), German (1,499 | 15.4%), English (1,268 | 13.1%), and Polish (1,090 | 11.2%), together accounting for 84.5% of all Lake Mohawk residents.
| Ancestry | # Population | % Population |
| American | 205 | 2.1% |
| Arab | 17 | 0.2% |
| Argentinean | 69 | 0.7% |
| Armenian | 70 | 0.7% |
| Austrian | 16 | 0.2% |
| Belgian | 85 | 0.9% |
| Bhutanese | 5 | 0.1% |
| Brazilian | 74 | 0.8% |
| British | 266 | 2.7% |
| Canadian | 16 | 0.2% |
| Colombian | 129 | 1.3% |
| Croatian | 22 | 0.2% |
| Cuban | 47 | 0.5% |
| Czech | 25 | 0.3% |
| Czechoslovakian | 23 | 0.2% |
| Danish | 11 | 0.1% |
| Dominican | 6 | 0.1% |
| Dutch | 228 | 2.4% |
| Eastern European | 47 | 0.5% |
| Ecuadorian | 22 | 0.2% |
| English | 1,268 | 13.1% |
| European | 206 | 2.1% |
| Finnish | 17 | 0.2% |
| French | 188 | 1.9% |
| French Canadian | 12 | 0.1% |
| German | 1,499 | 15.4% |
| Greek | 213 | 2.2% |
| Hungarian | 88 | 0.9% |
| Indian (Asian) | 161 | 1.7% |
| Irish | 2,089 | 21.5% |
| Israeli | 20 | 0.2% |
| Italian | 2,258 | 23.3% |
| Korean | 170 | 1.8% |
| Lebanese | 17 | 0.2% |
| Lithuanian | 16 | 0.2% |
| Mexican | 38 | 0.4% |
| Northern European | 18 | 0.2% |
| Norwegian | 204 | 2.1% |
| Pennsylvania German | 16 | 0.2% |
| Peruvian | 30 | 0.3% |
| Polish | 1,090 | 11.2% |
| Portuguese | 266 | 2.7% |
| Puerto Rican | 256 | 2.6% |
| Russian | 105 | 1.1% |
| Scandinavian | 34 | 0.4% |
| Scotch-Irish | 65 | 0.7% |
| Scottish | 213 | 2.2% |
| Slavic | 32 | 0.3% |
| Slovak | 44 | 0.4% |
| Slovene | 20 | 0.2% |
| South American | 256 | 2.6% |
| Spaniard | 72 | 0.7% |
| Sri Lankan | 44 | 0.4% |
| Swedish | 65 | 0.7% |
| Swiss | 71 | 0.7% |
| Thai | 148 | 1.5% |
| Turkish | 35 | 0.4% |
| Ukrainian | 59 | 0.6% |
| Welsh | 78 | 0.8% |
| Yugoslavian | 17 | 0.2% | View All 60 Rows |
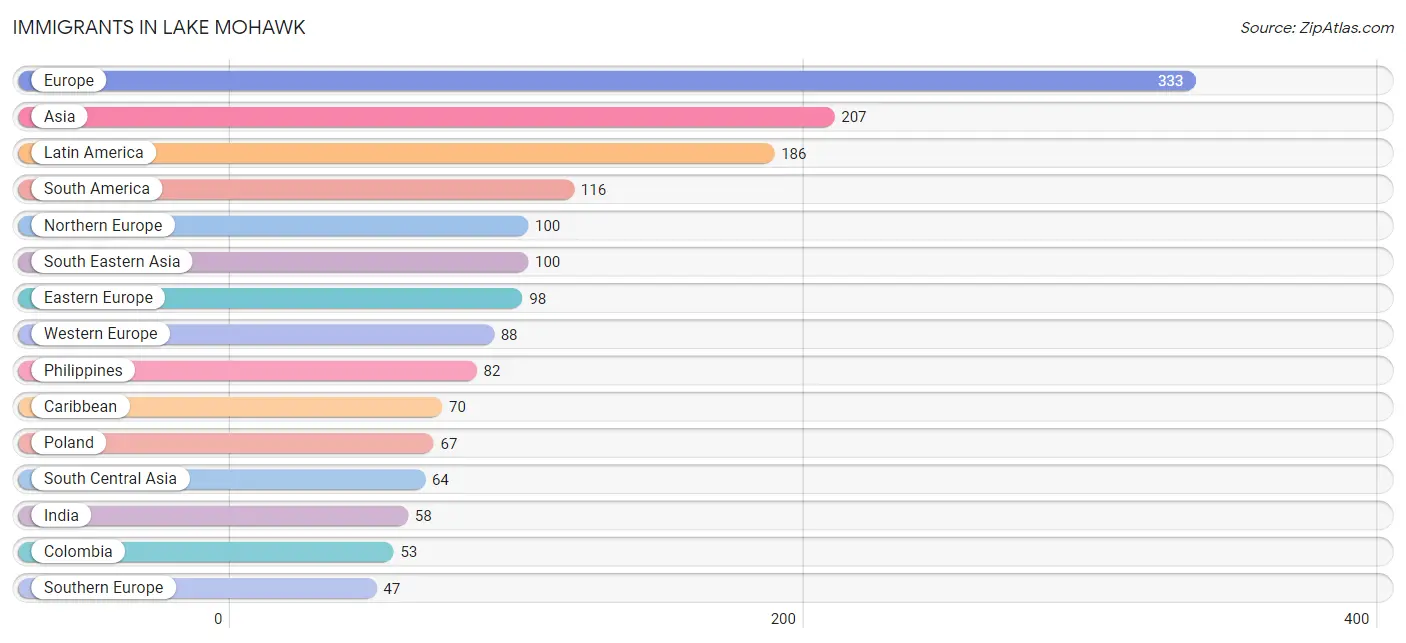
Immigrants in Lake Mohawk
The most numerous immigrant groups reported in Lake Mohawk came from Europe (333 | 3.4%), Asia (207 | 2.1%), Latin America (186 | 1.9%), South America (116 | 1.2%), and Northern Europe (100 | 1.0%), together accounting for 9.7% of all Lake Mohawk residents.
| Immigration Origin | # Population | % Population |
| Argentina | 20 | 0.2% |
| Asia | 207 | 2.1% |
| Austria | 16 | 0.2% |
| Belarus | 10 | 0.1% |
| Canada | 19 | 0.2% |
| Caribbean | 70 | 0.7% |
| China | 43 | 0.4% |
| Colombia | 53 | 0.5% |
| Cuba | 36 | 0.4% |
| Eastern Asia | 43 | 0.4% |
| Eastern Europe | 98 | 1.0% |
| Ecuador | 28 | 0.3% |
| England | 34 | 0.4% |
| Europe | 333 | 3.4% |
| Germany | 40 | 0.4% |
| Haiti | 18 | 0.2% |
| Hong Kong | 3 | 0.0% |
| India | 58 | 0.6% |
| Italy | 24 | 0.3% |
| Latin America | 186 | 1.9% |
| Malaysia | 3 | 0.0% |
| Netherlands | 32 | 0.3% |
| Northern Europe | 100 | 1.0% |
| Peru | 15 | 0.2% |
| Philippines | 82 | 0.9% |
| Poland | 67 | 0.7% |
| Romania | 10 | 0.1% |
| Russia | 11 | 0.1% |
| Scotland | 17 | 0.2% |
| South America | 116 | 1.2% |
| South Central Asia | 64 | 0.7% |
| South Eastern Asia | 100 | 1.0% |
| Southern Europe | 47 | 0.5% |
| Spain | 23 | 0.2% |
| Sri Lanka | 6 | 0.1% |
| Trinidad and Tobago | 16 | 0.2% |
| Vietnam | 15 | 0.2% |
| Western Europe | 88 | 0.9% | View All 38 Rows |
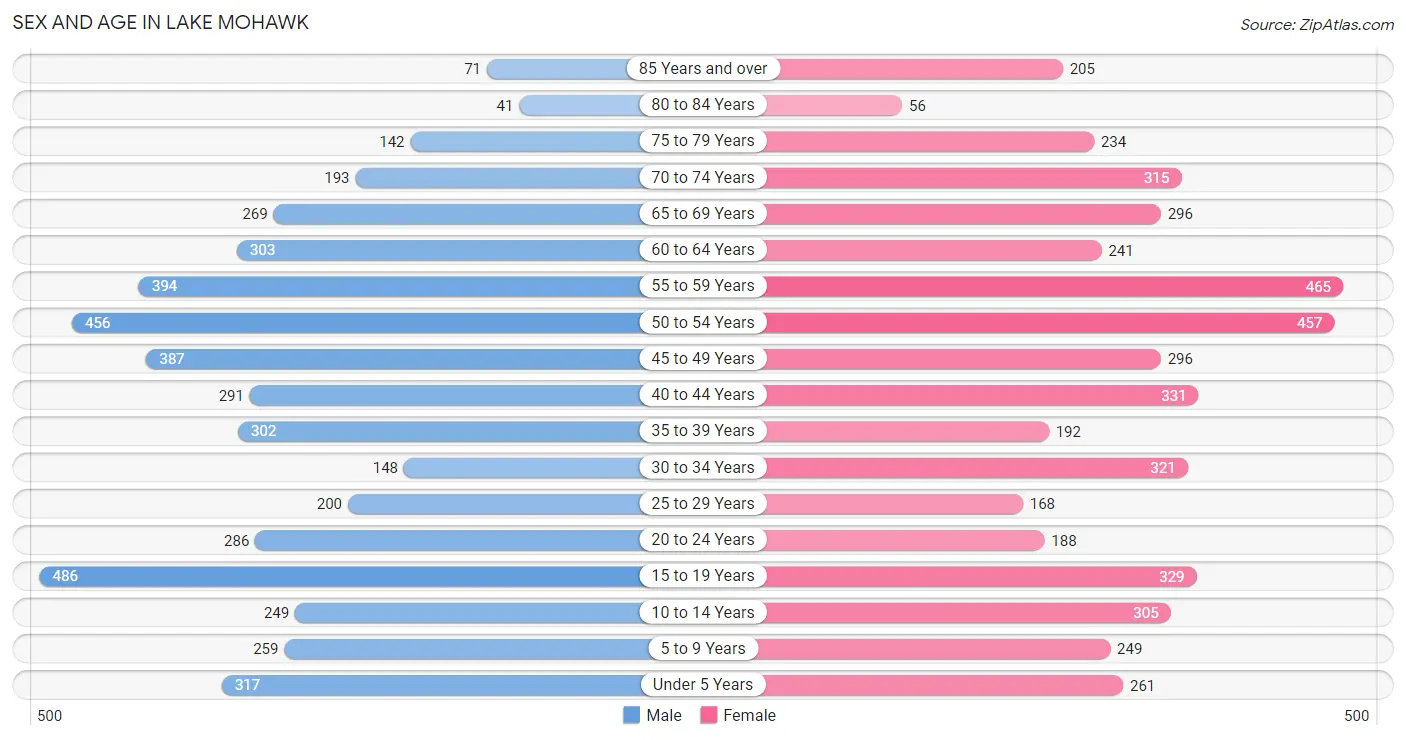
Sex and Age in Lake Mohawk
Sex and Age in Lake Mohawk
The most populous age groups in Lake Mohawk are 15 to 19 Years (486 | 10.1%) for men and 55 to 59 Years (465 | 9.5%) for women.
| Age Bracket | Male | Female |
| Under 5 Years | 317 (6.6%) | 261 (5.3%) |
| 5 to 9 Years | 259 (5.4%) | 249 (5.1%) |
| 10 to 14 Years | 249 (5.2%) | 305 (6.2%) |
| 15 to 19 Years | 486 (10.1%) | 329 (6.7%) |
| 20 to 24 Years | 286 (6.0%) | 188 (3.8%) |
| 25 to 29 Years | 200 (4.2%) | 168 (3.4%) |
| 30 to 34 Years | 148 (3.1%) | 321 (6.5%) |
| 35 to 39 Years | 302 (6.3%) | 192 (3.9%) |
| 40 to 44 Years | 291 (6.1%) | 331 (6.7%) |
| 45 to 49 Years | 387 (8.1%) | 296 (6.0%) |
| 50 to 54 Years | 456 (9.5%) | 457 (9.3%) |
| 55 to 59 Years | 394 (8.2%) | 465 (9.5%) |
| 60 to 64 Years | 303 (6.3%) | 241 (4.9%) |
| 65 to 69 Years | 269 (5.6%) | 296 (6.0%) |
| 70 to 74 Years | 193 (4.0%) | 315 (6.4%) |
| 75 to 79 Years | 142 (3.0%) | 234 (4.8%) |
| 80 to 84 Years | 41 (0.9%) | 56 (1.1%) |
| 85 Years and over | 71 (1.5%) | 205 (4.2%) |
| Total | 4,794 (100.0%) | 4,909 (100.0%) |
Families and Households in Lake Mohawk
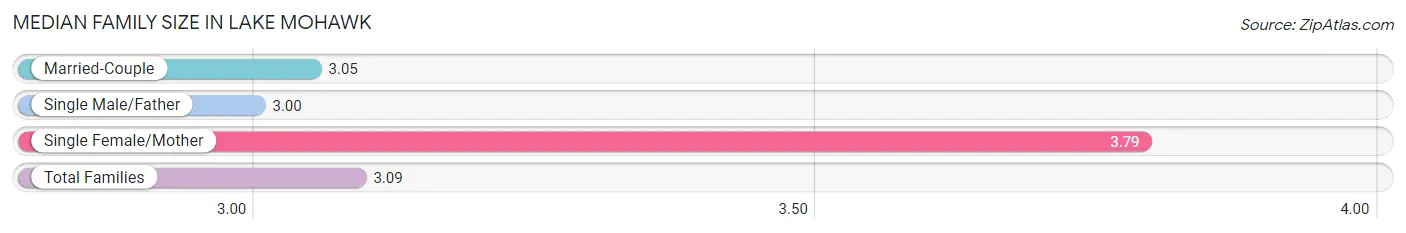
Median Family Size in Lake Mohawk
The median family size in Lake Mohawk is 3.09 persons per family, with single female/mother families (154 | 5.6%) accounting for the largest median family size of 3.79 persons per family. On the other hand, single male/father families (37 | 1.4%) represent the smallest median family size with 3.00 persons per family.
| Family Type | # Families | Family Size |
| Married-Couple | 2,539 (93.0%) | 3.05 |
| Single Male/Father | 37 (1.4%) | 3.00 |
| Single Female/Mother | 154 (5.6%) | 3.79 |
| Total Families | 2,730 (100.0%) | 3.09 |
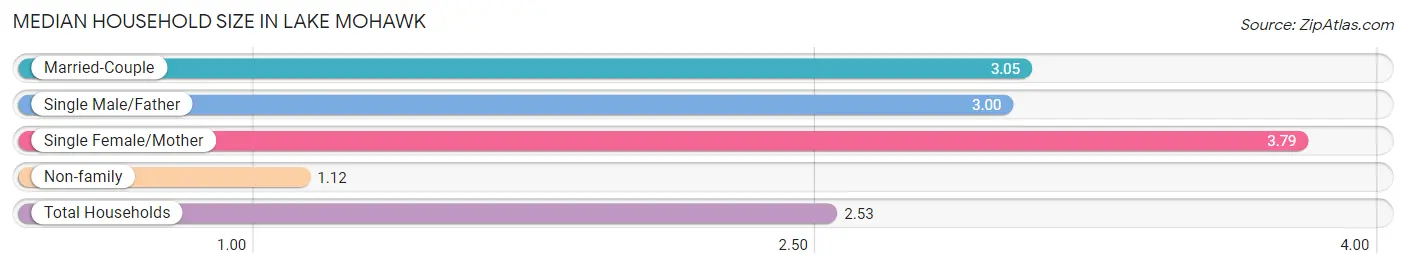
Median Household Size in Lake Mohawk
The median household size in Lake Mohawk is 2.53 persons per household, with single female/mother households (154 | 4.0%) accounting for the largest median household size of 3.79 persons per household. non-family households (1,094 | 28.6%) represent the smallest median household size with 1.12 persons per household.
| Household Type | # Households | Household Size |
| Married-Couple | 2,539 (66.4%) | 3.05 |
| Single Male/Father | 37 (1.0%) | 3.00 |
| Single Female/Mother | 154 (4.0%) | 3.79 |
| Non-family | 1,094 (28.6%) | 1.12 |
| Total Households | 3,824 (100.0%) | 2.53 |
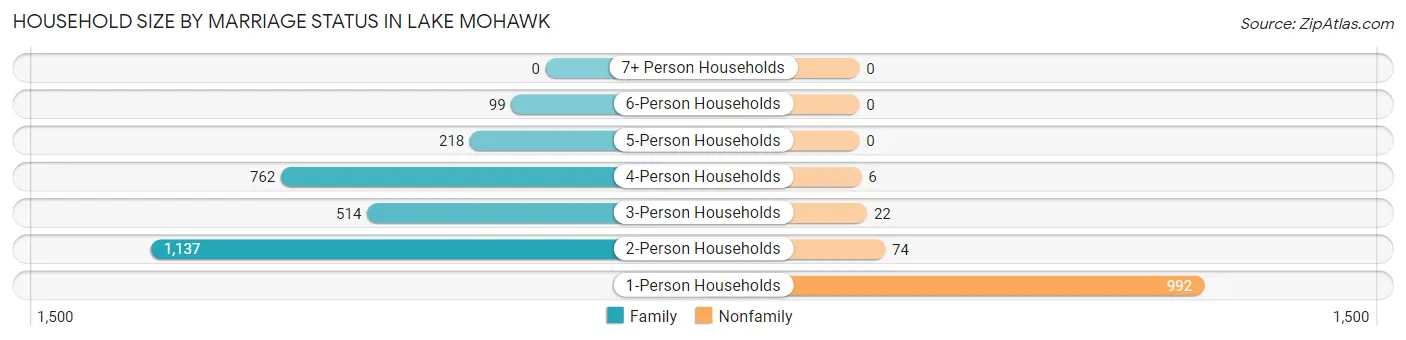
Household Size by Marriage Status in Lake Mohawk
Out of a total of 3,824 households in Lake Mohawk, 2,730 (71.4%) are family households, while 1,094 (28.6%) are nonfamily households. The most numerous type of family households are 2-person households, comprising 1,137, and the most common type of nonfamily households are 1-person households, comprising 992.
| Household Size | Family Households | Nonfamily Households |
| 1-Person Households | - | 992 (25.9%) |
| 2-Person Households | 1,137 (29.7%) | 74 (1.9%) |
| 3-Person Households | 514 (13.4%) | 22 (0.6%) |
| 4-Person Households | 762 (19.9%) | 6 (0.2%) |
| 5-Person Households | 218 (5.7%) | 0 (0.0%) |
| 6-Person Households | 99 (2.6%) | 0 (0.0%) |
| 7+ Person Households | 0 (0.0%) | 0 (0.0%) |
| Total | 2,730 (71.4%) | 1,094 (28.6%) |
Female Fertility in Lake Mohawk
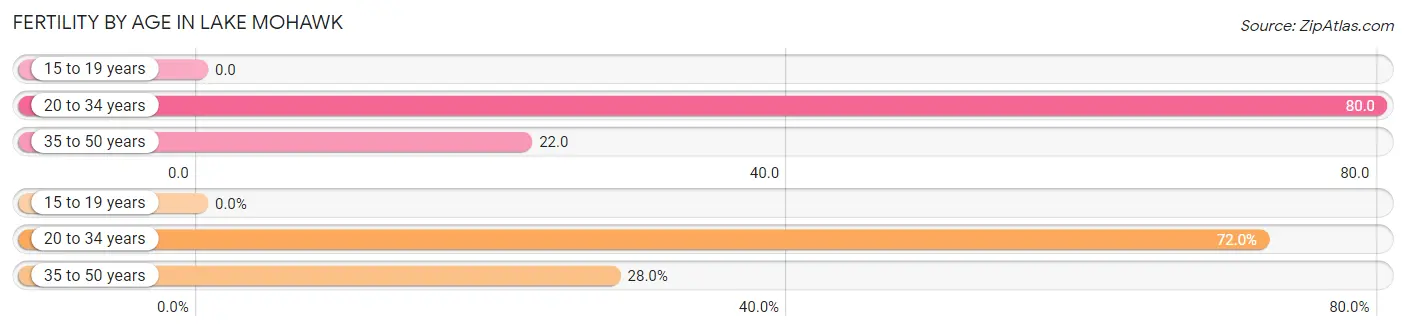
Fertility by Age in Lake Mohawk
Average fertility rate in Lake Mohawk is 38.0 births per 1,000 women. Women in the age bracket of 20 to 34 years have the highest fertility rate with 80.0 births per 1,000 women. Women in the age bracket of 20 to 34 years acount for 72.0% of all women with births.
| Age Bracket | Women with Births | Births / 1,000 Women |
| 15 to 19 years | 0 (0.0%) | 0.0 |
| 20 to 34 years | 54 (72.0%) | 80.0 |
| 35 to 50 years | 21 (28.0%) | 22.0 |
| Total | 75 (100.0%) | 38.0 |
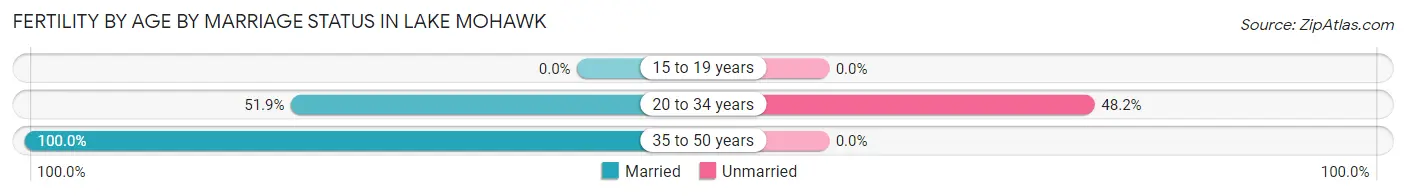
Fertility by Age by Marriage Status in Lake Mohawk
65.3% of women with births (75) in Lake Mohawk are married. The highest percentage of unmarried women with births falls into 20 to 34 years age bracket with 48.1% of them unmarried at the time of birth, while the lowest percentage of unmarried women with births belong to 35 to 50 years age bracket with 0.0% of them unmarried.
| Age Bracket | Married | Unmarried |
| 15 to 19 years | 0 (0.0%) | 0 (0.0%) |
| 20 to 34 years | 28 (51.8%) | 26 (48.1%) |
| 35 to 50 years | 21 (100.0%) | 0 (0.0%) |
| Total | 49 (65.3%) | 26 (34.7%) |
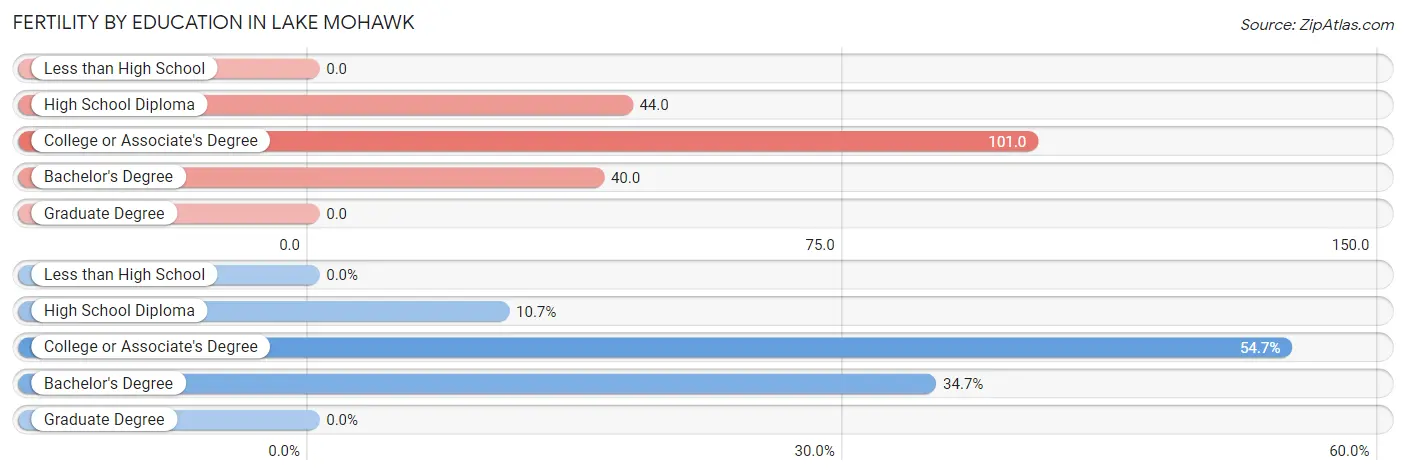
Fertility by Education in Lake Mohawk
| Educational Attainment | Women with Births | Births / 1,000 Women |
| Less than High School | 0 (0.0%) | 0.0 |
| High School Diploma | 8 (10.7%) | 44.0 |
| College or Associate's Degree | 41 (54.7%) | 101.0 |
| Bachelor's Degree | 26 (34.7%) | 40.0 |
| Graduate Degree | 0 (0.0%) | 0.0 |
| Total | 75 (100.0%) | 38.0 |
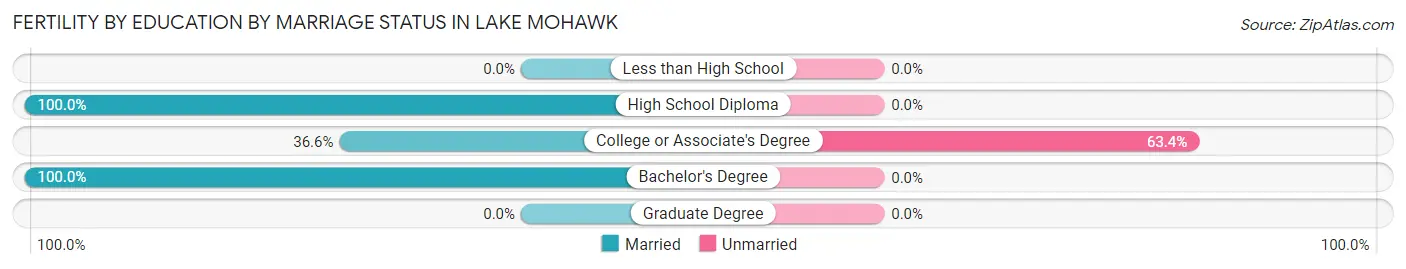
Fertility by Education by Marriage Status in Lake Mohawk
34.7% of women with births in Lake Mohawk are unmarried. Women with the educational attainment of high school diploma are most likely to be married with 100.0% of them married at childbirth, while women with the educational attainment of college or associate's degree are least likely to be married with 63.4% of them unmarried at childbirth.
| Educational Attainment | Married | Unmarried |
| Less than High School | 0 (0.0%) | 0 (0.0%) |
| High School Diploma | 8 (100.0%) | 0 (0.0%) |
| College or Associate's Degree | 15 (36.6%) | 26 (63.4%) |
| Bachelor's Degree | 26 (100.0%) | 0 (0.0%) |
| Graduate Degree | 0 (0.0%) | 0 (0.0%) |
| Total | 49 (65.3%) | 26 (34.7%) |
Income in Lake Mohawk
Income Overview in Lake Mohawk
Per Capita Income in Lake Mohawk is $66,203, while median incomes of families and households are $181,379 and $151,167 respectively.
| Characteristic | Number | Measure |
| Per Capita Income | 9,703 | $66,203 |
| Median Family Income | 2,730 | $181,379 |
| Mean Family Income | 2,730 | $202,320 |
| Median Household Income | 3,824 | $151,167 |
| Mean Household Income | 3,824 | $170,058 |
| Income Deficit | 2,730 | $0 |
| Wage / Income Gap (%) | 9,703 | 27.29% |
| Wage / Income Gap ($) | 9,703 | 72.71¢ per $1 |
| Gini / Inequality Index | 9,703 | 0.38 |
Earnings by Sex in Lake Mohawk
Average Earnings in Lake Mohawk are $74,724, $90,536 for men and $65,829 for women, a difference of 27.3%.
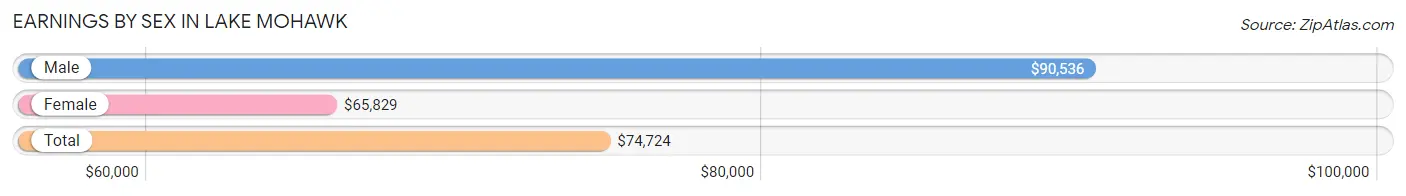
| Sex | Number | Average Earnings |
| Male | 2,894 (51.9%) | $90,536 |
| Female | 2,679 (48.1%) | $65,829 |
| Total | 5,573 (100.0%) | $74,724 |
Earnings by Sex by Income Bracket in Lake Mohawk
The most common earnings brackets in Lake Mohawk are $100,000+ for men (1,338 | 46.2%) and $100,000+ for women (739 | 27.6%).
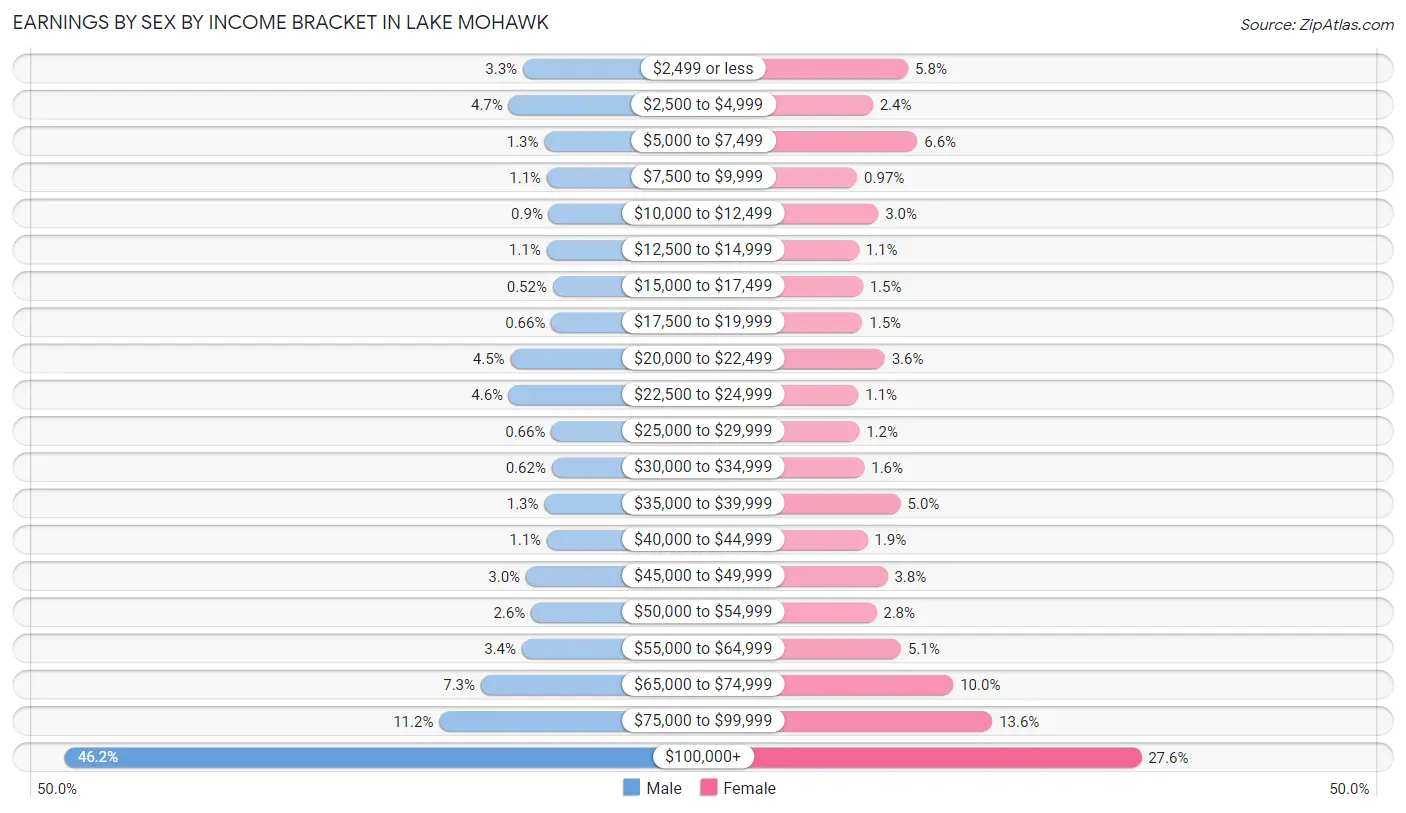
| Income | Male | Female |
| $2,499 or less | 96 (3.3%) | 154 (5.8%) |
| $2,500 to $4,999 | 135 (4.7%) | 65 (2.4%) |
| $5,000 to $7,499 | 38 (1.3%) | 177 (6.6%) |
| $7,500 to $9,999 | 31 (1.1%) | 26 (1.0%) |
| $10,000 to $12,499 | 26 (0.9%) | 79 (2.9%) |
| $12,500 to $14,999 | 32 (1.1%) | 30 (1.1%) |
| $15,000 to $17,499 | 15 (0.5%) | 40 (1.5%) |
| $17,500 to $19,999 | 19 (0.7%) | 39 (1.5%) |
| $20,000 to $22,499 | 130 (4.5%) | 95 (3.5%) |
| $22,500 to $24,999 | 134 (4.6%) | 29 (1.1%) |
| $25,000 to $29,999 | 19 (0.7%) | 31 (1.2%) |
| $30,000 to $34,999 | 18 (0.6%) | 44 (1.6%) |
| $35,000 to $39,999 | 38 (1.3%) | 135 (5.0%) |
| $40,000 to $44,999 | 31 (1.1%) | 52 (1.9%) |
| $45,000 to $49,999 | 88 (3.0%) | 102 (3.8%) |
| $50,000 to $54,999 | 74 (2.6%) | 74 (2.8%) |
| $55,000 to $64,999 | 99 (3.4%) | 136 (5.1%) |
| $65,000 to $74,999 | 210 (7.3%) | 267 (10.0%) |
| $75,000 to $99,999 | 323 (11.2%) | 365 (13.6%) |
| $100,000+ | 1,338 (46.2%) | 739 (27.6%) |
| Total | 2,894 (100.0%) | 2,679 (100.0%) |
Earnings by Sex by Educational Attainment in Lake Mohawk
Average earnings in Lake Mohawk are $107,188 for men and $73,312 for women, a difference of 31.6%. Men with an educational attainment of graduate degree enjoy the highest average annual earnings of $131,932, while those with less than high school education earn the least with $51,012. Women with an educational attainment of graduate degree earn the most with the average annual earnings of $86,919, while those with college or associate's degree education have the smallest earnings of $48,750.
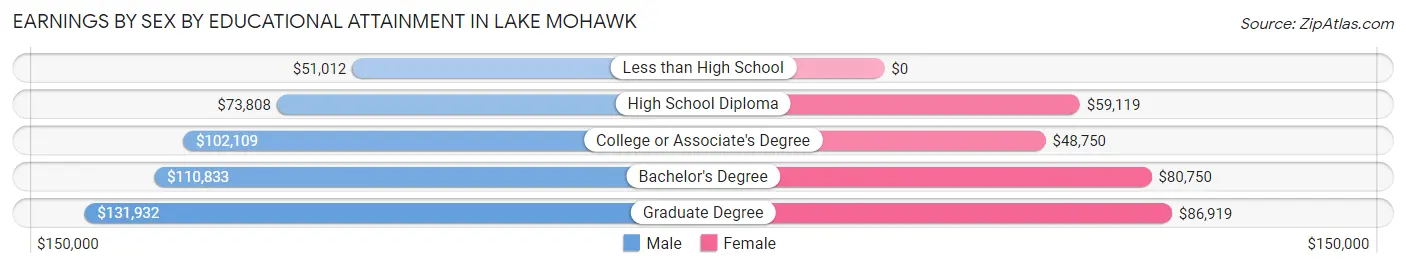
| Educational Attainment | Male Income | Female Income |
| Less than High School | $51,012 | $0 |
| High School Diploma | $73,808 | $59,119 |
| College or Associate's Degree | $102,109 | $48,750 |
| Bachelor's Degree | $110,833 | $80,750 |
| Graduate Degree | $131,932 | $86,919 |
| Total | $107,188 | $73,312 |
Family Income in Lake Mohawk
Family Income Brackets in Lake Mohawk
According to the Lake Mohawk family income data, there are 1,084 families falling into the $200,000+ income range, which is the most common income bracket and makes up 39.7% of all families.
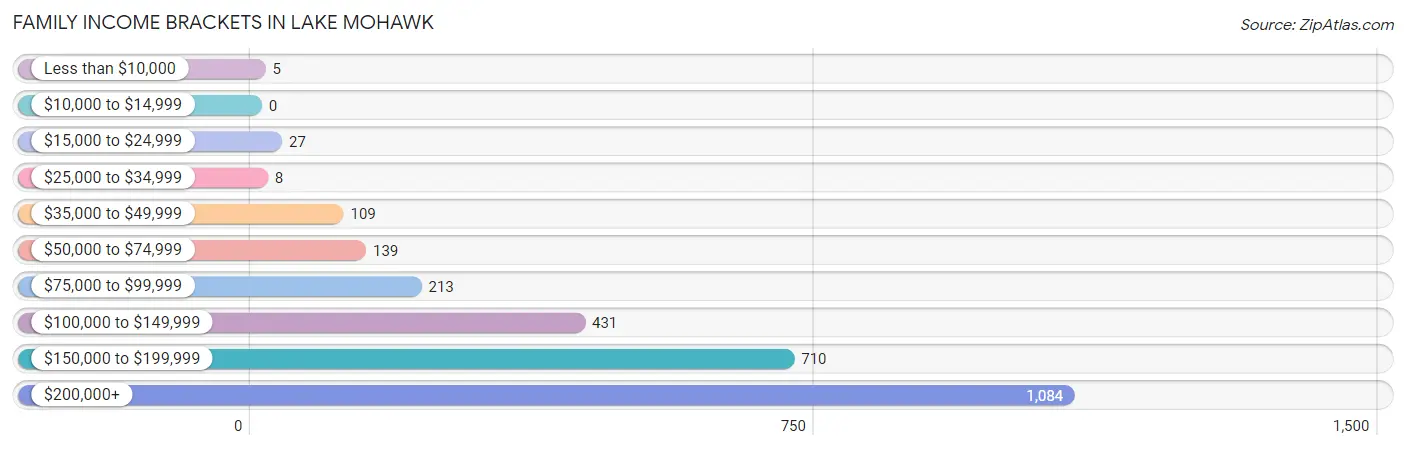
| Income Bracket | # Families | % Families |
| Less than $10,000 | 5 | 0.2% |
| $10,000 to $14,999 | 0 | 0.0% |
| $15,000 to $24,999 | 27 | 1.0% |
| $25,000 to $34,999 | 8 | 0.3% |
| $35,000 to $49,999 | 109 | 4.0% |
| $50,000 to $74,999 | 139 | 5.1% |
| $75,000 to $99,999 | 213 | 7.8% |
| $100,000 to $149,999 | 431 | 15.8% |
| $150,000 to $199,999 | 710 | 26.0% |
| $200,000+ | 1,084 | 39.7% |
Family Income by Famaliy Size in Lake Mohawk
5-person families (213 | 7.8%) account for the highest median family income in Lake Mohawk with $208,083 per family, while 2-person families (1,137 | 41.6%) have the highest median income of $89,271 per family member.
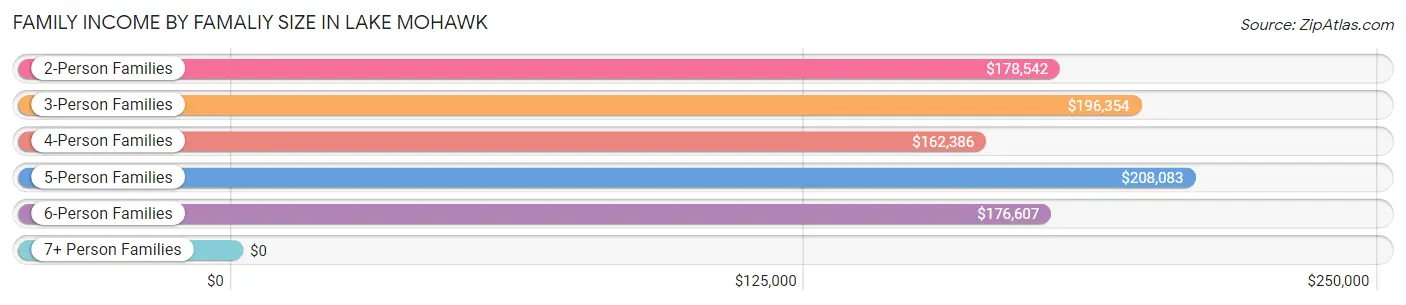
| Income Bracket | # Families | Median Income |
| 2-Person Families | 1,137 (41.6%) | $178,542 |
| 3-Person Families | 514 (18.8%) | $196,354 |
| 4-Person Families | 767 (28.1%) | $162,386 |
| 5-Person Families | 213 (7.8%) | $208,083 |
| 6-Person Families | 99 (3.6%) | $176,607 |
| 7+ Person Families | 0 (0.0%) | $0 |
| Total | 2,730 (100.0%) | $181,379 |
Family Income by Number of Earners in Lake Mohawk
The median family income in Lake Mohawk is $181,379, with families comprising 2 earners (1,399) having the highest median family income of $197,031, while families with no earners (325) have the lowest median family income of $95,461, accounting for 51.2% and 11.9% of families, respectively.
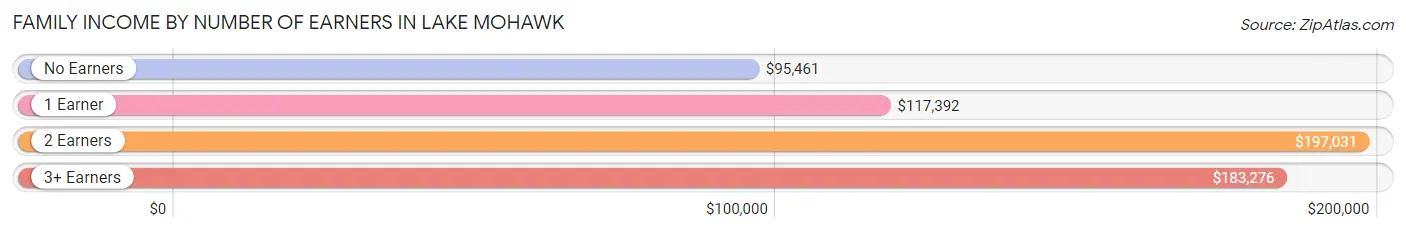
| Number of Earners | # Families | Median Income |
| No Earners | 325 (11.9%) | $95,461 |
| 1 Earner | 571 (20.9%) | $117,392 |
| 2 Earners | 1,399 (51.2%) | $197,031 |
| 3+ Earners | 435 (15.9%) | $183,276 |
| Total | 2,730 (100.0%) | $181,379 |
Household Income in Lake Mohawk
Household Income Brackets in Lake Mohawk
With 1,136 households falling in the category, the $200,000+ income range is the most frequent in Lake Mohawk, accounting for 29.7% of all households.
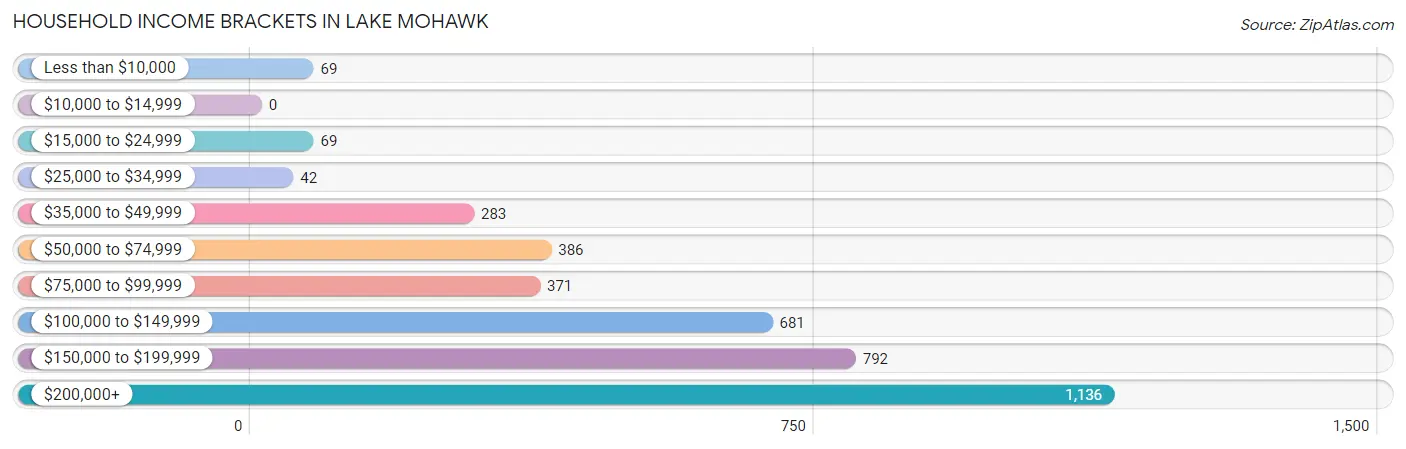
| Income Bracket | # Households | % Households |
| Less than $10,000 | 69 | 1.8% |
| $10,000 to $14,999 | 0 | 0.0% |
| $15,000 to $24,999 | 69 | 1.8% |
| $25,000 to $34,999 | 42 | 1.1% |
| $35,000 to $49,999 | 283 | 7.4% |
| $50,000 to $74,999 | 386 | 10.1% |
| $75,000 to $99,999 | 371 | 9.7% |
| $100,000 to $149,999 | 681 | 17.8% |
| $150,000 to $199,999 | 792 | 20.7% |
| $200,000+ | 1,136 | 29.7% |
Household Income by Householder Age in Lake Mohawk
The median household income in Lake Mohawk is $151,167, with the highest median household income of $183,000 found in the 45 to 64 years age bracket for the primary householder. A total of 1,742 households (45.6%) fall into this category. Meanwhile, the 15 to 24 years age bracket for the primary householder has the lowest median household income of $0, with 15 households (0.4%) in this group.
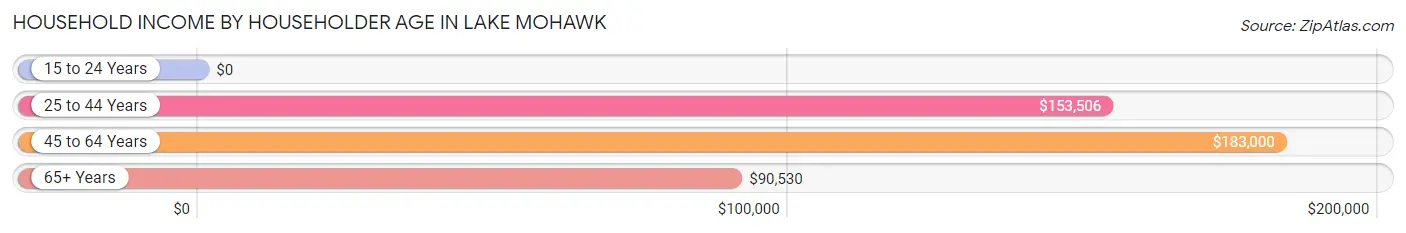
| Income Bracket | # Households | Median Income |
| 15 to 24 Years | 15 (0.4%) | $0 |
| 25 to 44 Years | 941 (24.6%) | $153,506 |
| 45 to 64 Years | 1,742 (45.6%) | $183,000 |
| 65+ Years | 1,126 (29.4%) | $90,530 |
| Total | 3,824 (100.0%) | $151,167 |
Poverty in Lake Mohawk
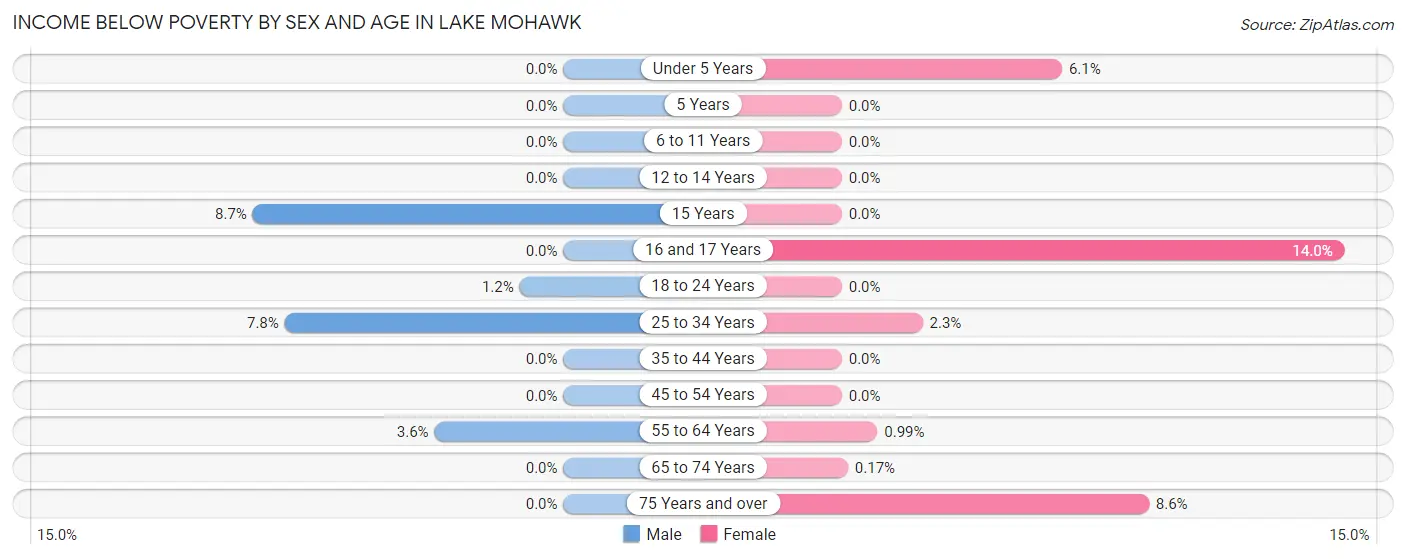
Income Below Poverty by Sex and Age in Lake Mohawk
With 1.4% poverty level for males and 1.9% for females among the residents of Lake Mohawk, 15 year old males and 16 and 17 year old females are the most vulnerable to poverty, with 9 males (8.6%) and 14 females (14.0%) in their respective age groups living below the poverty level.
| Age Bracket | Male | Female |
| Under 5 Years | 0 (0.0%) | 16 (6.1%) |
| 5 Years | 0 (0.0%) | 0 (0.0%) |
| 6 to 11 Years | 0 (0.0%) | 0 (0.0%) |
| 12 to 14 Years | 0 (0.0%) | 0 (0.0%) |
| 15 Years | 9 (8.6%) | 0 (0.0%) |
| 16 and 17 Years | 0 (0.0%) | 14 (14.0%) |
| 18 to 24 Years | 6 (1.2%) | 0 (0.0%) |
| 25 to 34 Years | 27 (7.8%) | 11 (2.2%) |
| 35 to 44 Years | 0 (0.0%) | 0 (0.0%) |
| 45 to 54 Years | 0 (0.0%) | 0 (0.0%) |
| 55 to 64 Years | 25 (3.6%) | 7 (1.0%) |
| 65 to 74 Years | 0 (0.0%) | 1 (0.2%) |
| 75 Years and over | 0 (0.0%) | 42 (8.6%) |
| Total | 67 (1.4%) | 91 (1.9%) |
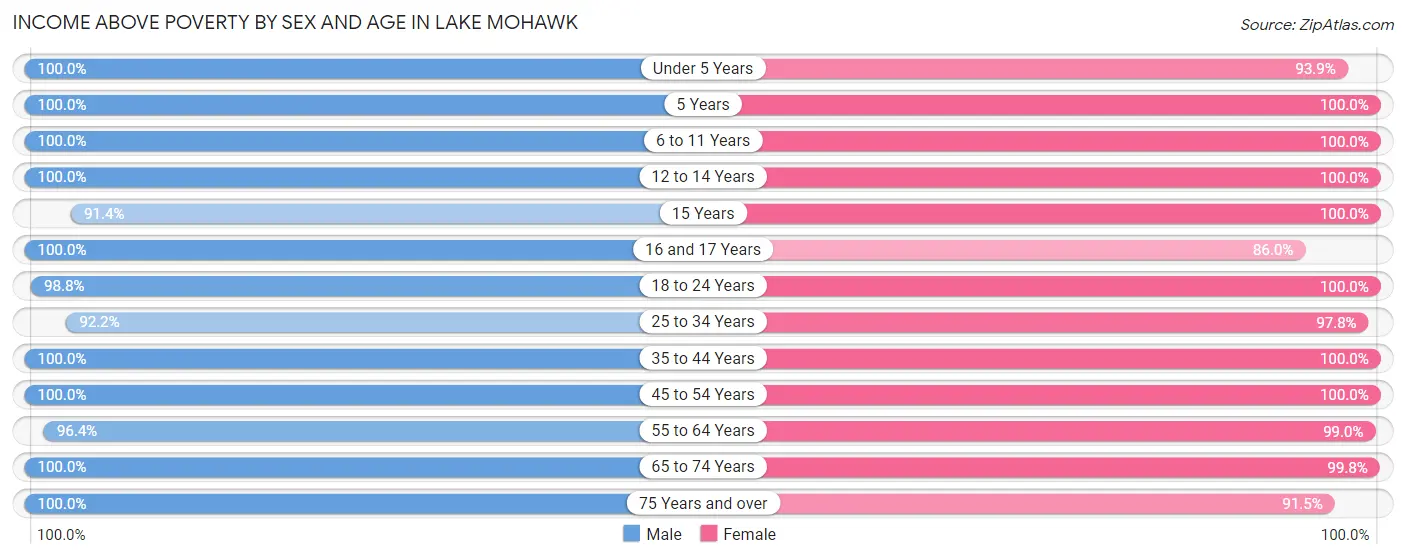
Income Above Poverty by Sex and Age in Lake Mohawk
According to the poverty statistics in Lake Mohawk, males aged under 5 years and females aged 5 years are the age groups that are most secure financially, with 100.0% of males and 100.0% of females in these age groups living above the poverty line.
| Age Bracket | Male | Female |
| Under 5 Years | 317 (100.0%) | 245 (93.9%) |
| 5 Years | 51 (100.0%) | 30 (100.0%) |
| 6 to 11 Years | 275 (100.0%) | 354 (100.0%) |
| 12 to 14 Years | 175 (100.0%) | 170 (100.0%) |
| 15 Years | 95 (91.3%) | 121 (100.0%) |
| 16 and 17 Years | 175 (100.0%) | 86 (86.0%) |
| 18 to 24 Years | 487 (98.8%) | 296 (100.0%) |
| 25 to 34 Years | 321 (92.2%) | 478 (97.8%) |
| 35 to 44 Years | 593 (100.0%) | 523 (100.0%) |
| 45 to 54 Years | 843 (100.0%) | 753 (100.0%) |
| 55 to 64 Years | 672 (96.4%) | 699 (99.0%) |
| 65 to 74 Years | 457 (100.0%) | 600 (99.8%) |
| 75 Years and over | 250 (100.0%) | 449 (91.4%) |
| Total | 4,711 (98.6%) | 4,804 (98.1%) |
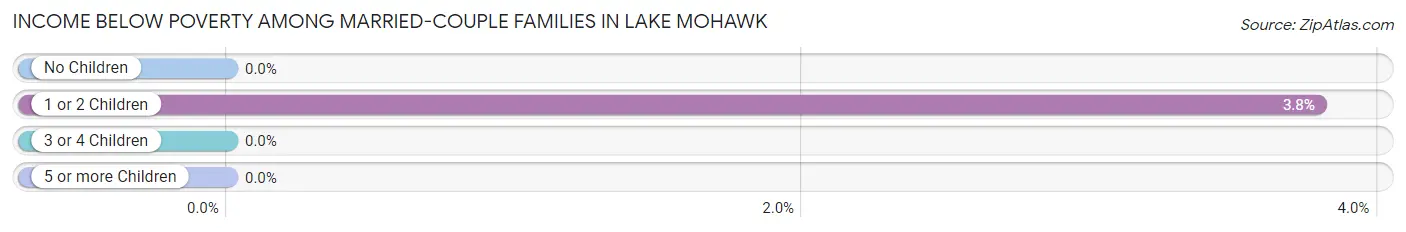
Income Below Poverty Among Married-Couple Families in Lake Mohawk
The poverty statistics for married-couple families in Lake Mohawk show that 1.3% or 33 of the total 2,539 families live below the poverty line. Families with 1 or 2 children have the highest poverty rate of 3.8%, comprising of 33 families. On the other hand, families with no children have the lowest poverty rate of 0.0%, which includes 0 families.
| Children | Above Poverty | Below Poverty |
| No Children | 1,461 (100.0%) | 0 (0.0%) |
| 1 or 2 Children | 837 (96.2%) | 33 (3.8%) |
| 3 or 4 Children | 208 (100.0%) | 0 (0.0%) |
| 5 or more Children | 0 (0.0%) | 0 (0.0%) |
| Total | 2,506 (98.7%) | 33 (1.3%) |
Income Below Poverty Among Single-Parent Households in Lake Mohawk
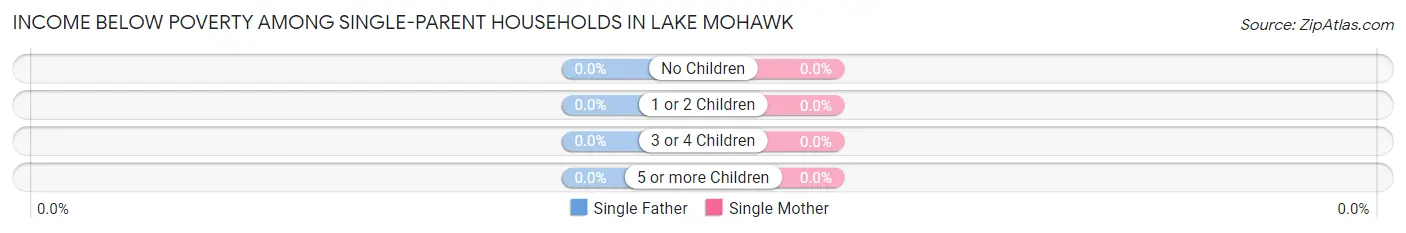
| Children | Single Father | Single Mother |
| No Children | 0 (0.0%) | 0 (0.0%) |
| 1 or 2 Children | 0 (0.0%) | 0 (0.0%) |
| 3 or 4 Children | 0 (0.0%) | 0 (0.0%) |
| 5 or more Children | 0 (0.0%) | 0 (0.0%) |
| Total | 0 (0.0%) | 0 (0.0%) |
Income Below Poverty Among Married-Couple vs Single-Parent Households in Lake Mohawk
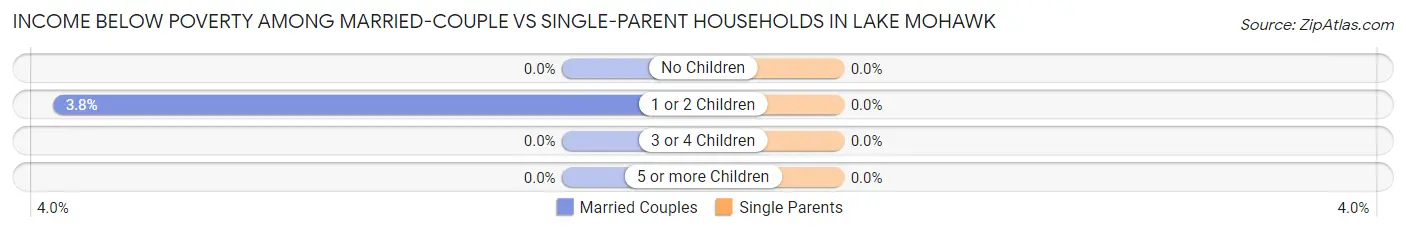
| Children | Married-Couple Families | Single-Parent Households |
| No Children | 0 (0.0%) | 0 (0.0%) |
| 1 or 2 Children | 33 (3.8%) | 0 (0.0%) |
| 3 or 4 Children | 0 (0.0%) | 0 (0.0%) |
| 5 or more Children | 0 (0.0%) | 0 (0.0%) |
| Total | 33 (1.3%) | 0 (0.0%) |
Employment Characteristics in Lake Mohawk
Employment by Class of Employer in Lake Mohawk
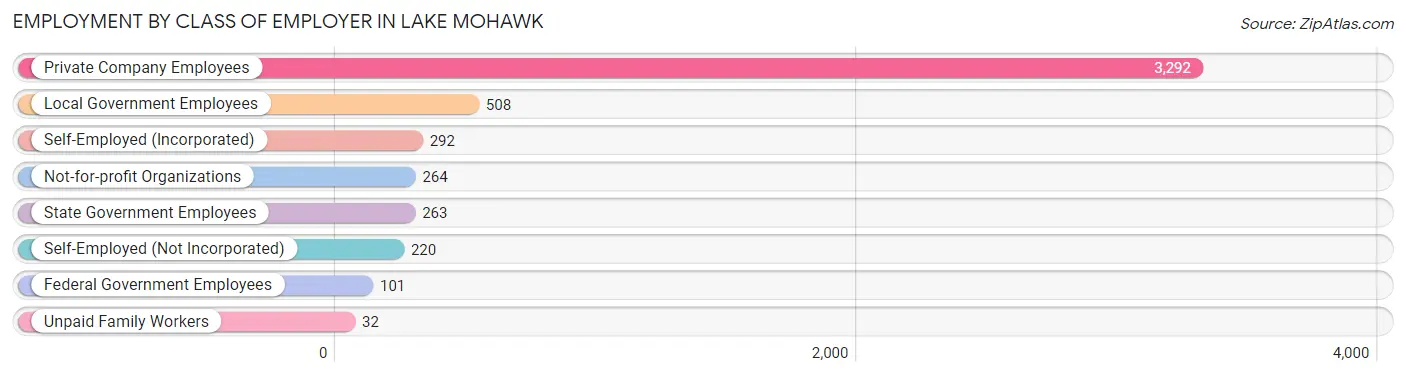
Among the 4,972 employed individuals in Lake Mohawk, private company employees (3,292 | 66.2%), local government employees (508 | 10.2%), and self-employed (incorporated) (292 | 5.9%) make up the most common classes of employment.
| Employer Class | # Employees | % Employees |
| Private Company Employees | 3,292 | 66.2% |
| Self-Employed (Incorporated) | 292 | 5.9% |
| Self-Employed (Not Incorporated) | 220 | 4.4% |
| Not-for-profit Organizations | 264 | 5.3% |
| Local Government Employees | 508 | 10.2% |
| State Government Employees | 263 | 5.3% |
| Federal Government Employees | 101 | 2.0% |
| Unpaid Family Workers | 32 | 0.6% |
| Total | 4,972 | 100.0% |
Employment Status by Age in Lake Mohawk
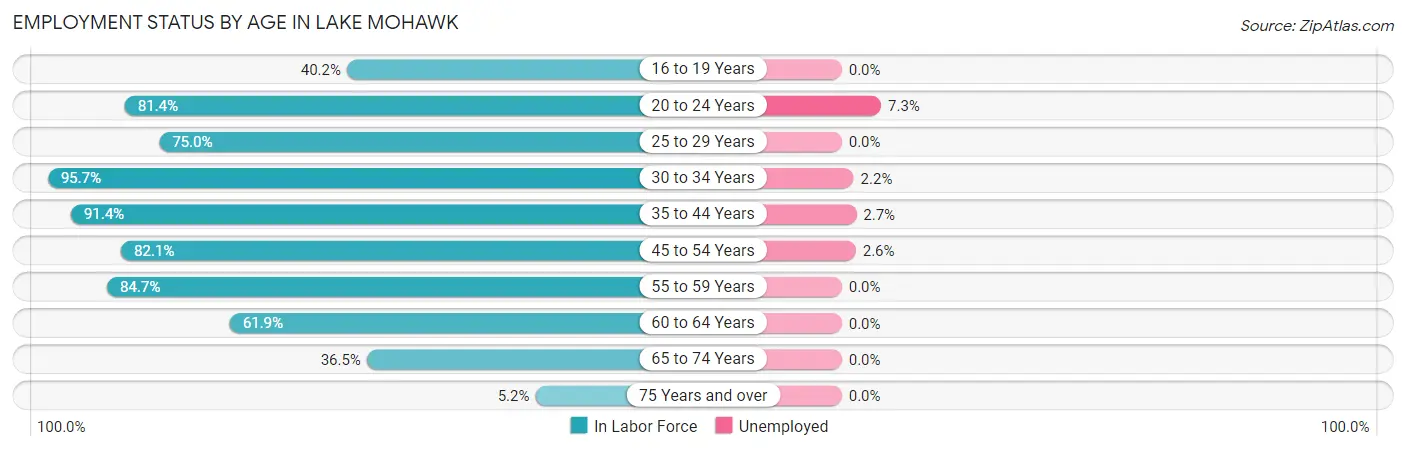
According to the labor force statistics for Lake Mohawk, out of the total population over 16 years of age (7,838), 66.0% or 5,173 individuals are in the labor force, with 1.9% or 98 of them unemployed. The age group with the highest labor force participation rate is 30 to 34 years, with 95.7% or 449 individuals in the labor force. Within the labor force, the 20 to 24 years age range has the highest percentage of unemployed individuals, with 7.3% or 28 of them being unemployed.
| Age Bracket | In Labor Force | Unemployed |
| 16 to 19 Years | 237 (40.2%) | 0 (0.0%) |
| 20 to 24 Years | 386 (81.4%) | 28 (7.3%) |
| 25 to 29 Years | 276 (75.0%) | 0 (0.0%) |
| 30 to 34 Years | 449 (95.7%) | 10 (2.2%) |
| 35 to 44 Years | 1,020 (91.4%) | 28 (2.7%) |
| 45 to 54 Years | 1,310 (82.1%) | 34 (2.6%) |
| 55 to 59 Years | 728 (84.7%) | 0 (0.0%) |
| 60 to 64 Years | 337 (61.9%) | 0 (0.0%) |
| 65 to 74 Years | 392 (36.5%) | 0 (0.0%) |
| 75 Years and over | 39 (5.2%) | 0 (0.0%) |
| Total | 5,173 (66.0%) | 98 (1.9%) |
Employment Status by Educational Attainment in Lake Mohawk
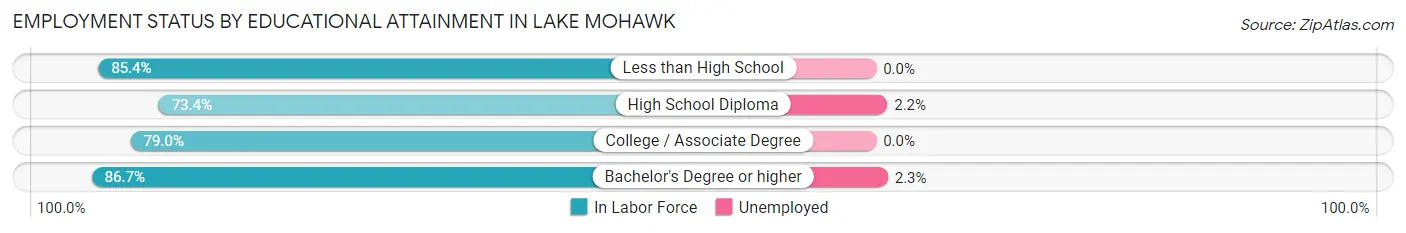
According to labor force statistics for Lake Mohawk, 83.2% of individuals (4,120) out of the total population between 25 and 64 years of age (4,952) are in the labor force, with 1.7% or 70 of them being unemployed. The group with the highest labor force participation rate are those with the educational attainment of bachelor's degree or higher, with 86.7% or 2,681 individuals in the labor force. Within the labor force, individuals with bachelor's degree or higher education have the highest percentage of unemployment, with 2.3% or 62 of them being unemployed.
| Educational Attainment | In Labor Force | Unemployed |
| Less than High School | 41 (85.4%) | 0 (0.0%) |
| High School Diploma | 452 (73.4%) | 14 (2.2%) |
| College / Associate Degree | 945 (79.0%) | 0 (0.0%) |
| Bachelor's Degree or higher | 2,681 (86.7%) | 71 (2.3%) |
| Total | 4,120 (83.2%) | 84 (1.7%) |
Employment Occupations by Sex in Lake Mohawk
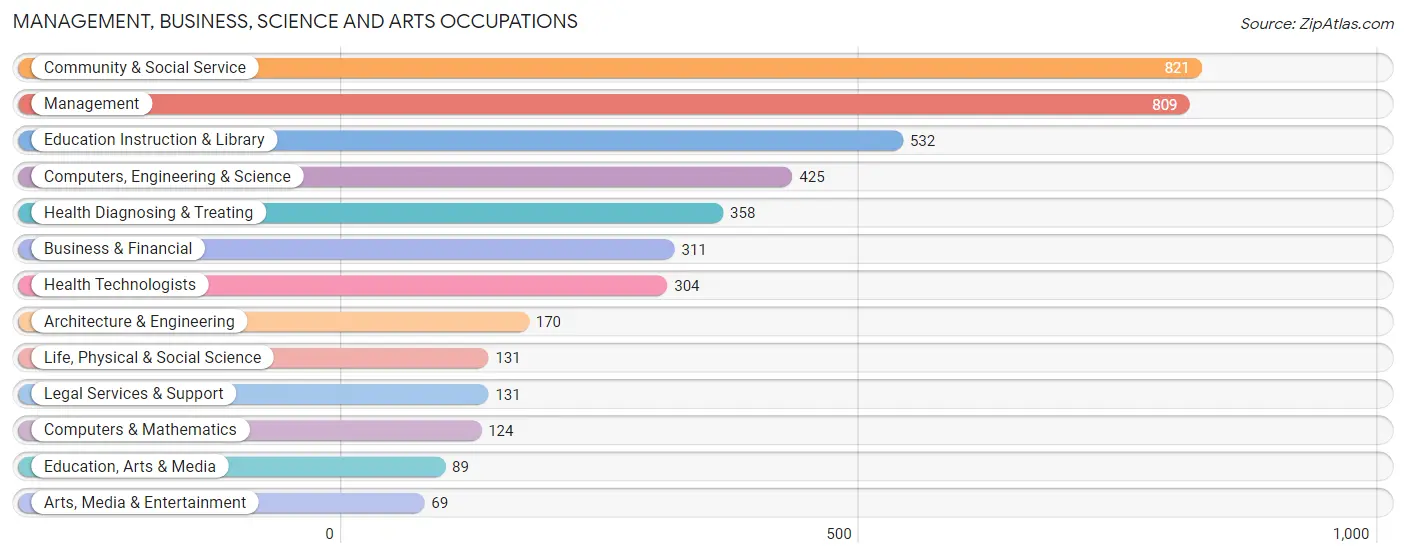
Management, Business, Science and Arts Occupations
The most common Management, Business, Science and Arts occupations in Lake Mohawk are Community & Social Service (821 | 16.2%), Management (809 | 15.9%), Education Instruction & Library (532 | 10.5%), Computers, Engineering & Science (425 | 8.4%), and Health Diagnosing & Treating (358 | 7.1%).
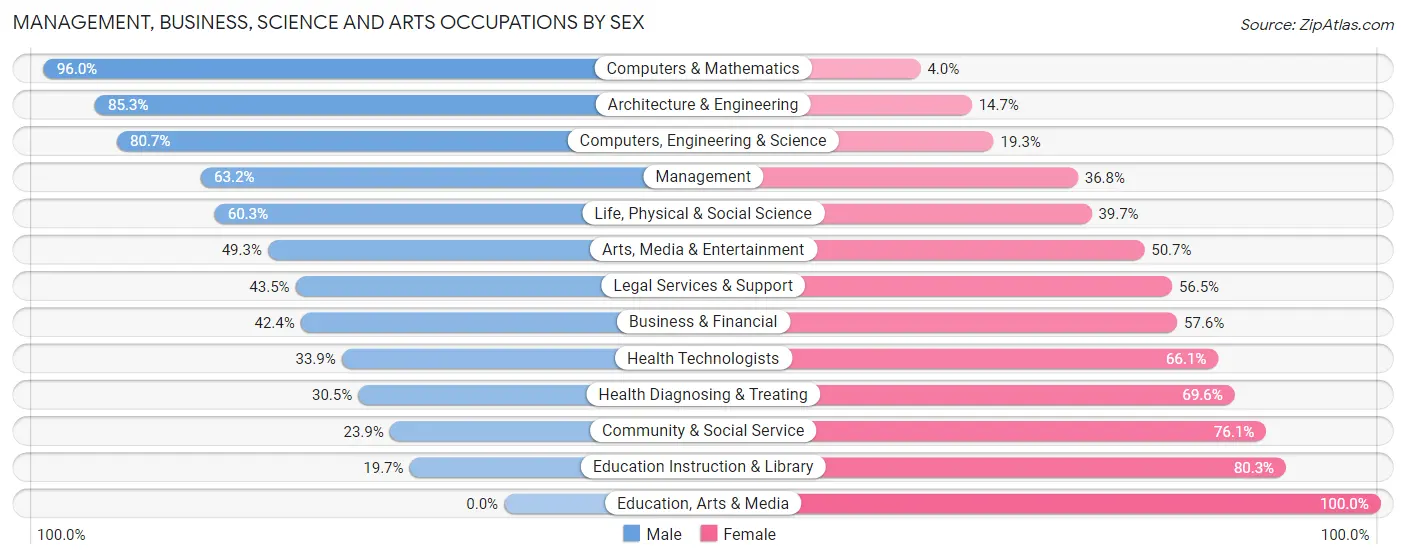
Management, Business, Science and Arts Occupations by Sex
Within the Management, Business, Science and Arts occupations in Lake Mohawk, the most male-oriented occupations are Computers & Mathematics (96.0%), Architecture & Engineering (85.3%), and Computers, Engineering & Science (80.7%), while the most female-oriented occupations are Education, Arts & Media (100.0%), Education Instruction & Library (80.3%), and Community & Social Service (76.1%).
| Occupation | Male | Female |
| Management | 511 (63.2%) | 298 (36.8%) |
| Business & Financial | 132 (42.4%) | 179 (57.6%) |
| Computers, Engineering & Science | 343 (80.7%) | 82 (19.3%) |
| Computers & Mathematics | 119 (96.0%) | 5 (4.0%) |
| Architecture & Engineering | 145 (85.3%) | 25 (14.7%) |
| Life, Physical & Social Science | 79 (60.3%) | 52 (39.7%) |
| Community & Social Service | 196 (23.9%) | 625 (76.1%) |
| Education, Arts & Media | 0 (0.0%) | 89 (100.0%) |
| Legal Services & Support | 57 (43.5%) | 74 (56.5%) |
| Education Instruction & Library | 105 (19.7%) | 427 (80.3%) |
| Arts, Media & Entertainment | 34 (49.3%) | 35 (50.7%) |
| Health Diagnosing & Treating | 109 (30.4%) | 249 (69.6%) |
| Health Technologists | 103 (33.9%) | 201 (66.1%) |
| Total (Category) | 1,291 (47.4%) | 1,433 (52.6%) |
| Total (Overall) | 2,659 (52.4%) | 2,415 (47.6%) |
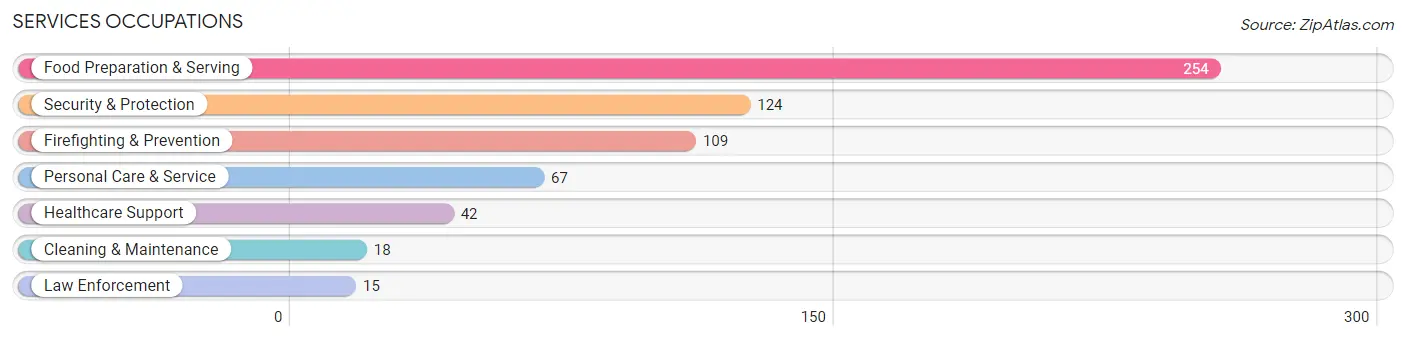
Services Occupations
The most common Services occupations in Lake Mohawk are Food Preparation & Serving (254 | 5.0%), Security & Protection (124 | 2.4%), Firefighting & Prevention (109 | 2.1%), Personal Care & Service (67 | 1.3%), and Healthcare Support (42 | 0.8%).
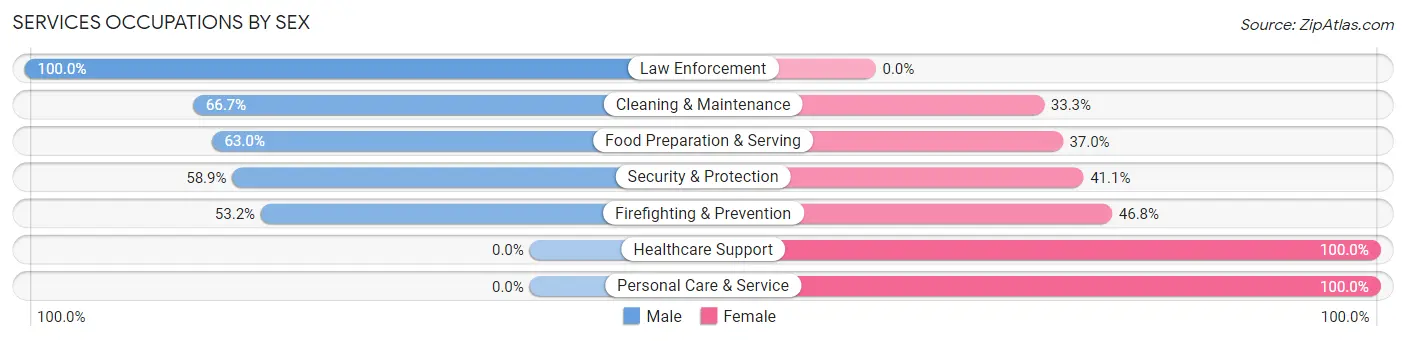
Services Occupations by Sex
Within the Services occupations in Lake Mohawk, the most male-oriented occupations are Law Enforcement (100.0%), Cleaning & Maintenance (66.7%), and Food Preparation & Serving (63.0%), while the most female-oriented occupations are Healthcare Support (100.0%), Personal Care & Service (100.0%), and Firefighting & Prevention (46.8%).
| Occupation | Male | Female |
| Healthcare Support | 0 (0.0%) | 42 (100.0%) |
| Security & Protection | 73 (58.9%) | 51 (41.1%) |
| Firefighting & Prevention | 58 (53.2%) | 51 (46.8%) |
| Law Enforcement | 15 (100.0%) | 0 (0.0%) |
| Food Preparation & Serving | 160 (63.0%) | 94 (37.0%) |
| Cleaning & Maintenance | 12 (66.7%) | 6 (33.3%) |
| Personal Care & Service | 0 (0.0%) | 67 (100.0%) |
| Total (Category) | 245 (48.5%) | 260 (51.5%) |
| Total (Overall) | 2,659 (52.4%) | 2,415 (47.6%) |
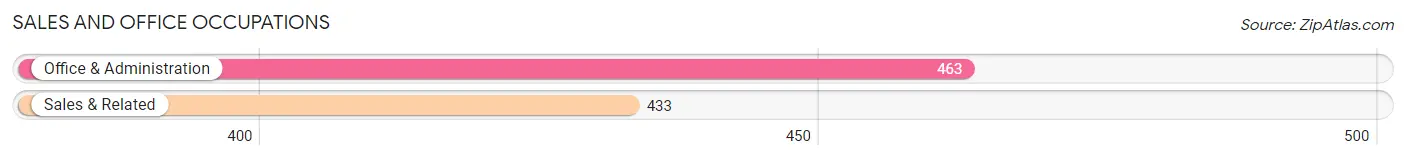
Sales and Office Occupations
The most common Sales and Office occupations in Lake Mohawk are Office & Administration (463 | 9.1%), and Sales & Related (433 | 8.5%).
Sales and Office Occupations by Sex
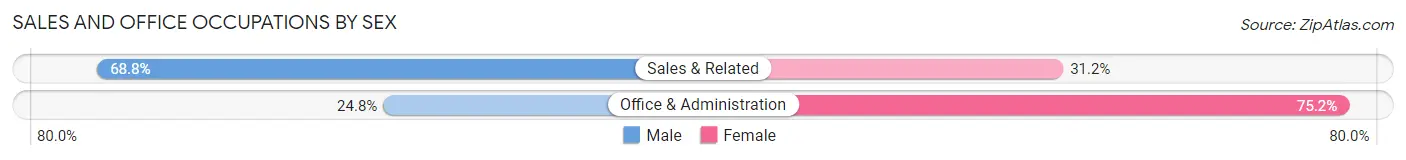
| Occupation | Male | Female |
| Sales & Related | 298 (68.8%) | 135 (31.2%) |
| Office & Administration | 115 (24.8%) | 348 (75.2%) |
| Total (Category) | 413 (46.1%) | 483 (53.9%) |
| Total (Overall) | 2,659 (52.4%) | 2,415 (47.6%) |
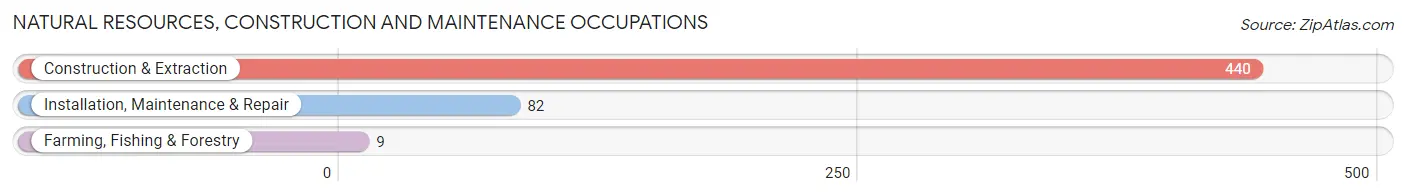
Natural Resources, Construction and Maintenance Occupations
The most common Natural Resources, Construction and Maintenance occupations in Lake Mohawk are Construction & Extraction (440 | 8.7%), Installation, Maintenance & Repair (82 | 1.6%), and Farming, Fishing & Forestry (9 | 0.2%).
Natural Resources, Construction and Maintenance Occupations by Sex
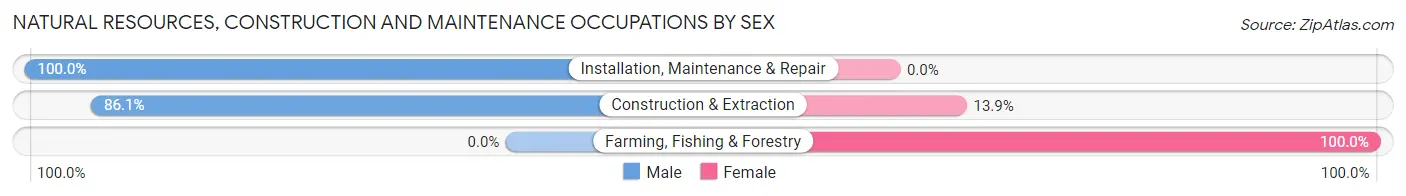
| Occupation | Male | Female |
| Farming, Fishing & Forestry | 0 (0.0%) | 9 (100.0%) |
| Construction & Extraction | 379 (86.1%) | 61 (13.9%) |
| Installation, Maintenance & Repair | 82 (100.0%) | 0 (0.0%) |
| Total (Category) | 461 (86.8%) | 70 (13.2%) |
| Total (Overall) | 2,659 (52.4%) | 2,415 (47.6%) |
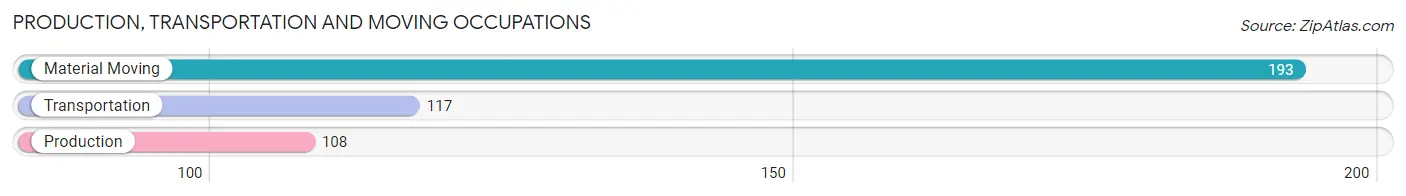
Production, Transportation and Moving Occupations
The most common Production, Transportation and Moving occupations in Lake Mohawk are Material Moving (193 | 3.8%), Transportation (117 | 2.3%), and Production (108 | 2.1%).
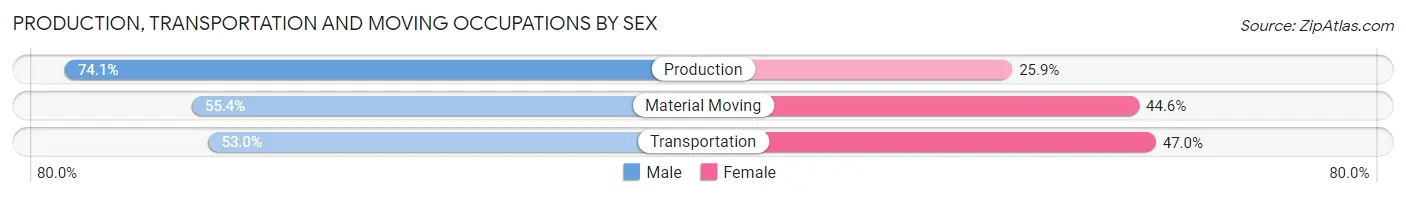
Production, Transportation and Moving Occupations by Sex
| Occupation | Male | Female |
| Production | 80 (74.1%) | 28 (25.9%) |
| Transportation | 62 (53.0%) | 55 (47.0%) |
| Material Moving | 107 (55.4%) | 86 (44.6%) |
| Total (Category) | 249 (59.6%) | 169 (40.4%) |
| Total (Overall) | 2,659 (52.4%) | 2,415 (47.6%) |
Employment Industries by Sex in Lake Mohawk
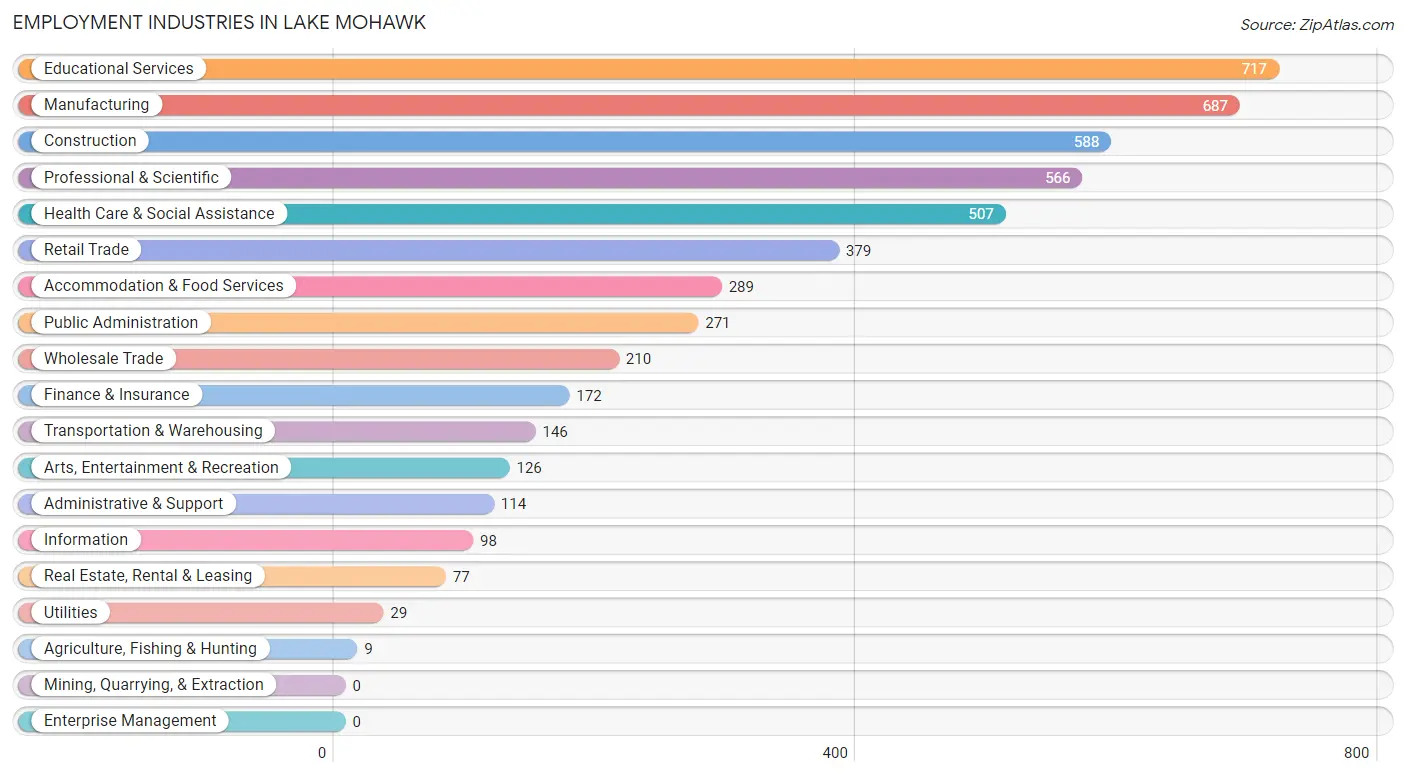
Employment Industries in Lake Mohawk
The major employment industries in Lake Mohawk include Educational Services (717 | 14.1%), Manufacturing (687 | 13.5%), Construction (588 | 11.6%), Professional & Scientific (566 | 11.2%), and Health Care & Social Assistance (507 | 10.0%).
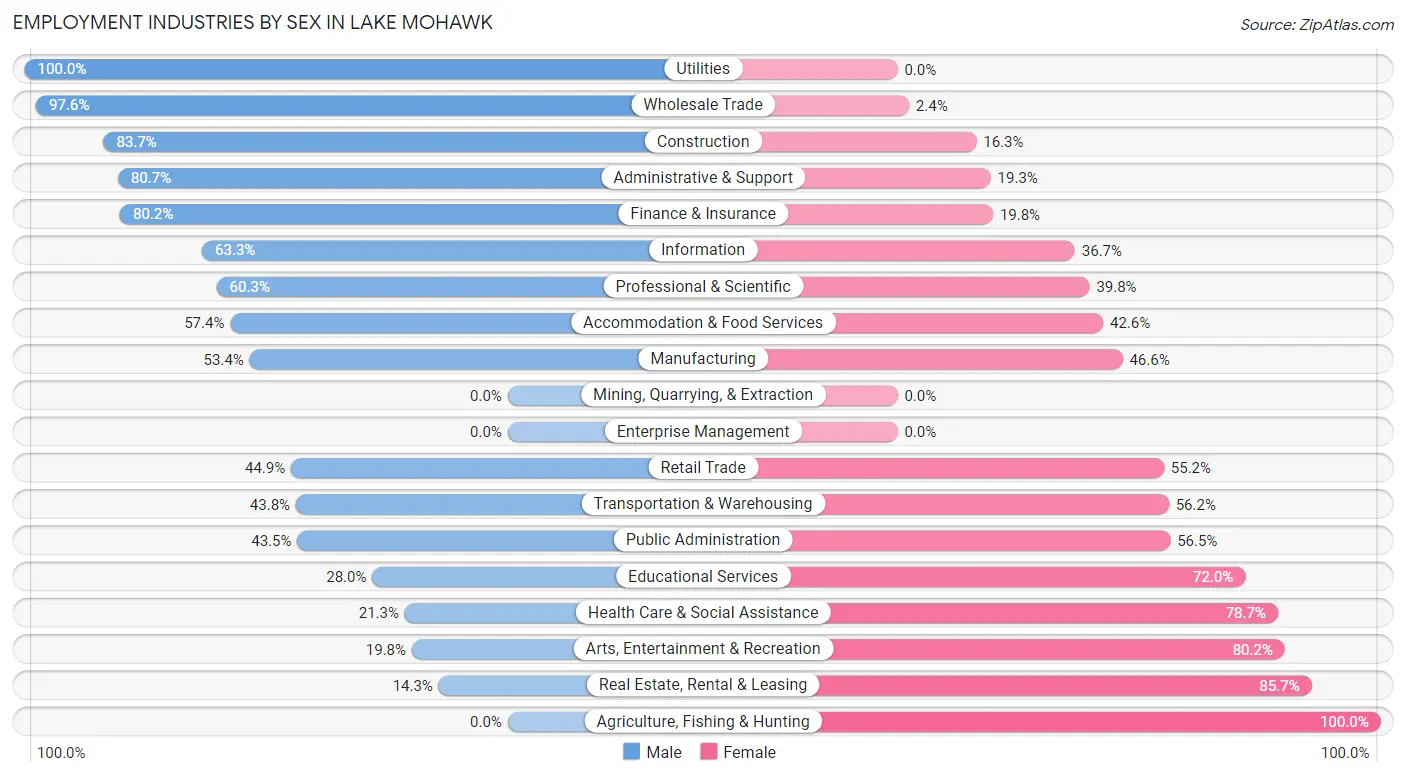
Employment Industries by Sex in Lake Mohawk
The Lake Mohawk industries that see more men than women are Utilities (100.0%), Wholesale Trade (97.6%), and Construction (83.7%), whereas the industries that tend to have a higher number of women are Agriculture, Fishing & Hunting (100.0%), Real Estate, Rental & Leasing (85.7%), and Arts, Entertainment & Recreation (80.2%).
| Industry | Male | Female |
| Agriculture, Fishing & Hunting | 0 (0.0%) | 9 (100.0%) |
| Mining, Quarrying, & Extraction | 0 (0.0%) | 0 (0.0%) |
| Construction | 492 (83.7%) | 96 (16.3%) |
| Manufacturing | 367 (53.4%) | 320 (46.6%) |
| Wholesale Trade | 205 (97.6%) | 5 (2.4%) |
| Retail Trade | 170 (44.9%) | 209 (55.1%) |
| Transportation & Warehousing | 64 (43.8%) | 82 (56.2%) |
| Utilities | 29 (100.0%) | 0 (0.0%) |
| Information | 62 (63.3%) | 36 (36.7%) |
| Finance & Insurance | 138 (80.2%) | 34 (19.8%) |
| Real Estate, Rental & Leasing | 11 (14.3%) | 66 (85.7%) |
| Professional & Scientific | 341 (60.3%) | 225 (39.8%) |
| Enterprise Management | 0 (0.0%) | 0 (0.0%) |
| Administrative & Support | 92 (80.7%) | 22 (19.3%) |
| Educational Services | 201 (28.0%) | 516 (72.0%) |
| Health Care & Social Assistance | 108 (21.3%) | 399 (78.7%) |
| Arts, Entertainment & Recreation | 25 (19.8%) | 101 (80.2%) |
| Accommodation & Food Services | 166 (57.4%) | 123 (42.6%) |
| Public Administration | 118 (43.5%) | 153 (56.5%) |
| Total | 2,659 (52.4%) | 2,415 (47.6%) |
Education in Lake Mohawk
School Enrollment in Lake Mohawk
The most common levels of schooling among the 2,355 students in Lake Mohawk are high school (790 | 33.6%), middle school (420 | 17.8%), and elementary school (409 | 17.4%).
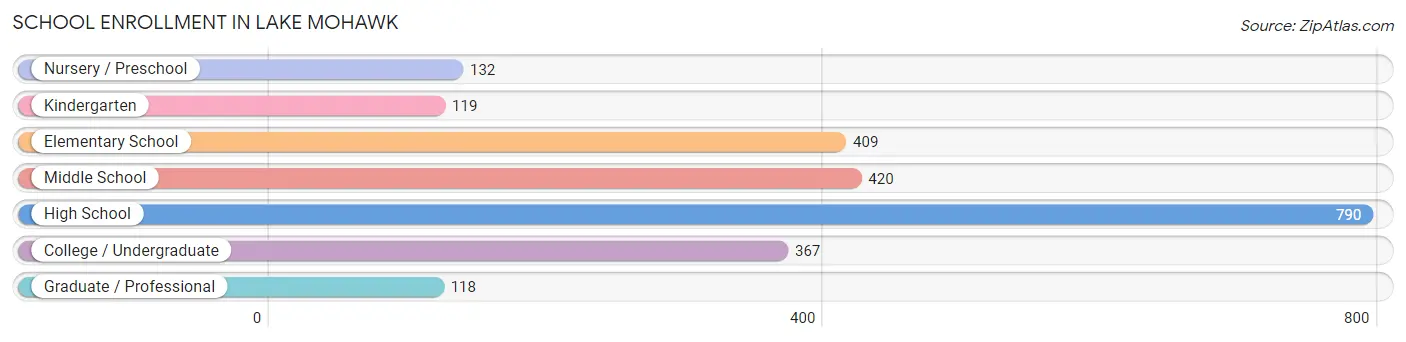
| School Level | # Students | % Students |
| Nursery / Preschool | 132 | 5.6% |
| Kindergarten | 119 | 5.1% |
| Elementary School | 409 | 17.4% |
| Middle School | 420 | 17.8% |
| High School | 790 | 33.6% |
| College / Undergraduate | 367 | 15.6% |
| Graduate / Professional | 118 | 5.0% |
| Total | 2,355 | 100.0% |
School Enrollment by Age by Funding Source in Lake Mohawk
Out of a total of 2,355 students who are enrolled in schools in Lake Mohawk, 309 (13.1%) attend a private institution, while the remaining 2,046 (86.9%) are enrolled in public schools. The age group of 3 to 4 year olds has the highest likelihood of being enrolled in private schools, with 65 (63.7% in the age bracket) enrolled. Conversely, the age group of 15 to 17 year olds has the lowest likelihood of being enrolled in a private school, with 488 (98.6% in the age bracket) attending a public institution.
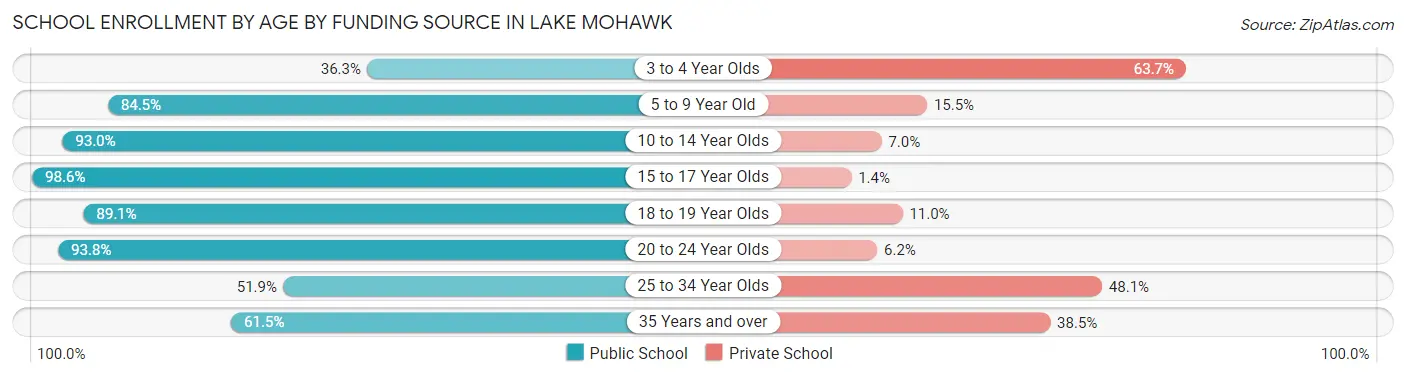
| Age Bracket | Public School | Private School |
| 3 to 4 Year Olds | 37 (36.3%) | 65 (63.7%) |
| 5 to 9 Year Old | 425 (84.5%) | 78 (15.5%) |
| 10 to 14 Year Olds | 515 (93.0%) | 39 (7.0%) |
| 15 to 17 Year Olds | 488 (98.6%) | 7 (1.4%) |
| 18 to 19 Year Olds | 244 (89.0%) | 30 (11.0%) |
| 20 to 24 Year Olds | 241 (93.8%) | 16 (6.2%) |
| 25 to 34 Year Olds | 41 (51.9%) | 38 (48.1%) |
| 35 Years and over | 56 (61.5%) | 35 (38.5%) |
| Total | 2,046 (86.9%) | 309 (13.1%) |
Educational Attainment by Field of Study in Lake Mohawk
Business (751 | 17.3%), social sciences (401 | 9.2%), engineering (372 | 8.6%), psychology (364 | 8.4%), and science & technology (328 | 7.6%) are the most common fields of study among 4,341 individuals in Lake Mohawk who have obtained a bachelor's degree or higher.
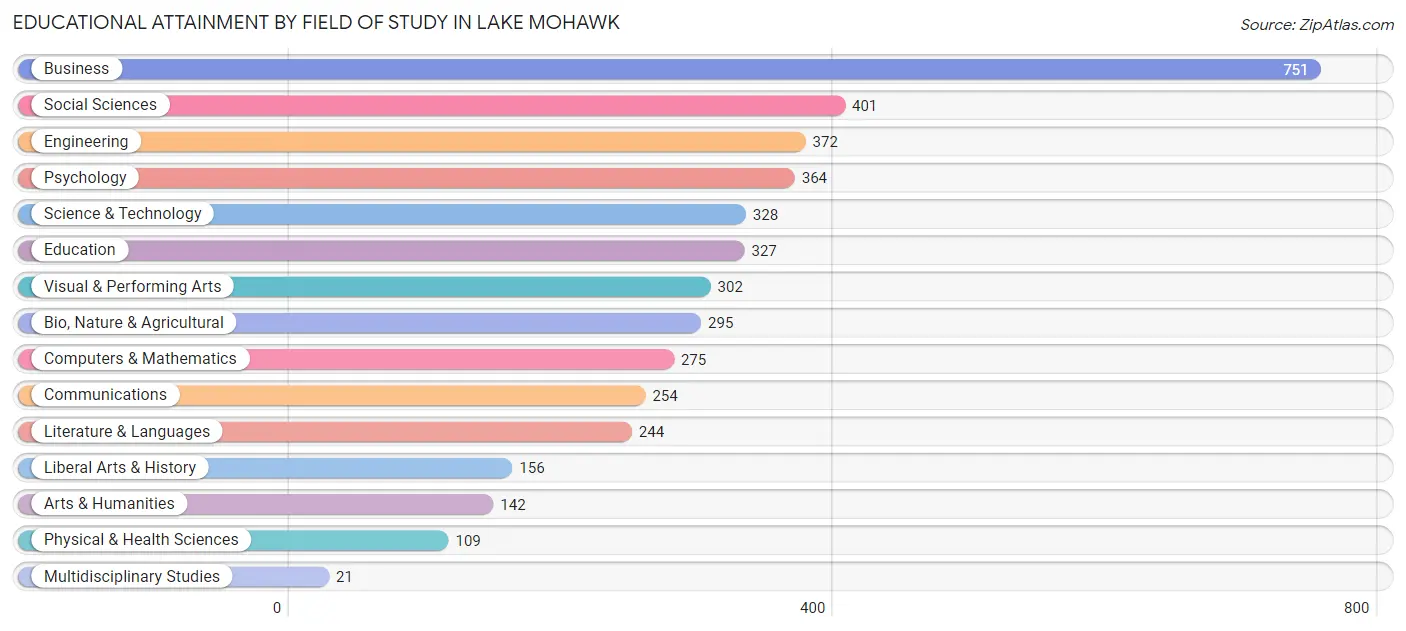
| Field of Study | # Graduates | % Graduates |
| Computers & Mathematics | 275 | 6.3% |
| Bio, Nature & Agricultural | 295 | 6.8% |
| Physical & Health Sciences | 109 | 2.5% |
| Psychology | 364 | 8.4% |
| Social Sciences | 401 | 9.2% |
| Engineering | 372 | 8.6% |
| Multidisciplinary Studies | 21 | 0.5% |
| Science & Technology | 328 | 7.6% |
| Business | 751 | 17.3% |
| Education | 327 | 7.5% |
| Literature & Languages | 244 | 5.6% |
| Liberal Arts & History | 156 | 3.6% |
| Visual & Performing Arts | 302 | 7.0% |
| Communications | 254 | 5.9% |
| Arts & Humanities | 142 | 3.3% |
| Total | 4,341 | 100.0% |
Transportation & Commute in Lake Mohawk
Vehicle Availability by Sex in Lake Mohawk
The most prevalent vehicle ownership categories in Lake Mohawk are males with 2 vehicles (1,389, accounting for 52.7%) and females with 2 vehicles (914, making up 59.5%).
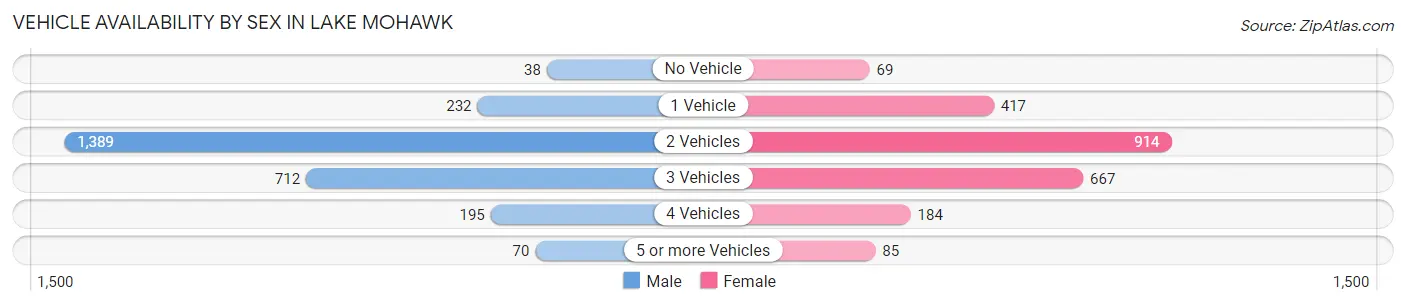
| Vehicles Available | Male | Female |
| No Vehicle | 38 (1.4%) | 69 (2.9%) |
| 1 Vehicle | 232 (8.8%) | 417 (17.8%) |
| 2 Vehicles | 1,389 (52.7%) | 914 (39.1%) |
| 3 Vehicles | 712 (27.0%) | 667 (28.5%) |
| 4 Vehicles | 195 (7.4%) | 184 (7.9%) |
| 5 or more Vehicles | 70 (2.7%) | 85 (3.6%) |
| Total | 2,636 (100.0%) | 2,336 (100.0%) |
Commute Time in Lake Mohawk
The most frequently occuring commute durations in Lake Mohawk are 45 to 59 minutes (731 commuters, 18.1%), 60 to 89 minutes (612 commuters, 15.2%), and 30 to 34 minutes (573 commuters, 14.2%).
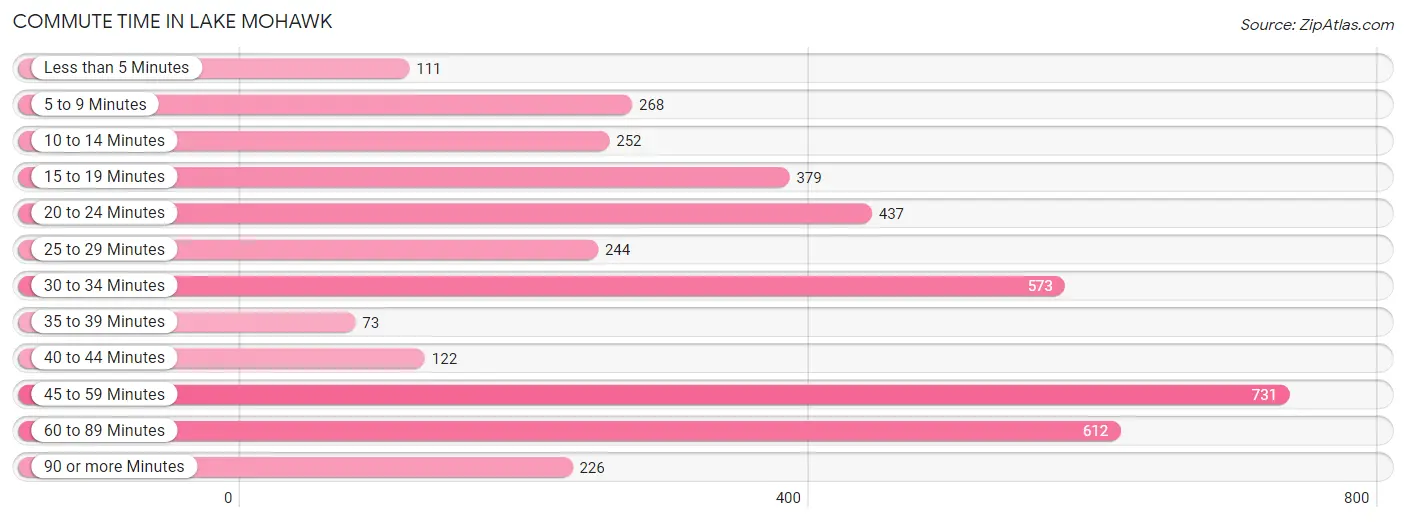
| Commute Time | # Commuters | % Commuters |
| Less than 5 Minutes | 111 | 2.8% |
| 5 to 9 Minutes | 268 | 6.7% |
| 10 to 14 Minutes | 252 | 6.3% |
| 15 to 19 Minutes | 379 | 9.4% |
| 20 to 24 Minutes | 437 | 10.8% |
| 25 to 29 Minutes | 244 | 6.1% |
| 30 to 34 Minutes | 573 | 14.2% |
| 35 to 39 Minutes | 73 | 1.8% |
| 40 to 44 Minutes | 122 | 3.0% |
| 45 to 59 Minutes | 731 | 18.1% |
| 60 to 89 Minutes | 612 | 15.2% |
| 90 or more Minutes | 226 | 5.6% |
Commute Time by Sex in Lake Mohawk
The most common commute times in Lake Mohawk are 45 to 59 minutes (447 commuters, 20.4%) for males and 60 to 89 minutes (359 commuters, 19.5%) for females.
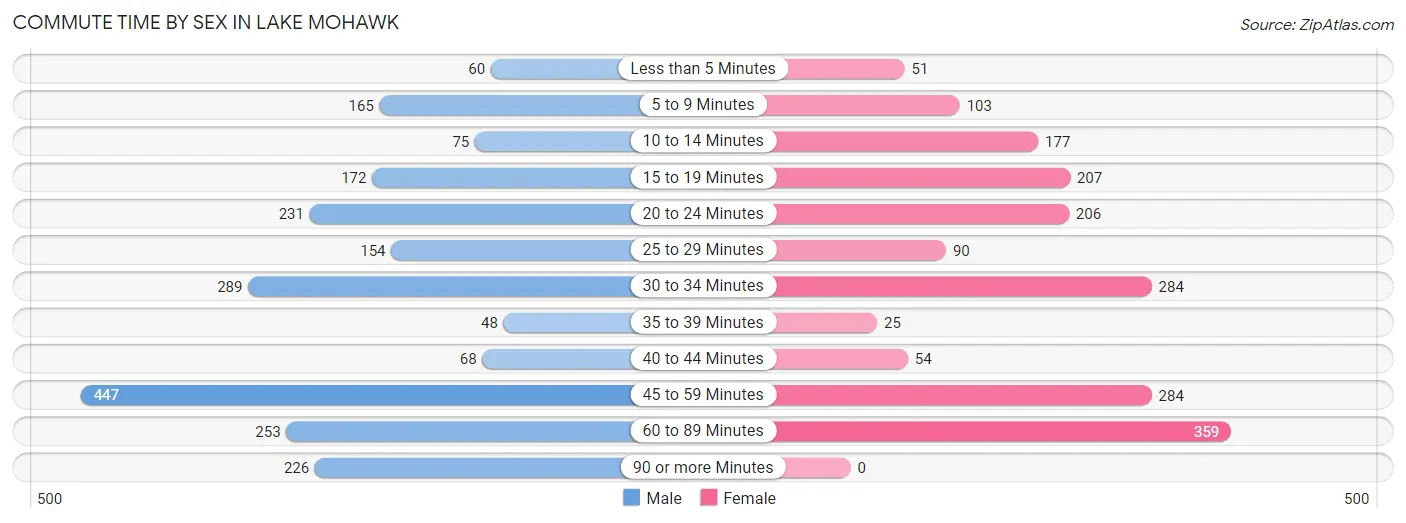
| Commute Time | Male | Female |
| Less than 5 Minutes | 60 (2.7%) | 51 (2.8%) |
| 5 to 9 Minutes | 165 (7.5%) | 103 (5.6%) |
| 10 to 14 Minutes | 75 (3.4%) | 177 (9.6%) |
| 15 to 19 Minutes | 172 (7.9%) | 207 (11.3%) |
| 20 to 24 Minutes | 231 (10.6%) | 206 (11.2%) |
| 25 to 29 Minutes | 154 (7.0%) | 90 (4.9%) |
| 30 to 34 Minutes | 289 (13.2%) | 284 (15.4%) |
| 35 to 39 Minutes | 48 (2.2%) | 25 (1.4%) |
| 40 to 44 Minutes | 68 (3.1%) | 54 (2.9%) |
| 45 to 59 Minutes | 447 (20.4%) | 284 (15.4%) |
| 60 to 89 Minutes | 253 (11.6%) | 359 (19.5%) |
| 90 or more Minutes | 226 (10.3%) | 0 (0.0%) |
Time of Departure to Work by Sex in Lake Mohawk
The most frequent times of departure to work in Lake Mohawk are 8:00 AM to 8:29 AM (365, 16.7%) for males and 8:00 AM to 8:29 AM (309, 16.8%) for females.
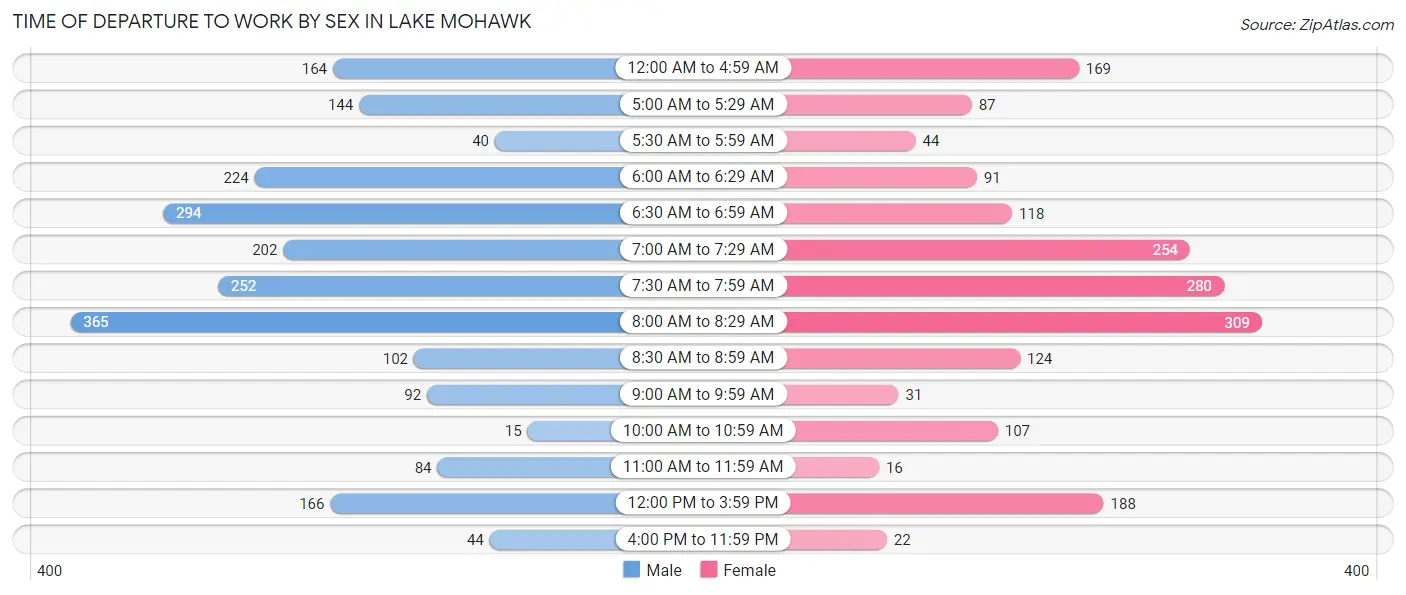
| Time of Departure | Male | Female |
| 12:00 AM to 4:59 AM | 164 (7.5%) | 169 (9.2%) |
| 5:00 AM to 5:29 AM | 144 (6.6%) | 87 (4.7%) |
| 5:30 AM to 5:59 AM | 40 (1.8%) | 44 (2.4%) |
| 6:00 AM to 6:29 AM | 224 (10.2%) | 91 (5.0%) |
| 6:30 AM to 6:59 AM | 294 (13.4%) | 118 (6.4%) |
| 7:00 AM to 7:29 AM | 202 (9.2%) | 254 (13.8%) |
| 7:30 AM to 7:59 AM | 252 (11.5%) | 280 (15.2%) |
| 8:00 AM to 8:29 AM | 365 (16.7%) | 309 (16.8%) |
| 8:30 AM to 8:59 AM | 102 (4.7%) | 124 (6.7%) |
| 9:00 AM to 9:59 AM | 92 (4.2%) | 31 (1.7%) |
| 10:00 AM to 10:59 AM | 15 (0.7%) | 107 (5.8%) |
| 11:00 AM to 11:59 AM | 84 (3.8%) | 16 (0.9%) |
| 12:00 PM to 3:59 PM | 166 (7.6%) | 188 (10.2%) |
| 4:00 PM to 11:59 PM | 44 (2.0%) | 22 (1.2%) |
| Total | 2,188 (100.0%) | 1,840 (100.0%) |
Housing Occupancy in Lake Mohawk
Occupancy by Ownership in Lake Mohawk
Of the total 3,824 dwellings in Lake Mohawk, owner-occupied units account for 3,296 (86.2%), while renter-occupied units make up 528 (13.8%).
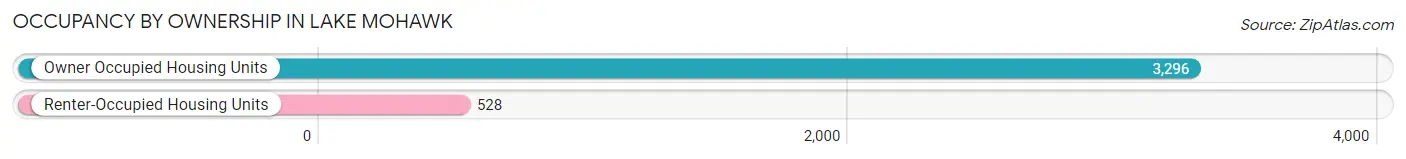
| Occupancy | # Housing Units | % Housing Units |
| Owner Occupied Housing Units | 3,296 | 86.2% |
| Renter-Occupied Housing Units | 528 | 13.8% |
| Total Occupied Housing Units | 3,824 | 100.0% |
Occupancy by Household Size in Lake Mohawk
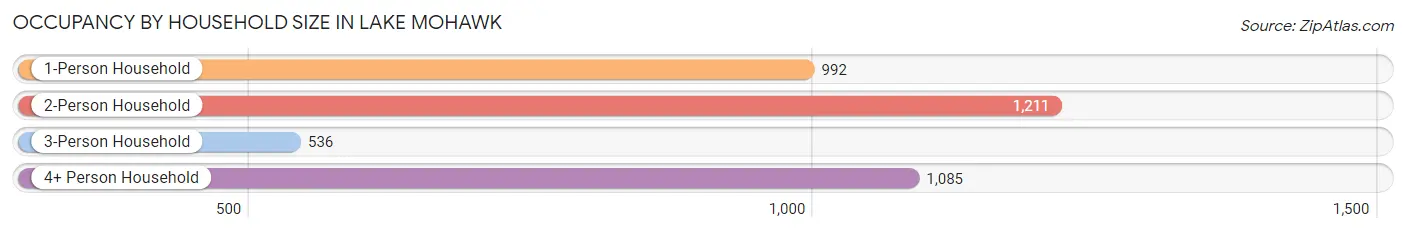
| Household Size | # Housing Units | % Housing Units |
| 1-Person Household | 992 | 25.9% |
| 2-Person Household | 1,211 | 31.7% |
| 3-Person Household | 536 | 14.0% |
| 4+ Person Household | 1,085 | 28.4% |
| Total Housing Units | 3,824 | 100.0% |
Occupancy by Ownership by Household Size in Lake Mohawk
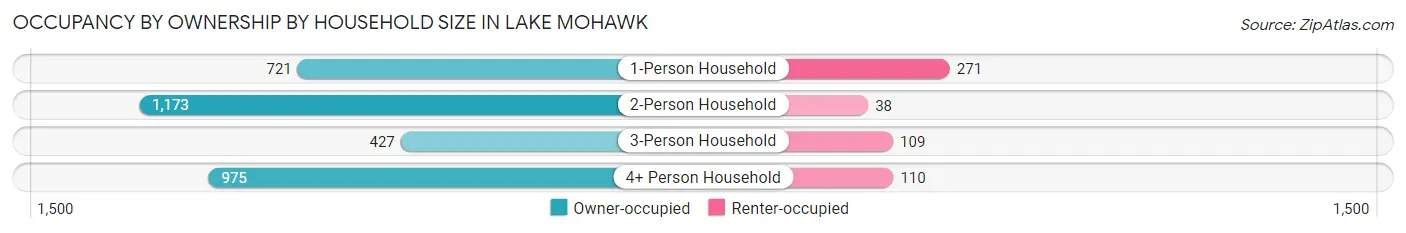
| Household Size | Owner-occupied | Renter-occupied |
| 1-Person Household | 721 (72.7%) | 271 (27.3%) |
| 2-Person Household | 1,173 (96.9%) | 38 (3.1%) |
| 3-Person Household | 427 (79.7%) | 109 (20.3%) |
| 4+ Person Household | 975 (89.9%) | 110 (10.1%) |
| Total Housing Units | 3,296 (86.2%) | 528 (13.8%) |
Occupancy by Educational Attainment in Lake Mohawk
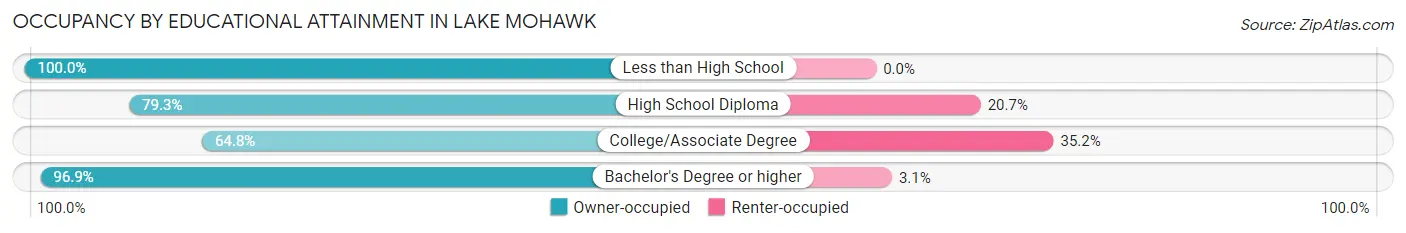
| Household Size | Owner-occupied | Renter-occupied |
| Less than High School | 23 (100.0%) | 0 (0.0%) |
| High School Diploma | 348 (79.3%) | 91 (20.7%) |
| College/Associate Degree | 671 (64.8%) | 364 (35.2%) |
| Bachelor's Degree or higher | 2,254 (96.9%) | 73 (3.1%) |
Occupancy by Age of Householder in Lake Mohawk
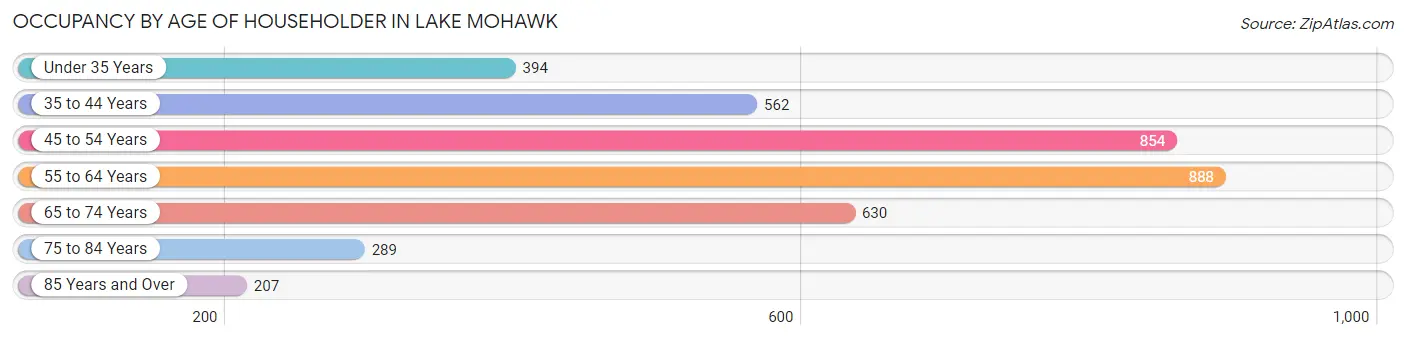
| Age Bracket | # Households | % Households |
| Under 35 Years | 394 | 10.3% |
| 35 to 44 Years | 562 | 14.7% |
| 45 to 54 Years | 854 | 22.3% |
| 55 to 64 Years | 888 | 23.2% |
| 65 to 74 Years | 630 | 16.5% |
| 75 to 84 Years | 289 | 7.6% |
| 85 Years and Over | 207 | 5.4% |
| Total | 3,824 | 100.0% |
Housing Finances in Lake Mohawk
Median Income by Occupancy in Lake Mohawk
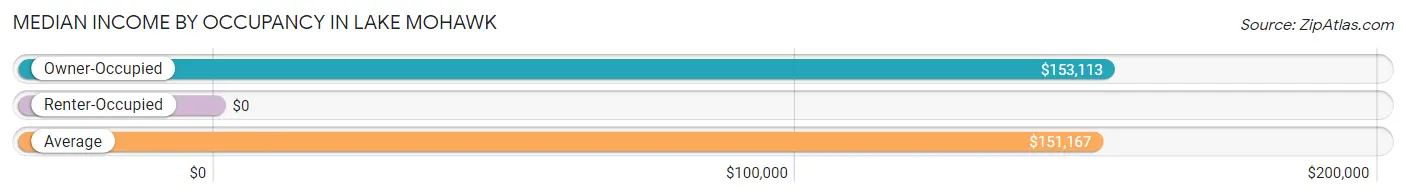
| Occupancy Type | # Households | Median Income |
| Owner-Occupied | 3,296 (86.2%) | $153,113 |
| Renter-Occupied | 528 (13.8%) | $0 |
| Average | 3,824 (100.0%) | $151,167 |
Occupancy by Householder Income Bracket in Lake Mohawk
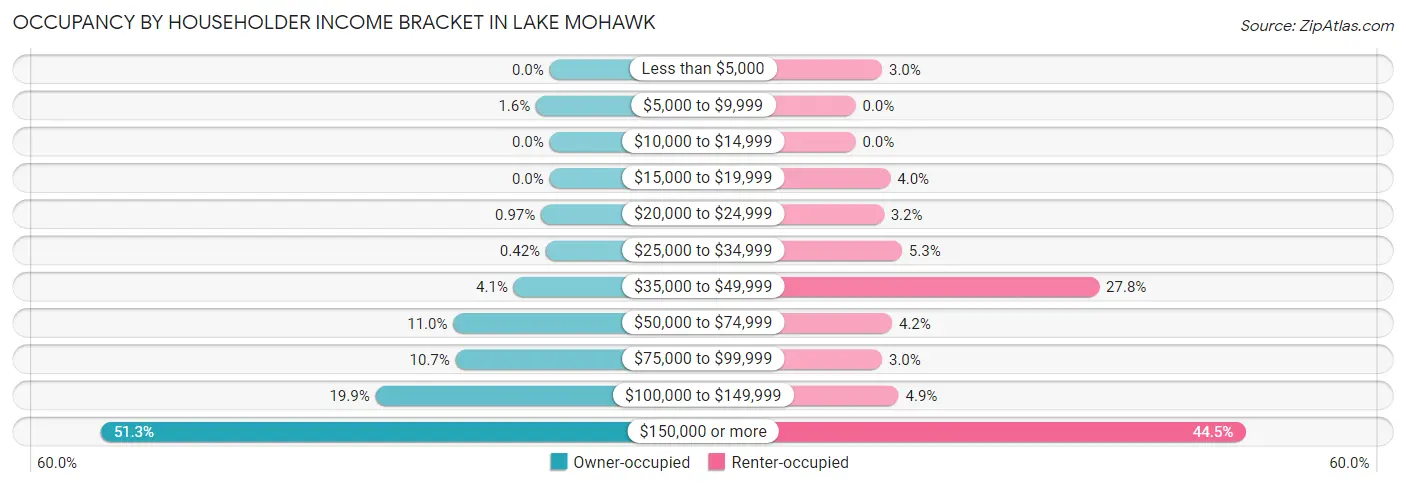
| Income Bracket | Owner-occupied | Renter-occupied |
| Less than $5,000 | 0 (0.0%) | 16 (3.0%) |
| $5,000 to $9,999 | 51 (1.5%) | 0 (0.0%) |
| $10,000 to $14,999 | 0 (0.0%) | 0 (0.0%) |
| $15,000 to $19,999 | 0 (0.0%) | 21 (4.0%) |
| $20,000 to $24,999 | 32 (1.0%) | 17 (3.2%) |
| $25,000 to $34,999 | 14 (0.4%) | 28 (5.3%) |
| $35,000 to $49,999 | 135 (4.1%) | 147 (27.8%) |
| $50,000 to $74,999 | 363 (11.0%) | 22 (4.2%) |
| $75,000 to $99,999 | 354 (10.7%) | 16 (3.0%) |
| $100,000 to $149,999 | 656 (19.9%) | 26 (4.9%) |
| $150,000 or more | 1,691 (51.3%) | 235 (44.5%) |
| Total | 3,296 (100.0%) | 528 (100.0%) |
Monthly Housing Cost Tiers in Lake Mohawk
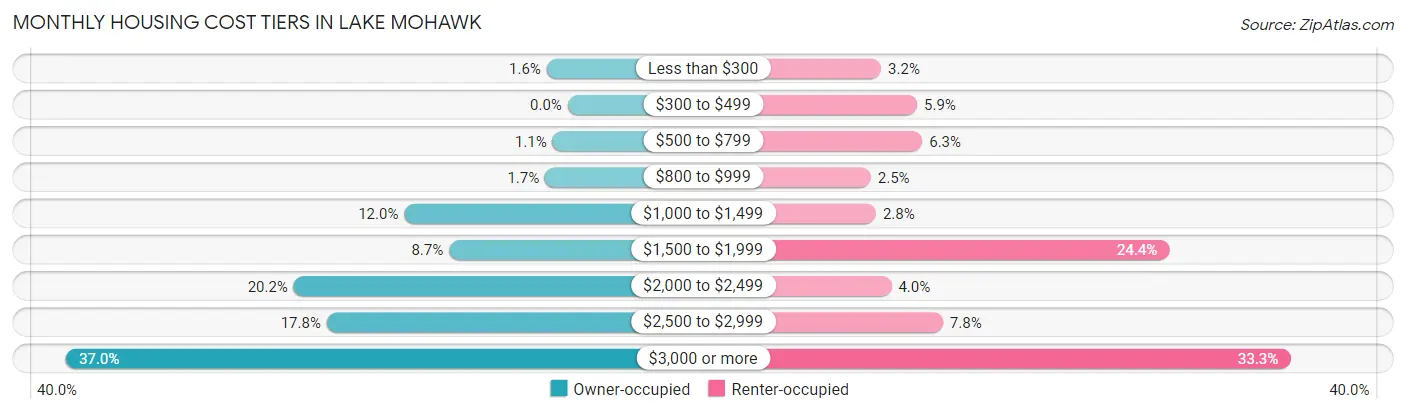
| Monthly Cost | Owner-occupied | Renter-occupied |
| Less than $300 | 51 (1.5%) | 17 (3.2%) |
| $300 to $499 | 0 (0.0%) | 31 (5.9%) |
| $500 to $799 | 37 (1.1%) | 33 (6.2%) |
| $800 to $999 | 55 (1.7%) | 13 (2.5%) |
| $1,000 to $1,499 | 397 (12.0%) | 15 (2.8%) |
| $1,500 to $1,999 | 288 (8.7%) | 129 (24.4%) |
| $2,000 to $2,499 | 665 (20.2%) | 21 (4.0%) |
| $2,500 to $2,999 | 585 (17.7%) | 41 (7.8%) |
| $3,000 or more | 1,218 (36.9%) | 176 (33.3%) |
| Total | 3,296 (100.0%) | 528 (100.0%) |
Physical Housing Characteristics in Lake Mohawk
Housing Structures in Lake Mohawk
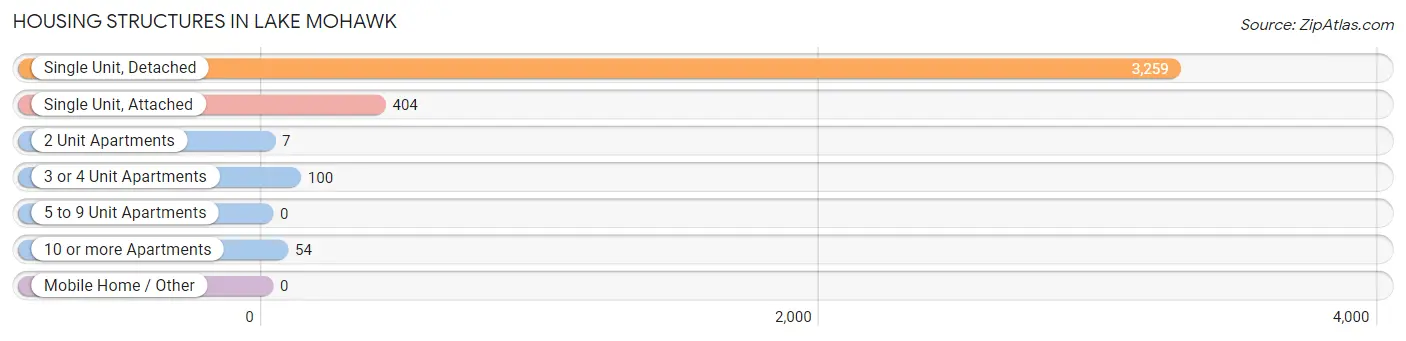
| Structure Type | # Housing Units | % Housing Units |
| Single Unit, Detached | 3,259 | 85.2% |
| Single Unit, Attached | 404 | 10.6% |
| 2 Unit Apartments | 7 | 0.2% |
| 3 or 4 Unit Apartments | 100 | 2.6% |
| 5 to 9 Unit Apartments | 0 | 0.0% |
| 10 or more Apartments | 54 | 1.4% |
| Mobile Home / Other | 0 | 0.0% |
| Total | 3,824 | 100.0% |
Housing Structures by Occupancy in Lake Mohawk
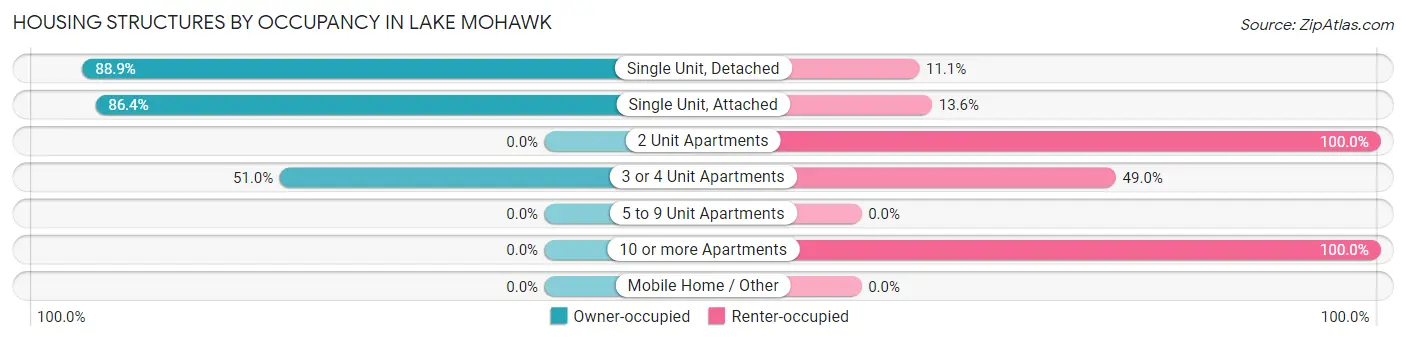
| Structure Type | Owner-occupied | Renter-occupied |
| Single Unit, Detached | 2,896 (88.9%) | 363 (11.1%) |
| Single Unit, Attached | 349 (86.4%) | 55 (13.6%) |
| 2 Unit Apartments | 0 (0.0%) | 7 (100.0%) |
| 3 or 4 Unit Apartments | 51 (51.0%) | 49 (49.0%) |
| 5 to 9 Unit Apartments | 0 (0.0%) | 0 (0.0%) |
| 10 or more Apartments | 0 (0.0%) | 54 (100.0%) |
| Mobile Home / Other | 0 (0.0%) | 0 (0.0%) |
| Total | 3,296 (86.2%) | 528 (13.8%) |
Housing Structures by Number of Rooms in Lake Mohawk
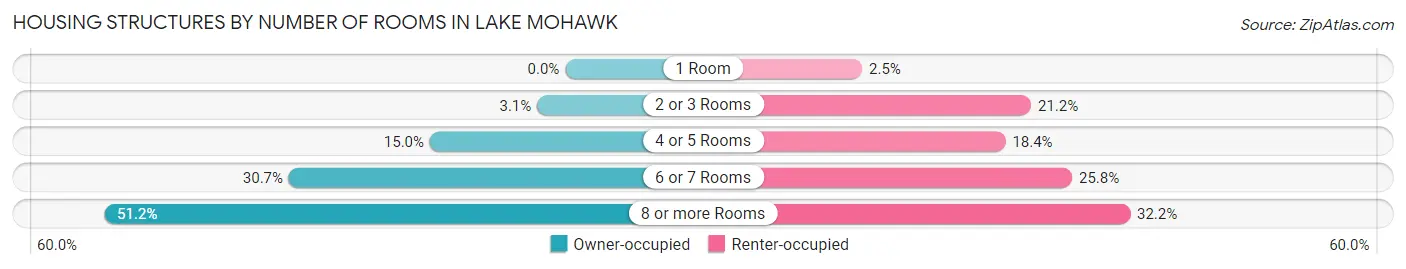
| Number of Rooms | Owner-occupied | Renter-occupied |
| 1 Room | 0 (0.0%) | 13 (2.5%) |
| 2 or 3 Rooms | 103 (3.1%) | 112 (21.2%) |
| 4 or 5 Rooms | 495 (15.0%) | 97 (18.4%) |
| 6 or 7 Rooms | 1,011 (30.7%) | 136 (25.8%) |
| 8 or more Rooms | 1,687 (51.2%) | 170 (32.2%) |
| Total | 3,296 (100.0%) | 528 (100.0%) |
Housing Structure by Heating Type in Lake Mohawk
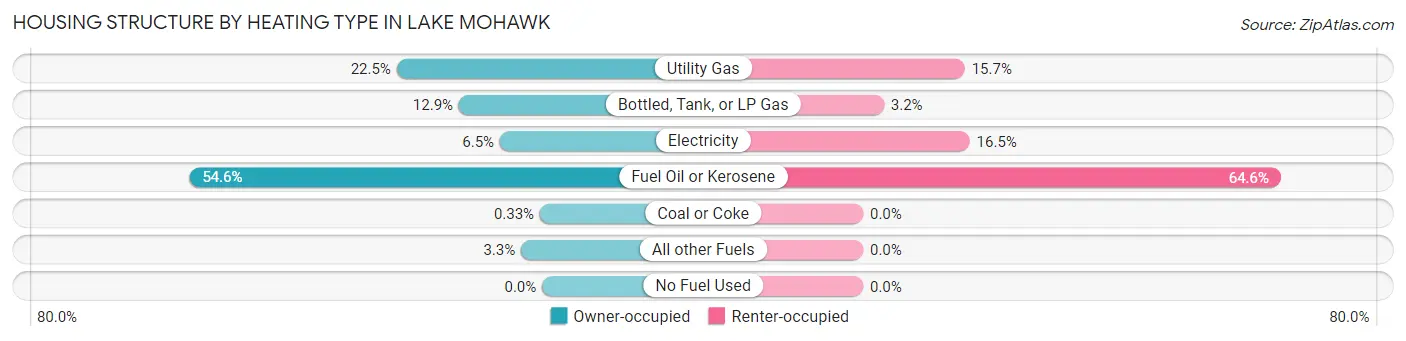
| Heating Type | Owner-occupied | Renter-occupied |
| Utility Gas | 741 (22.5%) | 83 (15.7%) |
| Bottled, Tank, or LP Gas | 424 (12.9%) | 17 (3.2%) |
| Electricity | 215 (6.5%) | 87 (16.5%) |
| Fuel Oil or Kerosene | 1,798 (54.5%) | 341 (64.6%) |
| Coal or Coke | 11 (0.3%) | 0 (0.0%) |
| All other Fuels | 107 (3.3%) | 0 (0.0%) |
| No Fuel Used | 0 (0.0%) | 0 (0.0%) |
| Total | 3,296 (100.0%) | 528 (100.0%) |
Household Vehicle Usage in Lake Mohawk
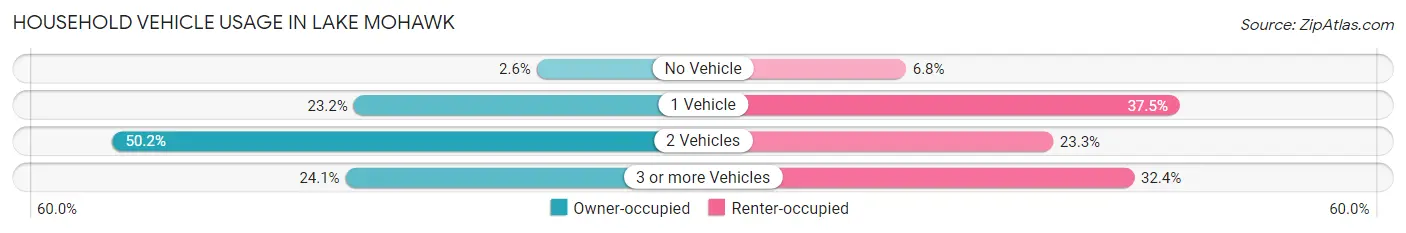
| Vehicles per Household | Owner-occupied | Renter-occupied |
| No Vehicle | 87 (2.6%) | 36 (6.8%) |
| 1 Vehicle | 763 (23.2%) | 198 (37.5%) |
| 2 Vehicles | 1,653 (50.1%) | 123 (23.3%) |
| 3 or more Vehicles | 793 (24.1%) | 171 (32.4%) |
| Total | 3,296 (100.0%) | 528 (100.0%) |
Real Estate & Mortgages in Lake Mohawk
Real Estate and Mortgage Overview in Lake Mohawk
| Characteristic | Without Mortgage | With Mortgage |
| Housing Units | 796 | 2,500 |
| Median Property Value | $421,700 | $416,400 |
| Median Household Income | $107,794 | $1,409 |
| Monthly Housing Costs | $1,409 | $1,198 |
| Real Estate Taxes | $10,001 | $21 |
Property Value by Mortgage Status in Lake Mohawk
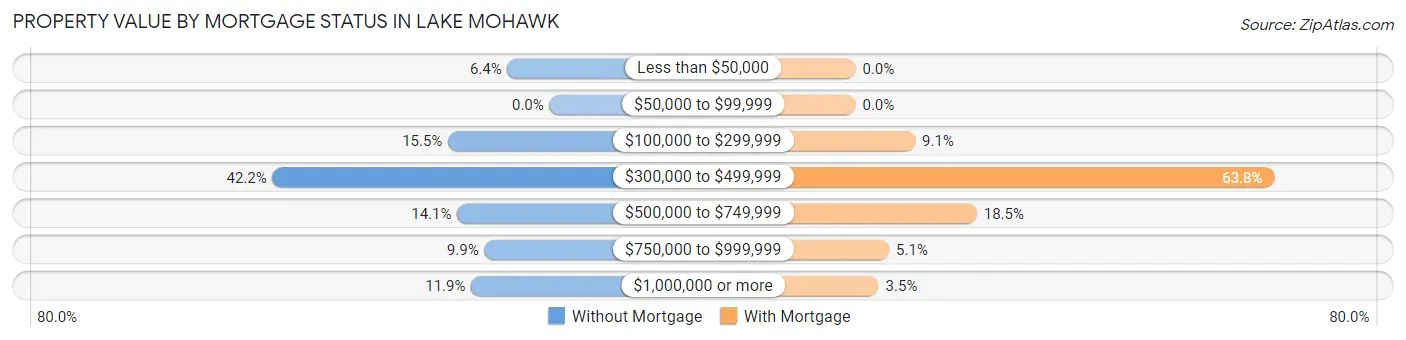
| Property Value | Without Mortgage | With Mortgage |
| Less than $50,000 | 51 (6.4%) | 0 (0.0%) |
| $50,000 to $99,999 | 0 (0.0%) | 0 (0.0%) |
| $100,000 to $299,999 | 123 (15.4%) | 227 (9.1%) |
| $300,000 to $499,999 | 336 (42.2%) | 1,595 (63.8%) |
| $500,000 to $749,999 | 112 (14.1%) | 462 (18.5%) |
| $750,000 to $999,999 | 79 (9.9%) | 128 (5.1%) |
| $1,000,000 or more | 95 (11.9%) | 88 (3.5%) |
| Total | 796 (100.0%) | 2,500 (100.0%) |
Household Income by Mortgage Status in Lake Mohawk
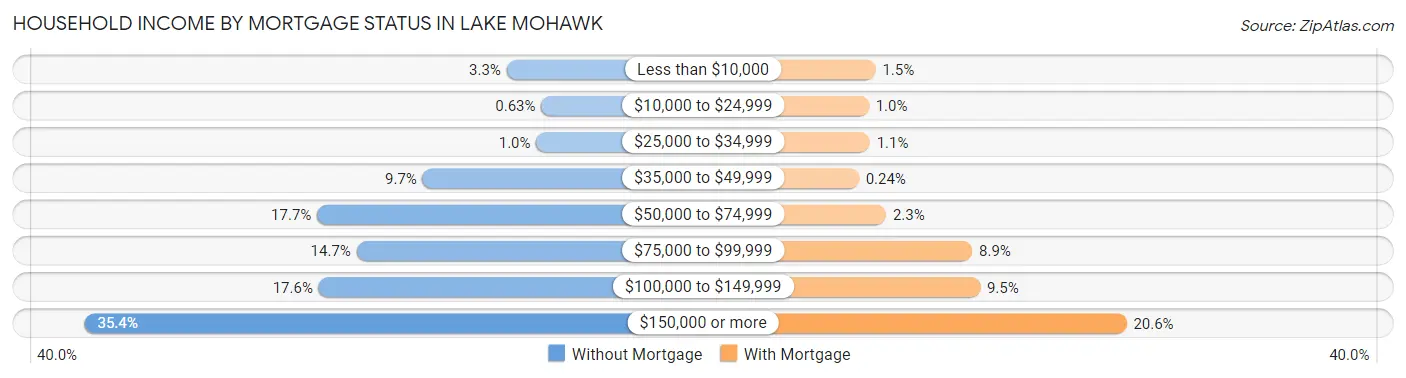
| Household Income | Without Mortgage | With Mortgage |
| Less than $10,000 | 26 (3.3%) | 38 (1.5%) |
| $10,000 to $24,999 | 5 (0.6%) | 25 (1.0%) |
| $25,000 to $34,999 | 8 (1.0%) | 27 (1.1%) |
| $35,000 to $49,999 | 77 (9.7%) | 6 (0.2%) |
| $50,000 to $74,999 | 141 (17.7%) | 58 (2.3%) |
| $75,000 to $99,999 | 117 (14.7%) | 222 (8.9%) |
| $100,000 to $149,999 | 140 (17.6%) | 237 (9.5%) |
| $150,000 or more | 282 (35.4%) | 516 (20.6%) |
| Total | 796 (100.0%) | 2,500 (100.0%) |
Property Value to Household Income Ratio in Lake Mohawk
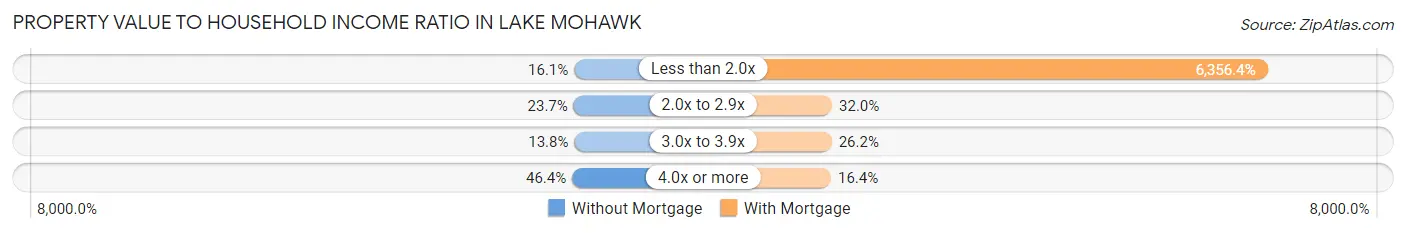
| Value-to-Income Ratio | Without Mortgage | With Mortgage |
| Less than 2.0x | 128 (16.1%) | 158,911 (6,356.4%) |
| 2.0x to 2.9x | 189 (23.7%) | 799 (32.0%) |
| 3.0x to 3.9x | 110 (13.8%) | 656 (26.2%) |
| 4.0x or more | 369 (46.4%) | 411 (16.4%) |
| Total | 796 (100.0%) | 2,500 (100.0%) |
Real Estate Taxes by Mortgage Status in Lake Mohawk
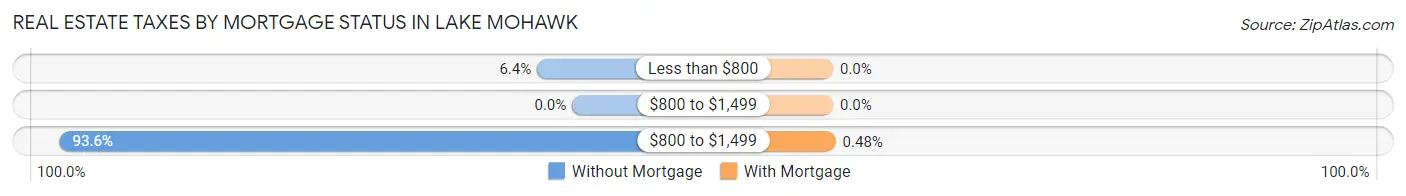
| Property Taxes | Without Mortgage | With Mortgage |
| Less than $800 | 51 (6.4%) | 0 (0.0%) |
| $800 to $1,499 | 0 (0.0%) | 0 (0.0%) |
| $800 to $1,499 | 745 (93.6%) | 12 (0.5%) |
| Total | 796 (100.0%) | 2,500 (100.0%) |
Health & Disability in Lake Mohawk
Health Insurance Coverage by Age in Lake Mohawk
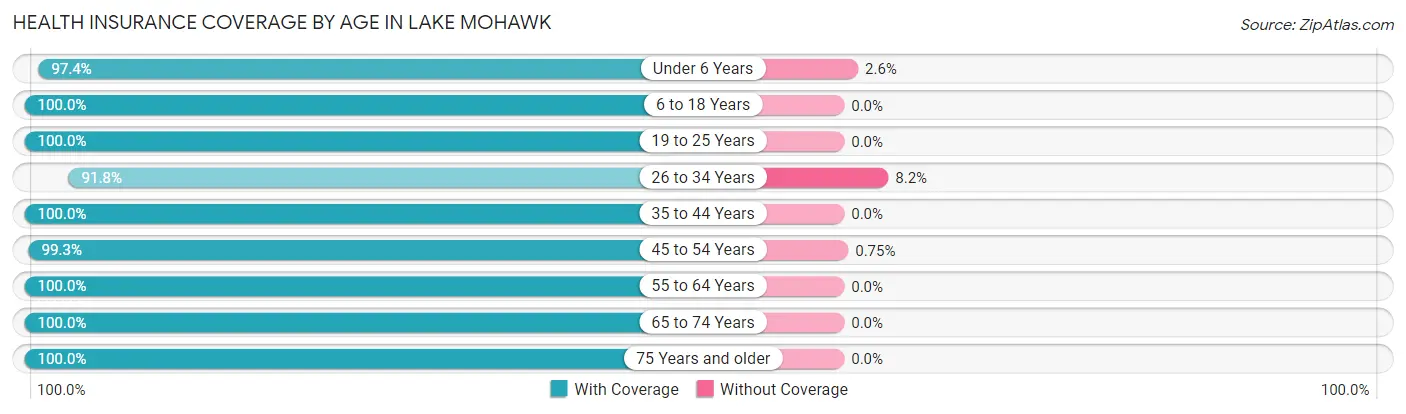
| Age Bracket | With Coverage | Without Coverage |
| Under 6 Years | 642 (97.4%) | 17 (2.6%) |
| 6 to 18 Years | 1,715 (100.0%) | 0 (0.0%) |
| 19 to 25 Years | 673 (100.0%) | 0 (0.0%) |
| 26 to 34 Years | 660 (91.8%) | 59 (8.2%) |
| 35 to 44 Years | 1,116 (100.0%) | 0 (0.0%) |
| 45 to 54 Years | 1,584 (99.3%) | 12 (0.7%) |
| 55 to 64 Years | 1,403 (100.0%) | 0 (0.0%) |
| 65 to 74 Years | 1,058 (100.0%) | 0 (0.0%) |
| 75 Years and older | 741 (100.0%) | 0 (0.0%) |
| Total | 9,592 (99.1%) | 88 (0.9%) |
Health Insurance Coverage by Citizenship Status in Lake Mohawk
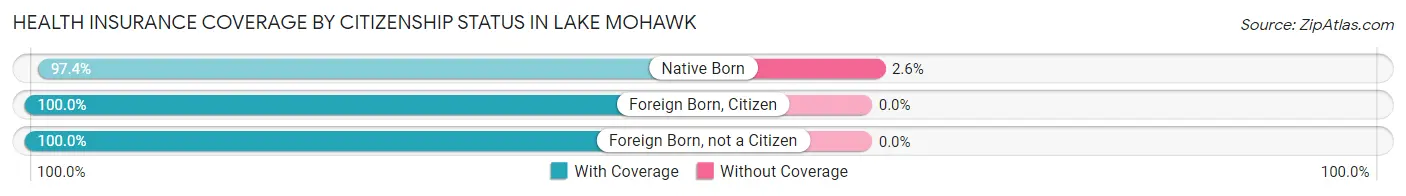
| Citizenship Status | With Coverage | Without Coverage |
| Native Born | 642 (97.4%) | 17 (2.6%) |
| Foreign Born, Citizen | 1,715 (100.0%) | 0 (0.0%) |
| Foreign Born, not a Citizen | 673 (100.0%) | 0 (0.0%) |
Health Insurance Coverage by Household Income in Lake Mohawk
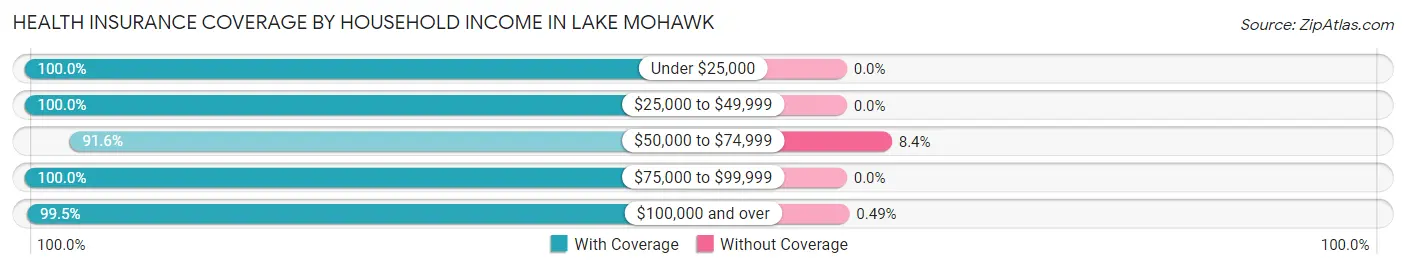
| Household Income | With Coverage | Without Coverage |
| Under $25,000 | 184 (100.0%) | 0 (0.0%) |
| $25,000 to $49,999 | 651 (100.0%) | 0 (0.0%) |
| $50,000 to $74,999 | 554 (91.6%) | 51 (8.4%) |
| $75,000 to $99,999 | 675 (100.0%) | 0 (0.0%) |
| $100,000 and over | 7,523 (99.5%) | 37 (0.5%) |
Public vs Private Health Insurance Coverage by Age in Lake Mohawk
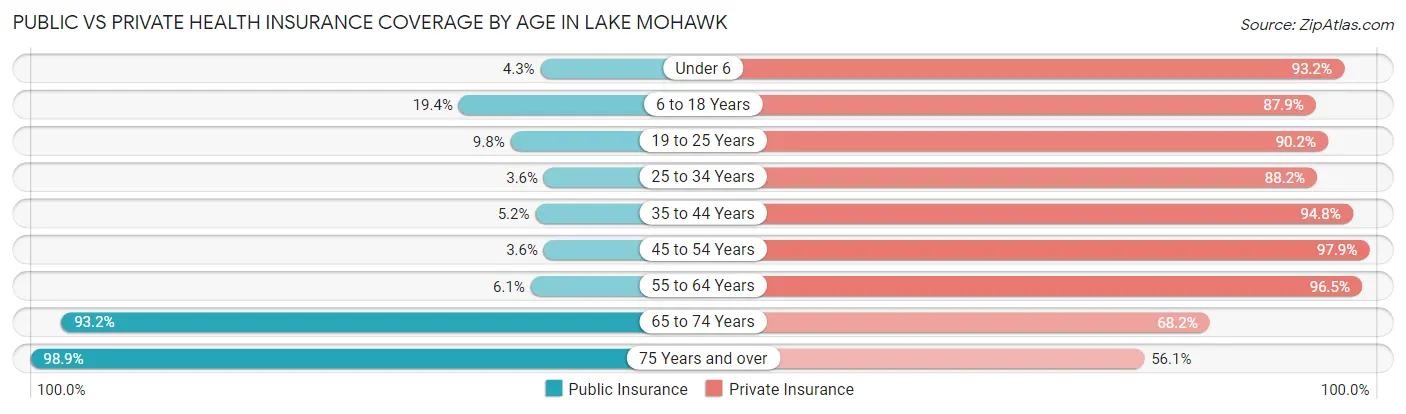
| Age Bracket | Public Insurance | Private Insurance |
| Under 6 | 28 (4.3%) | 614 (93.2%) |
| 6 to 18 Years | 333 (19.4%) | 1,508 (87.9%) |
| 19 to 25 Years | 66 (9.8%) | 607 (90.2%) |
| 25 to 34 Years | 26 (3.6%) | 634 (88.2%) |
| 35 to 44 Years | 58 (5.2%) | 1,058 (94.8%) |
| 45 to 54 Years | 58 (3.6%) | 1,562 (97.9%) |
| 55 to 64 Years | 85 (6.1%) | 1,354 (96.5%) |
| 65 to 74 Years | 986 (93.2%) | 722 (68.2%) |
| 75 Years and over | 733 (98.9%) | 416 (56.1%) |
| Total | 2,373 (24.5%) | 8,475 (87.5%) |
Disability Status by Sex by Age in Lake Mohawk
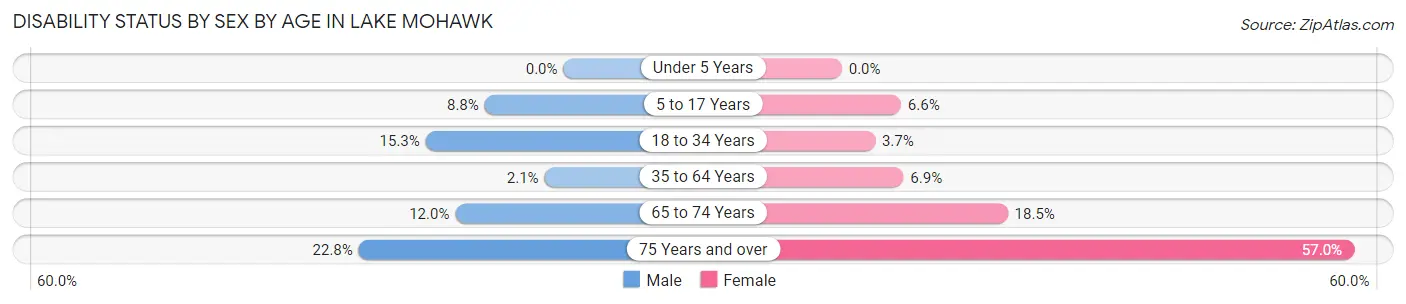
| Age Bracket | Male | Female |
| Under 5 Years | 0 (0.0%) | 0 (0.0%) |
| 5 to 17 Years | 69 (8.8%) | 51 (6.6%) |
| 18 to 34 Years | 129 (15.3%) | 29 (3.7%) |
| 35 to 64 Years | 45 (2.1%) | 136 (6.9%) |
| 65 to 74 Years | 55 (12.0%) | 111 (18.5%) |
| 75 Years and over | 57 (22.8%) | 280 (57.0%) |
Disability Class by Sex by Age in Lake Mohawk
Disability Class: Hearing Difficulty
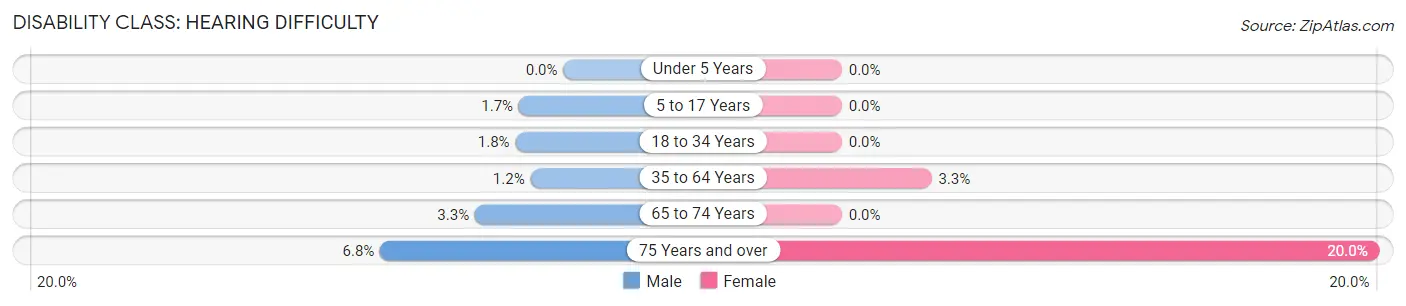
| Age Bracket | Male | Female |
| Under 5 Years | 0 (0.0%) | 0 (0.0%) |
| 5 to 17 Years | 13 (1.7%) | 0 (0.0%) |
| 18 to 34 Years | 15 (1.8%) | 0 (0.0%) |
| 35 to 64 Years | 26 (1.2%) | 66 (3.3%) |
| 65 to 74 Years | 15 (3.3%) | 0 (0.0%) |
| 75 Years and over | 17 (6.8%) | 98 (20.0%) |
Disability Class: Vision Difficulty
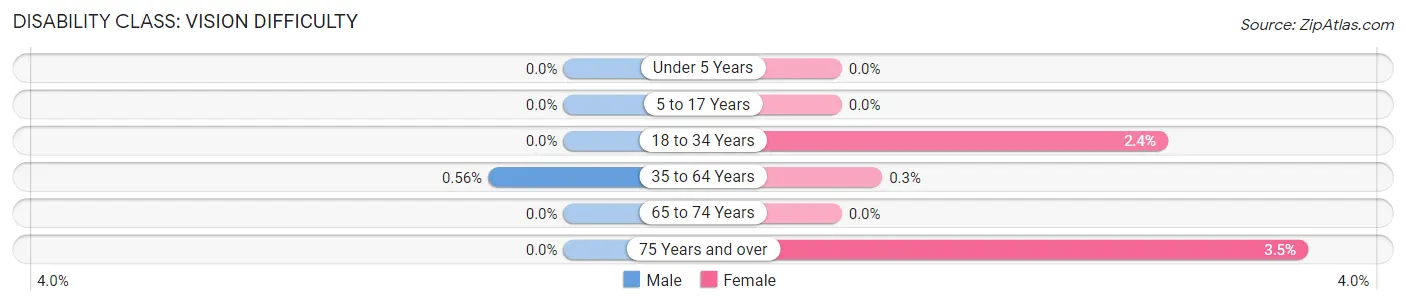
| Age Bracket | Male | Female |
| Under 5 Years | 0 (0.0%) | 0 (0.0%) |
| 5 to 17 Years | 0 (0.0%) | 0 (0.0%) |
| 18 to 34 Years | 0 (0.0%) | 19 (2.4%) |
| 35 to 64 Years | 12 (0.6%) | 6 (0.3%) |
| 65 to 74 Years | 0 (0.0%) | 0 (0.0%) |
| 75 Years and over | 0 (0.0%) | 17 (3.5%) |
Disability Class: Cognitive Difficulty
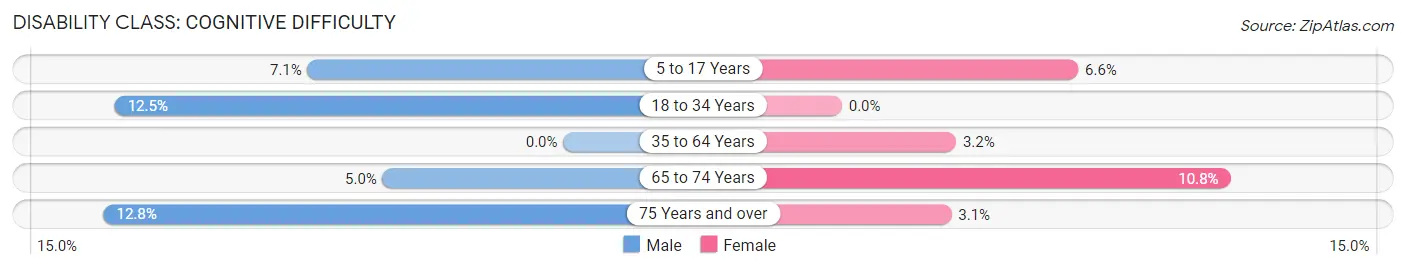
| Age Bracket | Male | Female |
| 5 to 17 Years | 56 (7.1%) | 51 (6.6%) |
| 18 to 34 Years | 105 (12.5%) | 0 (0.0%) |
| 35 to 64 Years | 0 (0.0%) | 63 (3.2%) |
| 65 to 74 Years | 23 (5.0%) | 65 (10.8%) |
| 75 Years and over | 32 (12.8%) | 15 (3.0%) |
Disability Class: Ambulatory Difficulty
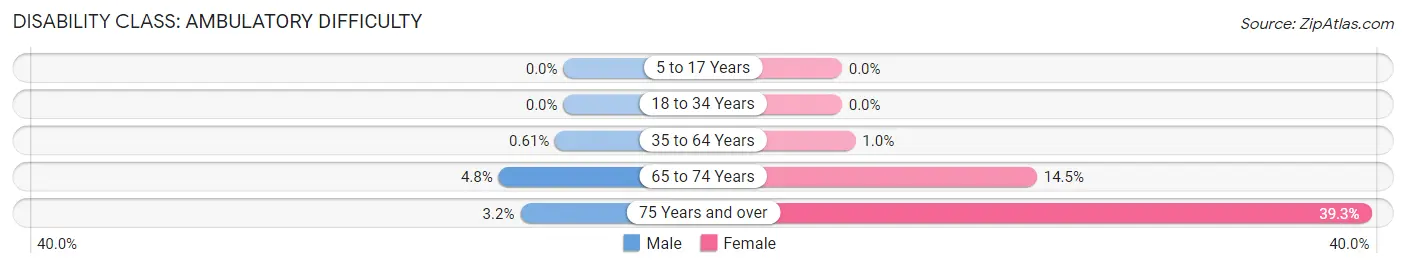
| Age Bracket | Male | Female |
| 5 to 17 Years | 0 (0.0%) | 0 (0.0%) |
| 18 to 34 Years | 0 (0.0%) | 0 (0.0%) |
| 35 to 64 Years | 13 (0.6%) | 20 (1.0%) |
| 65 to 74 Years | 22 (4.8%) | 87 (14.5%) |
| 75 Years and over | 8 (3.2%) | 193 (39.3%) |
Disability Class: Self-Care Difficulty
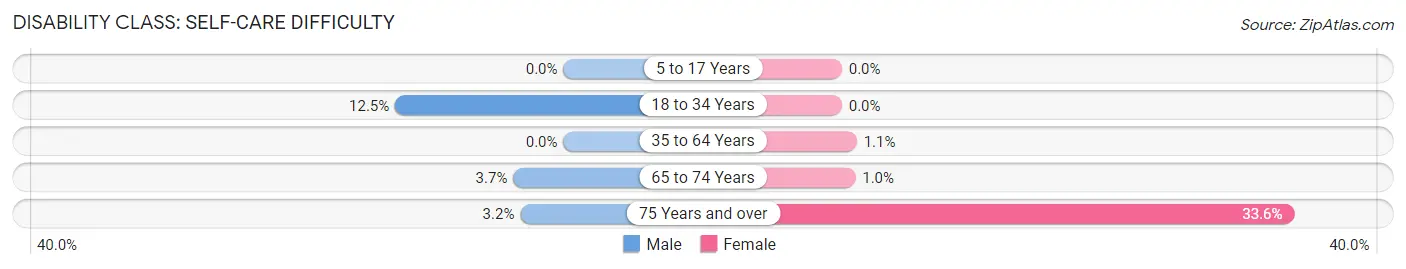
| Age Bracket | Male | Female |
| 5 to 17 Years | 0 (0.0%) | 0 (0.0%) |
| 18 to 34 Years | 105 (12.5%) | 0 (0.0%) |
| 35 to 64 Years | 0 (0.0%) | 22 (1.1%) |
| 65 to 74 Years | 17 (3.7%) | 6 (1.0%) |
| 75 Years and over | 8 (3.2%) | 165 (33.6%) |
Technology Access in Lake Mohawk
Computing Device Access in Lake Mohawk
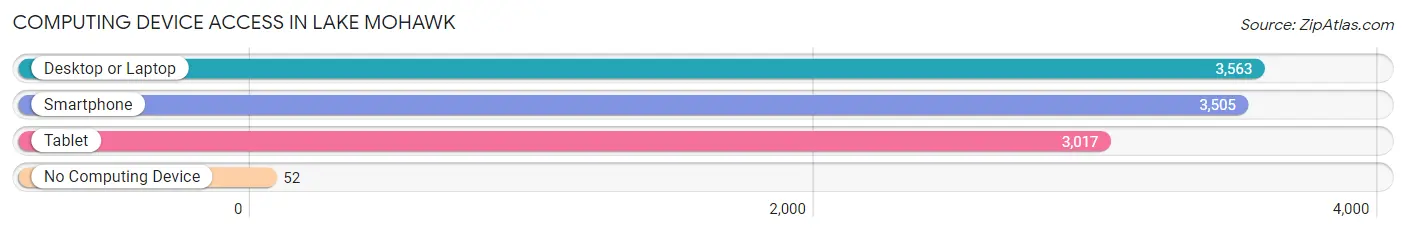
| Device Type | # Households | % Households |
| Desktop or Laptop | 3,563 | 93.2% |
| Smartphone | 3,505 | 91.7% |
| Tablet | 3,017 | 78.9% |
| No Computing Device | 52 | 1.4% |
| Total | 3,824 | 100.0% |
Internet Access in Lake Mohawk
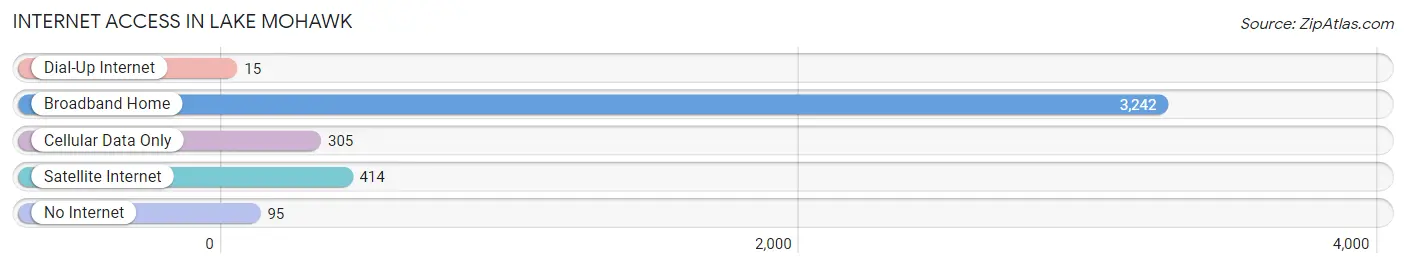
| Internet Type | # Households | % Households |
| Dial-Up Internet | 15 | 0.4% |
| Broadband Home | 3,242 | 84.8% |
| Cellular Data Only | 305 | 8.0% |
| Satellite Internet | 414 | 10.8% |
| No Internet | 95 | 2.5% |
| Total | 3,824 | 100.0% |
Lake Mohawk Summary
History
Lake Mohawk is a private residential community located in Sparta Township, Sussex County, New Jersey. It was founded in 1927 by a group of businessmen who wanted to create a recreational area for their families. The lake was created by damming the Wallkill River and was named after the nearby Mohawk Mountain. The lake is surrounded by a 3.5 mile long boardwalk, which is lined with homes and businesses.
The community was designed to be a self-contained village, with its own schools, churches, stores, and other amenities. The original plan was to create a resort-like atmosphere, with a golf course, tennis courts, and a beach. The community was also designed to be a safe and secure place to live, with a 24-hour security force.
The community has grown over the years, and now includes over 1,500 homes, two churches, a post office, a library, a fire station, and a police station. The lake is a popular destination for fishing, swimming, and boating.
Geography
Lake Mohawk is located in the Kittatinny Mountains of northwestern New Jersey. The lake is approximately 1,000 acres in size and is surrounded by a 3.5 mile long boardwalk. The lake is fed by the Wallkill River and is the source of the Sparta River. The lake is also home to several species of fish, including bass, trout, and catfish.
The community is located in a rural area, with the nearest major city being Newark, which is approximately 40 miles away. The area is known for its rolling hills, forests, and lakes.
Economy
The economy of Lake Mohawk is largely based on tourism and recreation. The lake is a popular destination for fishing, swimming, and boating. The community also has several restaurants, stores, and other businesses that cater to visitors.
The community also has several businesses that provide services to the local residents. These include a post office, a library, a fire station, and a police station.
Demographics
As of the 2010 census, the population of Lake Mohawk was 2,845. The racial makeup of the community was 94.3% White, 2.2% African American, 0.3% Native American, 0.9% Asian, 0.1% Pacific Islander, and 1.2% from other races. The median household income was $90,945, and the median family income was $103,945.
Conclusion
Lake Mohawk is a private residential community located in Sparta Township, Sussex County, New Jersey. It was founded in 1927 by a group of businessmen who wanted to create a recreational area for their families. The lake is surrounded by a 3.5 mile long boardwalk, which is lined with homes and businesses. The community has grown over the years, and now includes over 1,500 homes, two churches, a post office, a library, a fire station, and a police station. The economy of Lake Mohawk is largely based on tourism and recreation. As of the 2010 census, the population of Lake Mohawk was 2,845. The racial makeup of the community was 94.3% White, 2.2% African American, 0.3% Native American, 0.9% Asian, 0.1% Pacific Islander, and 1.2% from other races. The median household income was $90,945, and the median family income was $103,945.
Common Questions
What is the Total Population of Lake Mohawk?
Total Population of Lake Mohawk is 9,703.
What is the Total Male Population of Lake Mohawk?
Total Male Population of Lake Mohawk is 4,794.
What is the Total Female Population of Lake Mohawk?
Total Female Population of Lake Mohawk is 4,909.
What is the Ratio of Males per 100 Females in Lake Mohawk?
There are 97.66 Males per 100 Females in Lake Mohawk.
What is the Ratio of Females per 100 Males in Lake Mohawk?
There are 102.40 Females per 100 Males in Lake Mohawk.
What is the Median Population Age in Lake Mohawk?
Median Population Age in Lake Mohawk is 44.8 Years.
What is the Average Family Size in Lake Mohawk
Average Family Size in Lake Mohawk is 3.1 People.
What is the Average Household Size in Lake Mohawk
Average Household Size in Lake Mohawk is 2.5 People.
What is Per Capita Income in Lake Mohawk?
Per Capita income in Lake Mohawk is $66,203.
What is the Median Family Income in Lake Mohawk?
Median Family Income in Lake Mohawk is $181,379.
What is the Median Household income in Lake Mohawk?
Median Household Income in Lake Mohawk is $151,167.
What is Income or Wage Gap in Lake Mohawk?
Income or Wage Gap in Lake Mohawk is 27.3%.
Women in Lake Mohawk earn 72.7 cents for every dollar earned by a man.
What is Inequality or Gini Index in Lake Mohawk?
Inequality or Gini Index in Lake Mohawk is 0.38.
How Large is the Labor Force in Lake Mohawk?
There are 5,173 People in the Labor Forcein in Lake Mohawk.
What is the Percentage of People in the Labor Force in Lake Mohawk?
66.0% of People are in the Labor Force in Lake Mohawk.
What is the Unemployment Rate in Lake Mohawk?
Unemployment Rate in Lake Mohawk is 1.9%.