Groveville, NJ
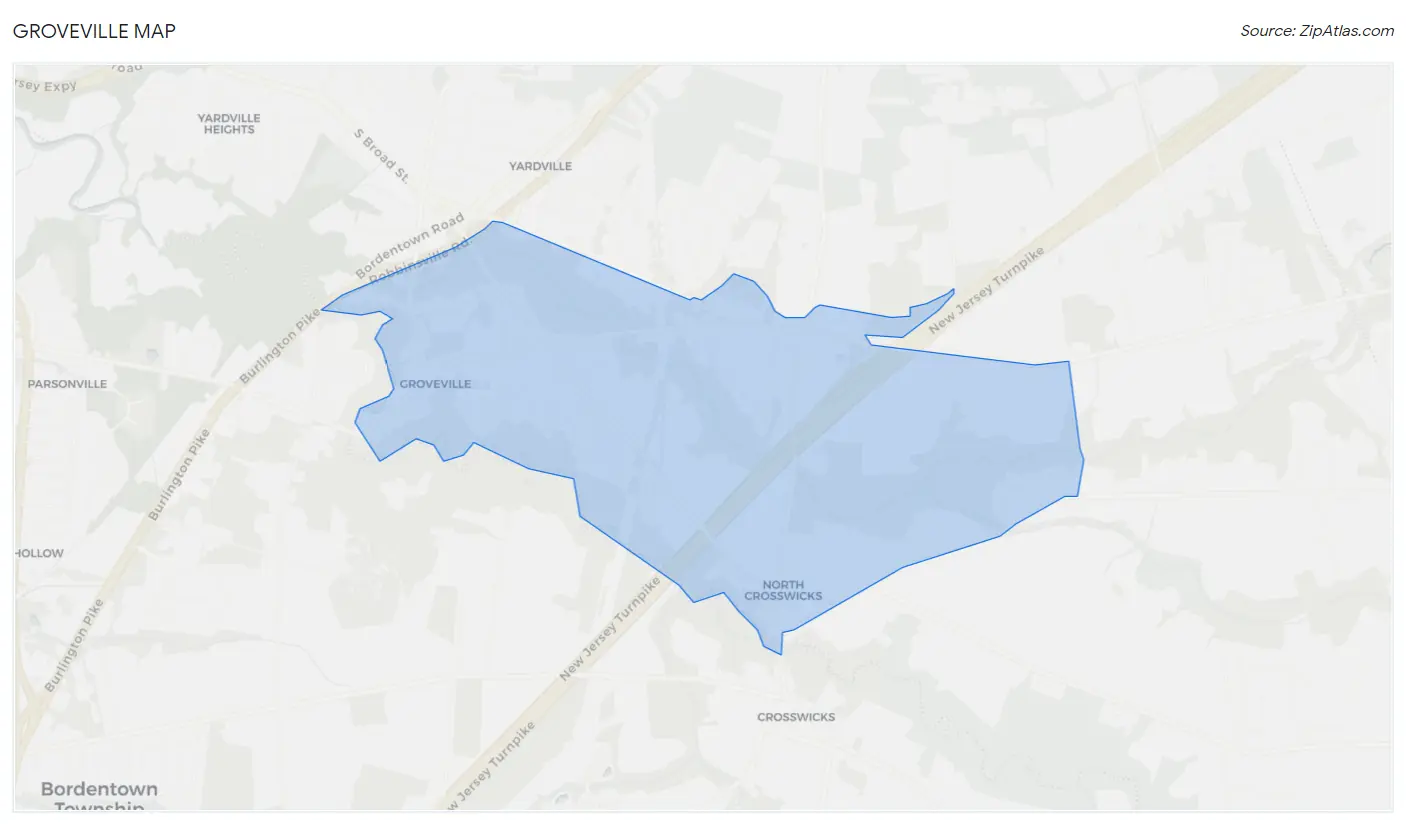
Groveville Map
Groveville Overview
3,335
TOTAL POPULATION
1,852
MALE POPULATION
1,483
FEMALE POPULATION
124.88
MALES / 100 FEMALES
80.08
FEMALES / 100 MALES
37.7
MEDIAN AGE
3.9
AVG FAMILY SIZE
3.3
AVG HOUSEHOLD SIZE
$37,762
PER CAPITA INCOME
$137,446
AVG FAMILY INCOME
$117,617
AVG HOUSEHOLD INCOME
28.3%
WAGE / INCOME GAP [ % ]
71.7¢/ $1
WAGE / INCOME GAP [ $ ]
0.40
INEQUALITY / GINI INDEX
1,893
LABOR FORCE [ PEOPLE ]
64.6%
PERCENT IN LABOR FORCE
11.9%
UNEMPLOYMENT RATE
Race in Groveville
The most populous races in Groveville are White / Caucasian (3,048 | 91.4%), Black / African American (159 | 4.8%), and Hispanic or Latino (158 | 4.7%).
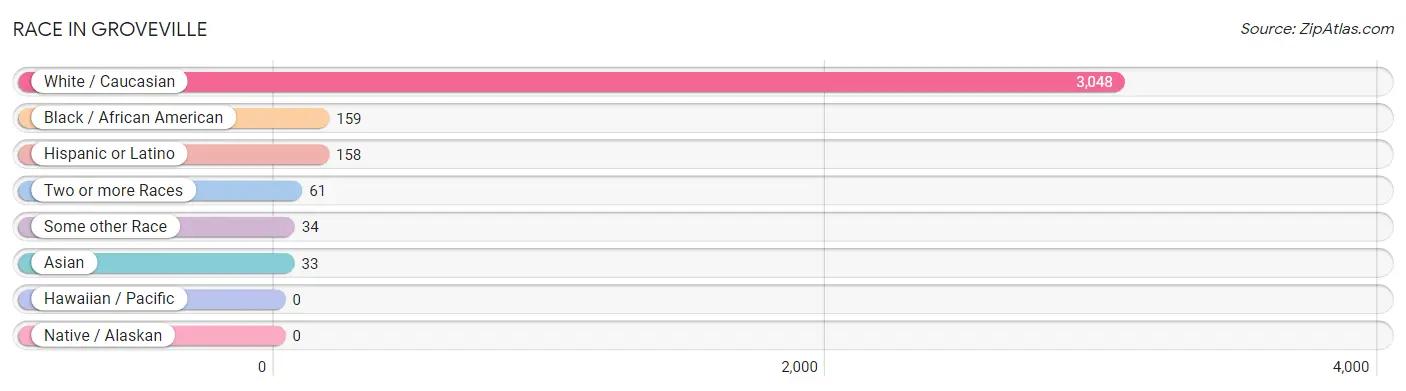
| Race | # Population | % Population |
| Asian | 33 | 1.0% |
| Black / African American | 159 | 4.8% |
| Hawaiian / Pacific | 0 | 0.0% |
| Hispanic or Latino | 158 | 4.7% |
| Native / Alaskan | 0 | 0.0% |
| White / Caucasian | 3,048 | 91.4% |
| Two or more Races | 61 | 1.8% |
| Some other Race | 34 | 1.0% |
| Total | 3,335 | 100.0% |
Ancestry in Groveville
The most populous ancestries reported in Groveville are Italian (1,551 | 46.5%), German (1,110 | 33.3%), Irish (600 | 18.0%), English (208 | 6.2%), and Slovak (152 | 4.6%), together accounting for 108.6% of all Groveville residents.
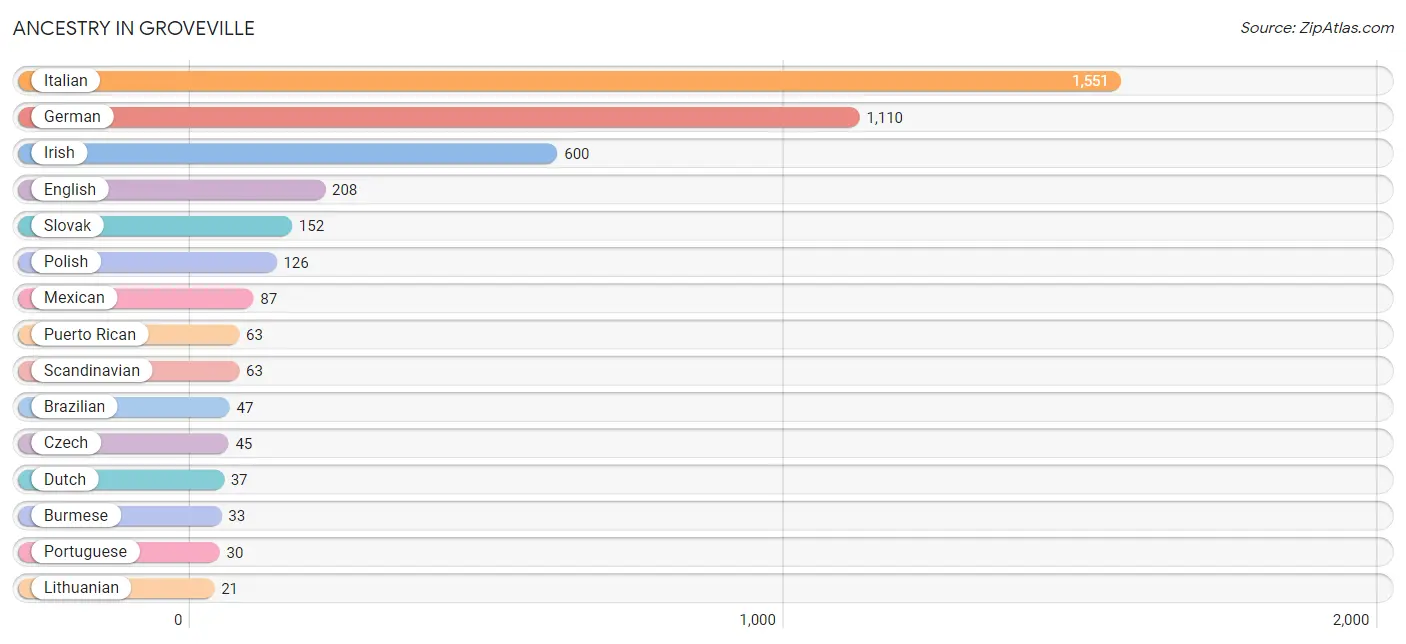
| Ancestry | # Population | % Population |
| Arab | 11 | 0.3% |
| Austrian | 17 | 0.5% |
| Bolivian | 8 | 0.2% |
| Brazilian | 47 | 1.4% |
| British | 2 | 0.1% |
| Burmese | 33 | 1.0% |
| Czech | 45 | 1.3% |
| Dutch | 37 | 1.1% |
| Eastern European | 20 | 0.6% |
| English | 208 | 6.2% |
| German | 1,110 | 33.3% |
| Haitian | 2 | 0.1% |
| Hungarian | 19 | 0.6% |
| Irish | 600 | 18.0% |
| Israeli | 17 | 0.5% |
| Italian | 1,551 | 46.5% |
| Lebanese | 11 | 0.3% |
| Lithuanian | 21 | 0.6% |
| Mexican | 87 | 2.6% |
| Polish | 126 | 3.8% |
| Portuguese | 30 | 0.9% |
| Puerto Rican | 63 | 1.9% |
| Russian | 9 | 0.3% |
| Scandinavian | 63 | 1.9% |
| Slovak | 152 | 4.6% |
| South American | 8 | 0.2% |
| Welsh | 14 | 0.4% |
| Yugoslavian | 10 | 0.3% | View All 28 Rows |
Immigrants in Groveville
The most numerous immigrant groups reported in Groveville came from Africa (71 | 2.1%), Liberia (71 | 2.1%), Western Africa (71 | 2.1%), Europe (62 | 1.9%), and Italy (52 | 1.6%), together accounting for 9.8% of all Groveville residents.
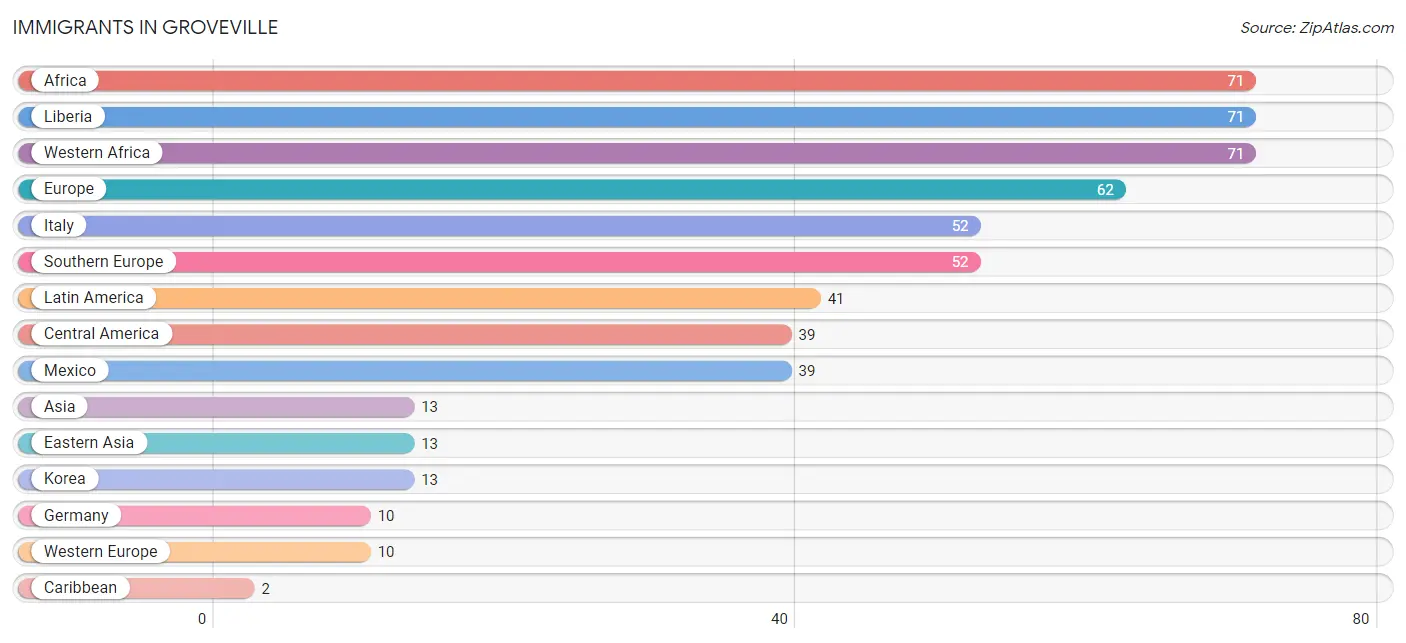
| Immigration Origin | # Population | % Population |
| Africa | 71 | 2.1% |
| Asia | 13 | 0.4% |
| Caribbean | 2 | 0.1% |
| Central America | 39 | 1.2% |
| Eastern Asia | 13 | 0.4% |
| Europe | 62 | 1.9% |
| Germany | 10 | 0.3% |
| Haiti | 2 | 0.1% |
| Italy | 52 | 1.6% |
| Korea | 13 | 0.4% |
| Latin America | 41 | 1.2% |
| Liberia | 71 | 2.1% |
| Mexico | 39 | 1.2% |
| Southern Europe | 52 | 1.6% |
| Western Africa | 71 | 2.1% |
| Western Europe | 10 | 0.3% | View All 16 Rows |
Sex and Age in Groveville
Sex and Age in Groveville
The most populous age groups in Groveville are 20 to 24 Years (348 | 18.8%) for men and 50 to 54 Years (210 | 14.2%) for women.
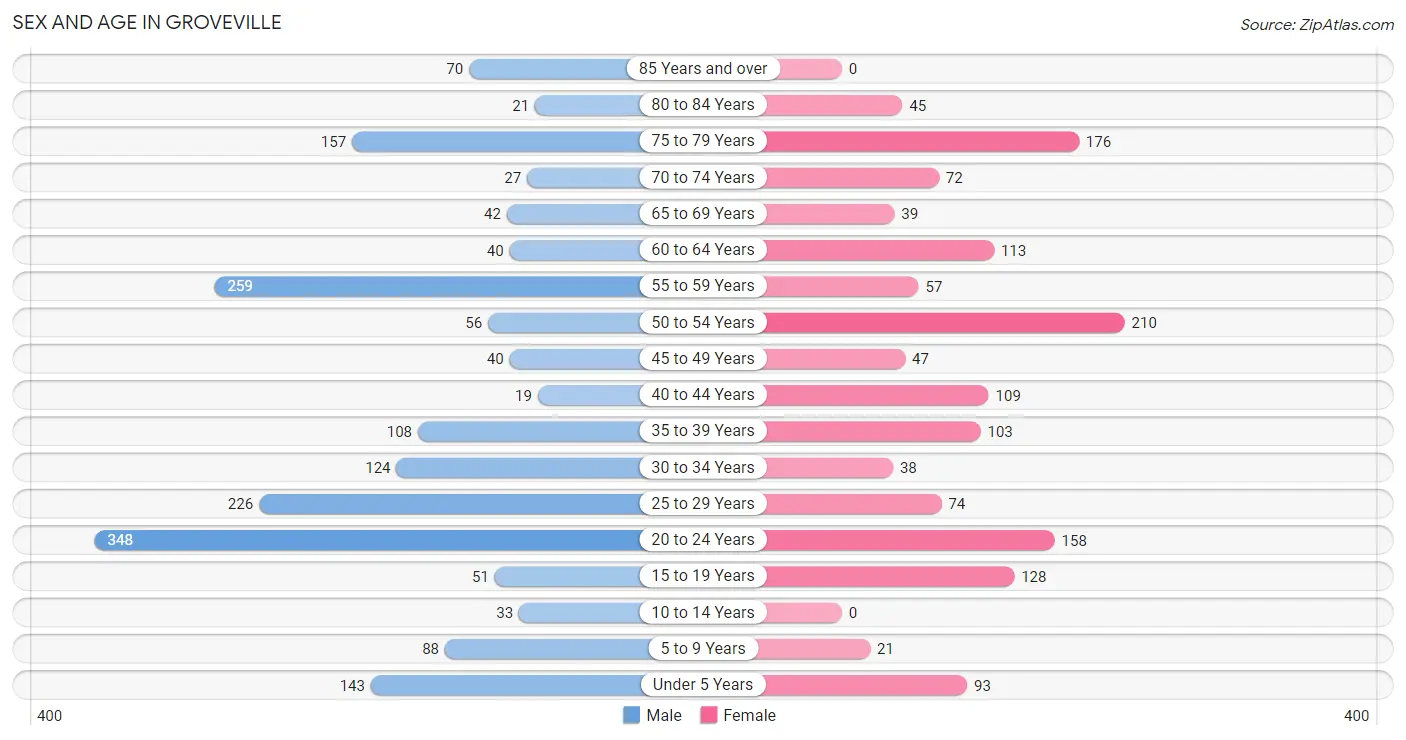
| Age Bracket | Male | Female |
| Under 5 Years | 143 (7.7%) | 93 (6.3%) |
| 5 to 9 Years | 88 (4.8%) | 21 (1.4%) |
| 10 to 14 Years | 33 (1.8%) | 0 (0.0%) |
| 15 to 19 Years | 51 (2.8%) | 128 (8.6%) |
| 20 to 24 Years | 348 (18.8%) | 158 (10.6%) |
| 25 to 29 Years | 226 (12.2%) | 74 (5.0%) |
| 30 to 34 Years | 124 (6.7%) | 38 (2.6%) |
| 35 to 39 Years | 108 (5.8%) | 103 (7.0%) |
| 40 to 44 Years | 19 (1.0%) | 109 (7.3%) |
| 45 to 49 Years | 40 (2.2%) | 47 (3.2%) |
| 50 to 54 Years | 56 (3.0%) | 210 (14.2%) |
| 55 to 59 Years | 259 (14.0%) | 57 (3.8%) |
| 60 to 64 Years | 40 (2.2%) | 113 (7.6%) |
| 65 to 69 Years | 42 (2.3%) | 39 (2.6%) |
| 70 to 74 Years | 27 (1.5%) | 72 (4.9%) |
| 75 to 79 Years | 157 (8.5%) | 176 (11.9%) |
| 80 to 84 Years | 21 (1.1%) | 45 (3.0%) |
| 85 Years and over | 70 (3.8%) | 0 (0.0%) |
| Total | 1,852 (100.0%) | 1,483 (100.0%) |
Families and Households in Groveville
Median Family Size in Groveville
The median family size in Groveville is 3.85 persons per family, with married-couple families (495 | 64.4%) accounting for the largest median family size of 4.47 persons per family. On the other hand, single female/mother families (188 | 24.4%) represent the smallest median family size with 2.61 persons per family.
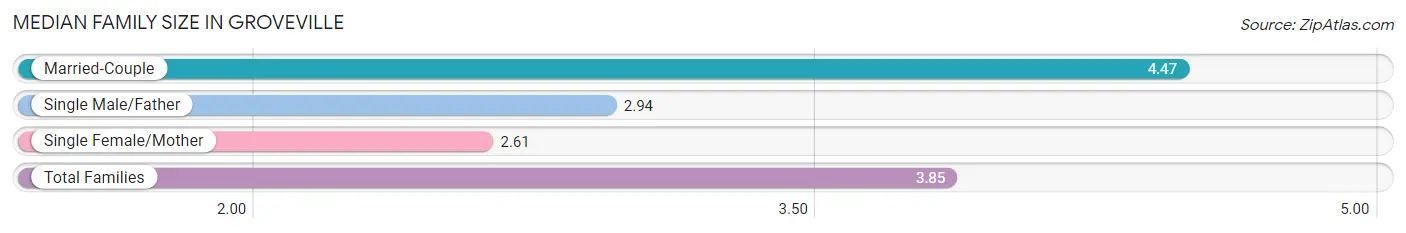
| Family Type | # Families | Family Size |
| Married-Couple | 495 (64.4%) | 4.47 |
| Single Male/Father | 86 (11.2%) | 2.94 |
| Single Female/Mother | 188 (24.4%) | 2.61 |
| Total Families | 769 (100.0%) | 3.85 |
Median Household Size in Groveville
The median household size in Groveville is 3.30 persons per household, with married-couple households (495 | 49.1%) accounting for the largest median household size of 4.47 persons per household. non-family households (240 | 23.8%) represent the smallest median household size with 1.21 persons per household.
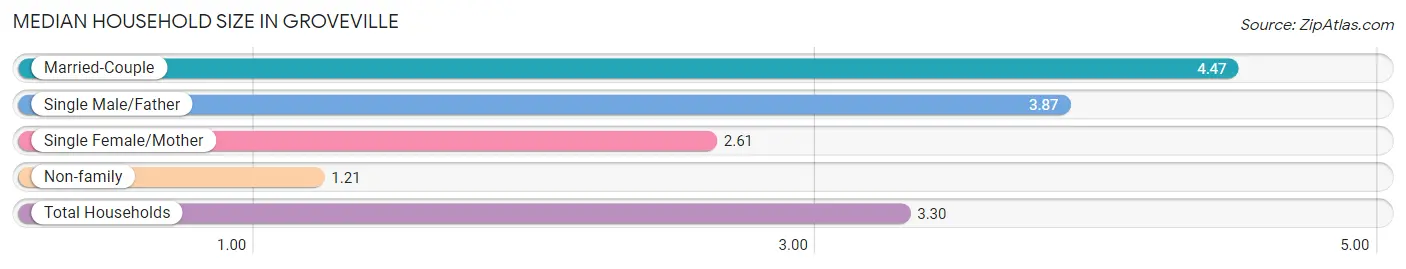
| Household Type | # Households | Household Size |
| Married-Couple | 495 (49.1%) | 4.47 |
| Single Male/Father | 86 (8.5%) | 3.87 |
| Single Female/Mother | 188 (18.6%) | 2.61 |
| Non-family | 240 (23.8%) | 1.21 |
| Total Households | 1,009 (100.0%) | 3.30 |
Household Size by Marriage Status in Groveville
Out of a total of 1,009 households in Groveville, 769 (76.2%) are family households, while 240 (23.8%) are nonfamily households. The most numerous type of family households are 2-person households, comprising 290, and the most common type of nonfamily households are 1-person households, comprising 192.
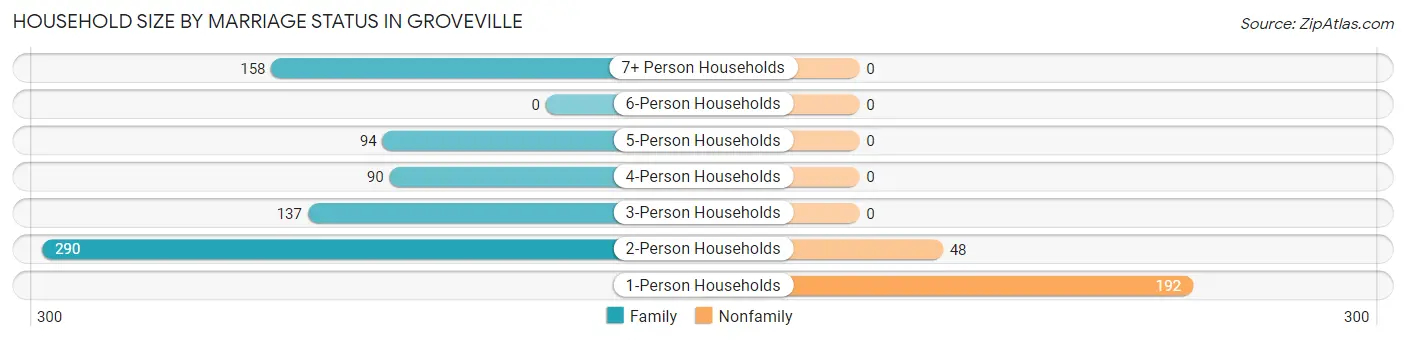
| Household Size | Family Households | Nonfamily Households |
| 1-Person Households | - | 192 (19.0%) |
| 2-Person Households | 290 (28.7%) | 48 (4.8%) |
| 3-Person Households | 137 (13.6%) | 0 (0.0%) |
| 4-Person Households | 90 (8.9%) | 0 (0.0%) |
| 5-Person Households | 94 (9.3%) | 0 (0.0%) |
| 6-Person Households | 0 (0.0%) | 0 (0.0%) |
| 7+ Person Households | 158 (15.7%) | 0 (0.0%) |
| Total | 769 (76.2%) | 240 (23.8%) |
Female Fertility in Groveville
Fertility by Age in Groveville
Average fertility rate in Groveville is 147.0 births per 1,000 women. Women in the age bracket of 20 to 34 years have the highest fertility rate with 300.0 births per 1,000 women. Women in the age bracket of 20 to 34 years acount for 82.7% of all women with births.
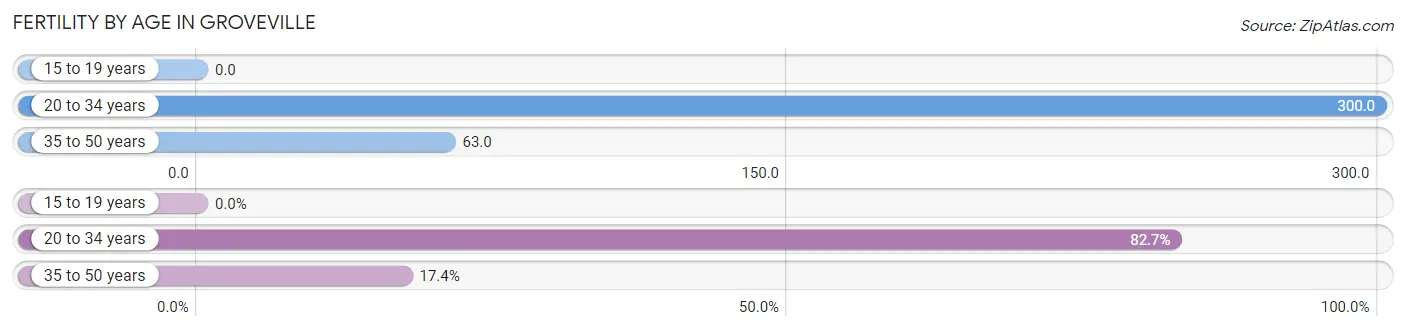
| Age Bracket | Women with Births | Births / 1,000 Women |
| 15 to 19 years | 0 (0.0%) | 0.0 |
| 20 to 34 years | 81 (82.7%) | 300.0 |
| 35 to 50 years | 17 (17.3%) | 63.0 |
| Total | 98 (100.0%) | 147.0 |
Fertility by Age by Marriage Status in Groveville
10.2% of women with births (98) in Groveville are married. The highest percentage of unmarried women with births falls into 35 to 50 years age bracket with 100.0% of them unmarried at the time of birth, while the lowest percentage of unmarried women with births belong to 20 to 34 years age bracket with 87.7% of them unmarried.
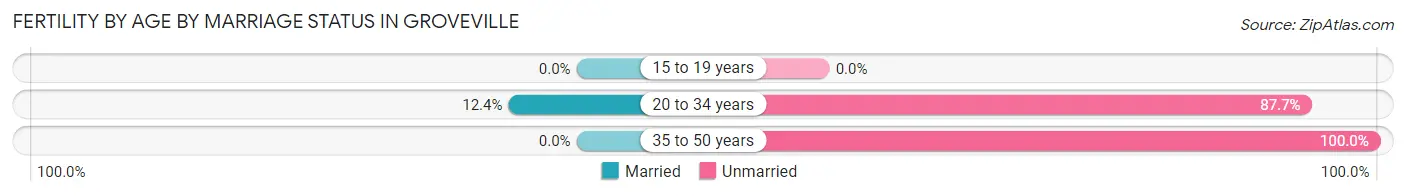
| Age Bracket | Married | Unmarried |
| 15 to 19 years | 0 (0.0%) | 0 (0.0%) |
| 20 to 34 years | 10 (12.3%) | 71 (87.6%) |
| 35 to 50 years | 0 (0.0%) | 17 (100.0%) |
| Total | 10 (10.2%) | 88 (89.8%) |
Fertility by Education in Groveville
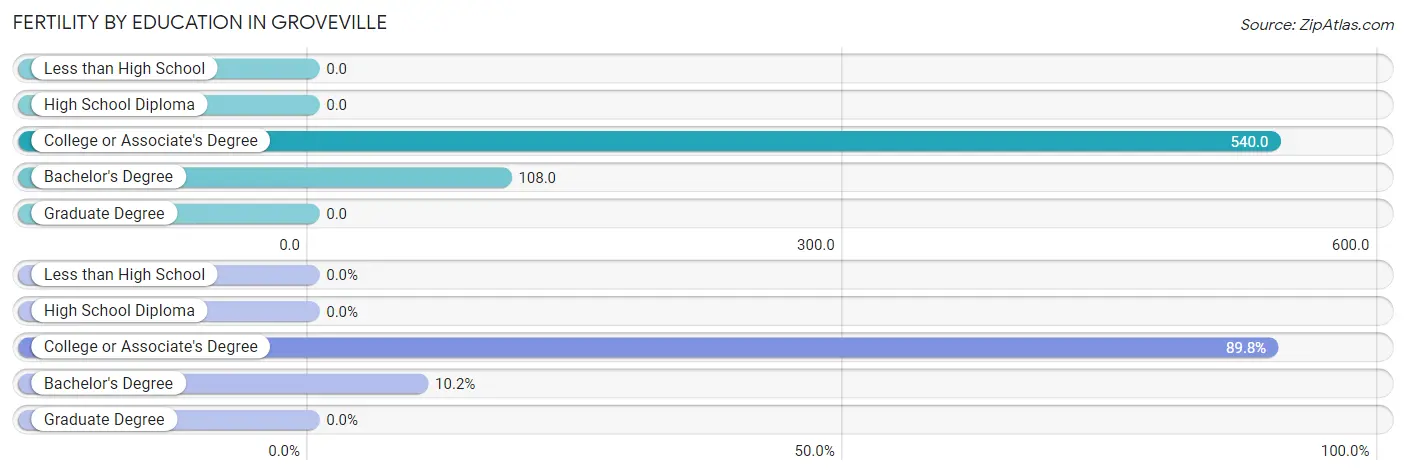
| Educational Attainment | Women with Births | Births / 1,000 Women |
| Less than High School | 0 (0.0%) | 0.0 |
| High School Diploma | 0 (0.0%) | 0.0 |
| College or Associate's Degree | 88 (89.8%) | 540.0 |
| Bachelor's Degree | 10 (10.2%) | 108.0 |
| Graduate Degree | 0 (0.0%) | 0.0 |
| Total | 98 (100.0%) | 147.0 |
Fertility by Education by Marriage Status in Groveville
89.8% of women with births in Groveville are unmarried. Women with the educational attainment of bachelor's degree are most likely to be married with 100.0% of them married at childbirth, while women with the educational attainment of college or associate's degree are least likely to be married with 100.0% of them unmarried at childbirth.
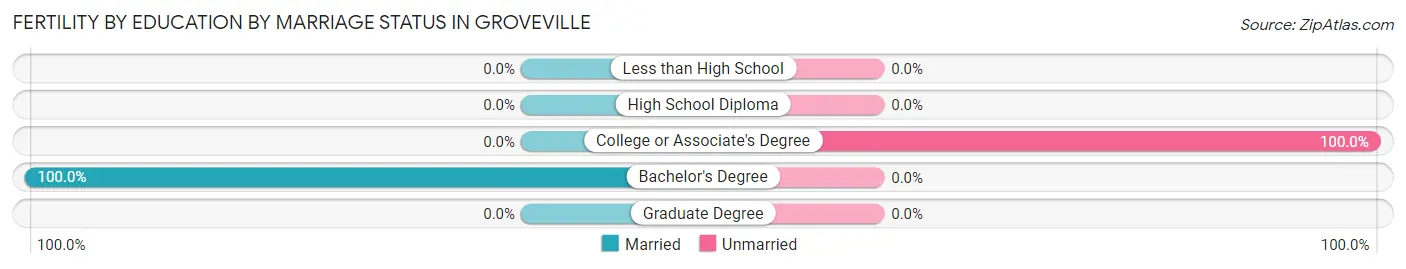
| Educational Attainment | Married | Unmarried |
| Less than High School | 0 (0.0%) | 0 (0.0%) |
| High School Diploma | 0 (0.0%) | 0 (0.0%) |
| College or Associate's Degree | 0 (0.0%) | 88 (100.0%) |
| Bachelor's Degree | 10 (100.0%) | 0 (0.0%) |
| Graduate Degree | 0 (0.0%) | 0 (0.0%) |
| Total | 10 (10.2%) | 88 (89.8%) |
Income in Groveville
Income Overview in Groveville
Per Capita Income in Groveville is $37,762, while median incomes of families and households are $137,446 and $117,617 respectively.
| Characteristic | Number | Measure |
| Per Capita Income | 3,335 | $37,762 |
| Median Family Income | 769 | $137,446 |
| Mean Family Income | 769 | $132,157 |
| Median Household Income | 1,009 | $117,617 |
| Mean Household Income | 1,009 | $118,146 |
| Income Deficit | 769 | $0 |
| Wage / Income Gap (%) | 3,335 | 28.31% |
| Wage / Income Gap ($) | 3,335 | 71.69¢ per $1 |
| Gini / Inequality Index | 3,335 | 0.40 |
Earnings by Sex in Groveville
Average Earnings in Groveville are $51,038, $51,967 for men and $37,256 for women, a difference of 28.3%.
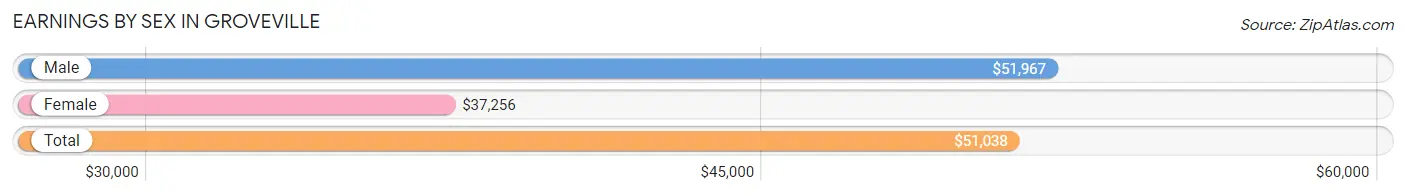
| Sex | Number | Average Earnings |
| Male | 1,160 (57.6%) | $51,967 |
| Female | 855 (42.4%) | $37,256 |
| Total | 2,015 (100.0%) | $51,038 |
Earnings by Sex by Income Bracket in Groveville
The most common earnings brackets in Groveville are $55,000 to $64,999 for men (330 | 28.4%) and $35,000 to $39,999 for women (189 | 22.1%).
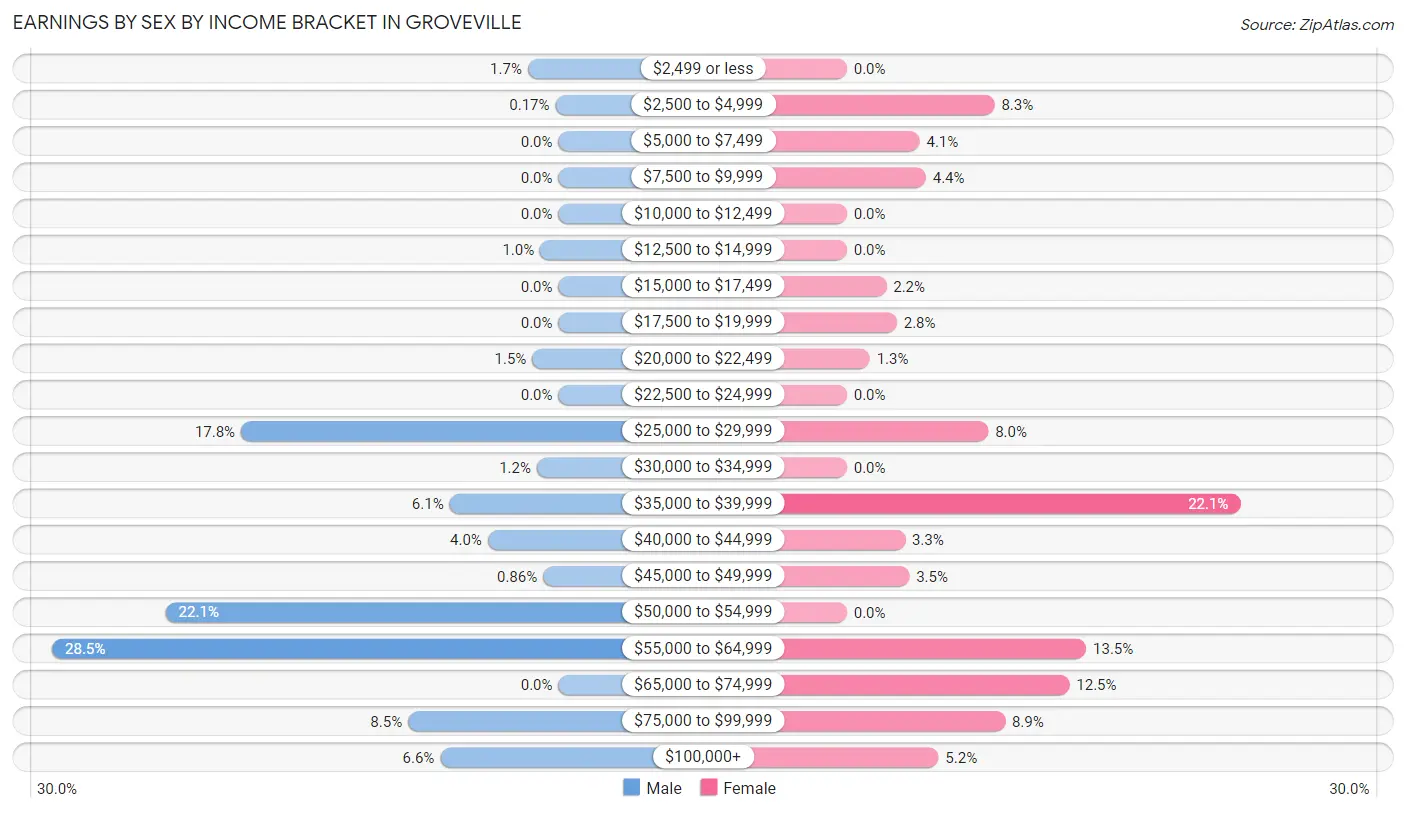
| Income | Male | Female |
| $2,499 or less | 20 (1.7%) | 0 (0.0%) |
| $2,500 to $4,999 | 2 (0.2%) | 71 (8.3%) |
| $5,000 to $7,499 | 0 (0.0%) | 35 (4.1%) |
| $7,500 to $9,999 | 0 (0.0%) | 38 (4.4%) |
| $10,000 to $12,499 | 0 (0.0%) | 0 (0.0%) |
| $12,500 to $14,999 | 12 (1.0%) | 0 (0.0%) |
| $15,000 to $17,499 | 0 (0.0%) | 19 (2.2%) |
| $17,500 to $19,999 | 0 (0.0%) | 24 (2.8%) |
| $20,000 to $22,499 | 17 (1.5%) | 11 (1.3%) |
| $22,500 to $24,999 | 0 (0.0%) | 0 (0.0%) |
| $25,000 to $29,999 | 207 (17.8%) | 68 (8.0%) |
| $30,000 to $34,999 | 14 (1.2%) | 0 (0.0%) |
| $35,000 to $39,999 | 71 (6.1%) | 189 (22.1%) |
| $40,000 to $44,999 | 46 (4.0%) | 28 (3.3%) |
| $45,000 to $49,999 | 10 (0.9%) | 30 (3.5%) |
| $50,000 to $54,999 | 256 (22.1%) | 0 (0.0%) |
| $55,000 to $64,999 | 330 (28.4%) | 115 (13.5%) |
| $65,000 to $74,999 | 0 (0.0%) | 107 (12.5%) |
| $75,000 to $99,999 | 98 (8.5%) | 76 (8.9%) |
| $100,000+ | 77 (6.6%) | 44 (5.1%) |
| Total | 1,160 (100.0%) | 855 (100.0%) |
Earnings by Sex by Educational Attainment in Groveville
Average earnings in Groveville are $50,841 for men and $37,311 for women, a difference of 26.6%. Men with an educational attainment of graduate degree enjoy the highest average annual earnings of $102,222, while those with high school diploma education earn the least with $49,375. Women with an educational attainment of graduate degree earn the most with the average annual earnings of $118,403, while those with college or associate's degree education have the smallest earnings of $36,138.
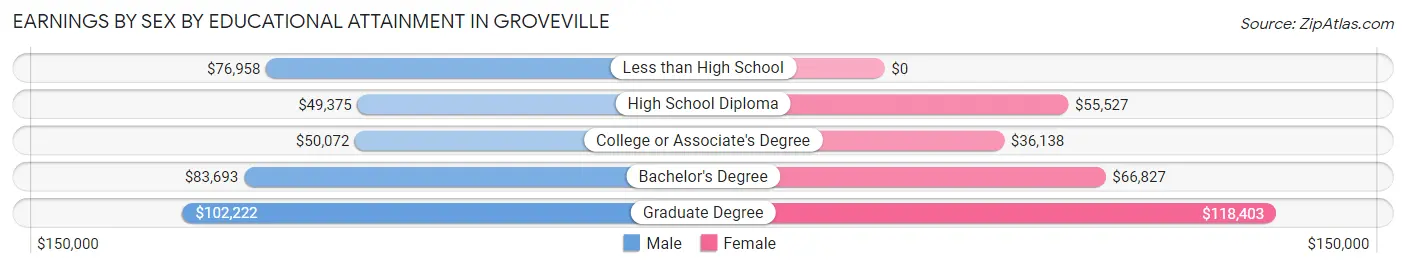
| Educational Attainment | Male Income | Female Income |
| Less than High School | $76,958 | $0 |
| High School Diploma | $49,375 | $55,527 |
| College or Associate's Degree | $50,072 | $36,138 |
| Bachelor's Degree | $83,693 | $66,827 |
| Graduate Degree | $102,222 | $118,403 |
| Total | $50,841 | $37,311 |
Family Income in Groveville
Family Income Brackets in Groveville
According to the Groveville family income data, there are 224 families falling into the $200,000+ income range, which is the most common income bracket and makes up 29.1% of all families.
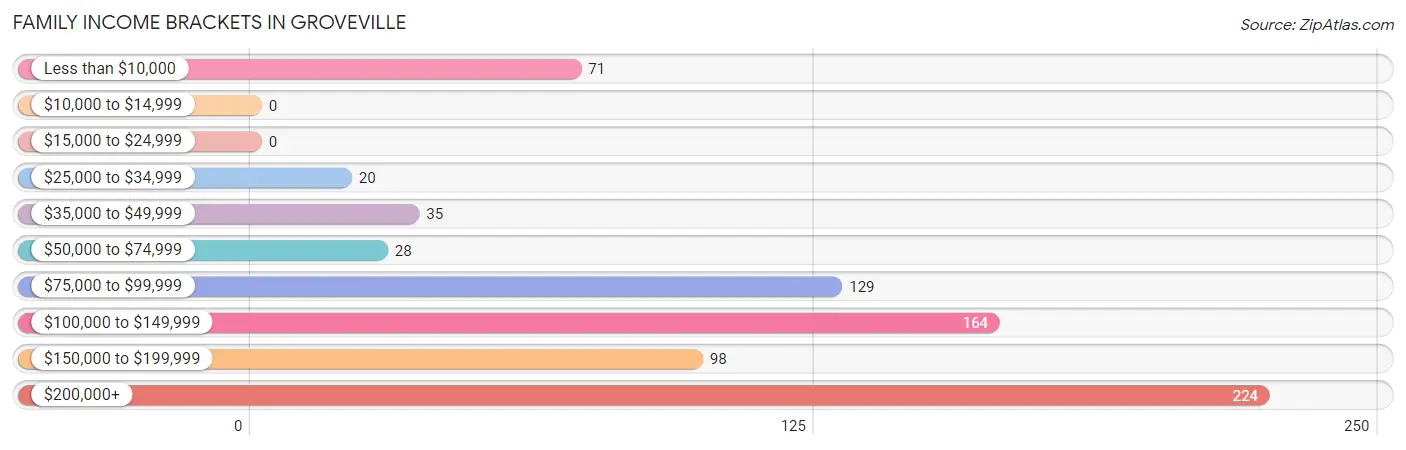
| Income Bracket | # Families | % Families |
| Less than $10,000 | 71 | 9.2% |
| $10,000 to $14,999 | 0 | 0.0% |
| $15,000 to $24,999 | 0 | 0.0% |
| $25,000 to $34,999 | 20 | 2.6% |
| $35,000 to $49,999 | 35 | 4.6% |
| $50,000 to $74,999 | 28 | 3.6% |
| $75,000 to $99,999 | 129 | 16.8% |
| $100,000 to $149,999 | 164 | 21.3% |
| $150,000 to $199,999 | 98 | 12.7% |
| $200,000+ | 224 | 29.1% |
Family Income by Famaliy Size in Groveville
4-person families (146 | 19.0%) account for the highest median family income in Groveville with $163,795 per family, while 3-person families (107 | 13.9%) have the highest median income of $46,213 per family member.
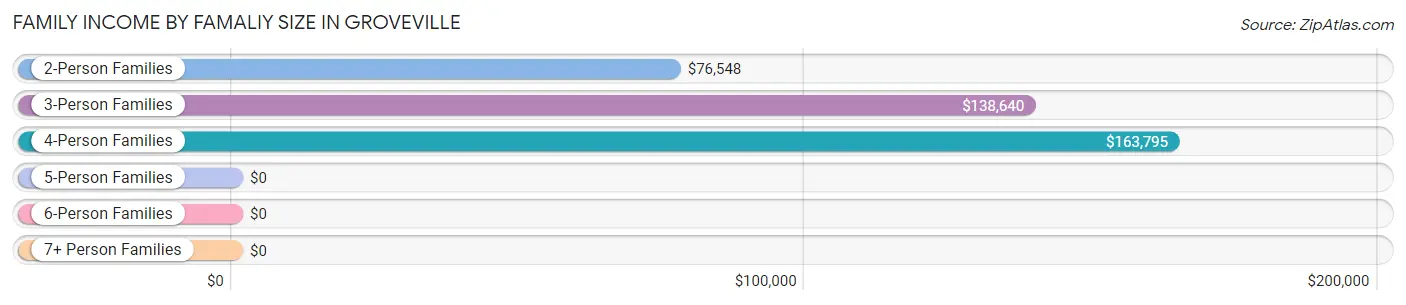
| Income Bracket | # Families | Median Income |
| 2-Person Families | 320 (41.6%) | $76,548 |
| 3-Person Families | 107 (13.9%) | $138,640 |
| 4-Person Families | 146 (19.0%) | $163,795 |
| 5-Person Families | 38 (4.9%) | $0 |
| 6-Person Families | 0 (0.0%) | $0 |
| 7+ Person Families | 158 (20.5%) | $0 |
| Total | 769 (100.0%) | $137,446 |
Family Income by Number of Earners in Groveville
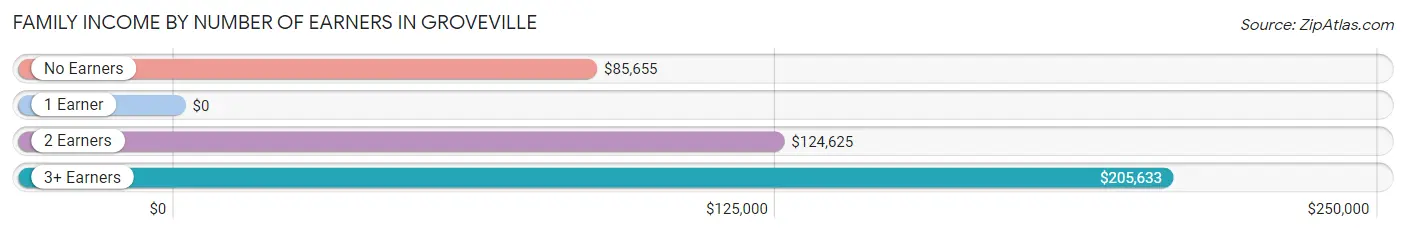
| Number of Earners | # Families | Median Income |
| No Earners | 91 (11.8%) | $85,655 |
| 1 Earner | 173 (22.5%) | $0 |
| 2 Earners | 211 (27.4%) | $124,625 |
| 3+ Earners | 294 (38.2%) | $205,633 |
| Total | 769 (100.0%) | $137,446 |
Household Income in Groveville
Household Income Brackets in Groveville
With 310 households falling in the category, the $200,000+ income range is the most frequent in Groveville, accounting for 30.7% of all households.
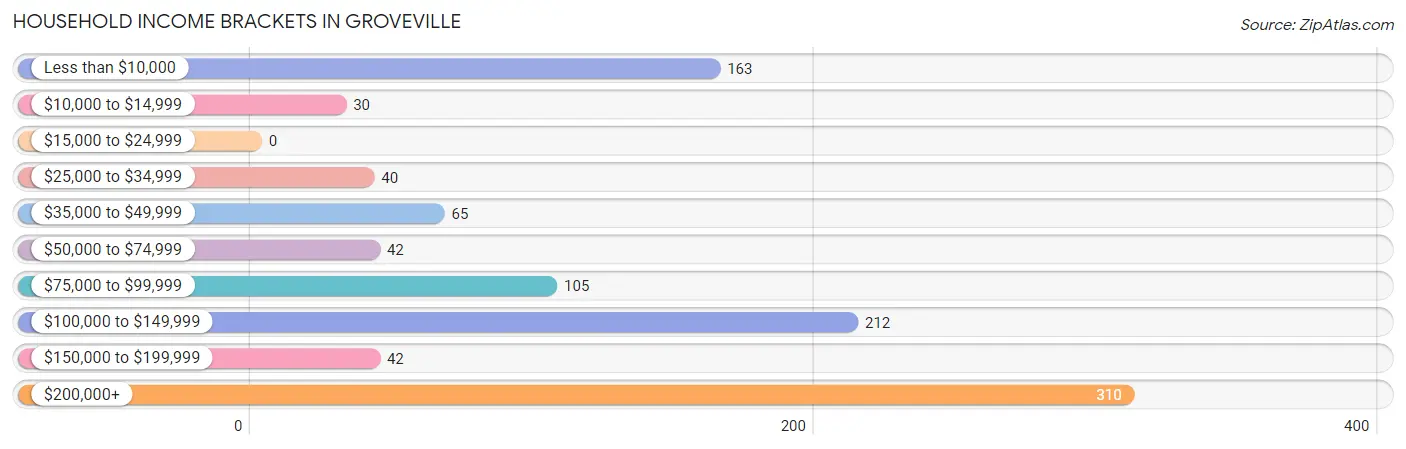
| Income Bracket | # Households | % Households |
| Less than $10,000 | 163 | 16.2% |
| $10,000 to $14,999 | 30 | 3.0% |
| $15,000 to $24,999 | 0 | 0.0% |
| $25,000 to $34,999 | 40 | 4.0% |
| $35,000 to $49,999 | 65 | 6.4% |
| $50,000 to $74,999 | 42 | 4.2% |
| $75,000 to $99,999 | 105 | 10.4% |
| $100,000 to $149,999 | 212 | 21.0% |
| $150,000 to $199,999 | 42 | 4.2% |
| $200,000+ | 310 | 30.7% |
Household Income by Householder Age in Groveville
The median household income in Groveville is $117,617, with the highest median household income of $118,750 found in the 25 to 44 years age bracket for the primary householder. A total of 250 households (24.8%) fall into this category. Meanwhile, the 15 to 24 years age bracket for the primary householder has the lowest median household income of $0, with 127 households (12.6%) in this group.
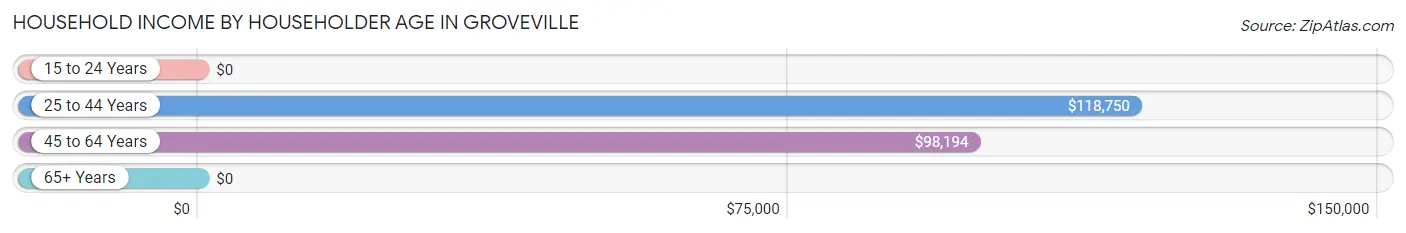
| Income Bracket | # Households | Median Income |
| 15 to 24 Years | 127 (12.6%) | $0 |
| 25 to 44 Years | 250 (24.8%) | $118,750 |
| 45 to 64 Years | 232 (23.0%) | $98,194 |
| 65+ Years | 400 (39.6%) | $0 |
| Total | 1,009 (100.0%) | $117,617 |
Poverty in Groveville
Income Below Poverty by Sex and Age in Groveville
With 10.2% poverty level for males and 13.0% for females among the residents of Groveville, under 5 year old males and 65 to 74 year old females are the most vulnerable to poverty, with 83 males (58.0%) and 66 females (59.5%) in their respective age groups living below the poverty level.
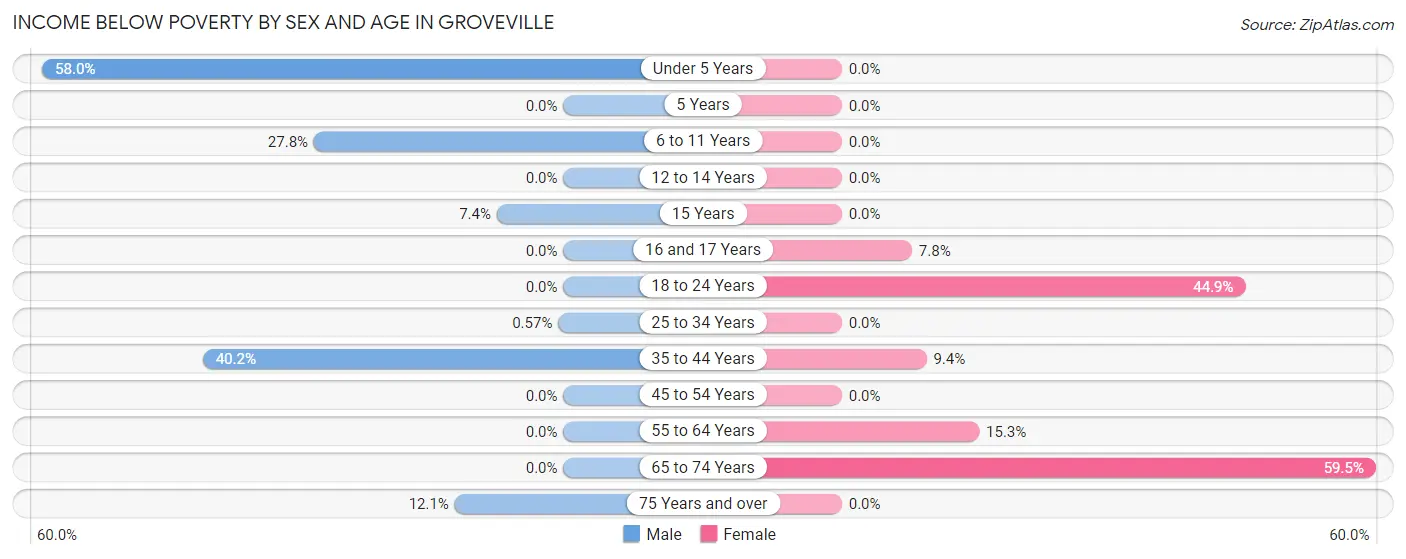
| Age Bracket | Male | Female |
| Under 5 Years | 83 (58.0%) | 0 (0.0%) |
| 5 Years | 0 (0.0%) | 0 (0.0%) |
| 6 to 11 Years | 20 (27.8%) | 0 (0.0%) |
| 12 to 14 Years | 0 (0.0%) | 0 (0.0%) |
| 15 Years | 2 (7.4%) | 0 (0.0%) |
| 16 and 17 Years | 0 (0.0%) | 10 (7.8%) |
| 18 to 24 Years | 0 (0.0%) | 71 (44.9%) |
| 25 to 34 Years | 2 (0.6%) | 0 (0.0%) |
| 35 to 44 Years | 51 (40.2%) | 20 (9.4%) |
| 45 to 54 Years | 0 (0.0%) | 0 (0.0%) |
| 55 to 64 Years | 0 (0.0%) | 26 (15.3%) |
| 65 to 74 Years | 0 (0.0%) | 66 (59.5%) |
| 75 Years and over | 30 (12.1%) | 0 (0.0%) |
| Total | 188 (10.2%) | 193 (13.0%) |
Income Above Poverty by Sex and Age in Groveville
According to the poverty statistics in Groveville, males aged 5 years and females aged under 5 years are the age groups that are most secure financially, with 100.0% of males and 100.0% of females in these age groups living above the poverty line.
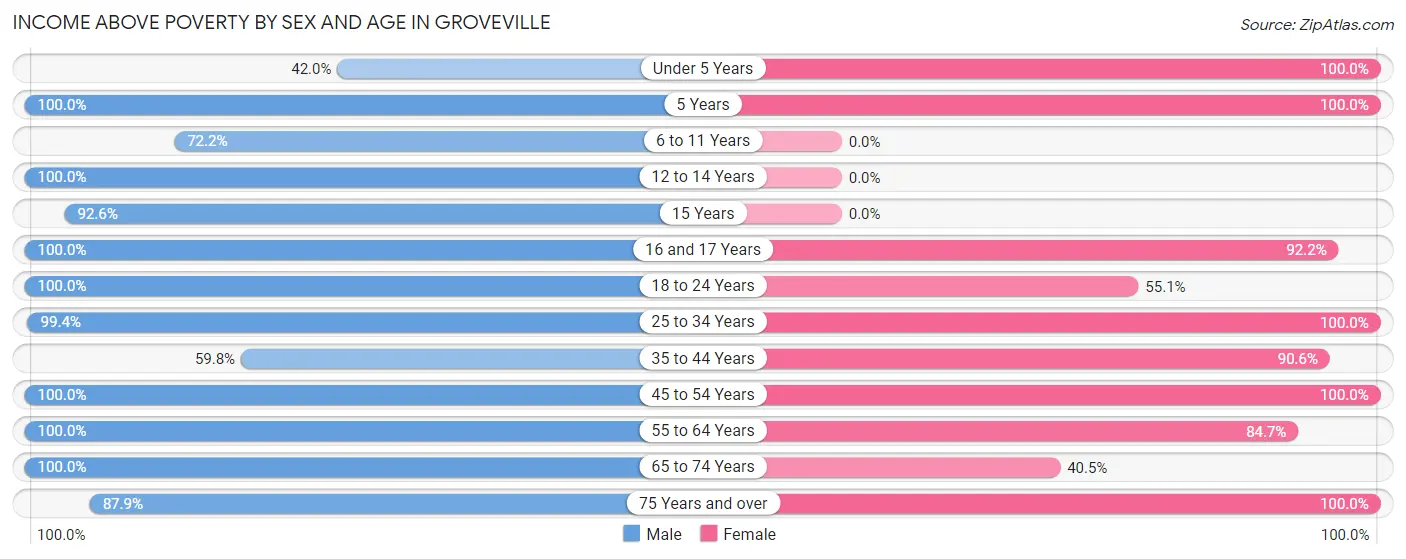
| Age Bracket | Male | Female |
| Under 5 Years | 60 (42.0%) | 93 (100.0%) |
| 5 Years | 16 (100.0%) | 21 (100.0%) |
| 6 to 11 Years | 52 (72.2%) | 0 (0.0%) |
| 12 to 14 Years | 32 (100.0%) | 0 (0.0%) |
| 15 Years | 25 (92.6%) | 0 (0.0%) |
| 16 and 17 Years | 12 (100.0%) | 118 (92.2%) |
| 18 to 24 Years | 360 (100.0%) | 87 (55.1%) |
| 25 to 34 Years | 348 (99.4%) | 112 (100.0%) |
| 35 to 44 Years | 76 (59.8%) | 192 (90.6%) |
| 45 to 54 Years | 96 (100.0%) | 257 (100.0%) |
| 55 to 64 Years | 299 (100.0%) | 144 (84.7%) |
| 65 to 74 Years | 69 (100.0%) | 45 (40.5%) |
| 75 Years and over | 218 (87.9%) | 221 (100.0%) |
| Total | 1,663 (89.8%) | 1,290 (87.0%) |
Income Below Poverty Among Married-Couple Families in Groveville
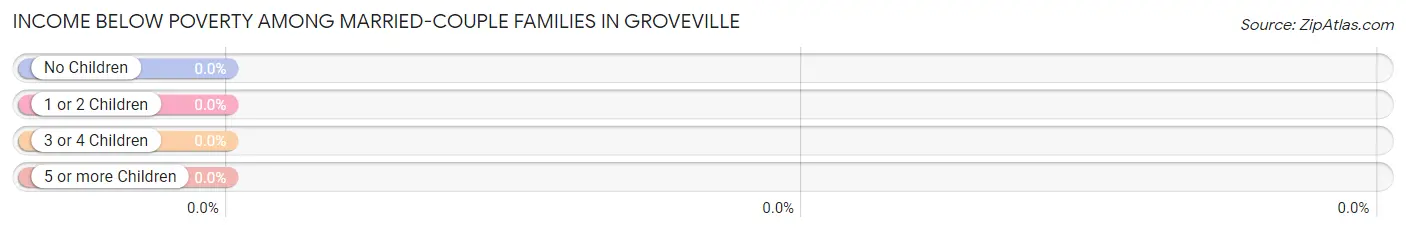
| Children | Above Poverty | Below Poverty |
| No Children | 231 (100.0%) | 0 (0.0%) |
| 1 or 2 Children | 241 (100.0%) | 0 (0.0%) |
| 3 or 4 Children | 23 (100.0%) | 0 (0.0%) |
| 5 or more Children | 0 (0.0%) | 0 (0.0%) |
| Total | 495 (100.0%) | 0 (0.0%) |
Income Below Poverty Among Single-Parent Households in Groveville
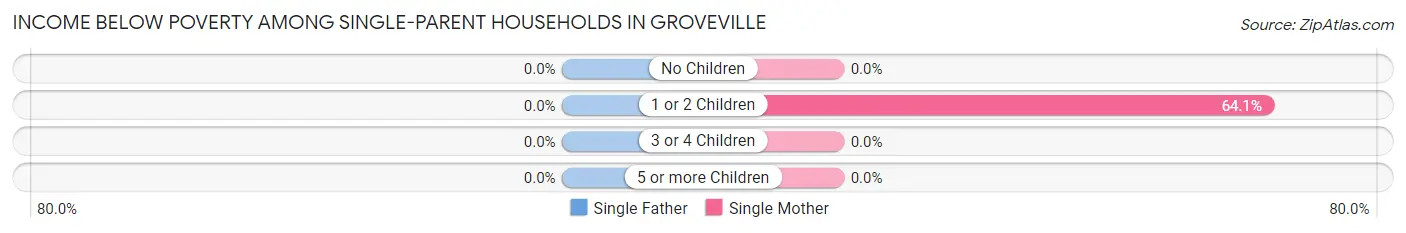
| Children | Single Father | Single Mother |
| No Children | 0 (0.0%) | 0 (0.0%) |
| 1 or 2 Children | 0 (0.0%) | 91 (64.1%) |
| 3 or 4 Children | 0 (0.0%) | 0 (0.0%) |
| 5 or more Children | 0 (0.0%) | 0 (0.0%) |
| Total | 0 (0.0%) | 91 (48.4%) |
Income Below Poverty Among Married-Couple vs Single-Parent Households in Groveville
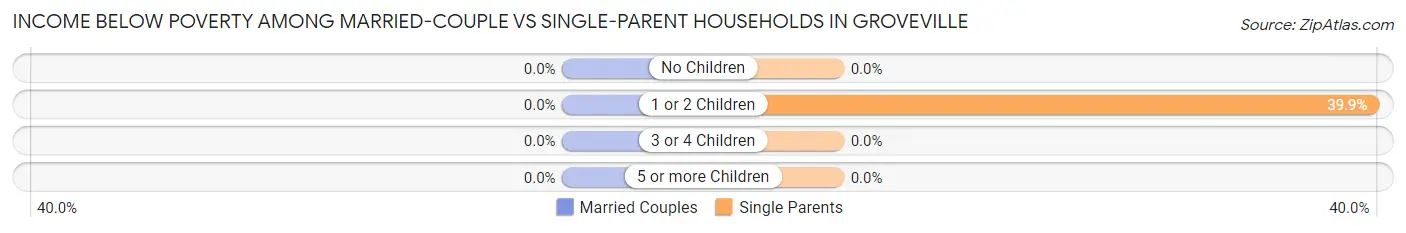
| Children | Married-Couple Families | Single-Parent Households |
| No Children | 0 (0.0%) | 0 (0.0%) |
| 1 or 2 Children | 0 (0.0%) | 91 (39.9%) |
| 3 or 4 Children | 0 (0.0%) | 0 (0.0%) |
| 5 or more Children | 0 (0.0%) | 0 (0.0%) |
| Total | 0 (0.0%) | 91 (33.2%) |
Employment Characteristics in Groveville
Employment by Class of Employer in Groveville
Among the 1,637 employed individuals in Groveville, private company employees (1,044 | 63.8%), not-for-profit organizations (245 | 15.0%), and state government employees (130 | 7.9%) make up the most common classes of employment.
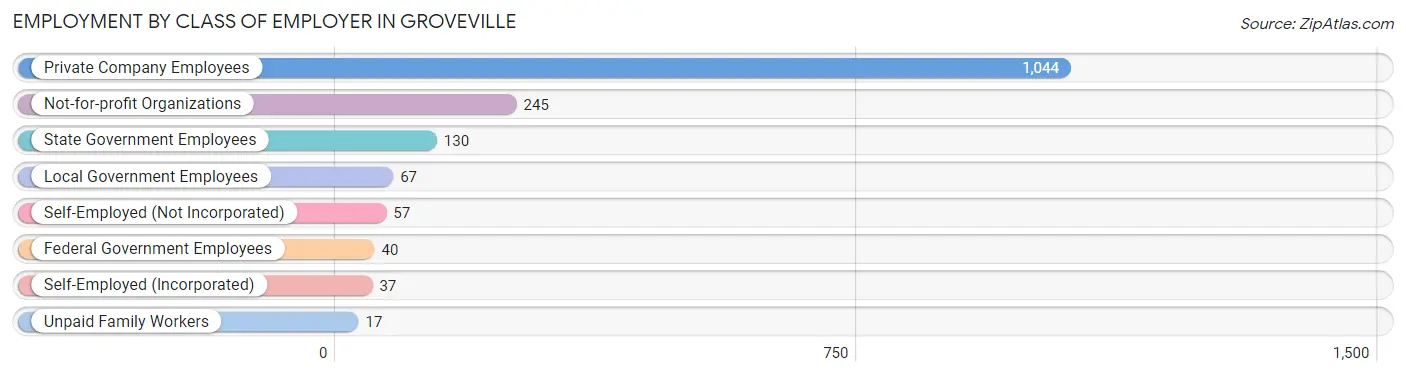
| Employer Class | # Employees | % Employees |
| Private Company Employees | 1,044 | 63.8% |
| Self-Employed (Incorporated) | 37 | 2.3% |
| Self-Employed (Not Incorporated) | 57 | 3.5% |
| Not-for-profit Organizations | 245 | 15.0% |
| Local Government Employees | 67 | 4.1% |
| State Government Employees | 130 | 7.9% |
| Federal Government Employees | 40 | 2.4% |
| Unpaid Family Workers | 17 | 1.0% |
| Total | 1,637 | 100.0% |
Employment Status by Age in Groveville
According to the labor force statistics for Groveville, out of the total population over 16 years of age (2,930), 64.6% or 1,893 individuals are in the labor force, with 11.9% or 225 of them unemployed. The age group with the highest labor force participation rate is 30 to 34 years, with 100.0% or 162 individuals in the labor force. Within the labor force, the 45 to 54 years age range has the highest percentage of unemployed individuals, with 58.3% or 179 of them being unemployed.
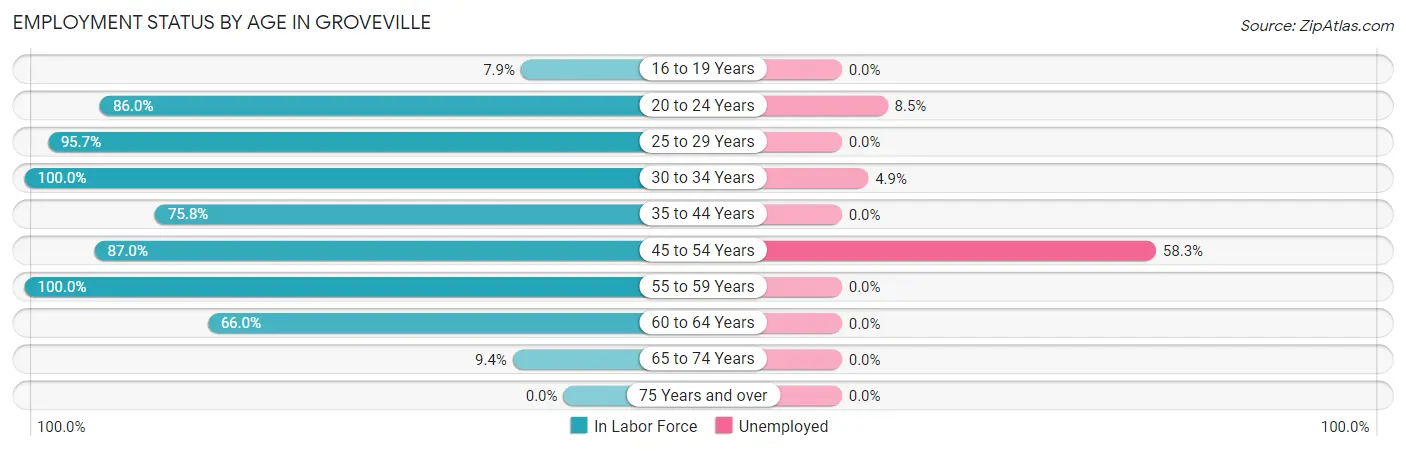
| Age Bracket | In Labor Force | Unemployed |
| 16 to 19 Years | 12 (7.9%) | 0 (0.0%) |
| 20 to 24 Years | 435 (86.0%) | 37 (8.5%) |
| 25 to 29 Years | 287 (95.7%) | 0 (0.0%) |
| 30 to 34 Years | 162 (100.0%) | 8 (4.9%) |
| 35 to 44 Years | 257 (75.8%) | 0 (0.0%) |
| 45 to 54 Years | 307 (87.0%) | 179 (58.3%) |
| 55 to 59 Years | 316 (100.0%) | 0 (0.0%) |
| 60 to 64 Years | 101 (66.0%) | 0 (0.0%) |
| 65 to 74 Years | 17 (9.4%) | 0 (0.0%) |
| 75 Years and over | 0 (0.0%) | 0 (0.0%) |
| Total | 1,893 (64.6%) | 225 (11.9%) |
Employment Status by Educational Attainment in Groveville
According to labor force statistics for Groveville, 88.1% of individuals (1,430) out of the total population between 25 and 64 years of age (1,623) are in the labor force, with 13.2% or 189 of them being unemployed. The group with the highest labor force participation rate are those with the educational attainment of college / associate degree, with 95.6% or 735 individuals in the labor force. Within the labor force, individuals with college / associate degree education have the highest percentage of unemployment, with 24.9% or 183 of them being unemployed.
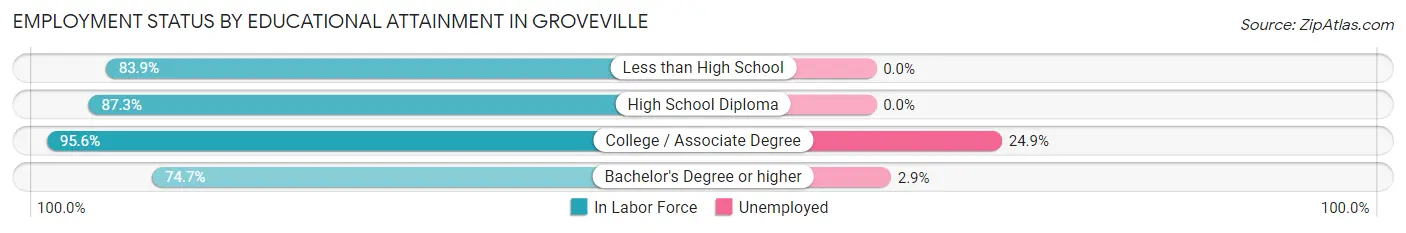
| Educational Attainment | In Labor Force | Unemployed |
| Less than High School | 104 (83.9%) | 0 (0.0%) |
| High School Diploma | 317 (87.3%) | 0 (0.0%) |
| College / Associate Degree | 735 (95.6%) | 191 (24.9%) |
| Bachelor's Degree or higher | 274 (74.7%) | 11 (2.9%) |
| Total | 1,430 (88.1%) | 214 (13.2%) |
Employment Occupations by Sex in Groveville
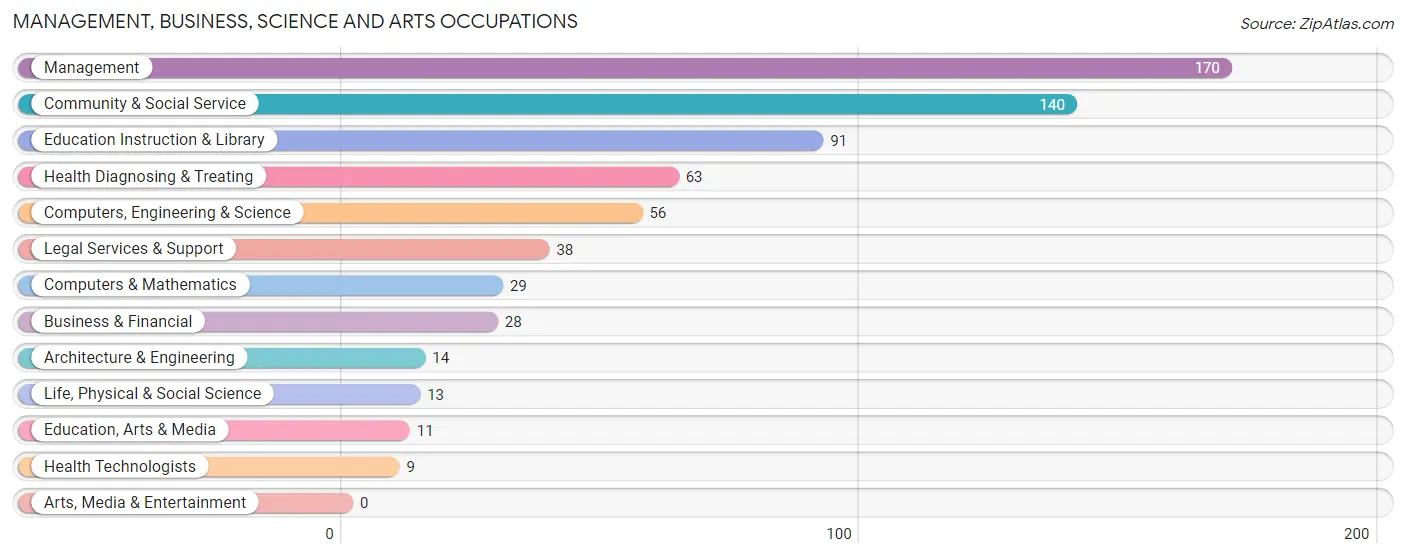
Management, Business, Science and Arts Occupations
The most common Management, Business, Science and Arts occupations in Groveville are Management (170 | 10.3%), Community & Social Service (140 | 8.5%), Education Instruction & Library (91 | 5.5%), Health Diagnosing & Treating (63 | 3.8%), and Computers, Engineering & Science (56 | 3.4%).
Management, Business, Science and Arts Occupations by Sex
Within the Management, Business, Science and Arts occupations in Groveville, the most male-oriented occupations are Architecture & Engineering (100.0%), Education, Arts & Media (100.0%), and Health Technologists (100.0%), while the most female-oriented occupations are Life, Physical & Social Science (100.0%), Legal Services & Support (100.0%), and Health Diagnosing & Treating (85.7%).
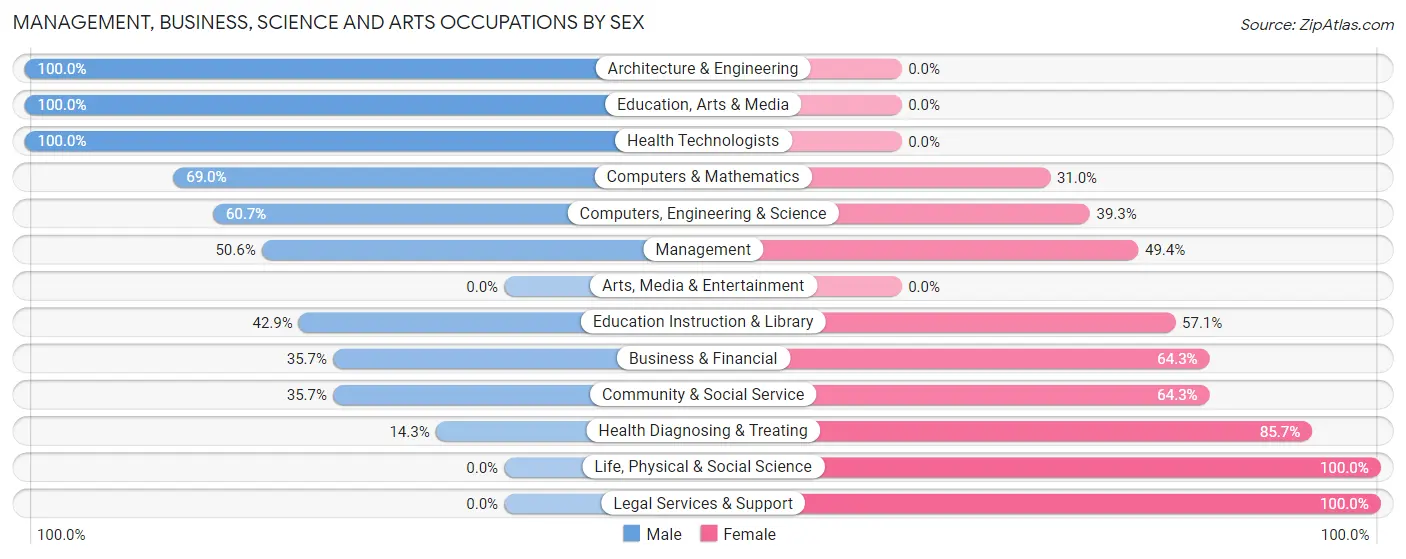
| Occupation | Male | Female |
| Management | 86 (50.6%) | 84 (49.4%) |
| Business & Financial | 10 (35.7%) | 18 (64.3%) |
| Computers, Engineering & Science | 34 (60.7%) | 22 (39.3%) |
| Computers & Mathematics | 20 (69.0%) | 9 (31.0%) |
| Architecture & Engineering | 14 (100.0%) | 0 (0.0%) |
| Life, Physical & Social Science | 0 (0.0%) | 13 (100.0%) |
| Community & Social Service | 50 (35.7%) | 90 (64.3%) |
| Education, Arts & Media | 11 (100.0%) | 0 (0.0%) |
| Legal Services & Support | 0 (0.0%) | 38 (100.0%) |
| Education Instruction & Library | 39 (42.9%) | 52 (57.1%) |
| Arts, Media & Entertainment | 0 (0.0%) | 0 (0.0%) |
| Health Diagnosing & Treating | 9 (14.3%) | 54 (85.7%) |
| Health Technologists | 9 (100.0%) | 0 (0.0%) |
| Total (Category) | 189 (41.4%) | 268 (58.6%) |
| Total (Overall) | 1,132 (68.5%) | 521 (31.5%) |
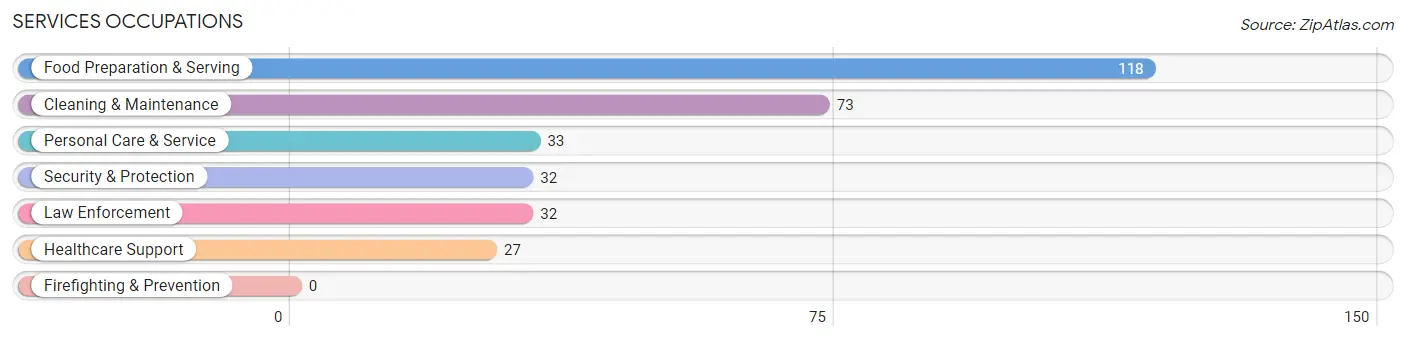
Services Occupations
The most common Services occupations in Groveville are Food Preparation & Serving (118 | 7.1%), Cleaning & Maintenance (73 | 4.4%), Personal Care & Service (33 | 2.0%), Security & Protection (32 | 1.9%), and Law Enforcement (32 | 1.9%).
Services Occupations by Sex
Within the Services occupations in Groveville, the most male-oriented occupations are Security & Protection (100.0%), Law Enforcement (100.0%), and Cleaning & Maintenance (64.4%), while the most female-oriented occupations are Personal Care & Service (100.0%), Food Preparation & Serving (42.4%), and Healthcare Support (37.0%).
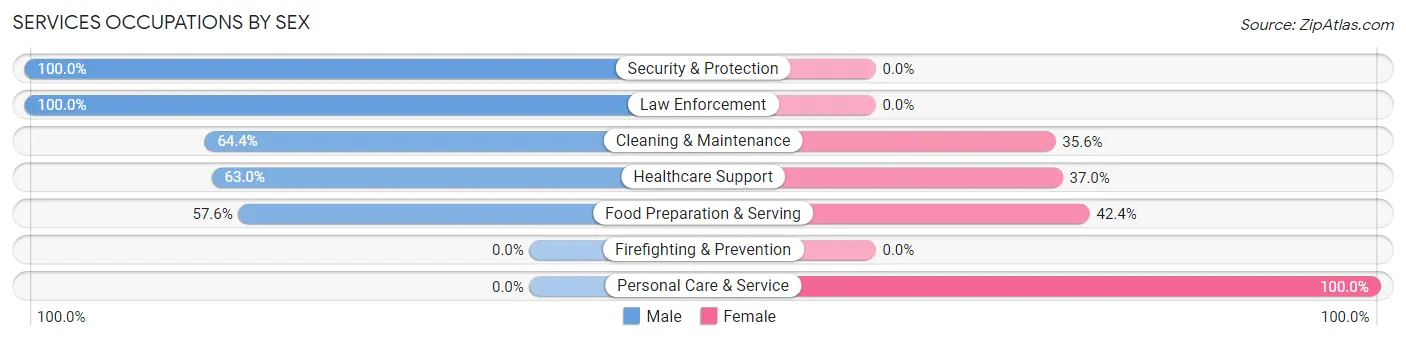
| Occupation | Male | Female |
| Healthcare Support | 17 (63.0%) | 10 (37.0%) |
| Security & Protection | 32 (100.0%) | 0 (0.0%) |
| Firefighting & Prevention | 0 (0.0%) | 0 (0.0%) |
| Law Enforcement | 32 (100.0%) | 0 (0.0%) |
| Food Preparation & Serving | 68 (57.6%) | 50 (42.4%) |
| Cleaning & Maintenance | 47 (64.4%) | 26 (35.6%) |
| Personal Care & Service | 0 (0.0%) | 33 (100.0%) |
| Total (Category) | 164 (58.0%) | 119 (42.0%) |
| Total (Overall) | 1,132 (68.5%) | 521 (31.5%) |
Sales and Office Occupations
The most common Sales and Office occupations in Groveville are Office & Administration (327 | 19.8%), and Sales & Related (66 | 4.0%).
Sales and Office Occupations by Sex
| Occupation | Male | Female |
| Sales & Related | 42 (63.6%) | 24 (36.4%) |
| Office & Administration | 228 (69.7%) | 99 (30.3%) |
| Total (Category) | 270 (68.7%) | 123 (31.3%) |
| Total (Overall) | 1,132 (68.5%) | 521 (31.5%) |
Natural Resources, Construction and Maintenance Occupations
The most common Natural Resources, Construction and Maintenance occupations in Groveville are Construction & Extraction (245 | 14.8%), and Installation, Maintenance & Repair (174 | 10.5%).
Natural Resources, Construction and Maintenance Occupations by Sex

| Occupation | Male | Female |
| Farming, Fishing & Forestry | 0 (0.0%) | 0 (0.0%) |
| Construction & Extraction | 245 (100.0%) | 0 (0.0%) |
| Installation, Maintenance & Repair | 174 (100.0%) | 0 (0.0%) |
| Total (Category) | 419 (100.0%) | 0 (0.0%) |
| Total (Overall) | 1,132 (68.5%) | 521 (31.5%) |
Production, Transportation and Moving Occupations
The most common Production, Transportation and Moving occupations in Groveville are Material Moving (43 | 2.6%), Transportation (42 | 2.5%), and Production (16 | 1.0%).
Production, Transportation and Moving Occupations by Sex
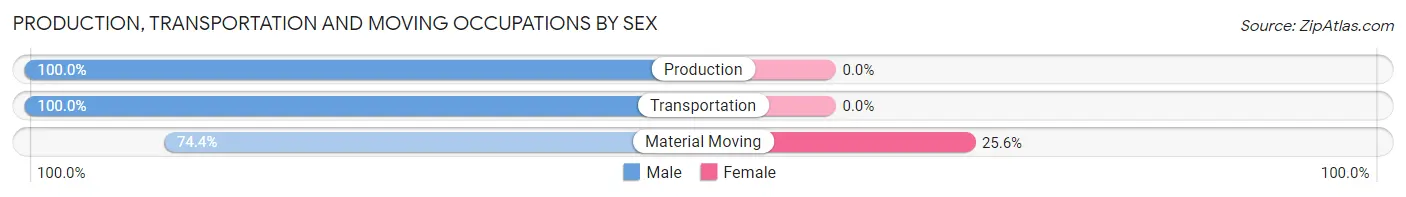
| Occupation | Male | Female |
| Production | 16 (100.0%) | 0 (0.0%) |
| Transportation | 42 (100.0%) | 0 (0.0%) |
| Material Moving | 32 (74.4%) | 11 (25.6%) |
| Total (Category) | 90 (89.1%) | 11 (10.9%) |
| Total (Overall) | 1,132 (68.5%) | 521 (31.5%) |
Employment Industries by Sex in Groveville
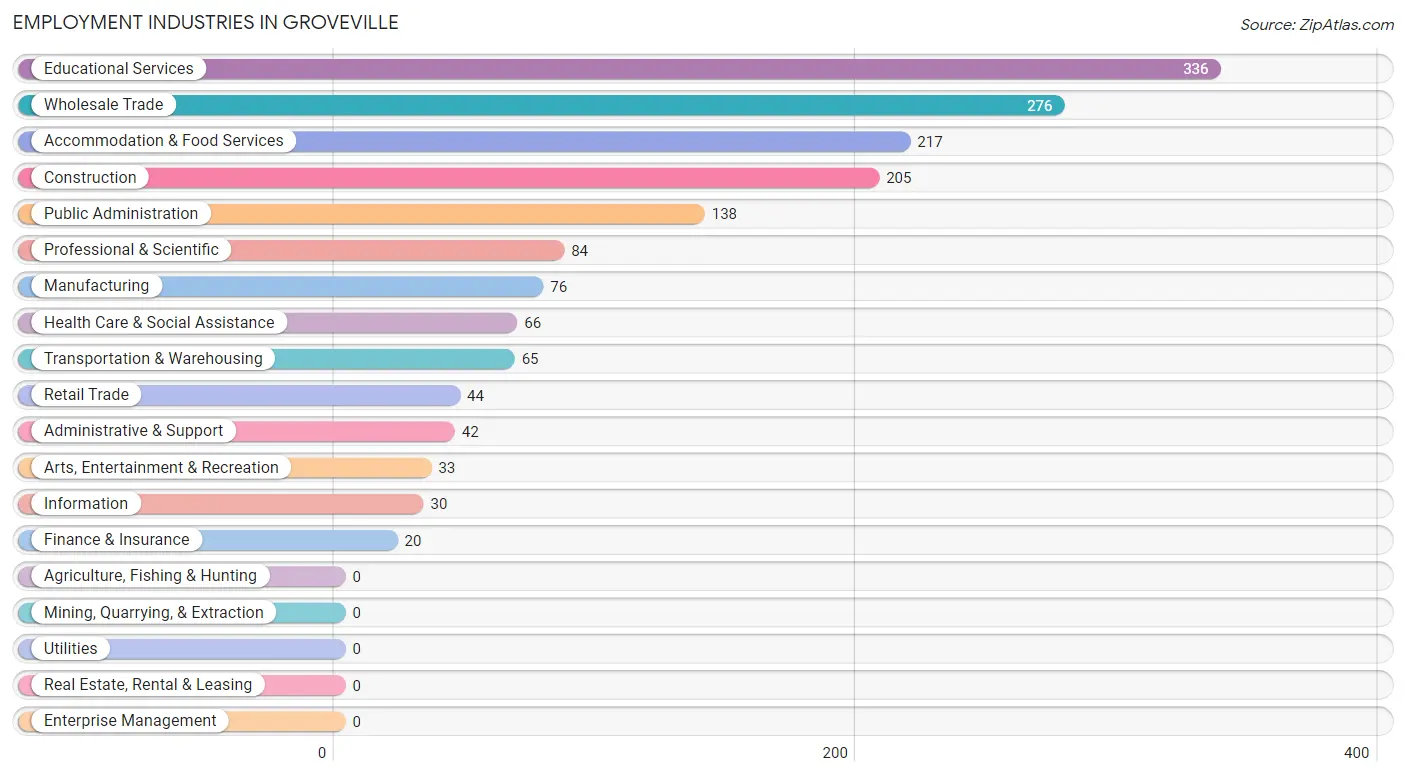
Employment Industries in Groveville
The major employment industries in Groveville include Educational Services (336 | 20.3%), Wholesale Trade (276 | 16.7%), Accommodation & Food Services (217 | 13.1%), Construction (205 | 12.4%), and Public Administration (138 | 8.4%).
Employment Industries by Sex in Groveville
The Groveville industries that see more men than women are Construction (100.0%), Transportation & Warehousing (100.0%), and Wholesale Trade (96.0%), whereas the industries that tend to have a higher number of women are Information (100.0%), Professional & Scientific (100.0%), and Public Administration (69.6%).
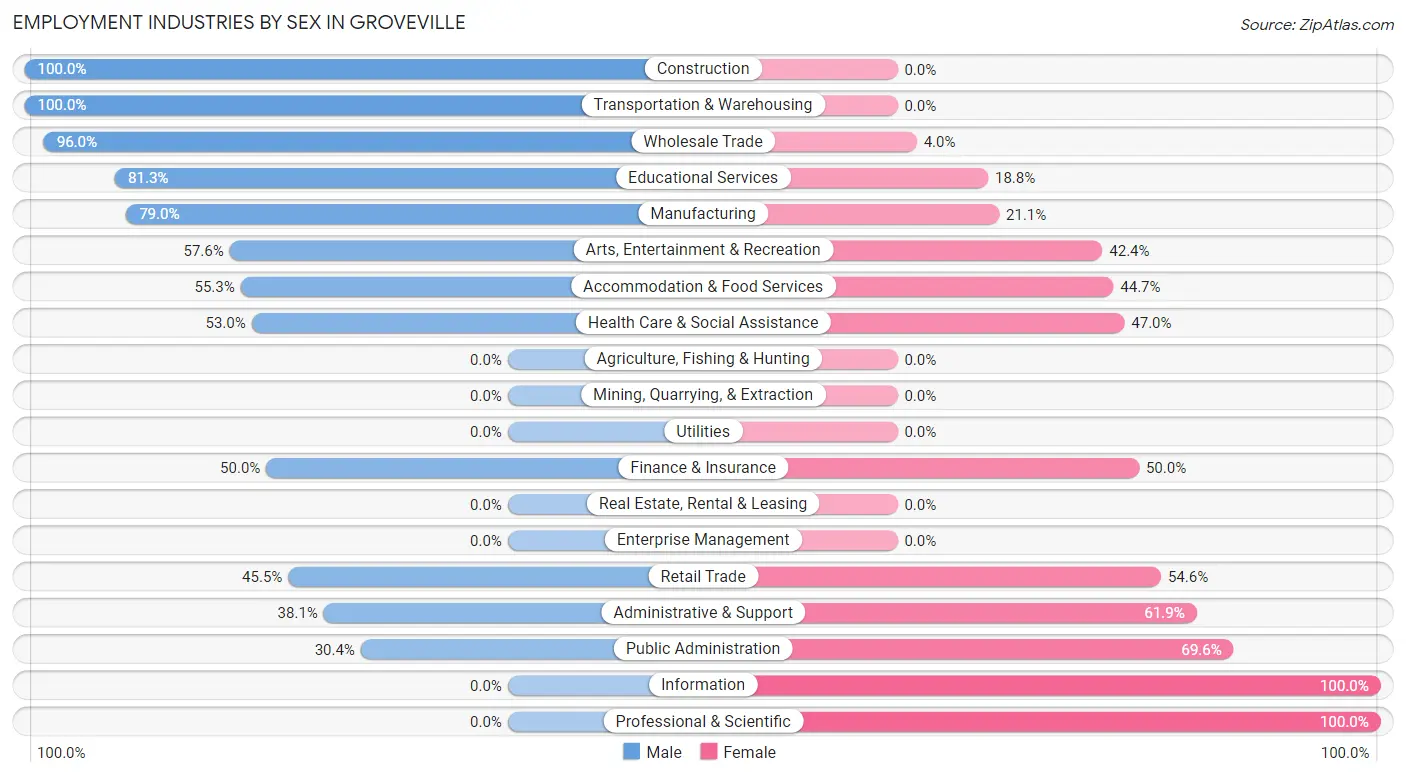
| Industry | Male | Female |
| Agriculture, Fishing & Hunting | 0 (0.0%) | 0 (0.0%) |
| Mining, Quarrying, & Extraction | 0 (0.0%) | 0 (0.0%) |
| Construction | 205 (100.0%) | 0 (0.0%) |
| Manufacturing | 60 (78.9%) | 16 (21.0%) |
| Wholesale Trade | 265 (96.0%) | 11 (4.0%) |
| Retail Trade | 20 (45.5%) | 24 (54.5%) |
| Transportation & Warehousing | 65 (100.0%) | 0 (0.0%) |
| Utilities | 0 (0.0%) | 0 (0.0%) |
| Information | 0 (0.0%) | 30 (100.0%) |
| Finance & Insurance | 10 (50.0%) | 10 (50.0%) |
| Real Estate, Rental & Leasing | 0 (0.0%) | 0 (0.0%) |
| Professional & Scientific | 0 (0.0%) | 84 (100.0%) |
| Enterprise Management | 0 (0.0%) | 0 (0.0%) |
| Administrative & Support | 16 (38.1%) | 26 (61.9%) |
| Educational Services | 273 (81.2%) | 63 (18.8%) |
| Health Care & Social Assistance | 35 (53.0%) | 31 (47.0%) |
| Arts, Entertainment & Recreation | 19 (57.6%) | 14 (42.4%) |
| Accommodation & Food Services | 120 (55.3%) | 97 (44.7%) |
| Public Administration | 42 (30.4%) | 96 (69.6%) |
| Total | 1,132 (68.5%) | 521 (31.5%) |
Education in Groveville
School Enrollment in Groveville
The most common levels of schooling among the 423 students in Groveville are high school (167 | 39.5%), college / undergraduate (120 | 28.4%), and elementary school (72 | 17.0%).
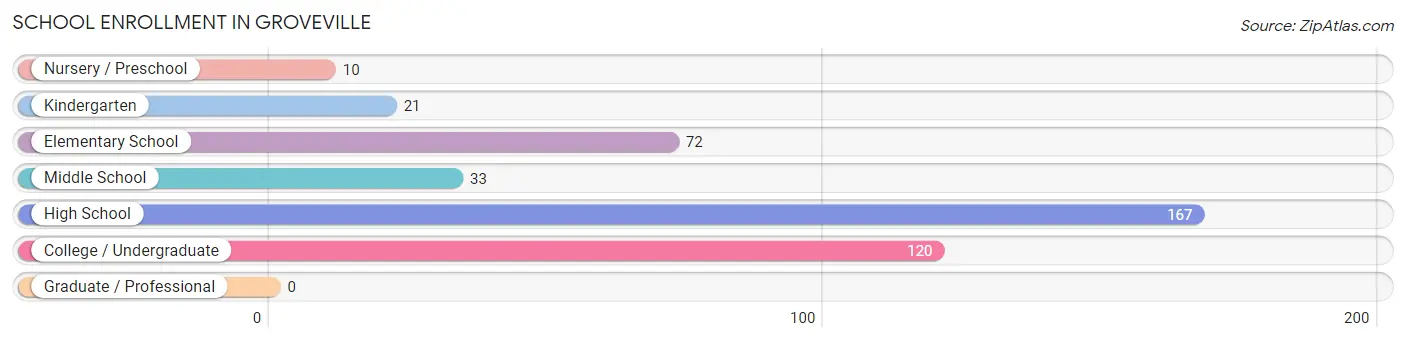
| School Level | # Students | % Students |
| Nursery / Preschool | 10 | 2.4% |
| Kindergarten | 21 | 5.0% |
| Elementary School | 72 | 17.0% |
| Middle School | 33 | 7.8% |
| High School | 167 | 39.5% |
| College / Undergraduate | 120 | 28.4% |
| Graduate / Professional | 0 | 0.0% |
| Total | 423 | 100.0% |
School Enrollment by Age by Funding Source in Groveville
Out of a total of 423 students who are enrolled in schools in Groveville, 165 (39.0%) attend a private institution, while the remaining 258 (61.0%) are enrolled in public schools. The age group of 3 to 4 year olds has the highest likelihood of being enrolled in private schools, with 10 (100.0% in the age bracket) enrolled. Conversely, the age group of 5 to 9 year old has the lowest likelihood of being enrolled in a private school, with 93 (100.0% in the age bracket) attending a public institution.
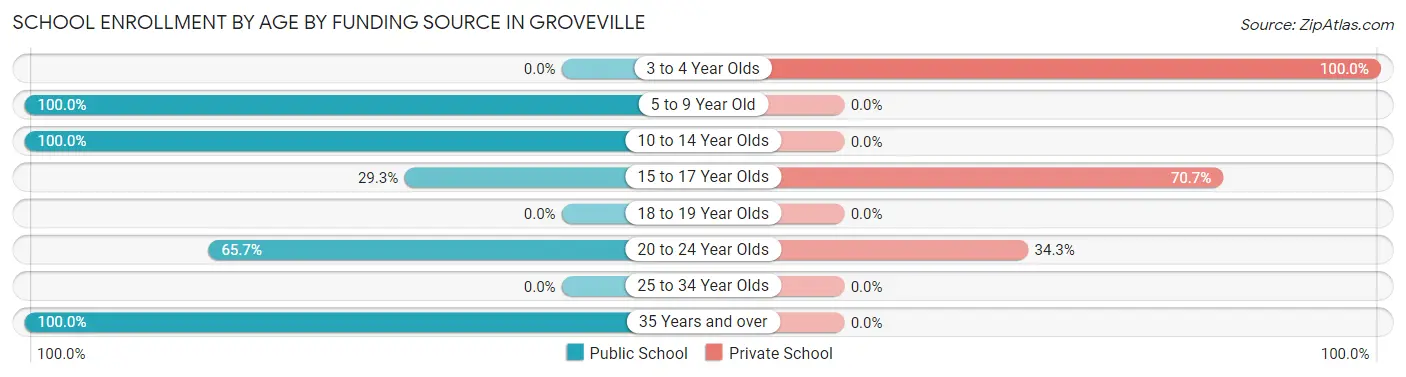
| Age Bracket | Public School | Private School |
| 3 to 4 Year Olds | 0 (0.0%) | 10 (100.0%) |
| 5 to 9 Year Old | 93 (100.0%) | 0 (0.0%) |
| 10 to 14 Year Olds | 33 (100.0%) | 0 (0.0%) |
| 15 to 17 Year Olds | 49 (29.3%) | 118 (70.7%) |
| 18 to 19 Year Olds | 0 (0.0%) | 0 (0.0%) |
| 20 to 24 Year Olds | 71 (65.7%) | 37 (34.3%) |
| 25 to 34 Year Olds | 0 (0.0%) | 0 (0.0%) |
| 35 Years and over | 12 (100.0%) | 0 (0.0%) |
| Total | 258 (61.0%) | 165 (39.0%) |
Educational Attainment by Field of Study in Groveville
Literature & languages (207 | 35.1%), business (85 | 14.4%), arts & humanities (47 | 8.0%), psychology (46 | 7.8%), and education (43 | 7.3%) are the most common fields of study among 590 individuals in Groveville who have obtained a bachelor's degree or higher.
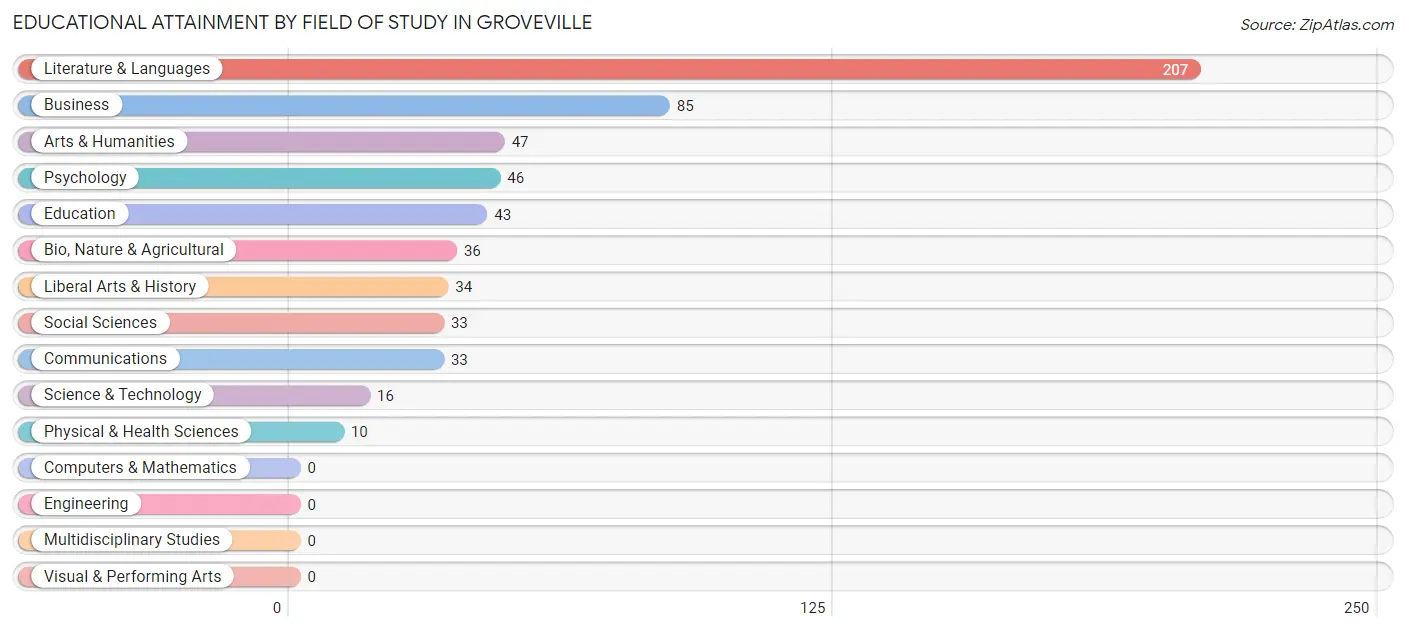
| Field of Study | # Graduates | % Graduates |
| Computers & Mathematics | 0 | 0.0% |
| Bio, Nature & Agricultural | 36 | 6.1% |
| Physical & Health Sciences | 10 | 1.7% |
| Psychology | 46 | 7.8% |
| Social Sciences | 33 | 5.6% |
| Engineering | 0 | 0.0% |
| Multidisciplinary Studies | 0 | 0.0% |
| Science & Technology | 16 | 2.7% |
| Business | 85 | 14.4% |
| Education | 43 | 7.3% |
| Literature & Languages | 207 | 35.1% |
| Liberal Arts & History | 34 | 5.8% |
| Visual & Performing Arts | 0 | 0.0% |
| Communications | 33 | 5.6% |
| Arts & Humanities | 47 | 8.0% |
| Total | 590 | 100.0% |
Transportation & Commute in Groveville
Vehicle Availability by Sex in Groveville
The most prevalent vehicle ownership categories in Groveville are males with 5 or more vehicles (638, accounting for 56.6%) and females with 5 or more vehicles (0, making up 126.3%).
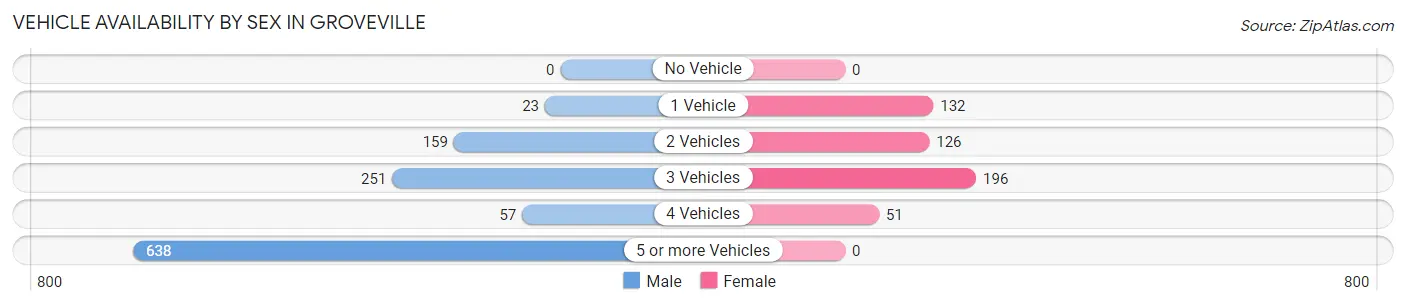
| Vehicles Available | Male | Female |
| No Vehicle | 0 (0.0%) | 0 (0.0%) |
| 1 Vehicle | 23 (2.0%) | 132 (26.1%) |
| 2 Vehicles | 159 (14.1%) | 126 (24.9%) |
| 3 Vehicles | 251 (22.3%) | 196 (38.8%) |
| 4 Vehicles | 57 (5.1%) | 51 (10.1%) |
| 5 or more Vehicles | 638 (56.6%) | 0 (0.0%) |
| Total | 1,128 (100.0%) | 505 (100.0%) |
Commute Time in Groveville
The most frequently occuring commute durations in Groveville are 30 to 34 minutes (647 commuters, 41.7%), 15 to 19 minutes (260 commuters, 16.7%), and 25 to 29 minutes (212 commuters, 13.7%).
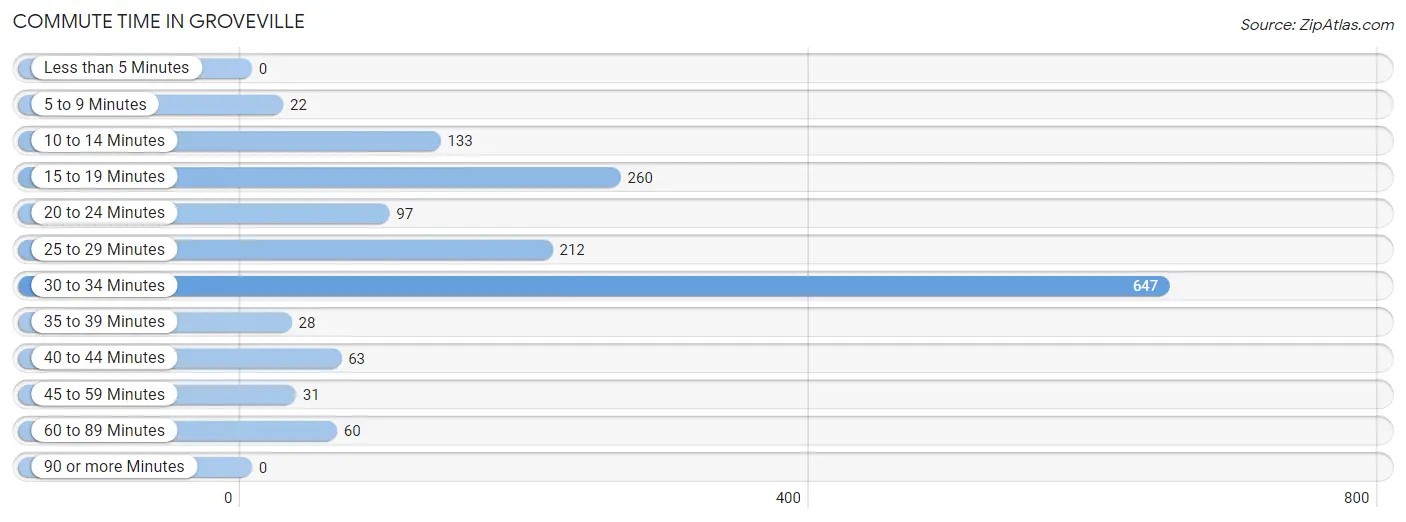
| Commute Time | # Commuters | % Commuters |
| Less than 5 Minutes | 0 | 0.0% |
| 5 to 9 Minutes | 22 | 1.4% |
| 10 to 14 Minutes | 133 | 8.6% |
| 15 to 19 Minutes | 260 | 16.7% |
| 20 to 24 Minutes | 97 | 6.2% |
| 25 to 29 Minutes | 212 | 13.7% |
| 30 to 34 Minutes | 647 | 41.7% |
| 35 to 39 Minutes | 28 | 1.8% |
| 40 to 44 Minutes | 63 | 4.1% |
| 45 to 59 Minutes | 31 | 2.0% |
| 60 to 89 Minutes | 60 | 3.9% |
| 90 or more Minutes | 0 | 0.0% |
Commute Time by Sex in Groveville
The most common commute times in Groveville are 30 to 34 minutes (560 commuters, 50.4%) for males and 25 to 29 minutes (108 commuters, 24.4%) for females.
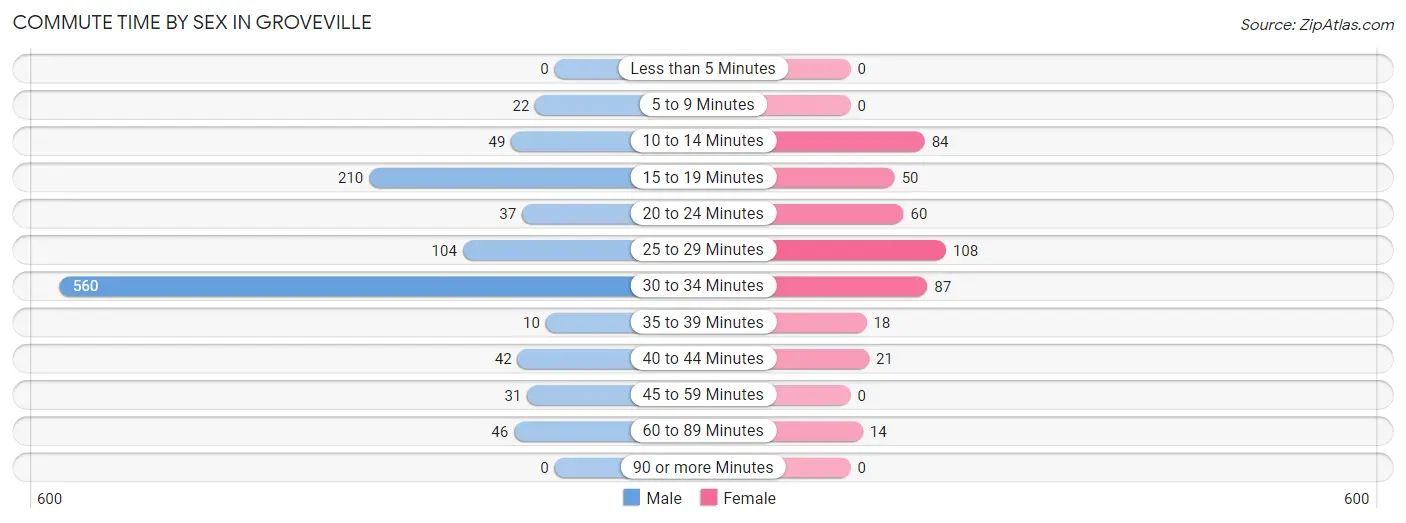
| Commute Time | Male | Female |
| Less than 5 Minutes | 0 (0.0%) | 0 (0.0%) |
| 5 to 9 Minutes | 22 (2.0%) | 0 (0.0%) |
| 10 to 14 Minutes | 49 (4.4%) | 84 (19.0%) |
| 15 to 19 Minutes | 210 (18.9%) | 50 (11.3%) |
| 20 to 24 Minutes | 37 (3.3%) | 60 (13.6%) |
| 25 to 29 Minutes | 104 (9.4%) | 108 (24.4%) |
| 30 to 34 Minutes | 560 (50.4%) | 87 (19.7%) |
| 35 to 39 Minutes | 10 (0.9%) | 18 (4.1%) |
| 40 to 44 Minutes | 42 (3.8%) | 21 (4.8%) |
| 45 to 59 Minutes | 31 (2.8%) | 0 (0.0%) |
| 60 to 89 Minutes | 46 (4.1%) | 14 (3.2%) |
| 90 or more Minutes | 0 (0.0%) | 0 (0.0%) |
Time of Departure to Work by Sex in Groveville
The most frequent times of departure to work in Groveville are 7:30 AM to 7:59 AM (489, 44.0%) for males and 6:30 AM to 6:59 AM (80, 18.1%) for females.
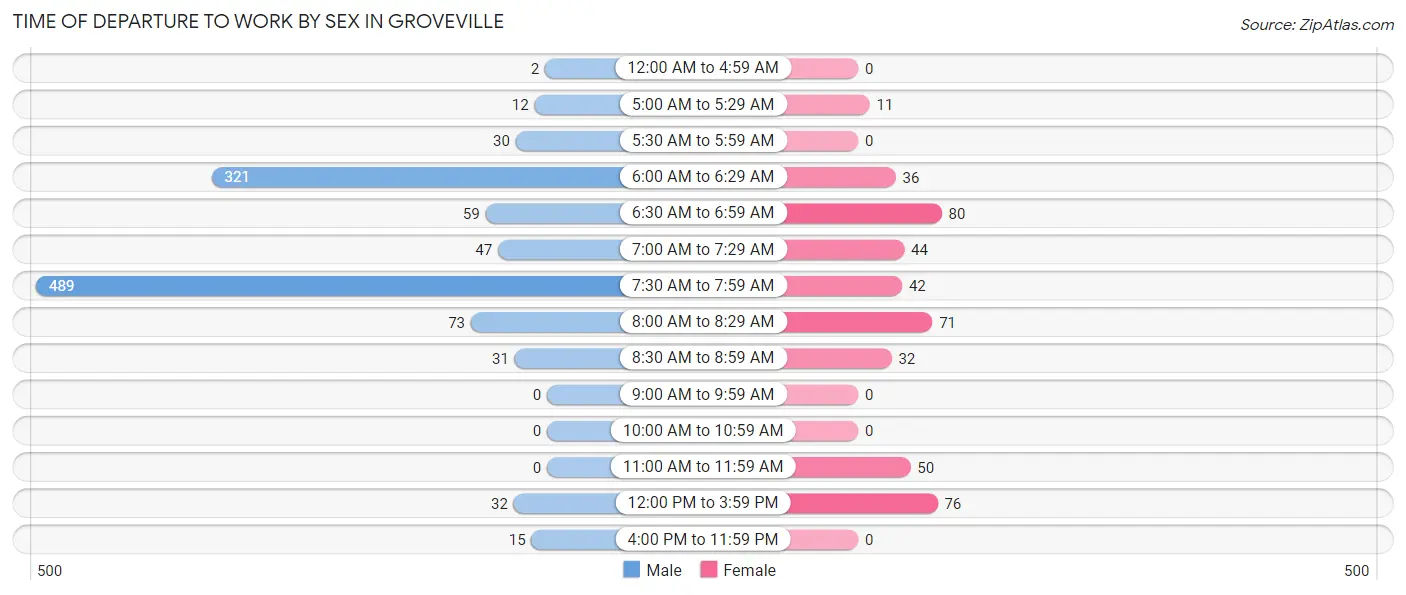
| Time of Departure | Male | Female |
| 12:00 AM to 4:59 AM | 2 (0.2%) | 0 (0.0%) |
| 5:00 AM to 5:29 AM | 12 (1.1%) | 11 (2.5%) |
| 5:30 AM to 5:59 AM | 30 (2.7%) | 0 (0.0%) |
| 6:00 AM to 6:29 AM | 321 (28.9%) | 36 (8.1%) |
| 6:30 AM to 6:59 AM | 59 (5.3%) | 80 (18.1%) |
| 7:00 AM to 7:29 AM | 47 (4.2%) | 44 (10.0%) |
| 7:30 AM to 7:59 AM | 489 (44.0%) | 42 (9.5%) |
| 8:00 AM to 8:29 AM | 73 (6.6%) | 71 (16.1%) |
| 8:30 AM to 8:59 AM | 31 (2.8%) | 32 (7.2%) |
| 9:00 AM to 9:59 AM | 0 (0.0%) | 0 (0.0%) |
| 10:00 AM to 10:59 AM | 0 (0.0%) | 0 (0.0%) |
| 11:00 AM to 11:59 AM | 0 (0.0%) | 50 (11.3%) |
| 12:00 PM to 3:59 PM | 32 (2.9%) | 76 (17.2%) |
| 4:00 PM to 11:59 PM | 15 (1.3%) | 0 (0.0%) |
| Total | 1,111 (100.0%) | 442 (100.0%) |
Housing Occupancy in Groveville
Occupancy by Ownership in Groveville
Of the total 1,009 dwellings in Groveville, owner-occupied units account for 704 (69.8%), while renter-occupied units make up 305 (30.2%).
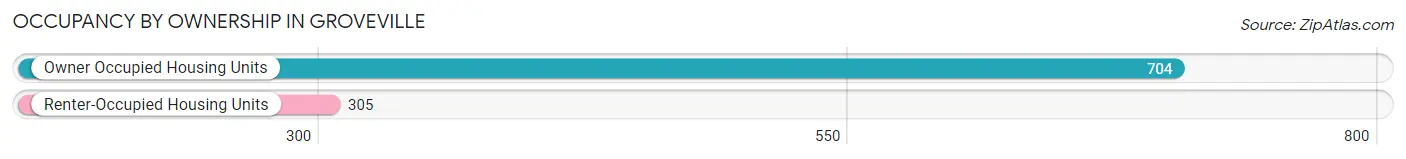
| Occupancy | # Housing Units | % Housing Units |
| Owner Occupied Housing Units | 704 | 69.8% |
| Renter-Occupied Housing Units | 305 | 30.2% |
| Total Occupied Housing Units | 1,009 | 100.0% |
Occupancy by Household Size in Groveville
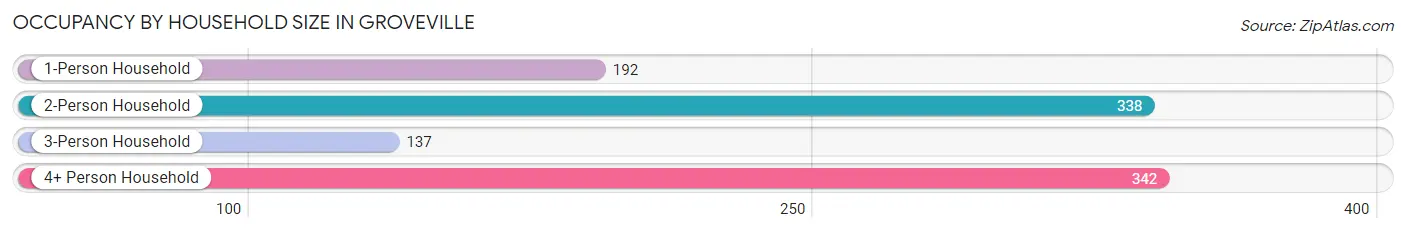
| Household Size | # Housing Units | % Housing Units |
| 1-Person Household | 192 | 19.0% |
| 2-Person Household | 338 | 33.5% |
| 3-Person Household | 137 | 13.6% |
| 4+ Person Household | 342 | 33.9% |
| Total Housing Units | 1,009 | 100.0% |
Occupancy by Ownership by Household Size in Groveville
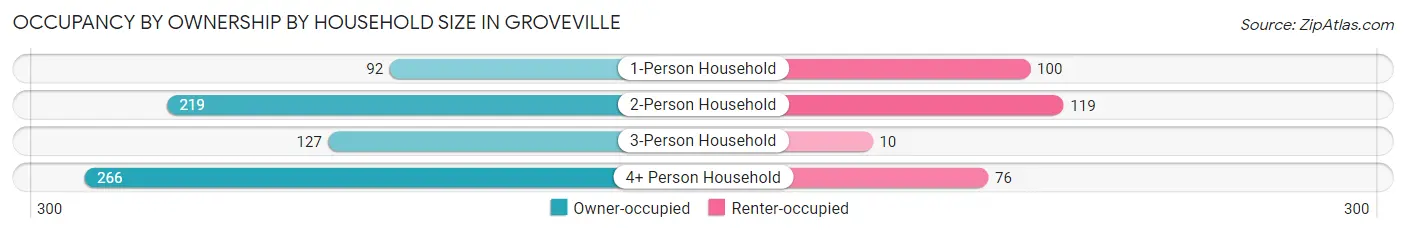
| Household Size | Owner-occupied | Renter-occupied |
| 1-Person Household | 92 (47.9%) | 100 (52.1%) |
| 2-Person Household | 219 (64.8%) | 119 (35.2%) |
| 3-Person Household | 127 (92.7%) | 10 (7.3%) |
| 4+ Person Household | 266 (77.8%) | 76 (22.2%) |
| Total Housing Units | 704 (69.8%) | 305 (30.2%) |
Occupancy by Educational Attainment in Groveville
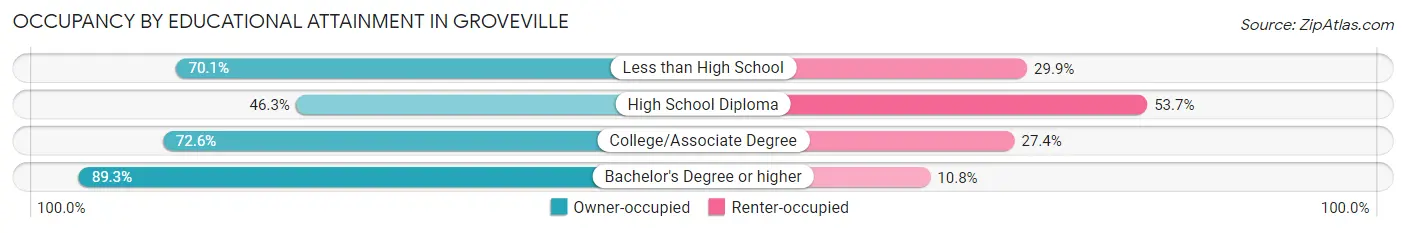
| Household Size | Owner-occupied | Renter-occupied |
| Less than High School | 117 (70.1%) | 50 (29.9%) |
| High School Diploma | 105 (46.3%) | 122 (53.7%) |
| College/Associate Degree | 291 (72.6%) | 110 (27.4%) |
| Bachelor's Degree or higher | 191 (89.2%) | 23 (10.7%) |
Occupancy by Age of Householder in Groveville
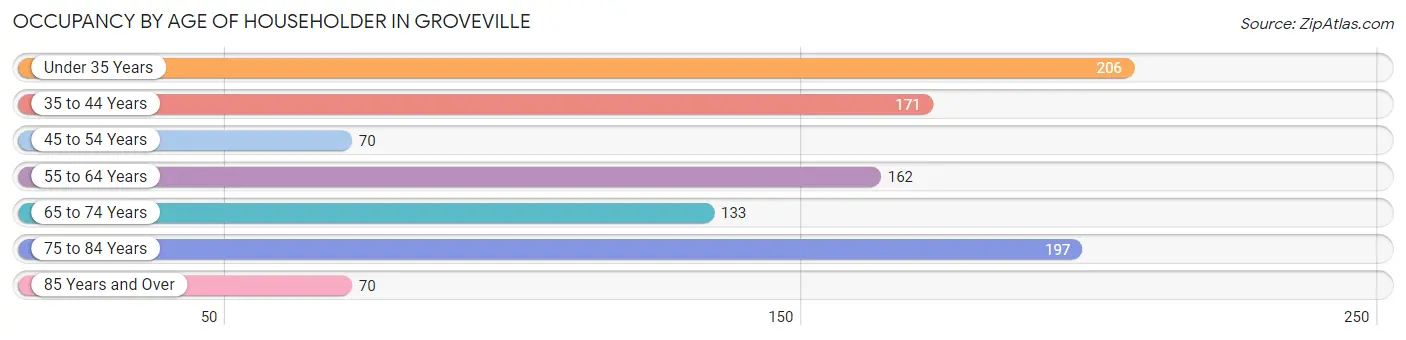
| Age Bracket | # Households | % Households |
| Under 35 Years | 206 | 20.4% |
| 35 to 44 Years | 171 | 17.0% |
| 45 to 54 Years | 70 | 6.9% |
| 55 to 64 Years | 162 | 16.1% |
| 65 to 74 Years | 133 | 13.2% |
| 75 to 84 Years | 197 | 19.5% |
| 85 Years and Over | 70 | 6.9% |
| Total | 1,009 | 100.0% |
Housing Finances in Groveville
Median Income by Occupancy in Groveville
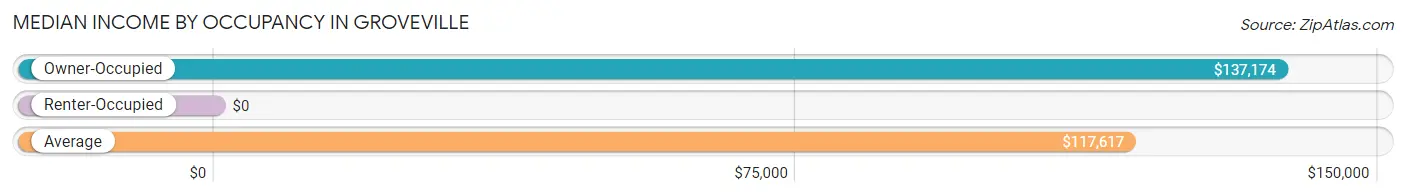
| Occupancy Type | # Households | Median Income |
| Owner-Occupied | 704 (69.8%) | $137,174 |
| Renter-Occupied | 305 (30.2%) | $0 |
| Average | 1,009 (100.0%) | $117,617 |
Occupancy by Householder Income Bracket in Groveville
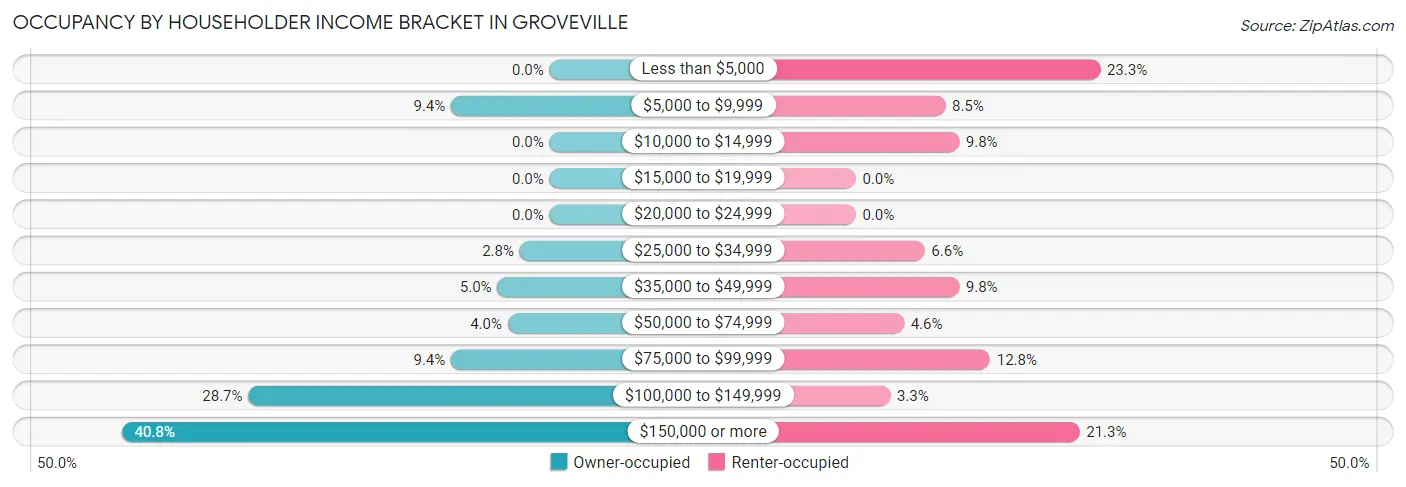
| Income Bracket | Owner-occupied | Renter-occupied |
| Less than $5,000 | 0 (0.0%) | 71 (23.3%) |
| $5,000 to $9,999 | 66 (9.4%) | 26 (8.5%) |
| $10,000 to $14,999 | 0 (0.0%) | 30 (9.8%) |
| $15,000 to $19,999 | 0 (0.0%) | 0 (0.0%) |
| $20,000 to $24,999 | 0 (0.0%) | 0 (0.0%) |
| $25,000 to $34,999 | 20 (2.8%) | 20 (6.6%) |
| $35,000 to $49,999 | 35 (5.0%) | 30 (9.8%) |
| $50,000 to $74,999 | 28 (4.0%) | 14 (4.6%) |
| $75,000 to $99,999 | 66 (9.4%) | 39 (12.8%) |
| $100,000 to $149,999 | 202 (28.7%) | 10 (3.3%) |
| $150,000 or more | 287 (40.8%) | 65 (21.3%) |
| Total | 704 (100.0%) | 305 (100.0%) |
Monthly Housing Cost Tiers in Groveville
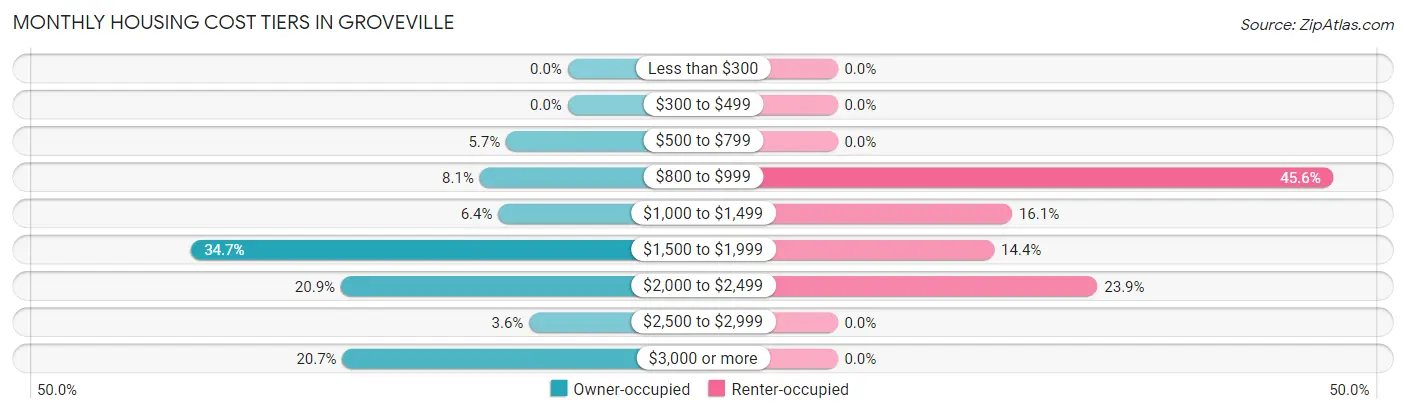
| Monthly Cost | Owner-occupied | Renter-occupied |
| Less than $300 | 0 (0.0%) | 0 (0.0%) |
| $300 to $499 | 0 (0.0%) | 0 (0.0%) |
| $500 to $799 | 40 (5.7%) | 0 (0.0%) |
| $800 to $999 | 57 (8.1%) | 139 (45.6%) |
| $1,000 to $1,499 | 45 (6.4%) | 49 (16.1%) |
| $1,500 to $1,999 | 244 (34.7%) | 44 (14.4%) |
| $2,000 to $2,499 | 147 (20.9%) | 73 (23.9%) |
| $2,500 to $2,999 | 25 (3.5%) | 0 (0.0%) |
| $3,000 or more | 146 (20.7%) | 0 (0.0%) |
| Total | 704 (100.0%) | 305 (100.0%) |
Physical Housing Characteristics in Groveville
Housing Structures in Groveville
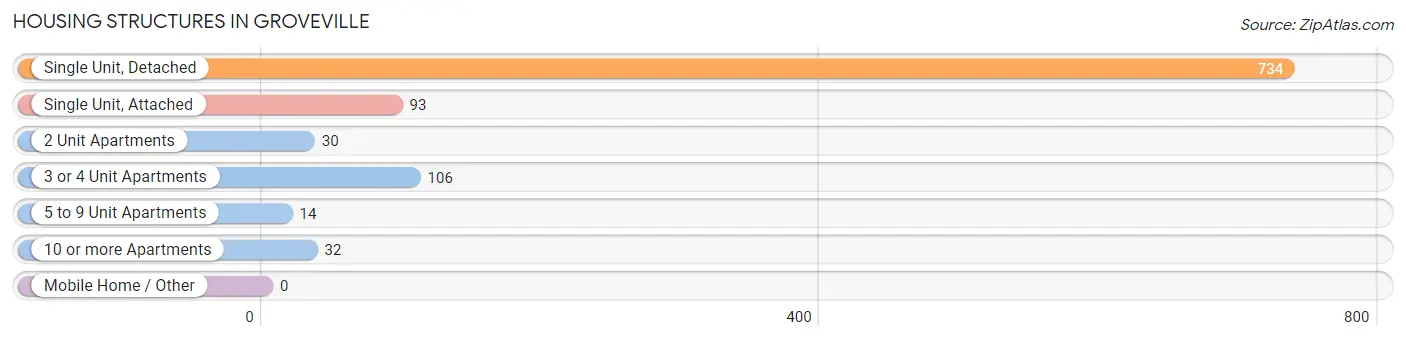
| Structure Type | # Housing Units | % Housing Units |
| Single Unit, Detached | 734 | 72.8% |
| Single Unit, Attached | 93 | 9.2% |
| 2 Unit Apartments | 30 | 3.0% |
| 3 or 4 Unit Apartments | 106 | 10.5% |
| 5 to 9 Unit Apartments | 14 | 1.4% |
| 10 or more Apartments | 32 | 3.2% |
| Mobile Home / Other | 0 | 0.0% |
| Total | 1,009 | 100.0% |
Housing Structures by Occupancy in Groveville
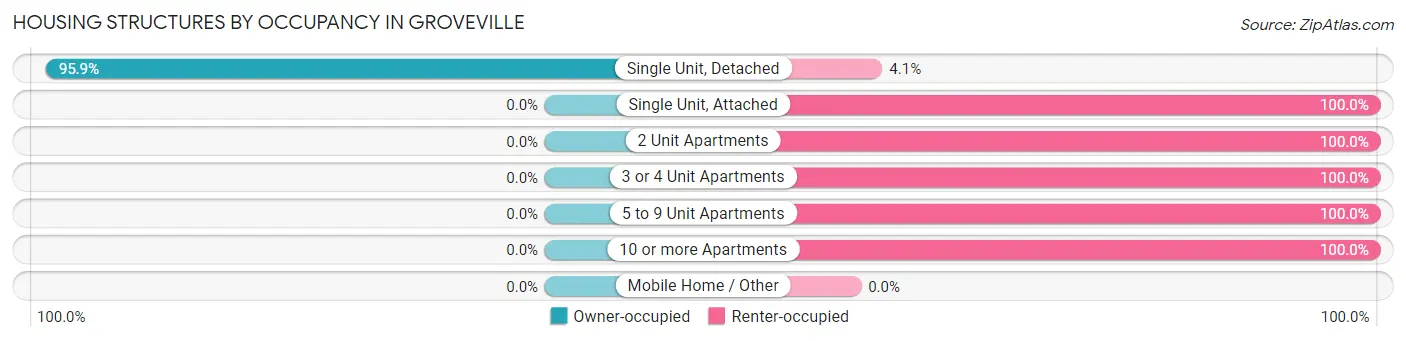
| Structure Type | Owner-occupied | Renter-occupied |
| Single Unit, Detached | 704 (95.9%) | 30 (4.1%) |
| Single Unit, Attached | 0 (0.0%) | 93 (100.0%) |
| 2 Unit Apartments | 0 (0.0%) | 30 (100.0%) |
| 3 or 4 Unit Apartments | 0 (0.0%) | 106 (100.0%) |
| 5 to 9 Unit Apartments | 0 (0.0%) | 14 (100.0%) |
| 10 or more Apartments | 0 (0.0%) | 32 (100.0%) |
| Mobile Home / Other | 0 (0.0%) | 0 (0.0%) |
| Total | 704 (69.8%) | 305 (30.2%) |
Housing Structures by Number of Rooms in Groveville
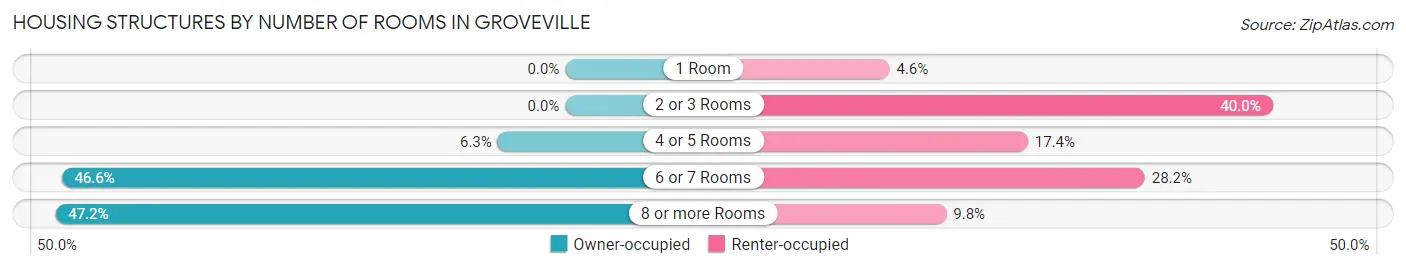
| Number of Rooms | Owner-occupied | Renter-occupied |
| 1 Room | 0 (0.0%) | 14 (4.6%) |
| 2 or 3 Rooms | 0 (0.0%) | 122 (40.0%) |
| 4 or 5 Rooms | 44 (6.2%) | 53 (17.4%) |
| 6 or 7 Rooms | 328 (46.6%) | 86 (28.2%) |
| 8 or more Rooms | 332 (47.2%) | 30 (9.8%) |
| Total | 704 (100.0%) | 305 (100.0%) |
Housing Structure by Heating Type in Groveville
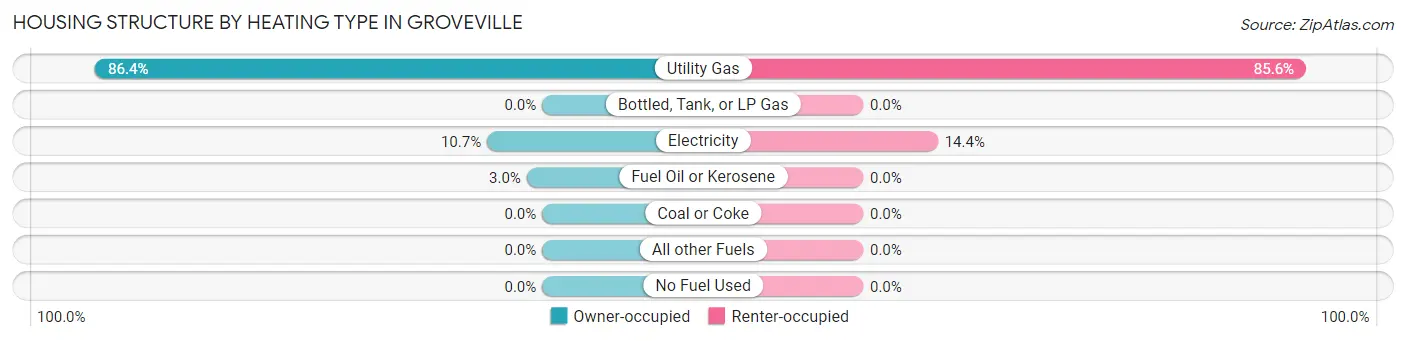
| Heating Type | Owner-occupied | Renter-occupied |
| Utility Gas | 608 (86.4%) | 261 (85.6%) |
| Bottled, Tank, or LP Gas | 0 (0.0%) | 0 (0.0%) |
| Electricity | 75 (10.6%) | 44 (14.4%) |
| Fuel Oil or Kerosene | 21 (3.0%) | 0 (0.0%) |
| Coal or Coke | 0 (0.0%) | 0 (0.0%) |
| All other Fuels | 0 (0.0%) | 0 (0.0%) |
| No Fuel Used | 0 (0.0%) | 0 (0.0%) |
| Total | 704 (100.0%) | 305 (100.0%) |
Household Vehicle Usage in Groveville
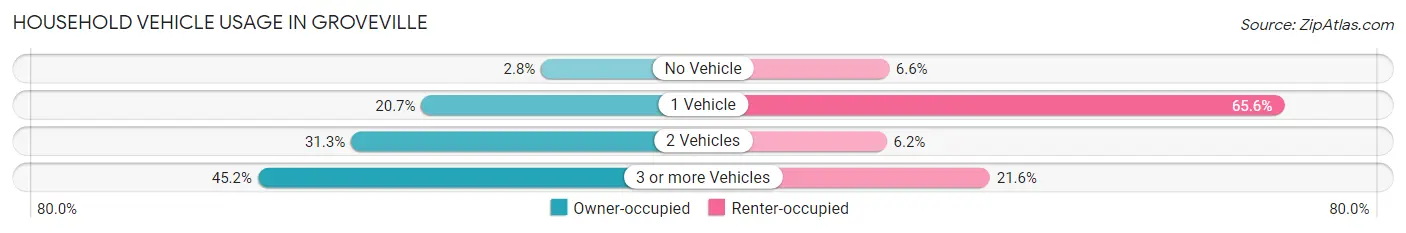
| Vehicles per Household | Owner-occupied | Renter-occupied |
| No Vehicle | 20 (2.8%) | 20 (6.6%) |
| 1 Vehicle | 146 (20.7%) | 200 (65.6%) |
| 2 Vehicles | 220 (31.2%) | 19 (6.2%) |
| 3 or more Vehicles | 318 (45.2%) | 66 (21.6%) |
| Total | 704 (100.0%) | 305 (100.0%) |
Real Estate & Mortgages in Groveville
Real Estate and Mortgage Overview in Groveville
| Characteristic | Without Mortgage | With Mortgage |
| Housing Units | 374 | 330 |
| Median Property Value | $340,900 | $337,000 |
| Median Household Income | - | - |
| Monthly Housing Costs | $1,501 | $146 |
| Real Estate Taxes | $10,001 | $0 |
Property Value by Mortgage Status in Groveville
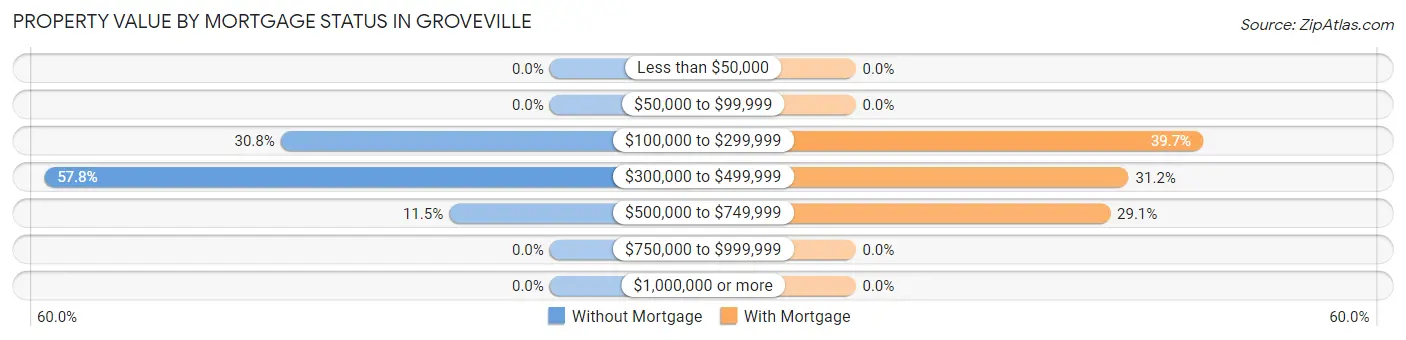
| Property Value | Without Mortgage | With Mortgage |
| Less than $50,000 | 0 (0.0%) | 0 (0.0%) |
| $50,000 to $99,999 | 0 (0.0%) | 0 (0.0%) |
| $100,000 to $299,999 | 115 (30.7%) | 131 (39.7%) |
| $300,000 to $499,999 | 216 (57.8%) | 103 (31.2%) |
| $500,000 to $749,999 | 43 (11.5%) | 96 (29.1%) |
| $750,000 to $999,999 | 0 (0.0%) | 0 (0.0%) |
| $1,000,000 or more | 0 (0.0%) | 0 (0.0%) |
| Total | 374 (100.0%) | 330 (100.0%) |
Household Income by Mortgage Status in Groveville
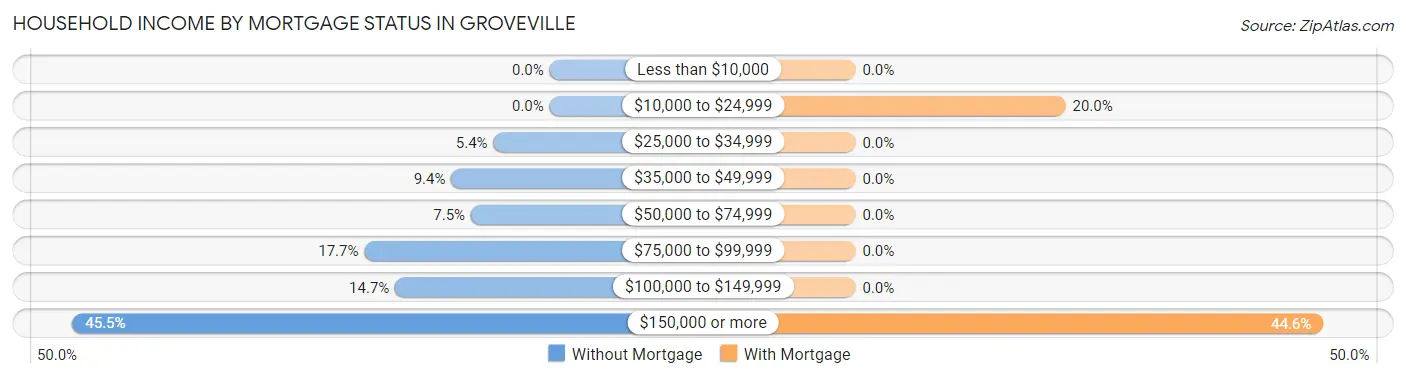
| Household Income | Without Mortgage | With Mortgage |
| Less than $10,000 | 0 (0.0%) | 0 (0.0%) |
| $10,000 to $24,999 | 0 (0.0%) | 66 (20.0%) |
| $25,000 to $34,999 | 20 (5.3%) | 0 (0.0%) |
| $35,000 to $49,999 | 35 (9.4%) | 0 (0.0%) |
| $50,000 to $74,999 | 28 (7.5%) | 0 (0.0%) |
| $75,000 to $99,999 | 66 (17.6%) | 0 (0.0%) |
| $100,000 to $149,999 | 55 (14.7%) | 0 (0.0%) |
| $150,000 or more | 170 (45.5%) | 147 (44.6%) |
| Total | 374 (100.0%) | 330 (100.0%) |
Property Value to Household Income Ratio in Groveville
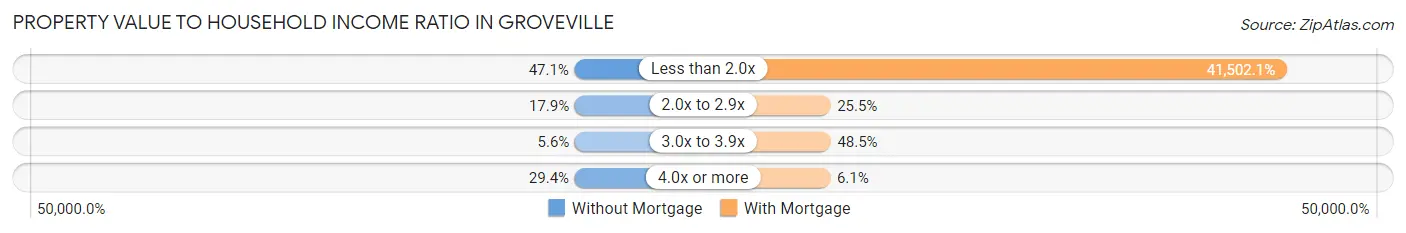
| Value-to-Income Ratio | Without Mortgage | With Mortgage |
| Less than 2.0x | 176 (47.1%) | 136,957 (41,502.1%) |
| 2.0x to 2.9x | 67 (17.9%) | 84 (25.5%) |
| 3.0x to 3.9x | 21 (5.6%) | 160 (48.5%) |
| 4.0x or more | 110 (29.4%) | 20 (6.1%) |
| Total | 374 (100.0%) | 330 (100.0%) |
Real Estate Taxes by Mortgage Status in Groveville
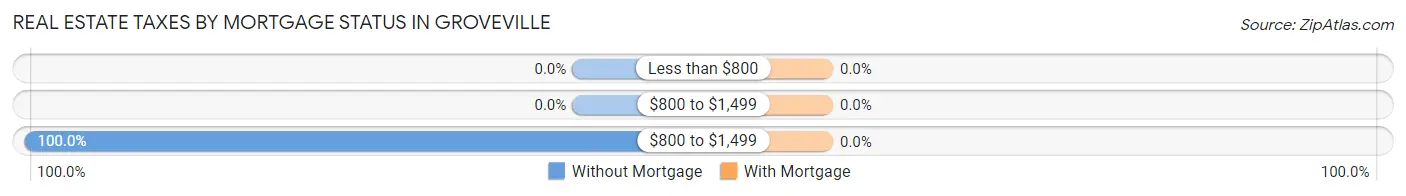
| Property Taxes | Without Mortgage | With Mortgage |
| Less than $800 | 0 (0.0%) | 0 (0.0%) |
| $800 to $1,499 | 0 (0.0%) | 0 (0.0%) |
| $800 to $1,499 | 374 (100.0%) | 0 (0.0%) |
| Total | 374 (100.0%) | 330 (100.0%) |
Health & Disability in Groveville
Health Insurance Coverage by Age in Groveville
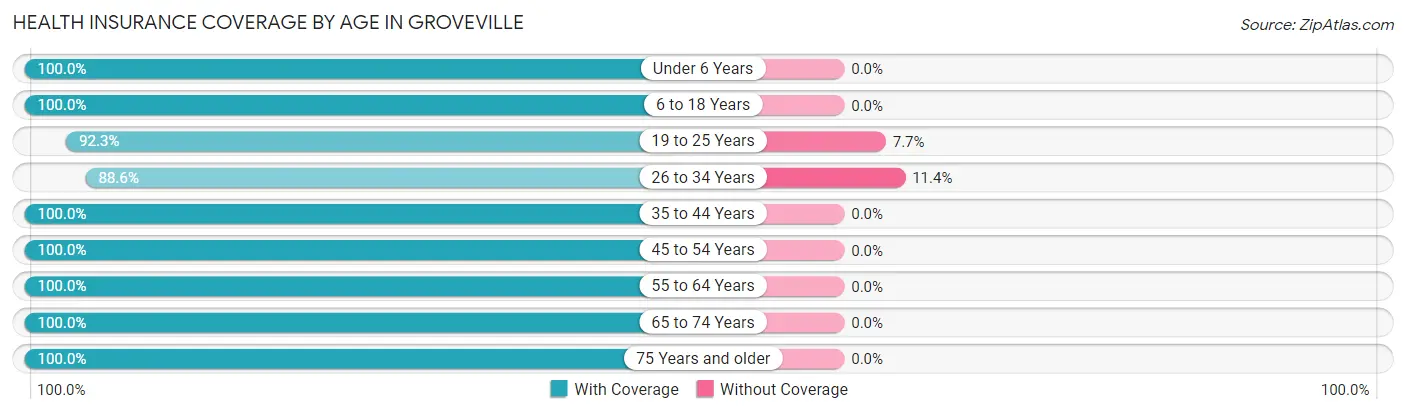
| Age Bracket | With Coverage | Without Coverage |
| Under 6 Years | 273 (100.0%) | 0 (0.0%) |
| 6 to 18 Years | 284 (100.0%) | 0 (0.0%) |
| 19 to 25 Years | 560 (92.3%) | 47 (7.7%) |
| 26 to 34 Years | 320 (88.6%) | 41 (11.4%) |
| 35 to 44 Years | 322 (100.0%) | 0 (0.0%) |
| 45 to 54 Years | 353 (100.0%) | 0 (0.0%) |
| 55 to 64 Years | 469 (100.0%) | 0 (0.0%) |
| 65 to 74 Years | 180 (100.0%) | 0 (0.0%) |
| 75 Years and older | 469 (100.0%) | 0 (0.0%) |
| Total | 3,230 (97.4%) | 88 (2.6%) |
Health Insurance Coverage by Citizenship Status in Groveville
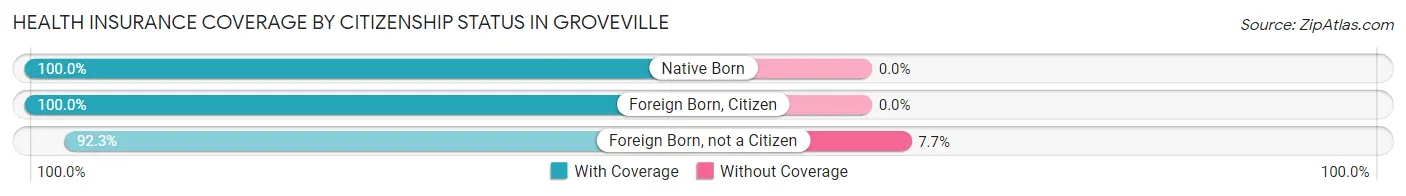
| Citizenship Status | With Coverage | Without Coverage |
| Native Born | 273 (100.0%) | 0 (0.0%) |
| Foreign Born, Citizen | 284 (100.0%) | 0 (0.0%) |
| Foreign Born, not a Citizen | 560 (92.3%) | 47 (7.7%) |
Health Insurance Coverage by Household Income in Groveville
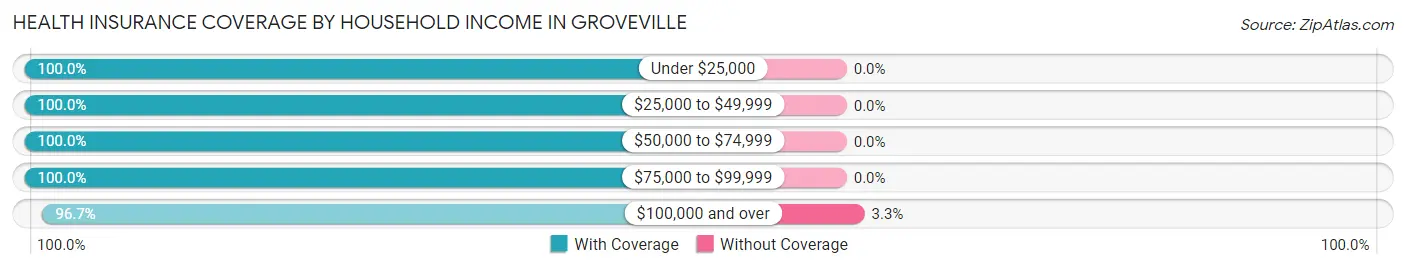
| Household Income | With Coverage | Without Coverage |
| Under $25,000 | 276 (100.0%) | 0 (0.0%) |
| $25,000 to $49,999 | 201 (100.0%) | 0 (0.0%) |
| $50,000 to $74,999 | 66 (100.0%) | 0 (0.0%) |
| $75,000 to $99,999 | 195 (100.0%) | 0 (0.0%) |
| $100,000 and over | 2,487 (96.7%) | 86 (3.3%) |
Public vs Private Health Insurance Coverage by Age in Groveville
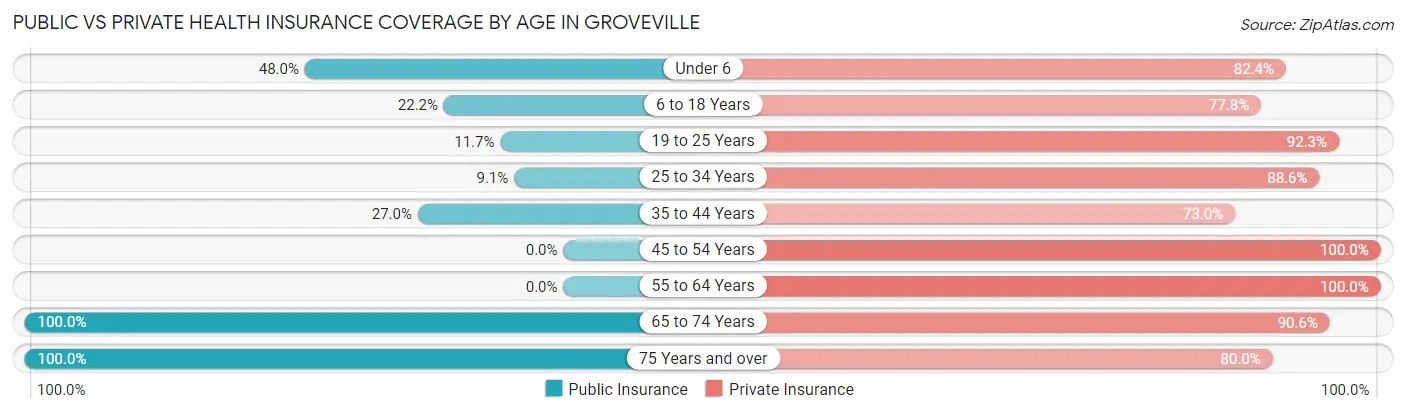
| Age Bracket | Public Insurance | Private Insurance |
| Under 6 | 131 (48.0%) | 225 (82.4%) |
| 6 to 18 Years | 63 (22.2%) | 221 (77.8%) |
| 19 to 25 Years | 71 (11.7%) | 560 (92.3%) |
| 25 to 34 Years | 33 (9.1%) | 320 (88.6%) |
| 35 to 44 Years | 87 (27.0%) | 235 (73.0%) |
| 45 to 54 Years | 0 (0.0%) | 353 (100.0%) |
| 55 to 64 Years | 0 (0.0%) | 469 (100.0%) |
| 65 to 74 Years | 180 (100.0%) | 163 (90.6%) |
| 75 Years and over | 469 (100.0%) | 375 (80.0%) |
| Total | 1,034 (31.2%) | 2,921 (88.0%) |
Disability Status by Sex by Age in Groveville
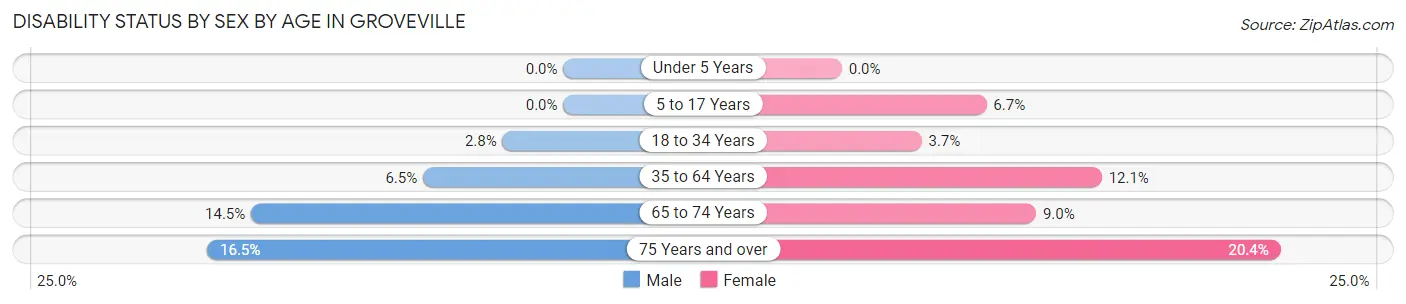
| Age Bracket | Male | Female |
| Under 5 Years | 0 (0.0%) | 0 (0.0%) |
| 5 to 17 Years | 0 (0.0%) | 10 (6.7%) |
| 18 to 34 Years | 20 (2.8%) | 10 (3.7%) |
| 35 to 64 Years | 34 (6.5%) | 75 (12.1%) |
| 65 to 74 Years | 10 (14.5%) | 10 (9.0%) |
| 75 Years and over | 41 (16.5%) | 45 (20.4%) |
Disability Class by Sex by Age in Groveville
Disability Class: Hearing Difficulty
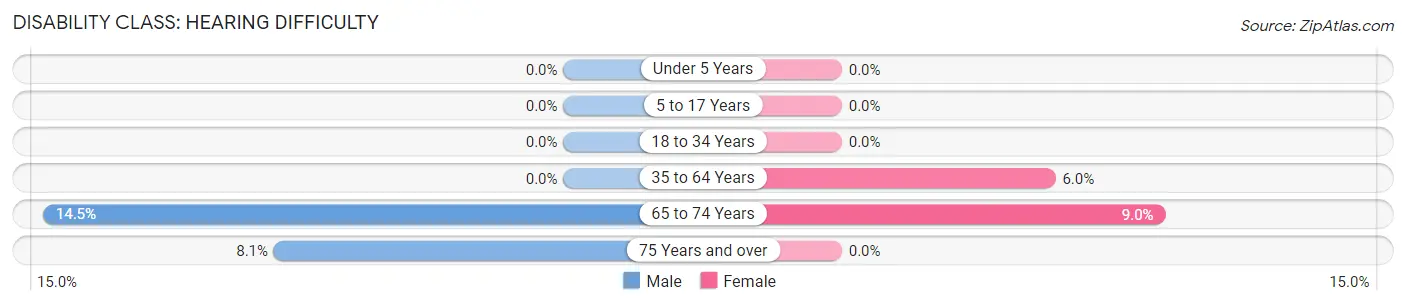
| Age Bracket | Male | Female |
| Under 5 Years | 0 (0.0%) | 0 (0.0%) |
| 5 to 17 Years | 0 (0.0%) | 0 (0.0%) |
| 18 to 34 Years | 0 (0.0%) | 0 (0.0%) |
| 35 to 64 Years | 0 (0.0%) | 37 (5.9%) |
| 65 to 74 Years | 10 (14.5%) | 10 (9.0%) |
| 75 Years and over | 20 (8.1%) | 0 (0.0%) |
Disability Class: Vision Difficulty
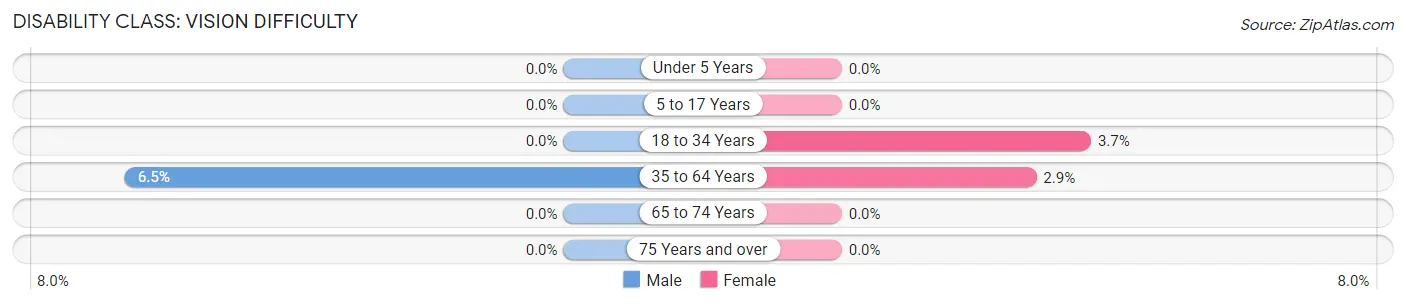
| Age Bracket | Male | Female |
| Under 5 Years | 0 (0.0%) | 0 (0.0%) |
| 5 to 17 Years | 0 (0.0%) | 0 (0.0%) |
| 18 to 34 Years | 0 (0.0%) | 10 (3.7%) |
| 35 to 64 Years | 34 (6.5%) | 18 (2.9%) |
| 65 to 74 Years | 0 (0.0%) | 0 (0.0%) |
| 75 Years and over | 0 (0.0%) | 0 (0.0%) |
Disability Class: Cognitive Difficulty
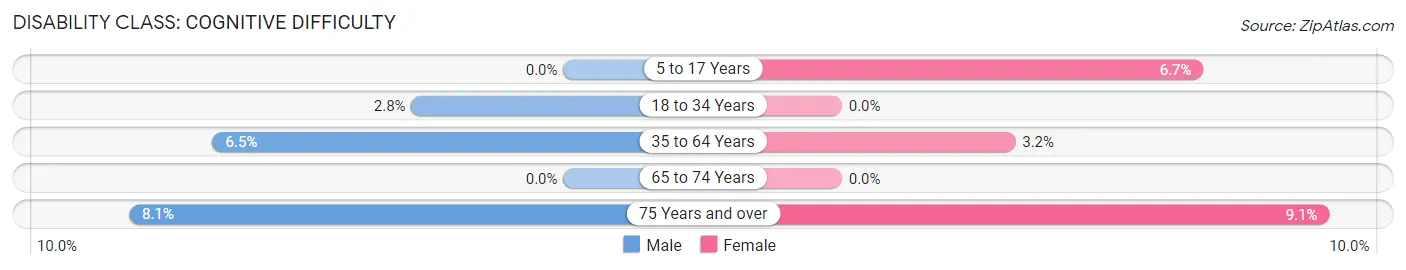
| Age Bracket | Male | Female |
| 5 to 17 Years | 0 (0.0%) | 10 (6.7%) |
| 18 to 34 Years | 20 (2.8%) | 0 (0.0%) |
| 35 to 64 Years | 34 (6.5%) | 20 (3.2%) |
| 65 to 74 Years | 0 (0.0%) | 0 (0.0%) |
| 75 Years and over | 20 (8.1%) | 20 (9.0%) |
Disability Class: Ambulatory Difficulty
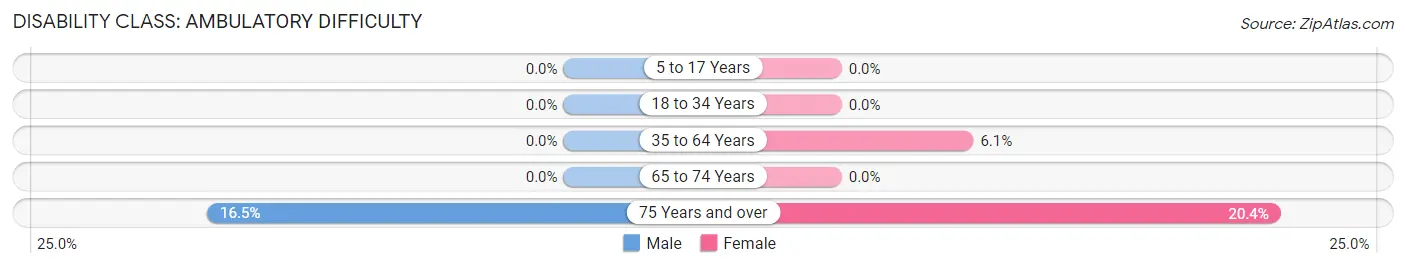
| Age Bracket | Male | Female |
| 5 to 17 Years | 0 (0.0%) | 0 (0.0%) |
| 18 to 34 Years | 0 (0.0%) | 0 (0.0%) |
| 35 to 64 Years | 0 (0.0%) | 38 (6.1%) |
| 65 to 74 Years | 0 (0.0%) | 0 (0.0%) |
| 75 Years and over | 41 (16.5%) | 45 (20.4%) |
Disability Class: Self-Care Difficulty
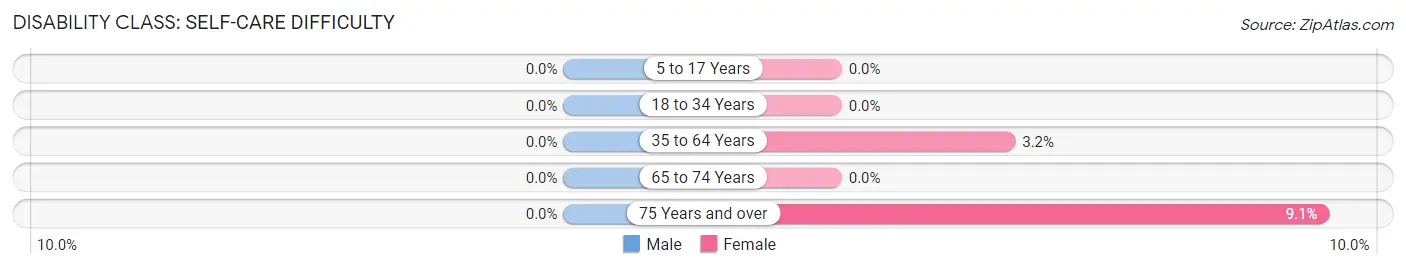
| Age Bracket | Male | Female |
| 5 to 17 Years | 0 (0.0%) | 0 (0.0%) |
| 18 to 34 Years | 0 (0.0%) | 0 (0.0%) |
| 35 to 64 Years | 0 (0.0%) | 20 (3.2%) |
| 65 to 74 Years | 0 (0.0%) | 0 (0.0%) |
| 75 Years and over | 0 (0.0%) | 20 (9.0%) |
Technology Access in Groveville
Computing Device Access in Groveville
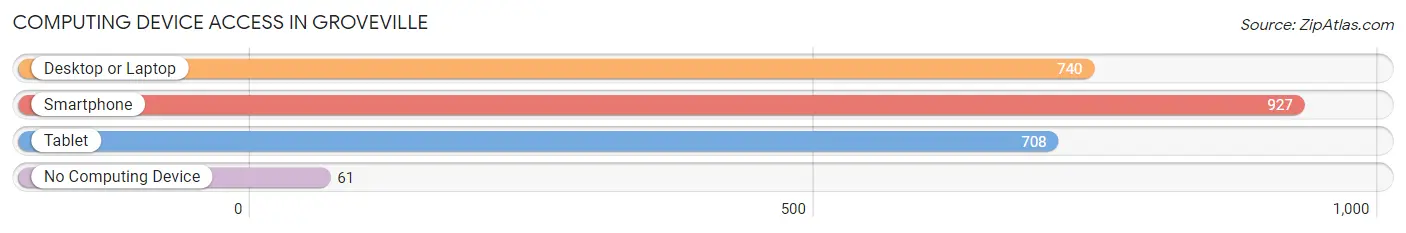
| Device Type | # Households | % Households |
| Desktop or Laptop | 740 | 73.3% |
| Smartphone | 927 | 91.9% |
| Tablet | 708 | 70.2% |
| No Computing Device | 61 | 6.0% |
| Total | 1,009 | 100.0% |
Internet Access in Groveville
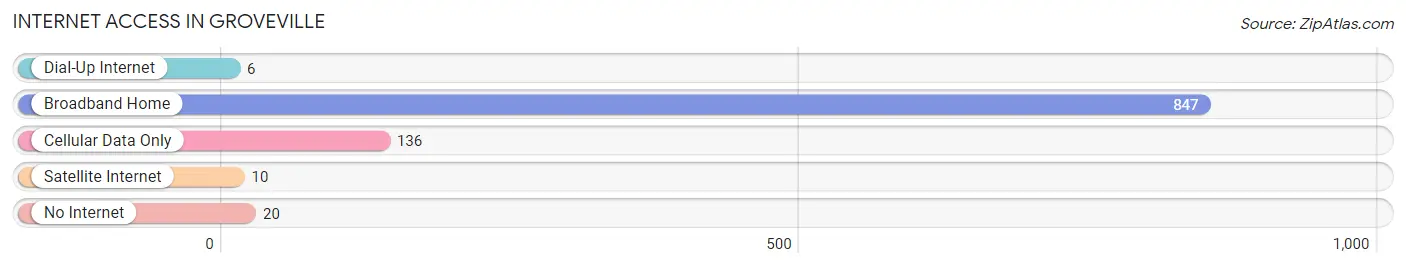
| Internet Type | # Households | % Households |
| Dial-Up Internet | 6 | 0.6% |
| Broadband Home | 847 | 83.9% |
| Cellular Data Only | 136 | 13.5% |
| Satellite Internet | 10 | 1.0% |
| No Internet | 20 | 2.0% |
| Total | 1,009 | 100.0% |
Groveville Summary
Groveville is a small unincorporated community located in the township of Eastampton, Burlington County, New Jersey. It is situated along the banks of the Rancocas Creek, approximately 8 miles northeast of Mount Holly. The population of Groveville was estimated to be 1,845 in the 2010 census.
History
The area that is now known as Groveville was originally inhabited by the Lenape Native Americans. The first European settlers arrived in the area in the late 1600s and early 1700s. The area was known as “Rancocas” and was part of the Province of West Jersey. In 1714, the area was officially established as Eastampton Township.
The area was primarily agricultural until the mid-1800s when the railroad was built through the area. This allowed for the development of industry and commerce in the area. The first post office in Groveville was established in 1867.
Geography
Groveville is located in the northern part of Eastampton Township, Burlington County, New Jersey. It is situated along the banks of the Rancocas Creek, approximately 8 miles northeast of Mount Holly. The total area of Groveville is 0.9 square miles, with 0.8 square miles of land and 0.1 square miles of water.
The climate in Groveville is classified as humid subtropical, with hot, humid summers and cold, wet winters. The average temperature in the summer is around 80°F and the average temperature in the winter is around 40°F.
Economy
The economy of Groveville is primarily based on agriculture and light industry. The area is home to several small businesses, including a few restaurants, a grocery store, and a few retail stores. The area also has a few small manufacturing plants.
The median household income in Groveville is $60,945, which is slightly higher than the national average. The unemployment rate in Groveville is 4.2%, which is lower than the national average.
Demographics
The population of Groveville was estimated to be 1,845 in the 2010 census. The racial makeup of Groveville is 87.3% White, 8.2% African American, 0.7% Asian, and 3.8% Hispanic or Latino.
The median age in Groveville is 40.3 years, which is slightly higher than the national average. The median household income in Groveville is $60,945, which is slightly higher than the national average. The poverty rate in Groveville is 8.3%, which is lower than the national average.
Conclusion
Groveville is a small unincorporated community located in the township of Eastampton, Burlington County, New Jersey. It is situated along the banks of the Rancocas Creek, approximately 8 miles northeast of Mount Holly. The population of Groveville was estimated to be 1,845 in the 2010 census. The economy of Groveville is primarily based on agriculture and light industry. The racial makeup of Groveville is 87.3% White, 8.2% African American, 0.7% Asian, and 3.8% Hispanic or Latino. The median age in Groveville is 40.3 years, which is slightly higher than the national average. The median household income in Groveville is $60,945, which is slightly higher than the national average. The poverty rate in Groveville is 8.3%, which is lower than the national average.
Common Questions
What is the Total Population of Groveville?
Total Population of Groveville is 3,335.
What is the Total Male Population of Groveville?
Total Male Population of Groveville is 1,852.
What is the Total Female Population of Groveville?
Total Female Population of Groveville is 1,483.
What is the Ratio of Males per 100 Females in Groveville?
There are 124.88 Males per 100 Females in Groveville.
What is the Ratio of Females per 100 Males in Groveville?
There are 80.08 Females per 100 Males in Groveville.
What is the Median Population Age in Groveville?
Median Population Age in Groveville is 37.7 Years.
What is the Average Family Size in Groveville
Average Family Size in Groveville is 3.9 People.
What is the Average Household Size in Groveville
Average Household Size in Groveville is 3.3 People.
What is Per Capita Income in Groveville?
Per Capita income in Groveville is $37,762.
What is the Median Family Income in Groveville?
Median Family Income in Groveville is $137,446.
What is the Median Household income in Groveville?
Median Household Income in Groveville is $117,617.
What is Income or Wage Gap in Groveville?
Income or Wage Gap in Groveville is 28.3%.
Women in Groveville earn 71.7 cents for every dollar earned by a man.
What is Inequality or Gini Index in Groveville?
Inequality or Gini Index in Groveville is 0.40.
How Large is the Labor Force in Groveville?
There are 1,893 People in the Labor Forcein in Groveville.
What is the Percentage of People in the Labor Force in Groveville?
64.6% of People are in the Labor Force in Groveville.
What is the Unemployment Rate in Groveville?
Unemployment Rate in Groveville is 11.9%.