North Cape May, NJ
North Cape May Map
North Cape May Overview
3,832
TOTAL POPULATION
1,772
MALE POPULATION
2,060
FEMALE POPULATION
86.02
MALES / 100 FEMALES
116.25
FEMALES / 100 MALES
55.2
MEDIAN AGE
2.7
AVG FAMILY SIZE
2.0
AVG HOUSEHOLD SIZE
$42,462
PER CAPITA INCOME
$92,128
AVG FAMILY INCOME
$71,389
AVG HOUSEHOLD INCOME
22.6%
WAGE / INCOME GAP [ % ]
77.4¢/ $1
WAGE / INCOME GAP [ $ ]
0.38
INEQUALITY / GINI INDEX
1,860
LABOR FORCE [ PEOPLE ]
56.2%
PERCENT IN LABOR FORCE
4.9%
UNEMPLOYMENT RATE
North Cape May Area Codes
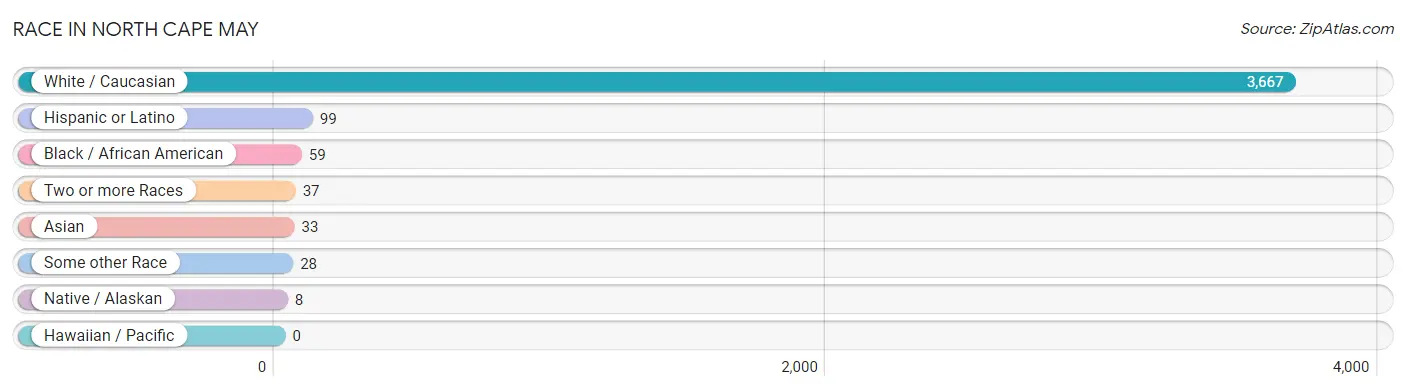
Race in North Cape May
The most populous races in North Cape May are White / Caucasian (3,667 | 95.7%), Hispanic or Latino (99 | 2.6%), and Black / African American (59 | 1.5%).
| Race | # Population | % Population |
| Asian | 33 | 0.9% |
| Black / African American | 59 | 1.5% |
| Hawaiian / Pacific | 0 | 0.0% |
| Hispanic or Latino | 99 | 2.6% |
| Native / Alaskan | 8 | 0.2% |
| White / Caucasian | 3,667 | 95.7% |
| Two or more Races | 37 | 1.0% |
| Some other Race | 28 | 0.7% |
| Total | 3,832 | 100.0% |
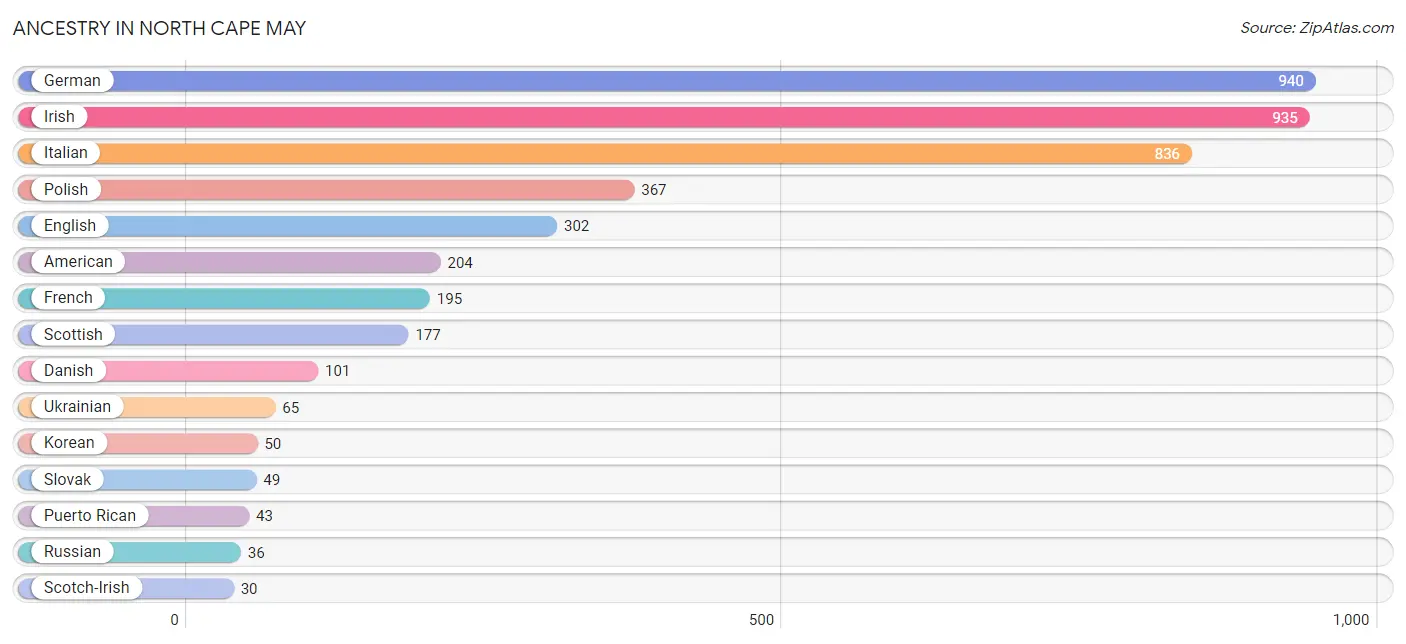
Ancestry in North Cape May
The most populous ancestries reported in North Cape May are German (940 | 24.5%), Irish (935 | 24.4%), Italian (836 | 21.8%), Polish (367 | 9.6%), and English (302 | 7.9%), together accounting for 88.2% of all North Cape May residents.
| Ancestry | # Population | % Population |
| American | 204 | 5.3% |
| Arab | 16 | 0.4% |
| British | 10 | 0.3% |
| Canadian | 17 | 0.4% |
| Central American | 27 | 0.7% |
| Danish | 101 | 2.6% |
| Dutch | 9 | 0.2% |
| English | 302 | 7.9% |
| European | 20 | 0.5% |
| French | 195 | 5.1% |
| German | 940 | 24.5% |
| Greek | 19 | 0.5% |
| Honduran | 27 | 0.7% |
| Hungarian | 4 | 0.1% |
| Irish | 935 | 24.4% |
| Iroquois | 9 | 0.2% |
| Italian | 836 | 21.8% |
| Korean | 50 | 1.3% |
| Lebanese | 16 | 0.4% |
| Lithuanian | 10 | 0.3% |
| Mexican | 29 | 0.8% |
| Pennsylvania German | 21 | 0.5% |
| Polish | 367 | 9.6% |
| Portuguese | 25 | 0.6% |
| Pueblo | 8 | 0.2% |
| Puerto Rican | 43 | 1.1% |
| Russian | 36 | 0.9% |
| Scandinavian | 21 | 0.5% |
| Scotch-Irish | 30 | 0.8% |
| Scottish | 177 | 4.6% |
| Slovak | 49 | 1.3% |
| Swedish | 7 | 0.2% |
| Swiss | 13 | 0.3% |
| Ukrainian | 65 | 1.7% |
| Welsh | 9 | 0.2% | View All 35 Rows |
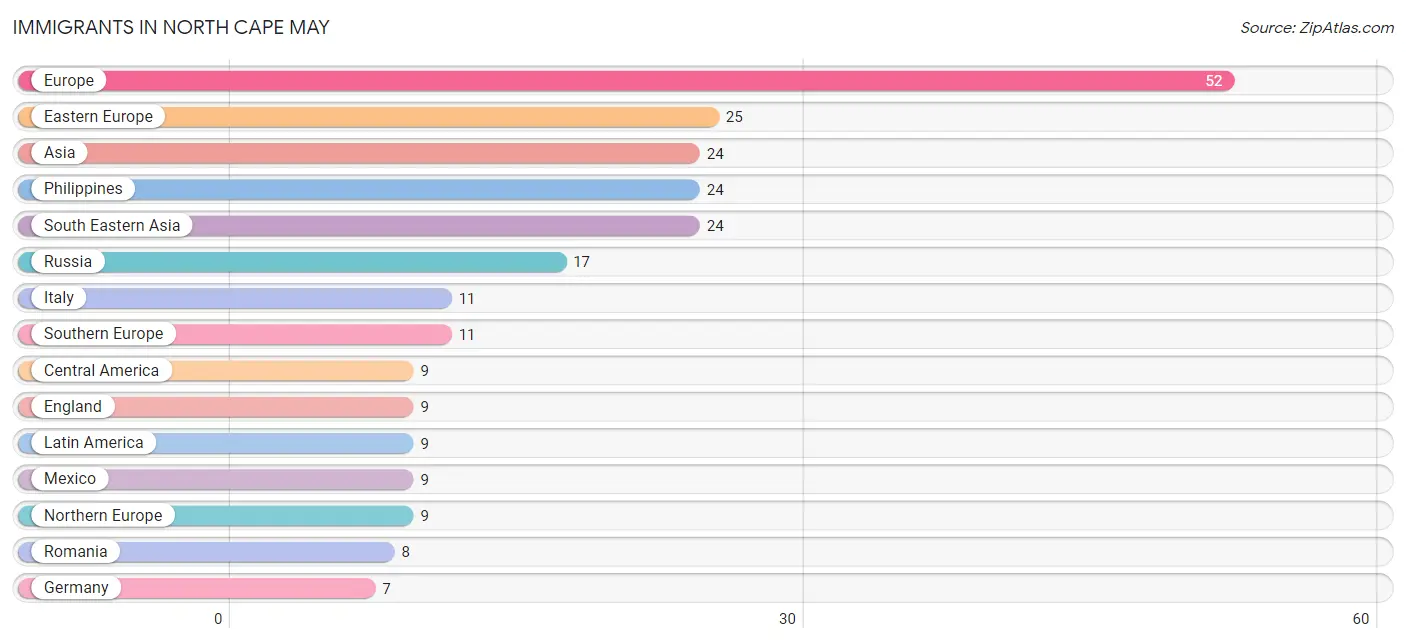
Immigrants in North Cape May
The most numerous immigrant groups reported in North Cape May came from Europe (52 | 1.4%), Eastern Europe (25 | 0.6%), Asia (24 | 0.6%), Philippines (24 | 0.6%), and South Eastern Asia (24 | 0.6%), together accounting for 3.9% of all North Cape May residents.
| Immigration Origin | # Population | % Population |
| Asia | 24 | 0.6% |
| Central America | 9 | 0.2% |
| Eastern Europe | 25 | 0.6% |
| England | 9 | 0.2% |
| Europe | 52 | 1.4% |
| Germany | 7 | 0.2% |
| Italy | 11 | 0.3% |
| Latin America | 9 | 0.2% |
| Mexico | 9 | 0.2% |
| Northern Europe | 9 | 0.2% |
| Philippines | 24 | 0.6% |
| Romania | 8 | 0.2% |
| Russia | 17 | 0.4% |
| South Eastern Asia | 24 | 0.6% |
| Southern Europe | 11 | 0.3% |
| Western Europe | 7 | 0.2% | View All 16 Rows |
Sex and Age in North Cape May
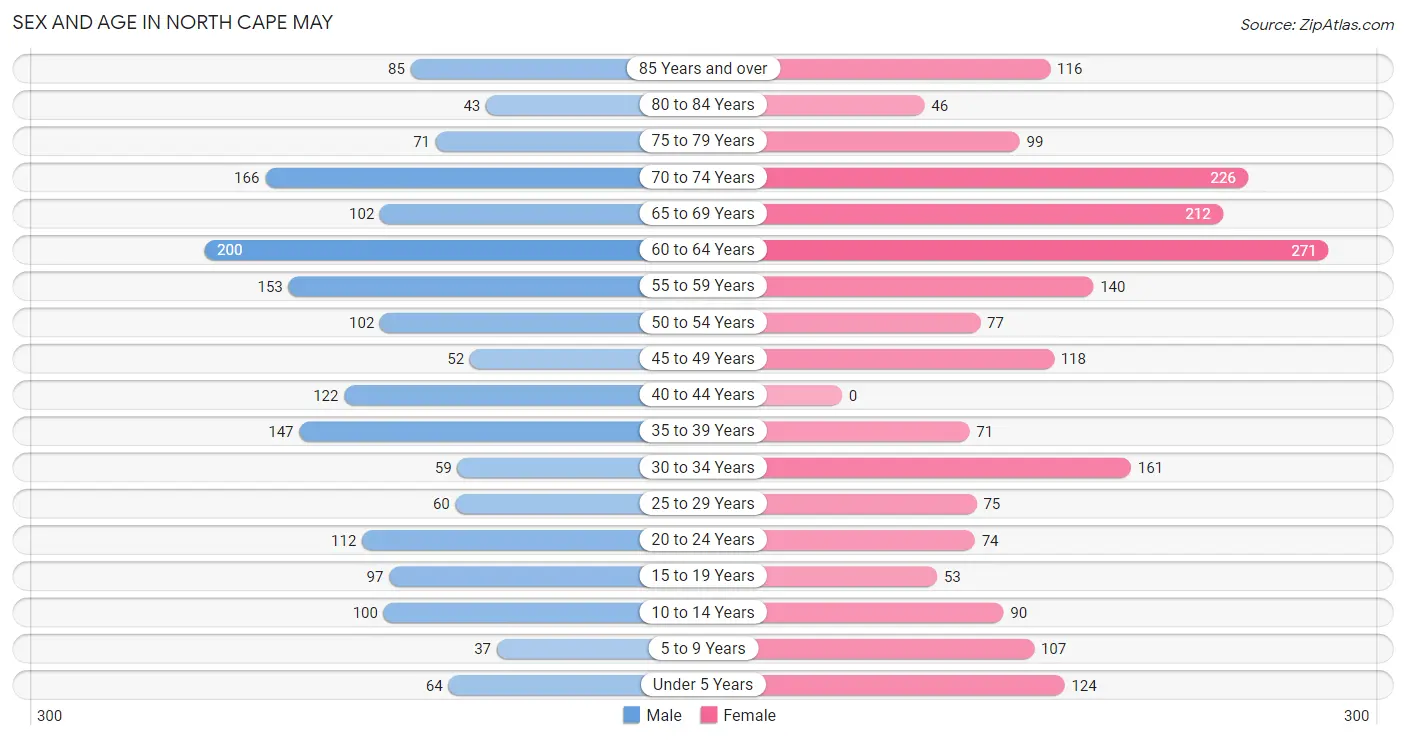
Sex and Age in North Cape May
The most populous age groups in North Cape May are 60 to 64 Years (200 | 11.3%) for men and 60 to 64 Years (271 | 13.2%) for women.
| Age Bracket | Male | Female |
| Under 5 Years | 64 (3.6%) | 124 (6.0%) |
| 5 to 9 Years | 37 (2.1%) | 107 (5.2%) |
| 10 to 14 Years | 100 (5.6%) | 90 (4.4%) |
| 15 to 19 Years | 97 (5.5%) | 53 (2.6%) |
| 20 to 24 Years | 112 (6.3%) | 74 (3.6%) |
| 25 to 29 Years | 60 (3.4%) | 75 (3.6%) |
| 30 to 34 Years | 59 (3.3%) | 161 (7.8%) |
| 35 to 39 Years | 147 (8.3%) | 71 (3.5%) |
| 40 to 44 Years | 122 (6.9%) | 0 (0.0%) |
| 45 to 49 Years | 52 (2.9%) | 118 (5.7%) |
| 50 to 54 Years | 102 (5.8%) | 77 (3.7%) |
| 55 to 59 Years | 153 (8.6%) | 140 (6.8%) |
| 60 to 64 Years | 200 (11.3%) | 271 (13.2%) |
| 65 to 69 Years | 102 (5.8%) | 212 (10.3%) |
| 70 to 74 Years | 166 (9.4%) | 226 (11.0%) |
| 75 to 79 Years | 71 (4.0%) | 99 (4.8%) |
| 80 to 84 Years | 43 (2.4%) | 46 (2.2%) |
| 85 Years and over | 85 (4.8%) | 116 (5.6%) |
| Total | 1,772 (100.0%) | 2,060 (100.0%) |
Families and Households in North Cape May
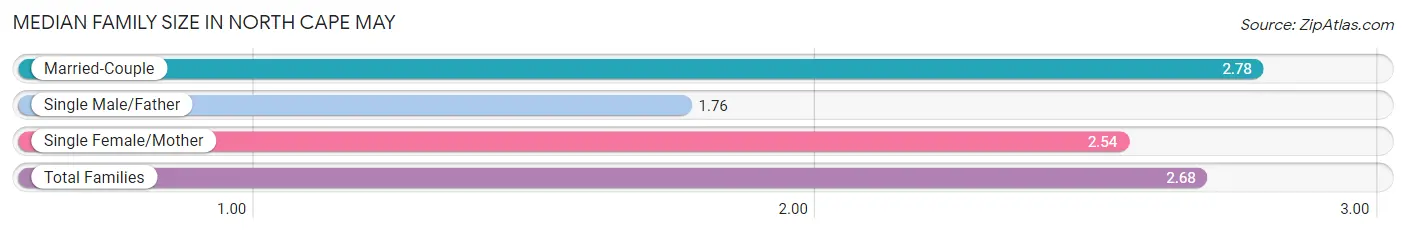
Median Family Size in North Cape May
The median family size in North Cape May is 2.68 persons per family, with married-couple families (795 | 73.1%) accounting for the largest median family size of 2.78 persons per family. On the other hand, single male/father families (49 | 4.5%) represent the smallest median family size with 1.76 persons per family.
| Family Type | # Families | Family Size |
| Married-Couple | 795 (73.1%) | 2.78 |
| Single Male/Father | 49 (4.5%) | 1.76 |
| Single Female/Mother | 243 (22.4%) | 2.54 |
| Total Families | 1,087 (100.0%) | 2.68 |
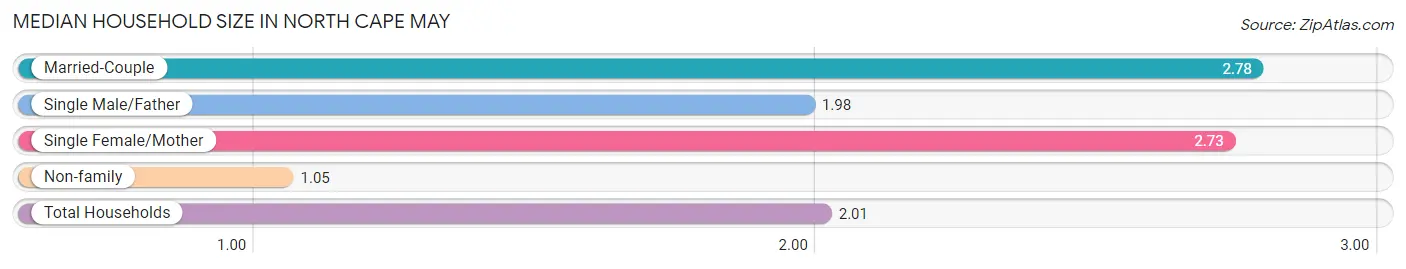
Median Household Size in North Cape May
The median household size in North Cape May is 2.01 persons per household, with married-couple households (795 | 41.7%) accounting for the largest median household size of 2.78 persons per household. non-family households (821 | 43.0%) represent the smallest median household size with 1.05 persons per household.
| Household Type | # Households | Household Size |
| Married-Couple | 795 (41.7%) | 2.78 |
| Single Male/Father | 49 (2.6%) | 1.98 |
| Single Female/Mother | 243 (12.7%) | 2.73 |
| Non-family | 821 (43.0%) | 1.05 |
| Total Households | 1,908 (100.0%) | 2.01 |
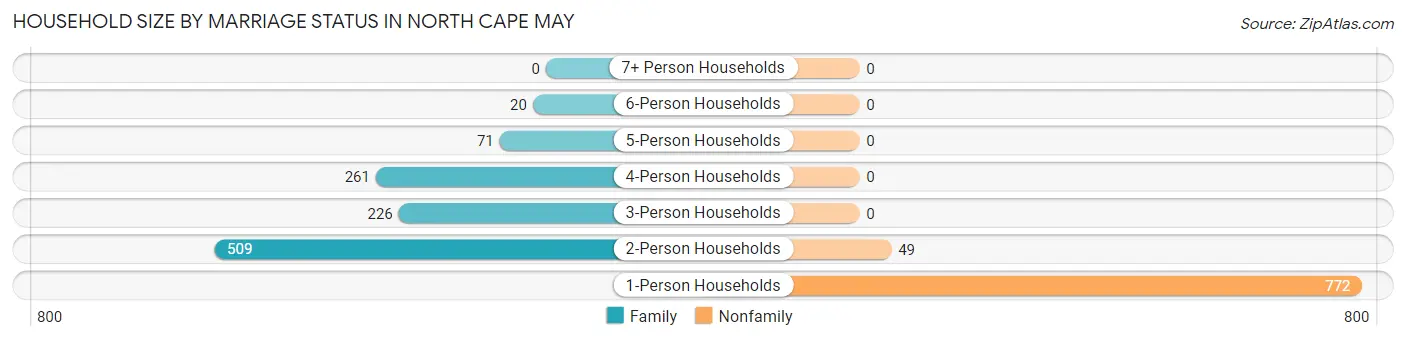
Household Size by Marriage Status in North Cape May
Out of a total of 1,908 households in North Cape May, 1,087 (57.0%) are family households, while 821 (43.0%) are nonfamily households. The most numerous type of family households are 2-person households, comprising 509, and the most common type of nonfamily households are 1-person households, comprising 772.
| Household Size | Family Households | Nonfamily Households |
| 1-Person Households | - | 772 (40.5%) |
| 2-Person Households | 509 (26.7%) | 49 (2.6%) |
| 3-Person Households | 226 (11.8%) | 0 (0.0%) |
| 4-Person Households | 261 (13.7%) | 0 (0.0%) |
| 5-Person Households | 71 (3.7%) | 0 (0.0%) |
| 6-Person Households | 20 (1.1%) | 0 (0.0%) |
| 7+ Person Households | 0 (0.0%) | 0 (0.0%) |
| Total | 1,087 (57.0%) | 821 (43.0%) |
Female Fertility in North Cape May
Fertility by Age in North Cape May
Average fertility rate in North Cape May is 175.0 births per 1,000 women. Women in the age bracket of 35 to 50 years have the highest fertility rate with 234.0 births per 1,000 women. Women in the age bracket of 20 to 34 years acount for 50.5% of all women with births.
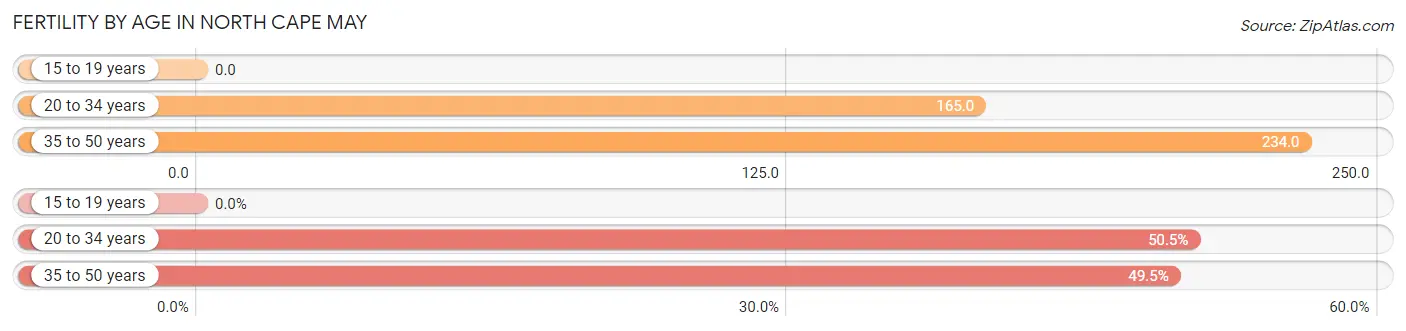
| Age Bracket | Women with Births | Births / 1,000 Women |
| 15 to 19 years | 0 (0.0%) | 0.0 |
| 20 to 34 years | 51 (50.5%) | 165.0 |
| 35 to 50 years | 50 (49.5%) | 234.0 |
| Total | 101 (100.0%) | 175.0 |
Fertility by Age by Marriage Status in North Cape May
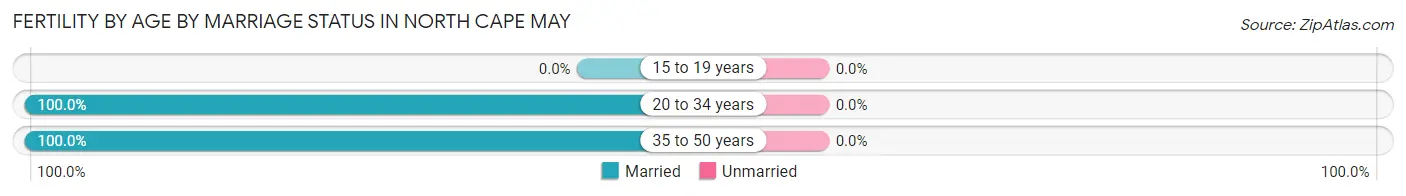
| Age Bracket | Married | Unmarried |
| 15 to 19 years | 0 (0.0%) | 0 (0.0%) |
| 20 to 34 years | 51 (100.0%) | 0 (0.0%) |
| 35 to 50 years | 50 (100.0%) | 0 (0.0%) |
| Total | 101 (100.0%) | 0 (0.0%) |
Fertility by Education in North Cape May
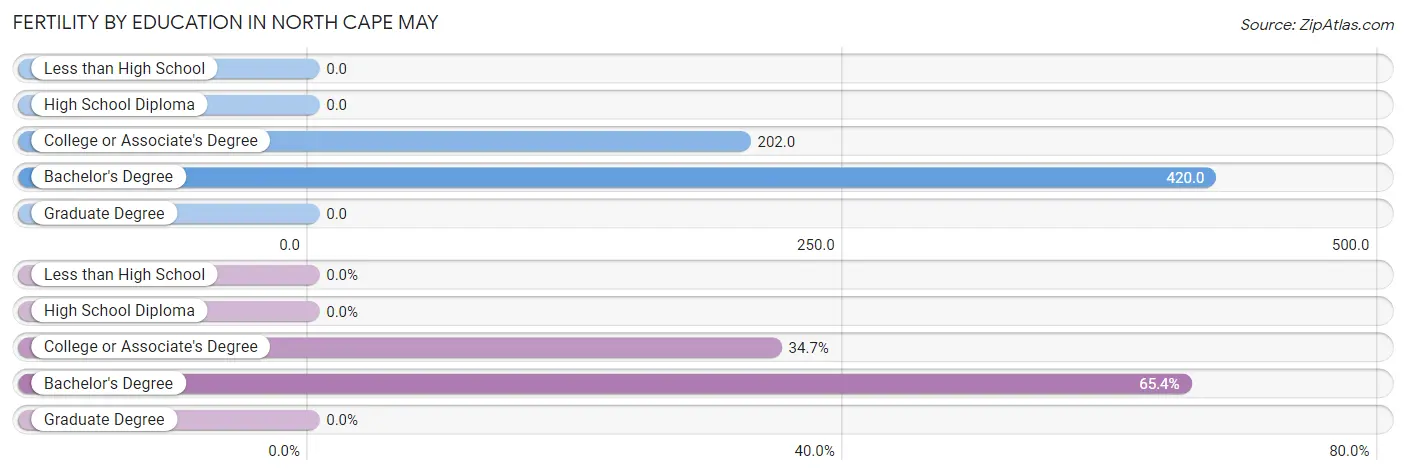
| Educational Attainment | Women with Births | Births / 1,000 Women |
| Less than High School | 0 (0.0%) | 0.0 |
| High School Diploma | 0 (0.0%) | 0.0 |
| College or Associate's Degree | 35 (34.6%) | 202.0 |
| Bachelor's Degree | 66 (65.3%) | 420.0 |
| Graduate Degree | 0 (0.0%) | 0.0 |
| Total | 101 (100.0%) | 175.0 |
Fertility by Education by Marriage Status in North Cape May
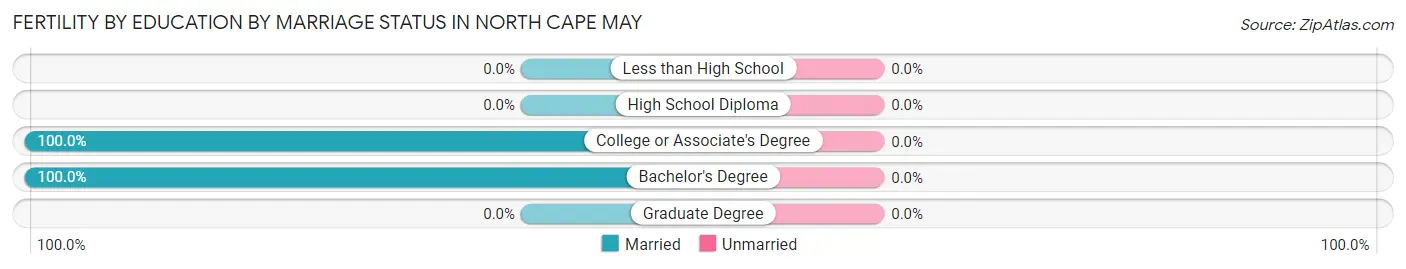
| Educational Attainment | Married | Unmarried |
| Less than High School | 0 (0.0%) | 0 (0.0%) |
| High School Diploma | 0 (0.0%) | 0 (0.0%) |
| College or Associate's Degree | 35 (100.0%) | 0 (0.0%) |
| Bachelor's Degree | 66 (100.0%) | 0 (0.0%) |
| Graduate Degree | 0 (0.0%) | 0 (0.0%) |
| Total | 101 (100.0%) | 0 (0.0%) |
Income in North Cape May
Income Overview in North Cape May
Per Capita Income in North Cape May is $42,462, while median incomes of families and households are $92,128 and $71,389 respectively.
| Characteristic | Number | Measure |
| Per Capita Income | 3,832 | $42,462 |
| Median Family Income | 1,087 | $92,128 |
| Mean Family Income | 1,087 | $106,315 |
| Median Household Income | 1,908 | $71,389 |
| Mean Household Income | 1,908 | $90,472 |
| Income Deficit | 1,087 | $0 |
| Wage / Income Gap (%) | 3,832 | 22.60% |
| Wage / Income Gap ($) | 3,832 | 77.40¢ per $1 |
| Gini / Inequality Index | 3,832 | 0.38 |
Earnings by Sex in North Cape May
Average Earnings in North Cape May are $43,563, $49,430 for men and $38,260 for women, a difference of 22.6%.
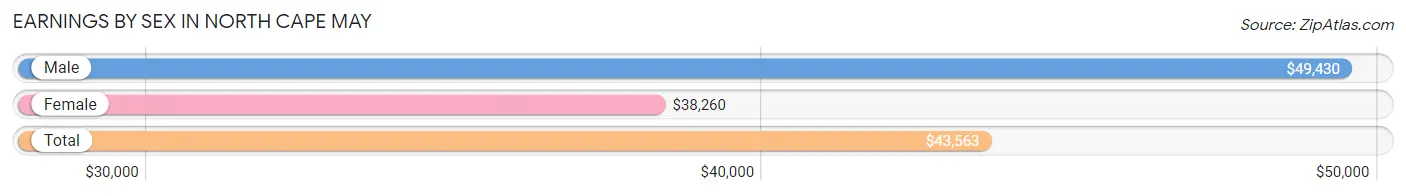
| Sex | Number | Average Earnings |
| Male | 980 (49.9%) | $49,430 |
| Female | 985 (50.1%) | $38,260 |
| Total | 1,965 (100.0%) | $43,563 |
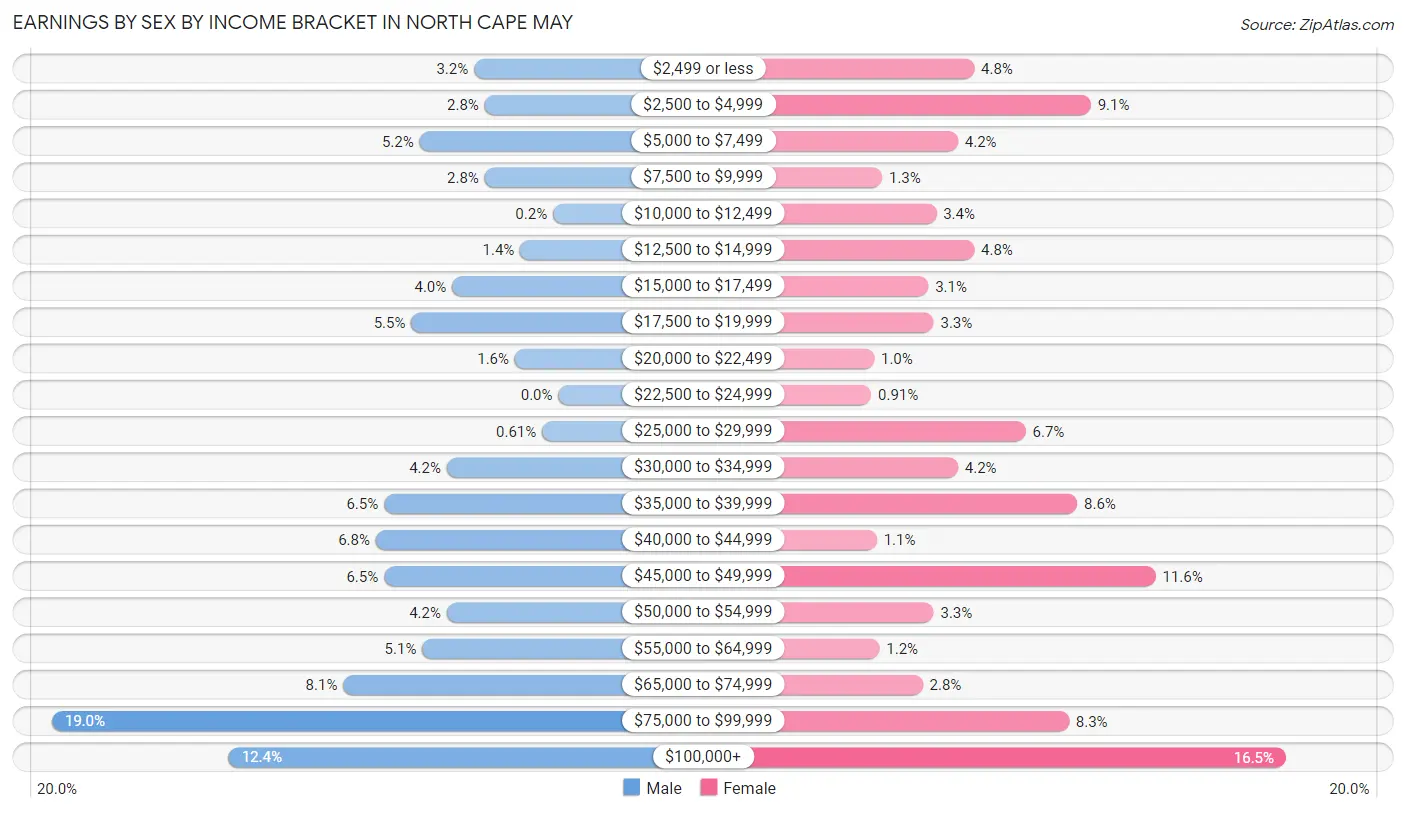
Earnings by Sex by Income Bracket in North Cape May
The most common earnings brackets in North Cape May are $75,000 to $99,999 for men (186 | 19.0%) and $100,000+ for women (162 | 16.5%).
| Income | Male | Female |
| $2,499 or less | 31 (3.2%) | 47 (4.8%) |
| $2,500 to $4,999 | 27 (2.8%) | 90 (9.1%) |
| $5,000 to $7,499 | 51 (5.2%) | 41 (4.2%) |
| $7,500 to $9,999 | 27 (2.8%) | 13 (1.3%) |
| $10,000 to $12,499 | 2 (0.2%) | 33 (3.4%) |
| $12,500 to $14,999 | 14 (1.4%) | 47 (4.8%) |
| $15,000 to $17,499 | 39 (4.0%) | 30 (3.0%) |
| $17,500 to $19,999 | 54 (5.5%) | 32 (3.3%) |
| $20,000 to $22,499 | 16 (1.6%) | 10 (1.0%) |
| $22,500 to $24,999 | 0 (0.0%) | 9 (0.9%) |
| $25,000 to $29,999 | 6 (0.6%) | 66 (6.7%) |
| $30,000 to $34,999 | 41 (4.2%) | 41 (4.2%) |
| $35,000 to $39,999 | 64 (6.5%) | 85 (8.6%) |
| $40,000 to $44,999 | 67 (6.8%) | 11 (1.1%) |
| $45,000 to $49,999 | 64 (6.5%) | 114 (11.6%) |
| $50,000 to $54,999 | 41 (4.2%) | 32 (3.3%) |
| $55,000 to $64,999 | 50 (5.1%) | 12 (1.2%) |
| $65,000 to $74,999 | 79 (8.1%) | 28 (2.8%) |
| $75,000 to $99,999 | 186 (19.0%) | 82 (8.3%) |
| $100,000+ | 121 (12.3%) | 162 (16.5%) |
| Total | 980 (100.0%) | 985 (100.0%) |
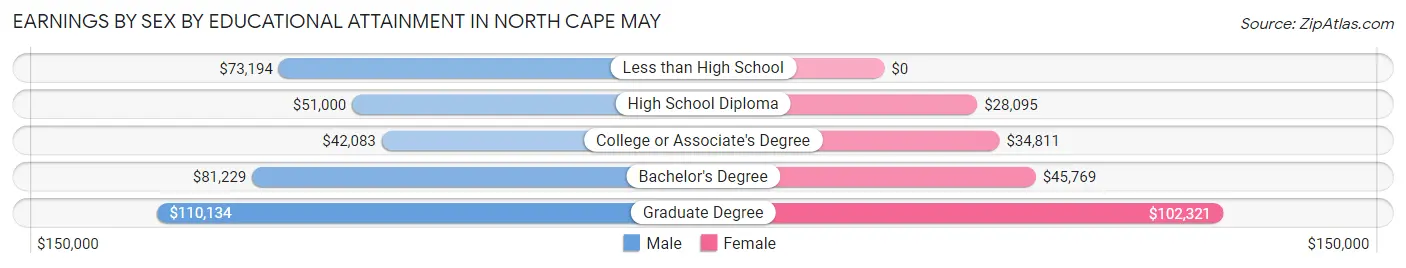
Earnings by Sex by Educational Attainment in North Cape May
Average earnings in North Cape May are $58,575 for men and $39,105 for women, a difference of 33.2%. Men with an educational attainment of graduate degree enjoy the highest average annual earnings of $110,134, while those with college or associate's degree education earn the least with $42,083. Women with an educational attainment of graduate degree earn the most with the average annual earnings of $102,321, while those with high school diploma education have the smallest earnings of $28,095.
| Educational Attainment | Male Income | Female Income |
| Less than High School | $73,194 | $0 |
| High School Diploma | $51,000 | $28,095 |
| College or Associate's Degree | $42,083 | $34,811 |
| Bachelor's Degree | $81,229 | $45,769 |
| Graduate Degree | $110,134 | $102,321 |
| Total | $58,575 | $39,105 |
Family Income in North Cape May
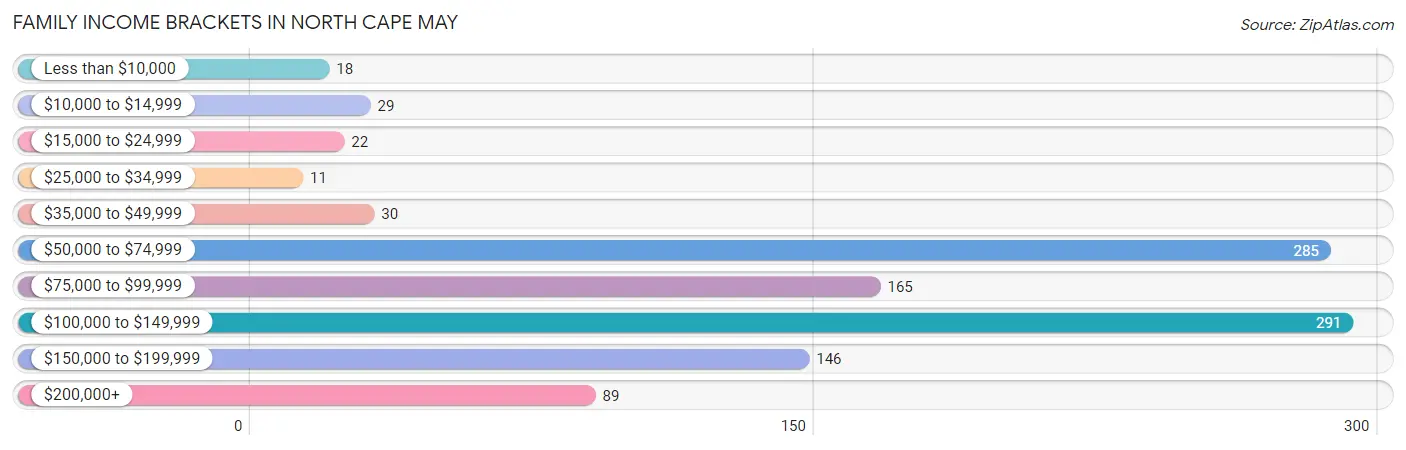
Family Income Brackets in North Cape May
According to the North Cape May family income data, there are 291 families falling into the $100,000 to $149,999 income range, which is the most common income bracket and makes up 26.8% of all families. Conversely, the $25,000 to $34,999 income bracket is the least frequent group with only 11 families (1.0%) belonging to this category.
| Income Bracket | # Families | % Families |
| Less than $10,000 | 18 | 1.7% |
| $10,000 to $14,999 | 29 | 2.7% |
| $15,000 to $24,999 | 22 | 2.0% |
| $25,000 to $34,999 | 11 | 1.0% |
| $35,000 to $49,999 | 30 | 2.8% |
| $50,000 to $74,999 | 285 | 26.2% |
| $75,000 to $99,999 | 165 | 15.2% |
| $100,000 to $149,999 | 291 | 26.8% |
| $150,000 to $199,999 | 146 | 13.4% |
| $200,000+ | 89 | 8.2% |
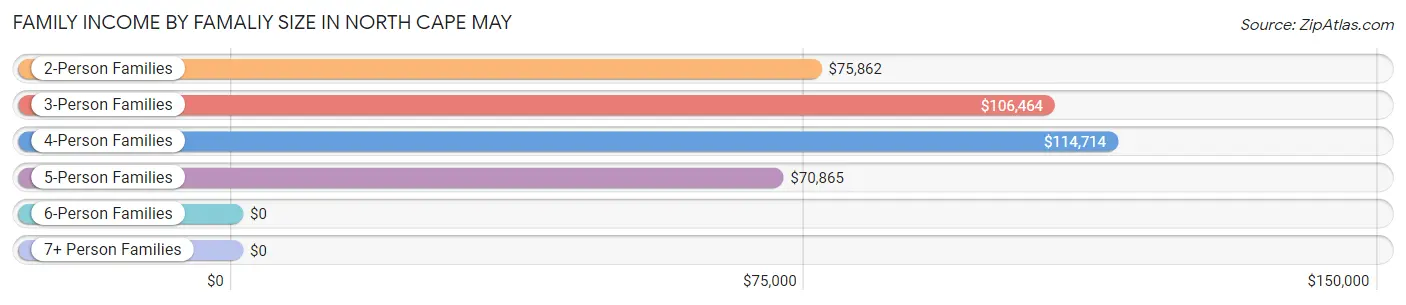
Family Income by Famaliy Size in North Cape May
4-person families (275 | 25.3%) account for the highest median family income in North Cape May with $114,714 per family, while 2-person families (518 | 47.6%) have the highest median income of $37,931 per family member.
| Income Bracket | # Families | Median Income |
| 2-Person Families | 518 (47.6%) | $75,862 |
| 3-Person Families | 227 (20.9%) | $106,464 |
| 4-Person Families | 275 (25.3%) | $114,714 |
| 5-Person Families | 59 (5.4%) | $70,865 |
| 6-Person Families | 8 (0.7%) | $0 |
| 7+ Person Families | 0 (0.0%) | $0 |
| Total | 1,087 (100.0%) | $92,128 |
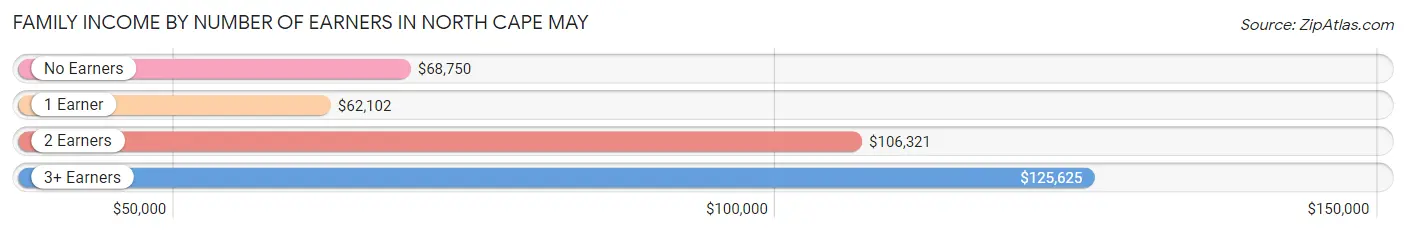
Family Income by Number of Earners in North Cape May
The median family income in North Cape May is $92,128, with families comprising 3+ earners (205) having the highest median family income of $125,625, while families with 1 earner (235) have the lowest median family income of $62,102, accounting for 18.9% and 21.6% of families, respectively.
| Number of Earners | # Families | Median Income |
| No Earners | 230 (21.2%) | $68,750 |
| 1 Earner | 235 (21.6%) | $62,102 |
| 2 Earners | 417 (38.4%) | $106,321 |
| 3+ Earners | 205 (18.9%) | $125,625 |
| Total | 1,087 (100.0%) | $92,128 |
Household Income in North Cape May
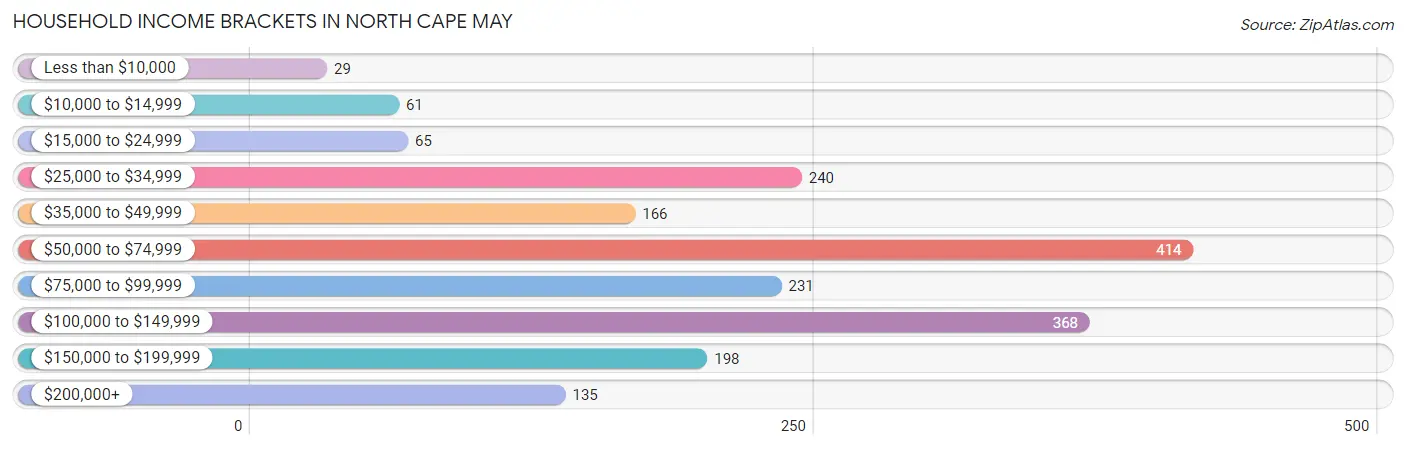
Household Income Brackets in North Cape May
With 414 households falling in the category, the $50,000 to $74,999 income range is the most frequent in North Cape May, accounting for 21.7% of all households. In contrast, only 29 households (1.5%) fall into the less than $10,000 income bracket, making it the least populous group.
| Income Bracket | # Households | % Households |
| Less than $10,000 | 29 | 1.5% |
| $10,000 to $14,999 | 61 | 3.2% |
| $15,000 to $24,999 | 65 | 3.4% |
| $25,000 to $34,999 | 240 | 12.6% |
| $35,000 to $49,999 | 166 | 8.7% |
| $50,000 to $74,999 | 414 | 21.7% |
| $75,000 to $99,999 | 231 | 12.1% |
| $100,000 to $149,999 | 368 | 19.3% |
| $150,000 to $199,999 | 198 | 10.4% |
| $200,000+ | 135 | 7.1% |
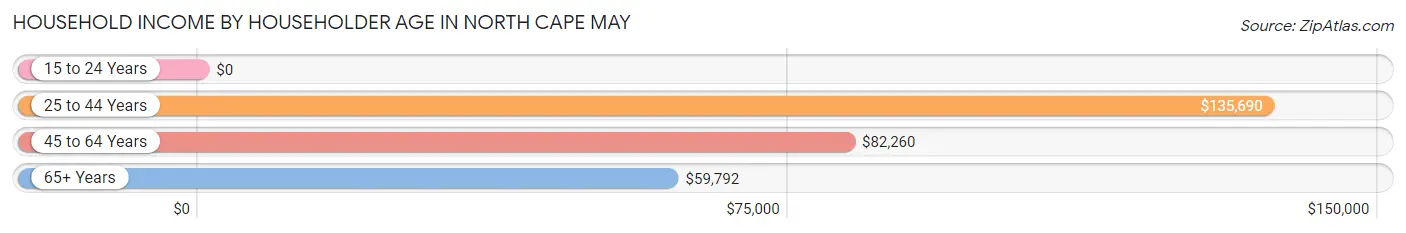
Household Income by Householder Age in North Cape May
The median household income in North Cape May is $71,389, with the highest median household income of $135,690 found in the 25 to 44 years age bracket for the primary householder. A total of 356 households (18.7%) fall into this category. Meanwhile, the 15 to 24 years age bracket for the primary householder has the lowest median household income of $0, with 35 households (1.8%) in this group.
| Income Bracket | # Households | Median Income |
| 15 to 24 Years | 35 (1.8%) | $0 |
| 25 to 44 Years | 356 (18.7%) | $135,690 |
| 45 to 64 Years | 649 (34.0%) | $82,260 |
| 65+ Years | 868 (45.5%) | $59,792 |
| Total | 1,908 (100.0%) | $71,389 |
Poverty in North Cape May
Income Below Poverty by Sex and Age in North Cape May
With 9.3% poverty level for males and 4.1% for females among the residents of North Cape May, under 5 year old males and 12 to 14 year old females are the most vulnerable to poverty, with 31 males (48.4%) and 26 females (28.9%) in their respective age groups living below the poverty level.
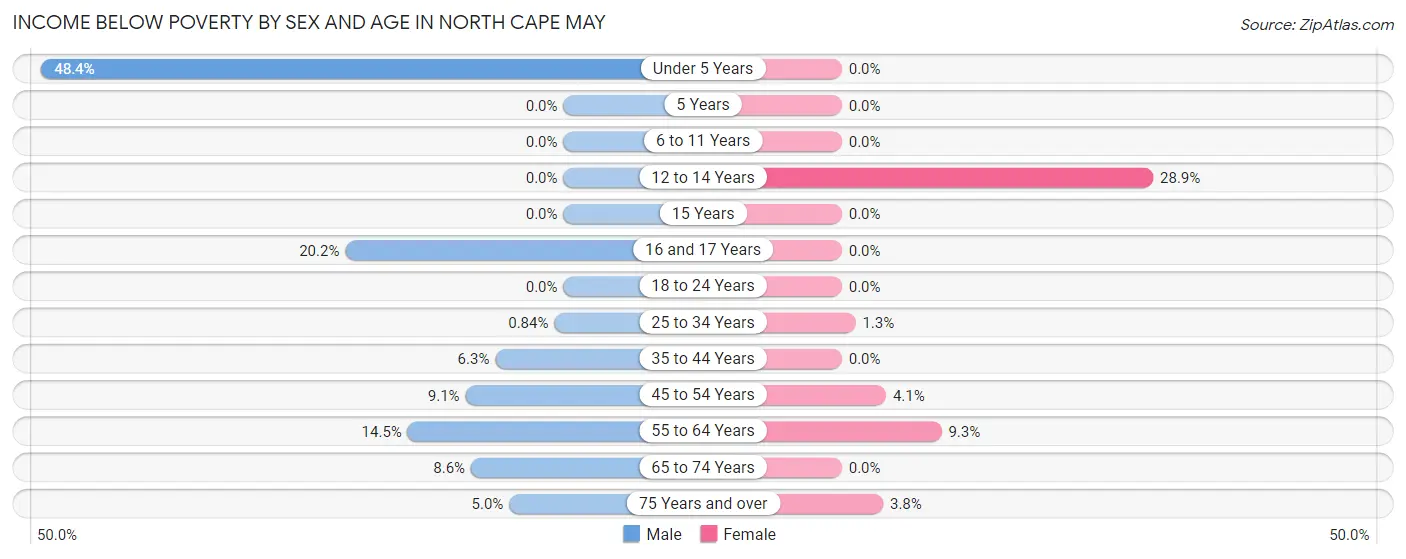
| Age Bracket | Male | Female |
| Under 5 Years | 31 (48.4%) | 0 (0.0%) |
| 5 Years | 0 (0.0%) | 0 (0.0%) |
| 6 to 11 Years | 0 (0.0%) | 0 (0.0%) |
| 12 to 14 Years | 0 (0.0%) | 26 (28.9%) |
| 15 Years | 0 (0.0%) | 0 (0.0%) |
| 16 and 17 Years | 17 (20.2%) | 0 (0.0%) |
| 18 to 24 Years | 0 (0.0%) | 0 (0.0%) |
| 25 to 34 Years | 1 (0.8%) | 3 (1.3%) |
| 35 to 44 Years | 17 (6.3%) | 0 (0.0%) |
| 45 to 54 Years | 14 (9.1%) | 8 (4.1%) |
| 55 to 64 Years | 51 (14.4%) | 38 (9.2%) |
| 65 to 74 Years | 23 (8.6%) | 0 (0.0%) |
| 75 Years and over | 10 (5.0%) | 10 (3.8%) |
| Total | 164 (9.3%) | 85 (4.1%) |
Income Above Poverty by Sex and Age in North Cape May
According to the poverty statistics in North Cape May, males aged 6 to 11 years and females aged under 5 years are the age groups that are most secure financially, with 100.0% of males and 100.0% of females in these age groups living above the poverty line.
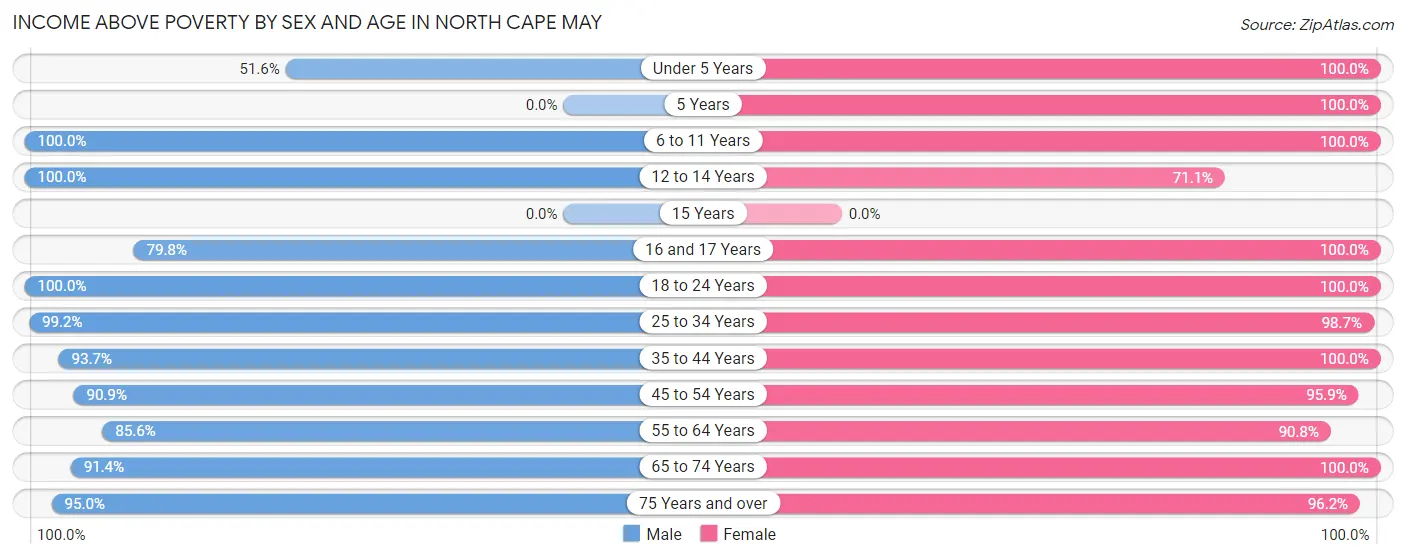
| Age Bracket | Male | Female |
| Under 5 Years | 33 (51.6%) | 124 (100.0%) |
| 5 Years | 0 (0.0%) | 11 (100.0%) |
| 6 to 11 Years | 84 (100.0%) | 96 (100.0%) |
| 12 to 14 Years | 53 (100.0%) | 64 (71.1%) |
| 15 Years | 0 (0.0%) | 0 (0.0%) |
| 16 and 17 Years | 67 (79.8%) | 35 (100.0%) |
| 18 to 24 Years | 125 (100.0%) | 92 (100.0%) |
| 25 to 34 Years | 118 (99.2%) | 233 (98.7%) |
| 35 to 44 Years | 252 (93.7%) | 71 (100.0%) |
| 45 to 54 Years | 140 (90.9%) | 187 (95.9%) |
| 55 to 64 Years | 302 (85.6%) | 373 (90.7%) |
| 65 to 74 Years | 245 (91.4%) | 438 (100.0%) |
| 75 Years and over | 189 (95.0%) | 251 (96.2%) |
| Total | 1,608 (90.7%) | 1,975 (95.9%) |
Income Below Poverty Among Married-Couple Families in North Cape May
The poverty statistics for married-couple families in North Cape May show that 6.4% or 51 of the total 795 families live below the poverty line. Families with 3 or 4 children have the highest poverty rate of 56.0%, comprising of 14 families. On the other hand, families with no children have the lowest poverty rate of 4.0%, which includes 19 families.
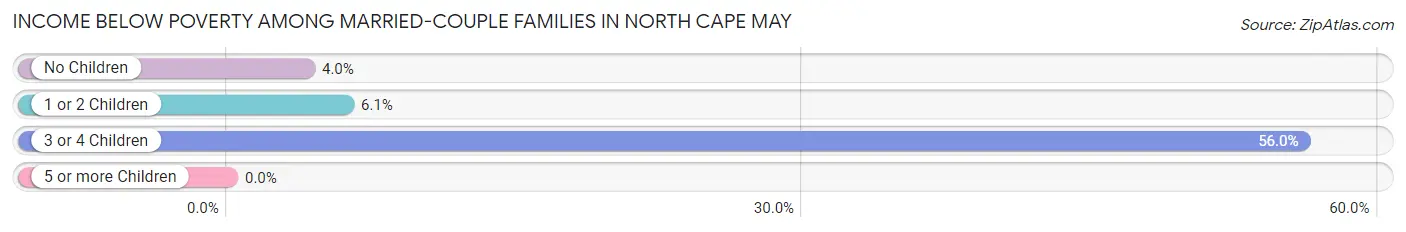
| Children | Above Poverty | Below Poverty |
| No Children | 454 (96.0%) | 19 (4.0%) |
| 1 or 2 Children | 279 (93.9%) | 18 (6.1%) |
| 3 or 4 Children | 11 (44.0%) | 14 (56.0%) |
| 5 or more Children | 0 (0.0%) | 0 (0.0%) |
| Total | 744 (93.6%) | 51 (6.4%) |
Income Below Poverty Among Single-Parent Households in North Cape May
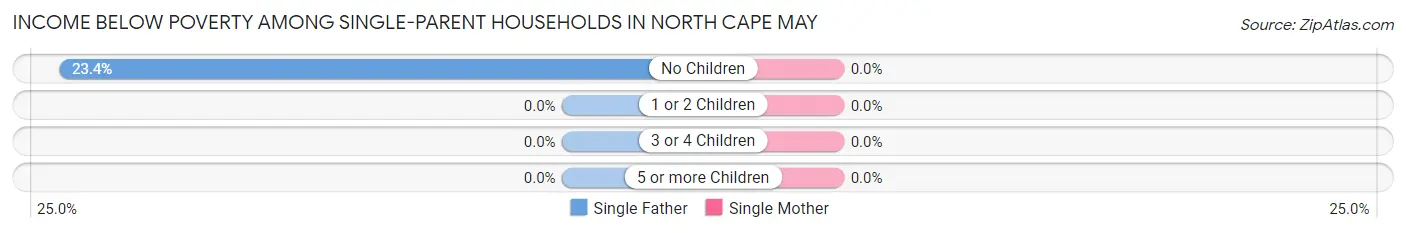
| Children | Single Father | Single Mother |
| No Children | 11 (23.4%) | 0 (0.0%) |
| 1 or 2 Children | 0 (0.0%) | 0 (0.0%) |
| 3 or 4 Children | 0 (0.0%) | 0 (0.0%) |
| 5 or more Children | 0 (0.0%) | 0 (0.0%) |
| Total | 11 (22.5%) | 0 (0.0%) |
Income Below Poverty Among Married-Couple vs Single-Parent Households in North Cape May
The poverty data for North Cape May shows that 51 of the married-couple family households (6.4%) and 11 of the single-parent households (3.8%) are living below the poverty level. Within the married-couple family households, those with 3 or 4 children have the highest poverty rate, with 14 households (56.0%) falling below the poverty line. Among the single-parent households, those with no children have the highest poverty rate, with 11 household (5.4%) living below poverty.
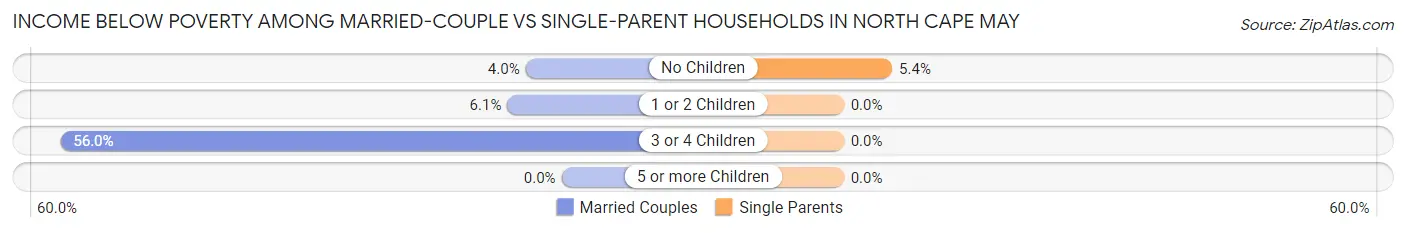
| Children | Married-Couple Families | Single-Parent Households |
| No Children | 19 (4.0%) | 11 (5.4%) |
| 1 or 2 Children | 18 (6.1%) | 0 (0.0%) |
| 3 or 4 Children | 14 (56.0%) | 0 (0.0%) |
| 5 or more Children | 0 (0.0%) | 0 (0.0%) |
| Total | 51 (6.4%) | 11 (3.8%) |
Employment Characteristics in North Cape May
Employment by Class of Employer in North Cape May
Among the 1,700 employed individuals in North Cape May, private company employees (1,098 | 64.6%), local government employees (247 | 14.5%), and federal government employees (124 | 7.3%) make up the most common classes of employment.
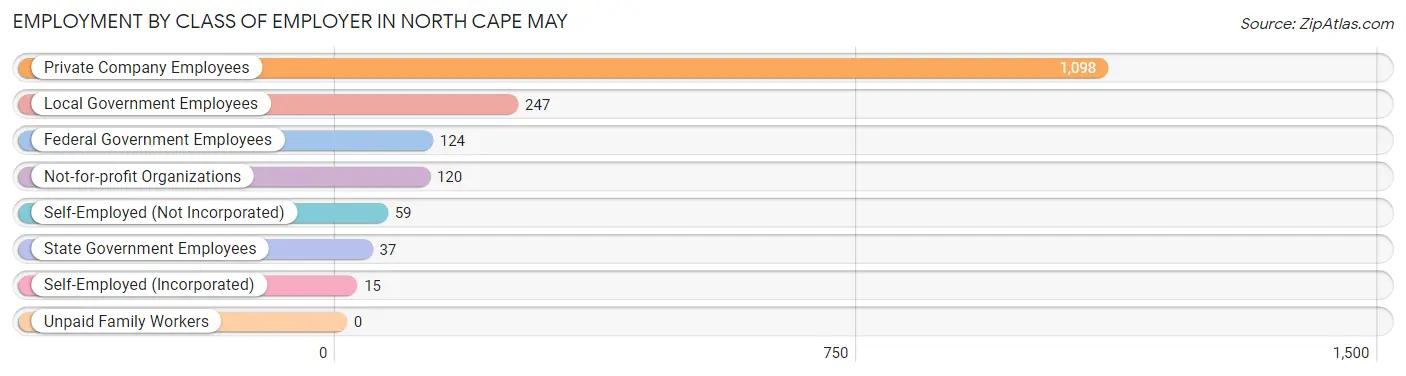
| Employer Class | # Employees | % Employees |
| Private Company Employees | 1,098 | 64.6% |
| Self-Employed (Incorporated) | 15 | 0.9% |
| Self-Employed (Not Incorporated) | 59 | 3.5% |
| Not-for-profit Organizations | 120 | 7.1% |
| Local Government Employees | 247 | 14.5% |
| State Government Employees | 37 | 2.2% |
| Federal Government Employees | 124 | 7.3% |
| Unpaid Family Workers | 0 | 0.0% |
| Total | 1,700 | 100.0% |
Employment Status by Age in North Cape May
According to the labor force statistics for North Cape May, out of the total population over 16 years of age (3,310), 56.2% or 1,860 individuals are in the labor force, with 4.9% or 91 of them unemployed. The age group with the highest labor force participation rate is 30 to 34 years, with 96.8% or 213 individuals in the labor force. Within the labor force, the 20 to 24 years age range has the highest percentage of unemployed individuals, with 35.7% or 60 of them being unemployed.
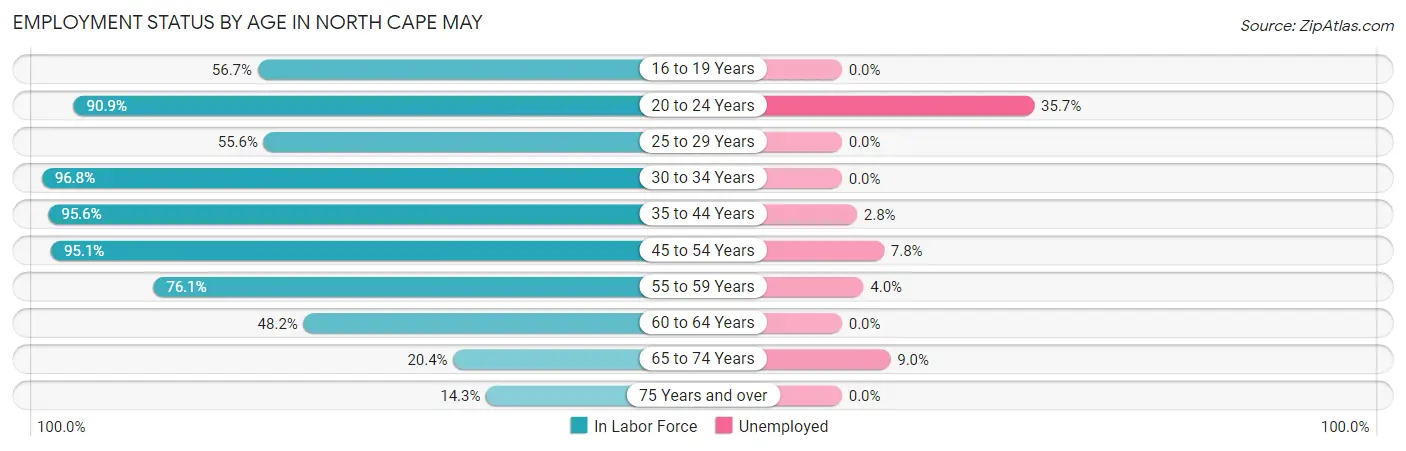
| Age Bracket | In Labor Force | Unemployed |
| 16 to 19 Years | 85 (56.7%) | 0 (0.0%) |
| 20 to 24 Years | 169 (90.9%) | 60 (35.7%) |
| 25 to 29 Years | 75 (55.6%) | 0 (0.0%) |
| 30 to 34 Years | 213 (96.8%) | 0 (0.0%) |
| 35 to 44 Years | 325 (95.6%) | 9 (2.8%) |
| 45 to 54 Years | 332 (95.1%) | 26 (7.8%) |
| 55 to 59 Years | 223 (76.1%) | 9 (4.0%) |
| 60 to 64 Years | 227 (48.2%) | 0 (0.0%) |
| 65 to 74 Years | 144 (20.4%) | 13 (9.0%) |
| 75 Years and over | 66 (14.3%) | 0 (0.0%) |
| Total | 1,860 (56.2%) | 91 (4.9%) |
Employment Status by Educational Attainment in North Cape May
According to labor force statistics for North Cape May, 77.2% of individuals (1,396) out of the total population between 25 and 64 years of age (1,808) are in the labor force, with 3.2% or 45 of them being unemployed. The group with the highest labor force participation rate are those with the educational attainment of bachelor's degree or higher, with 86.3% or 487 individuals in the labor force. Within the labor force, individuals with less than high school education have the highest percentage of unemployment, with 19.5% or 8 of them being unemployed.
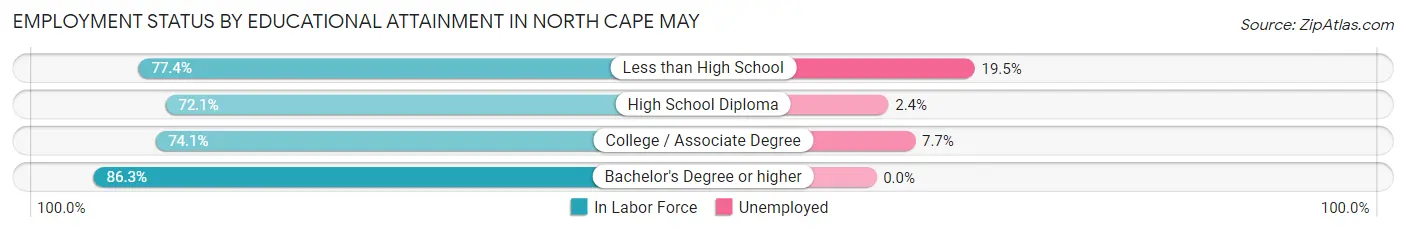
| Educational Attainment | In Labor Force | Unemployed |
| Less than High School | 41 (77.4%) | 10 (19.5%) |
| High School Diploma | 553 (72.1%) | 18 (2.4%) |
| College / Associate Degree | 314 (74.1%) | 33 (7.7%) |
| Bachelor's Degree or higher | 487 (86.3%) | 0 (0.0%) |
| Total | 1,396 (77.2%) | 58 (3.2%) |
Employment Occupations by Sex in North Cape May
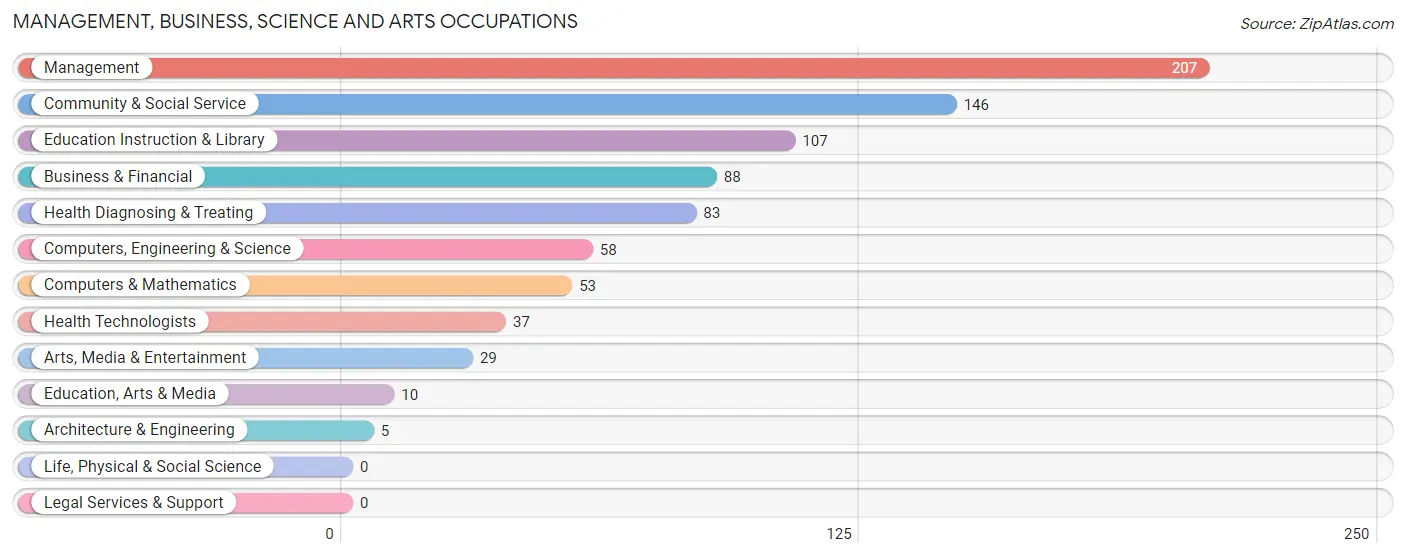
Management, Business, Science and Arts Occupations
The most common Management, Business, Science and Arts occupations in North Cape May are Management (207 | 12.4%), Community & Social Service (146 | 8.7%), Education Instruction & Library (107 | 6.4%), Business & Financial (88 | 5.3%), and Health Diagnosing & Treating (83 | 5.0%).
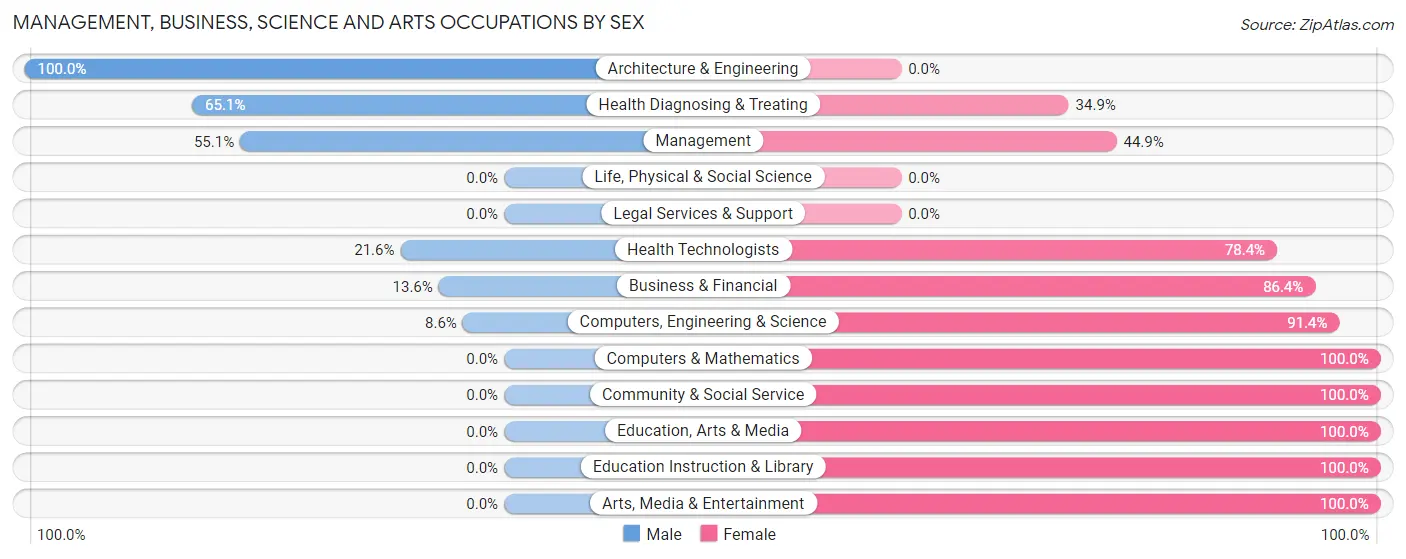
Management, Business, Science and Arts Occupations by Sex
Within the Management, Business, Science and Arts occupations in North Cape May, the most male-oriented occupations are Architecture & Engineering (100.0%), Health Diagnosing & Treating (65.1%), and Management (55.1%), while the most female-oriented occupations are Computers & Mathematics (100.0%), Community & Social Service (100.0%), and Education, Arts & Media (100.0%).
| Occupation | Male | Female |
| Management | 114 (55.1%) | 93 (44.9%) |
| Business & Financial | 12 (13.6%) | 76 (86.4%) |
| Computers, Engineering & Science | 5 (8.6%) | 53 (91.4%) |
| Computers & Mathematics | 0 (0.0%) | 53 (100.0%) |
| Architecture & Engineering | 5 (100.0%) | 0 (0.0%) |
| Life, Physical & Social Science | 0 (0.0%) | 0 (0.0%) |
| Community & Social Service | 0 (0.0%) | 146 (100.0%) |
| Education, Arts & Media | 0 (0.0%) | 10 (100.0%) |
| Legal Services & Support | 0 (0.0%) | 0 (0.0%) |
| Education Instruction & Library | 0 (0.0%) | 107 (100.0%) |
| Arts, Media & Entertainment | 0 (0.0%) | 29 (100.0%) |
| Health Diagnosing & Treating | 54 (65.1%) | 29 (34.9%) |
| Health Technologists | 8 (21.6%) | 29 (78.4%) |
| Total (Category) | 185 (31.8%) | 397 (68.2%) |
| Total (Overall) | 810 (48.4%) | 862 (51.6%) |
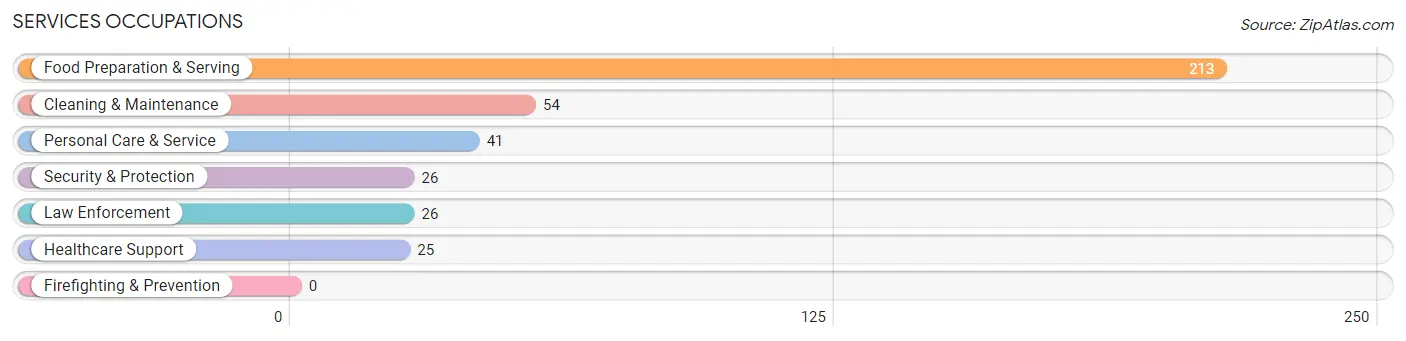
Services Occupations
The most common Services occupations in North Cape May are Food Preparation & Serving (213 | 12.7%), Cleaning & Maintenance (54 | 3.2%), Personal Care & Service (41 | 2.5%), Security & Protection (26 | 1.6%), and Law Enforcement (26 | 1.6%).
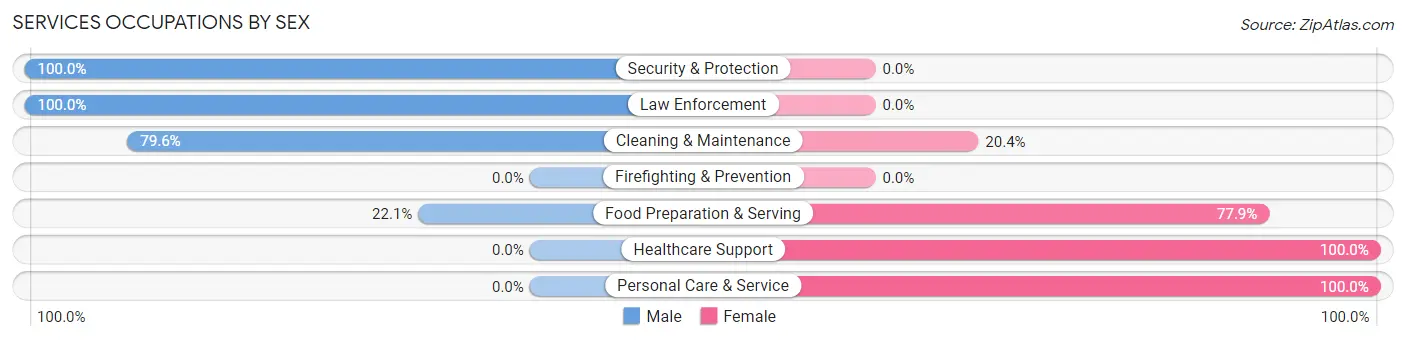
Services Occupations by Sex
Within the Services occupations in North Cape May, the most male-oriented occupations are Security & Protection (100.0%), Law Enforcement (100.0%), and Cleaning & Maintenance (79.6%), while the most female-oriented occupations are Healthcare Support (100.0%), Personal Care & Service (100.0%), and Food Preparation & Serving (77.9%).
| Occupation | Male | Female |
| Healthcare Support | 0 (0.0%) | 25 (100.0%) |
| Security & Protection | 26 (100.0%) | 0 (0.0%) |
| Firefighting & Prevention | 0 (0.0%) | 0 (0.0%) |
| Law Enforcement | 26 (100.0%) | 0 (0.0%) |
| Food Preparation & Serving | 47 (22.1%) | 166 (77.9%) |
| Cleaning & Maintenance | 43 (79.6%) | 11 (20.4%) |
| Personal Care & Service | 0 (0.0%) | 41 (100.0%) |
| Total (Category) | 116 (32.3%) | 243 (67.7%) |
| Total (Overall) | 810 (48.4%) | 862 (51.6%) |
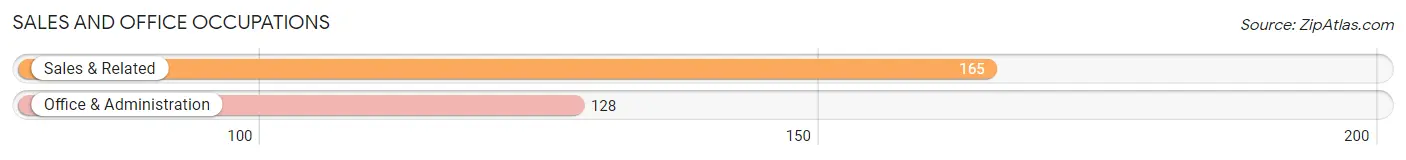
Sales and Office Occupations
The most common Sales and Office occupations in North Cape May are Sales & Related (165 | 9.9%), and Office & Administration (128 | 7.7%).
Sales and Office Occupations by Sex
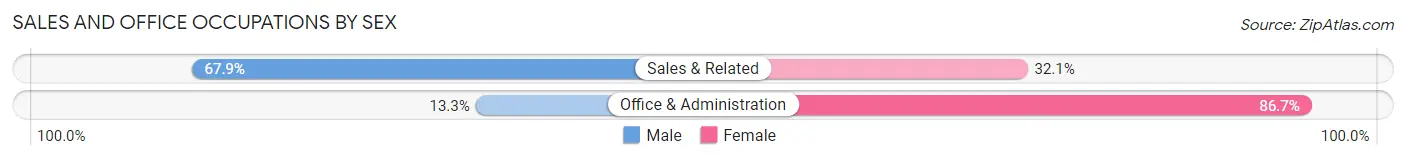
| Occupation | Male | Female |
| Sales & Related | 112 (67.9%) | 53 (32.1%) |
| Office & Administration | 17 (13.3%) | 111 (86.7%) |
| Total (Category) | 129 (44.0%) | 164 (56.0%) |
| Total (Overall) | 810 (48.4%) | 862 (51.6%) |
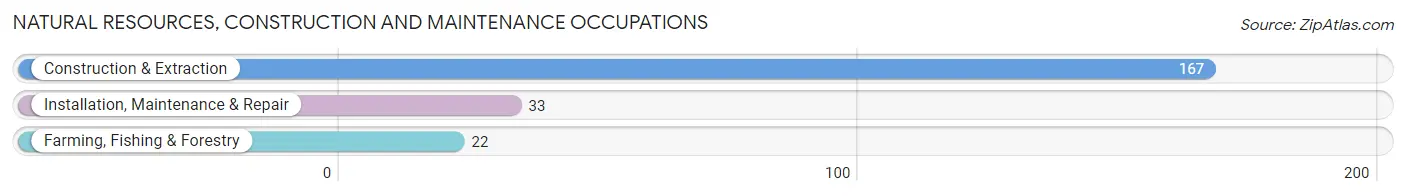
Natural Resources, Construction and Maintenance Occupations
The most common Natural Resources, Construction and Maintenance occupations in North Cape May are Construction & Extraction (167 | 10.0%), Installation, Maintenance & Repair (33 | 2.0%), and Farming, Fishing & Forestry (22 | 1.3%).
Natural Resources, Construction and Maintenance Occupations by Sex
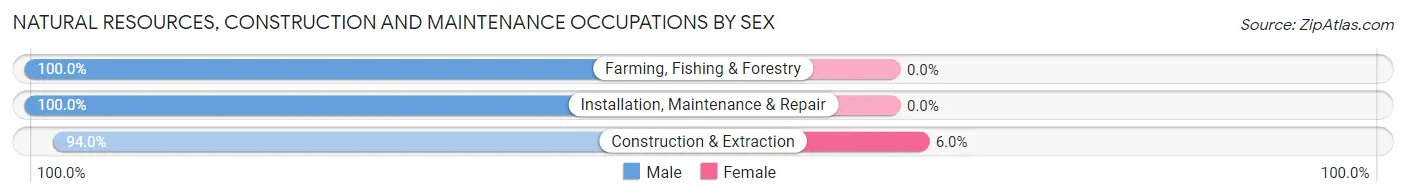
| Occupation | Male | Female |
| Farming, Fishing & Forestry | 22 (100.0%) | 0 (0.0%) |
| Construction & Extraction | 157 (94.0%) | 10 (6.0%) |
| Installation, Maintenance & Repair | 33 (100.0%) | 0 (0.0%) |
| Total (Category) | 212 (95.5%) | 10 (4.5%) |
| Total (Overall) | 810 (48.4%) | 862 (51.6%) |
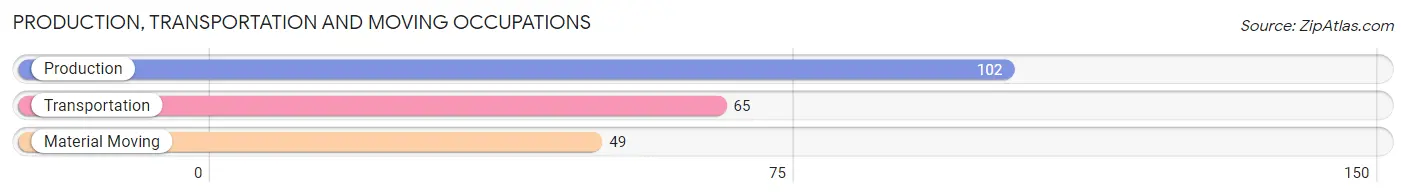
Production, Transportation and Moving Occupations
The most common Production, Transportation and Moving occupations in North Cape May are Production (102 | 6.1%), Transportation (65 | 3.9%), and Material Moving (49 | 2.9%).
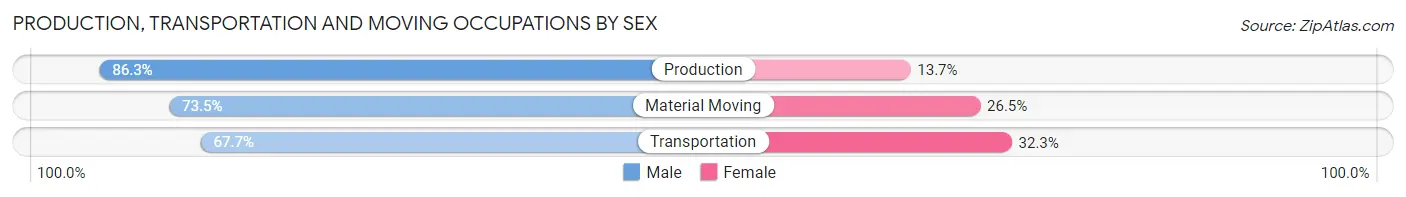
Production, Transportation and Moving Occupations by Sex
| Occupation | Male | Female |
| Production | 88 (86.3%) | 14 (13.7%) |
| Transportation | 44 (67.7%) | 21 (32.3%) |
| Material Moving | 36 (73.5%) | 13 (26.5%) |
| Total (Category) | 168 (77.8%) | 48 (22.2%) |
| Total (Overall) | 810 (48.4%) | 862 (51.6%) |
Employment Industries by Sex in North Cape May
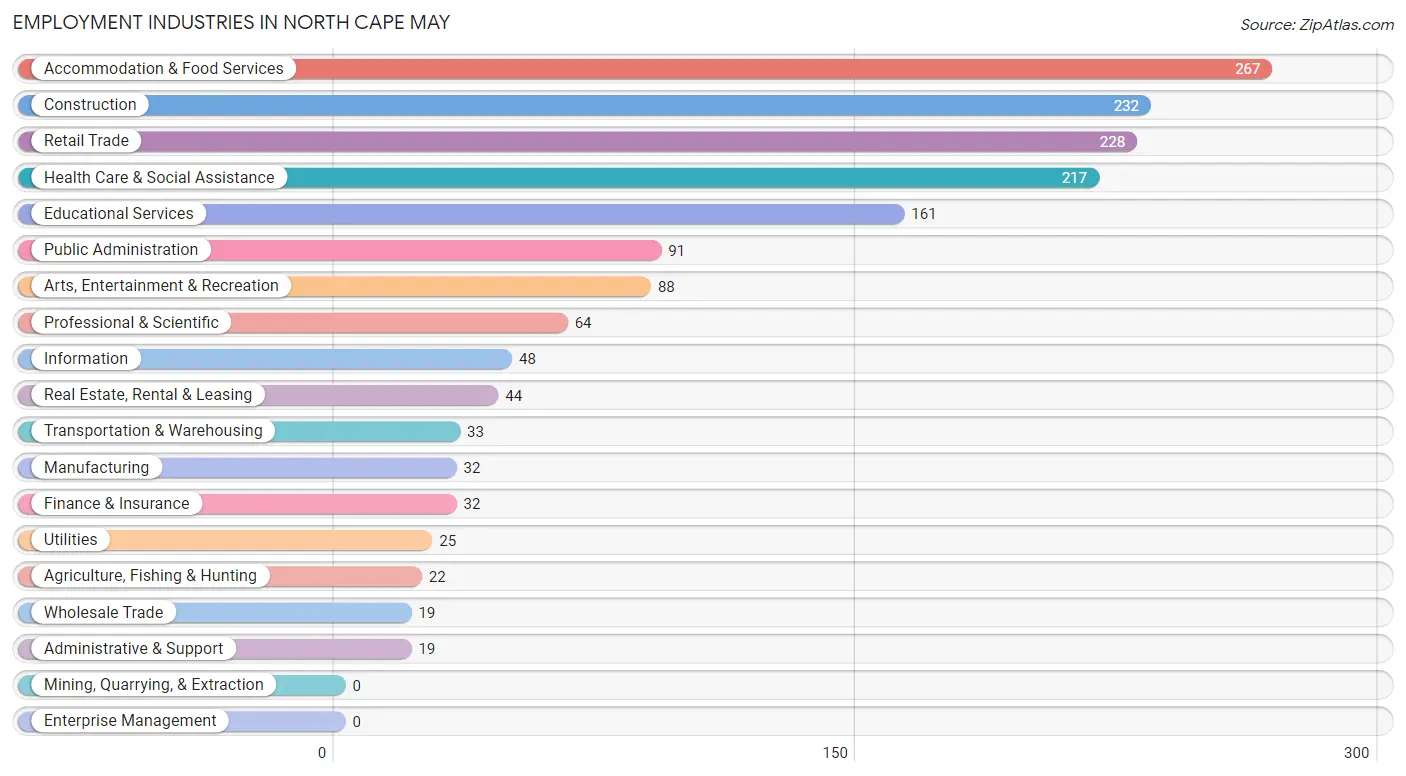
Employment Industries in North Cape May
The major employment industries in North Cape May include Accommodation & Food Services (267 | 16.0%), Construction (232 | 13.9%), Retail Trade (228 | 13.6%), Health Care & Social Assistance (217 | 13.0%), and Educational Services (161 | 9.6%).
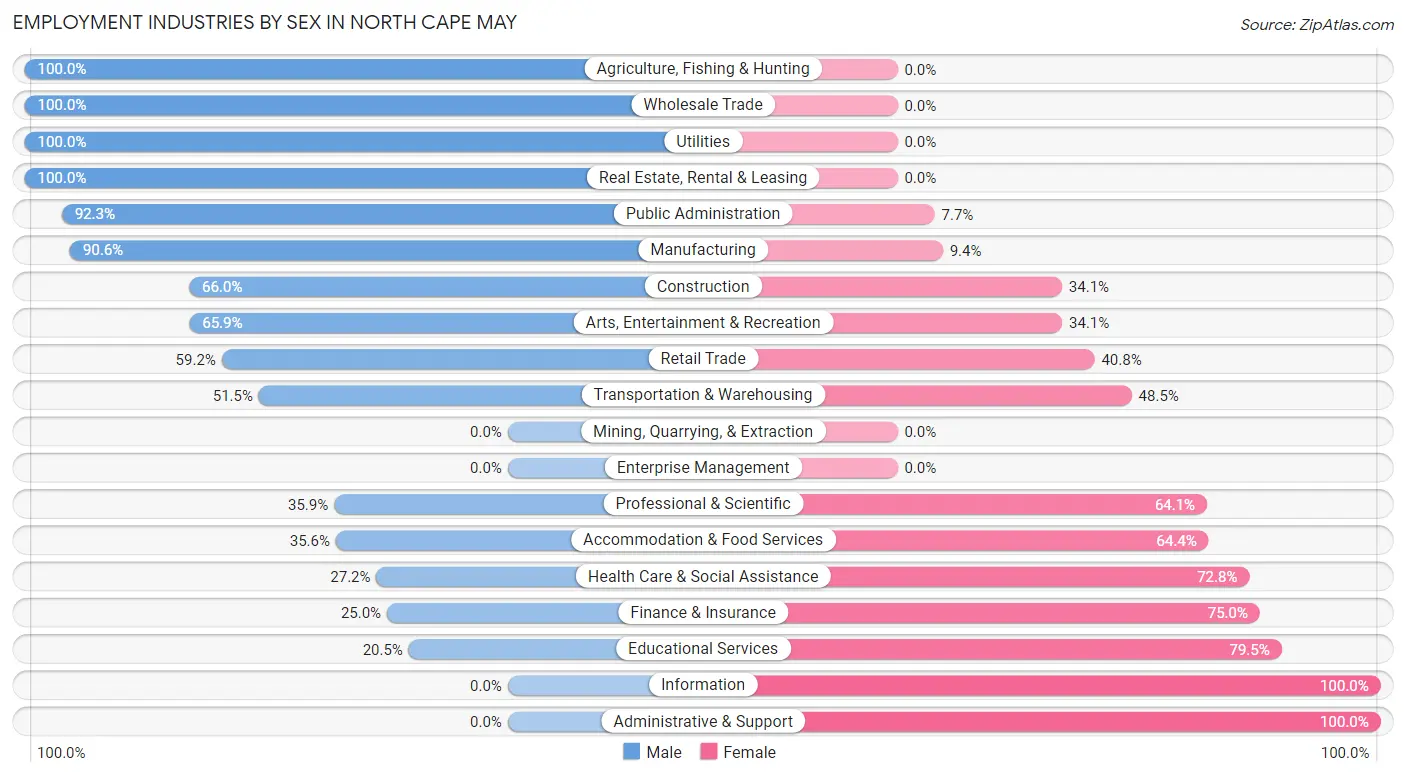
Employment Industries by Sex in North Cape May
The North Cape May industries that see more men than women are Agriculture, Fishing & Hunting (100.0%), Wholesale Trade (100.0%), and Utilities (100.0%), whereas the industries that tend to have a higher number of women are Information (100.0%), Administrative & Support (100.0%), and Educational Services (79.5%).
| Industry | Male | Female |
| Agriculture, Fishing & Hunting | 22 (100.0%) | 0 (0.0%) |
| Mining, Quarrying, & Extraction | 0 (0.0%) | 0 (0.0%) |
| Construction | 153 (65.9%) | 79 (34.1%) |
| Manufacturing | 29 (90.6%) | 3 (9.4%) |
| Wholesale Trade | 19 (100.0%) | 0 (0.0%) |
| Retail Trade | 135 (59.2%) | 93 (40.8%) |
| Transportation & Warehousing | 17 (51.5%) | 16 (48.5%) |
| Utilities | 25 (100.0%) | 0 (0.0%) |
| Information | 0 (0.0%) | 48 (100.0%) |
| Finance & Insurance | 8 (25.0%) | 24 (75.0%) |
| Real Estate, Rental & Leasing | 44 (100.0%) | 0 (0.0%) |
| Professional & Scientific | 23 (35.9%) | 41 (64.1%) |
| Enterprise Management | 0 (0.0%) | 0 (0.0%) |
| Administrative & Support | 0 (0.0%) | 19 (100.0%) |
| Educational Services | 33 (20.5%) | 128 (79.5%) |
| Health Care & Social Assistance | 59 (27.2%) | 158 (72.8%) |
| Arts, Entertainment & Recreation | 58 (65.9%) | 30 (34.1%) |
| Accommodation & Food Services | 95 (35.6%) | 172 (64.4%) |
| Public Administration | 84 (92.3%) | 7 (7.7%) |
| Total | 810 (48.4%) | 862 (51.6%) |
Education in North Cape May
School Enrollment in North Cape May
The most common levels of schooling among the 524 students in North Cape May are high school (152 | 29.0%), elementary school (150 | 28.6%), and middle school (109 | 20.8%).
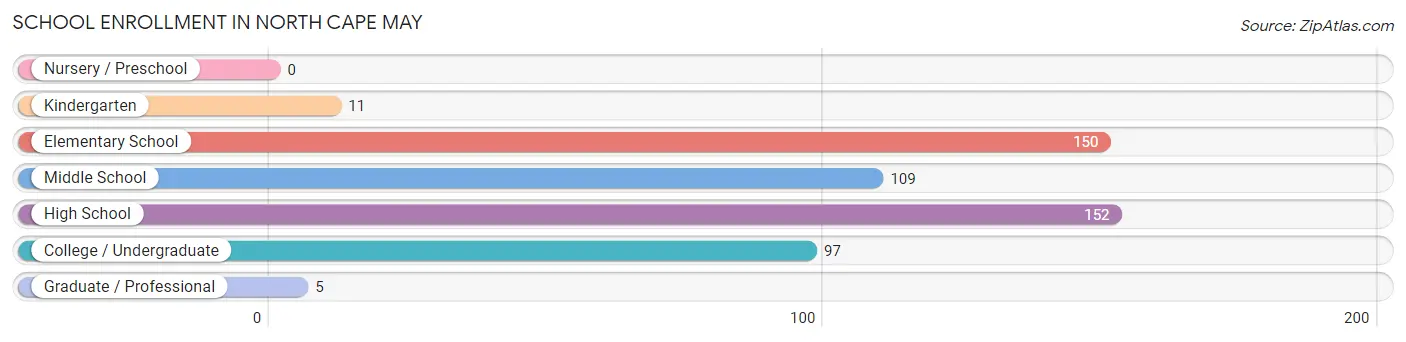
| School Level | # Students | % Students |
| Nursery / Preschool | 0 | 0.0% |
| Kindergarten | 11 | 2.1% |
| Elementary School | 150 | 28.6% |
| Middle School | 109 | 20.8% |
| High School | 152 | 29.0% |
| College / Undergraduate | 97 | 18.5% |
| Graduate / Professional | 5 | 0.9% |
| Total | 524 | 100.0% |
School Enrollment by Age by Funding Source in North Cape May
Out of a total of 524 students who are enrolled in schools in North Cape May, 31 (5.9%) attend a private institution, while the remaining 493 (94.1%) are enrolled in public schools. The age group of 25 to 34 year olds has the highest likelihood of being enrolled in private schools, with 9 (42.9% in the age bracket) enrolled. Conversely, the age group of 5 to 9 year old has the lowest likelihood of being enrolled in a private school, with 144 (100.0% in the age bracket) attending a public institution.
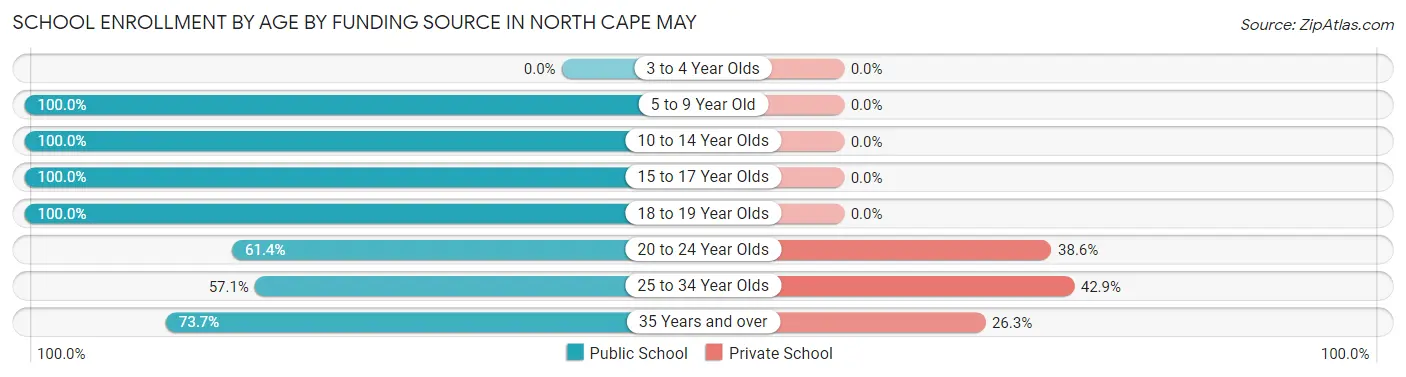
| Age Bracket | Public School | Private School |
| 3 to 4 Year Olds | 0 (0.0%) | 0 (0.0%) |
| 5 to 9 Year Old | 144 (100.0%) | 0 (0.0%) |
| 10 to 14 Year Olds | 172 (100.0%) | 0 (0.0%) |
| 15 to 17 Year Olds | 93 (100.0%) | 0 (0.0%) |
| 18 to 19 Year Olds | 31 (100.0%) | 0 (0.0%) |
| 20 to 24 Year Olds | 27 (61.4%) | 17 (38.6%) |
| 25 to 34 Year Olds | 12 (57.1%) | 9 (42.9%) |
| 35 Years and over | 14 (73.7%) | 5 (26.3%) |
| Total | 493 (94.1%) | 31 (5.9%) |
Educational Attainment by Field of Study in North Cape May
Business (312 | 37.8%), education (152 | 18.4%), science & technology (79 | 9.6%), social sciences (62 | 7.5%), and psychology (60 | 7.3%) are the most common fields of study among 825 individuals in North Cape May who have obtained a bachelor's degree or higher.
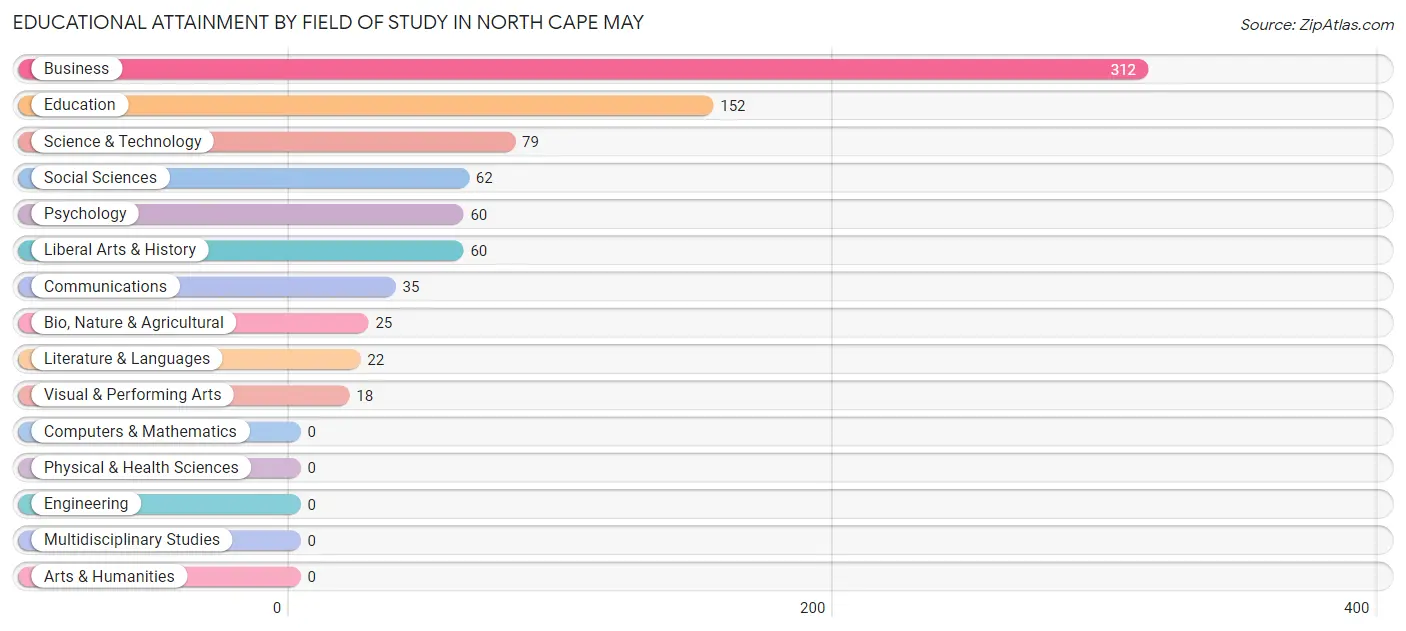
| Field of Study | # Graduates | % Graduates |
| Computers & Mathematics | 0 | 0.0% |
| Bio, Nature & Agricultural | 25 | 3.0% |
| Physical & Health Sciences | 0 | 0.0% |
| Psychology | 60 | 7.3% |
| Social Sciences | 62 | 7.5% |
| Engineering | 0 | 0.0% |
| Multidisciplinary Studies | 0 | 0.0% |
| Science & Technology | 79 | 9.6% |
| Business | 312 | 37.8% |
| Education | 152 | 18.4% |
| Literature & Languages | 22 | 2.7% |
| Liberal Arts & History | 60 | 7.3% |
| Visual & Performing Arts | 18 | 2.2% |
| Communications | 35 | 4.2% |
| Arts & Humanities | 0 | 0.0% |
| Total | 825 | 100.0% |
Transportation & Commute in North Cape May
Vehicle Availability by Sex in North Cape May
The most prevalent vehicle ownership categories in North Cape May are males with 2 vehicles (354, accounting for 41.5%) and females with 2 vehicles (405, making up 41.8%).
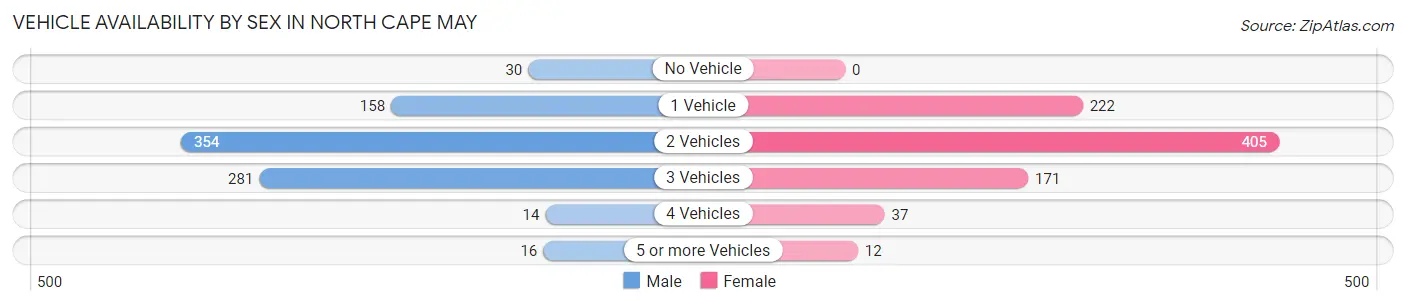
| Vehicles Available | Male | Female |
| No Vehicle | 30 (3.5%) | 0 (0.0%) |
| 1 Vehicle | 158 (18.5%) | 222 (26.2%) |
| 2 Vehicles | 354 (41.5%) | 405 (47.8%) |
| 3 Vehicles | 281 (32.9%) | 171 (20.2%) |
| 4 Vehicles | 14 (1.6%) | 37 (4.4%) |
| 5 or more Vehicles | 16 (1.9%) | 12 (1.4%) |
| Total | 853 (100.0%) | 847 (100.0%) |
Commute Time in North Cape May
The most frequently occuring commute durations in North Cape May are 15 to 19 minutes (467 commuters, 28.9%), 10 to 14 minutes (406 commuters, 25.1%), and 5 to 9 minutes (213 commuters, 13.2%).
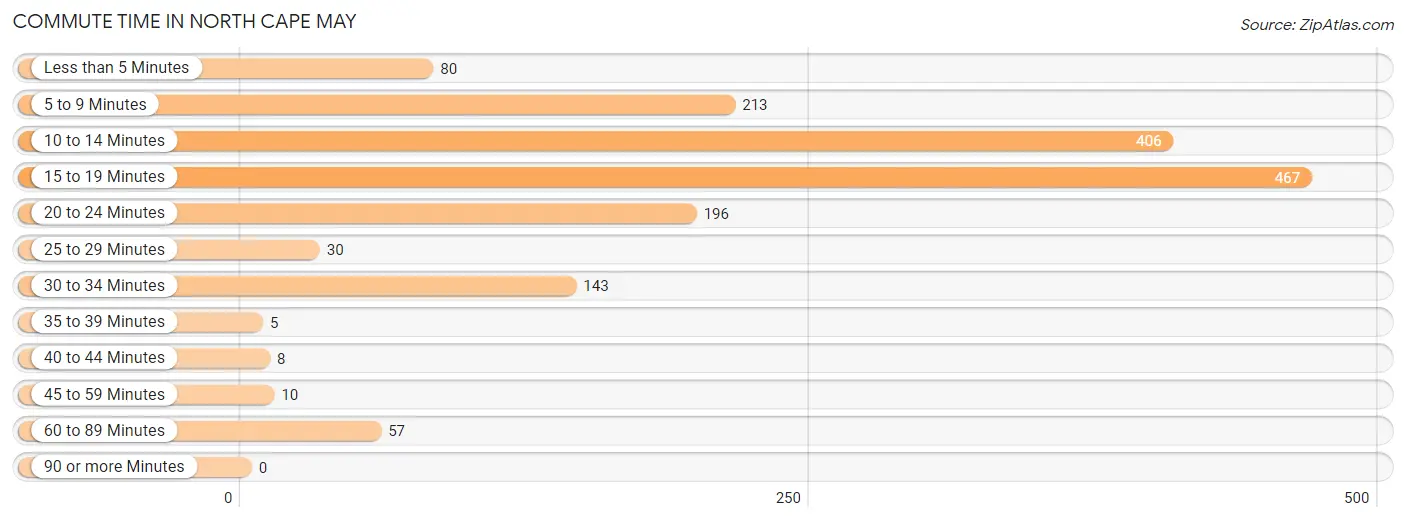
| Commute Time | # Commuters | % Commuters |
| Less than 5 Minutes | 80 | 5.0% |
| 5 to 9 Minutes | 213 | 13.2% |
| 10 to 14 Minutes | 406 | 25.1% |
| 15 to 19 Minutes | 467 | 28.9% |
| 20 to 24 Minutes | 196 | 12.1% |
| 25 to 29 Minutes | 30 | 1.9% |
| 30 to 34 Minutes | 143 | 8.8% |
| 35 to 39 Minutes | 5 | 0.3% |
| 40 to 44 Minutes | 8 | 0.5% |
| 45 to 59 Minutes | 10 | 0.6% |
| 60 to 89 Minutes | 57 | 3.5% |
| 90 or more Minutes | 0 | 0.0% |
Commute Time by Sex in North Cape May
The most common commute times in North Cape May are 15 to 19 minutes (332 commuters, 39.1%) for males and 10 to 14 minutes (236 commuters, 30.8%) for females.
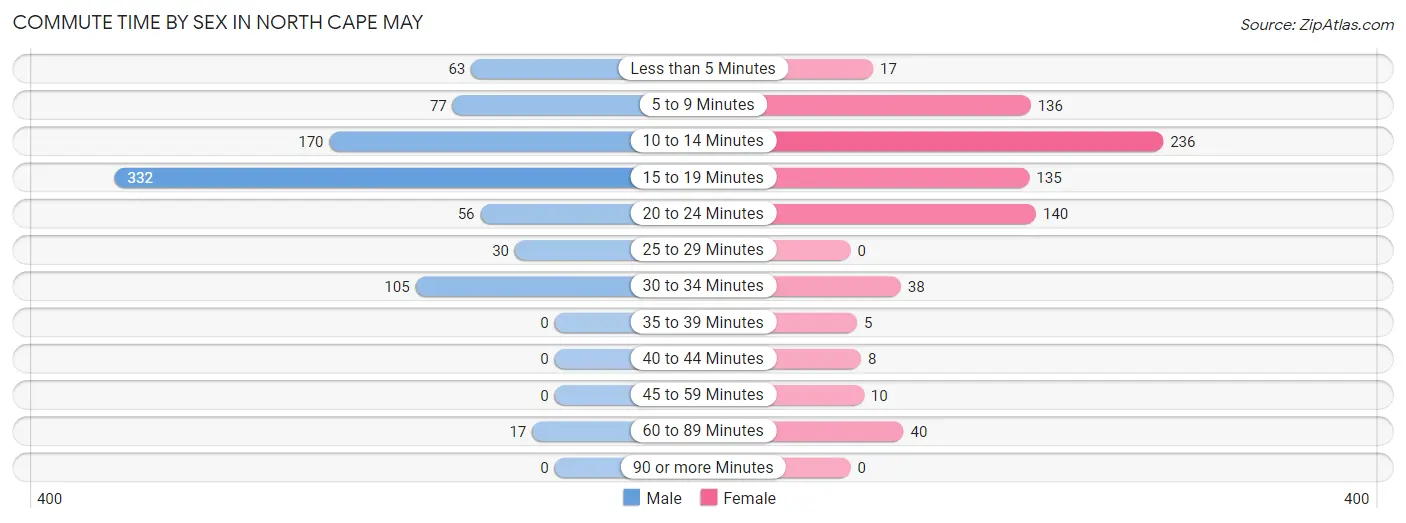
| Commute Time | Male | Female |
| Less than 5 Minutes | 63 (7.4%) | 17 (2.2%) |
| 5 to 9 Minutes | 77 (9.1%) | 136 (17.8%) |
| 10 to 14 Minutes | 170 (20.0%) | 236 (30.8%) |
| 15 to 19 Minutes | 332 (39.1%) | 135 (17.6%) |
| 20 to 24 Minutes | 56 (6.6%) | 140 (18.3%) |
| 25 to 29 Minutes | 30 (3.5%) | 0 (0.0%) |
| 30 to 34 Minutes | 105 (12.3%) | 38 (5.0%) |
| 35 to 39 Minutes | 0 (0.0%) | 5 (0.6%) |
| 40 to 44 Minutes | 0 (0.0%) | 8 (1.1%) |
| 45 to 59 Minutes | 0 (0.0%) | 10 (1.3%) |
| 60 to 89 Minutes | 17 (2.0%) | 40 (5.2%) |
| 90 or more Minutes | 0 (0.0%) | 0 (0.0%) |
Time of Departure to Work by Sex in North Cape May
The most frequent times of departure to work in North Cape May are 7:00 AM to 7:29 AM (268, 31.5%) for males and 7:30 AM to 7:59 AM (140, 18.3%) for females.
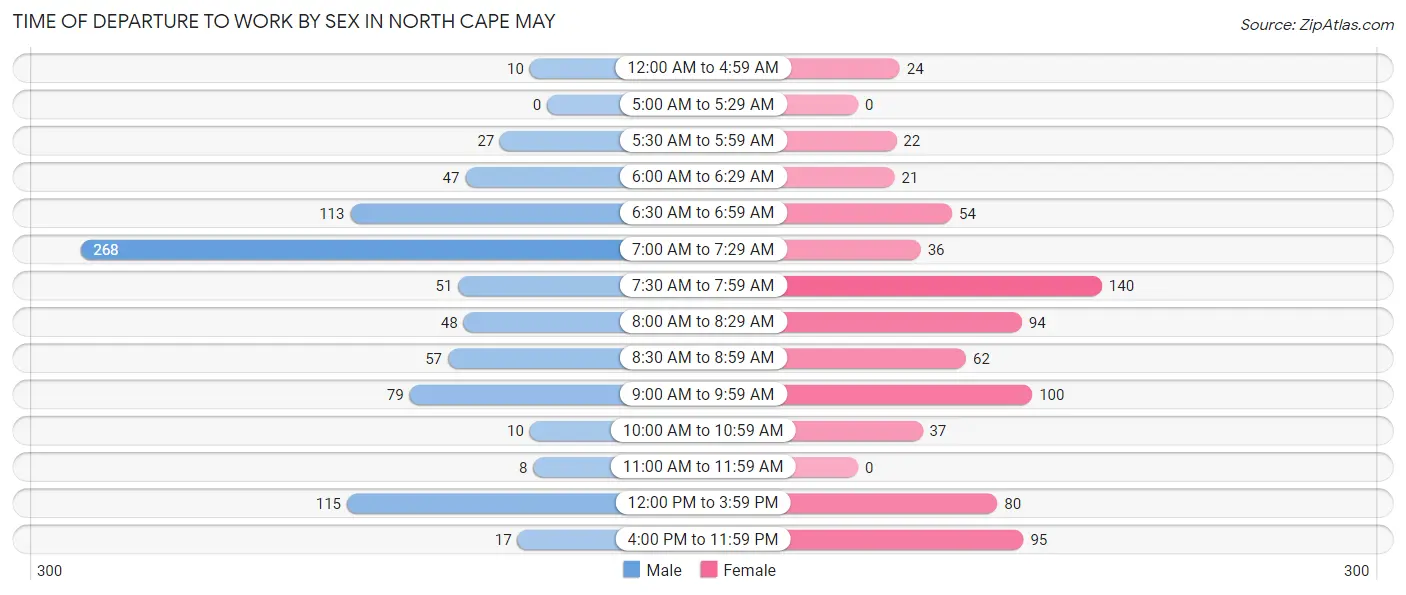
| Time of Departure | Male | Female |
| 12:00 AM to 4:59 AM | 10 (1.2%) | 24 (3.1%) |
| 5:00 AM to 5:29 AM | 0 (0.0%) | 0 (0.0%) |
| 5:30 AM to 5:59 AM | 27 (3.2%) | 22 (2.9%) |
| 6:00 AM to 6:29 AM | 47 (5.5%) | 21 (2.8%) |
| 6:30 AM to 6:59 AM | 113 (13.3%) | 54 (7.1%) |
| 7:00 AM to 7:29 AM | 268 (31.5%) | 36 (4.7%) |
| 7:30 AM to 7:59 AM | 51 (6.0%) | 140 (18.3%) |
| 8:00 AM to 8:29 AM | 48 (5.7%) | 94 (12.3%) |
| 8:30 AM to 8:59 AM | 57 (6.7%) | 62 (8.1%) |
| 9:00 AM to 9:59 AM | 79 (9.3%) | 100 (13.1%) |
| 10:00 AM to 10:59 AM | 10 (1.2%) | 37 (4.8%) |
| 11:00 AM to 11:59 AM | 8 (0.9%) | 0 (0.0%) |
| 12:00 PM to 3:59 PM | 115 (13.5%) | 80 (10.5%) |
| 4:00 PM to 11:59 PM | 17 (2.0%) | 95 (12.4%) |
| Total | 850 (100.0%) | 765 (100.0%) |
Housing Occupancy in North Cape May
Occupancy by Ownership in North Cape May
Of the total 1,908 dwellings in North Cape May, owner-occupied units account for 1,482 (77.7%), while renter-occupied units make up 426 (22.3%).
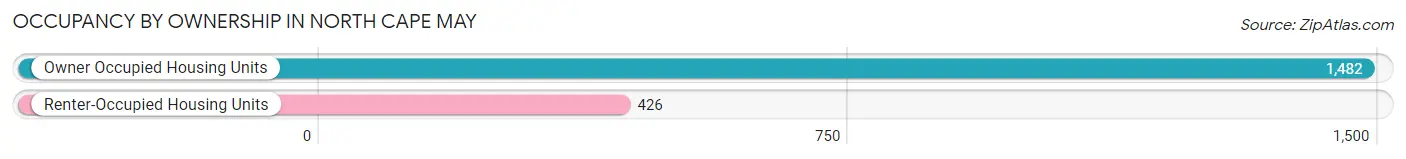
| Occupancy | # Housing Units | % Housing Units |
| Owner Occupied Housing Units | 1,482 | 77.7% |
| Renter-Occupied Housing Units | 426 | 22.3% |
| Total Occupied Housing Units | 1,908 | 100.0% |
Occupancy by Household Size in North Cape May
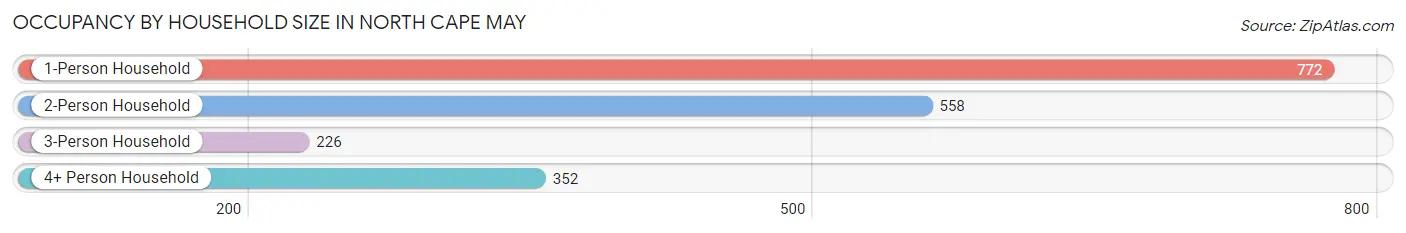
| Household Size | # Housing Units | % Housing Units |
| 1-Person Household | 772 | 40.5% |
| 2-Person Household | 558 | 29.2% |
| 3-Person Household | 226 | 11.8% |
| 4+ Person Household | 352 | 18.4% |
| Total Housing Units | 1,908 | 100.0% |
Occupancy by Ownership by Household Size in North Cape May
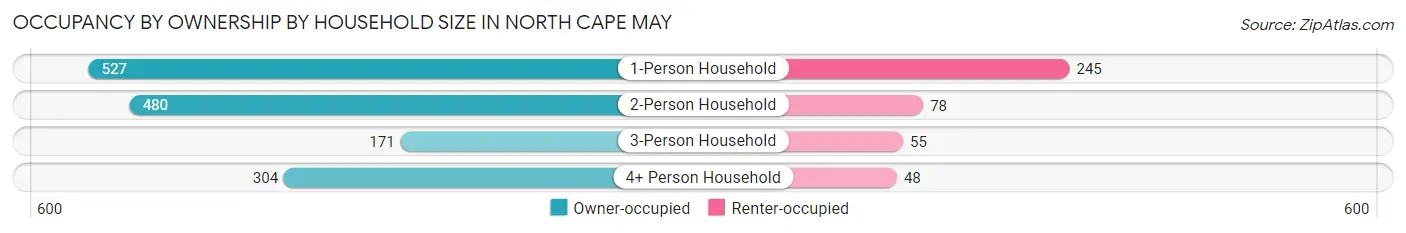
| Household Size | Owner-occupied | Renter-occupied |
| 1-Person Household | 527 (68.3%) | 245 (31.7%) |
| 2-Person Household | 480 (86.0%) | 78 (14.0%) |
| 3-Person Household | 171 (75.7%) | 55 (24.3%) |
| 4+ Person Household | 304 (86.4%) | 48 (13.6%) |
| Total Housing Units | 1,482 (77.7%) | 426 (22.3%) |
Occupancy by Educational Attainment in North Cape May
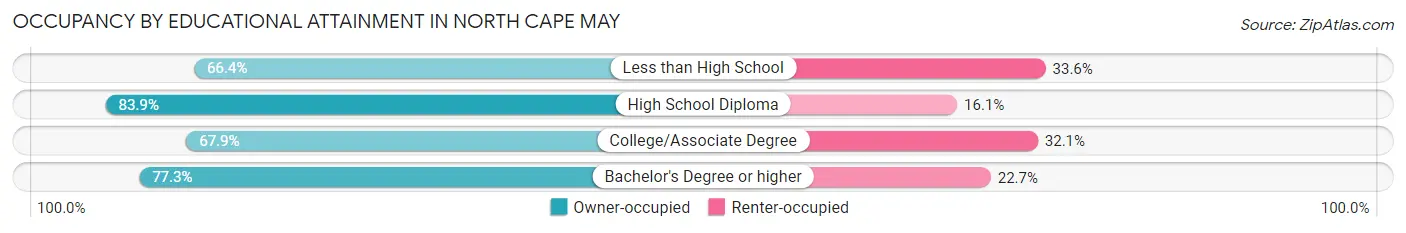
| Household Size | Owner-occupied | Renter-occupied |
| Less than High School | 87 (66.4%) | 44 (33.6%) |
| High School Diploma | 737 (83.9%) | 141 (16.1%) |
| College/Associate Degree | 267 (67.9%) | 126 (32.1%) |
| Bachelor's Degree or higher | 391 (77.3%) | 115 (22.7%) |
Occupancy by Age of Householder in North Cape May
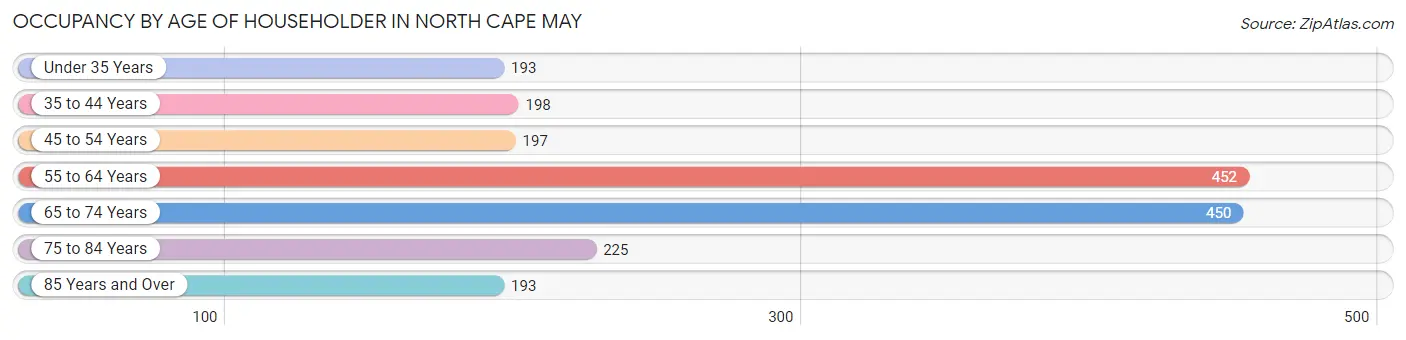
| Age Bracket | # Households | % Households |
| Under 35 Years | 193 | 10.1% |
| 35 to 44 Years | 198 | 10.4% |
| 45 to 54 Years | 197 | 10.3% |
| 55 to 64 Years | 452 | 23.7% |
| 65 to 74 Years | 450 | 23.6% |
| 75 to 84 Years | 225 | 11.8% |
| 85 Years and Over | 193 | 10.1% |
| Total | 1,908 | 100.0% |
Housing Finances in North Cape May
Median Income by Occupancy in North Cape May
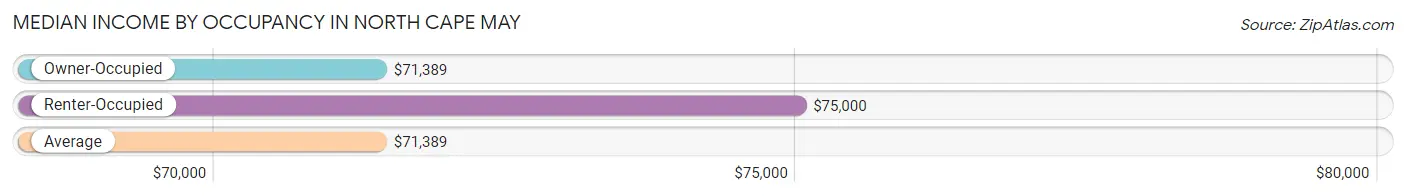
| Occupancy Type | # Households | Median Income |
| Owner-Occupied | 1,482 (77.7%) | $71,389 |
| Renter-Occupied | 426 (22.3%) | $75,000 |
| Average | 1,908 (100.0%) | $71,389 |
Occupancy by Householder Income Bracket in North Cape May
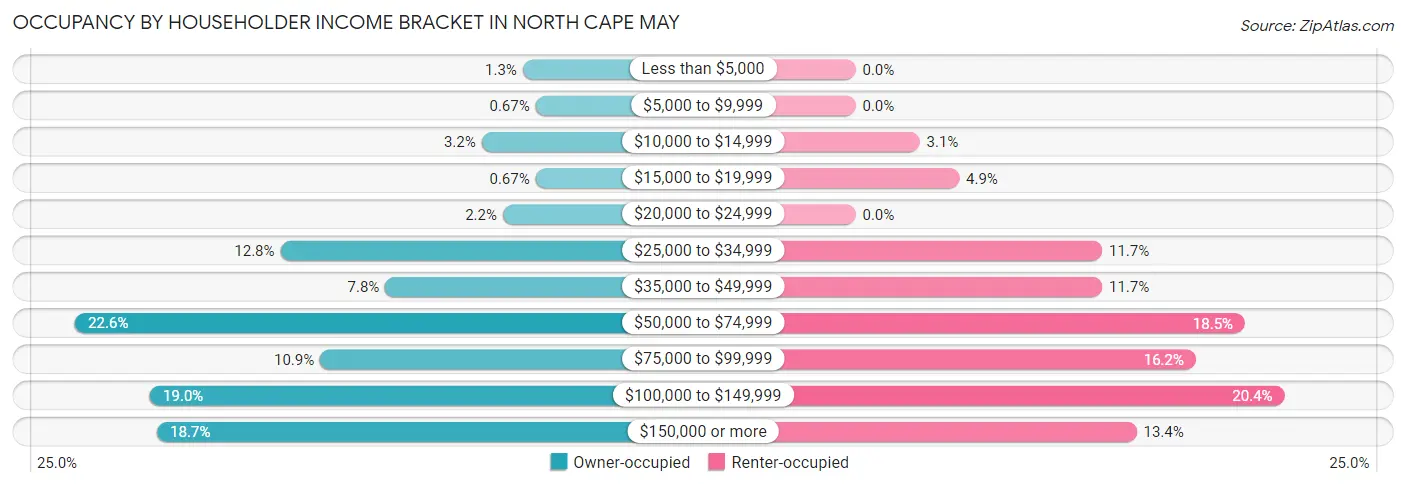
| Income Bracket | Owner-occupied | Renter-occupied |
| Less than $5,000 | 19 (1.3%) | 0 (0.0%) |
| $5,000 to $9,999 | 10 (0.7%) | 0 (0.0%) |
| $10,000 to $14,999 | 48 (3.2%) | 13 (3.0%) |
| $15,000 to $19,999 | 10 (0.7%) | 21 (4.9%) |
| $20,000 to $24,999 | 33 (2.2%) | 0 (0.0%) |
| $25,000 to $34,999 | 190 (12.8%) | 50 (11.7%) |
| $35,000 to $49,999 | 116 (7.8%) | 50 (11.7%) |
| $50,000 to $74,999 | 335 (22.6%) | 79 (18.5%) |
| $75,000 to $99,999 | 162 (10.9%) | 69 (16.2%) |
| $100,000 to $149,999 | 282 (19.0%) | 87 (20.4%) |
| $150,000 or more | 277 (18.7%) | 57 (13.4%) |
| Total | 1,482 (100.0%) | 426 (100.0%) |
Monthly Housing Cost Tiers in North Cape May
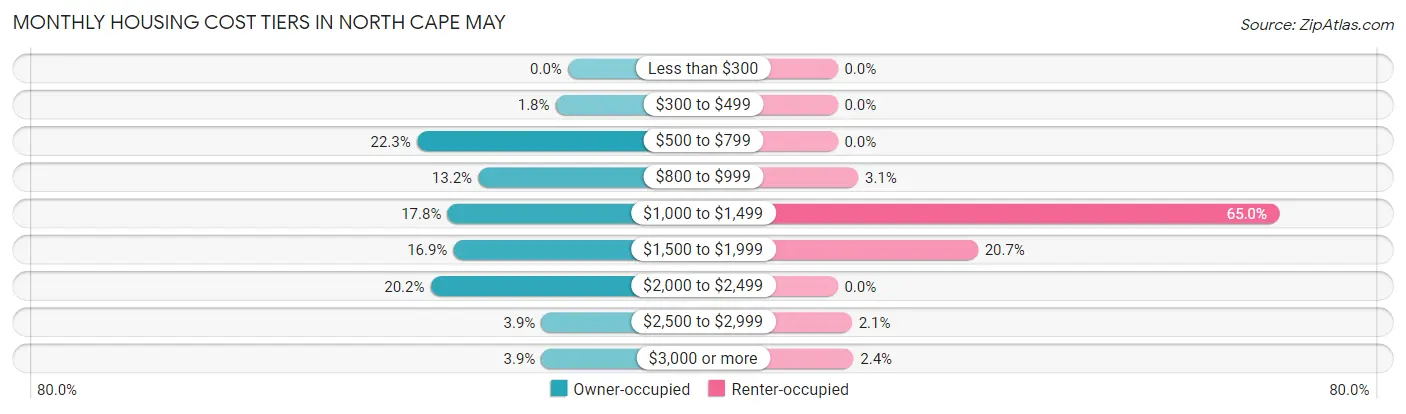
| Monthly Cost | Owner-occupied | Renter-occupied |
| Less than $300 | 0 (0.0%) | 0 (0.0%) |
| $300 to $499 | 27 (1.8%) | 0 (0.0%) |
| $500 to $799 | 330 (22.3%) | 0 (0.0%) |
| $800 to $999 | 196 (13.2%) | 13 (3.0%) |
| $1,000 to $1,499 | 263 (17.7%) | 277 (65.0%) |
| $1,500 to $1,999 | 250 (16.9%) | 88 (20.7%) |
| $2,000 to $2,499 | 300 (20.2%) | 0 (0.0%) |
| $2,500 to $2,999 | 58 (3.9%) | 9 (2.1%) |
| $3,000 or more | 58 (3.9%) | 10 (2.4%) |
| Total | 1,482 (100.0%) | 426 (100.0%) |
Physical Housing Characteristics in North Cape May
Housing Structures in North Cape May
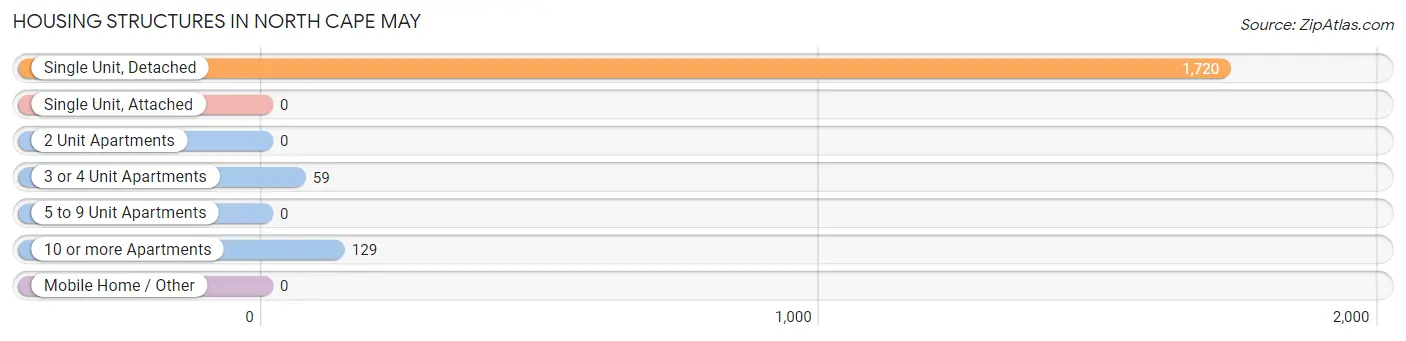
| Structure Type | # Housing Units | % Housing Units |
| Single Unit, Detached | 1,720 | 90.1% |
| Single Unit, Attached | 0 | 0.0% |
| 2 Unit Apartments | 0 | 0.0% |
| 3 or 4 Unit Apartments | 59 | 3.1% |
| 5 to 9 Unit Apartments | 0 | 0.0% |
| 10 or more Apartments | 129 | 6.8% |
| Mobile Home / Other | 0 | 0.0% |
| Total | 1,908 | 100.0% |
Housing Structures by Occupancy in North Cape May
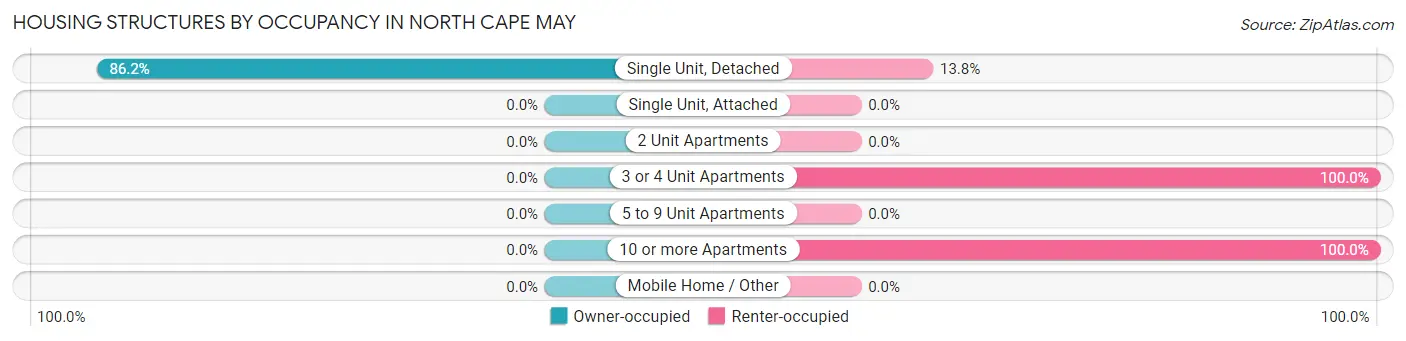
| Structure Type | Owner-occupied | Renter-occupied |
| Single Unit, Detached | 1,482 (86.2%) | 238 (13.8%) |
| Single Unit, Attached | 0 (0.0%) | 0 (0.0%) |
| 2 Unit Apartments | 0 (0.0%) | 0 (0.0%) |
| 3 or 4 Unit Apartments | 0 (0.0%) | 59 (100.0%) |
| 5 to 9 Unit Apartments | 0 (0.0%) | 0 (0.0%) |
| 10 or more Apartments | 0 (0.0%) | 129 (100.0%) |
| Mobile Home / Other | 0 (0.0%) | 0 (0.0%) |
| Total | 1,482 (77.7%) | 426 (22.3%) |
Housing Structures by Number of Rooms in North Cape May
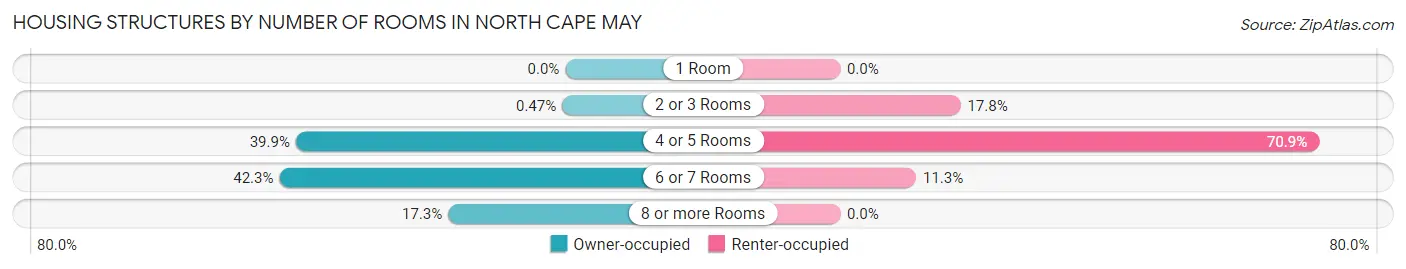
| Number of Rooms | Owner-occupied | Renter-occupied |
| 1 Room | 0 (0.0%) | 0 (0.0%) |
| 2 or 3 Rooms | 7 (0.5%) | 76 (17.8%) |
| 4 or 5 Rooms | 591 (39.9%) | 302 (70.9%) |
| 6 or 7 Rooms | 627 (42.3%) | 48 (11.3%) |
| 8 or more Rooms | 257 (17.3%) | 0 (0.0%) |
| Total | 1,482 (100.0%) | 426 (100.0%) |
Housing Structure by Heating Type in North Cape May
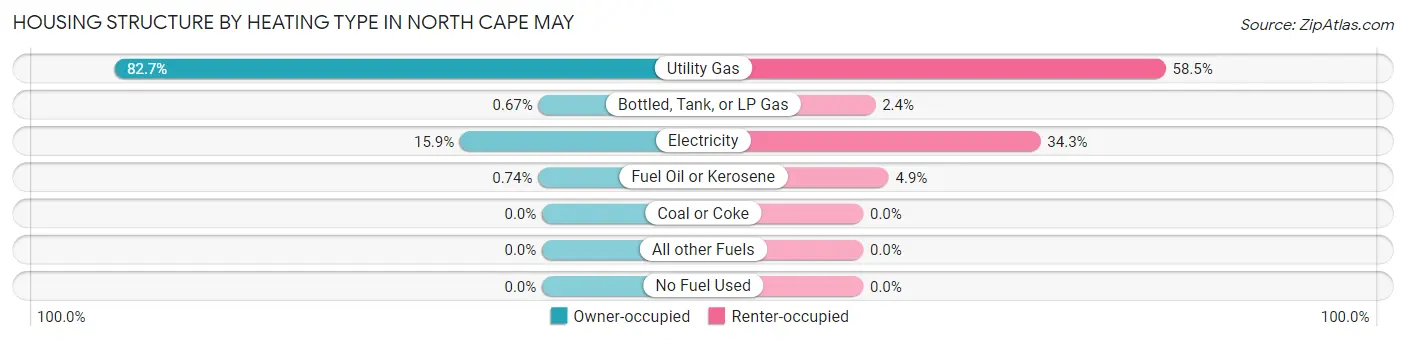
| Heating Type | Owner-occupied | Renter-occupied |
| Utility Gas | 1,226 (82.7%) | 249 (58.5%) |
| Bottled, Tank, or LP Gas | 10 (0.7%) | 10 (2.4%) |
| Electricity | 235 (15.9%) | 146 (34.3%) |
| Fuel Oil or Kerosene | 11 (0.7%) | 21 (4.9%) |
| Coal or Coke | 0 (0.0%) | 0 (0.0%) |
| All other Fuels | 0 (0.0%) | 0 (0.0%) |
| No Fuel Used | 0 (0.0%) | 0 (0.0%) |
| Total | 1,482 (100.0%) | 426 (100.0%) |
Household Vehicle Usage in North Cape May
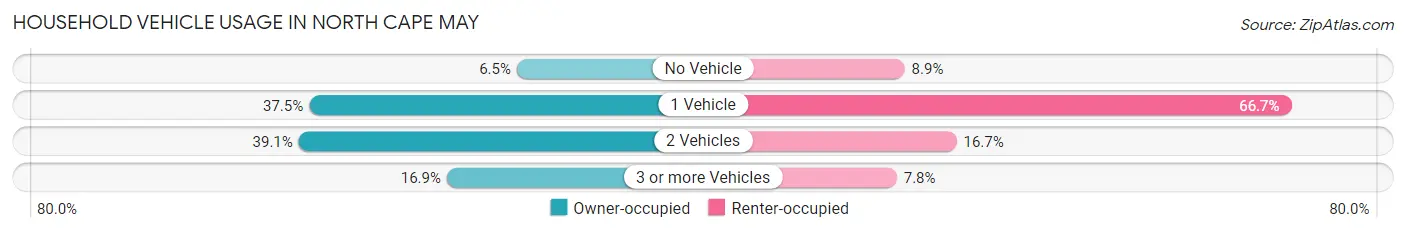
| Vehicles per Household | Owner-occupied | Renter-occupied |
| No Vehicle | 96 (6.5%) | 38 (8.9%) |
| 1 Vehicle | 556 (37.5%) | 284 (66.7%) |
| 2 Vehicles | 579 (39.1%) | 71 (16.7%) |
| 3 or more Vehicles | 251 (16.9%) | 33 (7.7%) |
| Total | 1,482 (100.0%) | 426 (100.0%) |
Real Estate & Mortgages in North Cape May
Real Estate and Mortgage Overview in North Cape May
| Characteristic | Without Mortgage | With Mortgage |
| Housing Units | 533 | 949 |
| Median Property Value | $268,800 | $288,800 |
| Median Household Income | $58,911 | $233 |
| Monthly Housing Costs | $696 | $58 |
| Real Estate Taxes | $3,879 | $27 |
Property Value by Mortgage Status in North Cape May
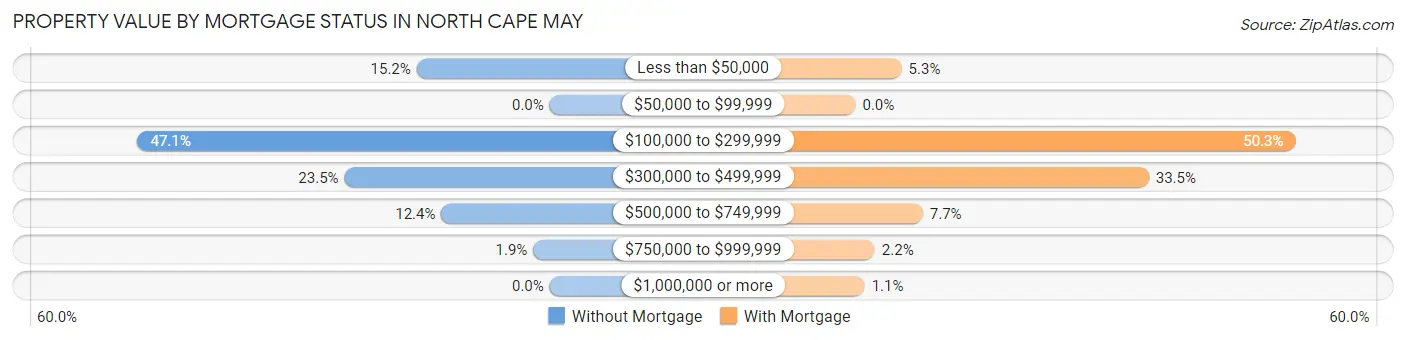
| Property Value | Without Mortgage | With Mortgage |
| Less than $50,000 | 81 (15.2%) | 50 (5.3%) |
| $50,000 to $99,999 | 0 (0.0%) | 0 (0.0%) |
| $100,000 to $299,999 | 251 (47.1%) | 477 (50.3%) |
| $300,000 to $499,999 | 125 (23.4%) | 318 (33.5%) |
| $500,000 to $749,999 | 66 (12.4%) | 73 (7.7%) |
| $750,000 to $999,999 | 10 (1.9%) | 21 (2.2%) |
| $1,000,000 or more | 0 (0.0%) | 10 (1.1%) |
| Total | 533 (100.0%) | 949 (100.0%) |
Household Income by Mortgage Status in North Cape May
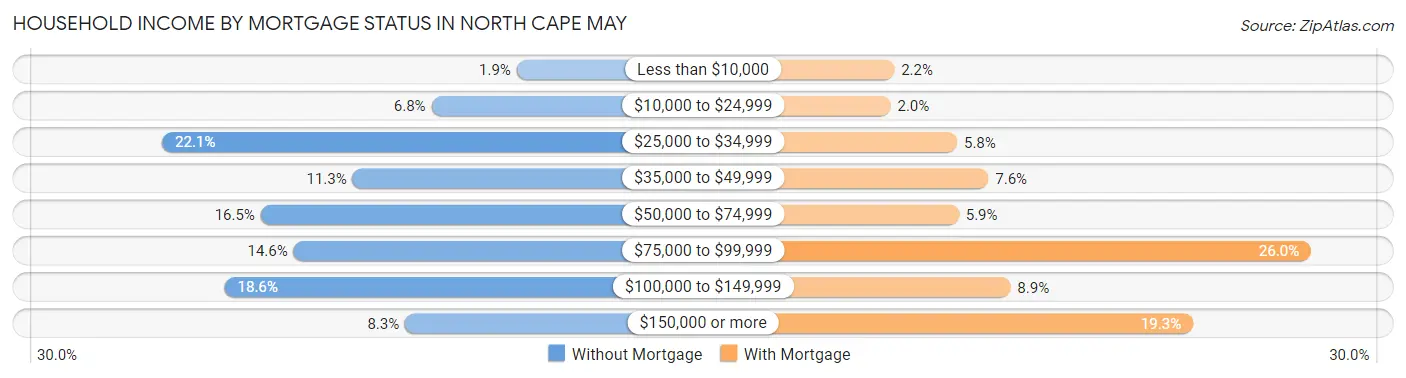
| Household Income | Without Mortgage | With Mortgage |
| Less than $10,000 | 10 (1.9%) | 21 (2.2%) |
| $10,000 to $24,999 | 36 (6.8%) | 19 (2.0%) |
| $25,000 to $34,999 | 118 (22.1%) | 55 (5.8%) |
| $35,000 to $49,999 | 60 (11.3%) | 72 (7.6%) |
| $50,000 to $74,999 | 88 (16.5%) | 56 (5.9%) |
| $75,000 to $99,999 | 78 (14.6%) | 247 (26.0%) |
| $100,000 to $149,999 | 99 (18.6%) | 84 (8.8%) |
| $150,000 or more | 44 (8.3%) | 183 (19.3%) |
| Total | 533 (100.0%) | 949 (100.0%) |
Property Value to Household Income Ratio in North Cape May
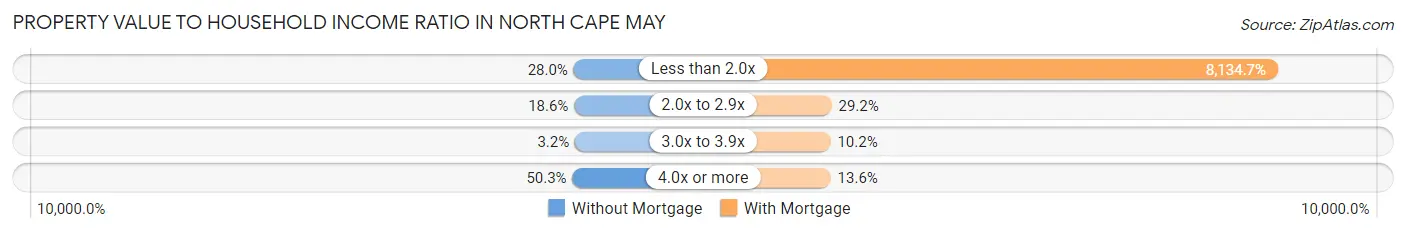
| Value-to-Income Ratio | Without Mortgage | With Mortgage |
| Less than 2.0x | 149 (28.0%) | 77,198 (8,134.7%) |
| 2.0x to 2.9x | 99 (18.6%) | 277 (29.2%) |
| 3.0x to 3.9x | 17 (3.2%) | 97 (10.2%) |
| 4.0x or more | 268 (50.3%) | 129 (13.6%) |
| Total | 533 (100.0%) | 949 (100.0%) |
Real Estate Taxes by Mortgage Status in North Cape May
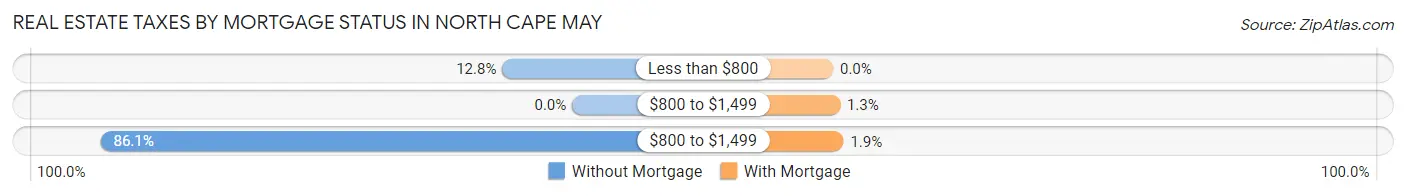
| Property Taxes | Without Mortgage | With Mortgage |
| Less than $800 | 68 (12.8%) | 0 (0.0%) |
| $800 to $1,499 | 0 (0.0%) | 12 (1.3%) |
| $800 to $1,499 | 459 (86.1%) | 18 (1.9%) |
| Total | 533 (100.0%) | 949 (100.0%) |
Health & Disability in North Cape May
Health Insurance Coverage by Age in North Cape May
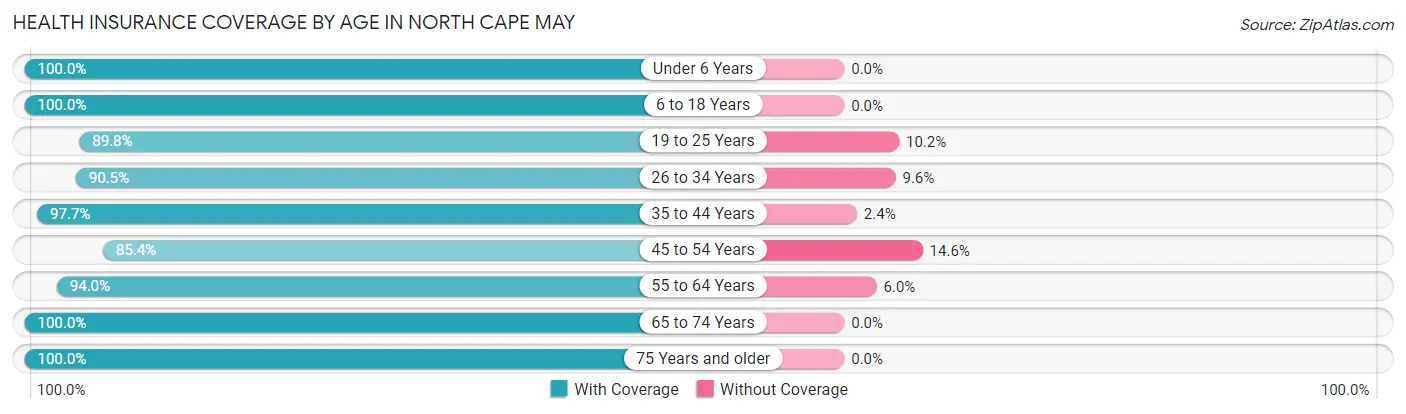
| Age Bracket | With Coverage | Without Coverage |
| Under 6 Years | 199 (100.0%) | 0 (0.0%) |
| 6 to 18 Years | 442 (100.0%) | 0 (0.0%) |
| 19 to 25 Years | 123 (89.8%) | 14 (10.2%) |
| 26 to 34 Years | 303 (90.4%) | 32 (9.6%) |
| 35 to 44 Years | 332 (97.7%) | 8 (2.4%) |
| 45 to 54 Years | 298 (85.4%) | 51 (14.6%) |
| 55 to 64 Years | 718 (94.0%) | 46 (6.0%) |
| 65 to 74 Years | 706 (100.0%) | 0 (0.0%) |
| 75 Years and older | 460 (100.0%) | 0 (0.0%) |
| Total | 3,581 (96.0%) | 151 (4.1%) |
Health Insurance Coverage by Citizenship Status in North Cape May
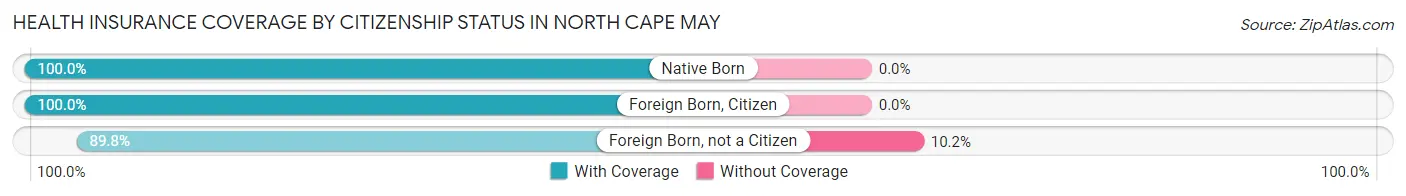
| Citizenship Status | With Coverage | Without Coverage |
| Native Born | 199 (100.0%) | 0 (0.0%) |
| Foreign Born, Citizen | 442 (100.0%) | 0 (0.0%) |
| Foreign Born, not a Citizen | 123 (89.8%) | 14 (10.2%) |
Health Insurance Coverage by Household Income in North Cape May
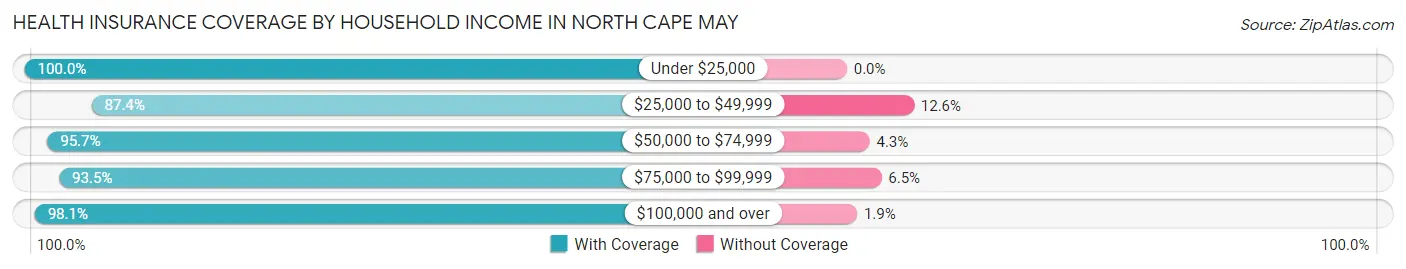
| Household Income | With Coverage | Without Coverage |
| Under $25,000 | 302 (100.0%) | 0 (0.0%) |
| $25,000 to $49,999 | 397 (87.4%) | 57 (12.6%) |
| $50,000 to $74,999 | 810 (95.7%) | 36 (4.3%) |
| $75,000 to $99,999 | 361 (93.5%) | 25 (6.5%) |
| $100,000 and over | 1,707 (98.1%) | 33 (1.9%) |
Public vs Private Health Insurance Coverage by Age in North Cape May
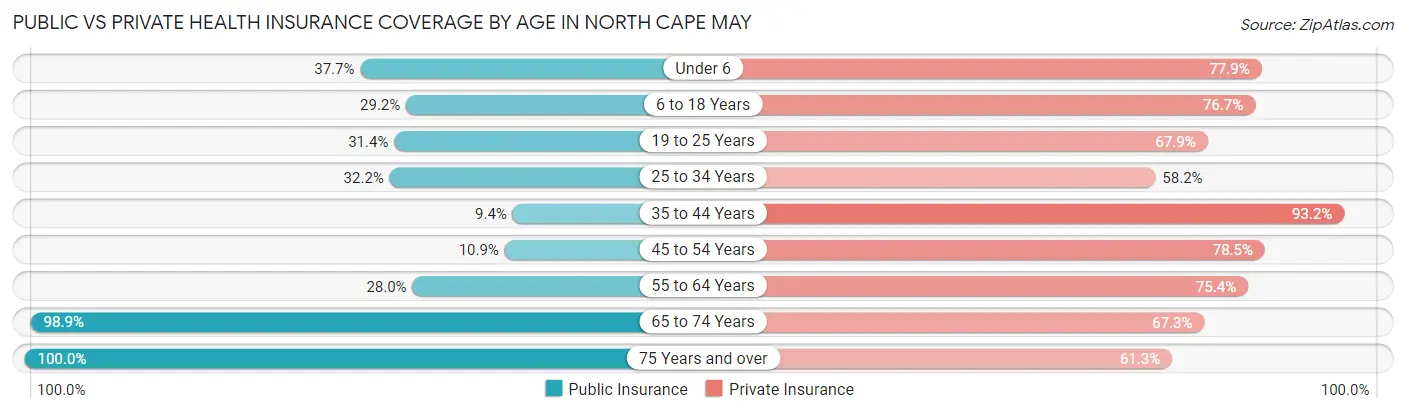
| Age Bracket | Public Insurance | Private Insurance |
| Under 6 | 75 (37.7%) | 155 (77.9%) |
| 6 to 18 Years | 129 (29.2%) | 339 (76.7%) |
| 19 to 25 Years | 43 (31.4%) | 93 (67.9%) |
| 25 to 34 Years | 108 (32.2%) | 195 (58.2%) |
| 35 to 44 Years | 32 (9.4%) | 317 (93.2%) |
| 45 to 54 Years | 38 (10.9%) | 274 (78.5%) |
| 55 to 64 Years | 214 (28.0%) | 576 (75.4%) |
| 65 to 74 Years | 698 (98.9%) | 475 (67.3%) |
| 75 Years and over | 460 (100.0%) | 282 (61.3%) |
| Total | 1,797 (48.1%) | 2,706 (72.5%) |
Disability Status by Sex by Age in North Cape May
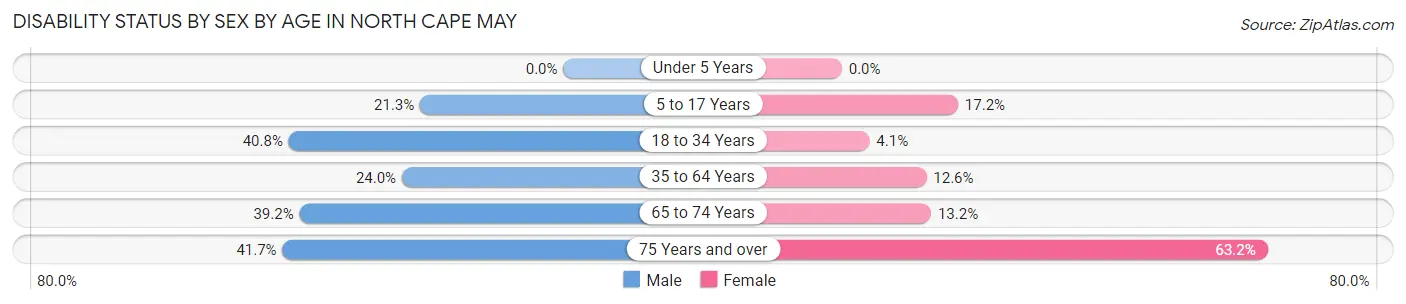
| Age Bracket | Male | Female |
| Under 5 Years | 0 (0.0%) | 0 (0.0%) |
| 5 to 17 Years | 47 (21.3%) | 40 (17.2%) |
| 18 to 34 Years | 73 (40.8%) | 12 (4.1%) |
| 35 to 64 Years | 186 (24.0%) | 85 (12.6%) |
| 65 to 74 Years | 105 (39.2%) | 58 (13.2%) |
| 75 Years and over | 83 (41.7%) | 165 (63.2%) |
Disability Class by Sex by Age in North Cape May
Disability Class: Hearing Difficulty
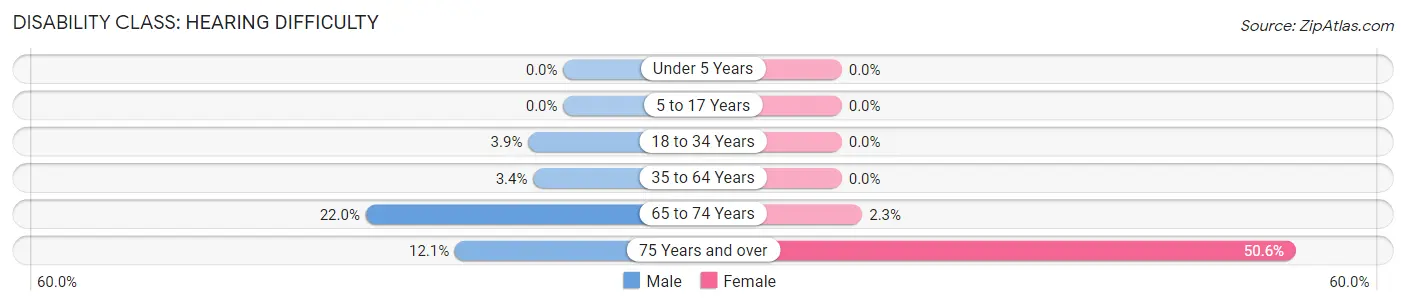
| Age Bracket | Male | Female |
| Under 5 Years | 0 (0.0%) | 0 (0.0%) |
| 5 to 17 Years | 0 (0.0%) | 0 (0.0%) |
| 18 to 34 Years | 7 (3.9%) | 0 (0.0%) |
| 35 to 64 Years | 26 (3.4%) | 0 (0.0%) |
| 65 to 74 Years | 59 (22.0%) | 10 (2.3%) |
| 75 Years and over | 24 (12.1%) | 132 (50.6%) |
Disability Class: Vision Difficulty
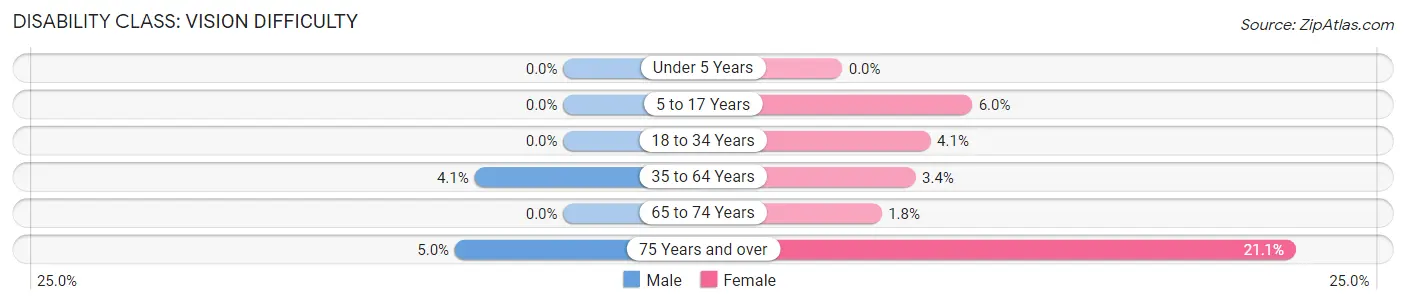
| Age Bracket | Male | Female |
| Under 5 Years | 0 (0.0%) | 0 (0.0%) |
| 5 to 17 Years | 0 (0.0%) | 14 (6.0%) |
| 18 to 34 Years | 0 (0.0%) | 12 (4.1%) |
| 35 to 64 Years | 32 (4.1%) | 23 (3.4%) |
| 65 to 74 Years | 0 (0.0%) | 8 (1.8%) |
| 75 Years and over | 10 (5.0%) | 55 (21.1%) |
Disability Class: Cognitive Difficulty
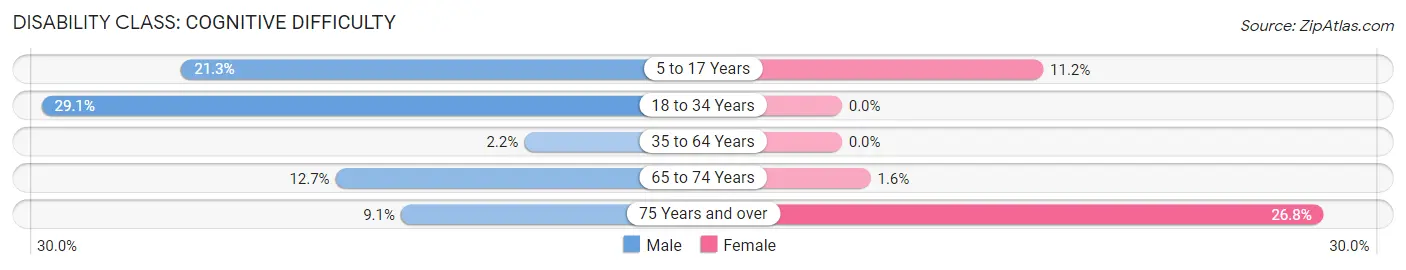
| Age Bracket | Male | Female |
| 5 to 17 Years | 47 (21.3%) | 26 (11.2%) |
| 18 to 34 Years | 52 (29.0%) | 0 (0.0%) |
| 35 to 64 Years | 17 (2.2%) | 0 (0.0%) |
| 65 to 74 Years | 34 (12.7%) | 7 (1.6%) |
| 75 Years and over | 18 (9.0%) | 70 (26.8%) |
Disability Class: Ambulatory Difficulty
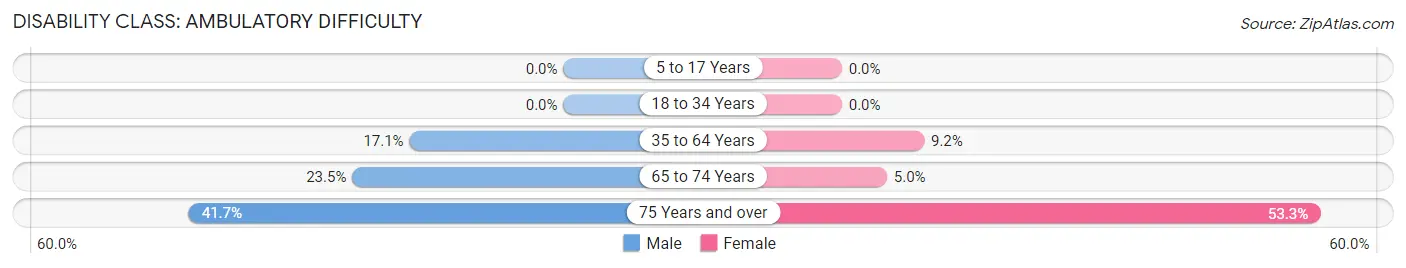
| Age Bracket | Male | Female |
| 5 to 17 Years | 0 (0.0%) | 0 (0.0%) |
| 18 to 34 Years | 0 (0.0%) | 0 (0.0%) |
| 35 to 64 Years | 133 (17.1%) | 62 (9.2%) |
| 65 to 74 Years | 63 (23.5%) | 22 (5.0%) |
| 75 Years and over | 83 (41.7%) | 139 (53.3%) |
Disability Class: Self-Care Difficulty
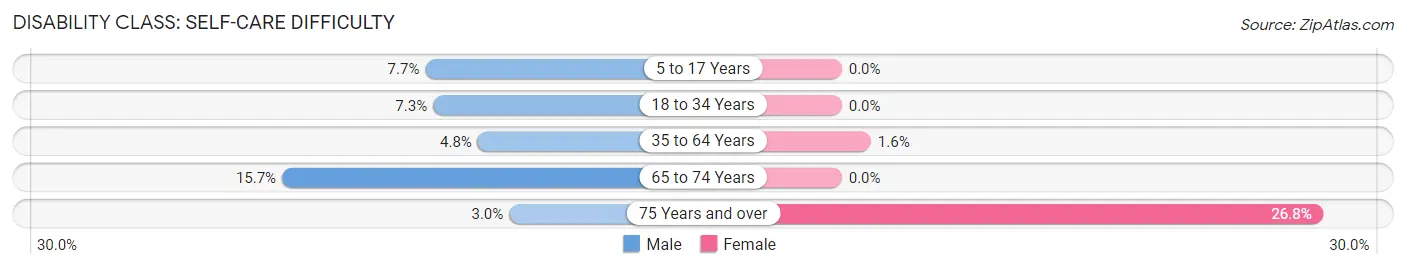
| Age Bracket | Male | Female |
| 5 to 17 Years | 17 (7.7%) | 0 (0.0%) |
| 18 to 34 Years | 13 (7.3%) | 0 (0.0%) |
| 35 to 64 Years | 37 (4.8%) | 11 (1.6%) |
| 65 to 74 Years | 42 (15.7%) | 0 (0.0%) |
| 75 Years and over | 6 (3.0%) | 70 (26.8%) |
Technology Access in North Cape May
Computing Device Access in North Cape May
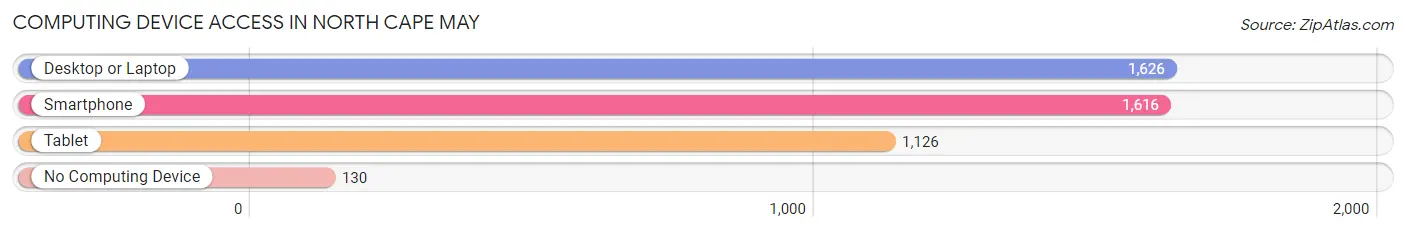
| Device Type | # Households | % Households |
| Desktop or Laptop | 1,626 | 85.2% |
| Smartphone | 1,616 | 84.7% |
| Tablet | 1,126 | 59.0% |
| No Computing Device | 130 | 6.8% |
| Total | 1,908 | 100.0% |
Internet Access in North Cape May
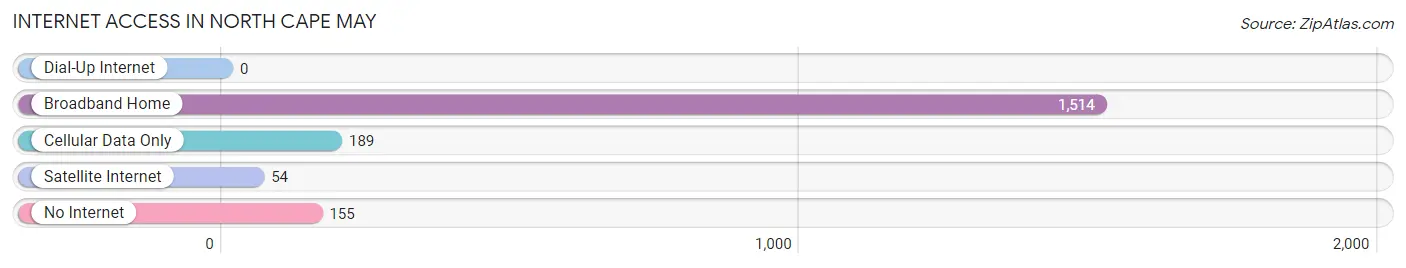
| Internet Type | # Households | % Households |
| Dial-Up Internet | 0 | 0.0% |
| Broadband Home | 1,514 | 79.3% |
| Cellular Data Only | 189 | 9.9% |
| Satellite Internet | 54 | 2.8% |
| No Internet | 155 | 8.1% |
| Total | 1,908 | 100.0% |
North Cape May Summary
Introduction
North Cape May is a small unincorporated community located in Lower Township, Cape May County, New Jersey. It is situated on the Delaware Bay, just south of the Cape May Canal. The community is home to a variety of businesses, including restaurants, shops, and a marina. North Cape May is a popular destination for tourists, who come to enjoy the area's beaches, fishing, and other recreational activities.
History
North Cape May was originally part of Lower Township, which was established in 1692. The area was first settled by Dutch and English colonists in the late 1600s. The community was known as "Cape May Point" until the early 1900s, when it was renamed "North Cape May."
In the late 1800s, the area was a popular destination for vacationers, who came to enjoy the area's beaches and fishing. The community was also home to a number of resorts, including the North Cape May Hotel, which opened in 1891.
In the early 1900s, the area began to develop as a residential community. The first homes were built in the 1920s, and the community continued to grow throughout the 20th century.
Geography
North Cape May is located in Lower Township, Cape May County, New Jersey. It is situated on the Delaware Bay, just south of the Cape May Canal. The community is bordered by the towns of Villas to the north, West Cape May to the east, and Cape May Point to the south.
The area is characterized by flat terrain, with sandy beaches and marshlands. The community is home to a variety of wildlife, including ospreys, herons, and other waterfowl.
Economy
North Cape May is a popular destination for tourists, who come to enjoy the area's beaches, fishing, and other recreational activities. The community is home to a variety of businesses, including restaurants, shops, and a marina.
The area is also home to a number of seasonal businesses, including ice cream stands, souvenir shops, and beachwear stores. The community is also home to a number of bed and breakfasts, as well as a number of vacation rental properties.
Demographics
As of the 2010 census, North Cape May had a population of 1,845. The population is predominantly white (94.3%), with a small percentage of African Americans (2.2%) and Hispanics (2.2%). The median household income is $50,972, and the median age is 44.
Conclusion
North Cape May is a small unincorporated community located in Lower Township, Cape May County, New Jersey. It is situated on the Delaware Bay, just south of the Cape May Canal. The community is home to a variety of businesses, including restaurants, shops, and a marina. North Cape May is a popular destination for tourists, who come to enjoy the area's beaches, fishing, and other recreational activities. The population is predominantly white, with a median household income of $50,972 and a median age of 44.
Common Questions
What is the Total Population of North Cape May?
Total Population of North Cape May is 3,832.
What is the Total Male Population of North Cape May?
Total Male Population of North Cape May is 1,772.
What is the Total Female Population of North Cape May?
Total Female Population of North Cape May is 2,060.
What is the Ratio of Males per 100 Females in North Cape May?
There are 86.02 Males per 100 Females in North Cape May.
What is the Ratio of Females per 100 Males in North Cape May?
There are 116.25 Females per 100 Males in North Cape May.
What is the Median Population Age in North Cape May?
Median Population Age in North Cape May is 55.2 Years.
What is the Average Family Size in North Cape May
Average Family Size in North Cape May is 2.7 People.
What is the Average Household Size in North Cape May
Average Household Size in North Cape May is 2.0 People.
What is Per Capita Income in North Cape May?
Per Capita income in North Cape May is $42,462.
What is the Median Family Income in North Cape May?
Median Family Income in North Cape May is $92,128.
What is the Median Household income in North Cape May?
Median Household Income in North Cape May is $71,389.
What is Income or Wage Gap in North Cape May?
Income or Wage Gap in North Cape May is 22.6%.
Women in North Cape May earn 77.4 cents for every dollar earned by a man.
What is Inequality or Gini Index in North Cape May?
Inequality or Gini Index in North Cape May is 0.38.
How Large is the Labor Force in North Cape May?
There are 1,860 People in the Labor Forcein in North Cape May.
What is the Percentage of People in the Labor Force in North Cape May?
56.2% of People are in the Labor Force in North Cape May.
What is the Unemployment Rate in North Cape May?
Unemployment Rate in North Cape May is 4.9%.