Red Bank borough, NJ
Red Bank borough Overview
12,868
TOTAL POPULATION
6,146
MALE POPULATION
6,722
FEMALE POPULATION
91.43
MALES / 100 FEMALES
109.37
FEMALES / 100 MALES
39.4
MEDIAN AGE
2.9
AVG FAMILY SIZE
2.1
AVG HOUSEHOLD SIZE
$66,966
PER CAPITA INCOME
$114,331
AVG FAMILY INCOME
$89,500
AVG HOUSEHOLD INCOME
4.7%
WAGE / INCOME GAP [ % ]
95.3¢/ $1
WAGE / INCOME GAP [ $ ]
0.53
INEQUALITY / GINI INDEX
7,276
LABOR FORCE [ PEOPLE ]
68.8%
PERCENT IN LABOR FORCE
3.2%
UNEMPLOYMENT RATE
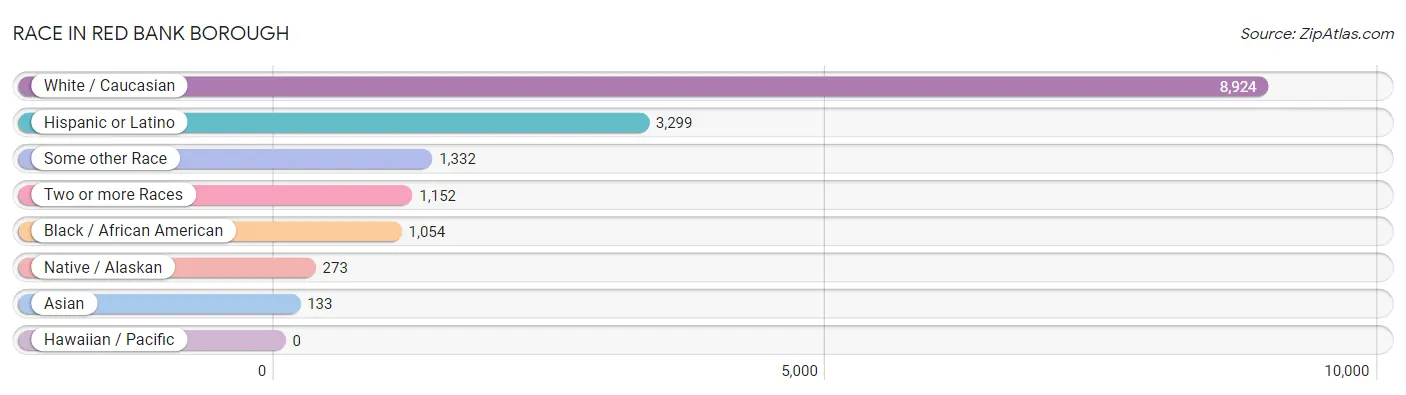
Race in Red Bank borough
The most populous races in Red Bank borough are White / Caucasian (8,924 | 69.4%), Hispanic or Latino (3,299 | 25.6%), and Some other Race (1,332 | 10.3%).
| Race | # Population | % Population |
| Asian | 133 | 1.0% |
| Black / African American | 1,054 | 8.2% |
| Hawaiian / Pacific | 0 | 0.0% |
| Hispanic or Latino | 3,299 | 25.6% |
| Native / Alaskan | 273 | 2.1% |
| White / Caucasian | 8,924 | 69.4% |
| Two or more Races | 1,152 | 8.9% |
| Some other Race | 1,332 | 10.3% |
| Total | 12,868 | 100.0% |
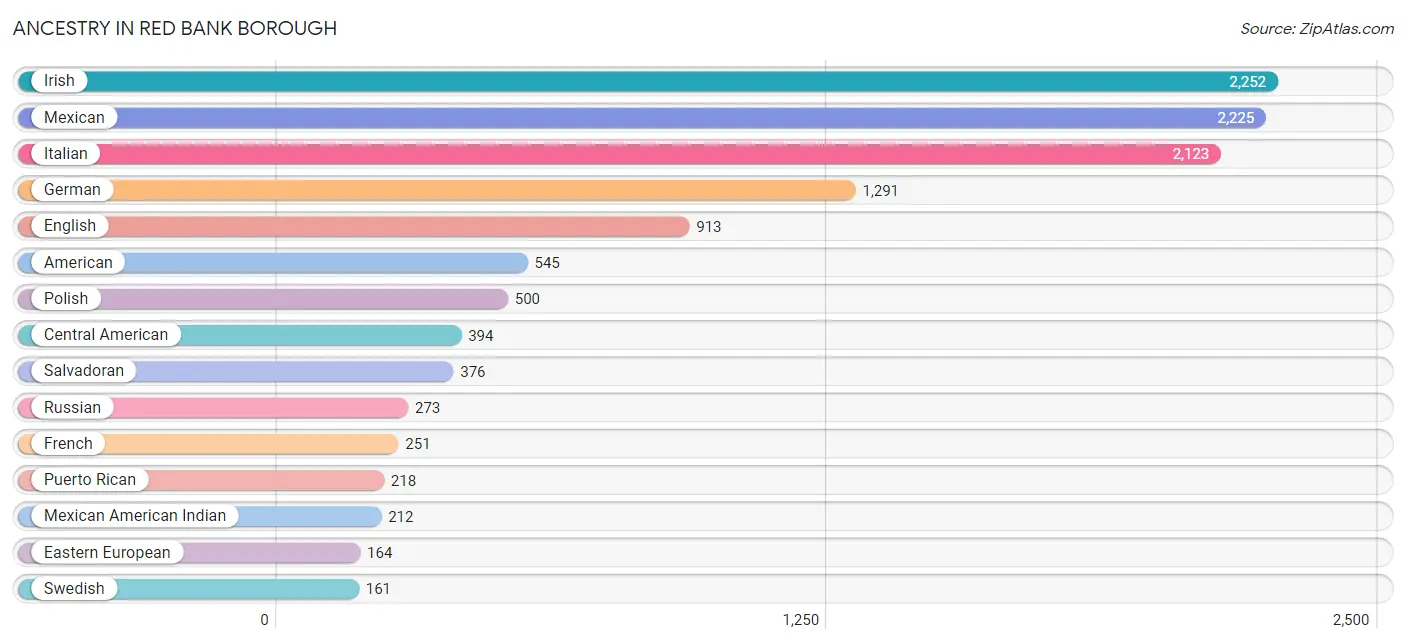
Ancestry in Red Bank borough
The most populous ancestries reported in Red Bank borough are Irish (2,252 | 17.5%), Mexican (2,225 | 17.3%), Italian (2,123 | 16.5%), German (1,291 | 10.0%), and English (913 | 7.1%), together accounting for 68.4% of all Red Bank borough residents.
| Ancestry | # Population | % Population |
| African | 35 | 0.3% |
| Albanian | 17 | 0.1% |
| American | 545 | 4.2% |
| Arab | 95 | 0.7% |
| Argentinean | 28 | 0.2% |
| Armenian | 13 | 0.1% |
| Assyrian / Chaldean / Syriac | 15 | 0.1% |
| Austrian | 44 | 0.3% |
| British | 114 | 0.9% |
| Bulgarian | 83 | 0.6% |
| Burmese | 34 | 0.3% |
| Central American | 394 | 3.1% |
| Croatian | 59 | 0.5% |
| Cuban | 16 | 0.1% |
| Czechoslovakian | 104 | 0.8% |
| Danish | 85 | 0.7% |
| Delaware | 13 | 0.1% |
| Dominican | 29 | 0.2% |
| Dutch | 137 | 1.1% |
| Eastern European | 164 | 1.3% |
| Ecuadorian | 21 | 0.2% |
| English | 913 | 7.1% |
| European | 118 | 0.9% |
| French | 251 | 1.9% |
| French Canadian | 13 | 0.1% |
| German | 1,291 | 10.0% |
| Greek | 16 | 0.1% |
| Guatemalan | 18 | 0.1% |
| Hungarian | 40 | 0.3% |
| Indian (Asian) | 58 | 0.4% |
| Irish | 2,252 | 17.5% |
| Italian | 2,123 | 16.5% |
| Jamaican | 112 | 0.9% |
| Jordanian | 50 | 0.4% |
| Korean | 22 | 0.2% |
| Lebanese | 40 | 0.3% |
| Lithuanian | 37 | 0.3% |
| Mexican | 2,225 | 17.3% |
| Mexican American Indian | 212 | 1.7% |
| New Zealander | 5 | 0.0% |
| Nigerian | 23 | 0.2% |
| Norwegian | 40 | 0.3% |
| Paraguayan | 15 | 0.1% |
| Peruvian | 15 | 0.1% |
| Polish | 500 | 3.9% |
| Portuguese | 15 | 0.1% |
| Puerto Rican | 218 | 1.7% |
| Russian | 273 | 2.1% |
| Salvadoran | 376 | 2.9% |
| Scandinavian | 70 | 0.5% |
| Scotch-Irish | 40 | 0.3% |
| Scottish | 143 | 1.1% |
| Slavic | 14 | 0.1% |
| Slovak | 38 | 0.3% |
| South American | 79 | 0.6% |
| Spaniard | 123 | 1.0% |
| Spanish | 5 | 0.0% |
| Sri Lankan | 23 | 0.2% |
| Subsaharan African | 58 | 0.4% |
| Swedish | 161 | 1.3% |
| Swiss | 13 | 0.1% |
| Thai | 13 | 0.1% |
| Turkish | 61 | 0.5% |
| Ukrainian | 75 | 0.6% | View All 64 Rows |
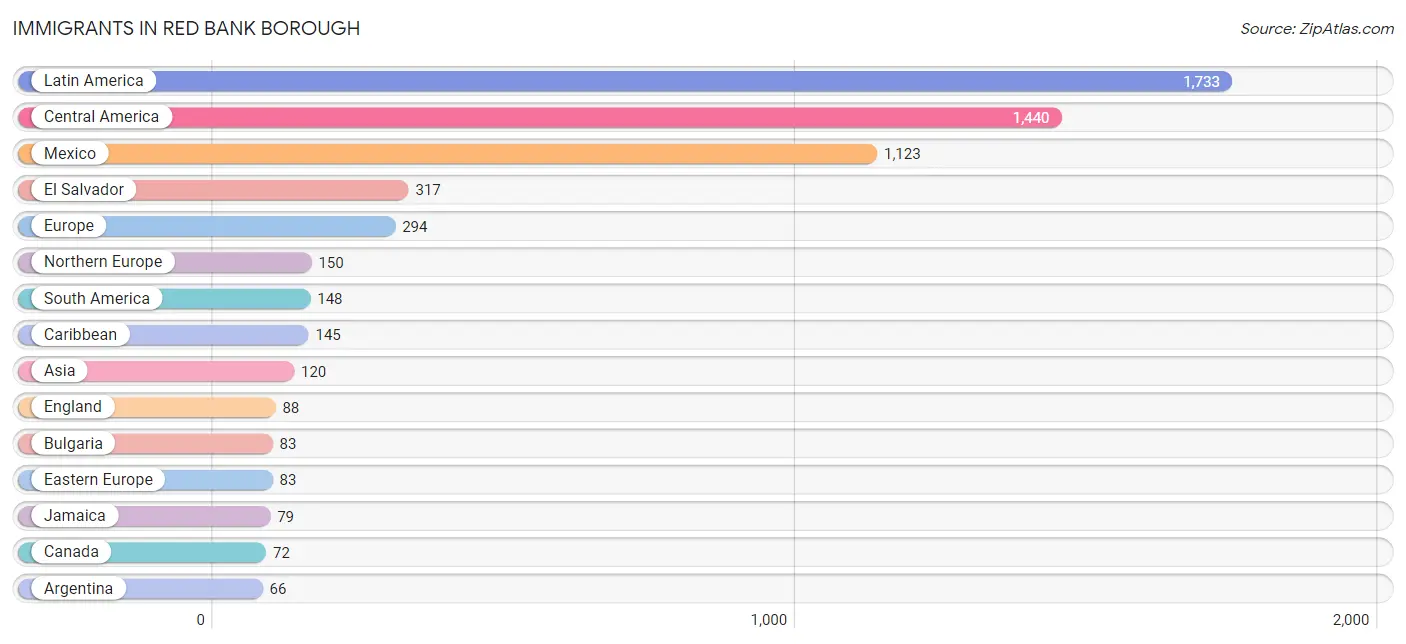
Immigrants in Red Bank borough
The most numerous immigrant groups reported in Red Bank borough came from Latin America (1,733 | 13.5%), Central America (1,440 | 11.2%), Mexico (1,123 | 8.7%), El Salvador (317 | 2.5%), and Europe (294 | 2.3%), together accounting for 38.1% of all Red Bank borough residents.
| Immigration Origin | # Population | % Population |
| Africa | 23 | 0.2% |
| Argentina | 66 | 0.5% |
| Asia | 120 | 0.9% |
| Australia | 60 | 0.5% |
| Brazil | 47 | 0.4% |
| Bulgaria | 83 | 0.6% |
| Canada | 72 | 0.6% |
| Caribbean | 145 | 1.1% |
| Central America | 1,440 | 11.2% |
| China | 20 | 0.2% |
| Cuba | 37 | 0.3% |
| Dominican Republic | 29 | 0.2% |
| Eastern Asia | 36 | 0.3% |
| Eastern Europe | 83 | 0.6% |
| Ecuador | 5 | 0.0% |
| El Salvador | 317 | 2.5% |
| England | 88 | 0.7% |
| Europe | 294 | 2.3% |
| India | 28 | 0.2% |
| Italy | 30 | 0.2% |
| Jamaica | 79 | 0.6% |
| Korea | 16 | 0.1% |
| Latin America | 1,733 | 13.5% |
| Lebanon | 15 | 0.1% |
| Mexico | 1,123 | 8.7% |
| Netherlands | 25 | 0.2% |
| Nigeria | 23 | 0.2% |
| Northern Europe | 150 | 1.2% |
| Oceania | 60 | 0.5% |
| Peru | 15 | 0.1% |
| Philippines | 5 | 0.0% |
| Scotland | 8 | 0.1% |
| South America | 148 | 1.1% |
| South Central Asia | 28 | 0.2% |
| South Eastern Asia | 28 | 0.2% |
| Southern Europe | 30 | 0.2% |
| Switzerland | 6 | 0.1% |
| Taiwan | 20 | 0.2% |
| Turkey | 13 | 0.1% |
| Vietnam | 23 | 0.2% |
| Western Africa | 23 | 0.2% |
| Western Asia | 28 | 0.2% |
| Western Europe | 31 | 0.2% | View All 43 Rows |
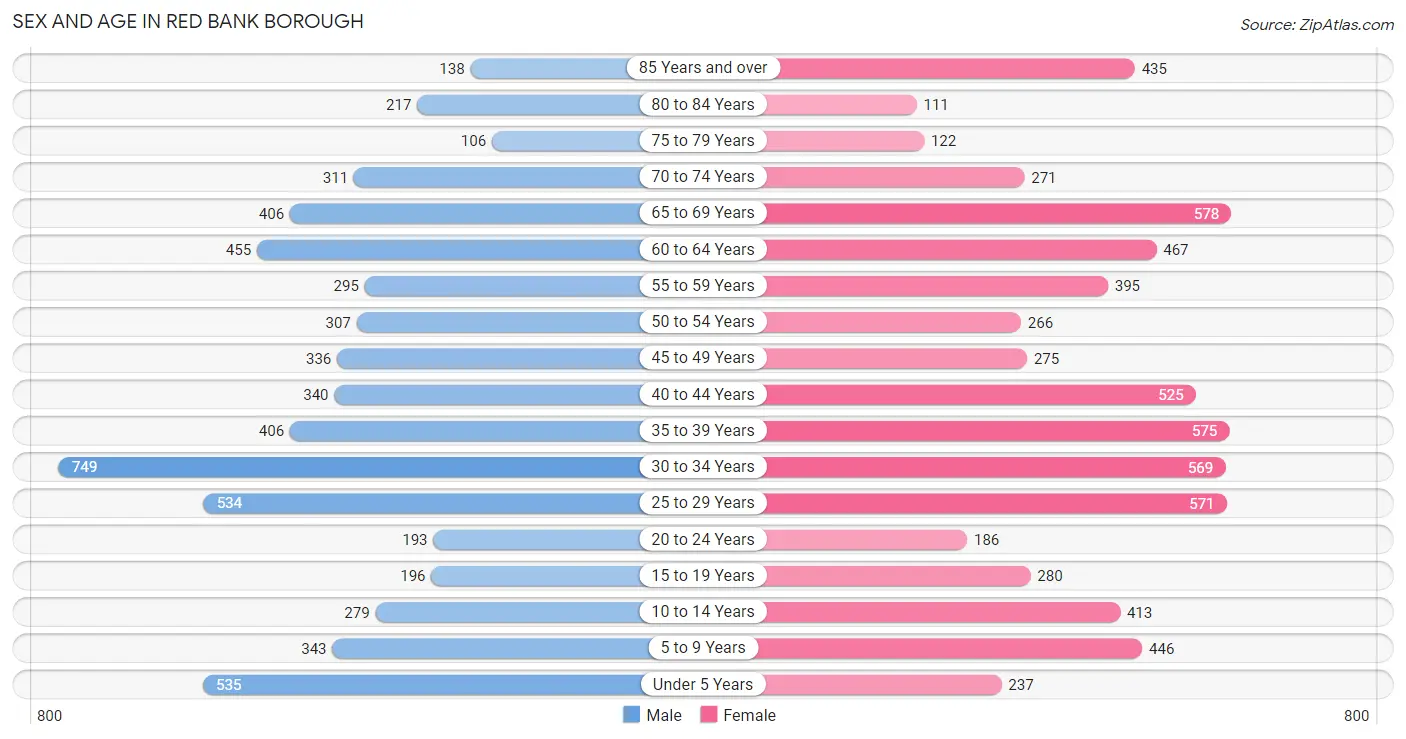
Sex and Age in Red Bank borough
Sex and Age in Red Bank borough
The most populous age groups in Red Bank borough are 30 to 34 Years (749 | 12.2%) for men and 65 to 69 Years (578 | 8.6%) for women.
| Age Bracket | Male | Female |
| Under 5 Years | 535 (8.7%) | 237 (3.5%) |
| 5 to 9 Years | 343 (5.6%) | 446 (6.6%) |
| 10 to 14 Years | 279 (4.5%) | 413 (6.1%) |
| 15 to 19 Years | 196 (3.2%) | 280 (4.2%) |
| 20 to 24 Years | 193 (3.1%) | 186 (2.8%) |
| 25 to 29 Years | 534 (8.7%) | 571 (8.5%) |
| 30 to 34 Years | 749 (12.2%) | 569 (8.5%) |
| 35 to 39 Years | 406 (6.6%) | 575 (8.6%) |
| 40 to 44 Years | 340 (5.5%) | 525 (7.8%) |
| 45 to 49 Years | 336 (5.5%) | 275 (4.1%) |
| 50 to 54 Years | 307 (5.0%) | 266 (4.0%) |
| 55 to 59 Years | 295 (4.8%) | 395 (5.9%) |
| 60 to 64 Years | 455 (7.4%) | 467 (7.0%) |
| 65 to 69 Years | 406 (6.6%) | 578 (8.6%) |
| 70 to 74 Years | 311 (5.1%) | 271 (4.0%) |
| 75 to 79 Years | 106 (1.7%) | 122 (1.8%) |
| 80 to 84 Years | 217 (3.5%) | 111 (1.7%) |
| 85 Years and over | 138 (2.2%) | 435 (6.5%) |
| Total | 6,146 (100.0%) | 6,722 (100.0%) |
Families and Households in Red Bank borough
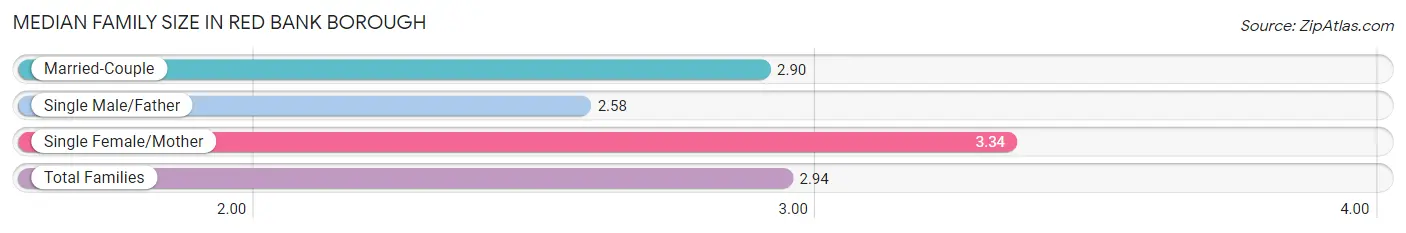
Median Family Size in Red Bank borough
The median family size in Red Bank borough is 2.94 persons per family, with single female/mother families (552 | 18.5%) accounting for the largest median family size of 3.34 persons per family. On the other hand, single male/father families (357 | 11.9%) represent the smallest median family size with 2.58 persons per family.
| Family Type | # Families | Family Size |
| Married-Couple | 2,082 (69.6%) | 2.90 |
| Single Male/Father | 357 (11.9%) | 2.58 |
| Single Female/Mother | 552 (18.5%) | 3.34 |
| Total Families | 2,991 (100.0%) | 2.94 |
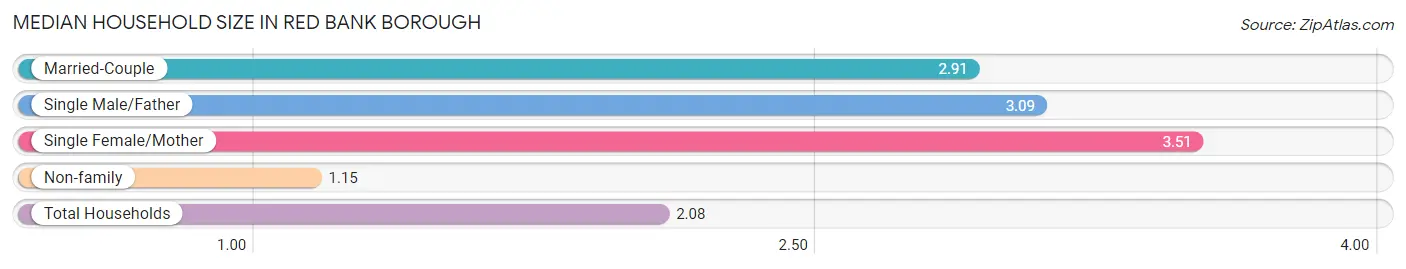
Median Household Size in Red Bank borough
The median household size in Red Bank borough is 2.08 persons per household, with single female/mother households (552 | 9.1%) accounting for the largest median household size of 3.51 persons per household. non-family households (3,093 | 50.8%) represent the smallest median household size with 1.15 persons per household.
| Household Type | # Households | Household Size |
| Married-Couple | 2,082 (34.2%) | 2.91 |
| Single Male/Father | 357 (5.9%) | 3.09 |
| Single Female/Mother | 552 (9.1%) | 3.51 |
| Non-family | 3,093 (50.8%) | 1.15 |
| Total Households | 6,084 (100.0%) | 2.08 |
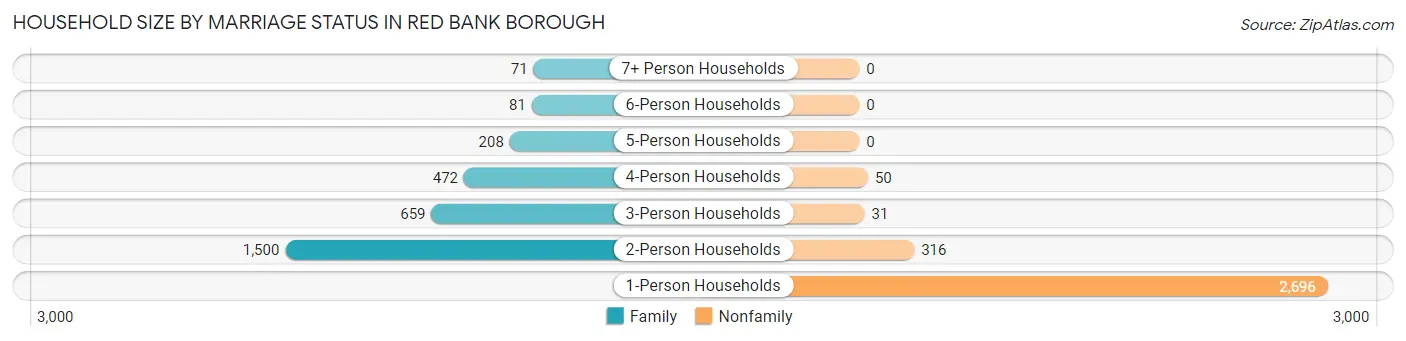
Household Size by Marriage Status in Red Bank borough
Out of a total of 6,084 households in Red Bank borough, 2,991 (49.2%) are family households, while 3,093 (50.8%) are nonfamily households. The most numerous type of family households are 2-person households, comprising 1,500, and the most common type of nonfamily households are 1-person households, comprising 2,696.
| Household Size | Family Households | Nonfamily Households |
| 1-Person Households | - | 2,696 (44.3%) |
| 2-Person Households | 1,500 (24.6%) | 316 (5.2%) |
| 3-Person Households | 659 (10.8%) | 31 (0.5%) |
| 4-Person Households | 472 (7.8%) | 50 (0.8%) |
| 5-Person Households | 208 (3.4%) | 0 (0.0%) |
| 6-Person Households | 81 (1.3%) | 0 (0.0%) |
| 7+ Person Households | 71 (1.2%) | 0 (0.0%) |
| Total | 2,991 (49.2%) | 3,093 (50.8%) |
Female Fertility in Red Bank borough
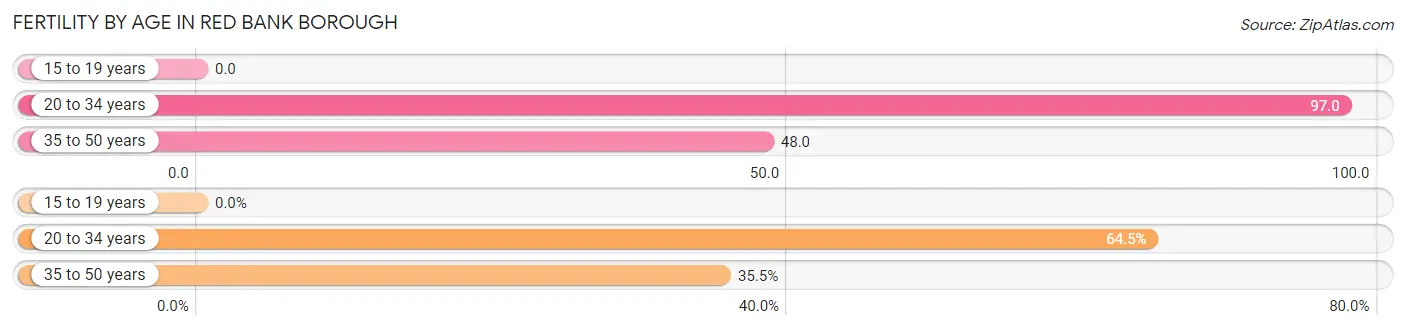
Fertility by Age in Red Bank borough
Average fertility rate in Red Bank borough is 65.0 births per 1,000 women. Women in the age bracket of 20 to 34 years have the highest fertility rate with 97.0 births per 1,000 women. Women in the age bracket of 20 to 34 years acount for 64.5% of all women with births.
| Age Bracket | Women with Births | Births / 1,000 Women |
| 15 to 19 years | 0 (0.0%) | 0.0 |
| 20 to 34 years | 129 (64.5%) | 97.0 |
| 35 to 50 years | 71 (35.5%) | 48.0 |
| Total | 200 (100.0%) | 65.0 |
Fertility by Age by Marriage Status in Red Bank borough
67.5% of women with births (200) in Red Bank borough are married. The highest percentage of unmarried women with births falls into 20 to 34 years age bracket with 42.6% of them unmarried at the time of birth, while the lowest percentage of unmarried women with births belong to 35 to 50 years age bracket with 14.1% of them unmarried.
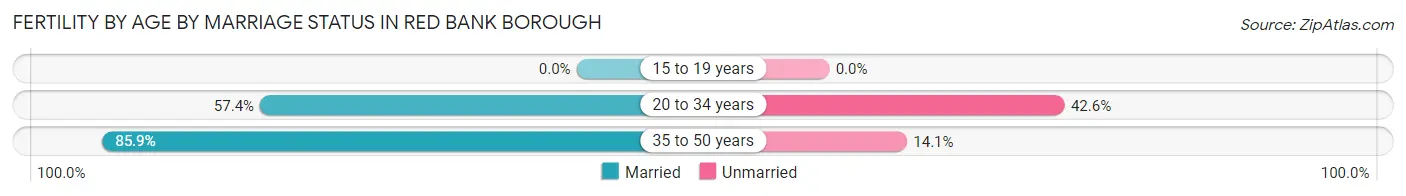
| Age Bracket | Married | Unmarried |
| 15 to 19 years | 0 (0.0%) | 0 (0.0%) |
| 20 to 34 years | 74 (57.4%) | 55 (42.6%) |
| 35 to 50 years | 61 (85.9%) | 10 (14.1%) |
| Total | 135 (67.5%) | 65 (32.5%) |
Fertility by Education in Red Bank borough
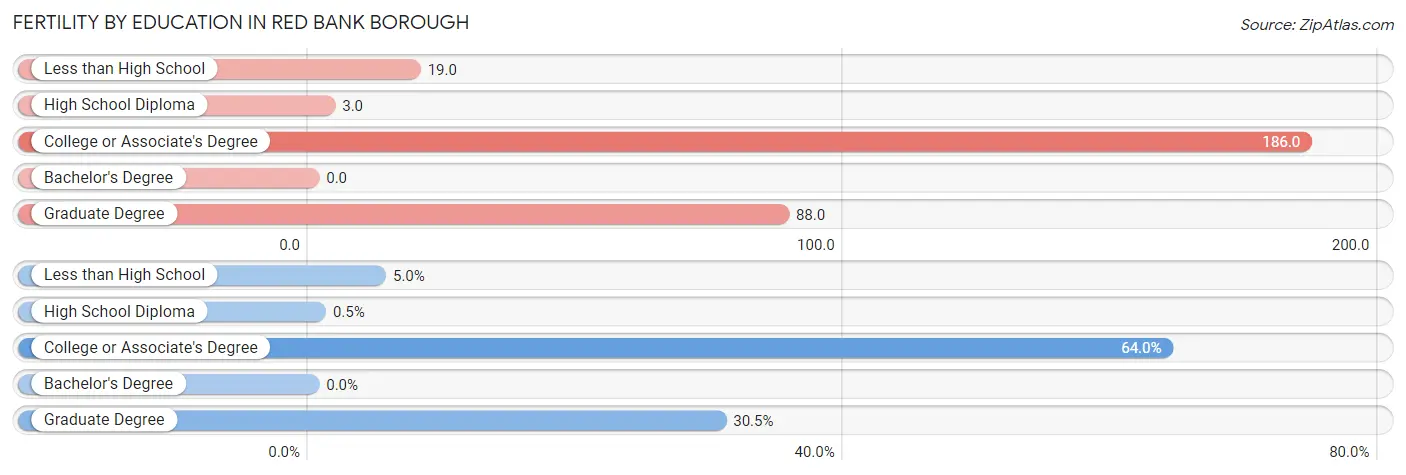
| Educational Attainment | Women with Births | Births / 1,000 Women |
| Less than High School | 10 (5.0%) | 19.0 |
| High School Diploma | 1 (0.5%) | 3.0 |
| College or Associate's Degree | 128 (64.0%) | 186.0 |
| Bachelor's Degree | 0 (0.0%) | 0.0 |
| Graduate Degree | 61 (30.5%) | 88.0 |
| Total | 200 (100.0%) | 65.0 |
Fertility by Education by Marriage Status in Red Bank borough
32.5% of women with births in Red Bank borough are unmarried. Women with the educational attainment of graduate degree are most likely to be married with 100.0% of them married at childbirth, while women with the educational attainment of less than high school are least likely to be married with 100.0% of them unmarried at childbirth.
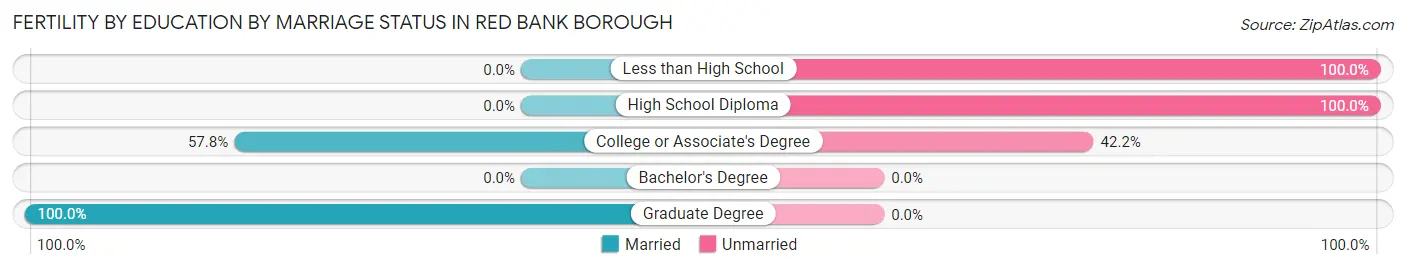
| Educational Attainment | Married | Unmarried |
| Less than High School | 0 (0.0%) | 10 (100.0%) |
| High School Diploma | 0 (0.0%) | 1 (100.0%) |
| College or Associate's Degree | 74 (57.8%) | 54 (42.2%) |
| Bachelor's Degree | 0 (0.0%) | 0 (0.0%) |
| Graduate Degree | 61 (100.0%) | 0 (0.0%) |
| Total | 135 (67.5%) | 65 (32.5%) |
Income in Red Bank borough
Income Overview in Red Bank borough
Per Capita Income in Red Bank borough is $66,966, while median incomes of families and households are $114,331 and $89,500 respectively.
| Characteristic | Number | Measure |
| Per Capita Income | 12,868 | $66,966 |
| Median Family Income | 2,991 | $114,331 |
| Mean Family Income | 2,991 | $172,517 |
| Median Household Income | 6,084 | $89,500 |
| Mean Household Income | 6,084 | $141,796 |
| Income Deficit | 2,991 | $0 |
| Wage / Income Gap (%) | 12,868 | 4.65% |
| Wage / Income Gap ($) | 12,868 | 95.35¢ per $1 |
| Gini / Inequality Index | 12,868 | 0.53 |
Earnings by Sex in Red Bank borough
Average Earnings in Red Bank borough are $63,463, $64,986 for men and $61,961 for women, a difference of 4.6%.
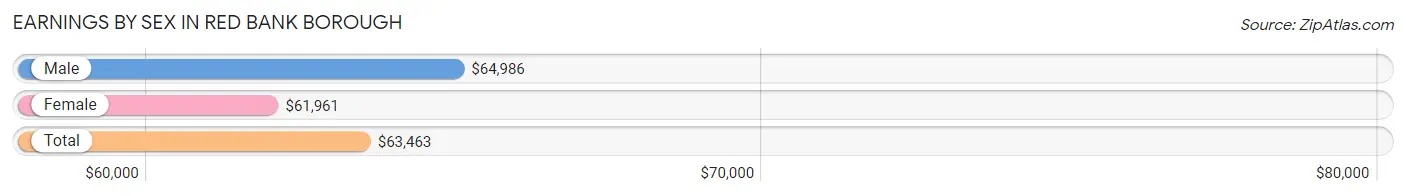
| Sex | Number | Average Earnings |
| Male | 3,721 (47.8%) | $64,986 |
| Female | 4,057 (52.2%) | $61,961 |
| Total | 7,778 (100.0%) | $63,463 |
Earnings by Sex by Income Bracket in Red Bank borough
The most common earnings brackets in Red Bank borough are $100,000+ for men (987 | 26.5%) and $100,000+ for women (849 | 20.9%).
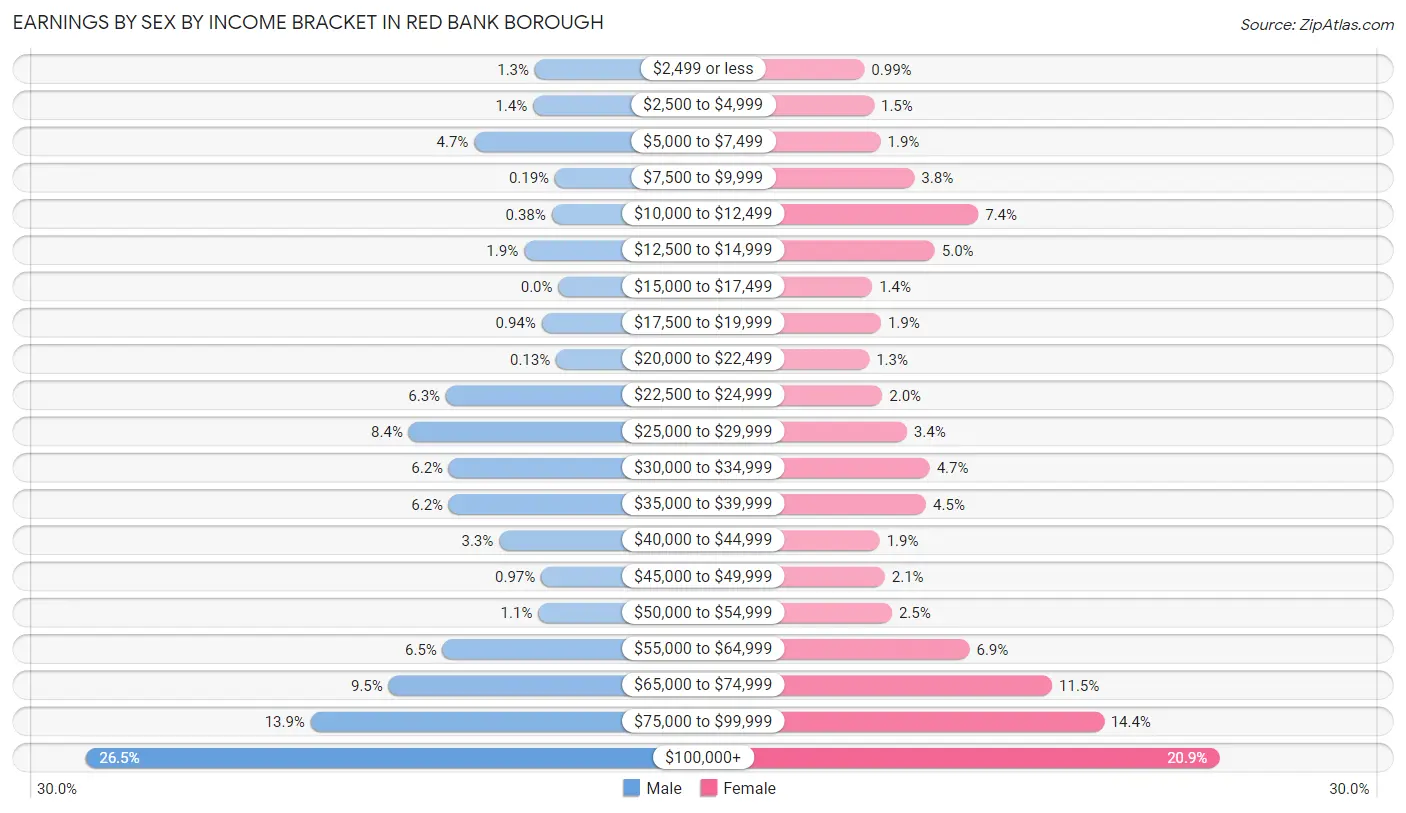
| Income | Male | Female |
| $2,499 or less | 49 (1.3%) | 40 (1.0%) |
| $2,500 to $4,999 | 53 (1.4%) | 62 (1.5%) |
| $5,000 to $7,499 | 176 (4.7%) | 77 (1.9%) |
| $7,500 to $9,999 | 7 (0.2%) | 154 (3.8%) |
| $10,000 to $12,499 | 14 (0.4%) | 300 (7.4%) |
| $12,500 to $14,999 | 72 (1.9%) | 201 (5.0%) |
| $15,000 to $17,499 | 0 (0.0%) | 58 (1.4%) |
| $17,500 to $19,999 | 35 (0.9%) | 78 (1.9%) |
| $20,000 to $22,499 | 5 (0.1%) | 51 (1.3%) |
| $22,500 to $24,999 | 235 (6.3%) | 81 (2.0%) |
| $25,000 to $29,999 | 313 (8.4%) | 137 (3.4%) |
| $30,000 to $34,999 | 229 (6.1%) | 189 (4.7%) |
| $35,000 to $39,999 | 229 (6.1%) | 181 (4.5%) |
| $40,000 to $44,999 | 124 (3.3%) | 75 (1.8%) |
| $45,000 to $49,999 | 36 (1.0%) | 87 (2.1%) |
| $50,000 to $54,999 | 42 (1.1%) | 103 (2.5%) |
| $55,000 to $64,999 | 242 (6.5%) | 280 (6.9%) |
| $65,000 to $74,999 | 355 (9.5%) | 468 (11.5%) |
| $75,000 to $99,999 | 518 (13.9%) | 586 (14.4%) |
| $100,000+ | 987 (26.5%) | 849 (20.9%) |
| Total | 3,721 (100.0%) | 4,057 (100.0%) |
Earnings by Sex by Educational Attainment in Red Bank borough
Average earnings in Red Bank borough are $66,630 for men and $65,399 for women, a difference of 1.8%. Men with an educational attainment of graduate degree enjoy the highest average annual earnings of $101,091, while those with less than high school education earn the least with $28,822. Women with an educational attainment of graduate degree earn the most with the average annual earnings of $81,667, while those with less than high school education have the smallest earnings of $19,769.
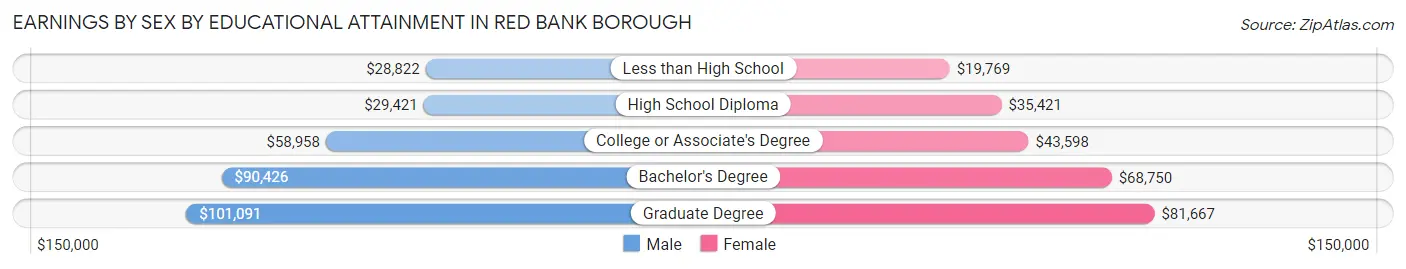
| Educational Attainment | Male Income | Female Income |
| Less than High School | $28,822 | $19,769 |
| High School Diploma | $29,421 | $35,421 |
| College or Associate's Degree | $58,958 | $43,598 |
| Bachelor's Degree | $90,426 | $68,750 |
| Graduate Degree | $101,091 | $81,667 |
| Total | $66,630 | $65,399 |
Family Income in Red Bank borough
Family Income Brackets in Red Bank borough
According to the Red Bank borough family income data, there are 757 families falling into the $200,000+ income range, which is the most common income bracket and makes up 25.3% of all families. Conversely, the less than $10,000 income bracket is the least frequent group with only 63 families (2.1%) belonging to this category.
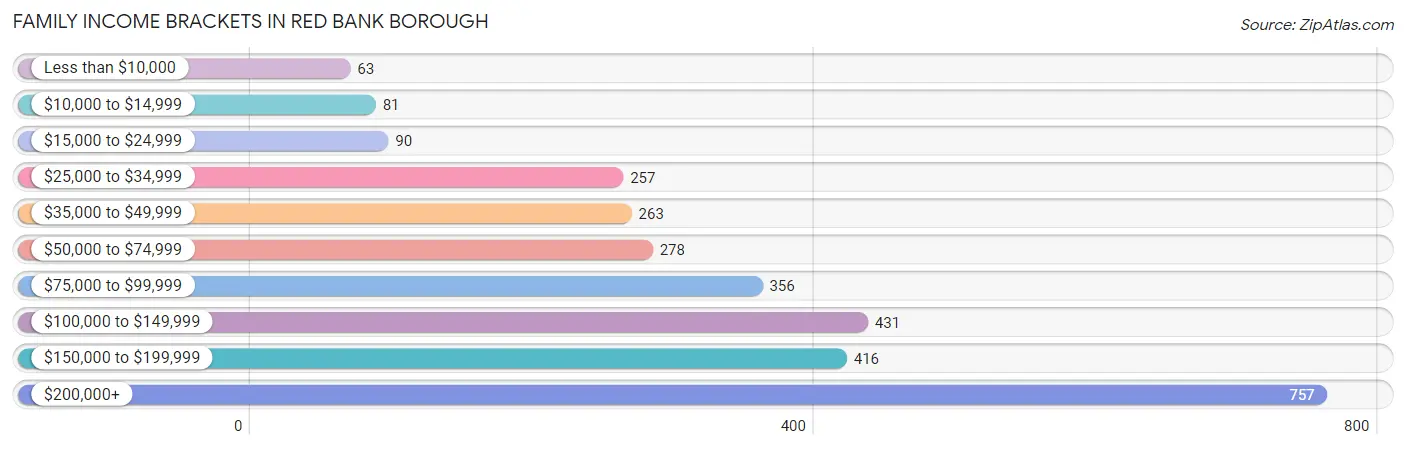
| Income Bracket | # Families | % Families |
| Less than $10,000 | 63 | 2.1% |
| $10,000 to $14,999 | 81 | 2.7% |
| $15,000 to $24,999 | 90 | 3.0% |
| $25,000 to $34,999 | 257 | 8.6% |
| $35,000 to $49,999 | 263 | 8.8% |
| $50,000 to $74,999 | 278 | 9.3% |
| $75,000 to $99,999 | 356 | 11.9% |
| $100,000 to $149,999 | 431 | 14.4% |
| $150,000 to $199,999 | 416 | 13.9% |
| $200,000+ | 757 | 25.3% |
Family Income by Famaliy Size in Red Bank borough
2-person families (1,678 | 56.1%) account for the highest median family income in Red Bank borough with $118,875 per family, while 2-person families (1,678 | 56.1%) have the highest median income of $59,438 per family member.
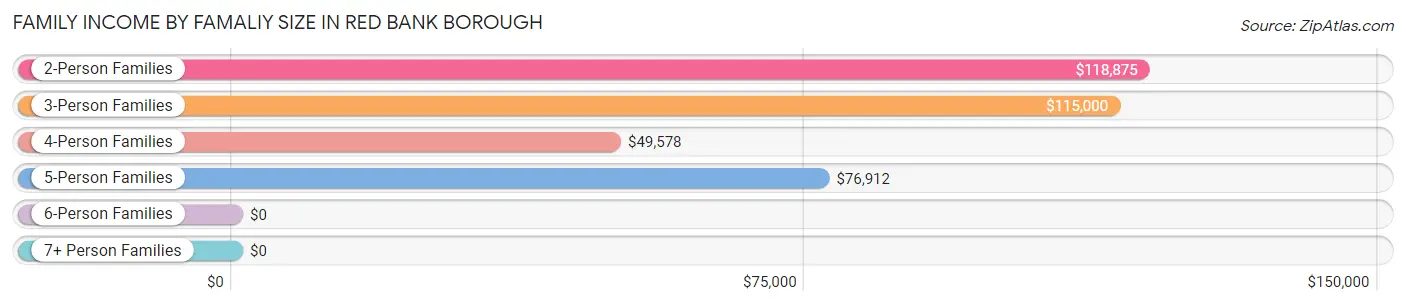
| Income Bracket | # Families | Median Income |
| 2-Person Families | 1,678 (56.1%) | $118,875 |
| 3-Person Families | 508 (17.0%) | $115,000 |
| 4-Person Families | 507 (17.0%) | $49,578 |
| 5-Person Families | 146 (4.9%) | $76,912 |
| 6-Person Families | 81 (2.7%) | $0 |
| 7+ Person Families | 71 (2.4%) | $0 |
| Total | 2,991 (100.0%) | $114,331 |
Family Income by Number of Earners in Red Bank borough
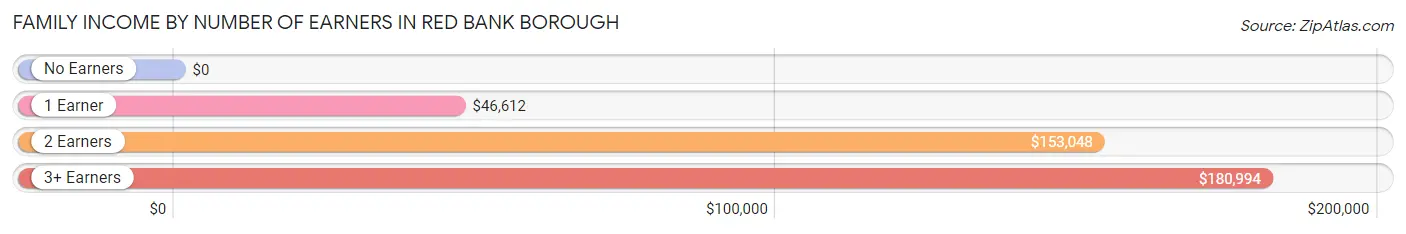
| Number of Earners | # Families | Median Income |
| No Earners | 316 (10.6%) | $0 |
| 1 Earner | 817 (27.3%) | $46,612 |
| 2 Earners | 1,555 (52.0%) | $153,048 |
| 3+ Earners | 303 (10.1%) | $180,994 |
| Total | 2,991 (100.0%) | $114,331 |
Household Income in Red Bank borough
Household Income Brackets in Red Bank borough
With 1,235 households falling in the category, the $200,000+ income range is the most frequent in Red Bank borough, accounting for 20.3% of all households. In contrast, only 231 households (3.8%) fall into the $10,000 to $14,999 income bracket, making it the least populous group.
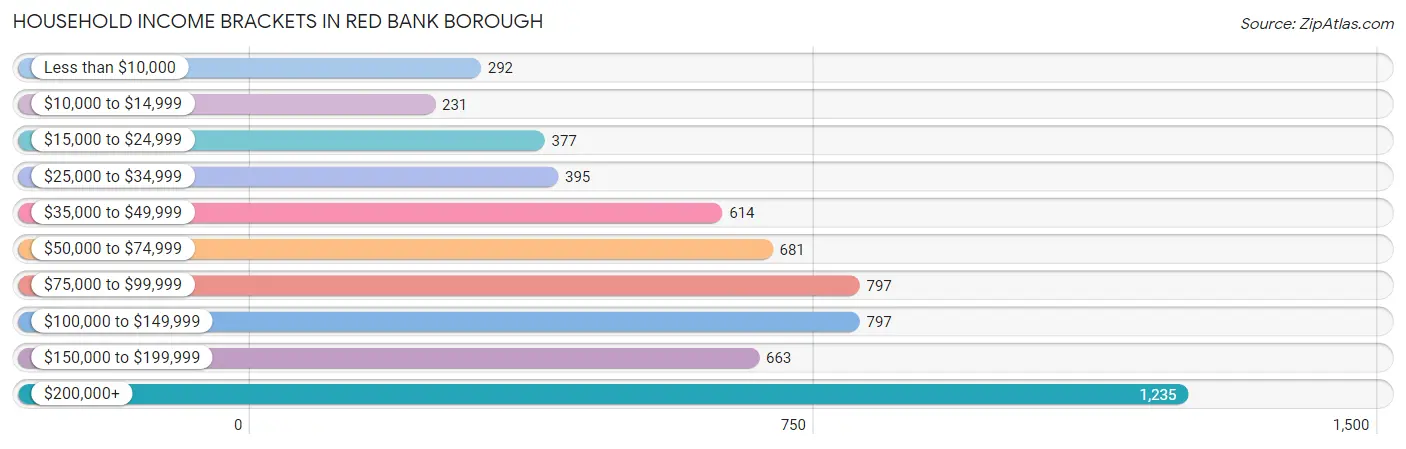
| Income Bracket | # Households | % Households |
| Less than $10,000 | 292 | 4.8% |
| $10,000 to $14,999 | 231 | 3.8% |
| $15,000 to $24,999 | 377 | 6.2% |
| $25,000 to $34,999 | 395 | 6.5% |
| $35,000 to $49,999 | 614 | 10.1% |
| $50,000 to $74,999 | 681 | 11.2% |
| $75,000 to $99,999 | 797 | 13.1% |
| $100,000 to $149,999 | 797 | 13.1% |
| $150,000 to $199,999 | 663 | 10.9% |
| $200,000+ | 1,235 | 20.3% |
Household Income by Householder Age in Red Bank borough
The median household income in Red Bank borough is $89,500, with the highest median household income of $110,256 found in the 45 to 64 years age bracket for the primary householder. A total of 1,952 households (32.1%) fall into this category. Meanwhile, the 15 to 24 years age bracket for the primary householder has the lowest median household income of $0, with 37 households (0.6%) in this group.
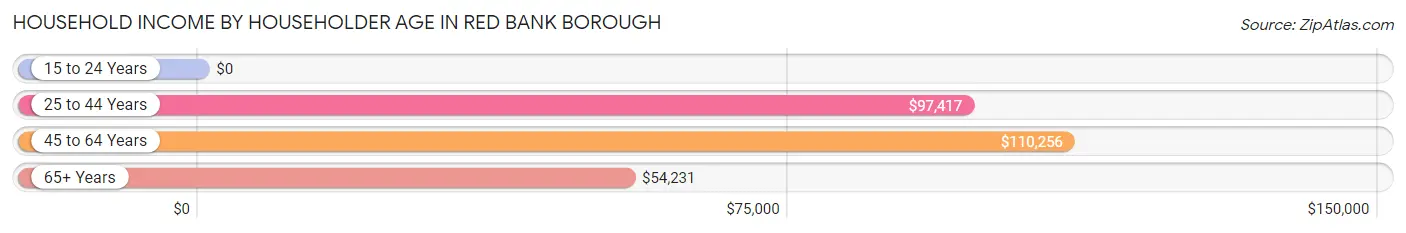
| Income Bracket | # Households | Median Income |
| 15 to 24 Years | 37 (0.6%) | $0 |
| 25 to 44 Years | 2,067 (34.0%) | $97,417 |
| 45 to 64 Years | 1,952 (32.1%) | $110,256 |
| 65+ Years | 2,028 (33.3%) | $54,231 |
| Total | 6,084 (100.0%) | $89,500 |
Poverty in Red Bank borough
Income Below Poverty by Sex and Age in Red Bank borough
With 10.9% poverty level for males and 9.8% for females among the residents of Red Bank borough, 65 to 74 year old males and under 5 year old females are the most vulnerable to poverty, with 176 males (25.2%) and 49 females (20.7%) in their respective age groups living below the poverty level.
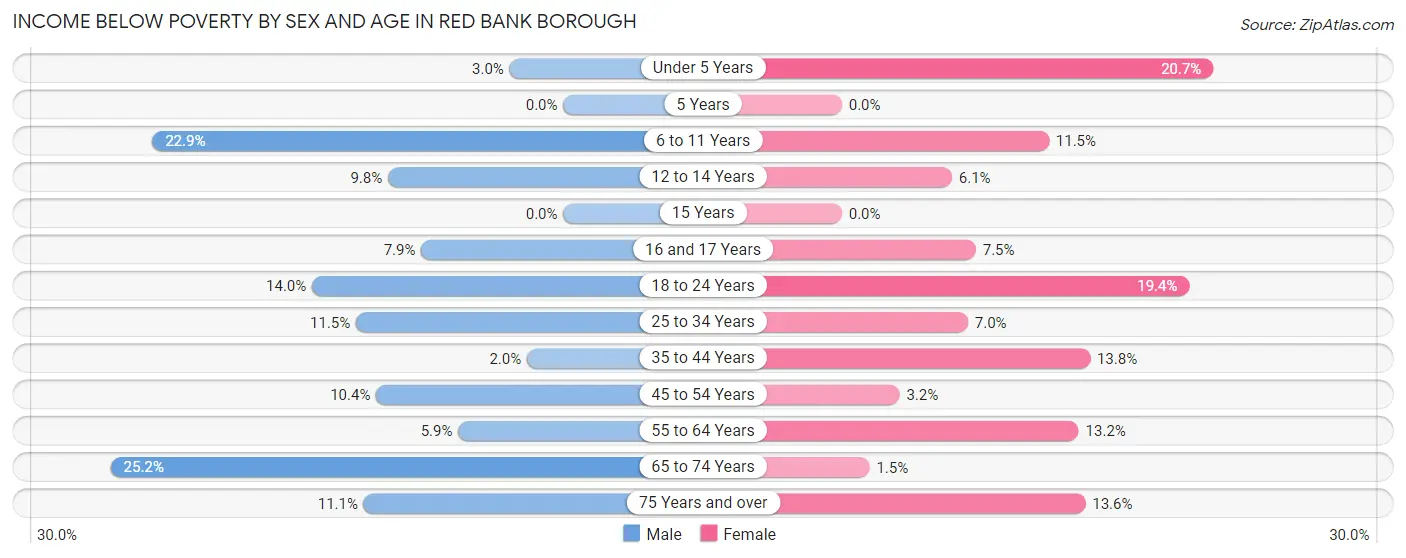
| Age Bracket | Male | Female |
| Under 5 Years | 16 (3.0%) | 49 (20.7%) |
| 5 Years | 0 (0.0%) | 0 (0.0%) |
| 6 to 11 Years | 95 (22.9%) | 67 (11.5%) |
| 12 to 14 Years | 12 (9.8%) | 13 (6.1%) |
| 15 Years | 0 (0.0%) | 0 (0.0%) |
| 16 and 17 Years | 14 (7.9%) | 17 (7.5%) |
| 18 to 24 Years | 27 (14.0%) | 42 (19.4%) |
| 25 to 34 Years | 148 (11.5%) | 80 (7.0%) |
| 35 to 44 Years | 15 (2.0%) | 152 (13.8%) |
| 45 to 54 Years | 67 (10.4%) | 17 (3.2%) |
| 55 to 64 Years | 43 (5.9%) | 113 (13.2%) |
| 65 to 74 Years | 176 (25.2%) | 13 (1.5%) |
| 75 Years and over | 47 (11.1%) | 83 (13.6%) |
| Total | 660 (10.9%) | 646 (9.8%) |
Income Above Poverty by Sex and Age in Red Bank borough
According to the poverty statistics in Red Bank borough, males aged 5 years and females aged 5 years are the age groups that are most secure financially, with 100.0% of males and 100.0% of females in these age groups living above the poverty line.
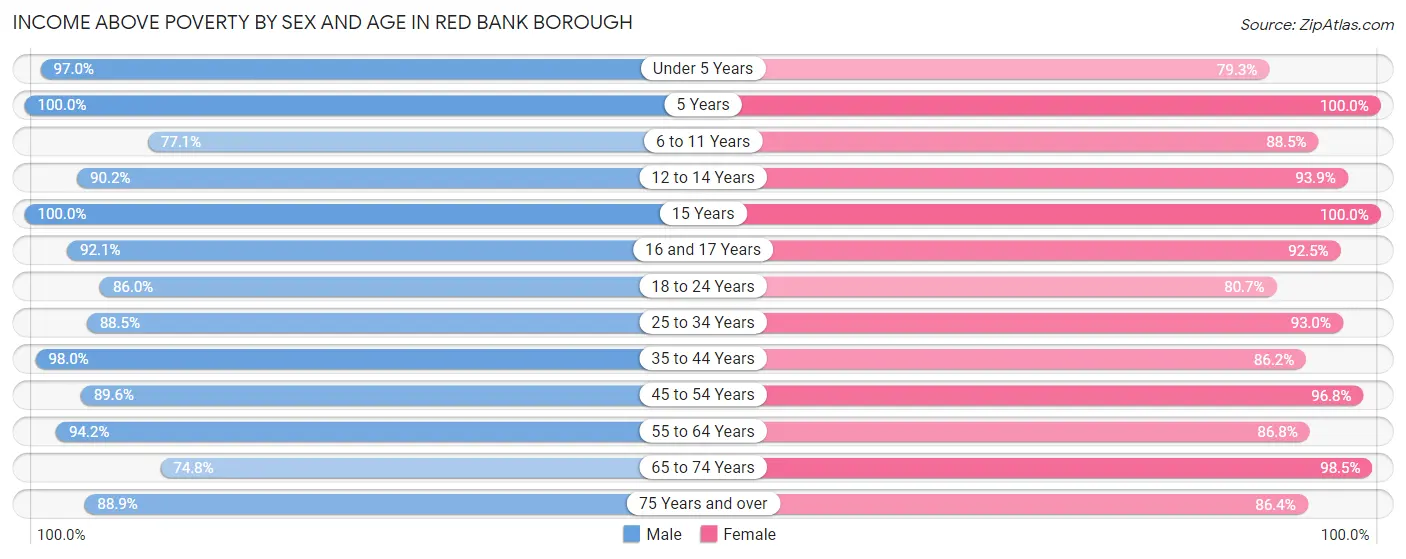
| Age Bracket | Male | Female |
| Under 5 Years | 519 (97.0%) | 188 (79.3%) |
| 5 Years | 84 (100.0%) | 48 (100.0%) |
| 6 to 11 Years | 320 (77.1%) | 514 (88.5%) |
| 12 to 14 Years | 111 (90.2%) | 199 (93.9%) |
| 15 Years | 19 (100.0%) | 21 (100.0%) |
| 16 and 17 Years | 163 (92.1%) | 211 (92.5%) |
| 18 to 24 Years | 166 (86.0%) | 175 (80.6%) |
| 25 to 34 Years | 1,135 (88.5%) | 1,060 (93.0%) |
| 35 to 44 Years | 726 (98.0%) | 948 (86.2%) |
| 45 to 54 Years | 576 (89.6%) | 512 (96.8%) |
| 55 to 64 Years | 692 (94.2%) | 744 (86.8%) |
| 65 to 74 Years | 522 (74.8%) | 831 (98.5%) |
| 75 Years and over | 376 (88.9%) | 529 (86.4%) |
| Total | 5,409 (89.1%) | 5,980 (90.2%) |
Income Below Poverty Among Married-Couple Families in Red Bank borough
The poverty statistics for married-couple families in Red Bank borough show that 6.4% or 134 of the total 2,082 families live below the poverty line. Families with 3 or 4 children have the highest poverty rate of 27.1%, comprising of 13 families. On the other hand, families with 5 or more children have the lowest poverty rate of 0.0%, which includes 0 families.
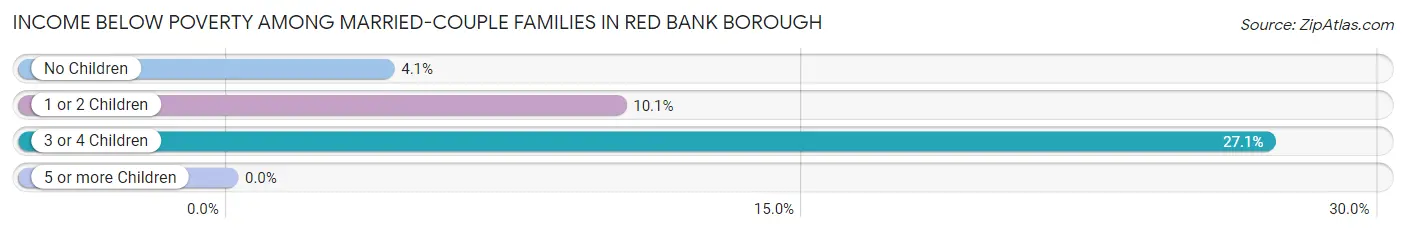
| Children | Above Poverty | Below Poverty |
| No Children | 1,293 (95.9%) | 55 (4.1%) |
| 1 or 2 Children | 585 (89.9%) | 66 (10.1%) |
| 3 or 4 Children | 35 (72.9%) | 13 (27.1%) |
| 5 or more Children | 35 (100.0%) | 0 (0.0%) |
| Total | 1,948 (93.6%) | 134 (6.4%) |
Income Below Poverty Among Single-Parent Households in Red Bank borough
According to the poverty data in Red Bank borough, 19.6% or 70 single-father households and 9.8% or 54 single-mother households are living below the poverty line. Among single-father households, those with no children have the highest poverty rate, with 35 households (33.7%) experiencing poverty. Likewise, among single-mother households, those with 3 or 4 children have the highest poverty rate, with 13 households (18.6%) falling below the poverty line.
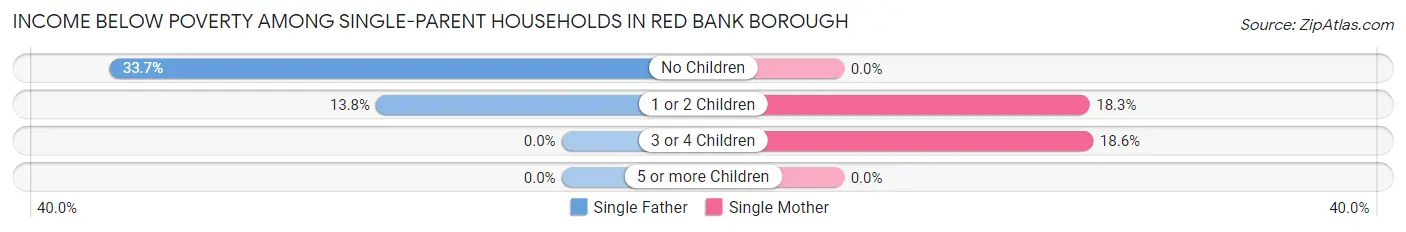
| Children | Single Father | Single Mother |
| No Children | 35 (33.7%) | 0 (0.0%) |
| 1 or 2 Children | 35 (13.8%) | 41 (18.3%) |
| 3 or 4 Children | 0 (0.0%) | 13 (18.6%) |
| 5 or more Children | 0 (0.0%) | 0 (0.0%) |
| Total | 70 (19.6%) | 54 (9.8%) |
Income Below Poverty Among Married-Couple vs Single-Parent Households in Red Bank borough
The poverty data for Red Bank borough shows that 134 of the married-couple family households (6.4%) and 124 of the single-parent households (13.6%) are living below the poverty level. Within the married-couple family households, those with 3 or 4 children have the highest poverty rate, with 13 households (27.1%) falling below the poverty line. Among the single-parent households, those with 3 or 4 children have the highest poverty rate, with 13 household (18.6%) living below poverty.
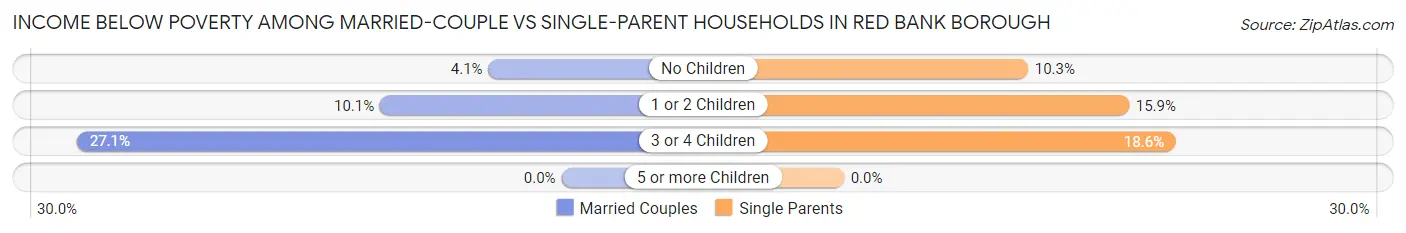
| Children | Married-Couple Families | Single-Parent Households |
| No Children | 55 (4.1%) | 35 (10.3%) |
| 1 or 2 Children | 66 (10.1%) | 76 (15.9%) |
| 3 or 4 Children | 13 (27.1%) | 13 (18.6%) |
| 5 or more Children | 0 (0.0%) | 0 (0.0%) |
| Total | 134 (6.4%) | 124 (13.6%) |
Employment Characteristics in Red Bank borough
Employment by Class of Employer in Red Bank borough
Among the 6,935 employed individuals in Red Bank borough, private company employees (4,852 | 70.0%), not-for-profit organizations (779 | 11.2%), and local government employees (445 | 6.4%) make up the most common classes of employment.
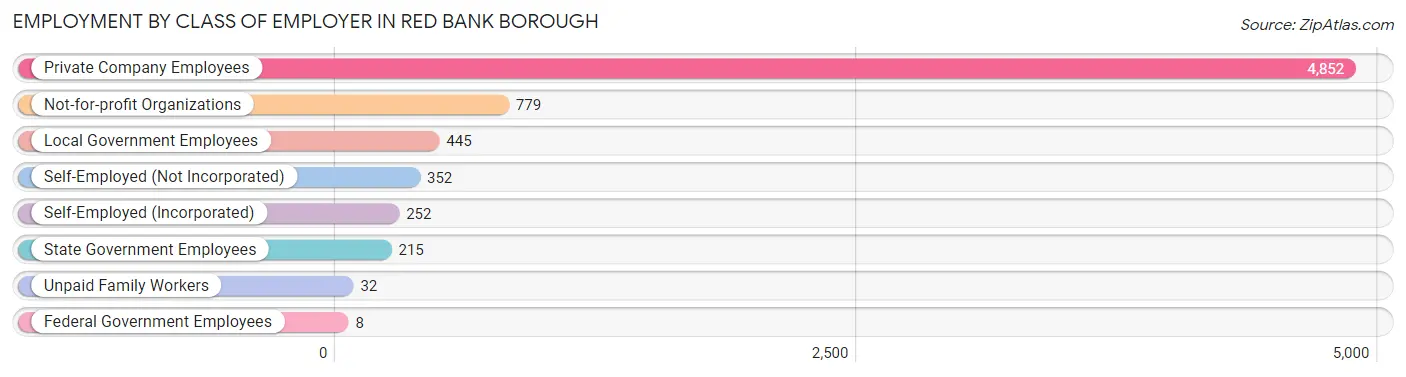
| Employer Class | # Employees | % Employees |
| Private Company Employees | 4,852 | 70.0% |
| Self-Employed (Incorporated) | 252 | 3.6% |
| Self-Employed (Not Incorporated) | 352 | 5.1% |
| Not-for-profit Organizations | 779 | 11.2% |
| Local Government Employees | 445 | 6.4% |
| State Government Employees | 215 | 3.1% |
| Federal Government Employees | 8 | 0.1% |
| Unpaid Family Workers | 32 | 0.5% |
| Total | 6,935 | 100.0% |
Employment Status by Age in Red Bank borough
According to the labor force statistics for Red Bank borough, out of the total population over 16 years of age (10,575), 68.8% or 7,276 individuals are in the labor force, with 3.2% or 233 of them unemployed. The age group with the highest labor force participation rate is 55 to 59 years, with 91.9% or 634 individuals in the labor force. Within the labor force, the 16 to 19 years age range has the highest percentage of unemployed individuals, with 10.1% or 21 of them being unemployed.
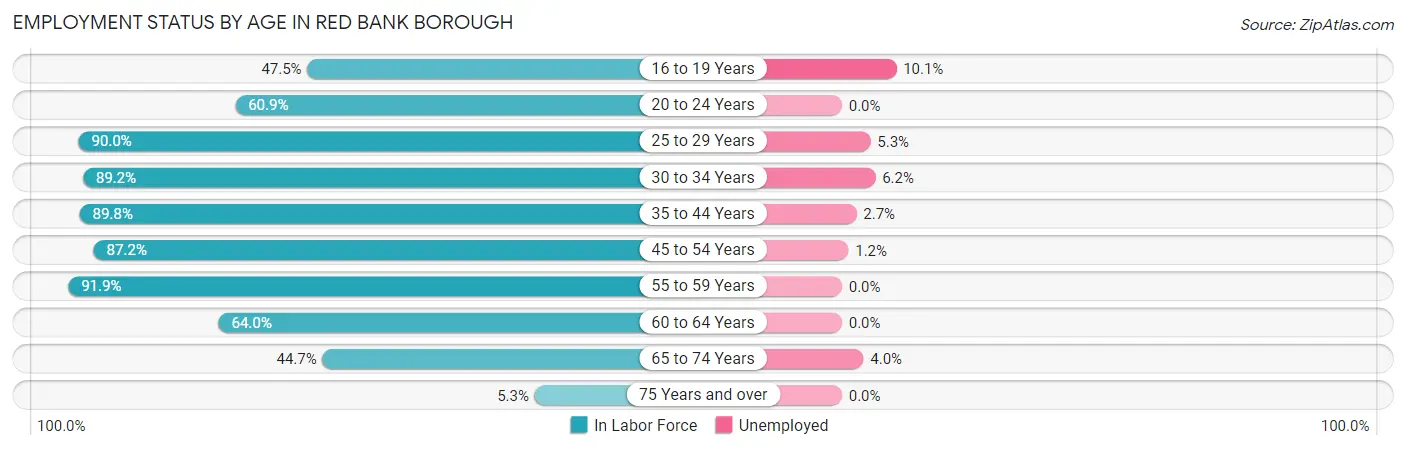
| Age Bracket | In Labor Force | Unemployed |
| 16 to 19 Years | 207 (47.5%) | 21 (10.1%) |
| 20 to 24 Years | 231 (60.9%) | 0 (0.0%) |
| 25 to 29 Years | 994 (90.0%) | 53 (5.3%) |
| 30 to 34 Years | 1,176 (89.2%) | 73 (6.2%) |
| 35 to 44 Years | 1,658 (89.8%) | 45 (2.7%) |
| 45 to 54 Years | 1,032 (87.2%) | 12 (1.2%) |
| 55 to 59 Years | 634 (91.9%) | 0 (0.0%) |
| 60 to 64 Years | 590 (64.0%) | 0 (0.0%) |
| 65 to 74 Years | 700 (44.7%) | 28 (4.0%) |
| 75 Years and over | 60 (5.3%) | 0 (0.0%) |
| Total | 7,276 (68.8%) | 233 (3.2%) |
Employment Status by Educational Attainment in Red Bank borough
According to labor force statistics for Red Bank borough, 86.1% of individuals (6,083) out of the total population between 25 and 64 years of age (7,065) are in the labor force, with 3.0% or 182 of them being unemployed. The group with the highest labor force participation rate are those with the educational attainment of bachelor's degree or higher, with 89.2% or 3,560 individuals in the labor force. Within the labor force, individuals with less than high school education have the highest percentage of unemployment, with 7.6% or 40 of them being unemployed.
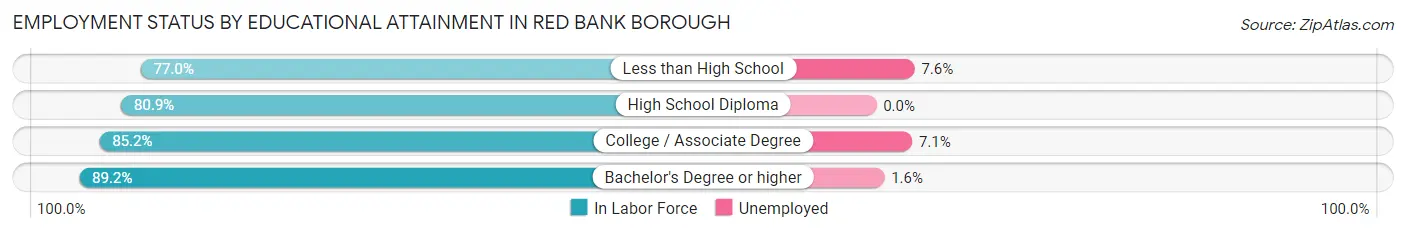
| Educational Attainment | In Labor Force | Unemployed |
| Less than High School | 523 (77.0%) | 52 (7.6%) |
| High School Diploma | 786 (80.9%) | 0 (0.0%) |
| College / Associate Degree | 1,212 (85.2%) | 101 (7.1%) |
| Bachelor's Degree or higher | 3,560 (89.2%) | 64 (1.6%) |
| Total | 6,083 (86.1%) | 212 (3.0%) |
Employment Occupations by Sex in Red Bank borough
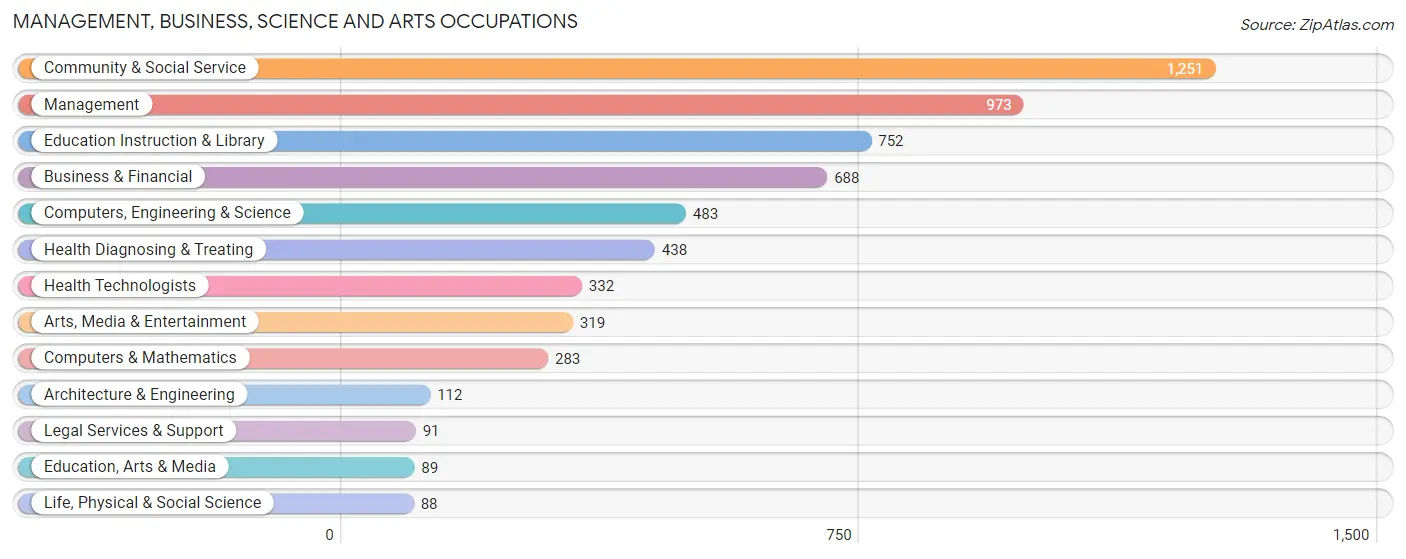
Management, Business, Science and Arts Occupations
The most common Management, Business, Science and Arts occupations in Red Bank borough are Community & Social Service (1,251 | 17.7%), Management (973 | 13.8%), Education Instruction & Library (752 | 10.7%), Business & Financial (688 | 9.8%), and Computers, Engineering & Science (483 | 6.9%).
Management, Business, Science and Arts Occupations by Sex
Within the Management, Business, Science and Arts occupations in Red Bank borough, the most male-oriented occupations are Legal Services & Support (86.8%), Architecture & Engineering (79.5%), and Business & Financial (49.7%), while the most female-oriented occupations are Education, Arts & Media (100.0%), Life, Physical & Social Science (85.2%), and Health Diagnosing & Treating (82.9%).
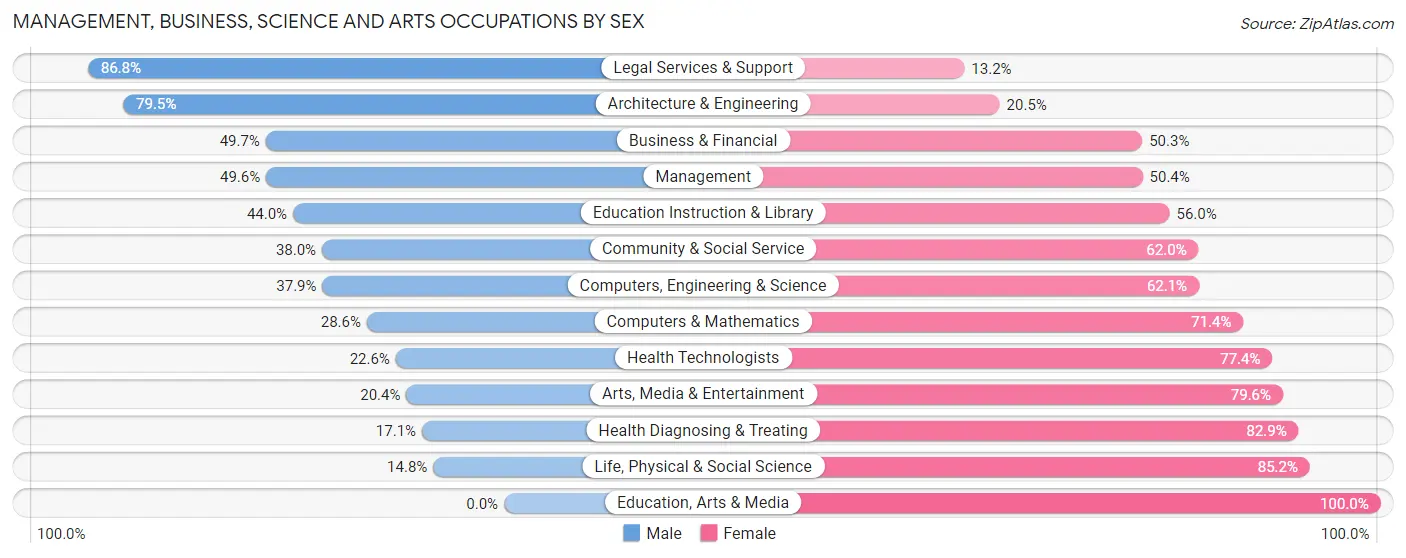
| Occupation | Male | Female |
| Management | 483 (49.6%) | 490 (50.4%) |
| Business & Financial | 342 (49.7%) | 346 (50.3%) |
| Computers, Engineering & Science | 183 (37.9%) | 300 (62.1%) |
| Computers & Mathematics | 81 (28.6%) | 202 (71.4%) |
| Architecture & Engineering | 89 (79.5%) | 23 (20.5%) |
| Life, Physical & Social Science | 13 (14.8%) | 75 (85.2%) |
| Community & Social Service | 475 (38.0%) | 776 (62.0%) |
| Education, Arts & Media | 0 (0.0%) | 89 (100.0%) |
| Legal Services & Support | 79 (86.8%) | 12 (13.2%) |
| Education Instruction & Library | 331 (44.0%) | 421 (56.0%) |
| Arts, Media & Entertainment | 65 (20.4%) | 254 (79.6%) |
| Health Diagnosing & Treating | 75 (17.1%) | 363 (82.9%) |
| Health Technologists | 75 (22.6%) | 257 (77.4%) |
| Total (Category) | 1,558 (40.6%) | 2,275 (59.4%) |
| Total (Overall) | 3,305 (46.9%) | 3,743 (53.1%) |
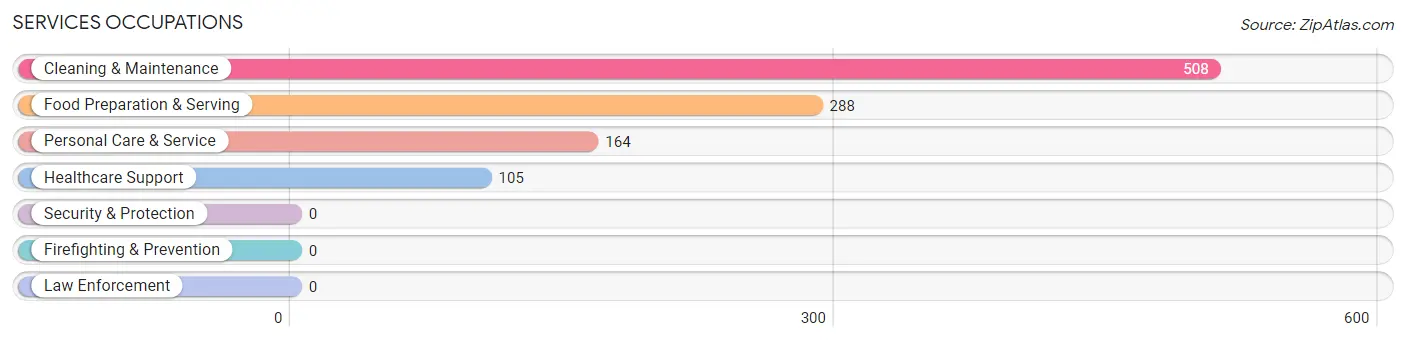
Services Occupations
The most common Services occupations in Red Bank borough are Cleaning & Maintenance (508 | 7.2%), Food Preparation & Serving (288 | 4.1%), Personal Care & Service (164 | 2.3%), and Healthcare Support (105 | 1.5%).
Services Occupations by Sex
Within the Services occupations in Red Bank borough, the most male-oriented occupations are Cleaning & Maintenance (66.5%), Food Preparation & Serving (53.5%), and Personal Care & Service (38.4%), while the most female-oriented occupations are Healthcare Support (78.1%), Personal Care & Service (61.6%), and Food Preparation & Serving (46.5%).
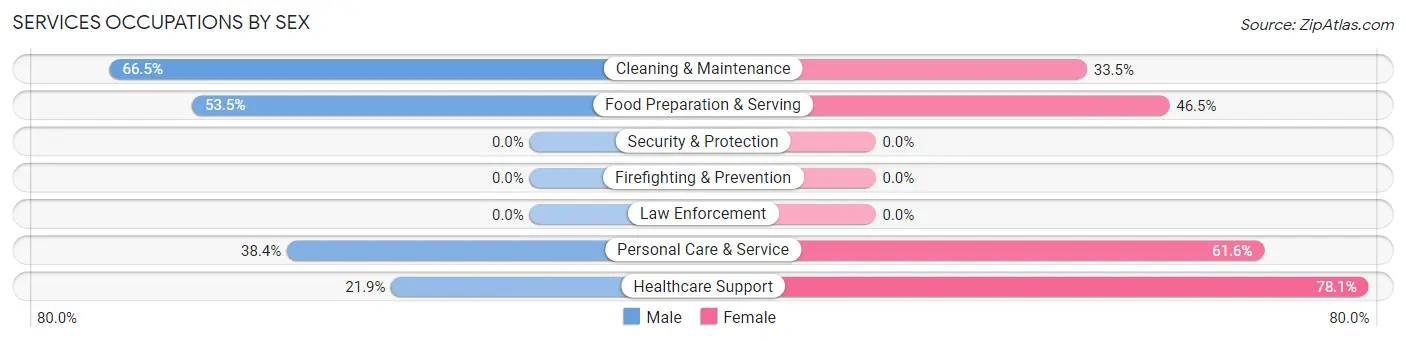
| Occupation | Male | Female |
| Healthcare Support | 23 (21.9%) | 82 (78.1%) |
| Security & Protection | 0 (0.0%) | 0 (0.0%) |
| Firefighting & Prevention | 0 (0.0%) | 0 (0.0%) |
| Law Enforcement | 0 (0.0%) | 0 (0.0%) |
| Food Preparation & Serving | 154 (53.5%) | 134 (46.5%) |
| Cleaning & Maintenance | 338 (66.5%) | 170 (33.5%) |
| Personal Care & Service | 63 (38.4%) | 101 (61.6%) |
| Total (Category) | 578 (54.3%) | 487 (45.7%) |
| Total (Overall) | 3,305 (46.9%) | 3,743 (53.1%) |
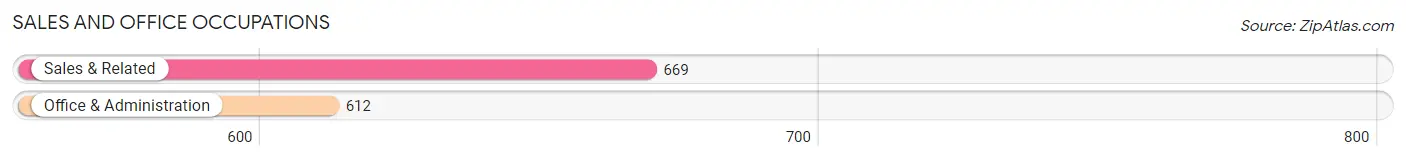
Sales and Office Occupations
The most common Sales and Office occupations in Red Bank borough are Sales & Related (669 | 9.5%), and Office & Administration (612 | 8.7%).
Sales and Office Occupations by Sex
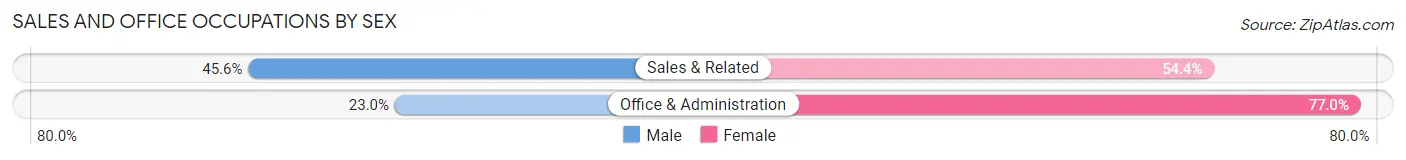
| Occupation | Male | Female |
| Sales & Related | 305 (45.6%) | 364 (54.4%) |
| Office & Administration | 141 (23.0%) | 471 (77.0%) |
| Total (Category) | 446 (34.8%) | 835 (65.2%) |
| Total (Overall) | 3,305 (46.9%) | 3,743 (53.1%) |
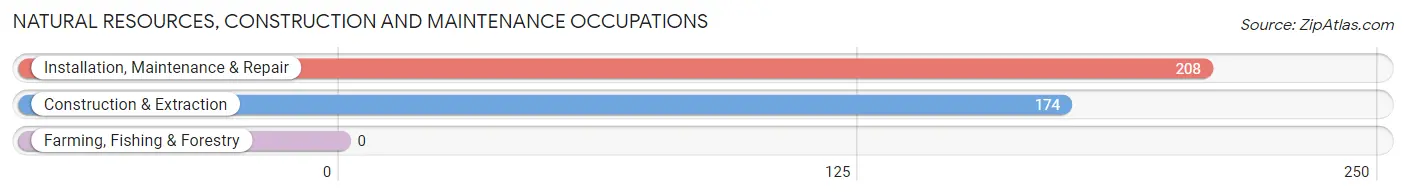
Natural Resources, Construction and Maintenance Occupations
The most common Natural Resources, Construction and Maintenance occupations in Red Bank borough are Installation, Maintenance & Repair (208 | 2.9%), and Construction & Extraction (174 | 2.5%).
Natural Resources, Construction and Maintenance Occupations by Sex
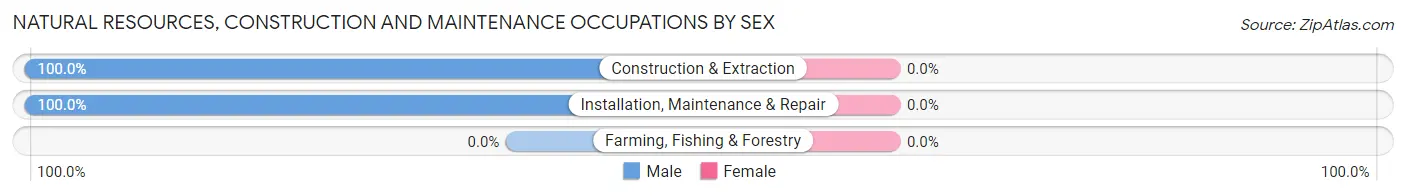
| Occupation | Male | Female |
| Farming, Fishing & Forestry | 0 (0.0%) | 0 (0.0%) |
| Construction & Extraction | 174 (100.0%) | 0 (0.0%) |
| Installation, Maintenance & Repair | 208 (100.0%) | 0 (0.0%) |
| Total (Category) | 382 (100.0%) | 0 (0.0%) |
| Total (Overall) | 3,305 (46.9%) | 3,743 (53.1%) |
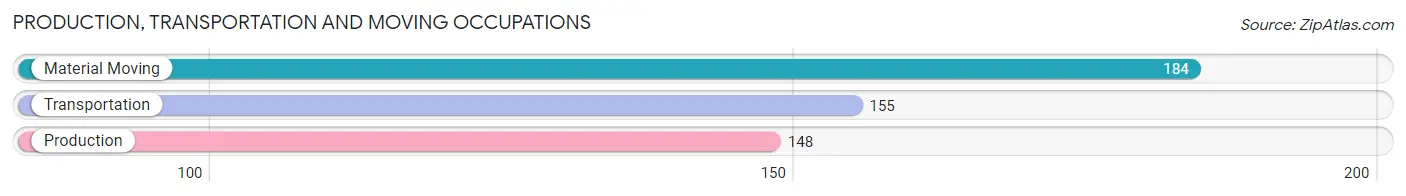
Production, Transportation and Moving Occupations
The most common Production, Transportation and Moving occupations in Red Bank borough are Material Moving (184 | 2.6%), Transportation (155 | 2.2%), and Production (148 | 2.1%).
Production, Transportation and Moving Occupations by Sex
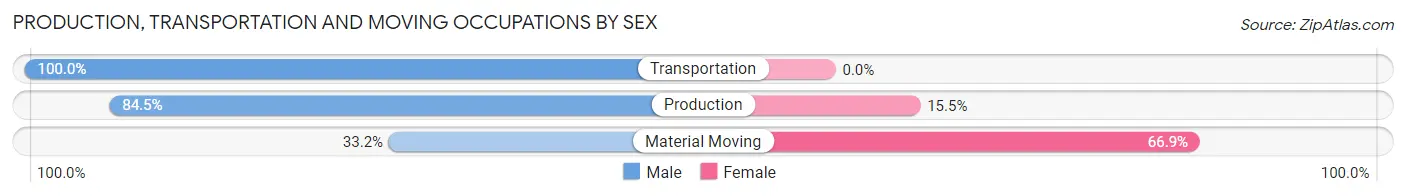
| Occupation | Male | Female |
| Production | 125 (84.5%) | 23 (15.5%) |
| Transportation | 155 (100.0%) | 0 (0.0%) |
| Material Moving | 61 (33.2%) | 123 (66.8%) |
| Total (Category) | 341 (70.0%) | 146 (30.0%) |
| Total (Overall) | 3,305 (46.9%) | 3,743 (53.1%) |
Employment Industries by Sex in Red Bank borough
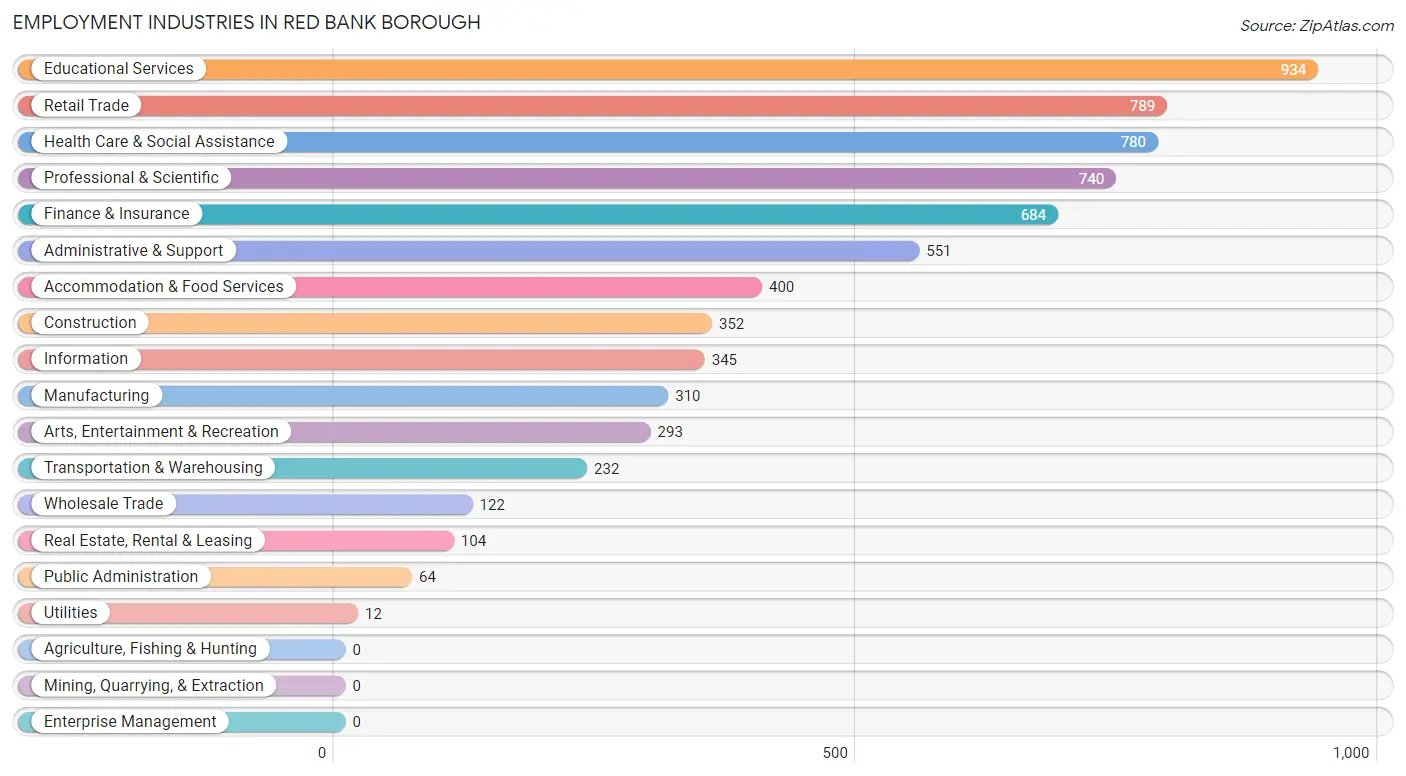
Employment Industries in Red Bank borough
The major employment industries in Red Bank borough include Educational Services (934 | 13.3%), Retail Trade (789 | 11.2%), Health Care & Social Assistance (780 | 11.1%), Professional & Scientific (740 | 10.5%), and Finance & Insurance (684 | 9.7%).
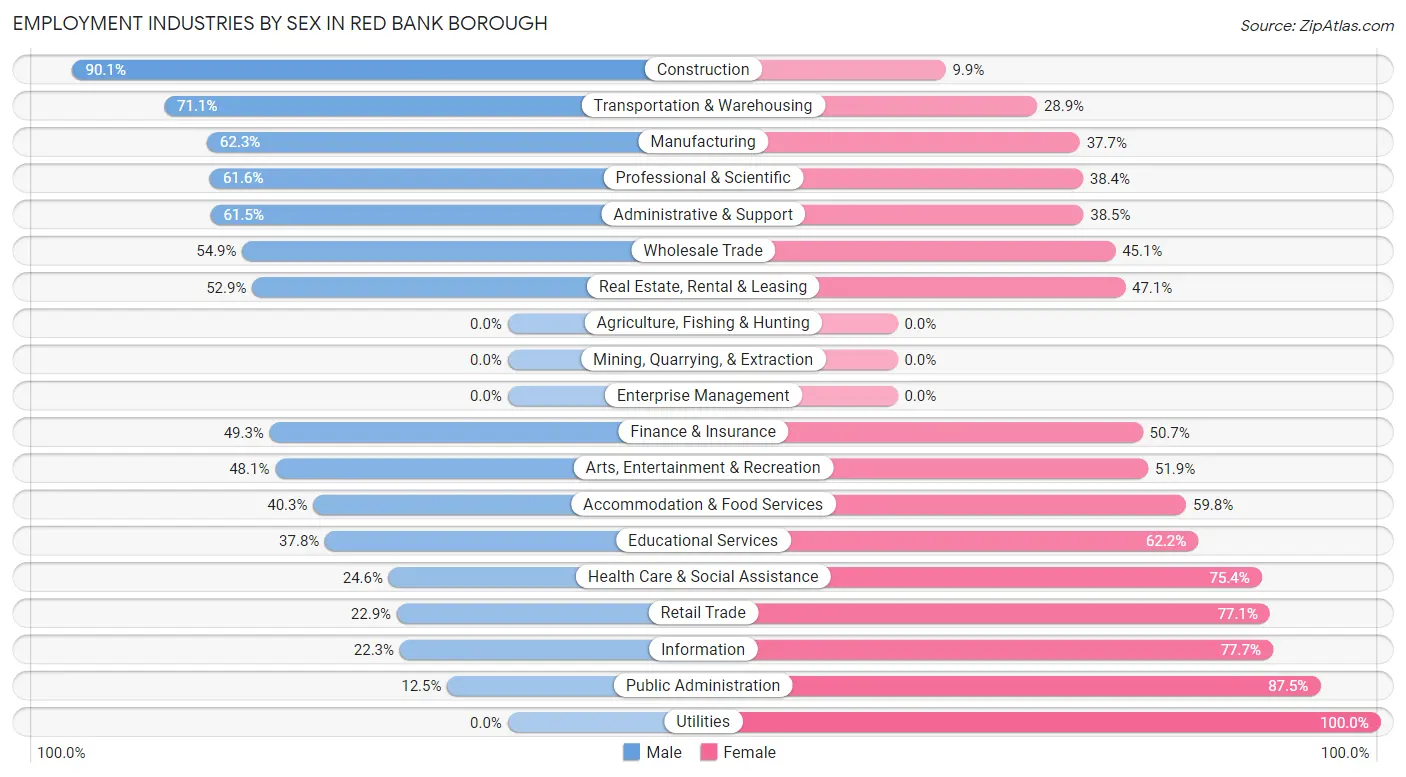
Employment Industries by Sex in Red Bank borough
The Red Bank borough industries that see more men than women are Construction (90.1%), Transportation & Warehousing (71.1%), and Manufacturing (62.3%), whereas the industries that tend to have a higher number of women are Utilities (100.0%), Public Administration (87.5%), and Information (77.7%).
| Industry | Male | Female |
| Agriculture, Fishing & Hunting | 0 (0.0%) | 0 (0.0%) |
| Mining, Quarrying, & Extraction | 0 (0.0%) | 0 (0.0%) |
| Construction | 317 (90.1%) | 35 (9.9%) |
| Manufacturing | 193 (62.3%) | 117 (37.7%) |
| Wholesale Trade | 67 (54.9%) | 55 (45.1%) |
| Retail Trade | 181 (22.9%) | 608 (77.1%) |
| Transportation & Warehousing | 165 (71.1%) | 67 (28.9%) |
| Utilities | 0 (0.0%) | 12 (100.0%) |
| Information | 77 (22.3%) | 268 (77.7%) |
| Finance & Insurance | 337 (49.3%) | 347 (50.7%) |
| Real Estate, Rental & Leasing | 55 (52.9%) | 49 (47.1%) |
| Professional & Scientific | 456 (61.6%) | 284 (38.4%) |
| Enterprise Management | 0 (0.0%) | 0 (0.0%) |
| Administrative & Support | 339 (61.5%) | 212 (38.5%) |
| Educational Services | 353 (37.8%) | 581 (62.2%) |
| Health Care & Social Assistance | 192 (24.6%) | 588 (75.4%) |
| Arts, Entertainment & Recreation | 141 (48.1%) | 152 (51.9%) |
| Accommodation & Food Services | 161 (40.3%) | 239 (59.8%) |
| Public Administration | 8 (12.5%) | 56 (87.5%) |
| Total | 3,305 (46.9%) | 3,743 (53.1%) |
Education in Red Bank borough
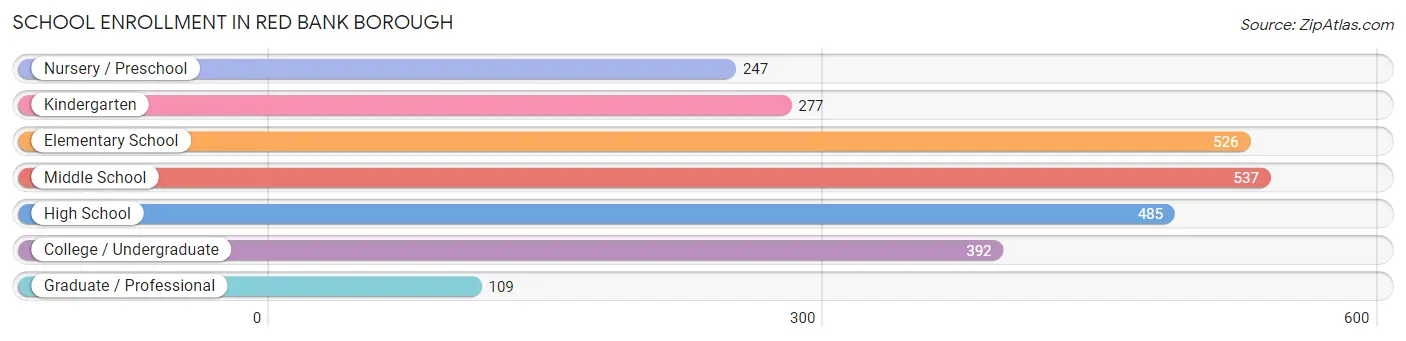
School Enrollment in Red Bank borough
The most common levels of schooling among the 2,573 students in Red Bank borough are middle school (537 | 20.9%), elementary school (526 | 20.4%), and high school (485 | 18.9%).
| School Level | # Students | % Students |
| Nursery / Preschool | 247 | 9.6% |
| Kindergarten | 277 | 10.8% |
| Elementary School | 526 | 20.4% |
| Middle School | 537 | 20.9% |
| High School | 485 | 18.9% |
| College / Undergraduate | 392 | 15.2% |
| Graduate / Professional | 109 | 4.2% |
| Total | 2,573 | 100.0% |
School Enrollment by Age by Funding Source in Red Bank borough
Out of a total of 2,573 students who are enrolled in schools in Red Bank borough, 684 (26.6%) attend a private institution, while the remaining 1,889 (73.4%) are enrolled in public schools. The age group of 20 to 24 year olds has the highest likelihood of being enrolled in private schools, with 23 (46.0% in the age bracket) enrolled. Conversely, the age group of 18 to 19 year olds has the lowest likelihood of being enrolled in a private school, with 31 (100.0% in the age bracket) attending a public institution.
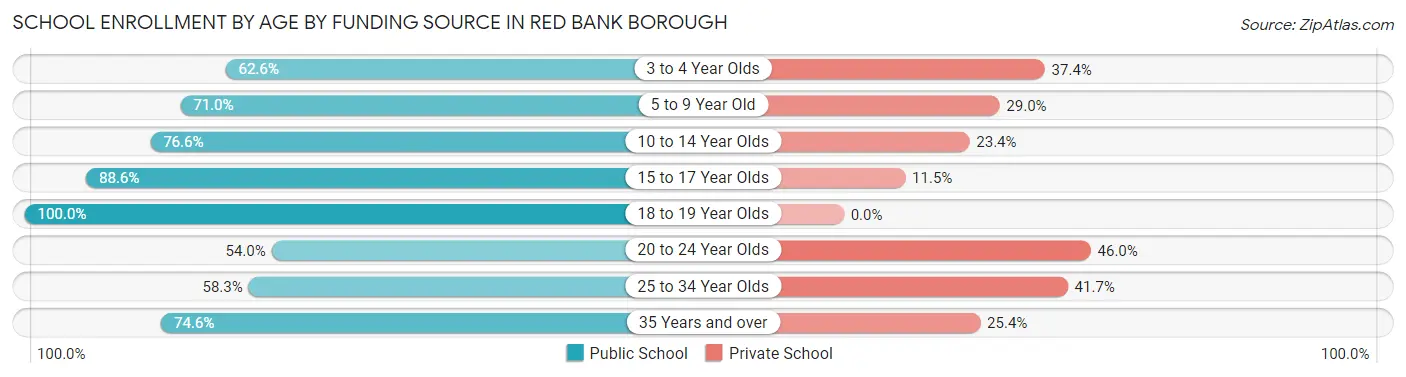
| Age Bracket | Public School | Private School |
| 3 to 4 Year Olds | 132 (62.6%) | 79 (37.4%) |
| 5 to 9 Year Old | 526 (71.0%) | 215 (29.0%) |
| 10 to 14 Year Olds | 530 (76.6%) | 162 (23.4%) |
| 15 to 17 Year Olds | 379 (88.5%) | 49 (11.5%) |
| 18 to 19 Year Olds | 31 (100.0%) | 0 (0.0%) |
| 20 to 24 Year Olds | 27 (54.0%) | 23 (46.0%) |
| 25 to 34 Year Olds | 176 (58.3%) | 126 (41.7%) |
| 35 Years and over | 88 (74.6%) | 30 (25.4%) |
| Total | 1,889 (73.4%) | 684 (26.6%) |
Educational Attainment by Field of Study in Red Bank borough
Business (1,377 | 25.9%), education (576 | 10.8%), social sciences (431 | 8.1%), visual & performing arts (401 | 7.5%), and science & technology (357 | 6.7%) are the most common fields of study among 5,318 individuals in Red Bank borough who have obtained a bachelor's degree or higher.
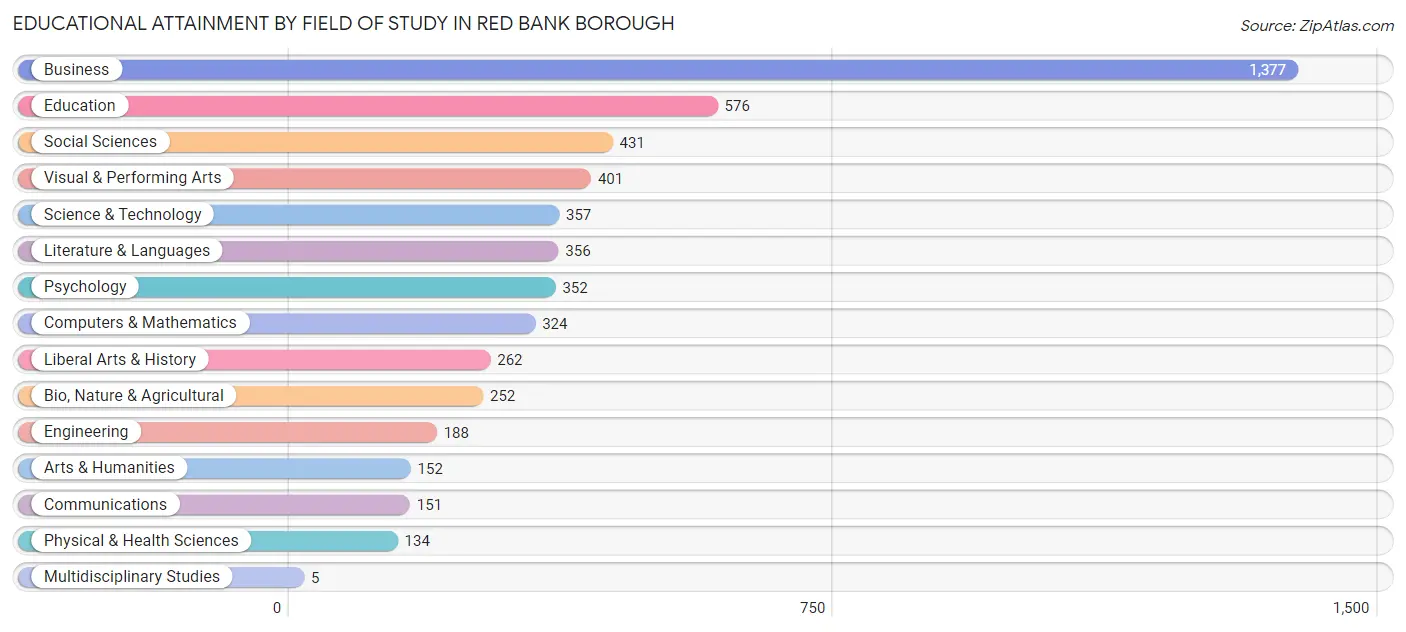
| Field of Study | # Graduates | % Graduates |
| Computers & Mathematics | 324 | 6.1% |
| Bio, Nature & Agricultural | 252 | 4.7% |
| Physical & Health Sciences | 134 | 2.5% |
| Psychology | 352 | 6.6% |
| Social Sciences | 431 | 8.1% |
| Engineering | 188 | 3.5% |
| Multidisciplinary Studies | 5 | 0.1% |
| Science & Technology | 357 | 6.7% |
| Business | 1,377 | 25.9% |
| Education | 576 | 10.8% |
| Literature & Languages | 356 | 6.7% |
| Liberal Arts & History | 262 | 4.9% |
| Visual & Performing Arts | 401 | 7.5% |
| Communications | 151 | 2.8% |
| Arts & Humanities | 152 | 2.9% |
| Total | 5,318 | 100.0% |
Transportation & Commute in Red Bank borough
Vehicle Availability by Sex in Red Bank borough
The most prevalent vehicle ownership categories in Red Bank borough are males with 2 vehicles (1,356, accounting for 41.6%) and females with 2 vehicles (1,431, making up 37.0%).
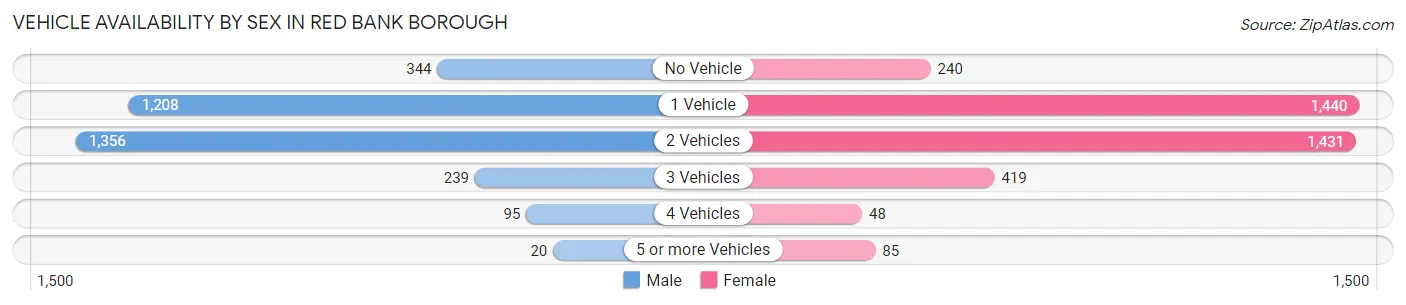
| Vehicles Available | Male | Female |
| No Vehicle | 344 (10.5%) | 240 (6.6%) |
| 1 Vehicle | 1,208 (37.0%) | 1,440 (39.3%) |
| 2 Vehicles | 1,356 (41.6%) | 1,431 (39.1%) |
| 3 Vehicles | 239 (7.3%) | 419 (11.4%) |
| 4 Vehicles | 95 (2.9%) | 48 (1.3%) |
| 5 or more Vehicles | 20 (0.6%) | 85 (2.3%) |
| Total | 3,262 (100.0%) | 3,663 (100.0%) |
Commute Time in Red Bank borough
The most frequently occuring commute durations in Red Bank borough are 10 to 14 minutes (956 commuters, 15.8%), 15 to 19 minutes (819 commuters, 13.5%), and 60 to 89 minutes (807 commuters, 13.3%).
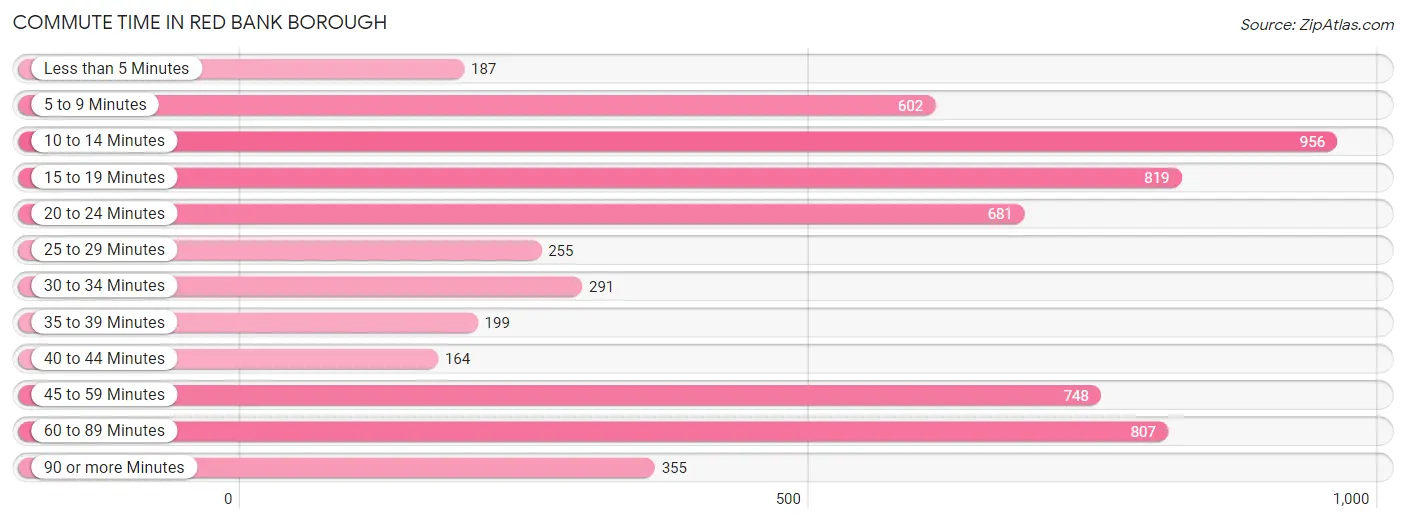
| Commute Time | # Commuters | % Commuters |
| Less than 5 Minutes | 187 | 3.1% |
| 5 to 9 Minutes | 602 | 9.9% |
| 10 to 14 Minutes | 956 | 15.8% |
| 15 to 19 Minutes | 819 | 13.5% |
| 20 to 24 Minutes | 681 | 11.2% |
| 25 to 29 Minutes | 255 | 4.2% |
| 30 to 34 Minutes | 291 | 4.8% |
| 35 to 39 Minutes | 199 | 3.3% |
| 40 to 44 Minutes | 164 | 2.7% |
| 45 to 59 Minutes | 748 | 12.3% |
| 60 to 89 Minutes | 807 | 13.3% |
| 90 or more Minutes | 355 | 5.9% |
Commute Time by Sex in Red Bank borough
The most common commute times in Red Bank borough are 10 to 14 minutes (500 commuters, 17.5%) for males and 10 to 14 minutes (456 commuters, 14.2%) for females.
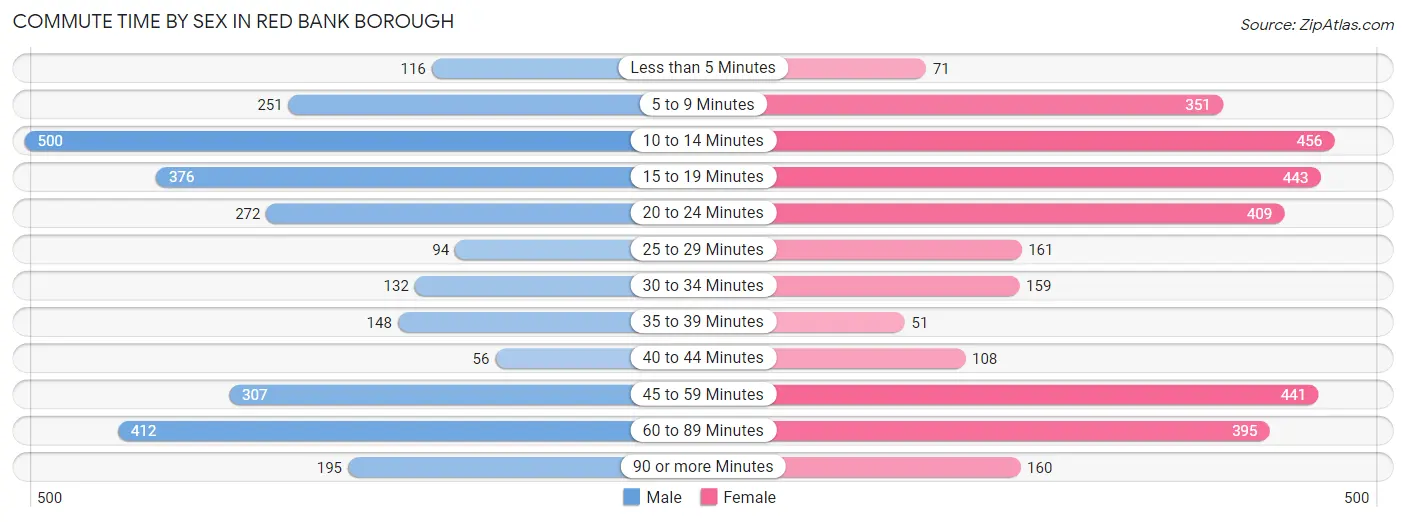
| Commute Time | Male | Female |
| Less than 5 Minutes | 116 (4.1%) | 71 (2.2%) |
| 5 to 9 Minutes | 251 (8.8%) | 351 (11.0%) |
| 10 to 14 Minutes | 500 (17.5%) | 456 (14.2%) |
| 15 to 19 Minutes | 376 (13.2%) | 443 (13.8%) |
| 20 to 24 Minutes | 272 (9.5%) | 409 (12.8%) |
| 25 to 29 Minutes | 94 (3.3%) | 161 (5.0%) |
| 30 to 34 Minutes | 132 (4.6%) | 159 (5.0%) |
| 35 to 39 Minutes | 148 (5.2%) | 51 (1.6%) |
| 40 to 44 Minutes | 56 (2.0%) | 108 (3.4%) |
| 45 to 59 Minutes | 307 (10.7%) | 441 (13.8%) |
| 60 to 89 Minutes | 412 (14.4%) | 395 (12.3%) |
| 90 or more Minutes | 195 (6.8%) | 160 (5.0%) |
Time of Departure to Work by Sex in Red Bank borough
The most frequent times of departure to work in Red Bank borough are 9:00 AM to 9:59 AM (453, 15.8%) for males and 7:30 AM to 7:59 AM (433, 13.5%) for females.
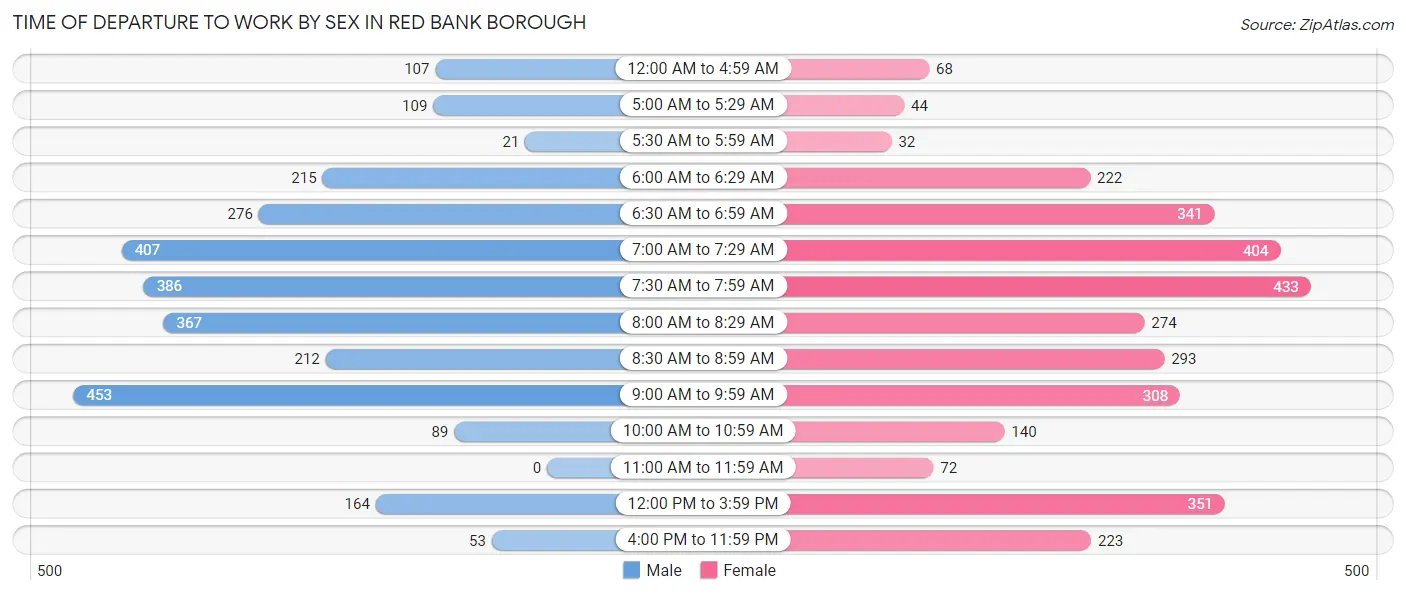
| Time of Departure | Male | Female |
| 12:00 AM to 4:59 AM | 107 (3.7%) | 68 (2.1%) |
| 5:00 AM to 5:29 AM | 109 (3.8%) | 44 (1.4%) |
| 5:30 AM to 5:59 AM | 21 (0.7%) | 32 (1.0%) |
| 6:00 AM to 6:29 AM | 215 (7.5%) | 222 (6.9%) |
| 6:30 AM to 6:59 AM | 276 (9.7%) | 341 (10.6%) |
| 7:00 AM to 7:29 AM | 407 (14.2%) | 404 (12.6%) |
| 7:30 AM to 7:59 AM | 386 (13.5%) | 433 (13.5%) |
| 8:00 AM to 8:29 AM | 367 (12.8%) | 274 (8.6%) |
| 8:30 AM to 8:59 AM | 212 (7.4%) | 293 (9.1%) |
| 9:00 AM to 9:59 AM | 453 (15.8%) | 308 (9.6%) |
| 10:00 AM to 10:59 AM | 89 (3.1%) | 140 (4.4%) |
| 11:00 AM to 11:59 AM | 0 (0.0%) | 72 (2.2%) |
| 12:00 PM to 3:59 PM | 164 (5.7%) | 351 (11.0%) |
| 4:00 PM to 11:59 PM | 53 (1.8%) | 223 (7.0%) |
| Total | 2,859 (100.0%) | 3,205 (100.0%) |
Housing Occupancy in Red Bank borough
Occupancy by Ownership in Red Bank borough
Of the total 6,084 dwellings in Red Bank borough, owner-occupied units account for 3,150 (51.8%), while renter-occupied units make up 2,934 (48.2%).
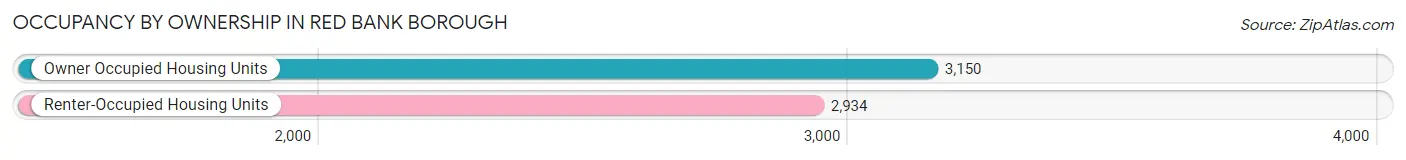
| Occupancy | # Housing Units | % Housing Units |
| Owner Occupied Housing Units | 3,150 | 51.8% |
| Renter-Occupied Housing Units | 2,934 | 48.2% |
| Total Occupied Housing Units | 6,084 | 100.0% |
Occupancy by Household Size in Red Bank borough
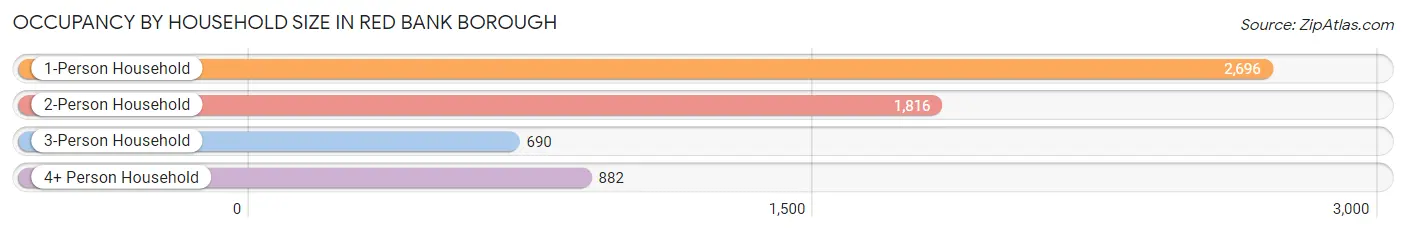
| Household Size | # Housing Units | % Housing Units |
| 1-Person Household | 2,696 | 44.3% |
| 2-Person Household | 1,816 | 29.8% |
| 3-Person Household | 690 | 11.3% |
| 4+ Person Household | 882 | 14.5% |
| Total Housing Units | 6,084 | 100.0% |
Occupancy by Ownership by Household Size in Red Bank borough
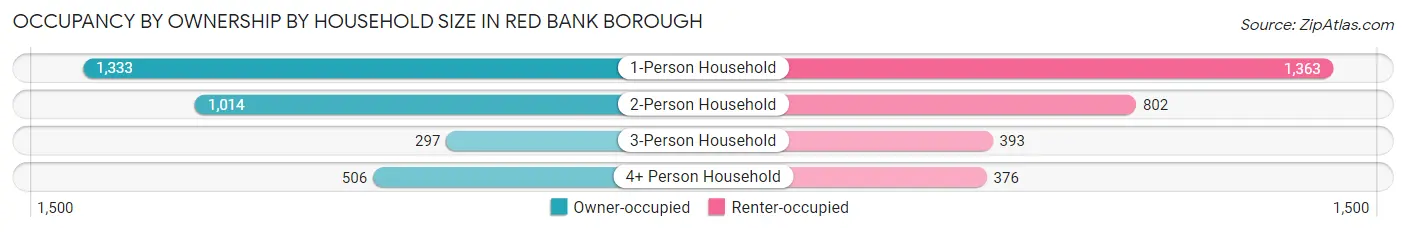
| Household Size | Owner-occupied | Renter-occupied |
| 1-Person Household | 1,333 (49.4%) | 1,363 (50.6%) |
| 2-Person Household | 1,014 (55.8%) | 802 (44.2%) |
| 3-Person Household | 297 (43.0%) | 393 (57.0%) |
| 4+ Person Household | 506 (57.4%) | 376 (42.6%) |
| Total Housing Units | 3,150 (51.8%) | 2,934 (48.2%) |
Occupancy by Educational Attainment in Red Bank borough
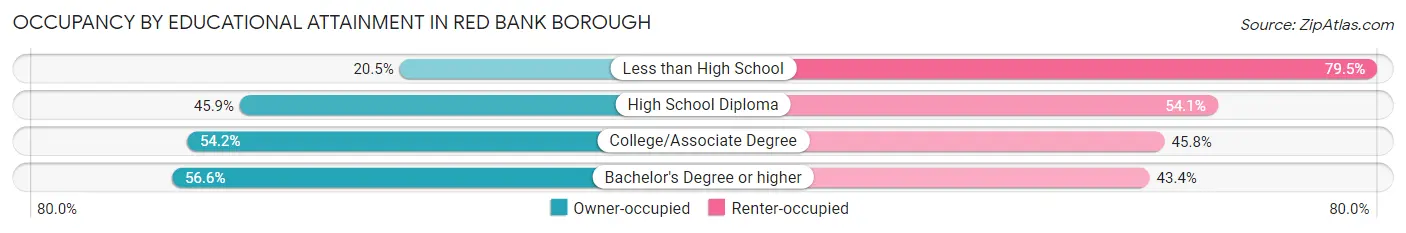
| Household Size | Owner-occupied | Renter-occupied |
| Less than High School | 84 (20.5%) | 325 (79.5%) |
| High School Diploma | 504 (45.9%) | 595 (54.1%) |
| College/Associate Degree | 659 (54.2%) | 556 (45.8%) |
| Bachelor's Degree or higher | 1,903 (56.6%) | 1,458 (43.4%) |
Occupancy by Age of Householder in Red Bank borough
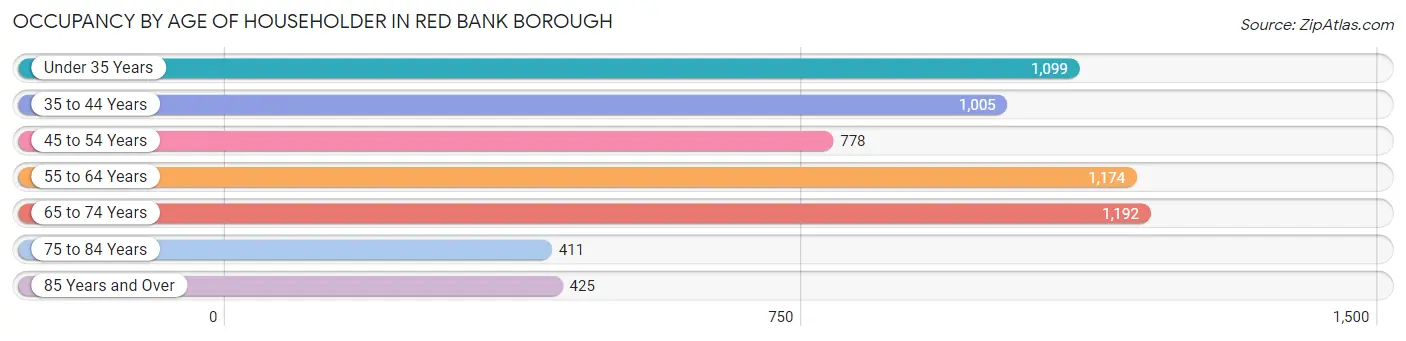
| Age Bracket | # Households | % Households |
| Under 35 Years | 1,099 | 18.1% |
| 35 to 44 Years | 1,005 | 16.5% |
| 45 to 54 Years | 778 | 12.8% |
| 55 to 64 Years | 1,174 | 19.3% |
| 65 to 74 Years | 1,192 | 19.6% |
| 75 to 84 Years | 411 | 6.8% |
| 85 Years and Over | 425 | 7.0% |
| Total | 6,084 | 100.0% |
Housing Finances in Red Bank borough
Median Income by Occupancy in Red Bank borough
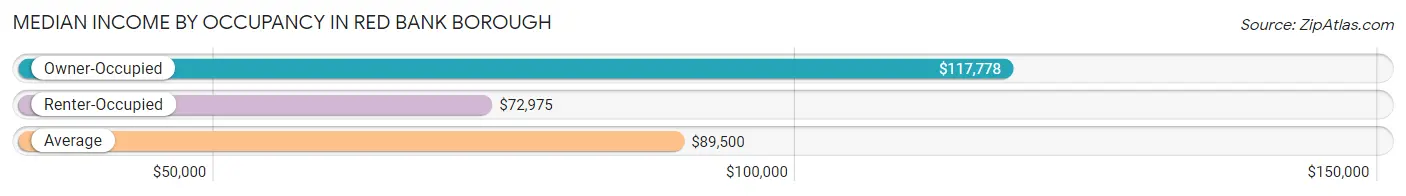
| Occupancy Type | # Households | Median Income |
| Owner-Occupied | 3,150 (51.8%) | $117,778 |
| Renter-Occupied | 2,934 (48.2%) | $72,975 |
| Average | 6,084 (100.0%) | $89,500 |
Occupancy by Householder Income Bracket in Red Bank borough
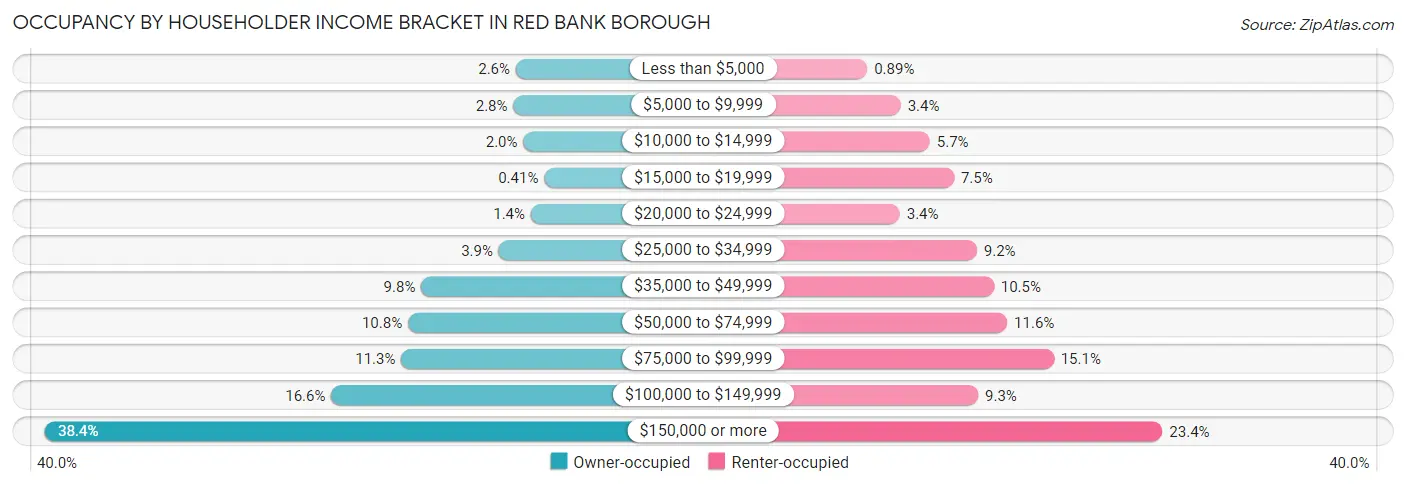
| Income Bracket | Owner-occupied | Renter-occupied |
| Less than $5,000 | 81 (2.6%) | 26 (0.9%) |
| $5,000 to $9,999 | 87 (2.8%) | 101 (3.4%) |
| $10,000 to $14,999 | 63 (2.0%) | 166 (5.7%) |
| $15,000 to $19,999 | 13 (0.4%) | 220 (7.5%) |
| $20,000 to $24,999 | 45 (1.4%) | 99 (3.4%) |
| $25,000 to $34,999 | 122 (3.9%) | 271 (9.2%) |
| $35,000 to $49,999 | 308 (9.8%) | 309 (10.5%) |
| $50,000 to $74,999 | 340 (10.8%) | 339 (11.6%) |
| $75,000 to $99,999 | 356 (11.3%) | 443 (15.1%) |
| $100,000 to $149,999 | 524 (16.6%) | 274 (9.3%) |
| $150,000 or more | 1,211 (38.4%) | 686 (23.4%) |
| Total | 3,150 (100.0%) | 2,934 (100.0%) |
Monthly Housing Cost Tiers in Red Bank borough
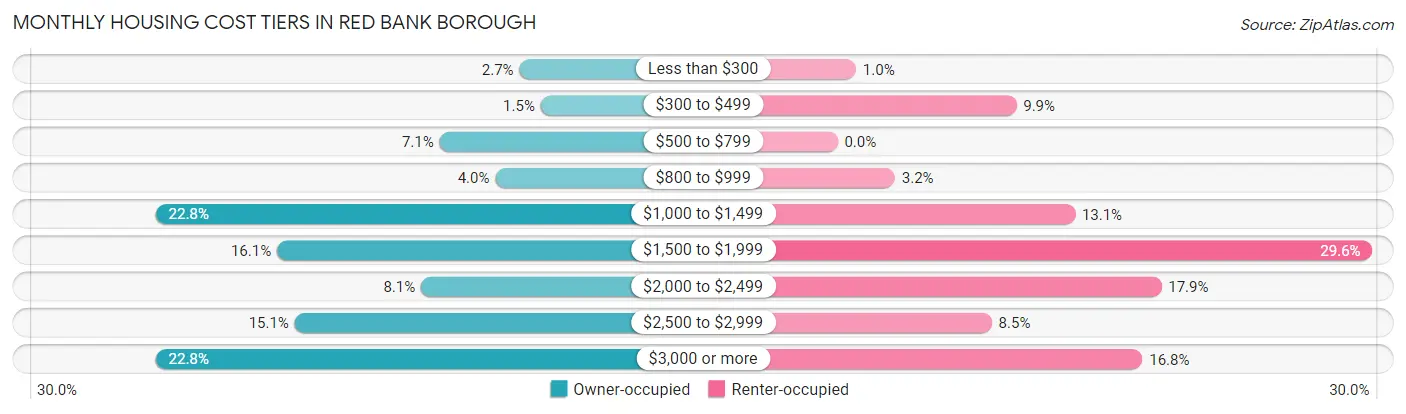
| Monthly Cost | Owner-occupied | Renter-occupied |
| Less than $300 | 84 (2.7%) | 30 (1.0%) |
| $300 to $499 | 47 (1.5%) | 290 (9.9%) |
| $500 to $799 | 223 (7.1%) | 0 (0.0%) |
| $800 to $999 | 126 (4.0%) | 93 (3.2%) |
| $1,000 to $1,499 | 717 (22.8%) | 385 (13.1%) |
| $1,500 to $1,999 | 506 (16.1%) | 867 (29.5%) |
| $2,000 to $2,499 | 255 (8.1%) | 525 (17.9%) |
| $2,500 to $2,999 | 475 (15.1%) | 250 (8.5%) |
| $3,000 or more | 717 (22.8%) | 494 (16.8%) |
| Total | 3,150 (100.0%) | 2,934 (100.0%) |
Physical Housing Characteristics in Red Bank borough
Housing Structures in Red Bank borough
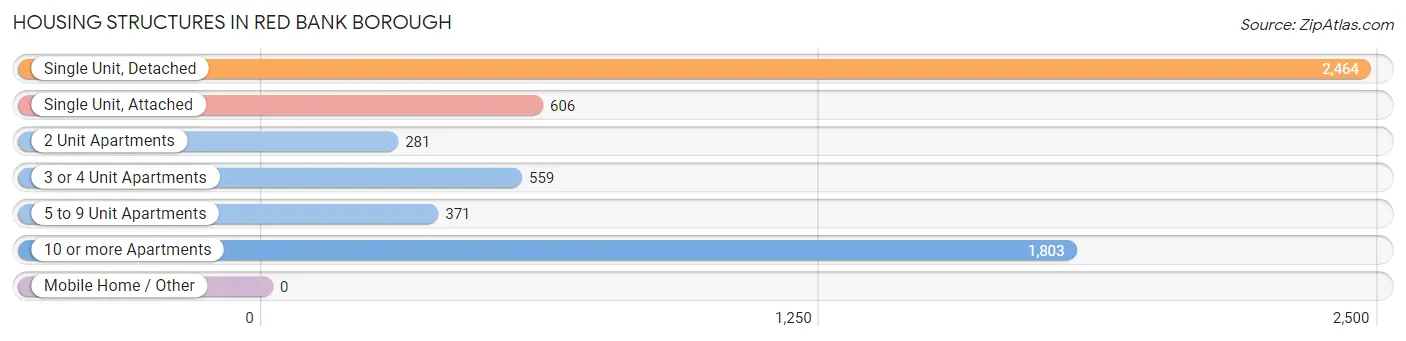
| Structure Type | # Housing Units | % Housing Units |
| Single Unit, Detached | 2,464 | 40.5% |
| Single Unit, Attached | 606 | 10.0% |
| 2 Unit Apartments | 281 | 4.6% |
| 3 or 4 Unit Apartments | 559 | 9.2% |
| 5 to 9 Unit Apartments | 371 | 6.1% |
| 10 or more Apartments | 1,803 | 29.6% |
| Mobile Home / Other | 0 | 0.0% |
| Total | 6,084 | 100.0% |
Housing Structures by Occupancy in Red Bank borough
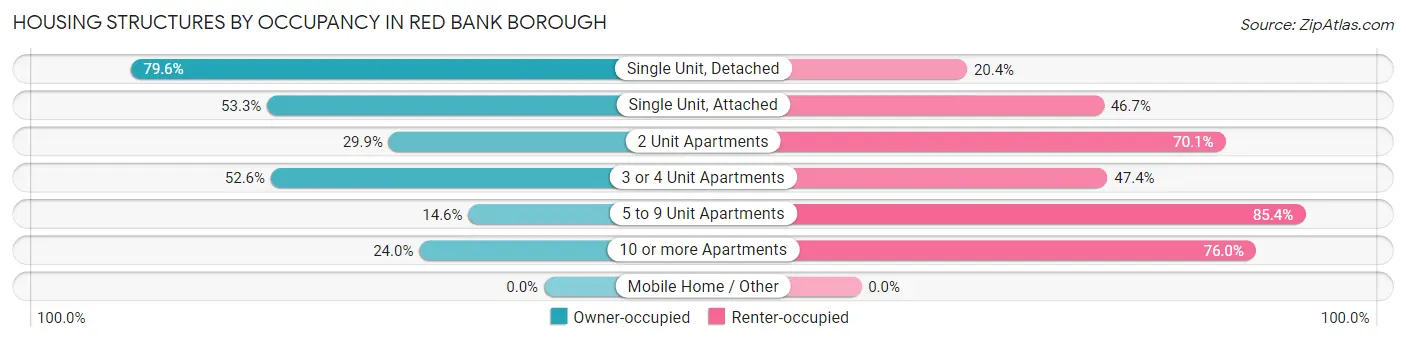
| Structure Type | Owner-occupied | Renter-occupied |
| Single Unit, Detached | 1,962 (79.6%) | 502 (20.4%) |
| Single Unit, Attached | 323 (53.3%) | 283 (46.7%) |
| 2 Unit Apartments | 84 (29.9%) | 197 (70.1%) |
| 3 or 4 Unit Apartments | 294 (52.6%) | 265 (47.4%) |
| 5 to 9 Unit Apartments | 54 (14.6%) | 317 (85.4%) |
| 10 or more Apartments | 433 (24.0%) | 1,370 (76.0%) |
| Mobile Home / Other | 0 (0.0%) | 0 (0.0%) |
| Total | 3,150 (51.8%) | 2,934 (48.2%) |
Housing Structures by Number of Rooms in Red Bank borough
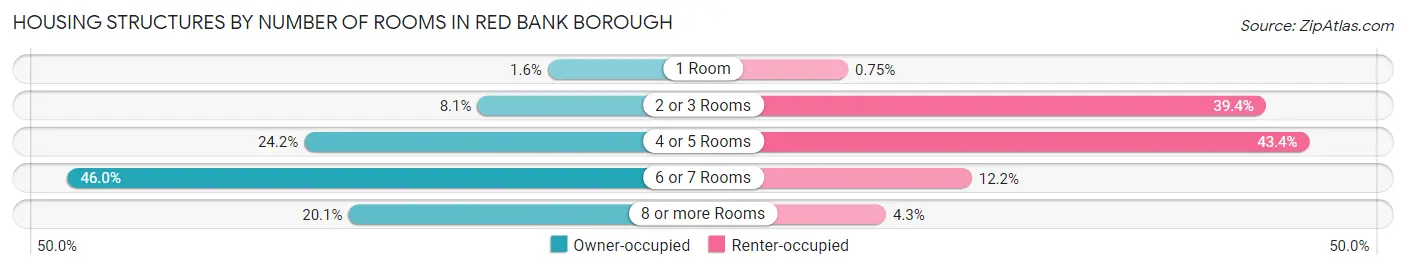
| Number of Rooms | Owner-occupied | Renter-occupied |
| 1 Room | 51 (1.6%) | 22 (0.7%) |
| 2 or 3 Rooms | 256 (8.1%) | 1,155 (39.4%) |
| 4 or 5 Rooms | 761 (24.2%) | 1,274 (43.4%) |
| 6 or 7 Rooms | 1,450 (46.0%) | 358 (12.2%) |
| 8 or more Rooms | 632 (20.1%) | 125 (4.3%) |
| Total | 3,150 (100.0%) | 2,934 (100.0%) |
Housing Structure by Heating Type in Red Bank borough
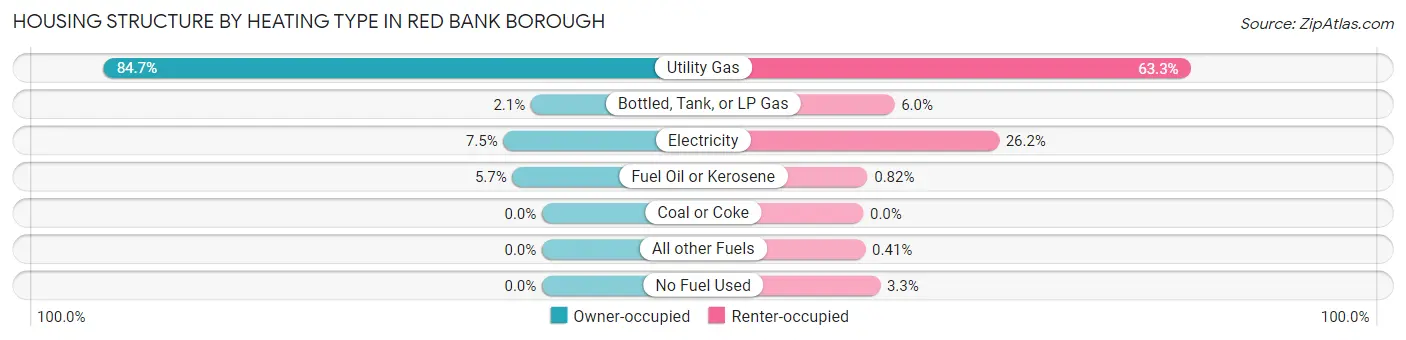
| Heating Type | Owner-occupied | Renter-occupied |
| Utility Gas | 2,668 (84.7%) | 1,856 (63.3%) |
| Bottled, Tank, or LP Gas | 67 (2.1%) | 177 (6.0%) |
| Electricity | 235 (7.5%) | 769 (26.2%) |
| Fuel Oil or Kerosene | 180 (5.7%) | 24 (0.8%) |
| Coal or Coke | 0 (0.0%) | 0 (0.0%) |
| All other Fuels | 0 (0.0%) | 12 (0.4%) |
| No Fuel Used | 0 (0.0%) | 96 (3.3%) |
| Total | 3,150 (100.0%) | 2,934 (100.0%) |
Household Vehicle Usage in Red Bank borough
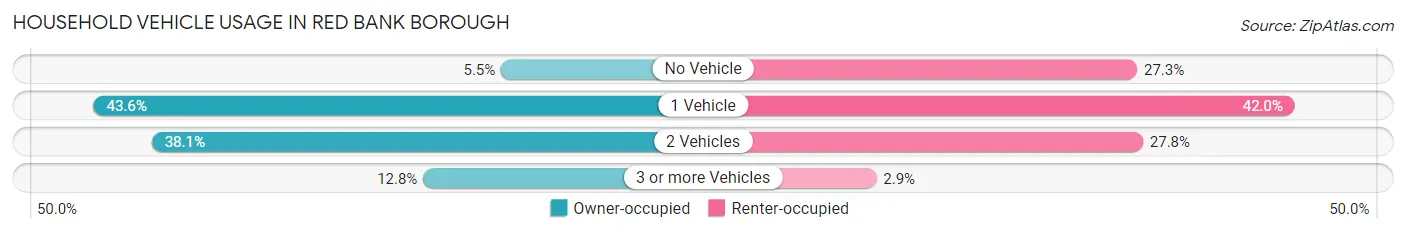
| Vehicles per Household | Owner-occupied | Renter-occupied |
| No Vehicle | 174 (5.5%) | 800 (27.3%) |
| 1 Vehicle | 1,372 (43.6%) | 1,232 (42.0%) |
| 2 Vehicles | 1,201 (38.1%) | 816 (27.8%) |
| 3 or more Vehicles | 403 (12.8%) | 86 (2.9%) |
| Total | 3,150 (100.0%) | 2,934 (100.0%) |
Real Estate & Mortgages in Red Bank borough
Real Estate and Mortgage Overview in Red Bank borough
| Characteristic | Without Mortgage | With Mortgage |
| Housing Units | 1,279 | 1,871 |
| Median Property Value | $315,300 | $490,900 |
| Median Household Income | $75,729 | $858 |
| Monthly Housing Costs | $1,342 | $703 |
| Real Estate Taxes | $7,166 | $12 |
Property Value by Mortgage Status in Red Bank borough
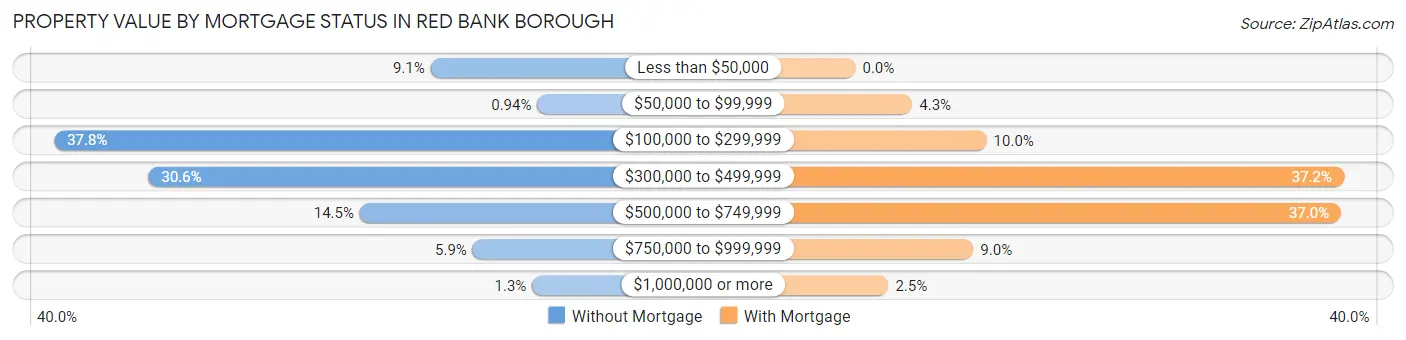
| Property Value | Without Mortgage | With Mortgage |
| Less than $50,000 | 116 (9.1%) | 0 (0.0%) |
| $50,000 to $99,999 | 12 (0.9%) | 81 (4.3%) |
| $100,000 to $299,999 | 483 (37.8%) | 187 (10.0%) |
| $300,000 to $499,999 | 391 (30.6%) | 696 (37.2%) |
| $500,000 to $749,999 | 185 (14.5%) | 692 (37.0%) |
| $750,000 to $999,999 | 75 (5.9%) | 168 (9.0%) |
| $1,000,000 or more | 17 (1.3%) | 47 (2.5%) |
| Total | 1,279 (100.0%) | 1,871 (100.0%) |
Household Income by Mortgage Status in Red Bank borough
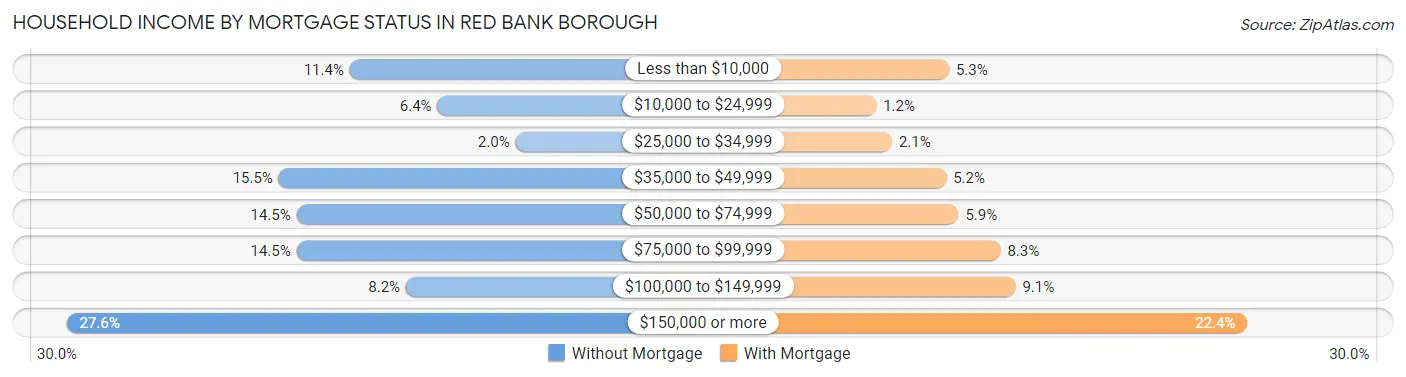
| Household Income | Without Mortgage | With Mortgage |
| Less than $10,000 | 146 (11.4%) | 100 (5.3%) |
| $10,000 to $24,999 | 82 (6.4%) | 22 (1.2%) |
| $25,000 to $34,999 | 25 (1.9%) | 39 (2.1%) |
| $35,000 to $49,999 | 198 (15.5%) | 97 (5.2%) |
| $50,000 to $74,999 | 185 (14.5%) | 110 (5.9%) |
| $75,000 to $99,999 | 185 (14.5%) | 155 (8.3%) |
| $100,000 to $149,999 | 105 (8.2%) | 171 (9.1%) |
| $150,000 or more | 353 (27.6%) | 419 (22.4%) |
| Total | 1,279 (100.0%) | 1,871 (100.0%) |
Property Value to Household Income Ratio in Red Bank borough
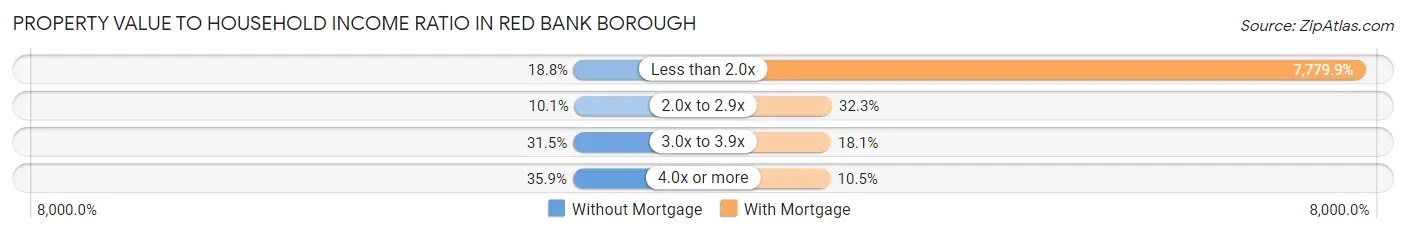
| Value-to-Income Ratio | Without Mortgage | With Mortgage |
| Less than 2.0x | 241 (18.8%) | 145,561 (7,779.9%) |
| 2.0x to 2.9x | 129 (10.1%) | 605 (32.3%) |
| 3.0x to 3.9x | 403 (31.5%) | 338 (18.1%) |
| 4.0x or more | 459 (35.9%) | 197 (10.5%) |
| Total | 1,279 (100.0%) | 1,871 (100.0%) |
Real Estate Taxes by Mortgage Status in Red Bank borough
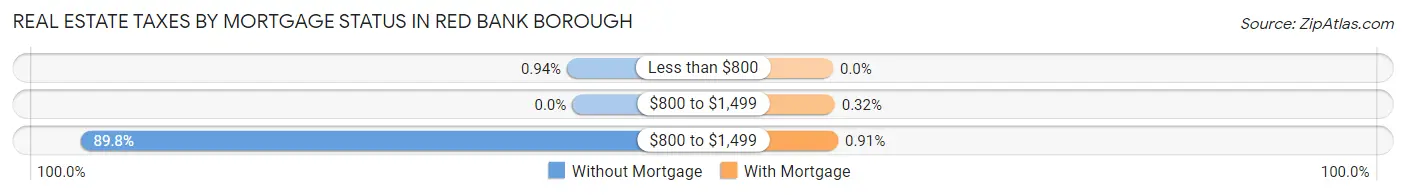
| Property Taxes | Without Mortgage | With Mortgage |
| Less than $800 | 12 (0.9%) | 0 (0.0%) |
| $800 to $1,499 | 0 (0.0%) | 6 (0.3%) |
| $800 to $1,499 | 1,148 (89.8%) | 17 (0.9%) |
| Total | 1,279 (100.0%) | 1,871 (100.0%) |
Health & Disability in Red Bank borough
Health Insurance Coverage by Age in Red Bank borough
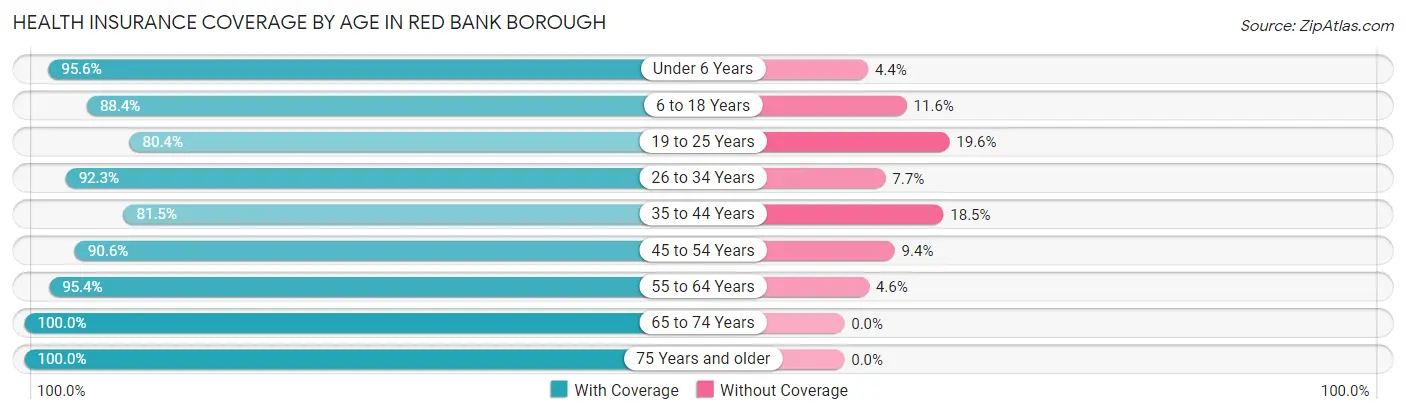
| Age Bracket | With Coverage | Without Coverage |
| Under 6 Years | 864 (95.6%) | 40 (4.4%) |
| 6 to 18 Years | 1,596 (88.4%) | 210 (11.6%) |
| 19 to 25 Years | 476 (80.4%) | 116 (19.6%) |
| 26 to 34 Years | 2,058 (92.3%) | 171 (7.7%) |
| 35 to 44 Years | 1,501 (81.5%) | 340 (18.5%) |
| 45 to 54 Years | 1,062 (90.6%) | 110 (9.4%) |
| 55 to 64 Years | 1,519 (95.4%) | 73 (4.6%) |
| 65 to 74 Years | 1,542 (100.0%) | 0 (0.0%) |
| 75 Years and older | 1,035 (100.0%) | 0 (0.0%) |
| Total | 11,653 (91.7%) | 1,060 (8.3%) |
Health Insurance Coverage by Citizenship Status in Red Bank borough
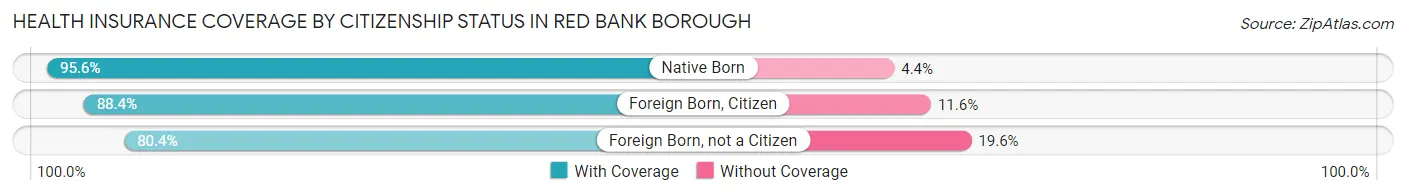
| Citizenship Status | With Coverage | Without Coverage |
| Native Born | 864 (95.6%) | 40 (4.4%) |
| Foreign Born, Citizen | 1,596 (88.4%) | 210 (11.6%) |
| Foreign Born, not a Citizen | 476 (80.4%) | 116 (19.6%) |
Health Insurance Coverage by Household Income in Red Bank borough
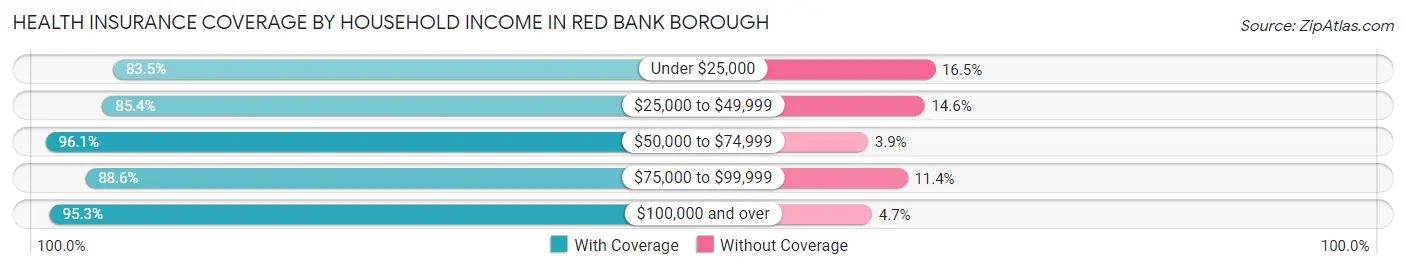
| Household Income | With Coverage | Without Coverage |
| Under $25,000 | 1,046 (83.5%) | 207 (16.5%) |
| $25,000 to $49,999 | 1,907 (85.4%) | 325 (14.6%) |
| $50,000 to $74,999 | 1,147 (96.1%) | 47 (3.9%) |
| $75,000 to $99,999 | 1,413 (88.6%) | 181 (11.4%) |
| $100,000 and over | 6,097 (95.3%) | 300 (4.7%) |
Public vs Private Health Insurance Coverage by Age in Red Bank borough
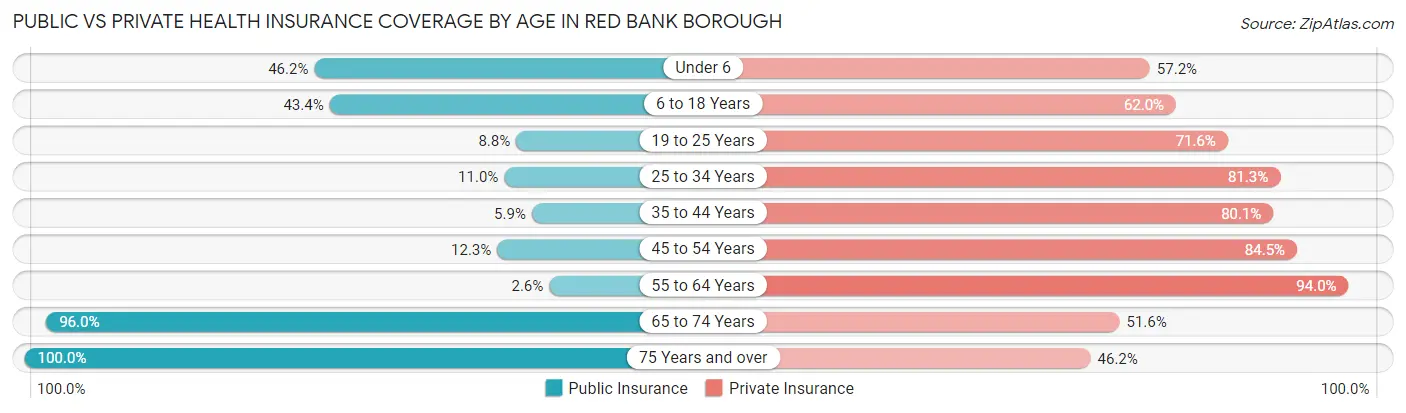
| Age Bracket | Public Insurance | Private Insurance |
| Under 6 | 418 (46.2%) | 517 (57.2%) |
| 6 to 18 Years | 784 (43.4%) | 1,120 (62.0%) |
| 19 to 25 Years | 52 (8.8%) | 424 (71.6%) |
| 25 to 34 Years | 245 (11.0%) | 1,813 (81.3%) |
| 35 to 44 Years | 108 (5.9%) | 1,474 (80.1%) |
| 45 to 54 Years | 144 (12.3%) | 990 (84.5%) |
| 55 to 64 Years | 42 (2.6%) | 1,497 (94.0%) |
| 65 to 74 Years | 1,480 (96.0%) | 795 (51.6%) |
| 75 Years and over | 1,035 (100.0%) | 478 (46.2%) |
| Total | 4,308 (33.9%) | 9,108 (71.6%) |
Disability Status by Sex by Age in Red Bank borough
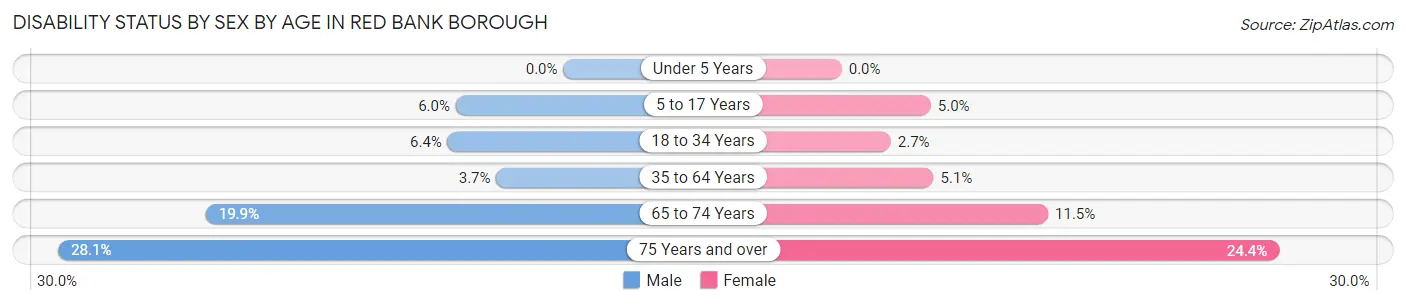
| Age Bracket | Male | Female |
| Under 5 Years | 0 (0.0%) | 0 (0.0%) |
| 5 to 17 Years | 49 (6.0%) | 55 (5.0%) |
| 18 to 34 Years | 95 (6.4%) | 37 (2.7%) |
| 35 to 64 Years | 79 (3.7%) | 127 (5.1%) |
| 65 to 74 Years | 139 (19.9%) | 97 (11.5%) |
| 75 Years and over | 119 (28.1%) | 149 (24.3%) |
Disability Class by Sex by Age in Red Bank borough
Disability Class: Hearing Difficulty
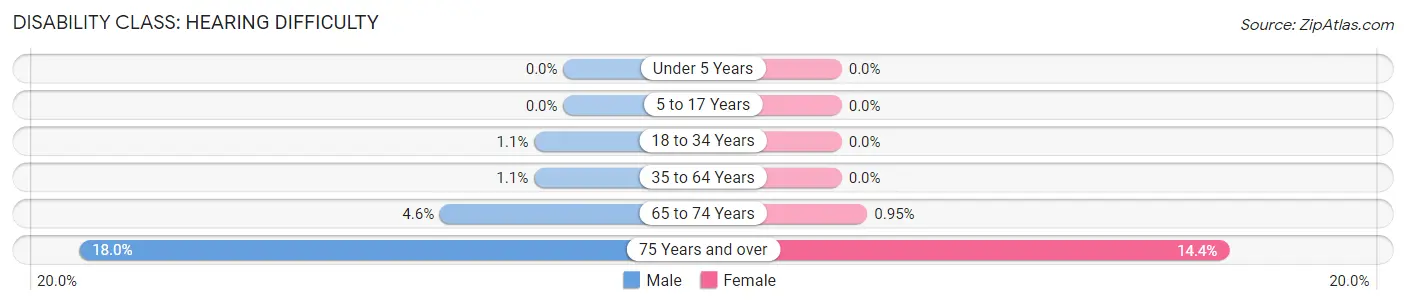
| Age Bracket | Male | Female |
| Under 5 Years | 0 (0.0%) | 0 (0.0%) |
| 5 to 17 Years | 0 (0.0%) | 0 (0.0%) |
| 18 to 34 Years | 16 (1.1%) | 0 (0.0%) |
| 35 to 64 Years | 23 (1.1%) | 0 (0.0%) |
| 65 to 74 Years | 32 (4.6%) | 8 (0.9%) |
| 75 Years and over | 76 (18.0%) | 88 (14.4%) |
Disability Class: Vision Difficulty
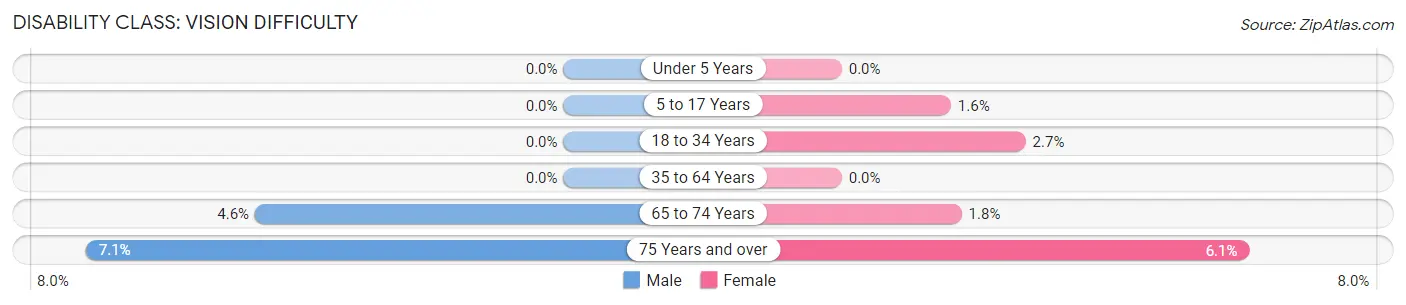
| Age Bracket | Male | Female |
| Under 5 Years | 0 (0.0%) | 0 (0.0%) |
| 5 to 17 Years | 0 (0.0%) | 18 (1.6%) |
| 18 to 34 Years | 0 (0.0%) | 37 (2.7%) |
| 35 to 64 Years | 0 (0.0%) | 0 (0.0%) |
| 65 to 74 Years | 32 (4.6%) | 15 (1.8%) |
| 75 Years and over | 30 (7.1%) | 37 (6.0%) |
Disability Class: Cognitive Difficulty
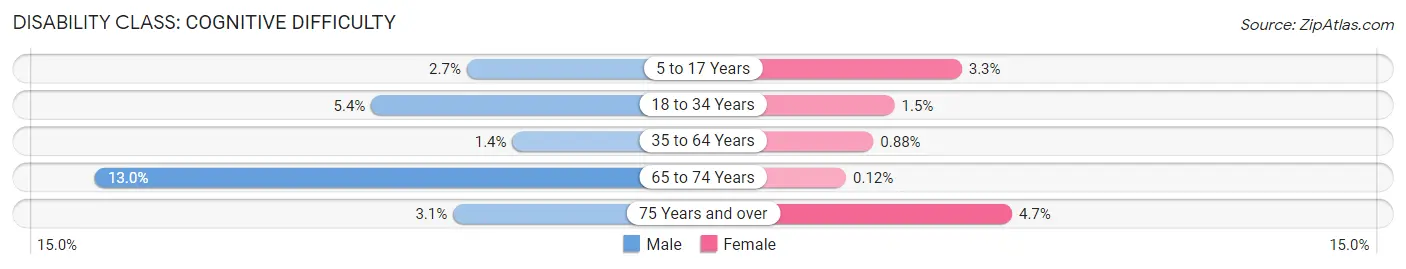
| Age Bracket | Male | Female |
| 5 to 17 Years | 22 (2.7%) | 37 (3.3%) |
| 18 to 34 Years | 79 (5.3%) | 20 (1.5%) |
| 35 to 64 Years | 30 (1.4%) | 22 (0.9%) |
| 65 to 74 Years | 91 (13.0%) | 1 (0.1%) |
| 75 Years and over | 13 (3.1%) | 29 (4.7%) |
Disability Class: Ambulatory Difficulty
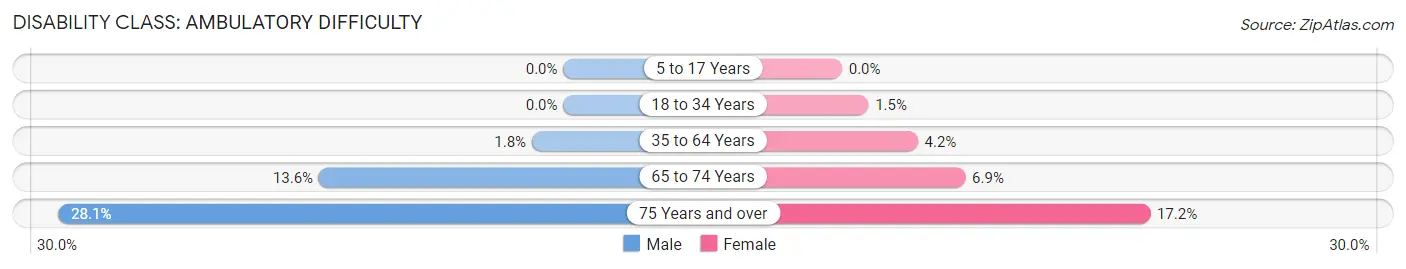
| Age Bracket | Male | Female |
| 5 to 17 Years | 0 (0.0%) | 0 (0.0%) |
| 18 to 34 Years | 0 (0.0%) | 20 (1.5%) |
| 35 to 64 Years | 37 (1.8%) | 105 (4.2%) |
| 65 to 74 Years | 95 (13.6%) | 58 (6.9%) |
| 75 Years and over | 119 (28.1%) | 105 (17.2%) |
Disability Class: Self-Care Difficulty
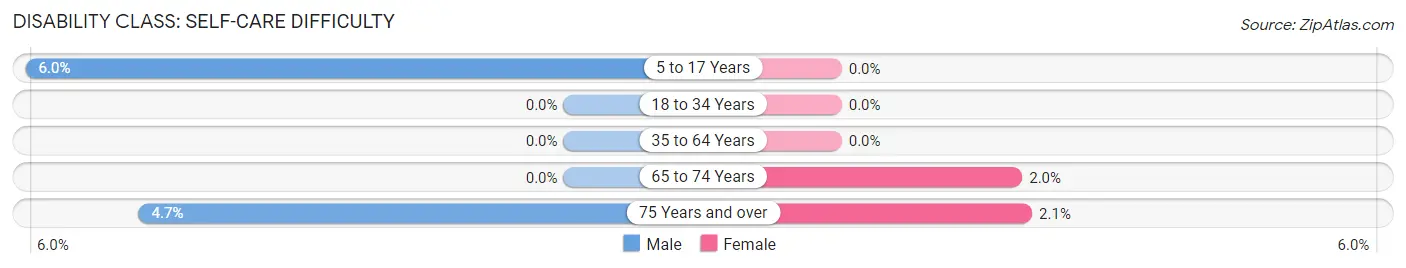
| Age Bracket | Male | Female |
| 5 to 17 Years | 49 (6.0%) | 0 (0.0%) |
| 18 to 34 Years | 0 (0.0%) | 0 (0.0%) |
| 35 to 64 Years | 0 (0.0%) | 0 (0.0%) |
| 65 to 74 Years | 0 (0.0%) | 17 (2.0%) |
| 75 Years and over | 20 (4.7%) | 13 (2.1%) |
Technology Access in Red Bank borough
Computing Device Access in Red Bank borough
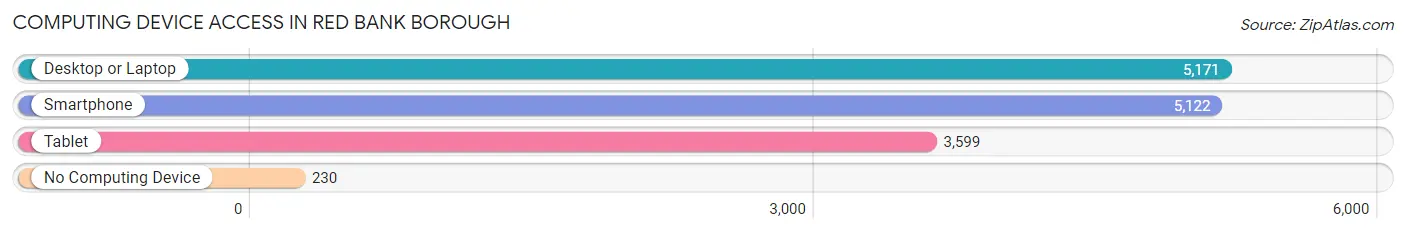
| Device Type | # Households | % Households |
| Desktop or Laptop | 5,171 | 85.0% |
| Smartphone | 5,122 | 84.2% |
| Tablet | 3,599 | 59.2% |
| No Computing Device | 230 | 3.8% |
| Total | 6,084 | 100.0% |
Internet Access in Red Bank borough
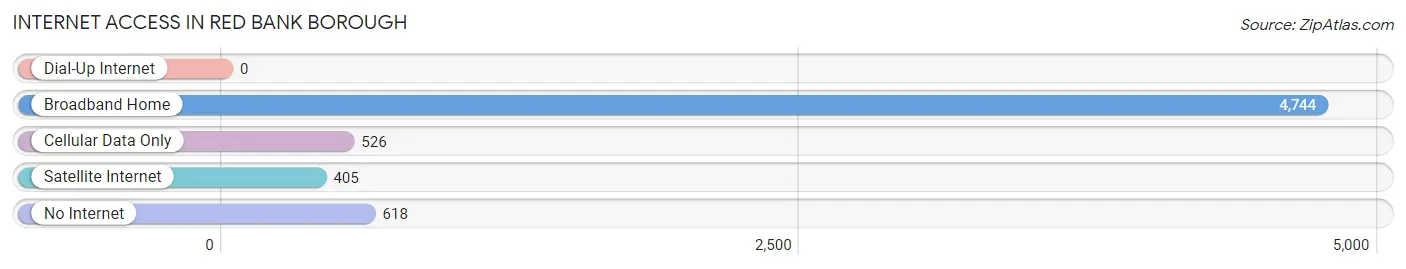
| Internet Type | # Households | % Households |
| Dial-Up Internet | 0 | 0.0% |
| Broadband Home | 4,744 | 78.0% |
| Cellular Data Only | 526 | 8.6% |
| Satellite Internet | 405 | 6.7% |
| No Internet | 618 | 10.2% |
| Total | 6,084 | 100.0% |
Red Bank borough Summary
Introduction
Red Bank Borough is a small borough located in Monmouth County, New Jersey. It is situated on the Navesink River, about two miles from the Atlantic Ocean. The borough is home to a population of 12,206 people, according to the 2010 United States Census. Red Bank is known for its vibrant downtown area, which is home to a variety of shops, restaurants, and entertainment venues. The borough is also home to several historic sites, including the Red Bank Battlefield Park and the Red Bank Opera House.
History
The area that is now Red Bank Borough was originally inhabited by the Lenape Native Americans. The first European settlers arrived in the area in the late 17th century. The area was initially known as “Little Silver Point” and was part of Shrewsbury Township. In 1870, the area was incorporated as the Borough of Red Bank.
The borough was named after the red clay soil found in the area. The area quickly became a popular destination for wealthy New Yorkers, who built large estates along the Navesink River. The borough was also home to several industries, including a shipbuilding yard, a glass factory, and a paper mill.
Geography
Red Bank Borough is located in Monmouth County, New Jersey. It is situated on the Navesink River, about two miles from the Atlantic Ocean. The borough is bordered by the boroughs of Shrewsbury, Little Silver, and Fair Haven. The borough covers an area of 1.7 square miles and is home to a population of 12,206 people, according to the 2010 United States Census.
The borough is located in the Raritan Valley region of New Jersey. The area is characterized by rolling hills and valleys, with the highest point in the borough being the Red Bank Battlefield Park, which is located at an elevation of 150 feet. The borough is also home to several parks, including the Red Bank Battlefield Park, the Riverside Gardens Park, and the Marine Park.
Economy
Red Bank Borough is home to a variety of businesses and industries. The borough is home to several large employers, including the Monmouth Medical Center, the Monmouth County Library, and the Monmouth County Park System. The borough is also home to a variety of retail stores, restaurants, and entertainment venues.
The borough is also home to several financial institutions, including the Red Bank National Bank, the Red Bank Savings Bank, and the Red Bank Trust Company. The borough is also home to several insurance companies, including the Red Bank Insurance Company and the Red Bank Mutual Insurance Company.
Demographics
According to the 2010 United States Census, Red Bank Borough is home to a population of 12,206 people. The racial makeup of the borough is 79.3% White, 11.2% African American, 0.3% Native American, 3.2% Asian, 0.1% Pacific Islander, and 5.9% from other races. The median household income in the borough is $62,917, and the median family income is $76,917.
Conclusion
Red Bank Borough is a small borough located in Monmouth County, New Jersey. It is situated on the Navesink River, about two miles from the Atlantic Ocean. The borough is home to a population of 12,206 people, according to the 2010 United States Census. Red Bank is known for its vibrant downtown area, which is home to a variety of shops, restaurants, and entertainment venues. The borough is also home to several historic sites, including the Red Bank Battlefield Park and the Red Bank Opera House. The borough is home to a variety of businesses and industries, and is also home to several financial institutions and insurance companies. The racial makeup of the borough is 79.3% White, 11.2% African American, 0.3% Native American, 3.2% Asian, 0.1% Pacific Islander, and 5.9% from other races. The median household income in the borough is $62,917, and the median family income is $76,917.
Common Questions
What is the Total Population of Red Bank borough?
Total Population of Red Bank borough is 12,868.
What is the Total Male Population of Red Bank borough?
Total Male Population of Red Bank borough is 6,146.
What is the Total Female Population of Red Bank borough?
Total Female Population of Red Bank borough is 6,722.
What is the Ratio of Males per 100 Females in Red Bank borough?
There are 91.43 Males per 100 Females in Red Bank borough.
What is the Ratio of Females per 100 Males in Red Bank borough?
There are 109.37 Females per 100 Males in Red Bank borough.
What is the Median Population Age in Red Bank borough?
Median Population Age in Red Bank borough is 39.4 Years.
What is the Average Family Size in Red Bank borough
Average Family Size in Red Bank borough is 2.9 People.
What is the Average Household Size in Red Bank borough
Average Household Size in Red Bank borough is 2.1 People.
What is Per Capita Income in Red Bank borough?
Per Capita income in Red Bank borough is $66,966.
What is the Median Family Income in Red Bank borough?
Median Family Income in Red Bank borough is $114,331.
What is the Median Household income in Red Bank borough?
Median Household Income in Red Bank borough is $89,500.
What is Income or Wage Gap in Red Bank borough?
Income or Wage Gap in Red Bank borough is 4.7%.
Women in Red Bank borough earn 95.3 cents for every dollar earned by a man.
What is Inequality or Gini Index in Red Bank borough?
Inequality or Gini Index in Red Bank borough is 0.53.
How Large is the Labor Force in Red Bank borough?
There are 7,276 People in the Labor Forcein in Red Bank borough.
What is the Percentage of People in the Labor Force in Red Bank borough?
68.8% of People are in the Labor Force in Red Bank borough.
What is the Unemployment Rate in Red Bank borough?
Unemployment Rate in Red Bank borough is 3.2%.