Oceanport borough, NJ
Oceanport borough Overview
6,119
TOTAL POPULATION
2,993
MALE POPULATION
3,126
FEMALE POPULATION
95.75
MALES / 100 FEMALES
104.44
FEMALES / 100 MALES
51.8
MEDIAN AGE
3.2
AVG FAMILY SIZE
2.5
AVG HOUSEHOLD SIZE
$66,586
PER CAPITA INCOME
$171,690
AVG FAMILY INCOME
$132,723
AVG HOUSEHOLD INCOME
0.42
INEQUALITY / GINI INDEX
3,155
LABOR FORCE [ PEOPLE ]
60.1%
PERCENT IN LABOR FORCE
7.5%
UNEMPLOYMENT RATE
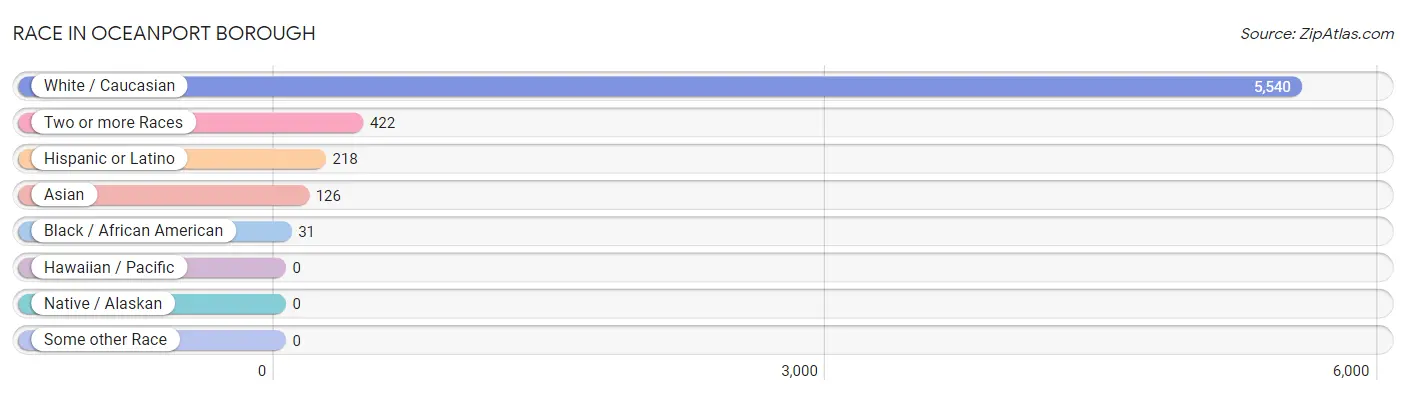
Race in Oceanport borough
The most populous races in Oceanport borough are White / Caucasian (5,540 | 90.5%), Two or more Races (422 | 6.9%), and Hispanic or Latino (218 | 3.6%).
| Race | # Population | % Population |
| Asian | 126 | 2.1% |
| Black / African American | 31 | 0.5% |
| Hawaiian / Pacific | 0 | 0.0% |
| Hispanic or Latino | 218 | 3.6% |
| Native / Alaskan | 0 | 0.0% |
| White / Caucasian | 5,540 | 90.5% |
| Two or more Races | 422 | 6.9% |
| Some other Race | 0 | 0.0% |
| Total | 6,119 | 100.0% |
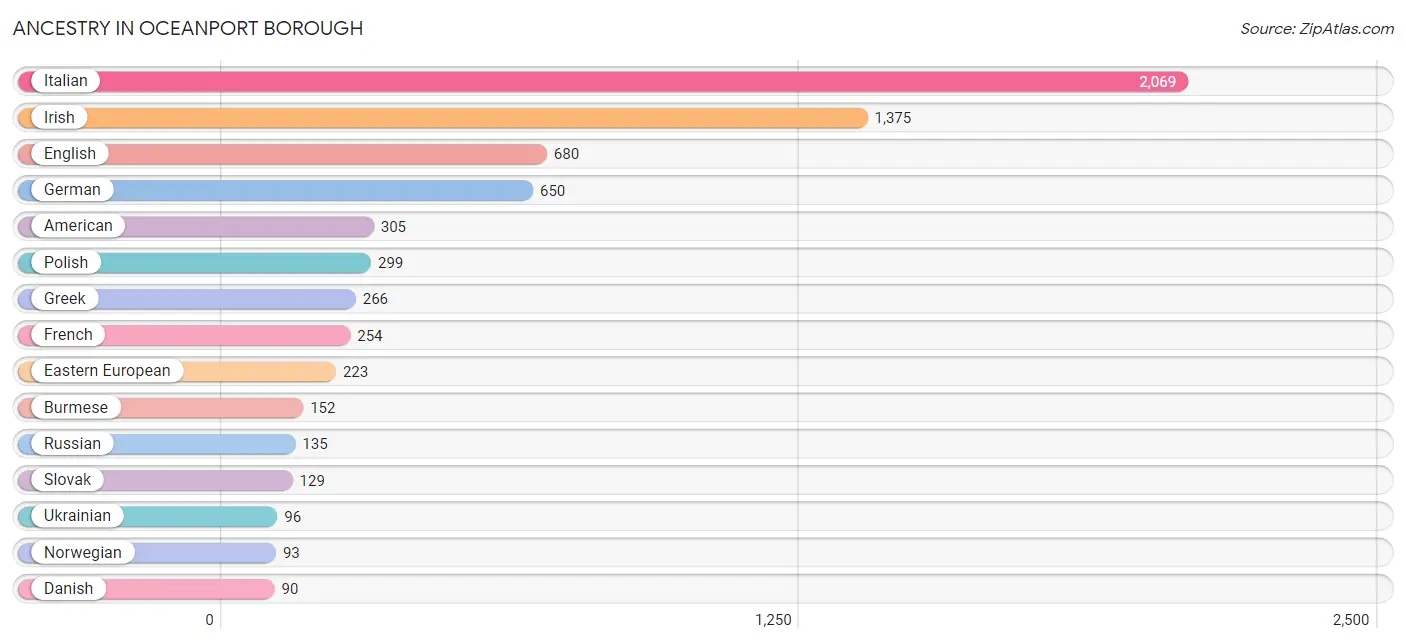
Ancestry in Oceanport borough
The most populous ancestries reported in Oceanport borough are Italian (2,069 | 33.8%), Irish (1,375 | 22.5%), English (680 | 11.1%), German (650 | 10.6%), and American (305 | 5.0%), together accounting for 83.0% of all Oceanport borough residents.
| Ancestry | # Population | % Population |
| American | 305 | 5.0% |
| Armenian | 26 | 0.4% |
| Blackfeet | 21 | 0.3% |
| British | 16 | 0.3% |
| Burmese | 152 | 2.5% |
| Czech | 32 | 0.5% |
| Danish | 90 | 1.5% |
| Dutch | 16 | 0.3% |
| Eastern European | 223 | 3.6% |
| English | 680 | 11.1% |
| European | 32 | 0.5% |
| French | 254 | 4.2% |
| French Canadian | 70 | 1.1% |
| German | 650 | 10.6% |
| Greek | 266 | 4.3% |
| Hungarian | 78 | 1.3% |
| Irish | 1,375 | 22.5% |
| Italian | 2,069 | 33.8% |
| Norwegian | 93 | 1.5% |
| Peruvian | 12 | 0.2% |
| Polish | 299 | 4.9% |
| Portuguese | 52 | 0.9% |
| Puerto Rican | 60 | 1.0% |
| Russian | 135 | 2.2% |
| Scandinavian | 48 | 0.8% |
| Scotch-Irish | 14 | 0.2% |
| Scottish | 68 | 1.1% |
| Seminole | 21 | 0.3% |
| Slovak | 129 | 2.1% |
| South American | 12 | 0.2% |
| Swedish | 28 | 0.5% |
| Thai | 17 | 0.3% |
| Ukrainian | 96 | 1.6% |
| Welsh | 18 | 0.3% | View All 34 Rows |
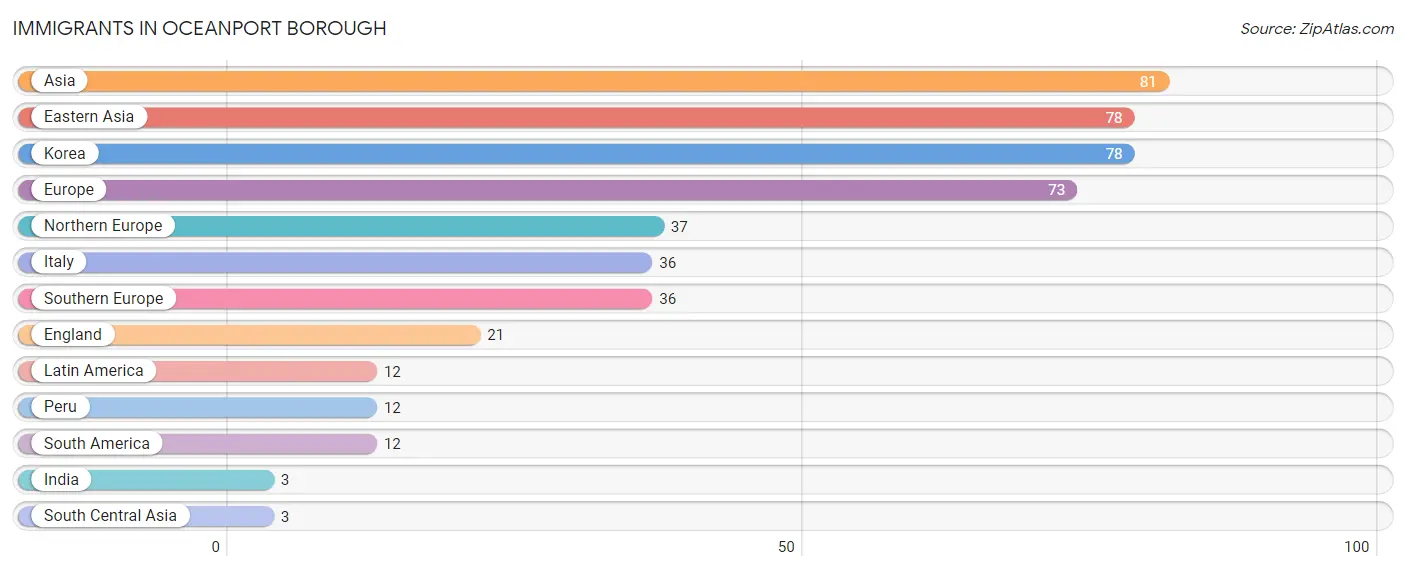
Immigrants in Oceanport borough
The most numerous immigrant groups reported in Oceanport borough came from Asia (81 | 1.3%), Eastern Asia (78 | 1.3%), Korea (78 | 1.3%), Europe (73 | 1.2%), and Northern Europe (37 | 0.6%), together accounting for 5.6% of all Oceanport borough residents.
| Immigration Origin | # Population | % Population |
| Asia | 81 | 1.3% |
| Eastern Asia | 78 | 1.3% |
| England | 21 | 0.3% |
| Europe | 73 | 1.2% |
| India | 3 | 0.1% |
| Italy | 36 | 0.6% |
| Korea | 78 | 1.3% |
| Latin America | 12 | 0.2% |
| Northern Europe | 37 | 0.6% |
| Peru | 12 | 0.2% |
| South America | 12 | 0.2% |
| South Central Asia | 3 | 0.1% |
| Southern Europe | 36 | 0.6% | View All 13 Rows |
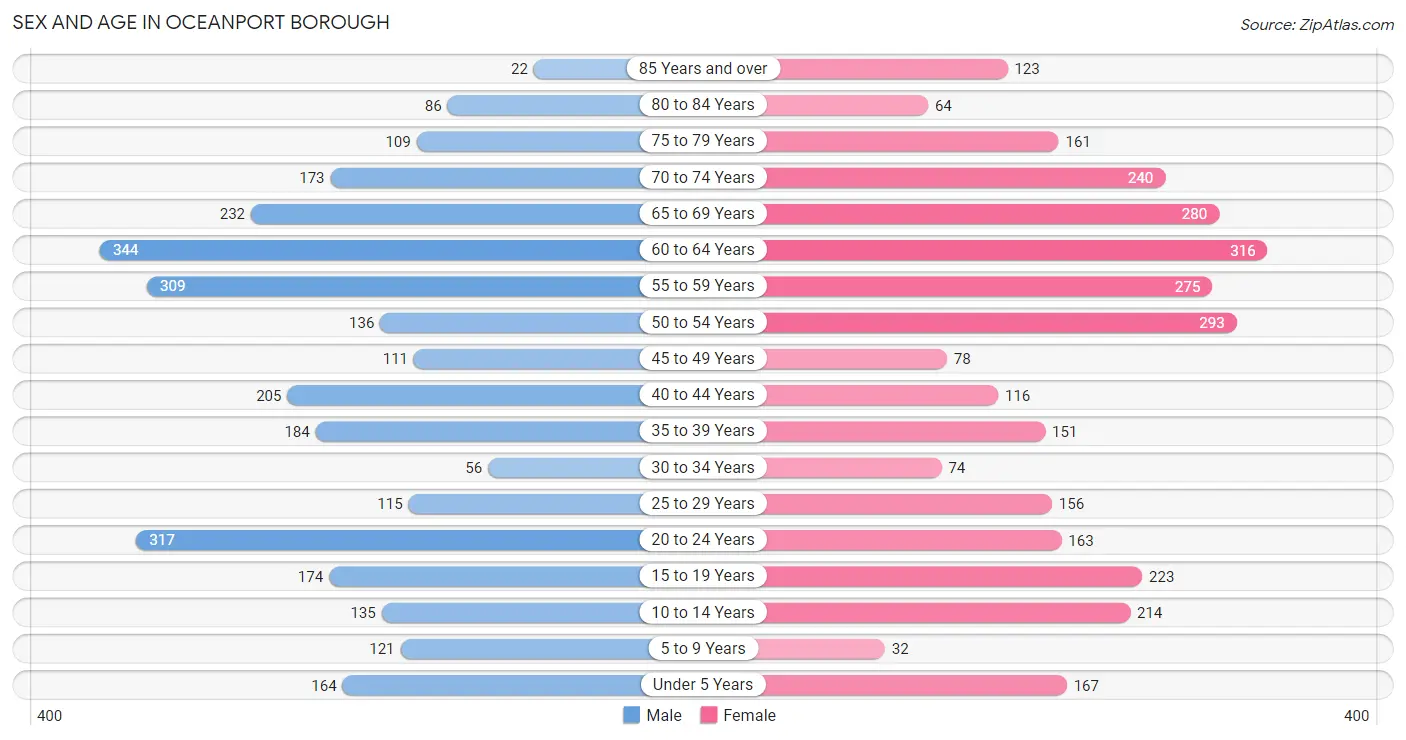
Sex and Age in Oceanport borough
Sex and Age in Oceanport borough
The most populous age groups in Oceanport borough are 60 to 64 Years (344 | 11.5%) for men and 60 to 64 Years (316 | 10.1%) for women.
| Age Bracket | Male | Female |
| Under 5 Years | 164 (5.5%) | 167 (5.3%) |
| 5 to 9 Years | 121 (4.0%) | 32 (1.0%) |
| 10 to 14 Years | 135 (4.5%) | 214 (6.9%) |
| 15 to 19 Years | 174 (5.8%) | 223 (7.1%) |
| 20 to 24 Years | 317 (10.6%) | 163 (5.2%) |
| 25 to 29 Years | 115 (3.8%) | 156 (5.0%) |
| 30 to 34 Years | 56 (1.9%) | 74 (2.4%) |
| 35 to 39 Years | 184 (6.1%) | 151 (4.8%) |
| 40 to 44 Years | 205 (6.9%) | 116 (3.7%) |
| 45 to 49 Years | 111 (3.7%) | 78 (2.5%) |
| 50 to 54 Years | 136 (4.5%) | 293 (9.4%) |
| 55 to 59 Years | 309 (10.3%) | 275 (8.8%) |
| 60 to 64 Years | 344 (11.5%) | 316 (10.1%) |
| 65 to 69 Years | 232 (7.7%) | 280 (9.0%) |
| 70 to 74 Years | 173 (5.8%) | 240 (7.7%) |
| 75 to 79 Years | 109 (3.6%) | 161 (5.1%) |
| 80 to 84 Years | 86 (2.9%) | 64 (2.1%) |
| 85 Years and over | 22 (0.7%) | 123 (3.9%) |
| Total | 2,993 (100.0%) | 3,126 (100.0%) |
Families and Households in Oceanport borough
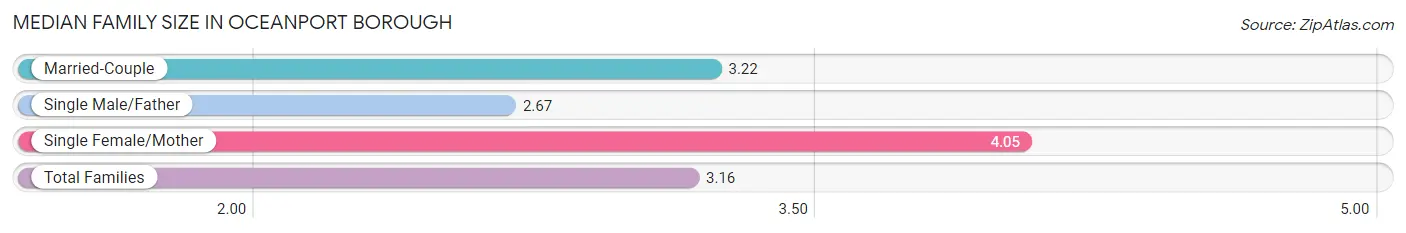
Median Family Size in Oceanport borough
The median family size in Oceanport borough is 3.16 persons per family, with single female/mother families (21 | 1.3%) accounting for the largest median family size of 4.05 persons per family. On the other hand, single male/father families (215 | 12.9%) represent the smallest median family size with 2.67 persons per family.
| Family Type | # Families | Family Size |
| Married-Couple | 1,428 (85.8%) | 3.22 |
| Single Male/Father | 215 (12.9%) | 2.67 |
| Single Female/Mother | 21 (1.3%) | 4.05 |
| Total Families | 1,664 (100.0%) | 3.16 |
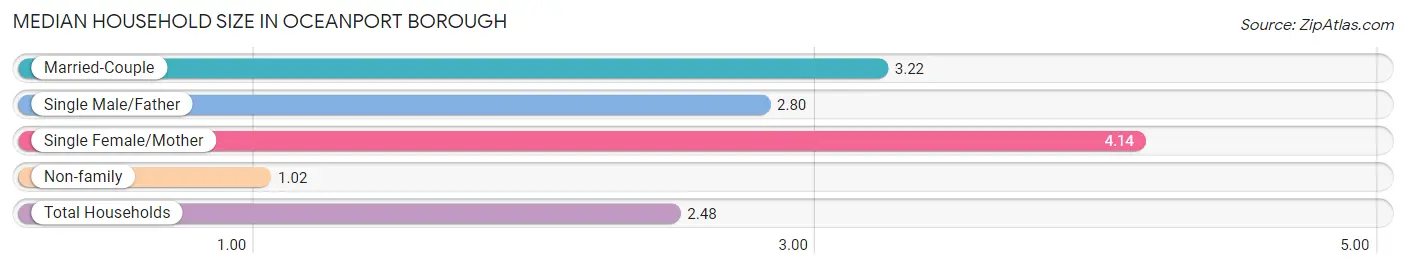
Median Household Size in Oceanport borough
The median household size in Oceanport borough is 2.48 persons per household, with single female/mother households (21 | 0.9%) accounting for the largest median household size of 4.14 persons per household. non-family households (795 | 32.3%) represent the smallest median household size with 1.02 persons per household.
| Household Type | # Households | Household Size |
| Married-Couple | 1,428 (58.1%) | 3.22 |
| Single Male/Father | 215 (8.7%) | 2.80 |
| Single Female/Mother | 21 (0.9%) | 4.14 |
| Non-family | 795 (32.3%) | 1.02 |
| Total Households | 2,459 (100.0%) | 2.48 |
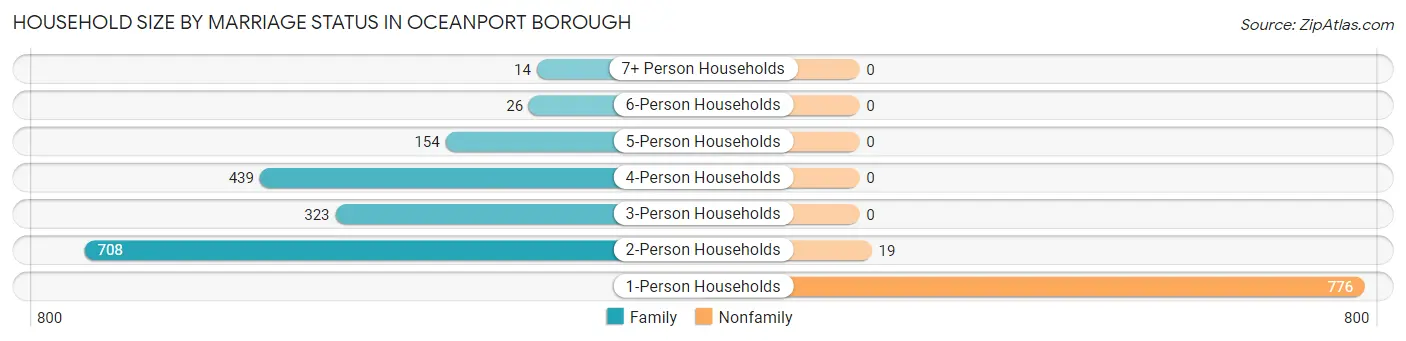
Household Size by Marriage Status in Oceanport borough
Out of a total of 2,459 households in Oceanport borough, 1,664 (67.7%) are family households, while 795 (32.3%) are nonfamily households. The most numerous type of family households are 2-person households, comprising 708, and the most common type of nonfamily households are 1-person households, comprising 776.
| Household Size | Family Households | Nonfamily Households |
| 1-Person Households | - | 776 (31.6%) |
| 2-Person Households | 708 (28.8%) | 19 (0.8%) |
| 3-Person Households | 323 (13.1%) | 0 (0.0%) |
| 4-Person Households | 439 (17.8%) | 0 (0.0%) |
| 5-Person Households | 154 (6.3%) | 0 (0.0%) |
| 6-Person Households | 26 (1.1%) | 0 (0.0%) |
| 7+ Person Households | 14 (0.6%) | 0 (0.0%) |
| Total | 1,664 (67.7%) | 795 (32.3%) |
Female Fertility in Oceanport borough
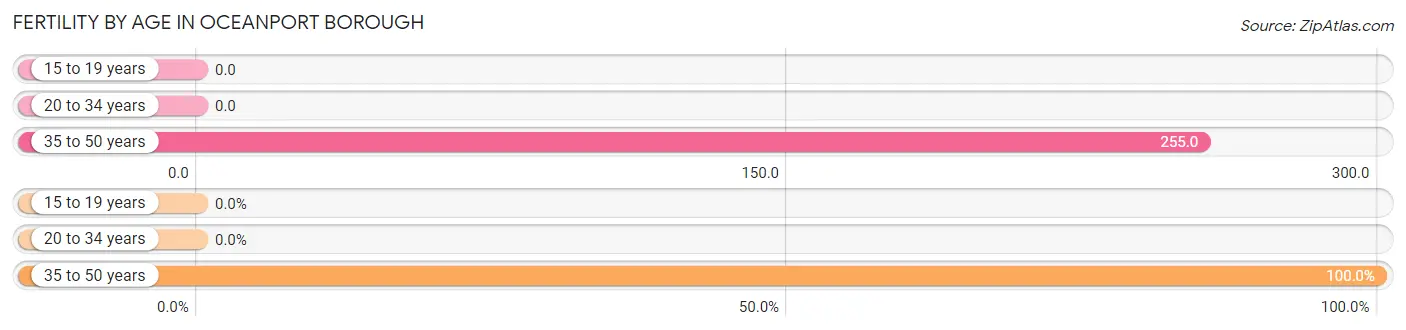
Fertility by Age in Oceanport borough
Average fertility rate in Oceanport borough is 92.0 births per 1,000 women. Women in the age bracket of 35 to 50 years have the highest fertility rate with 255.0 births per 1,000 women. Women in the age bracket of 35 to 50 years acount for 100.0% of all women with births.
| Age Bracket | Women with Births | Births / 1,000 Women |
| 15 to 19 years | 0 (0.0%) | 0.0 |
| 20 to 34 years | 0 (0.0%) | 0.0 |
| 35 to 50 years | 88 (100.0%) | 255.0 |
| Total | 88 (100.0%) | 92.0 |
Fertility by Age by Marriage Status in Oceanport borough
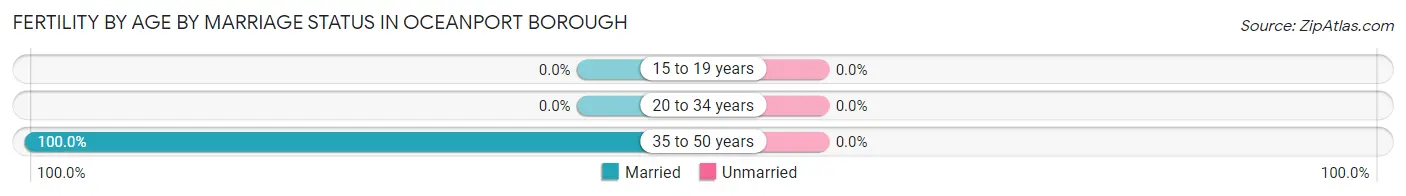
| Age Bracket | Married | Unmarried |
| 15 to 19 years | 0 (0.0%) | 0 (0.0%) |
| 20 to 34 years | 0 (0.0%) | 0 (0.0%) |
| 35 to 50 years | 88 (100.0%) | 0 (0.0%) |
| Total | 88 (100.0%) | 0 (0.0%) |
Fertility by Education in Oceanport borough
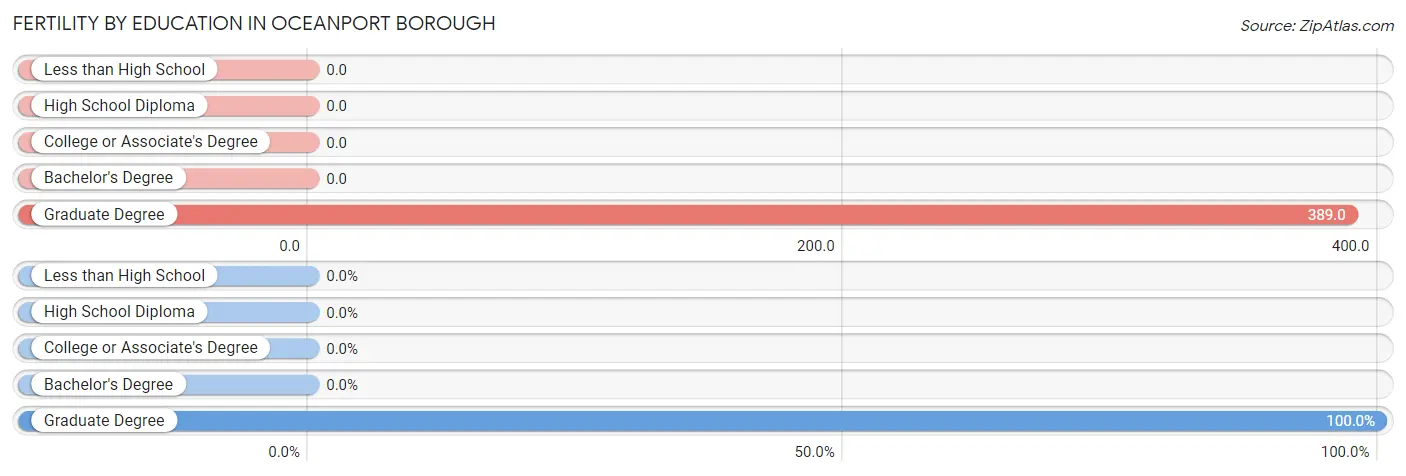
| Educational Attainment | Women with Births | Births / 1,000 Women |
| Less than High School | 0 (0.0%) | 0.0 |
| High School Diploma | 0 (0.0%) | 0.0 |
| College or Associate's Degree | 0 (0.0%) | 0.0 |
| Bachelor's Degree | 0 (0.0%) | 0.0 |
| Graduate Degree | 88 (100.0%) | 389.0 |
| Total | 88 (100.0%) | 92.0 |
Fertility by Education by Marriage Status in Oceanport borough
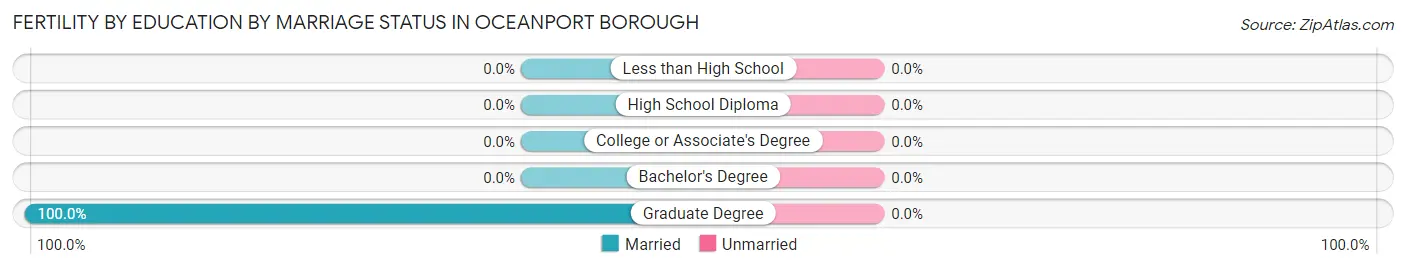
| Educational Attainment | Married | Unmarried |
| Less than High School | 0 (0.0%) | 0 (0.0%) |
| High School Diploma | 0 (0.0%) | 0 (0.0%) |
| College or Associate's Degree | 0 (0.0%) | 0 (0.0%) |
| Bachelor's Degree | 0 (0.0%) | 0 (0.0%) |
| Graduate Degree | 88 (100.0%) | 0 (0.0%) |
| Total | 88 (100.0%) | 0 (0.0%) |
Income in Oceanport borough
Income Overview in Oceanport borough
Per Capita Income in Oceanport borough is $66,586, while median incomes of families and households are $171,690 and $132,723 respectively.
| Characteristic | Number | Measure |
| Per Capita Income | 6,119 | $66,586 |
| Median Family Income | 1,664 | $171,690 |
| Mean Family Income | 1,664 | $208,720 |
| Median Household Income | 2,459 | $132,723 |
| Mean Household Income | 2,459 | $164,682 |
| Income Deficit | 1,664 | $0 |
| Wage / Income Gap (%) | 6,119 | 0.00% |
| Wage / Income Gap ($) | 6,119 | 100.00¢ per $1 |
| Gini / Inequality Index | 6,119 | 0.42 |
Earnings by Sex in Oceanport borough
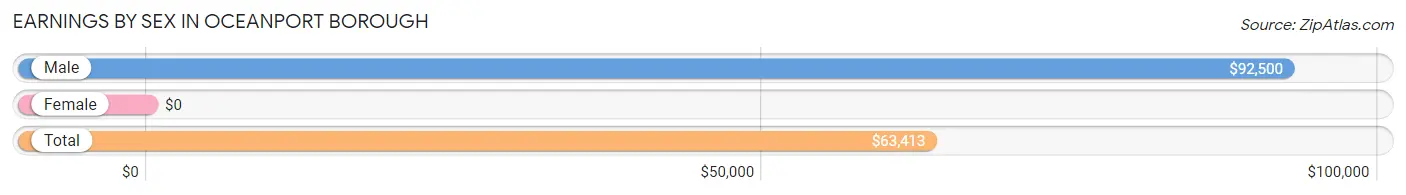
| Sex | Number | Average Earnings |
| Male | 1,904 (54.5%) | $92,500 |
| Female | 1,591 (45.5%) | $0 |
| Total | 3,495 (100.0%) | $63,413 |
Earnings by Sex by Income Bracket in Oceanport borough
The most common earnings brackets in Oceanport borough are $100,000+ for men (935 | 49.1%) and $100,000+ for women (295 | 18.5%).
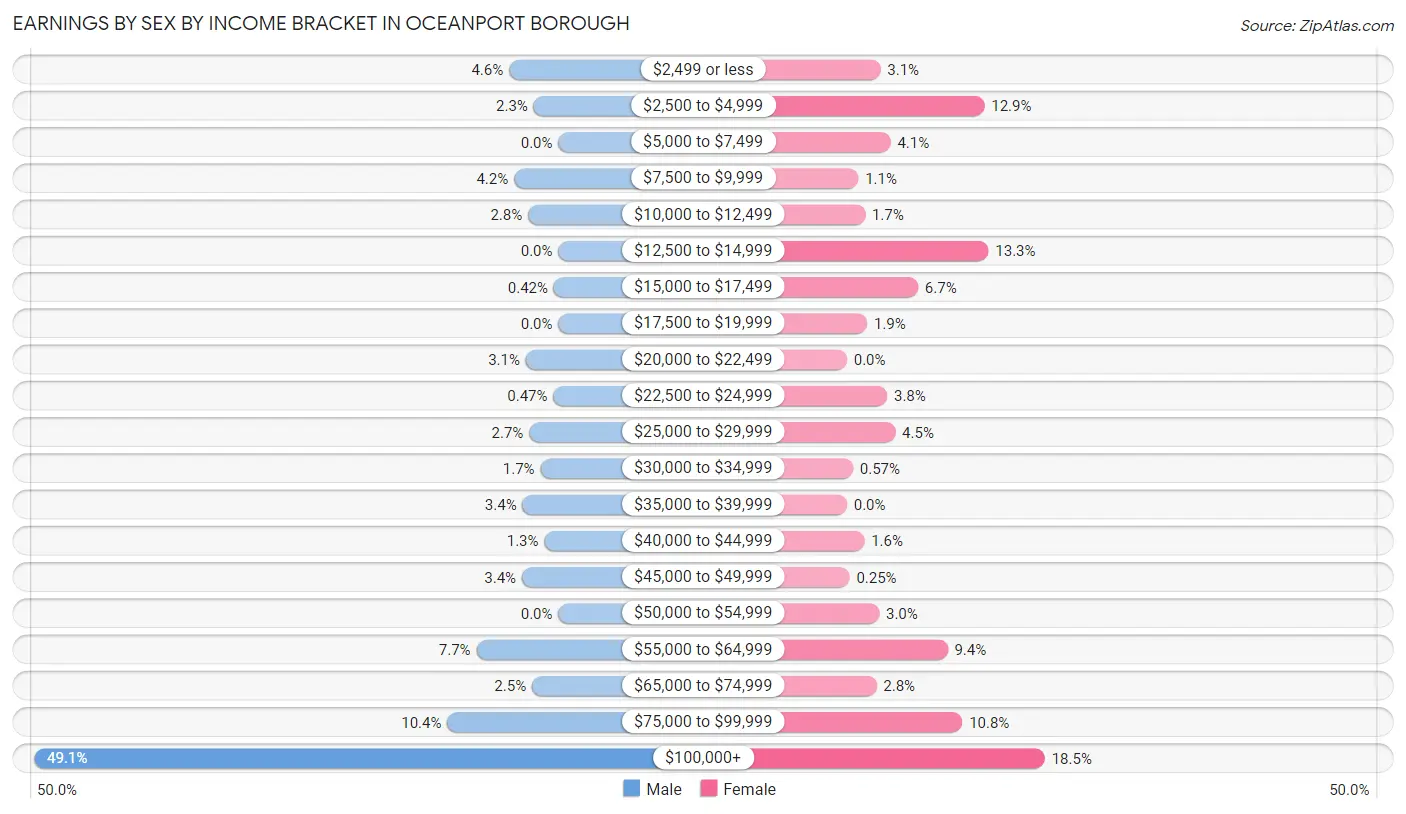
| Income | Male | Female |
| $2,499 or less | 88 (4.6%) | 50 (3.1%) |
| $2,500 to $4,999 | 44 (2.3%) | 205 (12.9%) |
| $5,000 to $7,499 | 0 (0.0%) | 65 (4.1%) |
| $7,500 to $9,999 | 79 (4.2%) | 17 (1.1%) |
| $10,000 to $12,499 | 54 (2.8%) | 27 (1.7%) |
| $12,500 to $14,999 | 0 (0.0%) | 211 (13.3%) |
| $15,000 to $17,499 | 8 (0.4%) | 106 (6.7%) |
| $17,500 to $19,999 | 0 (0.0%) | 30 (1.9%) |
| $20,000 to $22,499 | 58 (3.0%) | 0 (0.0%) |
| $22,500 to $24,999 | 9 (0.5%) | 60 (3.8%) |
| $25,000 to $29,999 | 52 (2.7%) | 72 (4.5%) |
| $30,000 to $34,999 | 32 (1.7%) | 9 (0.6%) |
| $35,000 to $39,999 | 64 (3.4%) | 0 (0.0%) |
| $40,000 to $44,999 | 25 (1.3%) | 26 (1.6%) |
| $45,000 to $49,999 | 65 (3.4%) | 4 (0.3%) |
| $50,000 to $54,999 | 0 (0.0%) | 48 (3.0%) |
| $55,000 to $64,999 | 146 (7.7%) | 150 (9.4%) |
| $65,000 to $74,999 | 47 (2.5%) | 44 (2.8%) |
| $75,000 to $99,999 | 198 (10.4%) | 172 (10.8%) |
| $100,000+ | 935 (49.1%) | 295 (18.5%) |
| Total | 1,904 (100.0%) | 1,591 (100.0%) |
Earnings by Sex by Educational Attainment in Oceanport borough
Average earnings in Oceanport borough are $119,135 for men and $58,667 for women, a difference of 50.8%. Men with an educational attainment of graduate degree enjoy the highest average annual earnings of $192,512, while those with less than high school education earn the least with $61,734. Women with an educational attainment of bachelor's degree earn the most with the average annual earnings of $71,389, while those with high school diploma education have the smallest earnings of $23,333.
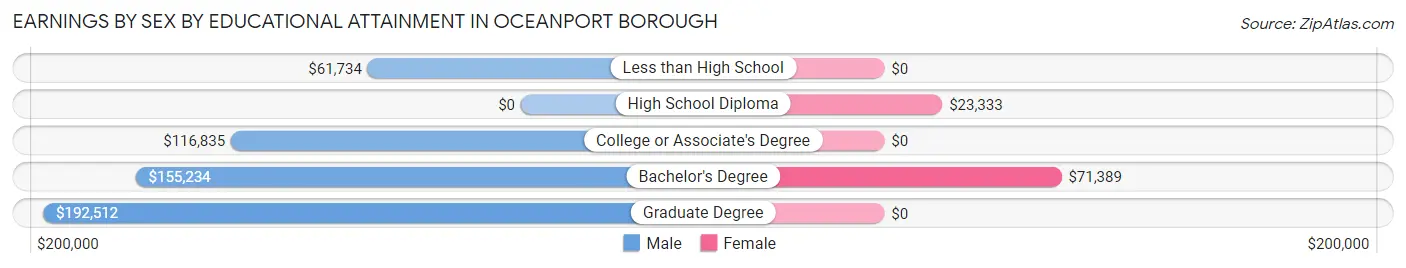
| Educational Attainment | Male Income | Female Income |
| Less than High School | $61,734 | $0 |
| High School Diploma | - | - |
| College or Associate's Degree | $116,835 | $0 |
| Bachelor's Degree | $155,234 | $71,389 |
| Graduate Degree | $192,512 | $0 |
| Total | $119,135 | $58,667 |
Family Income in Oceanport borough
Family Income Brackets in Oceanport borough
According to the Oceanport borough family income data, there are 652 families falling into the $200,000+ income range, which is the most common income bracket and makes up 39.2% of all families.
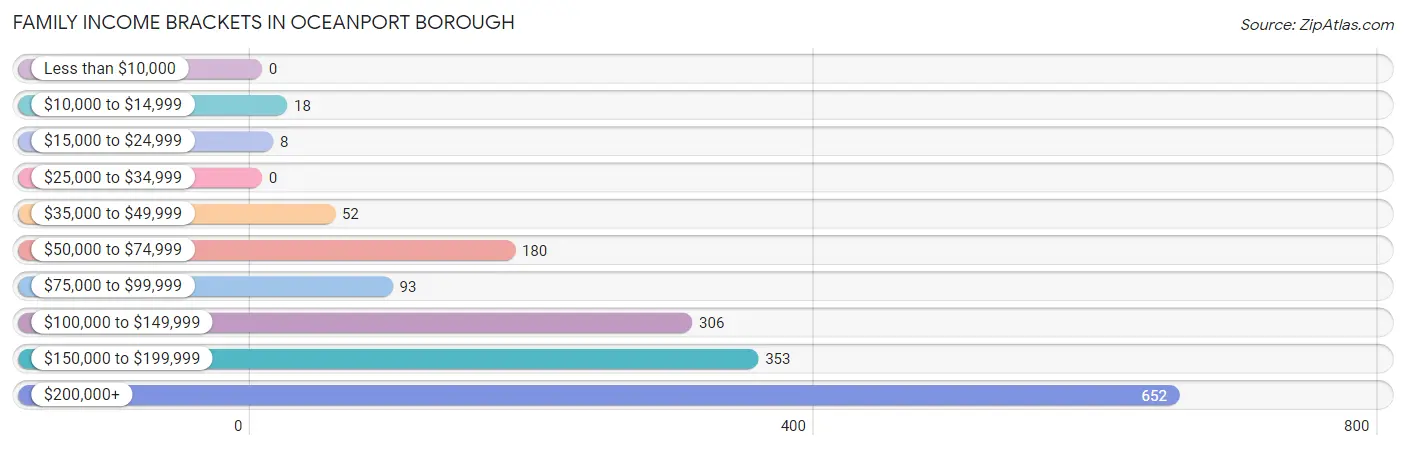
| Income Bracket | # Families | % Families |
| Less than $10,000 | 0 | 0.0% |
| $10,000 to $14,999 | 18 | 1.1% |
| $15,000 to $24,999 | 8 | 0.5% |
| $25,000 to $34,999 | 0 | 0.0% |
| $35,000 to $49,999 | 52 | 3.1% |
| $50,000 to $74,999 | 180 | 10.8% |
| $75,000 to $99,999 | 93 | 5.6% |
| $100,000 to $149,999 | 306 | 18.4% |
| $150,000 to $199,999 | 353 | 21.2% |
| $200,000+ | 652 | 39.2% |
Family Income by Famaliy Size in Oceanport borough
3-person families (345 | 20.7%) account for the highest median family income in Oceanport borough with $247,150 per family, while 3-person families (345 | 20.7%) have the highest median income of $82,383 per family member.
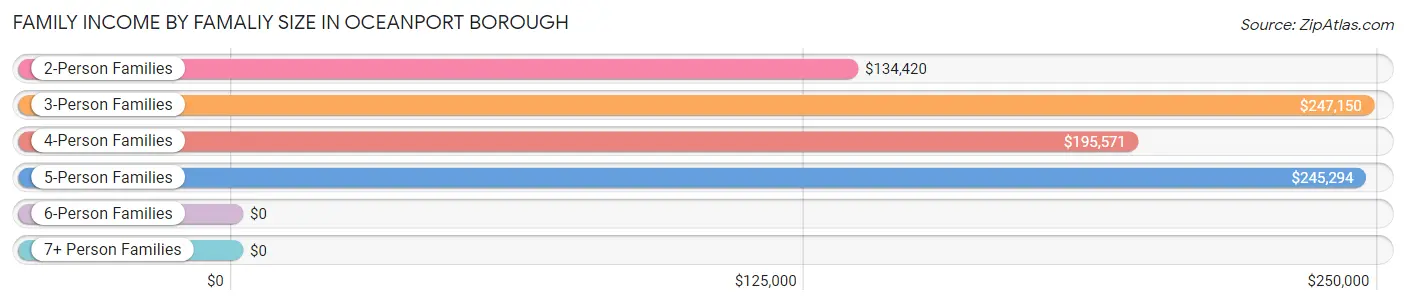
| Income Bracket | # Families | Median Income |
| 2-Person Families | 711 (42.7%) | $134,420 |
| 3-Person Families | 345 (20.7%) | $247,150 |
| 4-Person Families | 414 (24.9%) | $195,571 |
| 5-Person Families | 154 (9.2%) | $245,294 |
| 6-Person Families | 26 (1.6%) | $0 |
| 7+ Person Families | 14 (0.8%) | $0 |
| Total | 1,664 (100.0%) | $171,690 |
Family Income by Number of Earners in Oceanport borough
The median family income in Oceanport borough is $171,690, with families comprising 3+ earners (438) having the highest median family income of $246,610, while families with no earners (266) have the lowest median family income of $67,500, accounting for 26.3% and 16.0% of families, respectively.
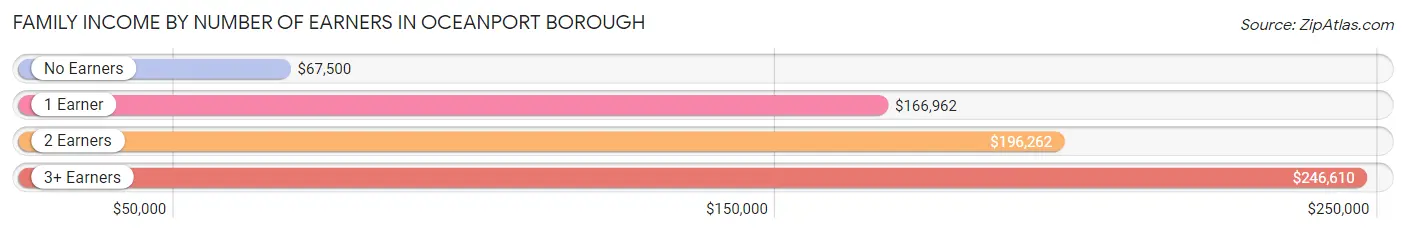
| Number of Earners | # Families | Median Income |
| No Earners | 266 (16.0%) | $67,500 |
| 1 Earner | 398 (23.9%) | $166,962 |
| 2 Earners | 562 (33.8%) | $196,262 |
| 3+ Earners | 438 (26.3%) | $246,610 |
| Total | 1,664 (100.0%) | $171,690 |
Household Income in Oceanport borough
Household Income Brackets in Oceanport borough
With 654 households falling in the category, the $200,000+ income range is the most frequent in Oceanport borough, accounting for 26.6% of all households.
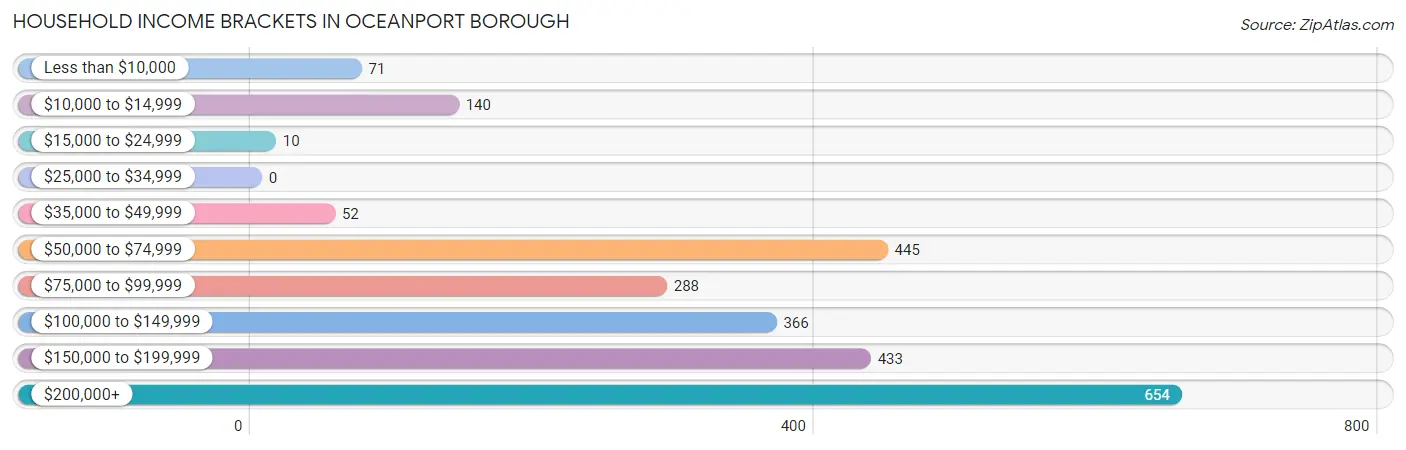
| Income Bracket | # Households | % Households |
| Less than $10,000 | 71 | 2.9% |
| $10,000 to $14,999 | 140 | 5.7% |
| $15,000 to $24,999 | 10 | 0.4% |
| $25,000 to $34,999 | 0 | 0.0% |
| $35,000 to $49,999 | 52 | 2.1% |
| $50,000 to $74,999 | 445 | 18.1% |
| $75,000 to $99,999 | 288 | 11.7% |
| $100,000 to $149,999 | 366 | 14.9% |
| $150,000 to $199,999 | 433 | 17.6% |
| $200,000+ | 654 | 26.6% |
Household Income by Householder Age in Oceanport borough
The median household income in Oceanport borough is $132,723, with the highest median household income of $197,298 found in the 25 to 44 years age bracket for the primary householder. A total of 335 households (13.6%) fall into this category.
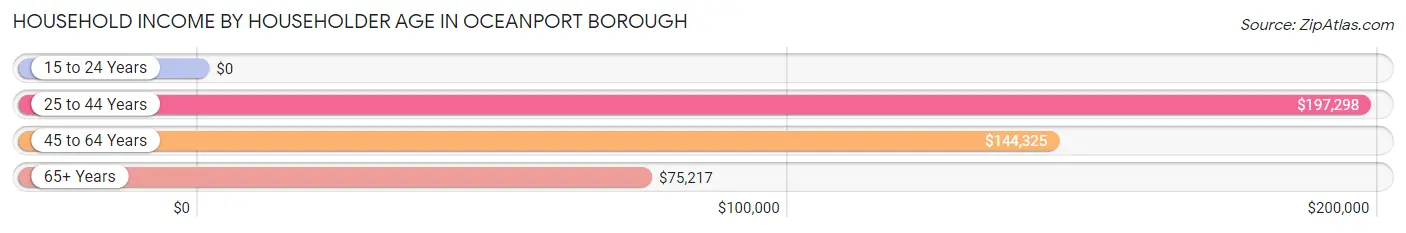
| Income Bracket | # Households | Median Income |
| 15 to 24 Years | 0 (0.0%) | $0 |
| 25 to 44 Years | 335 (13.6%) | $197,298 |
| 45 to 64 Years | 1,059 (43.1%) | $144,325 |
| 65+ Years | 1,065 (43.3%) | $75,217 |
| Total | 2,459 (100.0%) | $132,723 |
Poverty in Oceanport borough
Income Below Poverty by Sex and Age in Oceanport borough
With 3.0% poverty level for males and 4.3% for females among the residents of Oceanport borough, 25 to 34 year old males and 15 year old females are the most vulnerable to poverty, with 26 males (15.2%) and 10 females (38.5%) in their respective age groups living below the poverty level.
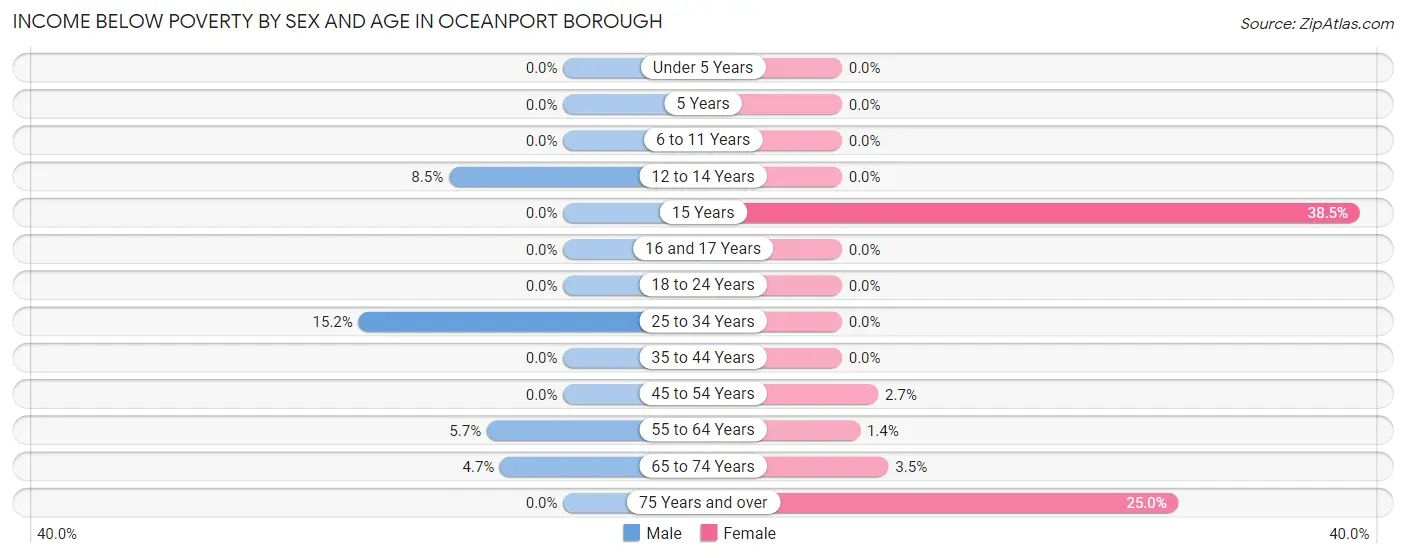
| Age Bracket | Male | Female |
| Under 5 Years | 0 (0.0%) | 0 (0.0%) |
| 5 Years | 0 (0.0%) | 0 (0.0%) |
| 6 to 11 Years | 0 (0.0%) | 0 (0.0%) |
| 12 to 14 Years | 9 (8.5%) | 0 (0.0%) |
| 15 Years | 0 (0.0%) | 10 (38.5%) |
| 16 and 17 Years | 0 (0.0%) | 0 (0.0%) |
| 18 to 24 Years | 0 (0.0%) | 0 (0.0%) |
| 25 to 34 Years | 26 (15.2%) | 0 (0.0%) |
| 35 to 44 Years | 0 (0.0%) | 0 (0.0%) |
| 45 to 54 Years | 0 (0.0%) | 10 (2.7%) |
| 55 to 64 Years | 37 (5.7%) | 8 (1.3%) |
| 65 to 74 Years | 19 (4.7%) | 18 (3.5%) |
| 75 Years and over | 0 (0.0%) | 87 (25.0%) |
| Total | 91 (3.0%) | 133 (4.3%) |
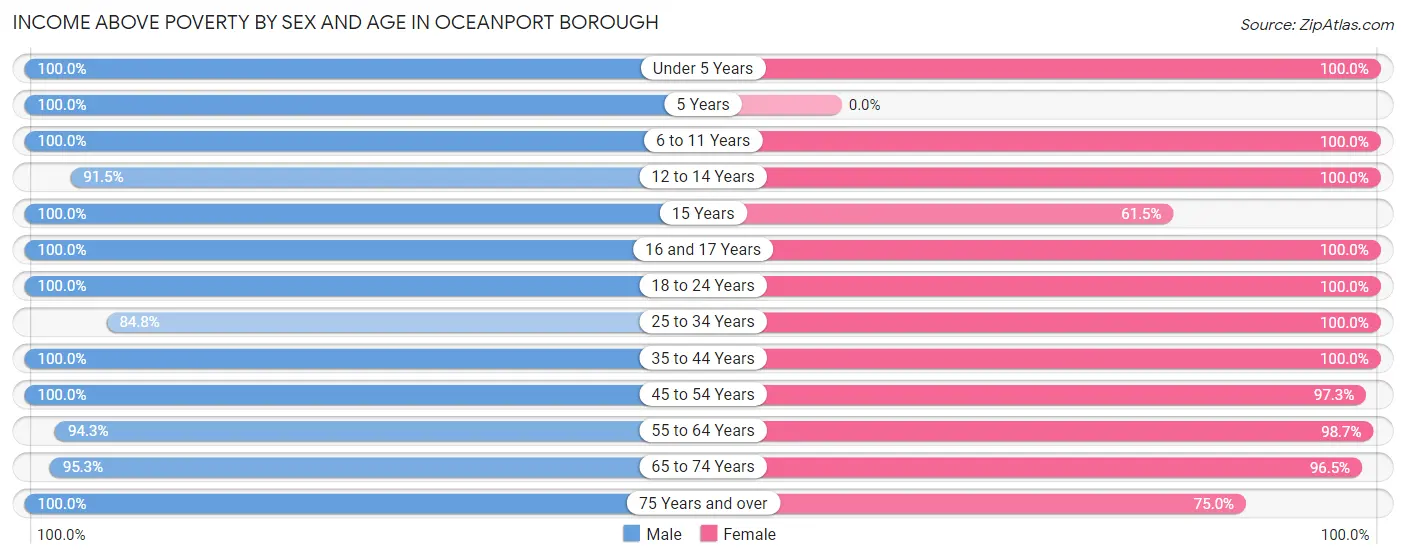
Income Above Poverty by Sex and Age in Oceanport borough
According to the poverty statistics in Oceanport borough, males aged under 5 years and females aged under 5 years are the age groups that are most secure financially, with 100.0% of males and 100.0% of females in these age groups living above the poverty line.
| Age Bracket | Male | Female |
| Under 5 Years | 164 (100.0%) | 167 (100.0%) |
| 5 Years | 11 (100.0%) | 0 (0.0%) |
| 6 to 11 Years | 139 (100.0%) | 129 (100.0%) |
| 12 to 14 Years | 97 (91.5%) | 117 (100.0%) |
| 15 Years | 10 (100.0%) | 16 (61.5%) |
| 16 and 17 Years | 112 (100.0%) | 63 (100.0%) |
| 18 to 24 Years | 369 (100.0%) | 297 (100.0%) |
| 25 to 34 Years | 145 (84.8%) | 230 (100.0%) |
| 35 to 44 Years | 389 (100.0%) | 267 (100.0%) |
| 45 to 54 Years | 247 (100.0%) | 361 (97.3%) |
| 55 to 64 Years | 616 (94.3%) | 583 (98.7%) |
| 65 to 74 Years | 386 (95.3%) | 502 (96.5%) |
| 75 Years and over | 217 (100.0%) | 261 (75.0%) |
| Total | 2,902 (97.0%) | 2,993 (95.8%) |
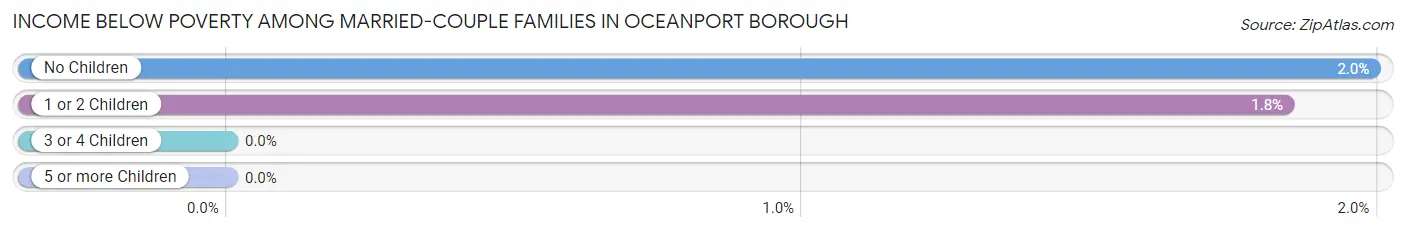
Income Below Poverty Among Married-Couple Families in Oceanport borough
The poverty statistics for married-couple families in Oceanport borough show that 1.9% or 27 of the total 1,428 families live below the poverty line. Families with no children have the highest poverty rate of 2.0%, comprising of 18 families. On the other hand, families with 3 or 4 children have the lowest poverty rate of 0.0%, which includes 0 families.
| Children | Above Poverty | Below Poverty |
| No Children | 885 (98.0%) | 18 (2.0%) |
| 1 or 2 Children | 480 (98.2%) | 9 (1.8%) |
| 3 or 4 Children | 36 (100.0%) | 0 (0.0%) |
| 5 or more Children | 0 (0.0%) | 0 (0.0%) |
| Total | 1,401 (98.1%) | 27 (1.9%) |
Income Below Poverty Among Single-Parent Households in Oceanport borough
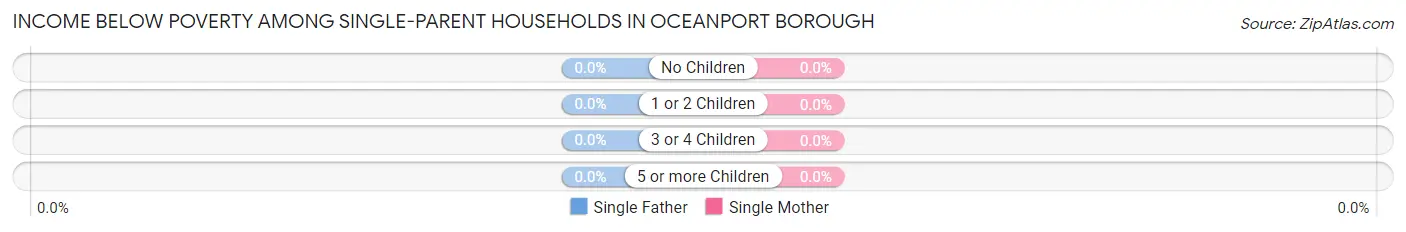
| Children | Single Father | Single Mother |
| No Children | 0 (0.0%) | 0 (0.0%) |
| 1 or 2 Children | 0 (0.0%) | 0 (0.0%) |
| 3 or 4 Children | 0 (0.0%) | 0 (0.0%) |
| 5 or more Children | 0 (0.0%) | 0 (0.0%) |
| Total | 0 (0.0%) | 0 (0.0%) |
Income Below Poverty Among Married-Couple vs Single-Parent Households in Oceanport borough
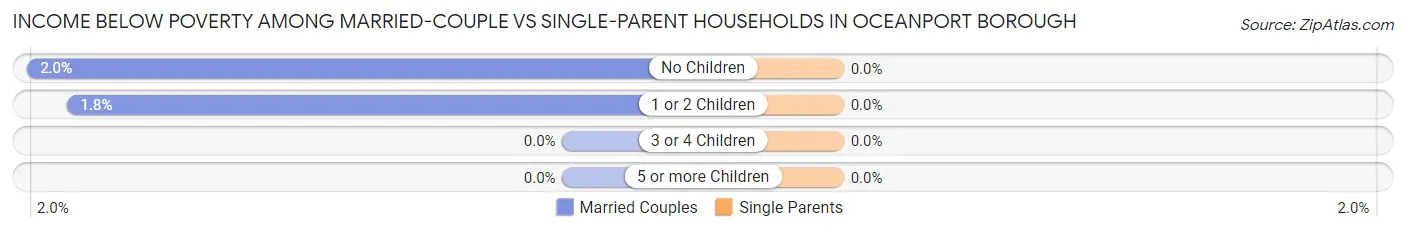
| Children | Married-Couple Families | Single-Parent Households |
| No Children | 18 (2.0%) | 0 (0.0%) |
| 1 or 2 Children | 9 (1.8%) | 0 (0.0%) |
| 3 or 4 Children | 0 (0.0%) | 0 (0.0%) |
| 5 or more Children | 0 (0.0%) | 0 (0.0%) |
| Total | 27 (1.9%) | 0 (0.0%) |
Employment Characteristics in Oceanport borough
Employment by Class of Employer in Oceanport borough
Among the 2,876 employed individuals in Oceanport borough, private company employees (1,756 | 61.1%), self-employed (incorporated) (415 | 14.4%), and local government employees (390 | 13.6%) make up the most common classes of employment.
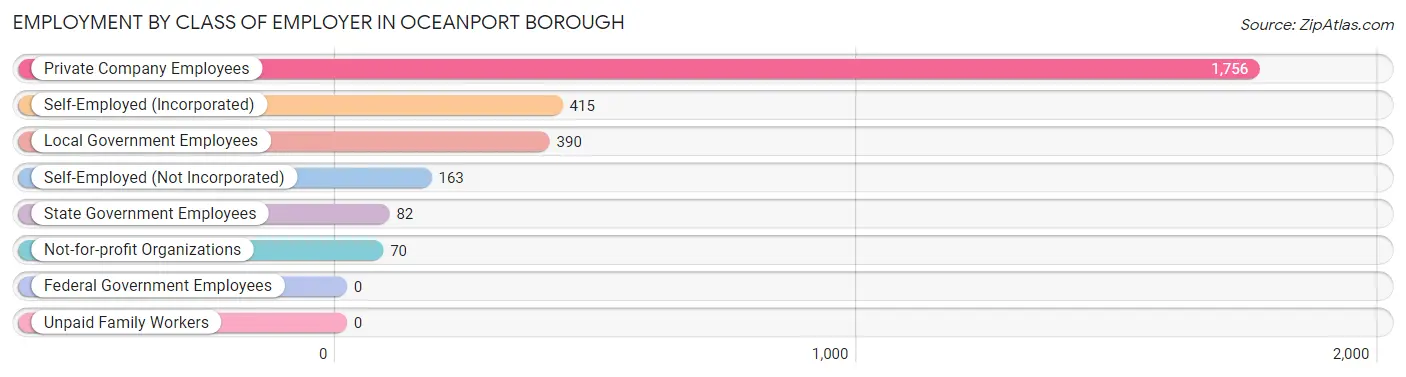
| Employer Class | # Employees | % Employees |
| Private Company Employees | 1,756 | 61.1% |
| Self-Employed (Incorporated) | 415 | 14.4% |
| Self-Employed (Not Incorporated) | 163 | 5.7% |
| Not-for-profit Organizations | 70 | 2.4% |
| Local Government Employees | 390 | 13.6% |
| State Government Employees | 82 | 2.9% |
| Federal Government Employees | 0 | 0.0% |
| Unpaid Family Workers | 0 | 0.0% |
| Total | 2,876 | 100.0% |
Employment Status by Age in Oceanport borough
According to the labor force statistics for Oceanport borough, out of the total population over 16 years of age (5,250), 60.1% or 3,155 individuals are in the labor force, with 7.5% or 237 of them unemployed. The age group with the highest labor force participation rate is 45 to 54 years, with 90.3% or 558 individuals in the labor force. Within the labor force, the 20 to 24 years age range has the highest percentage of unemployed individuals, with 32.0% or 132 of them being unemployed.
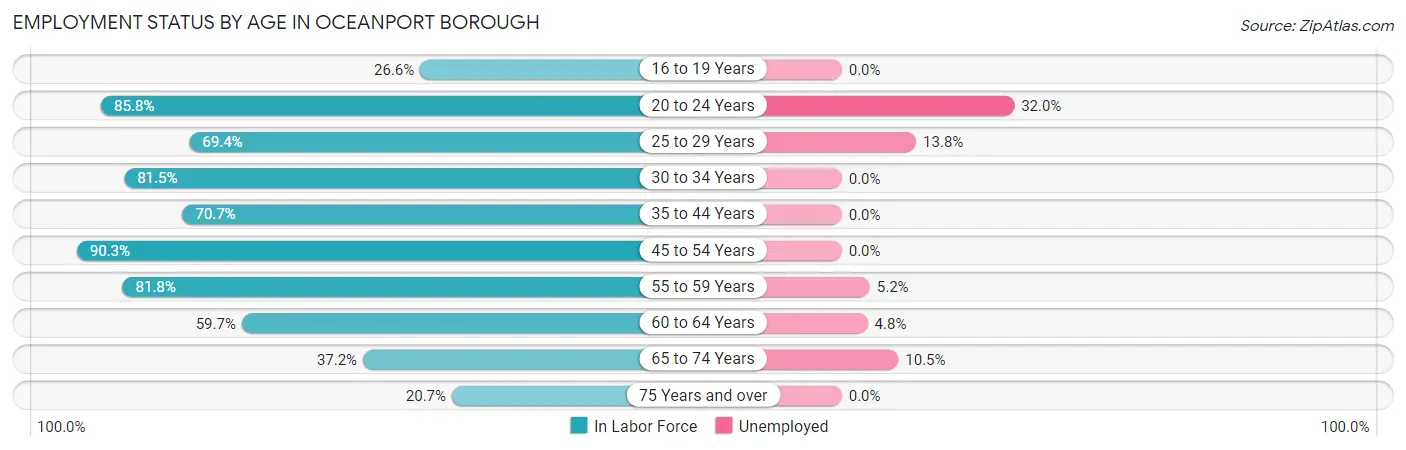
| Age Bracket | In Labor Force | Unemployed |
| 16 to 19 Years | 96 (26.6%) | 0 (0.0%) |
| 20 to 24 Years | 412 (85.8%) | 132 (32.0%) |
| 25 to 29 Years | 188 (69.4%) | 26 (13.8%) |
| 30 to 34 Years | 106 (81.5%) | 0 (0.0%) |
| 35 to 44 Years | 464 (70.7%) | 0 (0.0%) |
| 45 to 54 Years | 558 (90.3%) | 0 (0.0%) |
| 55 to 59 Years | 478 (81.8%) | 25 (5.2%) |
| 60 to 64 Years | 394 (59.7%) | 19 (4.8%) |
| 65 to 74 Years | 344 (37.2%) | 36 (10.5%) |
| 75 Years and over | 117 (20.7%) | 0 (0.0%) |
| Total | 3,155 (60.1%) | 237 (7.5%) |
Employment Status by Educational Attainment in Oceanport borough
According to labor force statistics for Oceanport borough, 75.0% of individuals (2,189) out of the total population between 25 and 64 years of age (2,919) are in the labor force, with 3.2% or 70 of them being unemployed. The group with the highest labor force participation rate are those with the educational attainment of college / associate degree, with 78.0% or 615 individuals in the labor force. Within the labor force, individuals with less than high school education have the highest percentage of unemployment, with 27.4% or 26 of them being unemployed.
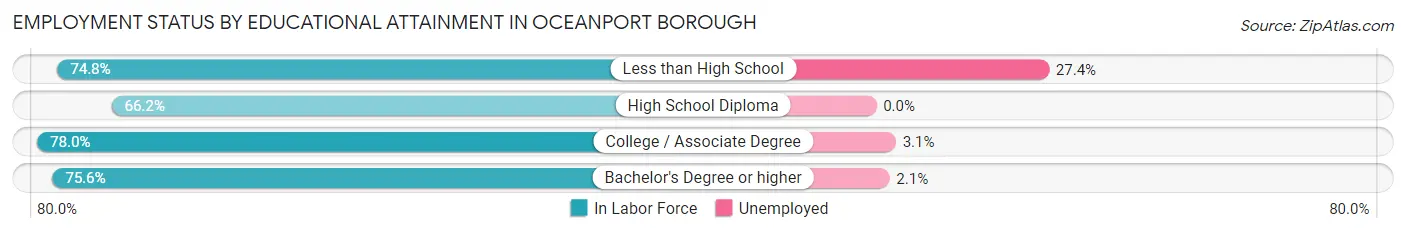
| Educational Attainment | In Labor Force | Unemployed |
| Less than High School | 95 (74.8%) | 35 (27.4%) |
| High School Diploma | 264 (66.2%) | 0 (0.0%) |
| College / Associate Degree | 615 (78.0%) | 24 (3.1%) |
| Bachelor's Degree or higher | 1,213 (75.6%) | 34 (2.1%) |
| Total | 2,189 (75.0%) | 93 (3.2%) |
Employment Occupations by Sex in Oceanport borough
Management, Business, Science and Arts Occupations
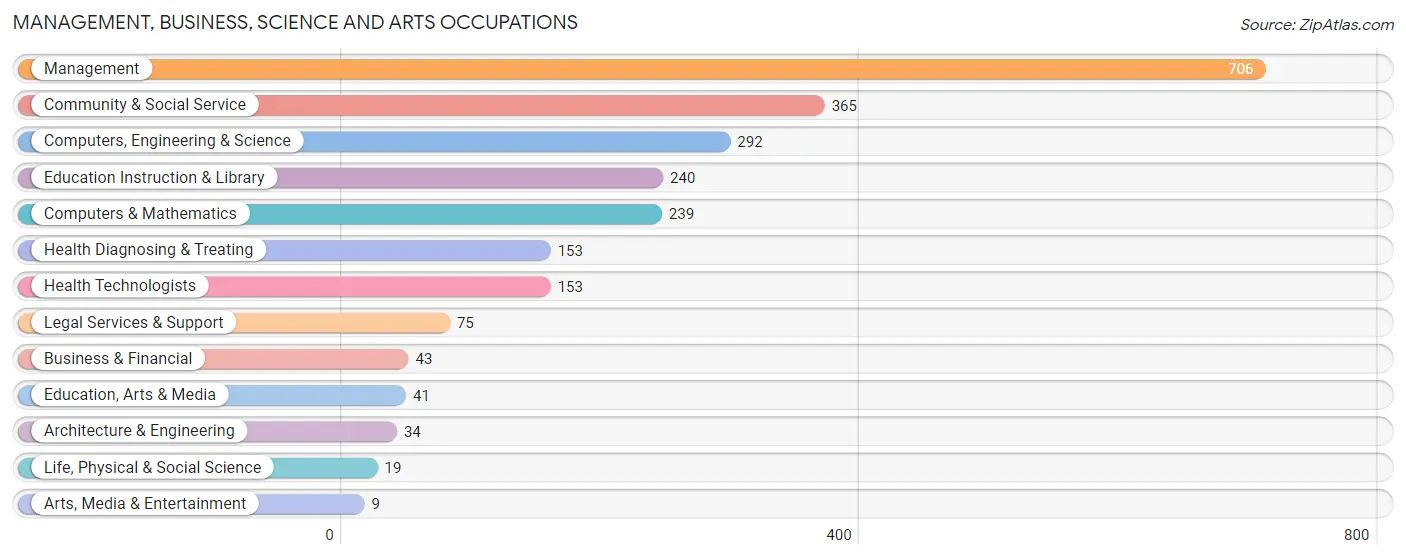
The most common Management, Business, Science and Arts occupations in Oceanport borough are Management (706 | 24.2%), Community & Social Service (365 | 12.5%), Computers, Engineering & Science (292 | 10.0%), Education Instruction & Library (240 | 8.2%), and Computers & Mathematics (239 | 8.2%).
Management, Business, Science and Arts Occupations by Sex
Within the Management, Business, Science and Arts occupations in Oceanport borough, the most male-oriented occupations are Architecture & Engineering (100.0%), Life, Physical & Social Science (100.0%), and Computers, Engineering & Science (79.1%), while the most female-oriented occupations are Business & Financial (100.0%), Education, Arts & Media (100.0%), and Legal Services & Support (100.0%).
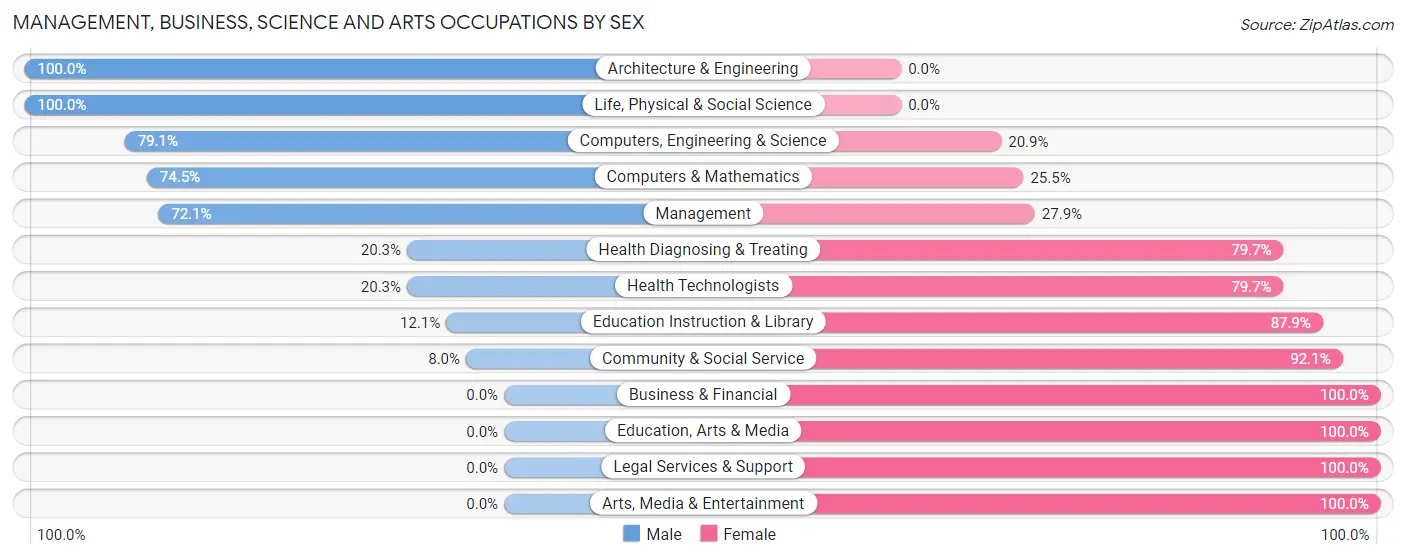
| Occupation | Male | Female |
| Management | 509 (72.1%) | 197 (27.9%) |
| Business & Financial | 0 (0.0%) | 43 (100.0%) |
| Computers, Engineering & Science | 231 (79.1%) | 61 (20.9%) |
| Computers & Mathematics | 178 (74.5%) | 61 (25.5%) |
| Architecture & Engineering | 34 (100.0%) | 0 (0.0%) |
| Life, Physical & Social Science | 19 (100.0%) | 0 (0.0%) |
| Community & Social Service | 29 (8.0%) | 336 (92.0%) |
| Education, Arts & Media | 0 (0.0%) | 41 (100.0%) |
| Legal Services & Support | 0 (0.0%) | 75 (100.0%) |
| Education Instruction & Library | 29 (12.1%) | 211 (87.9%) |
| Arts, Media & Entertainment | 0 (0.0%) | 9 (100.0%) |
| Health Diagnosing & Treating | 31 (20.3%) | 122 (79.7%) |
| Health Technologists | 31 (20.3%) | 122 (79.7%) |
| Total (Category) | 800 (51.3%) | 759 (48.7%) |
| Total (Overall) | 1,625 (55.7%) | 1,294 (44.3%) |
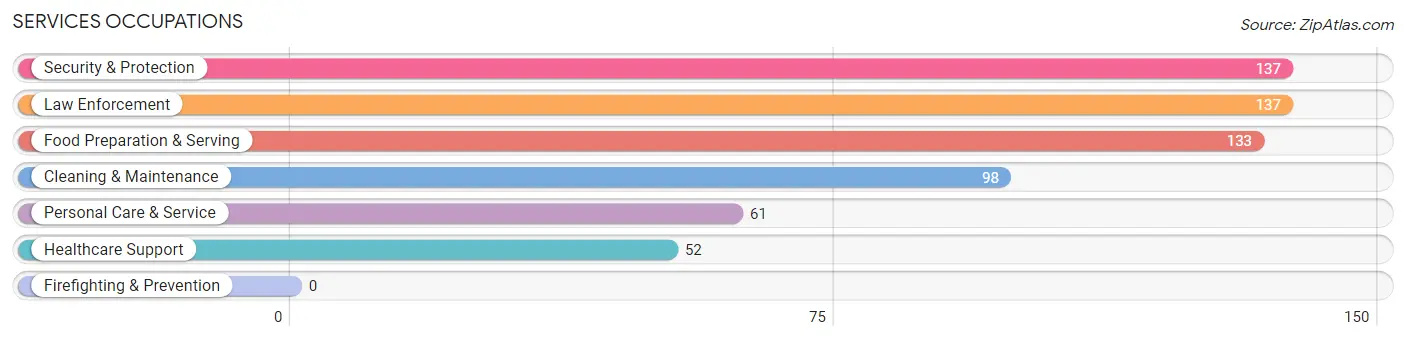
Services Occupations
The most common Services occupations in Oceanport borough are Security & Protection (137 | 4.7%), Law Enforcement (137 | 4.7%), Food Preparation & Serving (133 | 4.6%), Cleaning & Maintenance (98 | 3.4%), and Personal Care & Service (61 | 2.1%).
Services Occupations by Sex
Within the Services occupations in Oceanport borough, the most male-oriented occupations are Security & Protection (100.0%), Law Enforcement (100.0%), and Cleaning & Maintenance (100.0%), while the most female-oriented occupations are Healthcare Support (100.0%), Personal Care & Service (88.5%), and Food Preparation & Serving (59.4%).
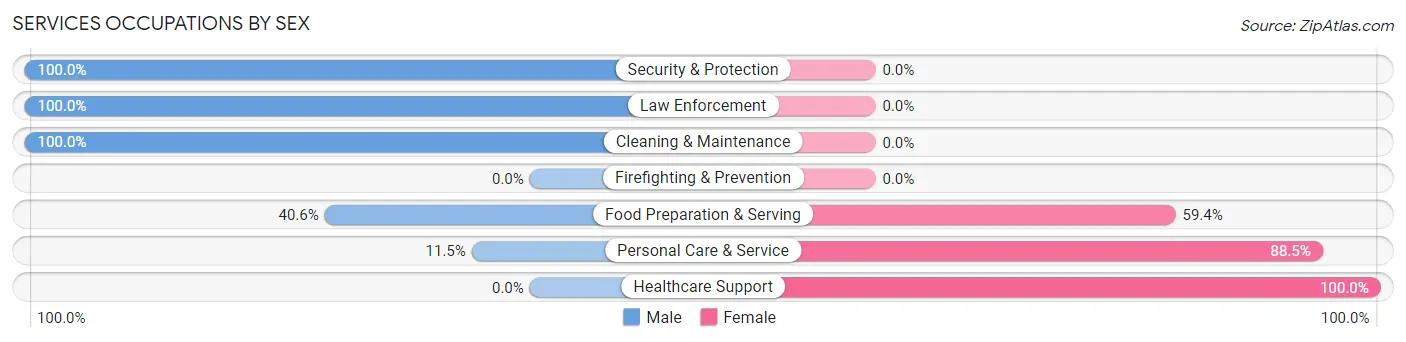
| Occupation | Male | Female |
| Healthcare Support | 0 (0.0%) | 52 (100.0%) |
| Security & Protection | 137 (100.0%) | 0 (0.0%) |
| Firefighting & Prevention | 0 (0.0%) | 0 (0.0%) |
| Law Enforcement | 137 (100.0%) | 0 (0.0%) |
| Food Preparation & Serving | 54 (40.6%) | 79 (59.4%) |
| Cleaning & Maintenance | 98 (100.0%) | 0 (0.0%) |
| Personal Care & Service | 7 (11.5%) | 54 (88.5%) |
| Total (Category) | 296 (61.5%) | 185 (38.5%) |
| Total (Overall) | 1,625 (55.7%) | 1,294 (44.3%) |
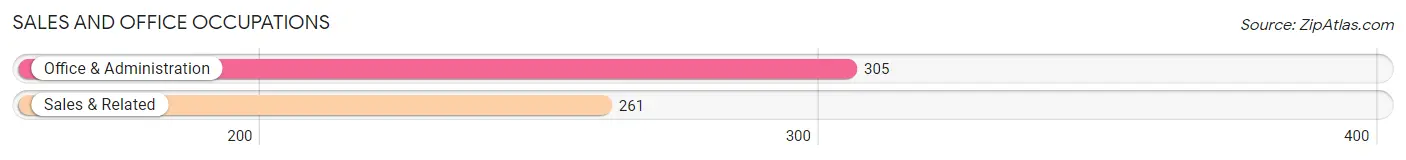
Sales and Office Occupations
The most common Sales and Office occupations in Oceanport borough are Office & Administration (305 | 10.4%), and Sales & Related (261 | 8.9%).
Sales and Office Occupations by Sex
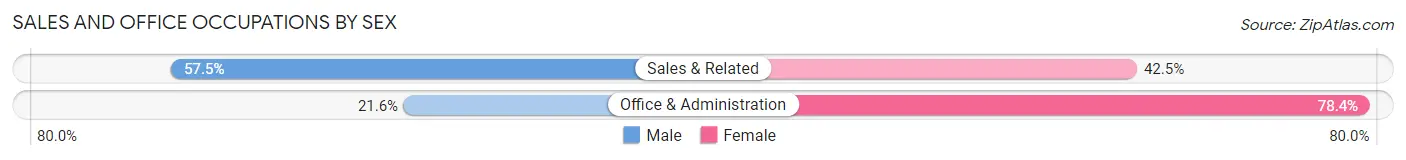
| Occupation | Male | Female |
| Sales & Related | 150 (57.5%) | 111 (42.5%) |
| Office & Administration | 66 (21.6%) | 239 (78.4%) |
| Total (Category) | 216 (38.2%) | 350 (61.8%) |
| Total (Overall) | 1,625 (55.7%) | 1,294 (44.3%) |
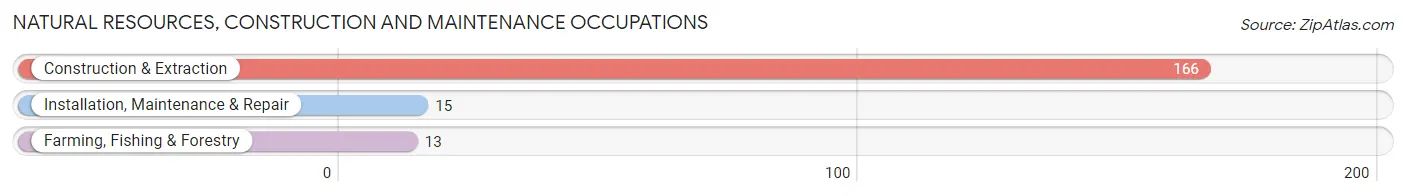
Natural Resources, Construction and Maintenance Occupations
The most common Natural Resources, Construction and Maintenance occupations in Oceanport borough are Construction & Extraction (166 | 5.7%), Installation, Maintenance & Repair (15 | 0.5%), and Farming, Fishing & Forestry (13 | 0.4%).
Natural Resources, Construction and Maintenance Occupations by Sex
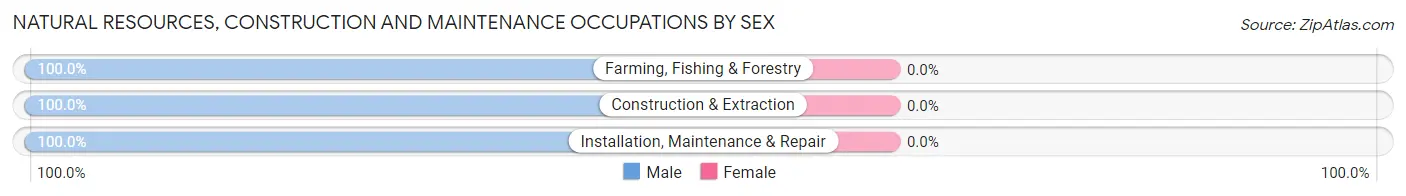
| Occupation | Male | Female |
| Farming, Fishing & Forestry | 13 (100.0%) | 0 (0.0%) |
| Construction & Extraction | 166 (100.0%) | 0 (0.0%) |
| Installation, Maintenance & Repair | 15 (100.0%) | 0 (0.0%) |
| Total (Category) | 194 (100.0%) | 0 (0.0%) |
| Total (Overall) | 1,625 (55.7%) | 1,294 (44.3%) |
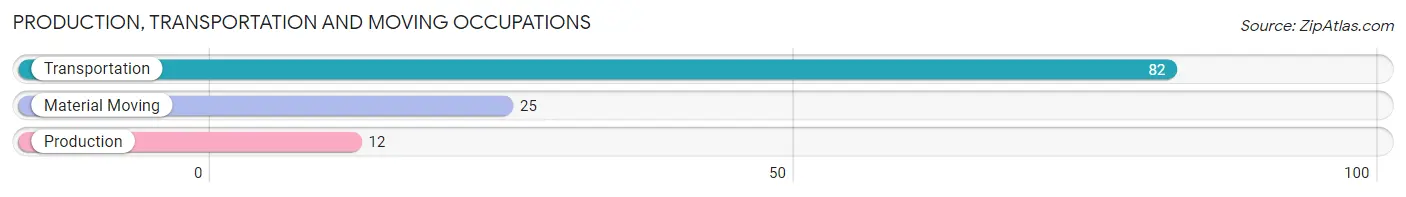
Production, Transportation and Moving Occupations
The most common Production, Transportation and Moving occupations in Oceanport borough are Transportation (82 | 2.8%), Material Moving (25 | 0.9%), and Production (12 | 0.4%).
Production, Transportation and Moving Occupations by Sex
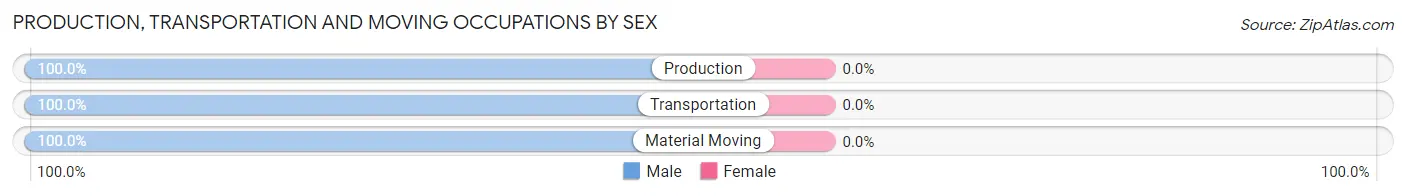
| Occupation | Male | Female |
| Production | 12 (100.0%) | 0 (0.0%) |
| Transportation | 82 (100.0%) | 0 (0.0%) |
| Material Moving | 25 (100.0%) | 0 (0.0%) |
| Total (Category) | 119 (100.0%) | 0 (0.0%) |
| Total (Overall) | 1,625 (55.7%) | 1,294 (44.3%) |
Employment Industries by Sex in Oceanport borough
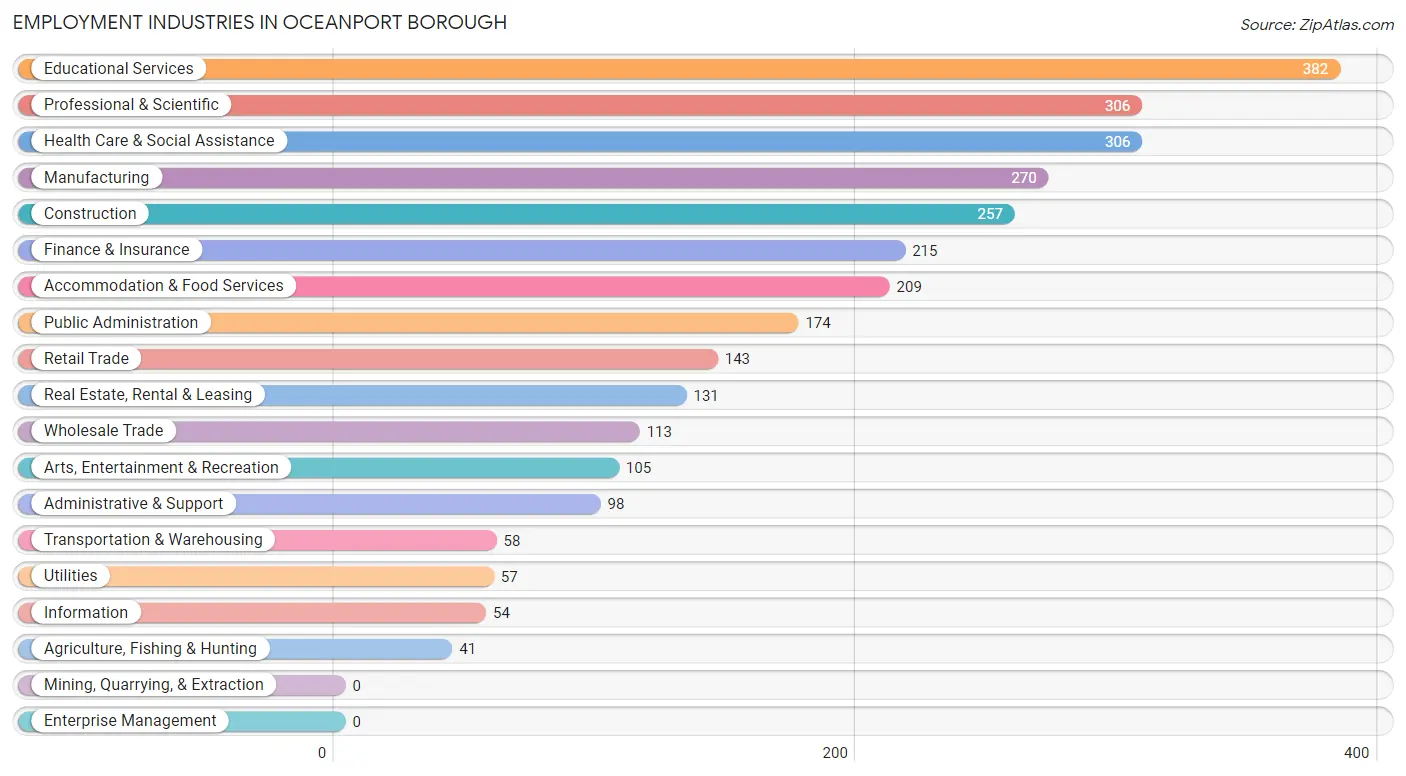
Employment Industries in Oceanport borough
The major employment industries in Oceanport borough include Educational Services (382 | 13.1%), Professional & Scientific (306 | 10.5%), Health Care & Social Assistance (306 | 10.5%), Manufacturing (270 | 9.2%), and Construction (257 | 8.8%).
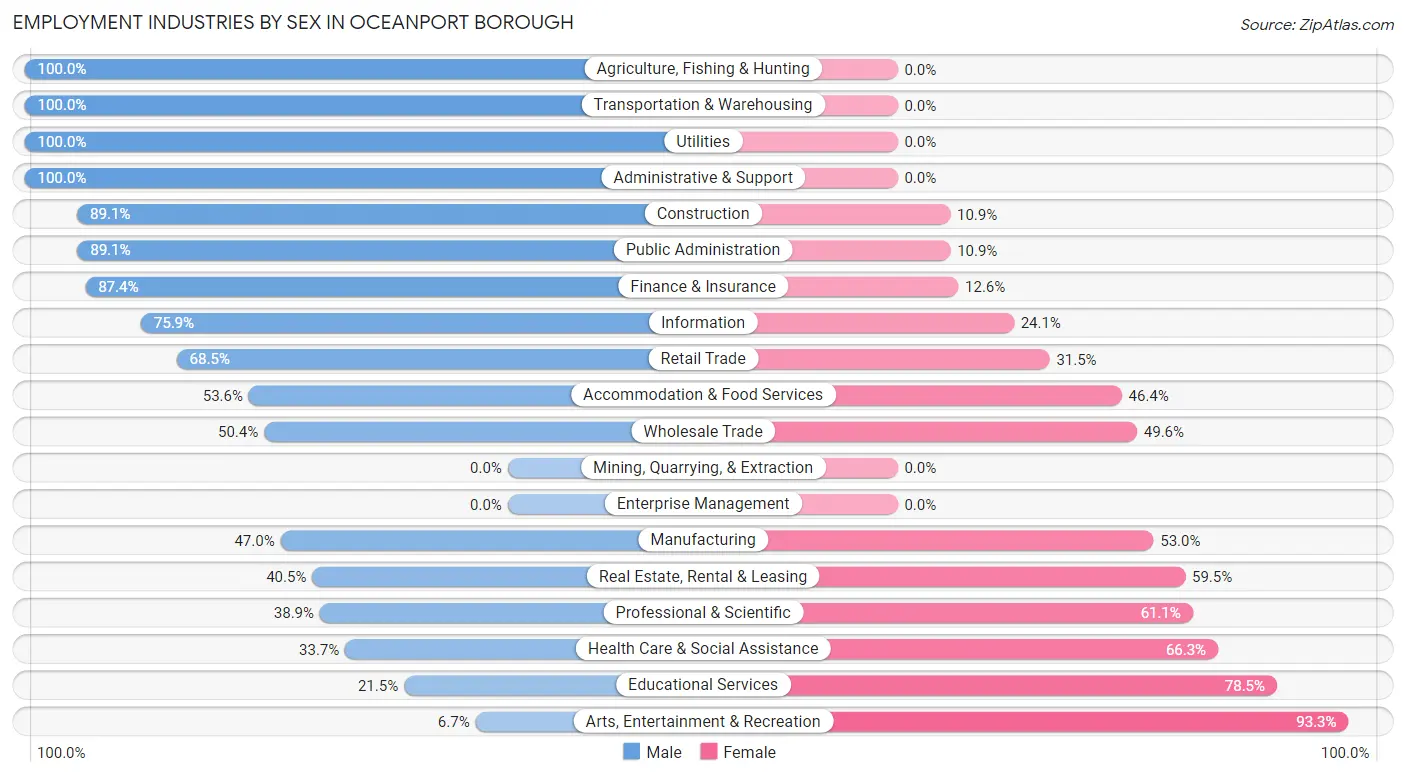
Employment Industries by Sex in Oceanport borough
The Oceanport borough industries that see more men than women are Agriculture, Fishing & Hunting (100.0%), Transportation & Warehousing (100.0%), and Utilities (100.0%), whereas the industries that tend to have a higher number of women are Arts, Entertainment & Recreation (93.3%), Educational Services (78.5%), and Health Care & Social Assistance (66.3%).
| Industry | Male | Female |
| Agriculture, Fishing & Hunting | 41 (100.0%) | 0 (0.0%) |
| Mining, Quarrying, & Extraction | 0 (0.0%) | 0 (0.0%) |
| Construction | 229 (89.1%) | 28 (10.9%) |
| Manufacturing | 127 (47.0%) | 143 (53.0%) |
| Wholesale Trade | 57 (50.4%) | 56 (49.6%) |
| Retail Trade | 98 (68.5%) | 45 (31.5%) |
| Transportation & Warehousing | 58 (100.0%) | 0 (0.0%) |
| Utilities | 57 (100.0%) | 0 (0.0%) |
| Information | 41 (75.9%) | 13 (24.1%) |
| Finance & Insurance | 188 (87.4%) | 27 (12.6%) |
| Real Estate, Rental & Leasing | 53 (40.5%) | 78 (59.5%) |
| Professional & Scientific | 119 (38.9%) | 187 (61.1%) |
| Enterprise Management | 0 (0.0%) | 0 (0.0%) |
| Administrative & Support | 98 (100.0%) | 0 (0.0%) |
| Educational Services | 82 (21.5%) | 300 (78.5%) |
| Health Care & Social Assistance | 103 (33.7%) | 203 (66.3%) |
| Arts, Entertainment & Recreation | 7 (6.7%) | 98 (93.3%) |
| Accommodation & Food Services | 112 (53.6%) | 97 (46.4%) |
| Public Administration | 155 (89.1%) | 19 (10.9%) |
| Total | 1,625 (55.7%) | 1,294 (44.3%) |
Education in Oceanport borough
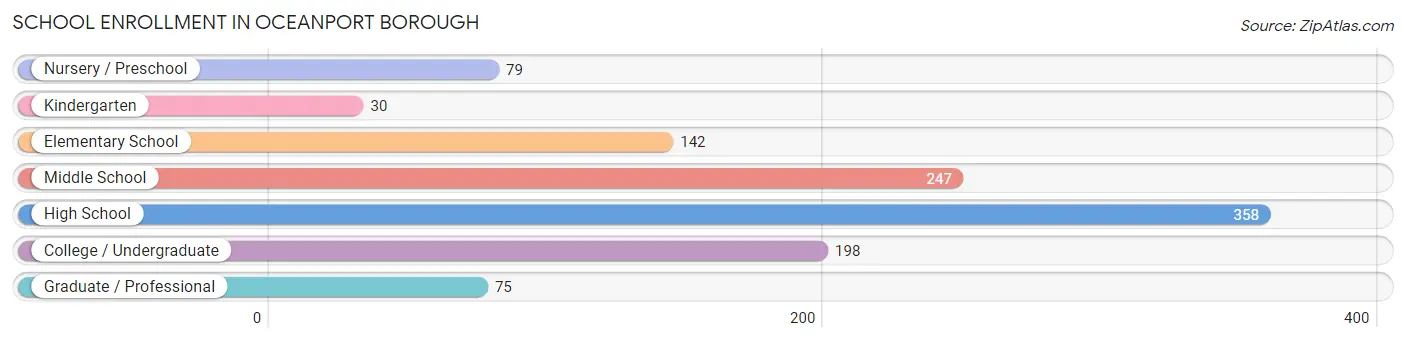
School Enrollment in Oceanport borough
The most common levels of schooling among the 1,129 students in Oceanport borough are high school (358 | 31.7%), middle school (247 | 21.9%), and college / undergraduate (198 | 17.5%).
| School Level | # Students | % Students |
| Nursery / Preschool | 79 | 7.0% |
| Kindergarten | 30 | 2.7% |
| Elementary School | 142 | 12.6% |
| Middle School | 247 | 21.9% |
| High School | 358 | 31.7% |
| College / Undergraduate | 198 | 17.5% |
| Graduate / Professional | 75 | 6.6% |
| Total | 1,129 | 100.0% |
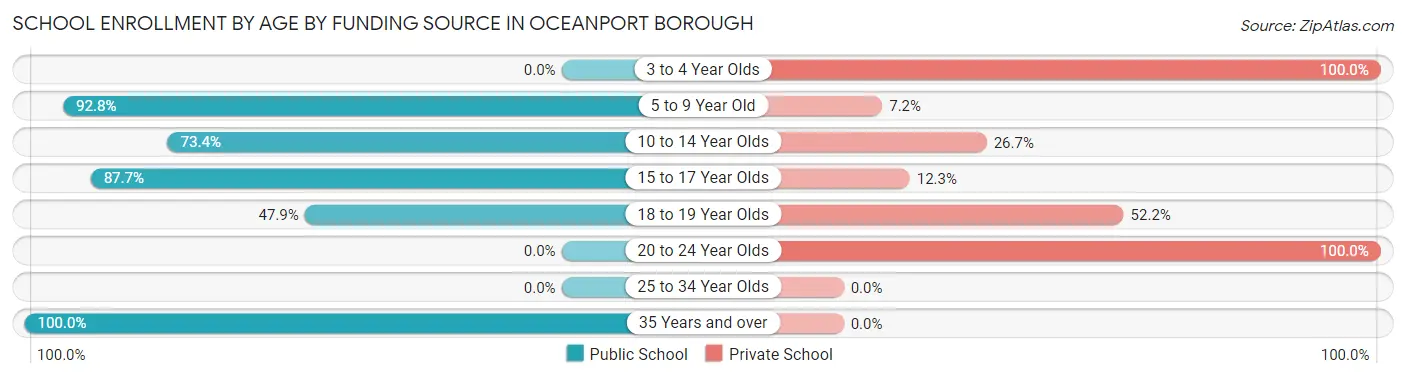
School Enrollment by Age by Funding Source in Oceanport borough
Out of a total of 1,129 students who are enrolled in schools in Oceanport borough, 444 (39.3%) attend a private institution, while the remaining 685 (60.7%) are enrolled in public schools. The age group of 3 to 4 year olds has the highest likelihood of being enrolled in private schools, with 68 (100.0% in the age bracket) enrolled. Conversely, the age group of 35 years and over has the lowest likelihood of being enrolled in a private school, with 13 (100.0% in the age bracket) attending a public institution.
| Age Bracket | Public School | Private School |
| 3 to 4 Year Olds | 0 (0.0%) | 68 (100.0%) |
| 5 to 9 Year Old | 142 (92.8%) | 11 (7.2%) |
| 10 to 14 Year Olds | 256 (73.4%) | 93 (26.7%) |
| 15 to 17 Year Olds | 185 (87.7%) | 26 (12.3%) |
| 18 to 19 Year Olds | 89 (47.8%) | 97 (52.1%) |
| 20 to 24 Year Olds | 0 (0.0%) | 149 (100.0%) |
| 25 to 34 Year Olds | 0 (0.0%) | 0 (0.0%) |
| 35 Years and over | 13 (100.0%) | 0 (0.0%) |
| Total | 685 (60.7%) | 444 (39.3%) |
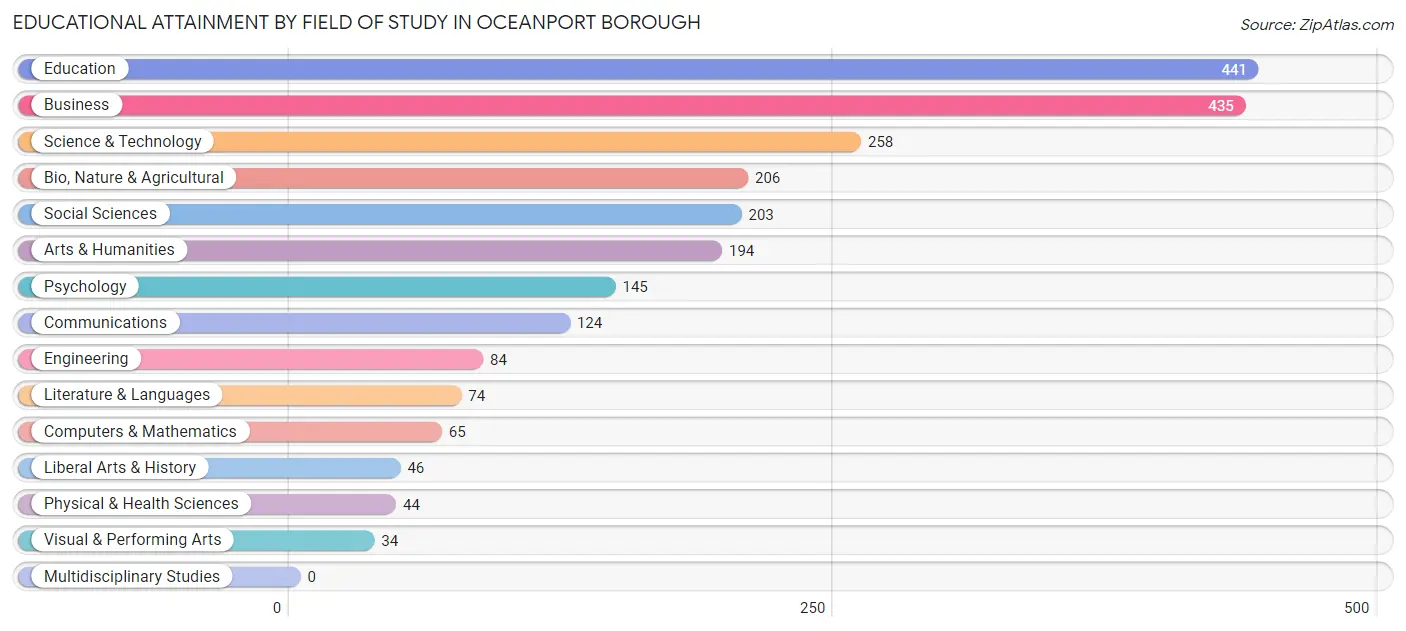
Educational Attainment by Field of Study in Oceanport borough
Education (441 | 18.7%), business (435 | 18.5%), science & technology (258 | 11.0%), bio, nature & agricultural (206 | 8.7%), and social sciences (203 | 8.6%) are the most common fields of study among 2,353 individuals in Oceanport borough who have obtained a bachelor's degree or higher.
| Field of Study | # Graduates | % Graduates |
| Computers & Mathematics | 65 | 2.8% |
| Bio, Nature & Agricultural | 206 | 8.7% |
| Physical & Health Sciences | 44 | 1.9% |
| Psychology | 145 | 6.2% |
| Social Sciences | 203 | 8.6% |
| Engineering | 84 | 3.6% |
| Multidisciplinary Studies | 0 | 0.0% |
| Science & Technology | 258 | 11.0% |
| Business | 435 | 18.5% |
| Education | 441 | 18.7% |
| Literature & Languages | 74 | 3.1% |
| Liberal Arts & History | 46 | 1.9% |
| Visual & Performing Arts | 34 | 1.4% |
| Communications | 124 | 5.3% |
| Arts & Humanities | 194 | 8.2% |
| Total | 2,353 | 100.0% |
Transportation & Commute in Oceanport borough
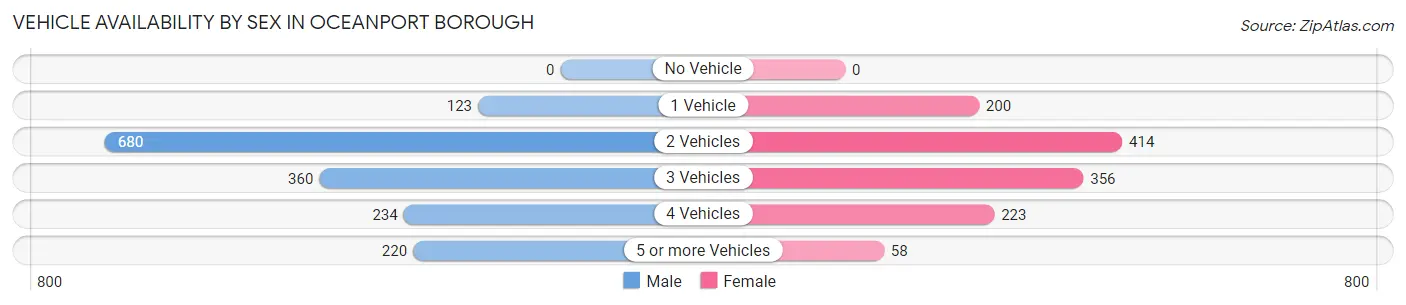
Vehicle Availability by Sex in Oceanport borough
The most prevalent vehicle ownership categories in Oceanport borough are males with 2 vehicles (680, accounting for 42.0%) and females with 2 vehicles (414, making up 54.4%).
| Vehicles Available | Male | Female |
| No Vehicle | 0 (0.0%) | 0 (0.0%) |
| 1 Vehicle | 123 (7.6%) | 200 (16.0%) |
| 2 Vehicles | 680 (42.0%) | 414 (33.1%) |
| 3 Vehicles | 360 (22.3%) | 356 (28.5%) |
| 4 Vehicles | 234 (14.5%) | 223 (17.8%) |
| 5 or more Vehicles | 220 (13.6%) | 58 (4.6%) |
| Total | 1,617 (100.0%) | 1,251 (100.0%) |
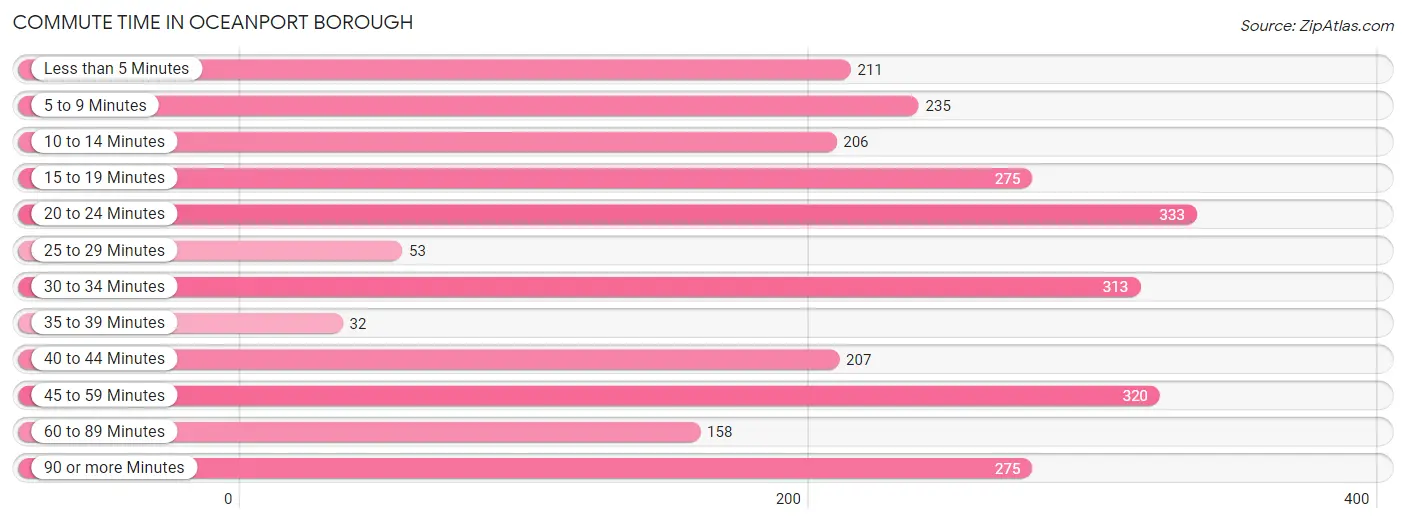
Commute Time in Oceanport borough
The most frequently occuring commute durations in Oceanport borough are 20 to 24 minutes (333 commuters, 12.7%), 45 to 59 minutes (320 commuters, 12.2%), and 30 to 34 minutes (313 commuters, 12.0%).
| Commute Time | # Commuters | % Commuters |
| Less than 5 Minutes | 211 | 8.1% |
| 5 to 9 Minutes | 235 | 9.0% |
| 10 to 14 Minutes | 206 | 7.9% |
| 15 to 19 Minutes | 275 | 10.5% |
| 20 to 24 Minutes | 333 | 12.7% |
| 25 to 29 Minutes | 53 | 2.0% |
| 30 to 34 Minutes | 313 | 12.0% |
| 35 to 39 Minutes | 32 | 1.2% |
| 40 to 44 Minutes | 207 | 7.9% |
| 45 to 59 Minutes | 320 | 12.2% |
| 60 to 89 Minutes | 158 | 6.0% |
| 90 or more Minutes | 275 | 10.5% |
Commute Time by Sex in Oceanport borough
The most common commute times in Oceanport borough are 90 or more minutes (261 commuters, 17.0%) for males and 20 to 24 minutes (206 commuters, 19.0%) for females.
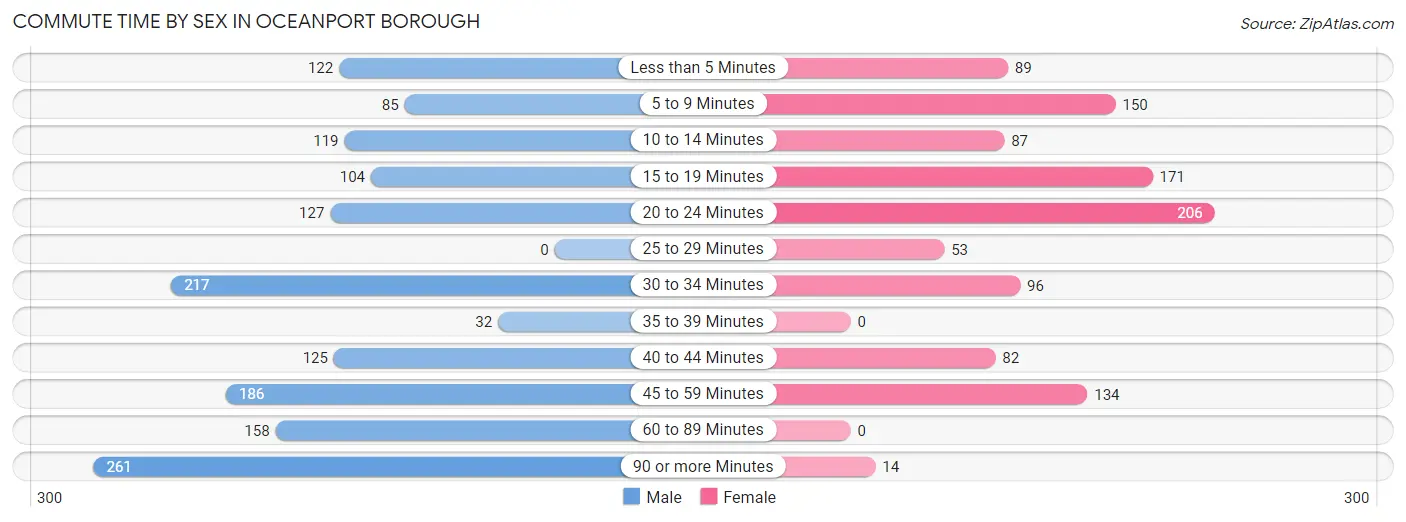
| Commute Time | Male | Female |
| Less than 5 Minutes | 122 (7.9%) | 89 (8.2%) |
| 5 to 9 Minutes | 85 (5.5%) | 150 (13.9%) |
| 10 to 14 Minutes | 119 (7.7%) | 87 (8.0%) |
| 15 to 19 Minutes | 104 (6.8%) | 171 (15.8%) |
| 20 to 24 Minutes | 127 (8.3%) | 206 (19.0%) |
| 25 to 29 Minutes | 0 (0.0%) | 53 (4.9%) |
| 30 to 34 Minutes | 217 (14.1%) | 96 (8.9%) |
| 35 to 39 Minutes | 32 (2.1%) | 0 (0.0%) |
| 40 to 44 Minutes | 125 (8.1%) | 82 (7.6%) |
| 45 to 59 Minutes | 186 (12.1%) | 134 (12.4%) |
| 60 to 89 Minutes | 158 (10.3%) | 0 (0.0%) |
| 90 or more Minutes | 261 (17.0%) | 14 (1.3%) |
Time of Departure to Work by Sex in Oceanport borough
The most frequent times of departure to work in Oceanport borough are 6:30 AM to 6:59 AM (278, 18.1%) for males and 7:00 AM to 7:29 AM (190, 17.6%) for females.
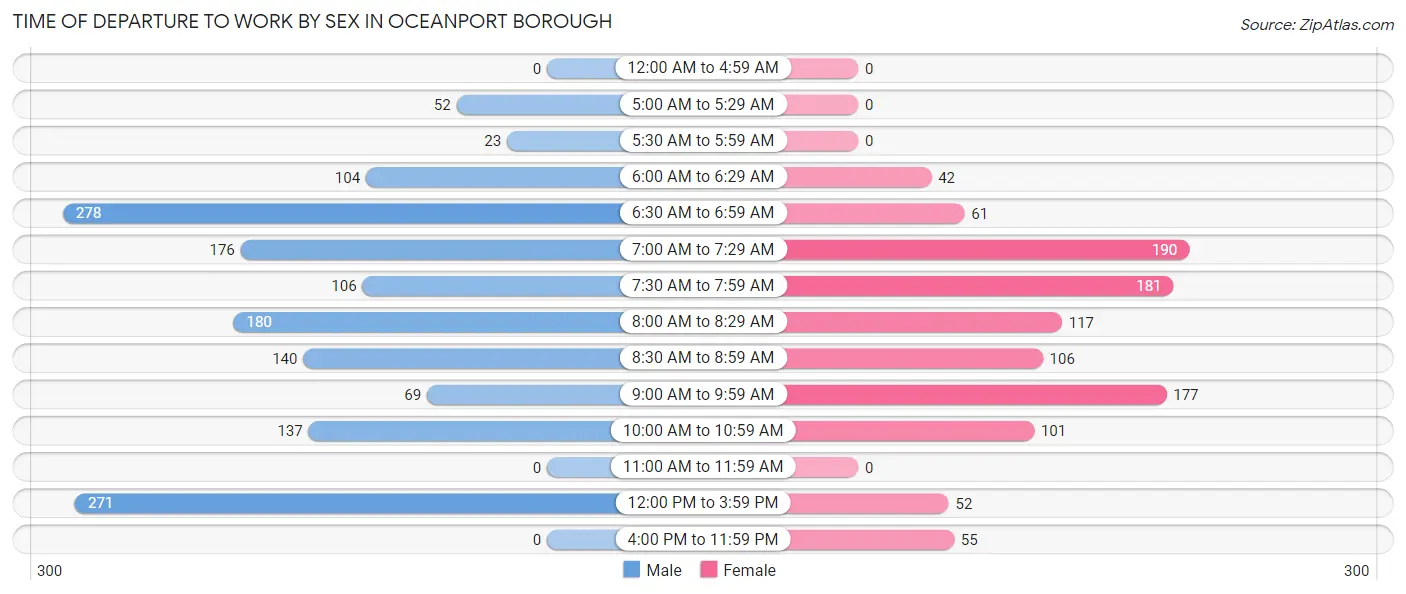
| Time of Departure | Male | Female |
| 12:00 AM to 4:59 AM | 0 (0.0%) | 0 (0.0%) |
| 5:00 AM to 5:29 AM | 52 (3.4%) | 0 (0.0%) |
| 5:30 AM to 5:59 AM | 23 (1.5%) | 0 (0.0%) |
| 6:00 AM to 6:29 AM | 104 (6.8%) | 42 (3.9%) |
| 6:30 AM to 6:59 AM | 278 (18.1%) | 61 (5.6%) |
| 7:00 AM to 7:29 AM | 176 (11.5%) | 190 (17.6%) |
| 7:30 AM to 7:59 AM | 106 (6.9%) | 181 (16.7%) |
| 8:00 AM to 8:29 AM | 180 (11.7%) | 117 (10.8%) |
| 8:30 AM to 8:59 AM | 140 (9.1%) | 106 (9.8%) |
| 9:00 AM to 9:59 AM | 69 (4.5%) | 177 (16.4%) |
| 10:00 AM to 10:59 AM | 137 (8.9%) | 101 (9.3%) |
| 11:00 AM to 11:59 AM | 0 (0.0%) | 0 (0.0%) |
| 12:00 PM to 3:59 PM | 271 (17.6%) | 52 (4.8%) |
| 4:00 PM to 11:59 PM | 0 (0.0%) | 55 (5.1%) |
| Total | 1,536 (100.0%) | 1,082 (100.0%) |
Housing Occupancy in Oceanport borough
Occupancy by Ownership in Oceanport borough
Of the total 2,459 dwellings in Oceanport borough, owner-occupied units account for 2,277 (92.6%), while renter-occupied units make up 182 (7.4%).
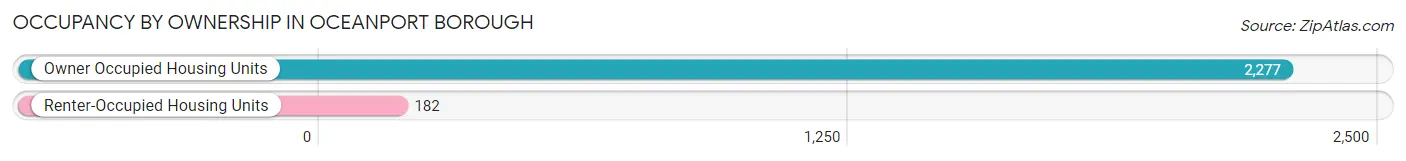
| Occupancy | # Housing Units | % Housing Units |
| Owner Occupied Housing Units | 2,277 | 92.6% |
| Renter-Occupied Housing Units | 182 | 7.4% |
| Total Occupied Housing Units | 2,459 | 100.0% |
Occupancy by Household Size in Oceanport borough
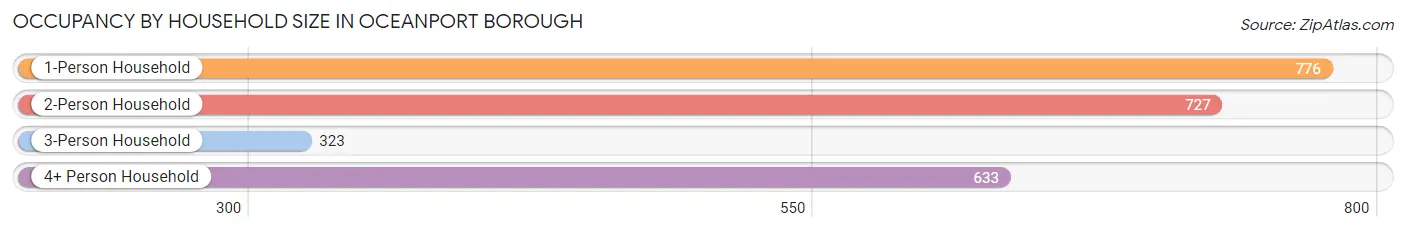
| Household Size | # Housing Units | % Housing Units |
| 1-Person Household | 776 | 31.6% |
| 2-Person Household | 727 | 29.6% |
| 3-Person Household | 323 | 13.1% |
| 4+ Person Household | 633 | 25.7% |
| Total Housing Units | 2,459 | 100.0% |
Occupancy by Ownership by Household Size in Oceanport borough
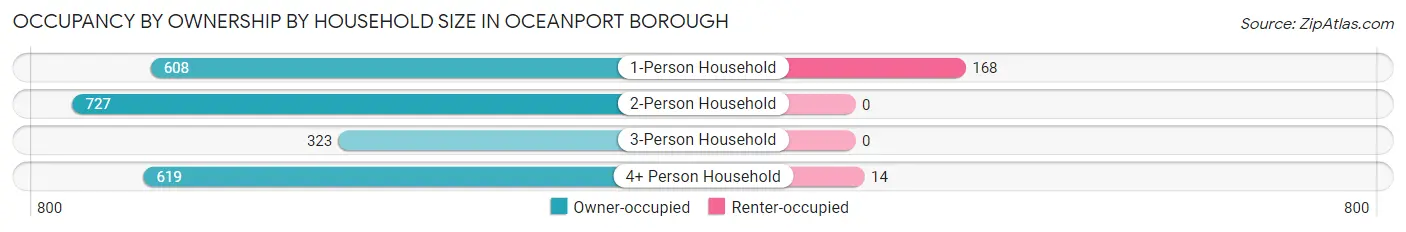
| Household Size | Owner-occupied | Renter-occupied |
| 1-Person Household | 608 (78.3%) | 168 (21.6%) |
| 2-Person Household | 727 (100.0%) | 0 (0.0%) |
| 3-Person Household | 323 (100.0%) | 0 (0.0%) |
| 4+ Person Household | 619 (97.8%) | 14 (2.2%) |
| Total Housing Units | 2,277 (92.6%) | 182 (7.4%) |
Occupancy by Educational Attainment in Oceanport borough
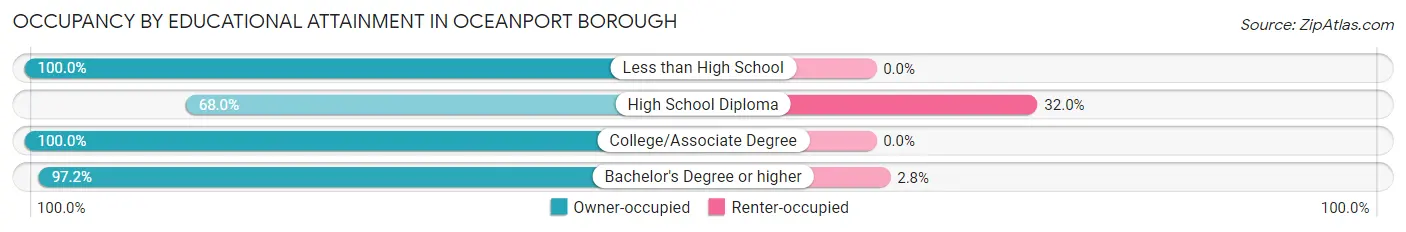
| Household Size | Owner-occupied | Renter-occupied |
| Less than High School | 19 (100.0%) | 0 (0.0%) |
| High School Diploma | 317 (68.0%) | 149 (32.0%) |
| College/Associate Degree | 796 (100.0%) | 0 (0.0%) |
| Bachelor's Degree or higher | 1,145 (97.2%) | 33 (2.8%) |
Occupancy by Age of Householder in Oceanport borough
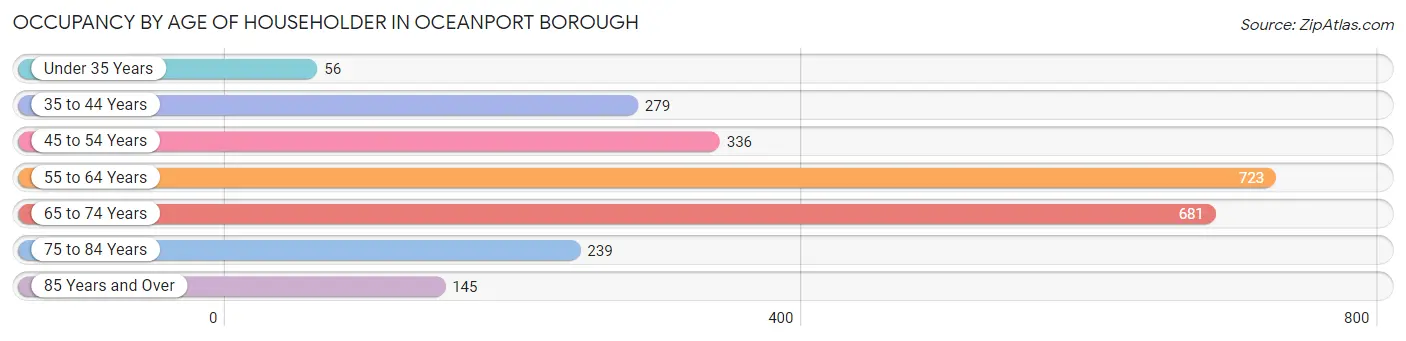
| Age Bracket | # Households | % Households |
| Under 35 Years | 56 | 2.3% |
| 35 to 44 Years | 279 | 11.4% |
| 45 to 54 Years | 336 | 13.7% |
| 55 to 64 Years | 723 | 29.4% |
| 65 to 74 Years | 681 | 27.7% |
| 75 to 84 Years | 239 | 9.7% |
| 85 Years and Over | 145 | 5.9% |
| Total | 2,459 | 100.0% |
Housing Finances in Oceanport borough
Median Income by Occupancy in Oceanport borough
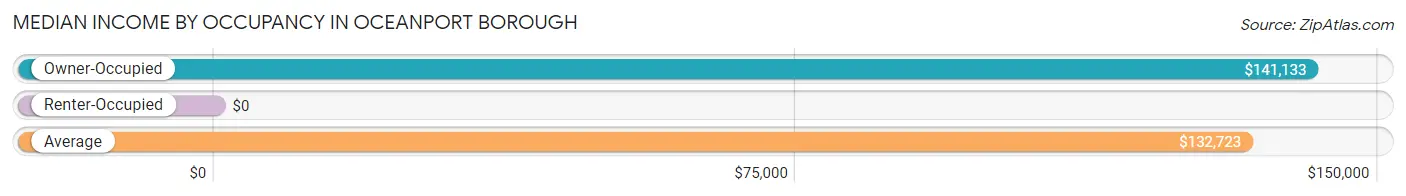
| Occupancy Type | # Households | Median Income |
| Owner-Occupied | 2,277 (92.6%) | $141,133 |
| Renter-Occupied | 182 (7.4%) | $0 |
| Average | 2,459 (100.0%) | $132,723 |
Occupancy by Householder Income Bracket in Oceanport borough
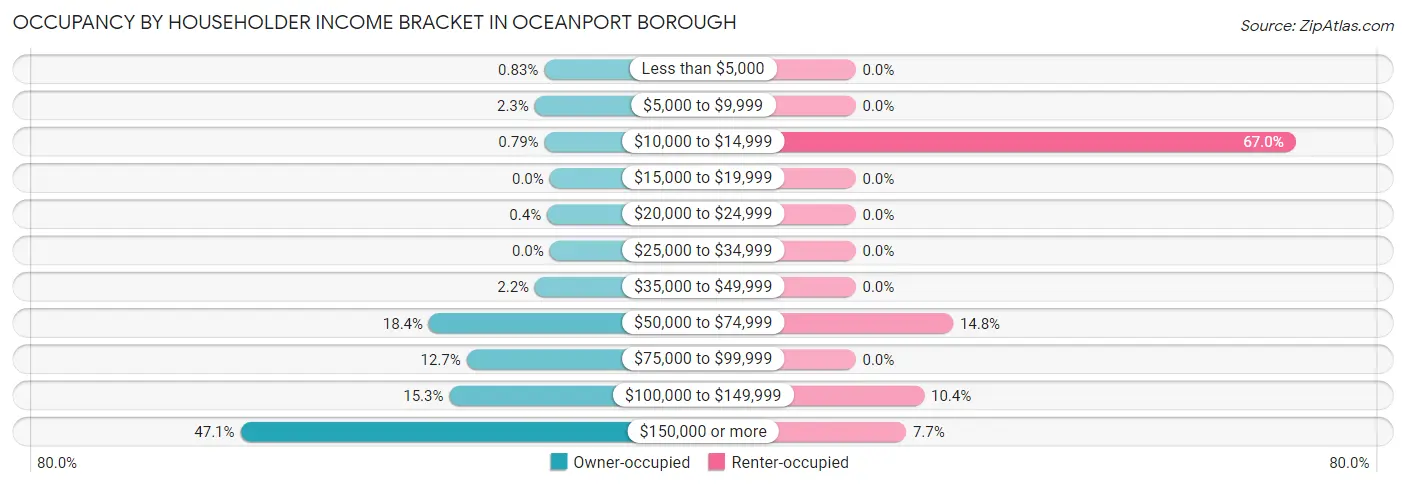
| Income Bracket | Owner-occupied | Renter-occupied |
| Less than $5,000 | 19 (0.8%) | 0 (0.0%) |
| $5,000 to $9,999 | 52 (2.3%) | 0 (0.0%) |
| $10,000 to $14,999 | 18 (0.8%) | 122 (67.0%) |
| $15,000 to $19,999 | 0 (0.0%) | 0 (0.0%) |
| $20,000 to $24,999 | 9 (0.4%) | 0 (0.0%) |
| $25,000 to $34,999 | 0 (0.0%) | 0 (0.0%) |
| $35,000 to $49,999 | 51 (2.2%) | 0 (0.0%) |
| $50,000 to $74,999 | 419 (18.4%) | 27 (14.8%) |
| $75,000 to $99,999 | 288 (12.7%) | 0 (0.0%) |
| $100,000 to $149,999 | 348 (15.3%) | 19 (10.4%) |
| $150,000 or more | 1,073 (47.1%) | 14 (7.7%) |
| Total | 2,277 (100.0%) | 182 (100.0%) |
Monthly Housing Cost Tiers in Oceanport borough
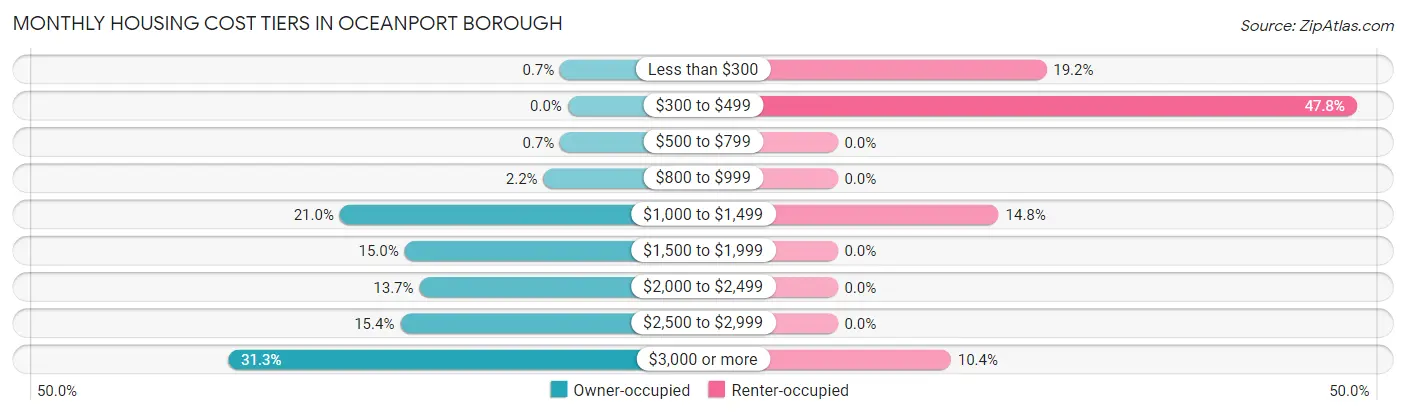
| Monthly Cost | Owner-occupied | Renter-occupied |
| Less than $300 | 16 (0.7%) | 35 (19.2%) |
| $300 to $499 | 0 (0.0%) | 87 (47.8%) |
| $500 to $799 | 16 (0.7%) | 0 (0.0%) |
| $800 to $999 | 51 (2.2%) | 0 (0.0%) |
| $1,000 to $1,499 | 478 (21.0%) | 27 (14.8%) |
| $1,500 to $1,999 | 342 (15.0%) | 0 (0.0%) |
| $2,000 to $2,499 | 311 (13.7%) | 0 (0.0%) |
| $2,500 to $2,999 | 351 (15.4%) | 0 (0.0%) |
| $3,000 or more | 712 (31.3%) | 19 (10.4%) |
| Total | 2,277 (100.0%) | 182 (100.0%) |
Physical Housing Characteristics in Oceanport borough
Housing Structures in Oceanport borough
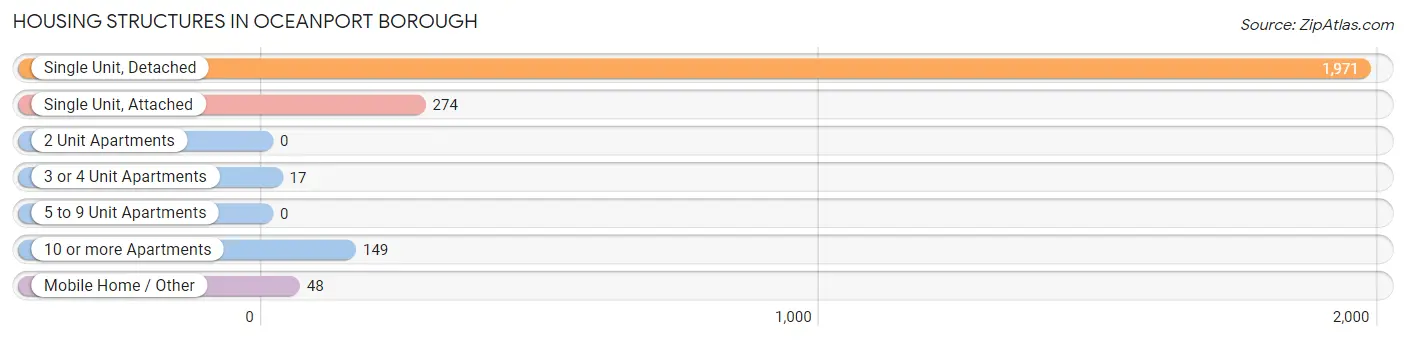
| Structure Type | # Housing Units | % Housing Units |
| Single Unit, Detached | 1,971 | 80.1% |
| Single Unit, Attached | 274 | 11.1% |
| 2 Unit Apartments | 0 | 0.0% |
| 3 or 4 Unit Apartments | 17 | 0.7% |
| 5 to 9 Unit Apartments | 0 | 0.0% |
| 10 or more Apartments | 149 | 6.1% |
| Mobile Home / Other | 48 | 1.9% |
| Total | 2,459 | 100.0% |
Housing Structures by Occupancy in Oceanport borough
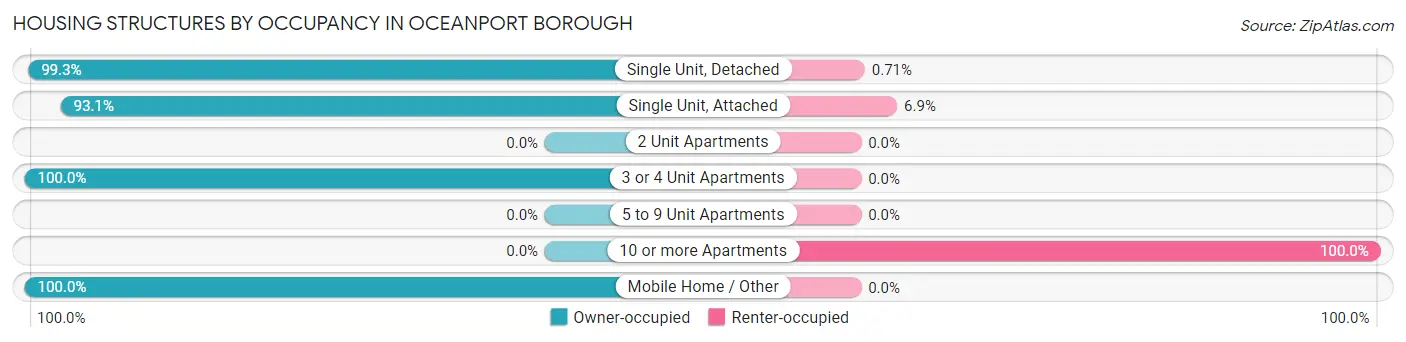
| Structure Type | Owner-occupied | Renter-occupied |
| Single Unit, Detached | 1,957 (99.3%) | 14 (0.7%) |
| Single Unit, Attached | 255 (93.1%) | 19 (6.9%) |
| 2 Unit Apartments | 0 (0.0%) | 0 (0.0%) |
| 3 or 4 Unit Apartments | 17 (100.0%) | 0 (0.0%) |
| 5 to 9 Unit Apartments | 0 (0.0%) | 0 (0.0%) |
| 10 or more Apartments | 0 (0.0%) | 149 (100.0%) |
| Mobile Home / Other | 48 (100.0%) | 0 (0.0%) |
| Total | 2,277 (92.6%) | 182 (7.4%) |
Housing Structures by Number of Rooms in Oceanport borough
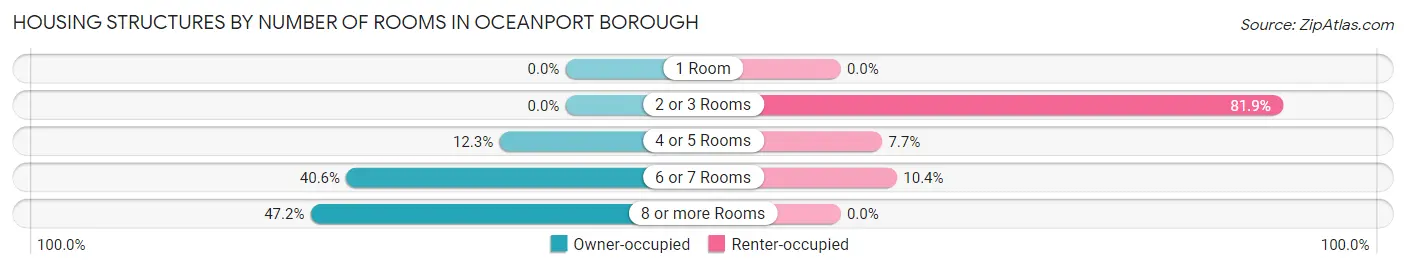
| Number of Rooms | Owner-occupied | Renter-occupied |
| 1 Room | 0 (0.0%) | 0 (0.0%) |
| 2 or 3 Rooms | 0 (0.0%) | 149 (81.9%) |
| 4 or 5 Rooms | 279 (12.2%) | 14 (7.7%) |
| 6 or 7 Rooms | 924 (40.6%) | 19 (10.4%) |
| 8 or more Rooms | 1,074 (47.2%) | 0 (0.0%) |
| Total | 2,277 (100.0%) | 182 (100.0%) |
Housing Structure by Heating Type in Oceanport borough
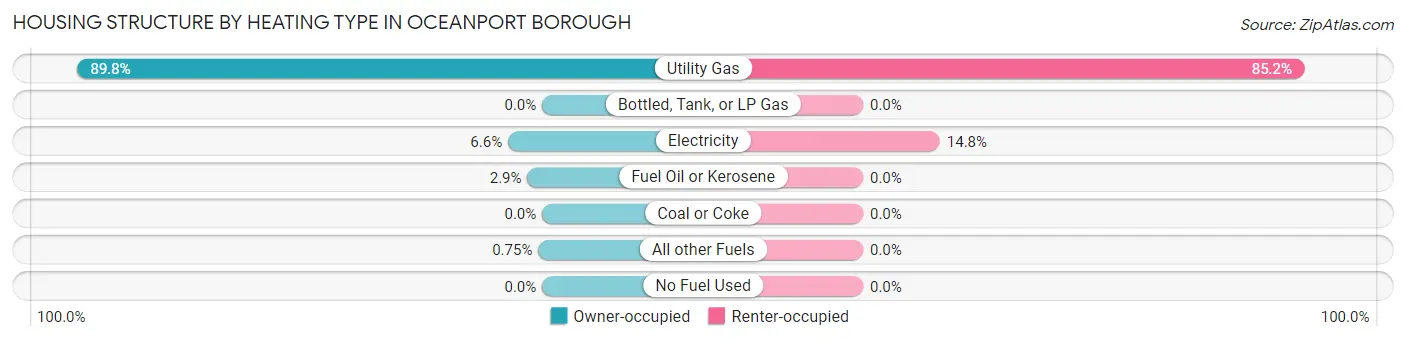
| Heating Type | Owner-occupied | Renter-occupied |
| Utility Gas | 2,045 (89.8%) | 155 (85.2%) |
| Bottled, Tank, or LP Gas | 0 (0.0%) | 0 (0.0%) |
| Electricity | 150 (6.6%) | 27 (14.8%) |
| Fuel Oil or Kerosene | 65 (2.9%) | 0 (0.0%) |
| Coal or Coke | 0 (0.0%) | 0 (0.0%) |
| All other Fuels | 17 (0.7%) | 0 (0.0%) |
| No Fuel Used | 0 (0.0%) | 0 (0.0%) |
| Total | 2,277 (100.0%) | 182 (100.0%) |
Household Vehicle Usage in Oceanport borough
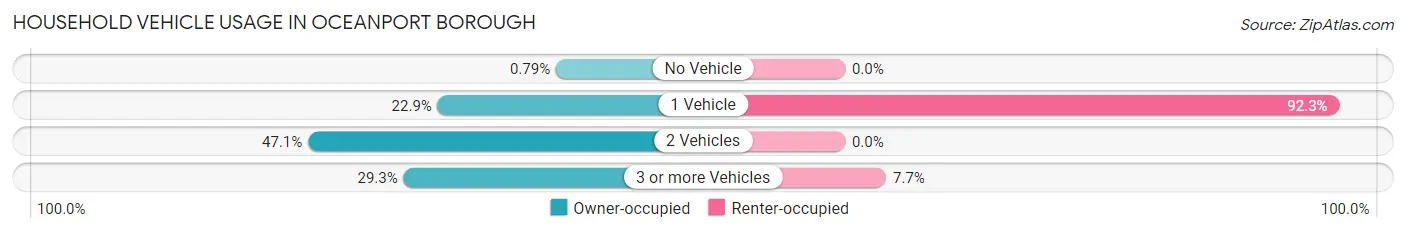
| Vehicles per Household | Owner-occupied | Renter-occupied |
| No Vehicle | 18 (0.8%) | 0 (0.0%) |
| 1 Vehicle | 521 (22.9%) | 168 (92.3%) |
| 2 Vehicles | 1,072 (47.1%) | 0 (0.0%) |
| 3 or more Vehicles | 666 (29.2%) | 14 (7.7%) |
| Total | 2,277 (100.0%) | 182 (100.0%) |
Real Estate & Mortgages in Oceanport borough
Real Estate and Mortgage Overview in Oceanport borough
| Characteristic | Without Mortgage | With Mortgage |
| Housing Units | 813 | 1,464 |
| Median Property Value | $631,600 | $650,900 |
| Median Household Income | $74,763 | $865 |
| Monthly Housing Costs | $1,415 | $689 |
| Real Estate Taxes | $9,900 | $0 |
Property Value by Mortgage Status in Oceanport borough
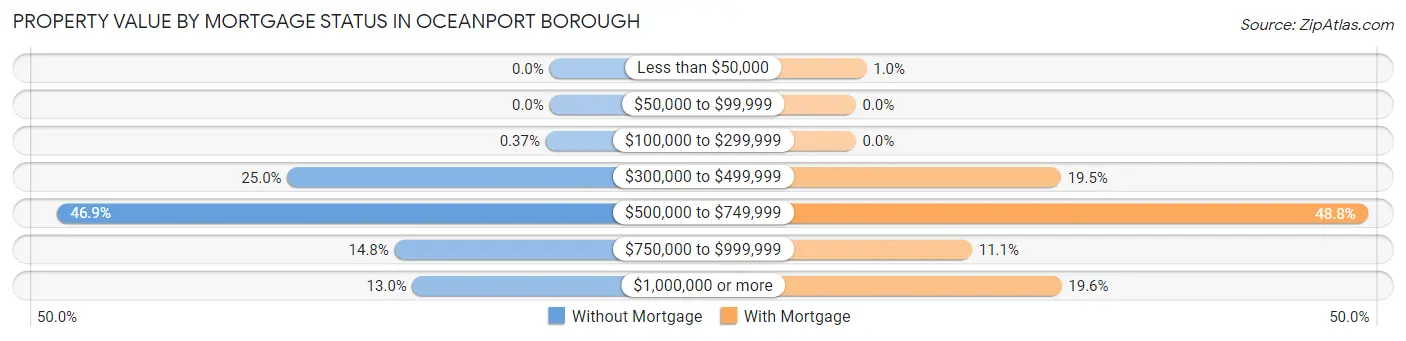
| Property Value | Without Mortgage | With Mortgage |
| Less than $50,000 | 0 (0.0%) | 15 (1.0%) |
| $50,000 to $99,999 | 0 (0.0%) | 0 (0.0%) |
| $100,000 to $299,999 | 3 (0.4%) | 0 (0.0%) |
| $300,000 to $499,999 | 203 (25.0%) | 286 (19.5%) |
| $500,000 to $749,999 | 381 (46.9%) | 714 (48.8%) |
| $750,000 to $999,999 | 120 (14.8%) | 162 (11.1%) |
| $1,000,000 or more | 106 (13.0%) | 287 (19.6%) |
| Total | 813 (100.0%) | 1,464 (100.0%) |
Household Income by Mortgage Status in Oceanport borough
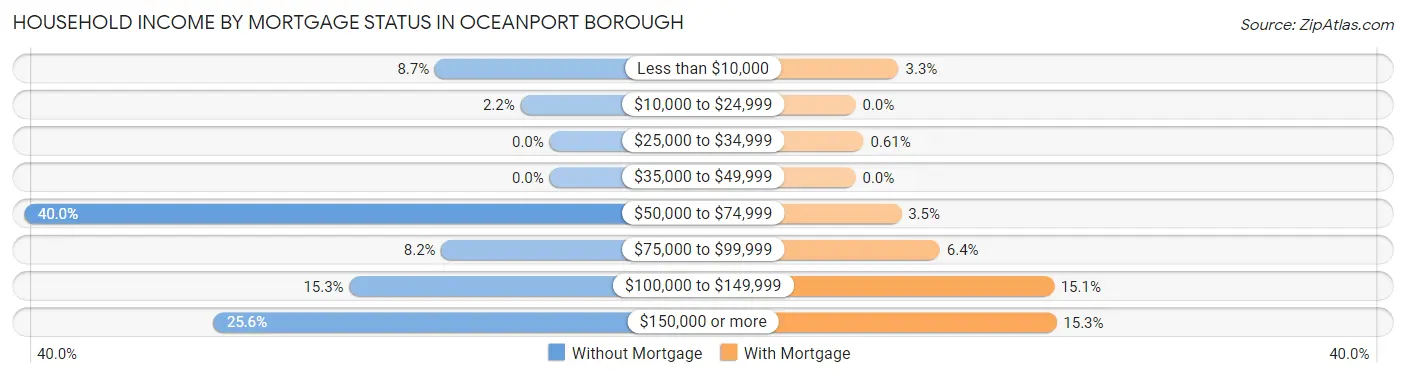
| Household Income | Without Mortgage | With Mortgage |
| Less than $10,000 | 71 (8.7%) | 48 (3.3%) |
| $10,000 to $24,999 | 18 (2.2%) | 0 (0.0%) |
| $25,000 to $34,999 | 0 (0.0%) | 9 (0.6%) |
| $35,000 to $49,999 | 0 (0.0%) | 0 (0.0%) |
| $50,000 to $74,999 | 325 (40.0%) | 51 (3.5%) |
| $75,000 to $99,999 | 67 (8.2%) | 94 (6.4%) |
| $100,000 to $149,999 | 124 (15.2%) | 221 (15.1%) |
| $150,000 or more | 208 (25.6%) | 224 (15.3%) |
| Total | 813 (100.0%) | 1,464 (100.0%) |
Property Value to Household Income Ratio in Oceanport borough
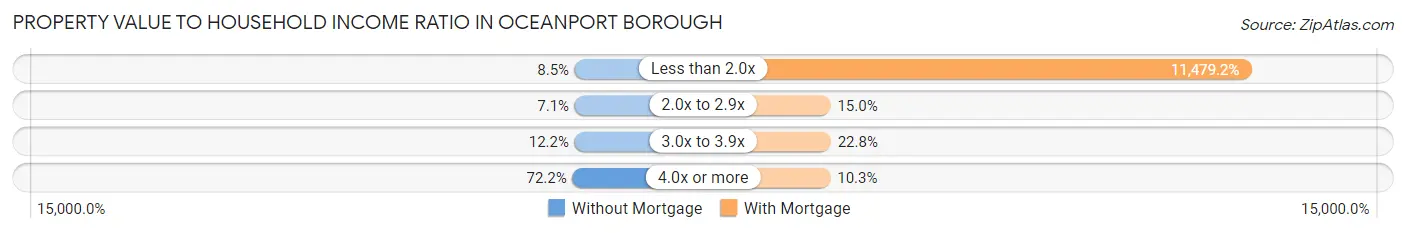
| Value-to-Income Ratio | Without Mortgage | With Mortgage |
| Less than 2.0x | 69 (8.5%) | 168,056 (11,479.2%) |
| 2.0x to 2.9x | 58 (7.1%) | 220 (15.0%) |
| 3.0x to 3.9x | 99 (12.2%) | 334 (22.8%) |
| 4.0x or more | 587 (72.2%) | 151 (10.3%) |
| Total | 813 (100.0%) | 1,464 (100.0%) |
Real Estate Taxes by Mortgage Status in Oceanport borough
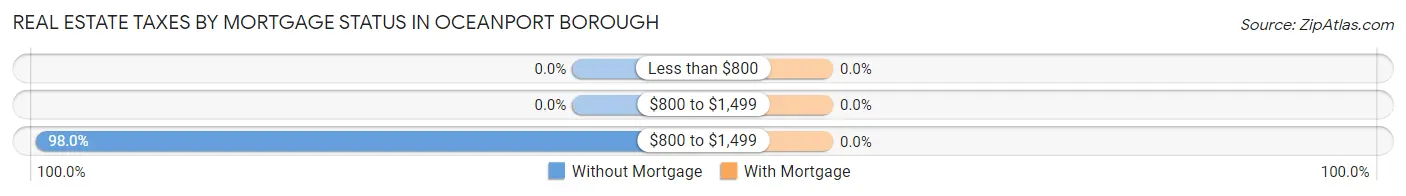
| Property Taxes | Without Mortgage | With Mortgage |
| Less than $800 | 0 (0.0%) | 0 (0.0%) |
| $800 to $1,499 | 0 (0.0%) | 0 (0.0%) |
| $800 to $1,499 | 797 (98.0%) | 0 (0.0%) |
| Total | 813 (100.0%) | 1,464 (100.0%) |
Health & Disability in Oceanport borough
Health Insurance Coverage by Age in Oceanport borough
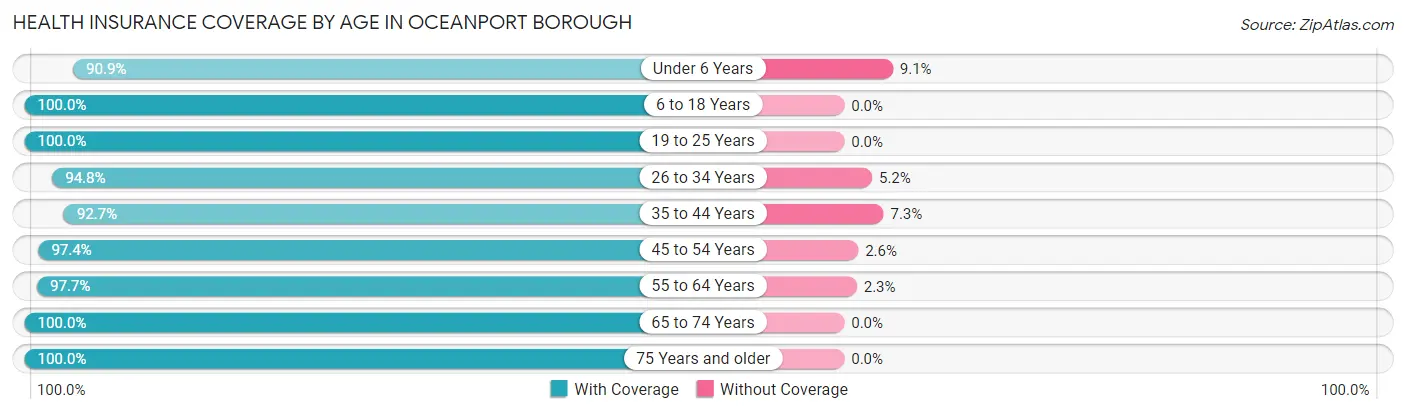
| Age Bracket | With Coverage | Without Coverage |
| Under 6 Years | 311 (90.9%) | 31 (9.1%) |
| 6 to 18 Years | 809 (100.0%) | 0 (0.0%) |
| 19 to 25 Years | 612 (100.0%) | 0 (0.0%) |
| 26 to 34 Years | 330 (94.8%) | 18 (5.2%) |
| 35 to 44 Years | 608 (92.7%) | 48 (7.3%) |
| 45 to 54 Years | 602 (97.4%) | 16 (2.6%) |
| 55 to 64 Years | 1,215 (97.7%) | 29 (2.3%) |
| 65 to 74 Years | 925 (100.0%) | 0 (0.0%) |
| 75 Years and older | 565 (100.0%) | 0 (0.0%) |
| Total | 5,977 (97.7%) | 142 (2.3%) |
Health Insurance Coverage by Citizenship Status in Oceanport borough
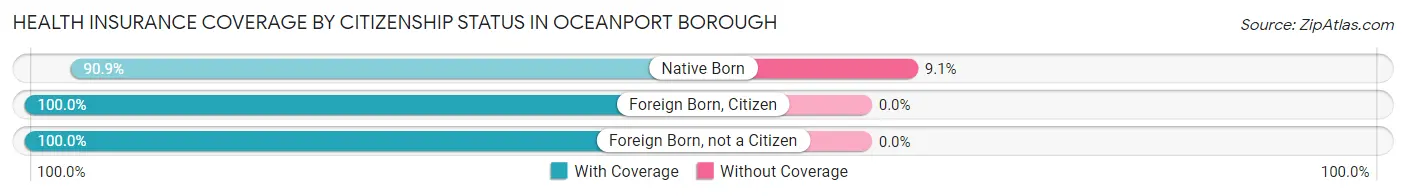
| Citizenship Status | With Coverage | Without Coverage |
| Native Born | 311 (90.9%) | 31 (9.1%) |
| Foreign Born, Citizen | 809 (100.0%) | 0 (0.0%) |
| Foreign Born, not a Citizen | 612 (100.0%) | 0 (0.0%) |
Health Insurance Coverage by Household Income in Oceanport borough
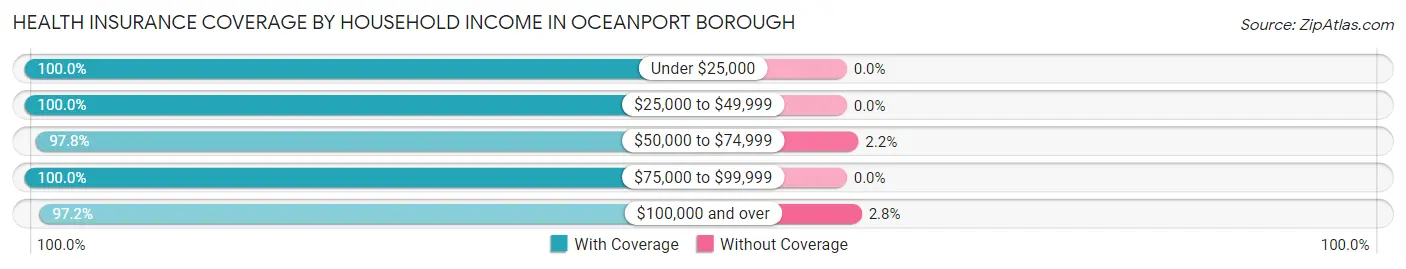
| Household Income | With Coverage | Without Coverage |
| Under $25,000 | 268 (100.0%) | 0 (0.0%) |
| $25,000 to $49,999 | 168 (100.0%) | 0 (0.0%) |
| $50,000 to $74,999 | 719 (97.8%) | 16 (2.2%) |
| $75,000 to $99,999 | 419 (100.0%) | 0 (0.0%) |
| $100,000 and over | 4,377 (97.2%) | 126 (2.8%) |
Public vs Private Health Insurance Coverage by Age in Oceanport borough
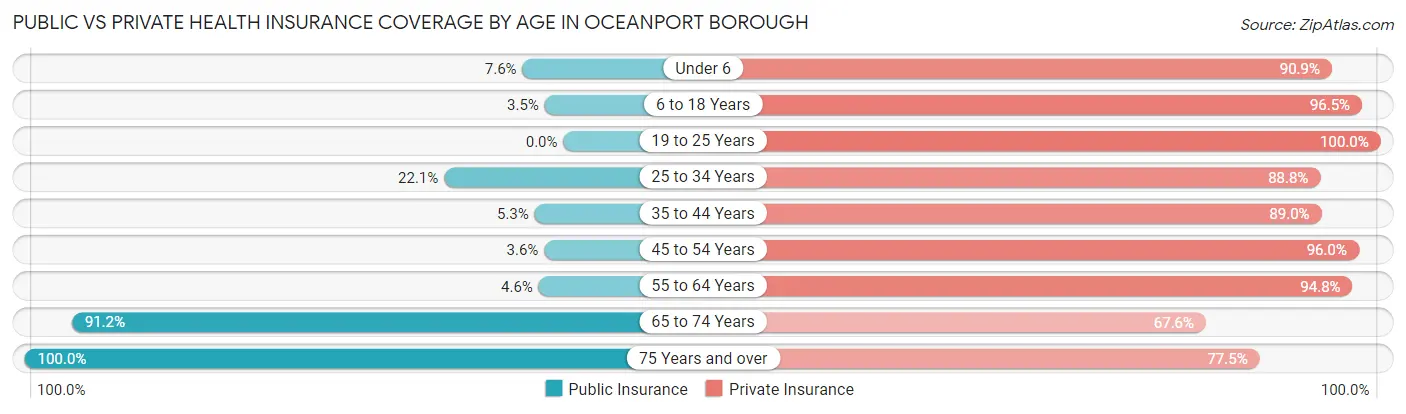
| Age Bracket | Public Insurance | Private Insurance |
| Under 6 | 26 (7.6%) | 311 (90.9%) |
| 6 to 18 Years | 28 (3.5%) | 781 (96.5%) |
| 19 to 25 Years | 0 (0.0%) | 612 (100.0%) |
| 25 to 34 Years | 77 (22.1%) | 309 (88.8%) |
| 35 to 44 Years | 35 (5.3%) | 584 (89.0%) |
| 45 to 54 Years | 22 (3.6%) | 593 (96.0%) |
| 55 to 64 Years | 57 (4.6%) | 1,179 (94.8%) |
| 65 to 74 Years | 844 (91.2%) | 625 (67.6%) |
| 75 Years and over | 565 (100.0%) | 438 (77.5%) |
| Total | 1,654 (27.0%) | 5,432 (88.8%) |
Disability Status by Sex by Age in Oceanport borough
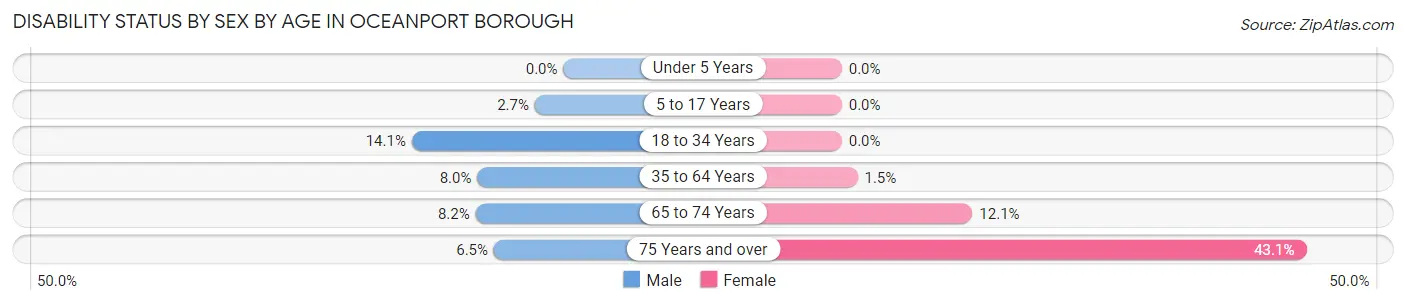
| Age Bracket | Male | Female |
| Under 5 Years | 0 (0.0%) | 0 (0.0%) |
| 5 to 17 Years | 10 (2.6%) | 0 (0.0%) |
| 18 to 34 Years | 76 (14.1%) | 0 (0.0%) |
| 35 to 64 Years | 103 (8.0%) | 18 (1.5%) |
| 65 to 74 Years | 33 (8.2%) | 63 (12.1%) |
| 75 Years and over | 14 (6.5%) | 150 (43.1%) |
Disability Class by Sex by Age in Oceanport borough
Disability Class: Hearing Difficulty
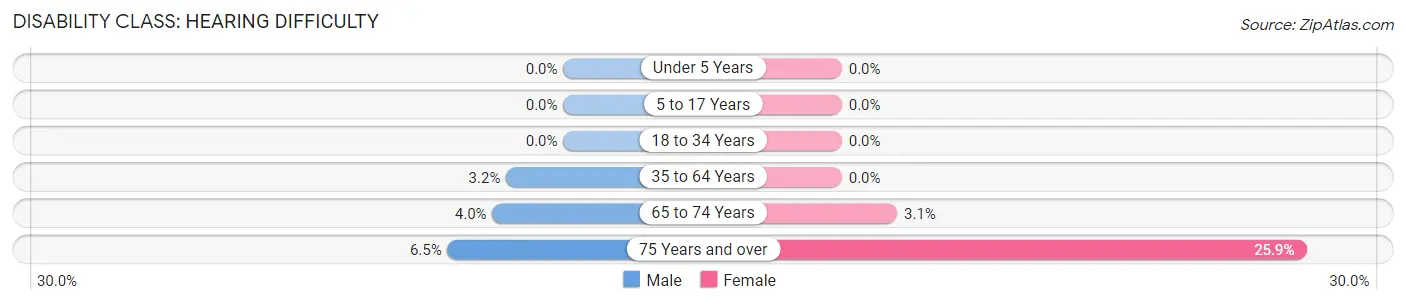
| Age Bracket | Male | Female |
| Under 5 Years | 0 (0.0%) | 0 (0.0%) |
| 5 to 17 Years | 0 (0.0%) | 0 (0.0%) |
| 18 to 34 Years | 0 (0.0%) | 0 (0.0%) |
| 35 to 64 Years | 41 (3.2%) | 0 (0.0%) |
| 65 to 74 Years | 16 (4.0%) | 16 (3.1%) |
| 75 Years and over | 14 (6.5%) | 90 (25.9%) |
Disability Class: Vision Difficulty
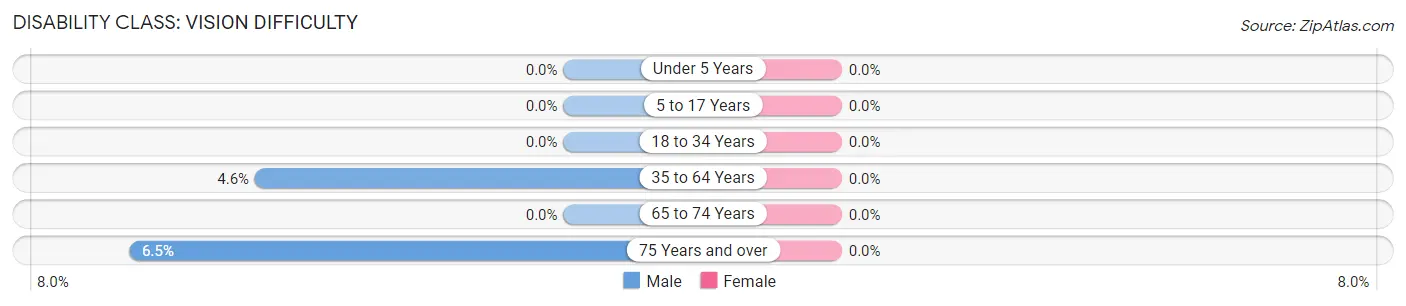
| Age Bracket | Male | Female |
| Under 5 Years | 0 (0.0%) | 0 (0.0%) |
| 5 to 17 Years | 0 (0.0%) | 0 (0.0%) |
| 18 to 34 Years | 0 (0.0%) | 0 (0.0%) |
| 35 to 64 Years | 59 (4.6%) | 0 (0.0%) |
| 65 to 74 Years | 0 (0.0%) | 0 (0.0%) |
| 75 Years and over | 14 (6.5%) | 0 (0.0%) |
Disability Class: Cognitive Difficulty
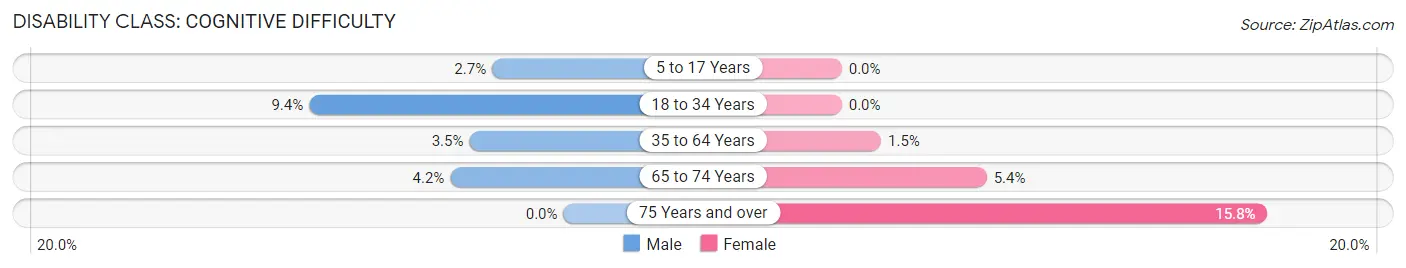
| Age Bracket | Male | Female |
| 5 to 17 Years | 10 (2.6%) | 0 (0.0%) |
| 18 to 34 Years | 51 (9.4%) | 0 (0.0%) |
| 35 to 64 Years | 45 (3.5%) | 18 (1.5%) |
| 65 to 74 Years | 17 (4.2%) | 28 (5.4%) |
| 75 Years and over | 0 (0.0%) | 55 (15.8%) |
Disability Class: Ambulatory Difficulty
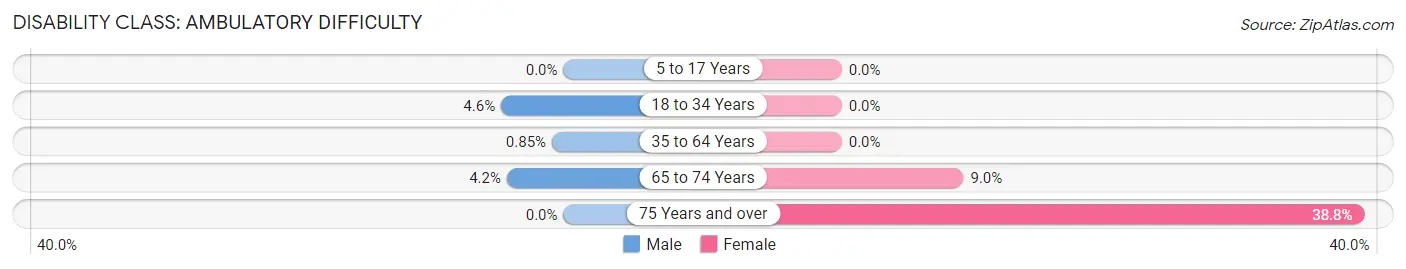
| Age Bracket | Male | Female |
| 5 to 17 Years | 0 (0.0%) | 0 (0.0%) |
| 18 to 34 Years | 25 (4.6%) | 0 (0.0%) |
| 35 to 64 Years | 11 (0.9%) | 0 (0.0%) |
| 65 to 74 Years | 17 (4.2%) | 47 (9.0%) |
| 75 Years and over | 0 (0.0%) | 135 (38.8%) |
Disability Class: Self-Care Difficulty
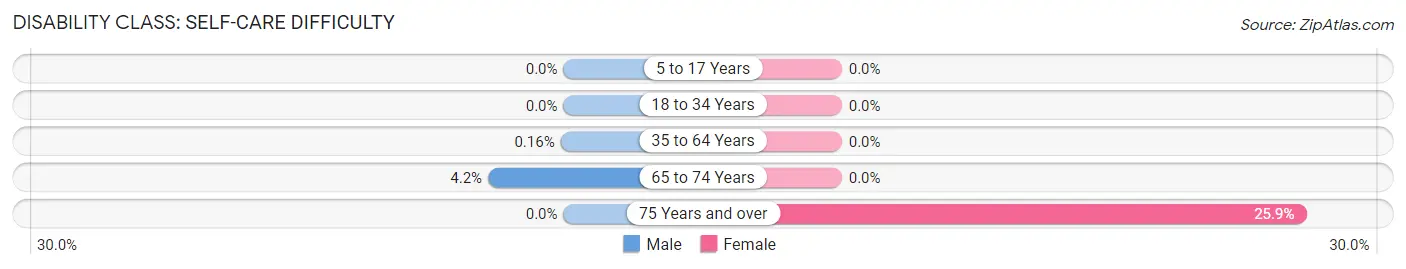
| Age Bracket | Male | Female |
| 5 to 17 Years | 0 (0.0%) | 0 (0.0%) |
| 18 to 34 Years | 0 (0.0%) | 0 (0.0%) |
| 35 to 64 Years | 2 (0.2%) | 0 (0.0%) |
| 65 to 74 Years | 17 (4.2%) | 0 (0.0%) |
| 75 Years and over | 0 (0.0%) | 90 (25.9%) |
Technology Access in Oceanport borough
Computing Device Access in Oceanport borough
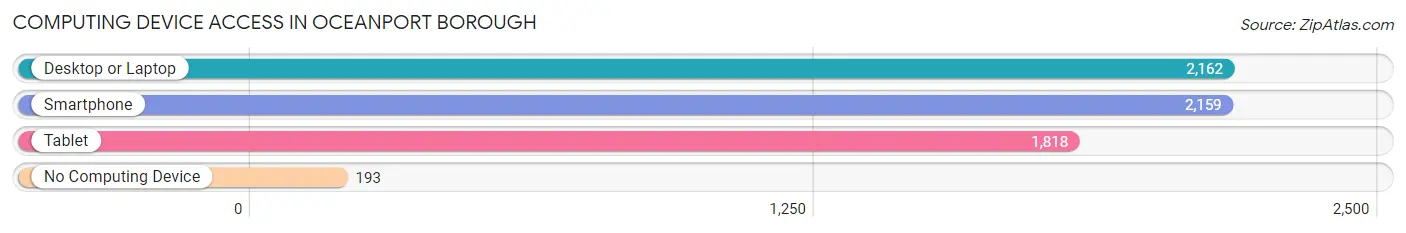
| Device Type | # Households | % Households |
| Desktop or Laptop | 2,162 | 87.9% |
| Smartphone | 2,159 | 87.8% |
| Tablet | 1,818 | 73.9% |
| No Computing Device | 193 | 7.9% |
| Total | 2,459 | 100.0% |
Internet Access in Oceanport borough
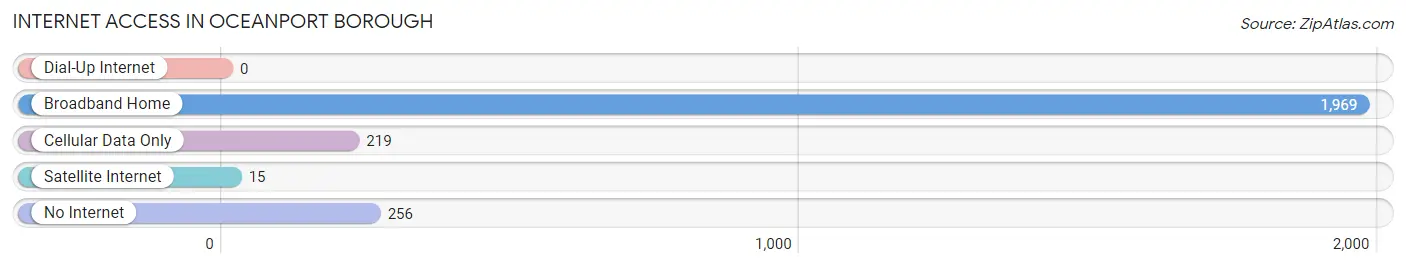
| Internet Type | # Households | % Households |
| Dial-Up Internet | 0 | 0.0% |
| Broadband Home | 1,969 | 80.1% |
| Cellular Data Only | 219 | 8.9% |
| Satellite Internet | 15 | 0.6% |
| No Internet | 256 | 10.4% |
| Total | 2,459 | 100.0% |
Oceanport borough Summary
Introduction
Oceanport Borough is a small borough located in Monmouth County, New Jersey. It is situated on the banks of the Shrewsbury River and is bordered by the towns of Little Silver, Long Branch, Monmouth Beach, and West Long Branch. The borough is home to approximately 5,500 people and is known for its small-town charm and close-knit community.
History
The area that is now Oceanport Borough was originally inhabited by the Lenape Native Americans. The first European settlers arrived in the area in the late 1600s and established a small fishing village. The village was known as “Port-au-Peck” and was located on the banks of the Shrewsbury River.
In the late 1700s, the area was purchased by the Monmouth County Board of Chosen Freeholders and was divided into several small townships. One of these townships was known as Oceanport. The town was officially incorporated in 1920 and was named after the nearby ocean.
Geography
Oceanport Borough is located in Monmouth County, New Jersey. It is situated on the banks of the Shrewsbury River and is bordered by the towns of Little Silver, Long Branch, Monmouth Beach, and West Long Branch. The borough covers an area of 1.3 square miles and is home to approximately 5,500 people.
The borough is located in the northern part of the county and is approximately 25 miles south of New York City. The borough is located in a temperate climate zone and experiences mild winters and hot summers.
Economy
The economy of Oceanport Borough is largely based on tourism and retail. The borough is home to several small businesses, including restaurants, shops, and boutiques. The borough is also home to several marinas, which attract tourists from all over the region.
The borough is also home to several large employers, including the Monmouth Park Racetrack and the Monmouth County Park System. The borough is also home to several corporate offices, including those of the pharmaceutical company Merck & Co. and the financial services company Prudential Financial.
Demographics
As of the 2010 census, the population of Oceanport Borough was 5,521. The racial makeup of the borough was 87.3% White, 5.2% African American, 0.3% Native American, 2.7% Asian, and 4.5% from other races. Hispanic or Latino of any race were 8.3% of the population.
The median household income in the borough was $87,917 and the median family income was $103,917. The per capita income for the borough was $41,945. Approximately 8.3% of the population was below the poverty line.
Conclusion
Oceanport Borough is a small borough located in Monmouth County, New Jersey. It is situated on the banks of the Shrewsbury River and is bordered by the towns of Little Silver, Long Branch, Monmouth Beach, and West Long Branch. The borough is home to approximately 5,500 people and is known for its small-town charm and close-knit community. The economy of the borough is largely based on tourism and retail, and the borough is home to several large employers. The population of the borough is predominantly white, with a small percentage of African Americans, Native Americans, Asians, and other races. The median household income in the borough is $87,917 and the per capita income is $41,945.
Common Questions
What is the Total Population of Oceanport borough?
Total Population of Oceanport borough is 6,119.
What is the Total Male Population of Oceanport borough?
Total Male Population of Oceanport borough is 2,993.
What is the Total Female Population of Oceanport borough?
Total Female Population of Oceanport borough is 3,126.
What is the Ratio of Males per 100 Females in Oceanport borough?
There are 95.75 Males per 100 Females in Oceanport borough.
What is the Ratio of Females per 100 Males in Oceanport borough?
There are 104.44 Females per 100 Males in Oceanport borough.
What is the Median Population Age in Oceanport borough?
Median Population Age in Oceanport borough is 51.8 Years.
What is the Average Family Size in Oceanport borough
Average Family Size in Oceanport borough is 3.2 People.
What is the Average Household Size in Oceanport borough
Average Household Size in Oceanport borough is 2.5 People.
What is Per Capita Income in Oceanport borough?
Per Capita income in Oceanport borough is $66,586.
What is the Median Family Income in Oceanport borough?
Median Family Income in Oceanport borough is $171,690.
What is the Median Household income in Oceanport borough?
Median Household Income in Oceanport borough is $132,723.
What is Inequality or Gini Index in Oceanport borough?
Inequality or Gini Index in Oceanport borough is 0.42.
How Large is the Labor Force in Oceanport borough?
There are 3,155 People in the Labor Forcein in Oceanport borough.
What is the Percentage of People in the Labor Force in Oceanport borough?
60.1% of People are in the Labor Force in Oceanport borough.
What is the Unemployment Rate in Oceanport borough?
Unemployment Rate in Oceanport borough is 7.5%.