Helmetta borough, NJ
Helmetta borough Overview
2,302
TOTAL POPULATION
1,154
MALE POPULATION
1,148
FEMALE POPULATION
100.52
MALES / 100 FEMALES
99.48
FEMALES / 100 MALES
39.0
MEDIAN AGE
3.0
AVG FAMILY SIZE
2.4
AVG HOUSEHOLD SIZE
$50,000
PER CAPITA INCOME
$113,041
AVG FAMILY INCOME
$104,500
AVG HOUSEHOLD INCOME
8.3%
WAGE / INCOME GAP [ % ]
91.7¢/ $1
WAGE / INCOME GAP [ $ ]
0.37
INEQUALITY / GINI INDEX
1,410
LABOR FORCE [ PEOPLE ]
73.6%
PERCENT IN LABOR FORCE
6.4%
UNEMPLOYMENT RATE
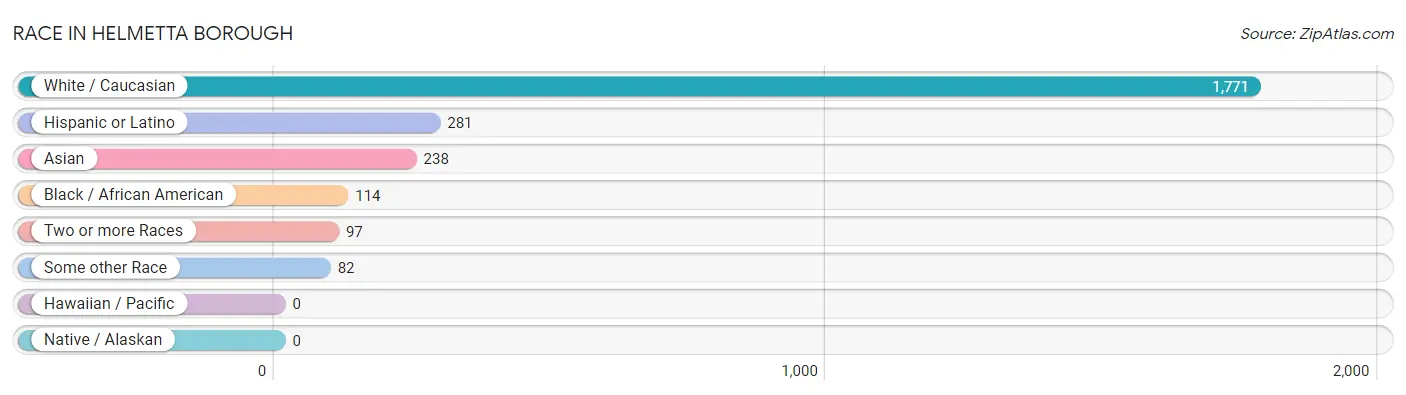
Race in Helmetta borough
The most populous races in Helmetta borough are White / Caucasian (1,771 | 76.9%), Hispanic or Latino (281 | 12.2%), and Asian (238 | 10.3%).
| Race | # Population | % Population |
| Asian | 238 | 10.3% |
| Black / African American | 114 | 5.0% |
| Hawaiian / Pacific | 0 | 0.0% |
| Hispanic or Latino | 281 | 12.2% |
| Native / Alaskan | 0 | 0.0% |
| White / Caucasian | 1,771 | 76.9% |
| Two or more Races | 97 | 4.2% |
| Some other Race | 82 | 3.6% |
| Total | 2,302 | 100.0% |
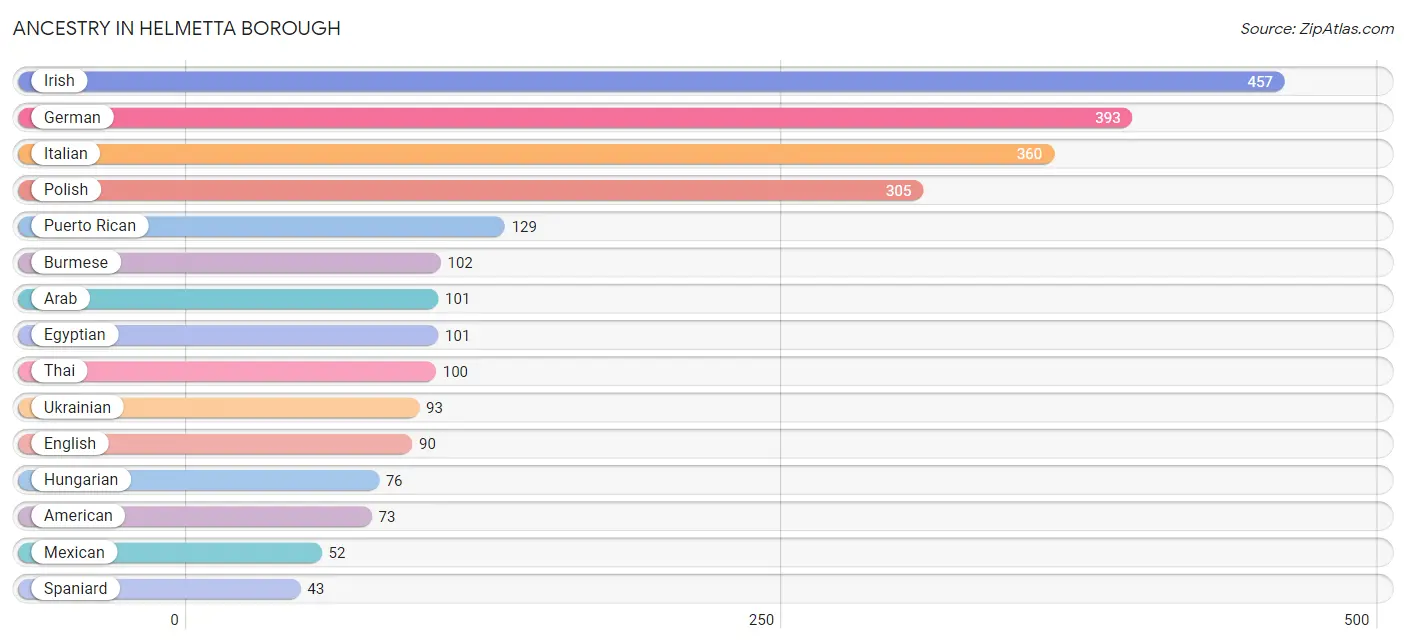
Ancestry in Helmetta borough
The most populous ancestries reported in Helmetta borough are Irish (457 | 19.9%), German (393 | 17.1%), Italian (360 | 15.6%), Polish (305 | 13.3%), and Puerto Rican (129 | 5.6%), together accounting for 71.4% of all Helmetta borough residents.
| Ancestry | # Population | % Population |
| American | 73 | 3.2% |
| Arab | 101 | 4.4% |
| Austrian | 5 | 0.2% |
| Brazilian | 12 | 0.5% |
| British | 5 | 0.2% |
| Burmese | 102 | 4.4% |
| Canadian | 7 | 0.3% |
| Central American | 25 | 1.1% |
| Cherokee | 9 | 0.4% |
| Cuban | 21 | 0.9% |
| Czechoslovakian | 6 | 0.3% |
| Dominican | 5 | 0.2% |
| Dutch | 4 | 0.2% |
| Eastern European | 26 | 1.1% |
| Egyptian | 101 | 4.4% |
| English | 90 | 3.9% |
| European | 11 | 0.5% |
| French | 27 | 1.2% |
| German | 393 | 17.1% |
| Greek | 29 | 1.3% |
| Honduran | 25 | 1.1% |
| Hungarian | 76 | 3.3% |
| Indian (Asian) | 11 | 0.5% |
| Irish | 457 | 19.9% |
| Italian | 360 | 15.6% |
| Korean | 25 | 1.1% |
| Lithuanian | 4 | 0.2% |
| Mexican | 52 | 2.3% |
| Northern European | 16 | 0.7% |
| Norwegian | 12 | 0.5% |
| Polish | 305 | 13.3% |
| Portuguese | 18 | 0.8% |
| Puerto Rican | 129 | 5.6% |
| Romanian | 29 | 1.3% |
| Russian | 12 | 0.5% |
| Scandinavian | 13 | 0.6% |
| Scotch-Irish | 13 | 0.6% |
| Scottish | 25 | 1.1% |
| Slavic | 6 | 0.3% |
| Slovak | 5 | 0.2% |
| Spaniard | 43 | 1.9% |
| Sri Lankan | 19 | 0.8% |
| Swedish | 27 | 1.2% |
| Thai | 100 | 4.3% |
| Ukrainian | 93 | 4.0% |
| Welsh | 10 | 0.4% | View All 46 Rows |
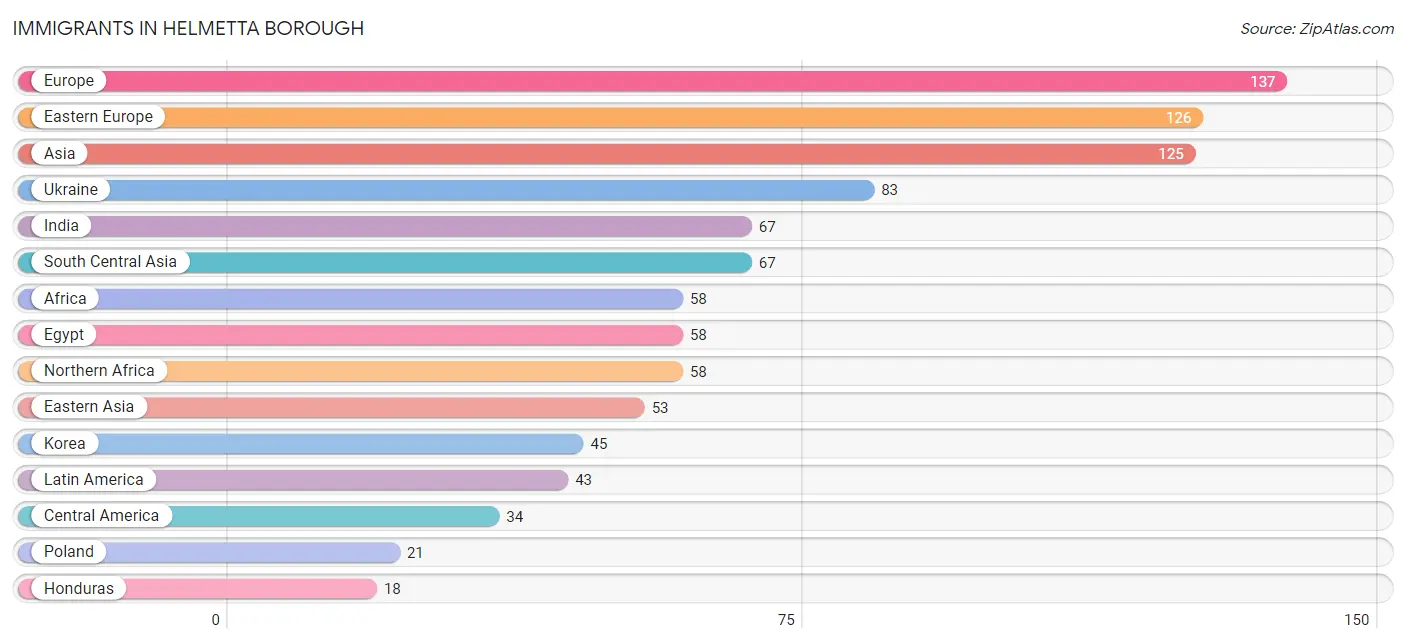
Immigrants in Helmetta borough
The most numerous immigrant groups reported in Helmetta borough came from Europe (137 | 5.9%), Eastern Europe (126 | 5.5%), Asia (125 | 5.4%), Ukraine (83 | 3.6%), and India (67 | 2.9%), together accounting for 23.4% of all Helmetta borough residents.
| Immigration Origin | # Population | % Population |
| Africa | 58 | 2.5% |
| Asia | 125 | 5.4% |
| Caribbean | 9 | 0.4% |
| Central America | 34 | 1.5% |
| China | 8 | 0.4% |
| Dominican Republic | 6 | 0.3% |
| Eastern Asia | 53 | 2.3% |
| Eastern Europe | 126 | 5.5% |
| Egypt | 58 | 2.5% |
| Europe | 137 | 5.9% |
| Greece | 4 | 0.2% |
| Honduras | 18 | 0.8% |
| India | 67 | 2.9% |
| Korea | 45 | 1.9% |
| Latin America | 43 | 1.9% |
| Lithuania | 4 | 0.2% |
| Mexico | 16 | 0.7% |
| Moldova | 8 | 0.4% |
| Northern Africa | 58 | 2.5% |
| Philippines | 5 | 0.2% |
| Poland | 21 | 0.9% |
| Portugal | 7 | 0.3% |
| Romania | 10 | 0.4% |
| South Central Asia | 67 | 2.9% |
| South Eastern Asia | 5 | 0.2% |
| Southern Europe | 11 | 0.5% |
| Ukraine | 83 | 3.6% |
| West Indies | 3 | 0.1% | View All 28 Rows |
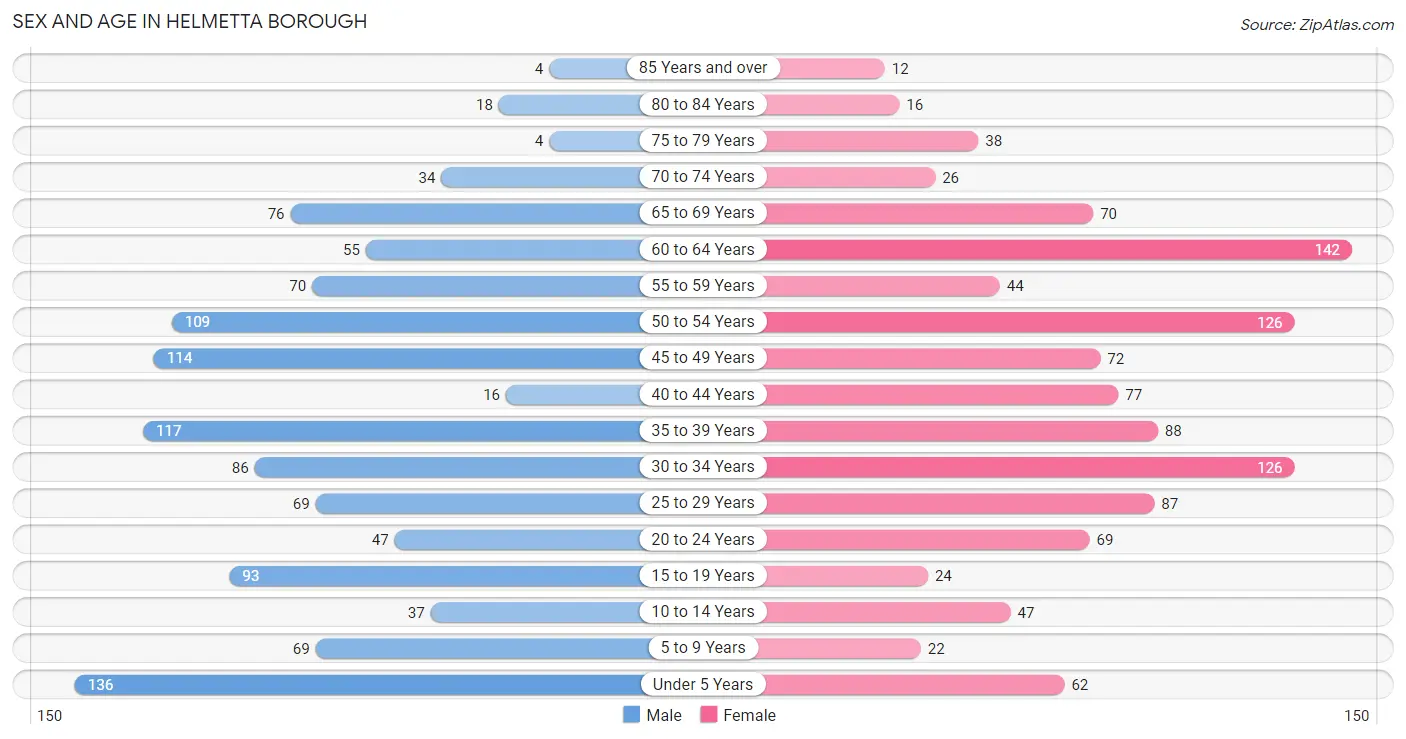
Sex and Age in Helmetta borough
Sex and Age in Helmetta borough
The most populous age groups in Helmetta borough are Under 5 Years (136 | 11.8%) for men and 60 to 64 Years (142 | 12.4%) for women.
| Age Bracket | Male | Female |
| Under 5 Years | 136 (11.8%) | 62 (5.4%) |
| 5 to 9 Years | 69 (6.0%) | 22 (1.9%) |
| 10 to 14 Years | 37 (3.2%) | 47 (4.1%) |
| 15 to 19 Years | 93 (8.1%) | 24 (2.1%) |
| 20 to 24 Years | 47 (4.1%) | 69 (6.0%) |
| 25 to 29 Years | 69 (6.0%) | 87 (7.6%) |
| 30 to 34 Years | 86 (7.4%) | 126 (11.0%) |
| 35 to 39 Years | 117 (10.1%) | 88 (7.7%) |
| 40 to 44 Years | 16 (1.4%) | 77 (6.7%) |
| 45 to 49 Years | 114 (9.9%) | 72 (6.3%) |
| 50 to 54 Years | 109 (9.5%) | 126 (11.0%) |
| 55 to 59 Years | 70 (6.1%) | 44 (3.8%) |
| 60 to 64 Years | 55 (4.8%) | 142 (12.4%) |
| 65 to 69 Years | 76 (6.6%) | 70 (6.1%) |
| 70 to 74 Years | 34 (2.9%) | 26 (2.3%) |
| 75 to 79 Years | 4 (0.4%) | 38 (3.3%) |
| 80 to 84 Years | 18 (1.6%) | 16 (1.4%) |
| 85 Years and over | 4 (0.4%) | 12 (1.1%) |
| Total | 1,154 (100.0%) | 1,148 (100.0%) |
Families and Households in Helmetta borough
Median Family Size in Helmetta borough
The median family size in Helmetta borough is 2.97 persons per family, with married-couple families (445 | 72.0%) accounting for the largest median family size of 3.14 persons per family. On the other hand, single male/father families (41 | 6.6%) represent the smallest median family size with 2.10 persons per family.

| Family Type | # Families | Family Size |
| Married-Couple | 445 (72.0%) | 3.14 |
| Single Male/Father | 41 (6.6%) | 2.10 |
| Single Female/Mother | 132 (21.4%) | 2.66 |
| Total Families | 618 (100.0%) | 2.97 |
Median Household Size in Helmetta borough
The median household size in Helmetta borough is 2.38 persons per household, with married-couple households (445 | 46.0%) accounting for the largest median household size of 3.16 persons per household. non-family households (350 | 36.2%) represent the smallest median household size with 1.21 persons per household.
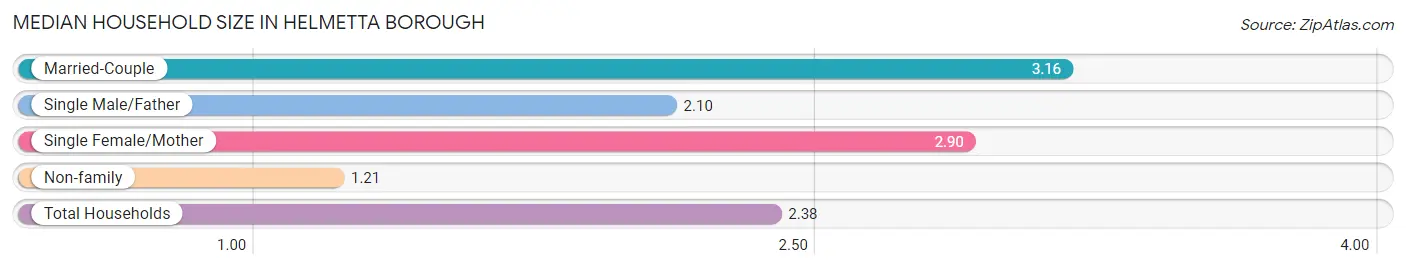
| Household Type | # Households | Household Size |
| Married-Couple | 445 (46.0%) | 3.16 |
| Single Male/Father | 41 (4.2%) | 2.10 |
| Single Female/Mother | 132 (13.6%) | 2.90 |
| Non-family | 350 (36.2%) | 1.21 |
| Total Households | 968 (100.0%) | 2.38 |
Household Size by Marriage Status in Helmetta borough
Out of a total of 968 households in Helmetta borough, 618 (63.8%) are family households, while 350 (36.2%) are nonfamily households. The most numerous type of family households are 2-person households, comprising 255, and the most common type of nonfamily households are 1-person households, comprising 279.
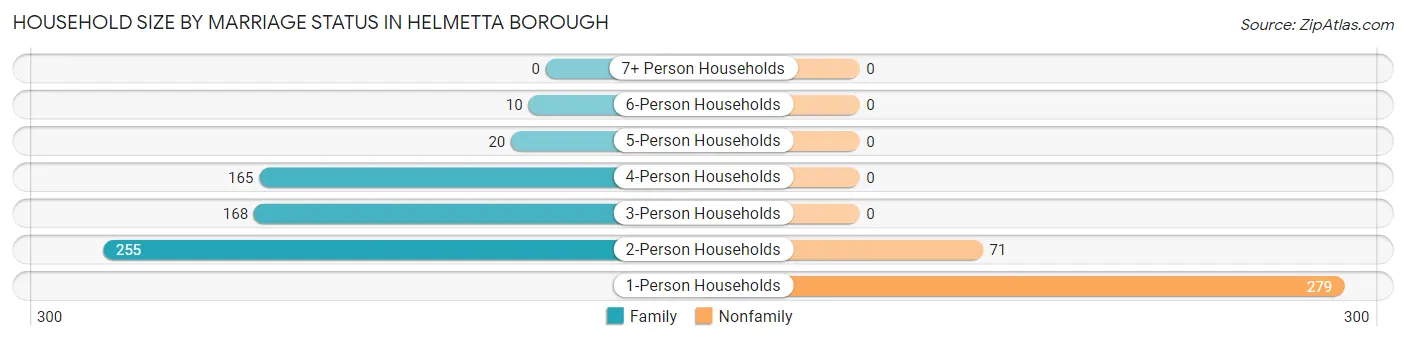
| Household Size | Family Households | Nonfamily Households |
| 1-Person Households | - | 279 (28.8%) |
| 2-Person Households | 255 (26.3%) | 71 (7.3%) |
| 3-Person Households | 168 (17.4%) | 0 (0.0%) |
| 4-Person Households | 165 (17.1%) | 0 (0.0%) |
| 5-Person Households | 20 (2.1%) | 0 (0.0%) |
| 6-Person Households | 10 (1.0%) | 0 (0.0%) |
| 7+ Person Households | 0 (0.0%) | 0 (0.0%) |
| Total | 618 (63.8%) | 350 (36.2%) |
Female Fertility in Helmetta borough
Fertility by Age in Helmetta borough
Average fertility rate in Helmetta borough is 79.0 births per 1,000 women. Women in the age bracket of 20 to 34 years have the highest fertility rate with 96.0 births per 1,000 women. Women in the age bracket of 20 to 34 years acount for 58.7% of all women with births.
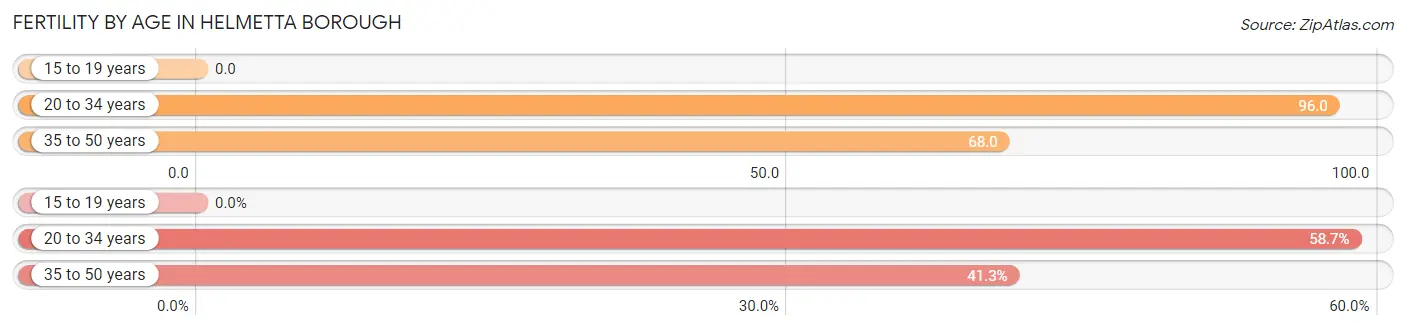
| Age Bracket | Women with Births | Births / 1,000 Women |
| 15 to 19 years | 0 (0.0%) | 0.0 |
| 20 to 34 years | 27 (58.7%) | 96.0 |
| 35 to 50 years | 19 (41.3%) | 68.0 |
| Total | 46 (100.0%) | 79.0 |
Fertility by Age by Marriage Status in Helmetta borough
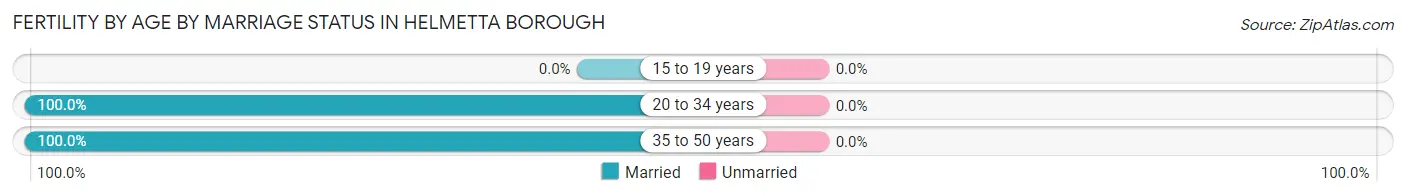
| Age Bracket | Married | Unmarried |
| 15 to 19 years | 0 (0.0%) | 0 (0.0%) |
| 20 to 34 years | 27 (100.0%) | 0 (0.0%) |
| 35 to 50 years | 19 (100.0%) | 0 (0.0%) |
| Total | 46 (100.0%) | 0 (0.0%) |
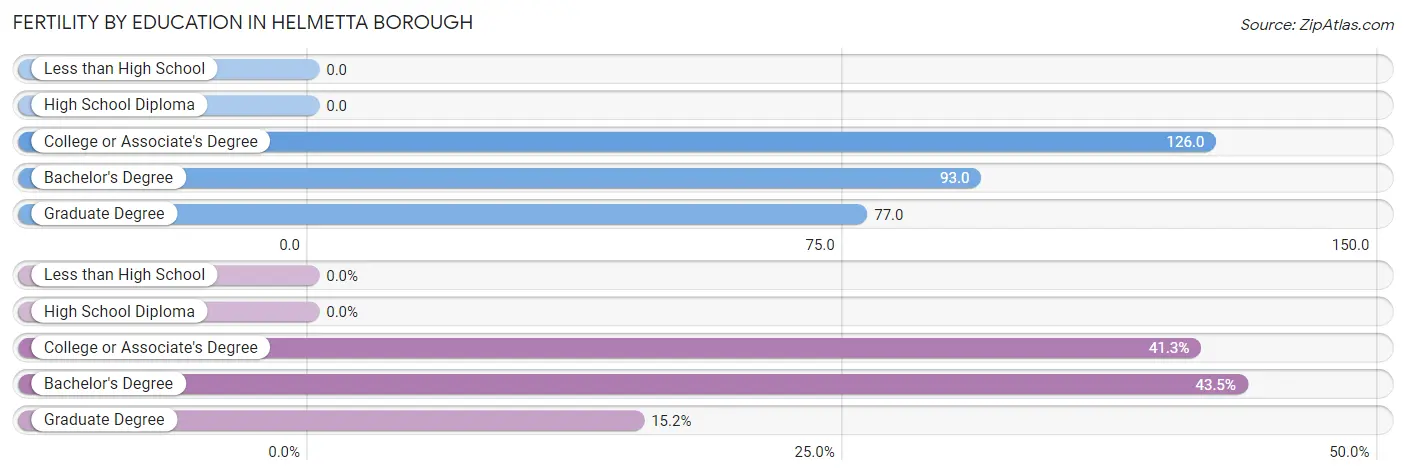
Fertility by Education in Helmetta borough
| Educational Attainment | Women with Births | Births / 1,000 Women |
| Less than High School | 0 (0.0%) | 0.0 |
| High School Diploma | 0 (0.0%) | 0.0 |
| College or Associate's Degree | 19 (41.3%) | 126.0 |
| Bachelor's Degree | 20 (43.5%) | 93.0 |
| Graduate Degree | 7 (15.2%) | 77.0 |
| Total | 46 (100.0%) | 79.0 |
Fertility by Education by Marriage Status in Helmetta borough
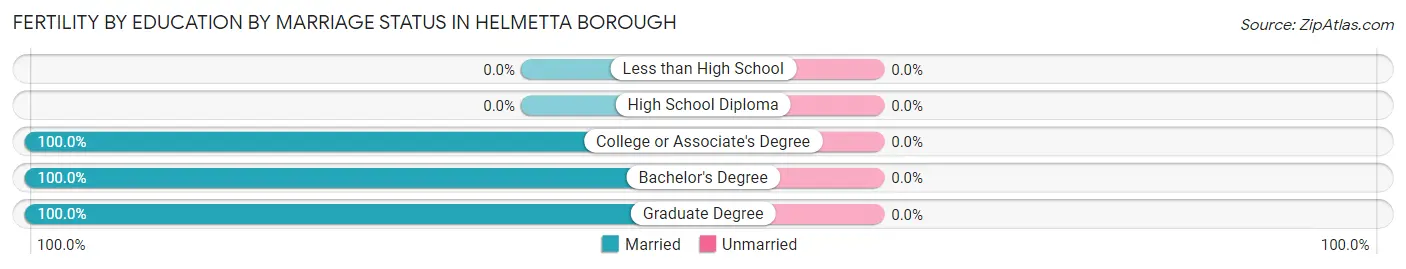
| Educational Attainment | Married | Unmarried |
| Less than High School | 0 (0.0%) | 0 (0.0%) |
| High School Diploma | 0 (0.0%) | 0 (0.0%) |
| College or Associate's Degree | 19 (100.0%) | 0 (0.0%) |
| Bachelor's Degree | 20 (100.0%) | 0 (0.0%) |
| Graduate Degree | 7 (100.0%) | 0 (0.0%) |
| Total | 46 (100.0%) | 0 (0.0%) |
Income in Helmetta borough
Income Overview in Helmetta borough
Per Capita Income in Helmetta borough is $50,000, while median incomes of families and households are $113,041 and $104,500 respectively.
| Characteristic | Number | Measure |
| Per Capita Income | 2,302 | $50,000 |
| Median Family Income | 618 | $113,041 |
| Mean Family Income | 618 | $128,812 |
| Median Household Income | 968 | $104,500 |
| Mean Household Income | 968 | $117,127 |
| Income Deficit | 618 | $0 |
| Wage / Income Gap (%) | 2,302 | 8.32% |
| Wage / Income Gap ($) | 2,302 | 91.68¢ per $1 |
| Gini / Inequality Index | 2,302 | 0.37 |
Earnings by Sex in Helmetta borough
Average Earnings in Helmetta borough are $54,911, $58,875 for men and $53,977 for women, a difference of 8.3%.
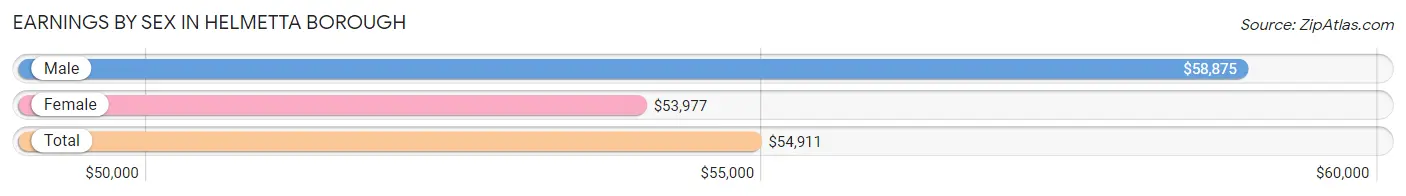
| Sex | Number | Average Earnings |
| Male | 732 (51.2%) | $58,875 |
| Female | 698 (48.8%) | $53,977 |
| Total | 1,430 (100.0%) | $54,911 |
Earnings by Sex by Income Bracket in Helmetta borough
The most common earnings brackets in Helmetta borough are $100,000+ for men (177 | 24.2%) and $75,000 to $99,999 for women (144 | 20.6%).
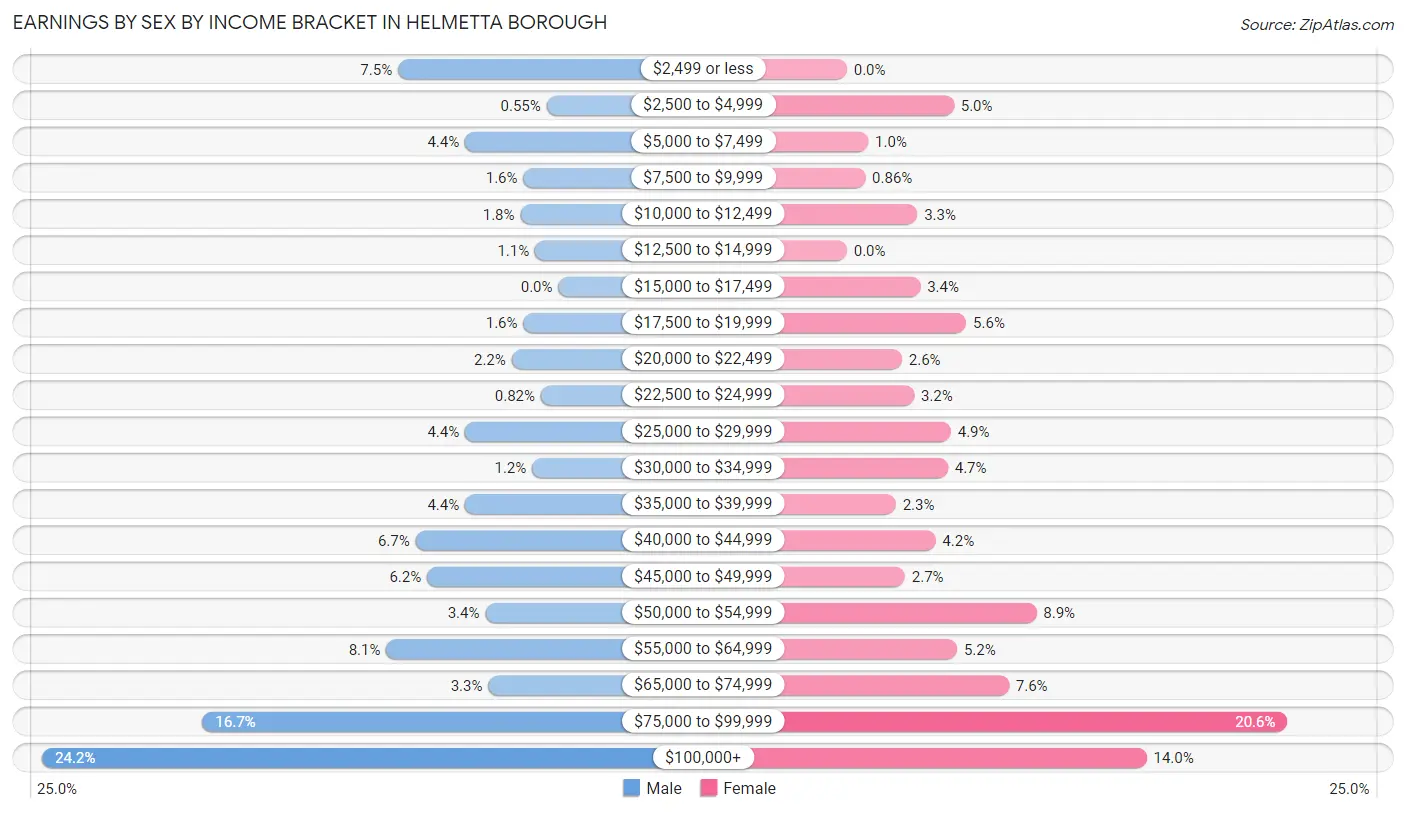
| Income | Male | Female |
| $2,499 or less | 55 (7.5%) | 0 (0.0%) |
| $2,500 to $4,999 | 4 (0.5%) | 35 (5.0%) |
| $5,000 to $7,499 | 32 (4.4%) | 7 (1.0%) |
| $7,500 to $9,999 | 12 (1.6%) | 6 (0.9%) |
| $10,000 to $12,499 | 13 (1.8%) | 23 (3.3%) |
| $12,500 to $14,999 | 8 (1.1%) | 0 (0.0%) |
| $15,000 to $17,499 | 0 (0.0%) | 24 (3.4%) |
| $17,500 to $19,999 | 12 (1.6%) | 39 (5.6%) |
| $20,000 to $22,499 | 16 (2.2%) | 18 (2.6%) |
| $22,500 to $24,999 | 6 (0.8%) | 22 (3.2%) |
| $25,000 to $29,999 | 32 (4.4%) | 34 (4.9%) |
| $30,000 to $34,999 | 9 (1.2%) | 33 (4.7%) |
| $35,000 to $39,999 | 32 (4.4%) | 16 (2.3%) |
| $40,000 to $44,999 | 49 (6.7%) | 29 (4.2%) |
| $45,000 to $49,999 | 45 (6.1%) | 19 (2.7%) |
| $50,000 to $54,999 | 25 (3.4%) | 62 (8.9%) |
| $55,000 to $64,999 | 59 (8.1%) | 36 (5.2%) |
| $65,000 to $74,999 | 24 (3.3%) | 53 (7.6%) |
| $75,000 to $99,999 | 122 (16.7%) | 144 (20.6%) |
| $100,000+ | 177 (24.2%) | 98 (14.0%) |
| Total | 732 (100.0%) | 698 (100.0%) |
Earnings by Sex by Educational Attainment in Helmetta borough
Average earnings in Helmetta borough are $67,813 for men and $54,901 for women, a difference of 19.0%. Men with an educational attainment of graduate degree enjoy the highest average annual earnings of $127,619, while those with high school diploma education earn the least with $46,217. Women with an educational attainment of bachelor's degree earn the most with the average annual earnings of $81,055, while those with college or associate's degree education have the smallest earnings of $41,630.
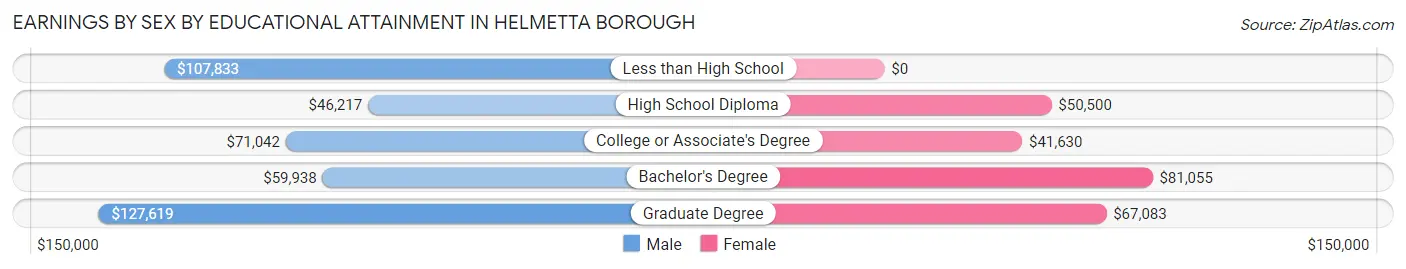
| Educational Attainment | Male Income | Female Income |
| Less than High School | $107,833 | $0 |
| High School Diploma | $46,217 | $50,500 |
| College or Associate's Degree | $71,042 | $41,630 |
| Bachelor's Degree | $59,938 | $81,055 |
| Graduate Degree | $127,619 | $67,083 |
| Total | $67,813 | $54,901 |
Family Income in Helmetta borough
Family Income Brackets in Helmetta borough
According to the Helmetta borough family income data, there are 168 families falling into the $100,000 to $149,999 income range, which is the most common income bracket and makes up 27.2% of all families. Conversely, the $10,000 to $14,999 income bracket is the least frequent group with only 4 families (0.6%) belonging to this category.
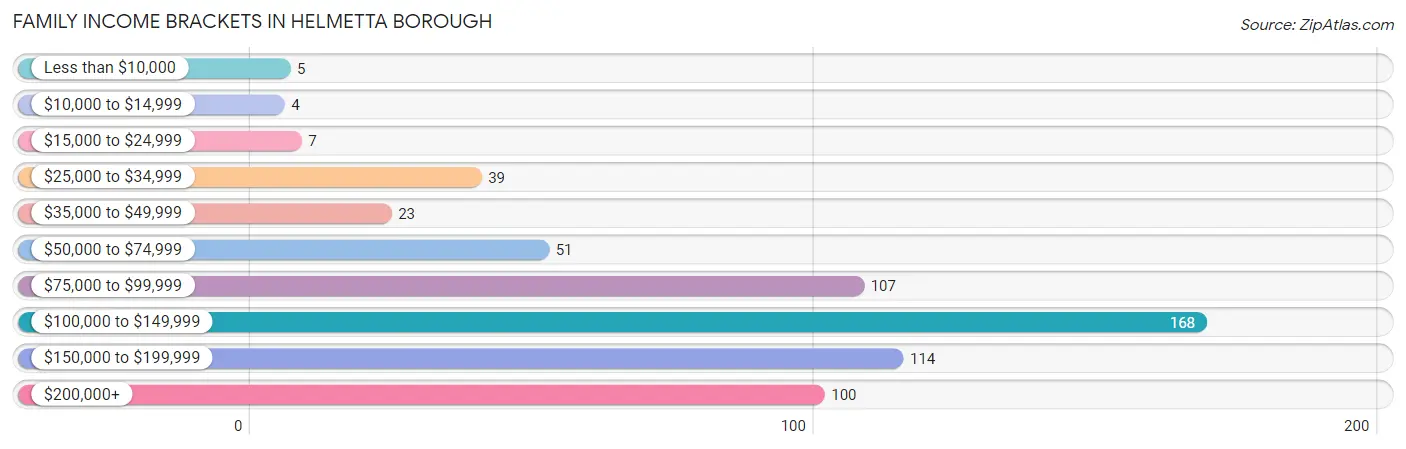
| Income Bracket | # Families | % Families |
| Less than $10,000 | 5 | 0.8% |
| $10,000 to $14,999 | 4 | 0.6% |
| $15,000 to $24,999 | 7 | 1.1% |
| $25,000 to $34,999 | 39 | 6.3% |
| $35,000 to $49,999 | 23 | 3.7% |
| $50,000 to $74,999 | 51 | 8.3% |
| $75,000 to $99,999 | 107 | 17.3% |
| $100,000 to $149,999 | 168 | 27.2% |
| $150,000 to $199,999 | 114 | 18.4% |
| $200,000+ | 100 | 16.2% |
Family Income by Famaliy Size in Helmetta borough
5-person families (18 | 2.9%) account for the highest median family income in Helmetta borough with $202,917 per family, while 2-person families (274 | 44.3%) have the highest median income of $54,062 per family member.
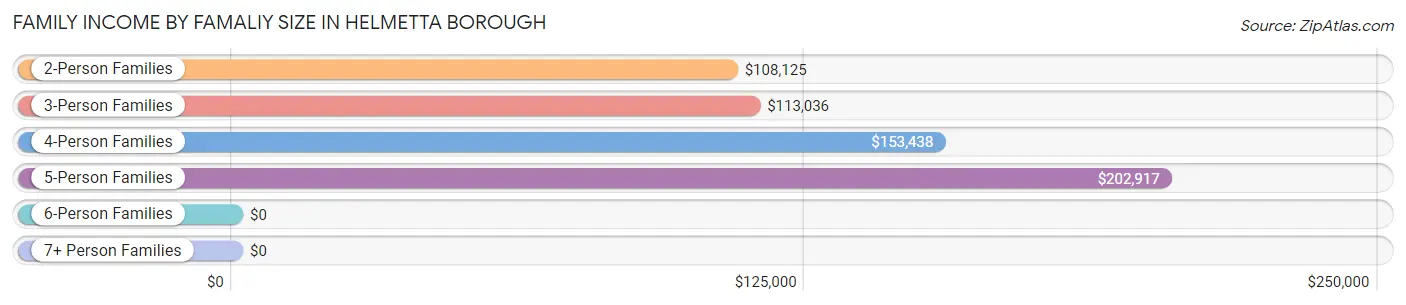
| Income Bracket | # Families | Median Income |
| 2-Person Families | 274 (44.3%) | $108,125 |
| 3-Person Families | 157 (25.4%) | $113,036 |
| 4-Person Families | 163 (26.4%) | $153,438 |
| 5-Person Families | 18 (2.9%) | $202,917 |
| 6-Person Families | 6 (1.0%) | $0 |
| 7+ Person Families | 0 (0.0%) | $0 |
| Total | 618 (100.0%) | $113,041 |
Family Income by Number of Earners in Helmetta borough
The median family income in Helmetta borough is $113,041, with families comprising 3+ earners (93) having the highest median family income of $175,938, while families with no earners (50) have the lowest median family income of $36,607, accounting for 15.0% and 8.1% of families, respectively.
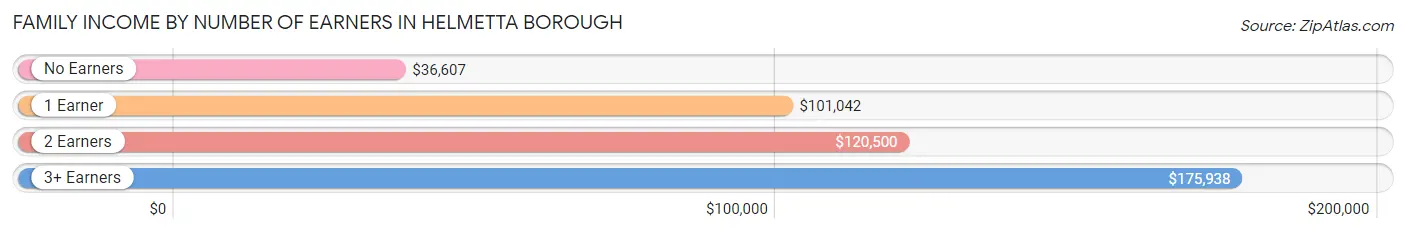
| Number of Earners | # Families | Median Income |
| No Earners | 50 (8.1%) | $36,607 |
| 1 Earner | 225 (36.4%) | $101,042 |
| 2 Earners | 250 (40.5%) | $120,500 |
| 3+ Earners | 93 (15.0%) | $175,938 |
| Total | 618 (100.0%) | $113,041 |
Household Income in Helmetta borough
Household Income Brackets in Helmetta borough
With 258 households falling in the category, the $100,000 to $149,999 income range is the most frequent in Helmetta borough, accounting for 26.7% of all households. In contrast, only 4 households (0.4%) fall into the $10,000 to $14,999 income bracket, making it the least populous group.
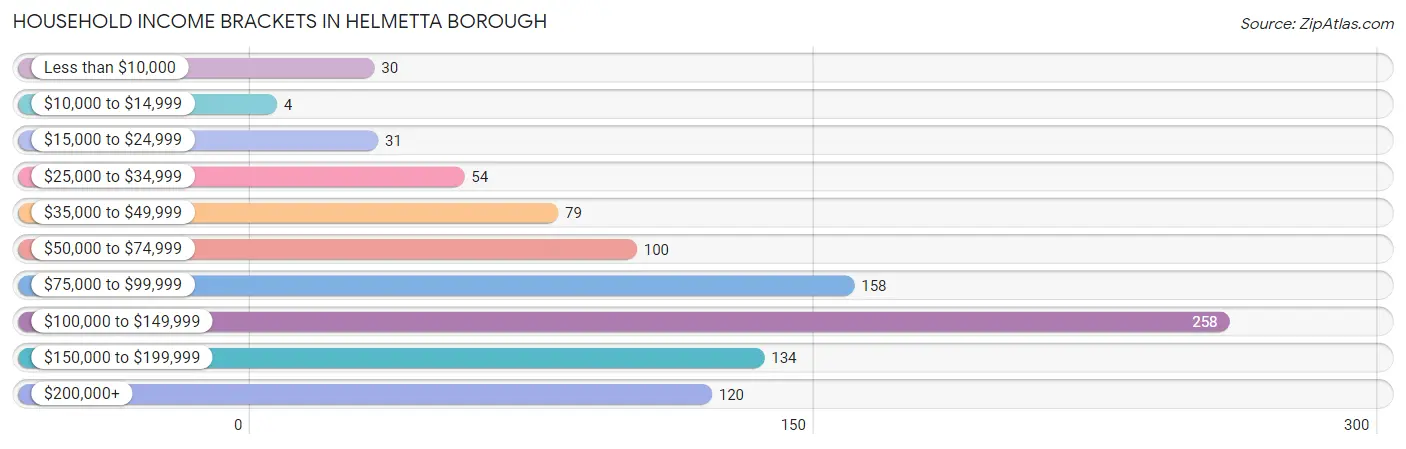
| Income Bracket | # Households | % Households |
| Less than $10,000 | 30 | 3.1% |
| $10,000 to $14,999 | 4 | 0.4% |
| $15,000 to $24,999 | 31 | 3.2% |
| $25,000 to $34,999 | 54 | 5.6% |
| $35,000 to $49,999 | 79 | 8.2% |
| $50,000 to $74,999 | 100 | 10.3% |
| $75,000 to $99,999 | 158 | 16.3% |
| $100,000 to $149,999 | 258 | 26.7% |
| $150,000 to $199,999 | 134 | 13.8% |
| $200,000+ | 120 | 12.4% |
Household Income by Householder Age in Helmetta borough
The median household income in Helmetta borough is $104,500, with the highest median household income of $113,558 found in the 45 to 64 years age bracket for the primary householder. A total of 439 households (45.4%) fall into this category. Meanwhile, the 15 to 24 years age bracket for the primary householder has the lowest median household income of $0, with 10 households (1.0%) in this group.
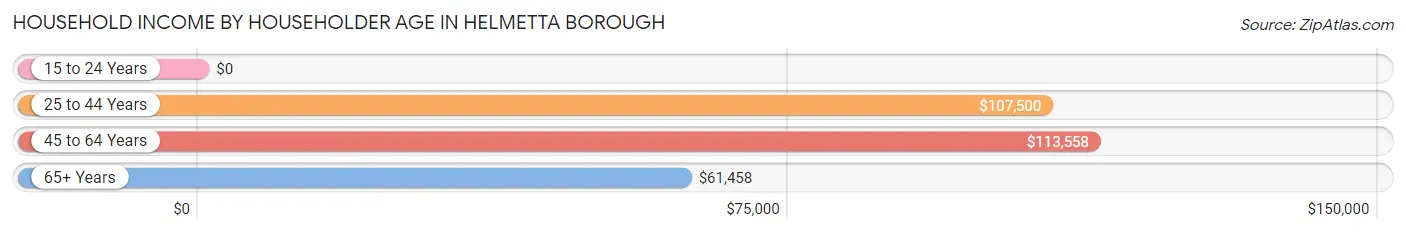
| Income Bracket | # Households | Median Income |
| 15 to 24 Years | 10 (1.0%) | $0 |
| 25 to 44 Years | 340 (35.1%) | $107,500 |
| 45 to 64 Years | 439 (45.4%) | $113,558 |
| 65+ Years | 179 (18.5%) | $61,458 |
| Total | 968 (100.0%) | $104,500 |
Poverty in Helmetta borough
Income Below Poverty by Sex and Age in Helmetta borough
With 3.5% poverty level for males and 2.0% for females among the residents of Helmetta borough, 12 to 14 year old males and 65 to 74 year old females are the most vulnerable to poverty, with 13 males (35.1%) and 7 females (7.3%) in their respective age groups living below the poverty level.
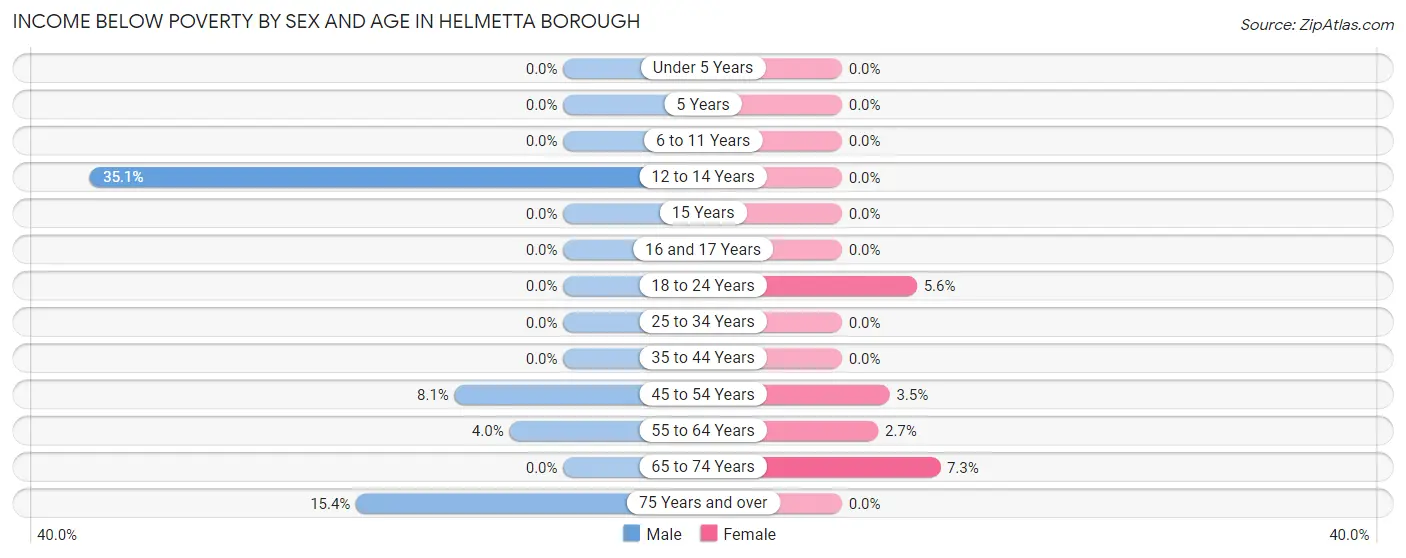
| Age Bracket | Male | Female |
| Under 5 Years | 0 (0.0%) | 0 (0.0%) |
| 5 Years | 0 (0.0%) | 0 (0.0%) |
| 6 to 11 Years | 0 (0.0%) | 0 (0.0%) |
| 12 to 14 Years | 13 (35.1%) | 0 (0.0%) |
| 15 Years | 0 (0.0%) | 0 (0.0%) |
| 16 and 17 Years | 0 (0.0%) | 0 (0.0%) |
| 18 to 24 Years | 0 (0.0%) | 4 (5.6%) |
| 25 to 34 Years | 0 (0.0%) | 0 (0.0%) |
| 35 to 44 Years | 0 (0.0%) | 0 (0.0%) |
| 45 to 54 Years | 18 (8.1%) | 7 (3.5%) |
| 55 to 64 Years | 5 (4.0%) | 5 (2.7%) |
| 65 to 74 Years | 0 (0.0%) | 7 (7.3%) |
| 75 Years and over | 4 (15.4%) | 0 (0.0%) |
| Total | 40 (3.5%) | 23 (2.0%) |
Income Above Poverty by Sex and Age in Helmetta borough
According to the poverty statistics in Helmetta borough, males aged under 5 years and females aged under 5 years are the age groups that are most secure financially, with 100.0% of males and 100.0% of females in these age groups living above the poverty line.
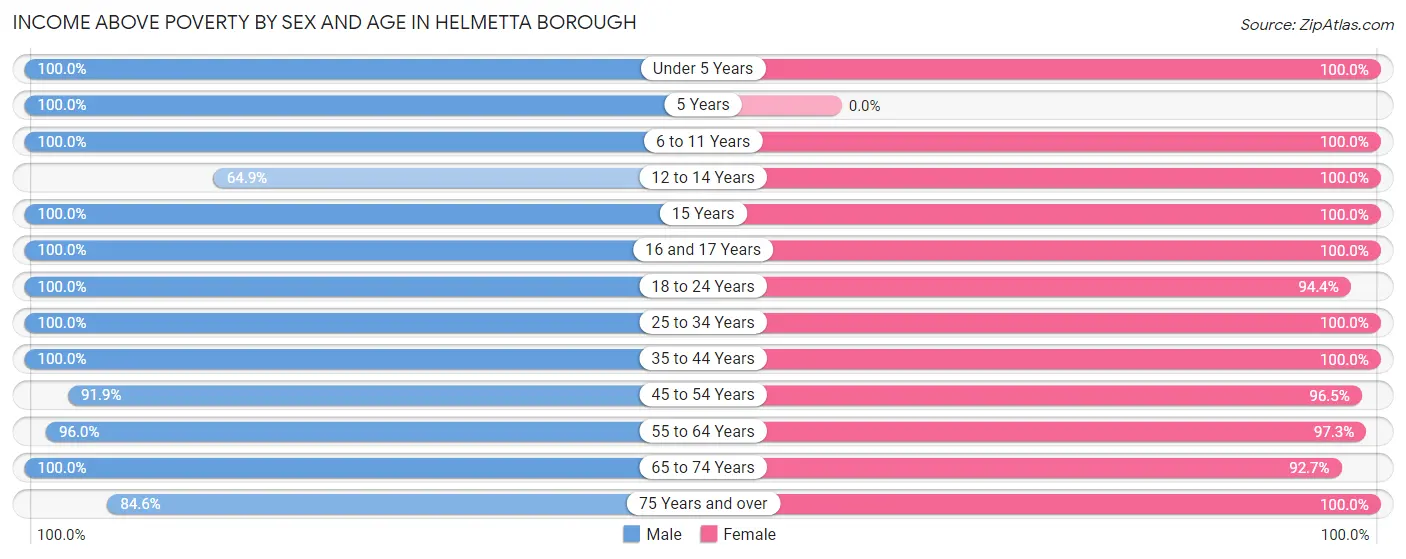
| Age Bracket | Male | Female |
| Under 5 Years | 136 (100.0%) | 62 (100.0%) |
| 5 Years | 5 (100.0%) | 0 (0.0%) |
| 6 to 11 Years | 64 (100.0%) | 33 (100.0%) |
| 12 to 14 Years | 24 (64.9%) | 36 (100.0%) |
| 15 Years | 4 (100.0%) | 9 (100.0%) |
| 16 and 17 Years | 47 (100.0%) | 12 (100.0%) |
| 18 to 24 Years | 89 (100.0%) | 68 (94.4%) |
| 25 to 34 Years | 155 (100.0%) | 213 (100.0%) |
| 35 to 44 Years | 133 (100.0%) | 165 (100.0%) |
| 45 to 54 Years | 205 (91.9%) | 191 (96.5%) |
| 55 to 64 Years | 120 (96.0%) | 181 (97.3%) |
| 65 to 74 Years | 110 (100.0%) | 89 (92.7%) |
| 75 Years and over | 22 (84.6%) | 66 (100.0%) |
| Total | 1,114 (96.5%) | 1,125 (98.0%) |
Income Below Poverty Among Married-Couple Families in Helmetta borough
The poverty statistics for married-couple families in Helmetta borough show that 0.9% or 4 of the total 445 families live below the poverty line. Families with no children have the highest poverty rate of 1.5%, comprising of 4 families. On the other hand, families with 1 or 2 children have the lowest poverty rate of 0.0%, which includes 0 families.
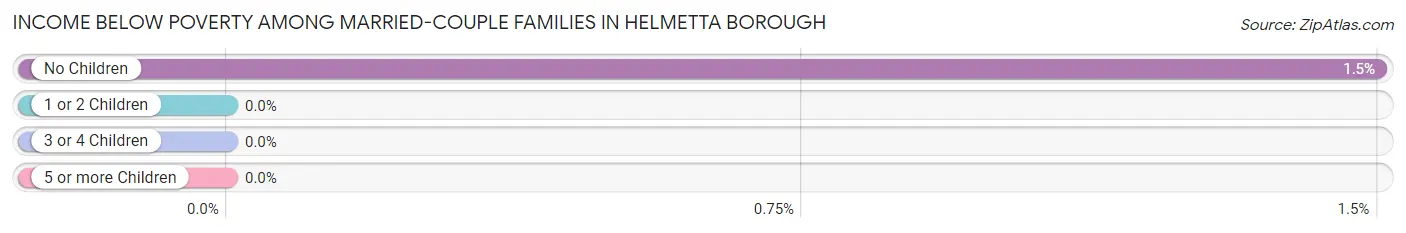
| Children | Above Poverty | Below Poverty |
| No Children | 262 (98.5%) | 4 (1.5%) |
| 1 or 2 Children | 173 (100.0%) | 0 (0.0%) |
| 3 or 4 Children | 6 (100.0%) | 0 (0.0%) |
| 5 or more Children | 0 (0.0%) | 0 (0.0%) |
| Total | 441 (99.1%) | 4 (0.9%) |
Income Below Poverty Among Single-Parent Households in Helmetta borough
According to the poverty data in Helmetta borough, 12.2% or 5 single-father households and 5.3% or 7 single-mother households are living below the poverty line. Among single-father households, those with no children have the highest poverty rate, with 5 households (26.3%) experiencing poverty. Likewise, among single-mother households, those with 1 or 2 children have the highest poverty rate, with 7 households (6.5%) falling below the poverty line.
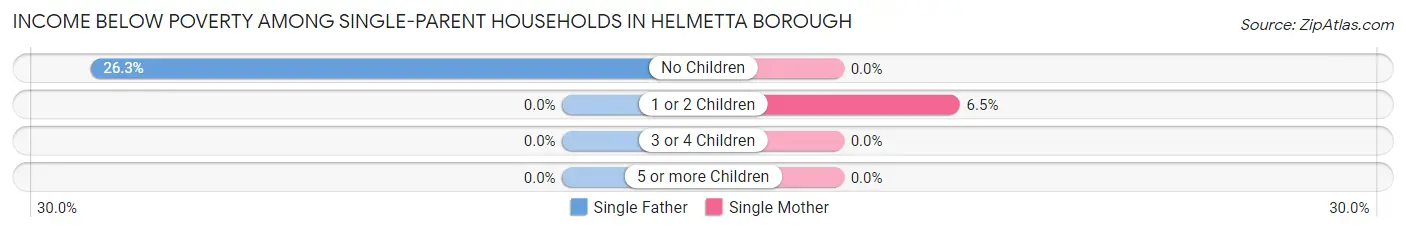
| Children | Single Father | Single Mother |
| No Children | 5 (26.3%) | 0 (0.0%) |
| 1 or 2 Children | 0 (0.0%) | 7 (6.5%) |
| 3 or 4 Children | 0 (0.0%) | 0 (0.0%) |
| 5 or more Children | 0 (0.0%) | 0 (0.0%) |
| Total | 5 (12.2%) | 7 (5.3%) |
Income Below Poverty Among Married-Couple vs Single-Parent Households in Helmetta borough
The poverty data for Helmetta borough shows that 4 of the married-couple family households (0.9%) and 12 of the single-parent households (6.9%) are living below the poverty level. Within the married-couple family households, those with no children have the highest poverty rate, with 4 households (1.5%) falling below the poverty line. Among the single-parent households, those with no children have the highest poverty rate, with 5 household (11.6%) living below poverty.
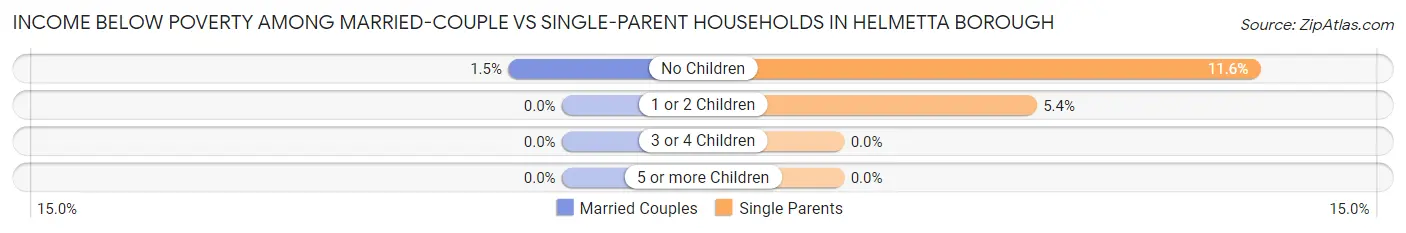
| Children | Married-Couple Families | Single-Parent Households |
| No Children | 4 (1.5%) | 5 (11.6%) |
| 1 or 2 Children | 0 (0.0%) | 7 (5.4%) |
| 3 or 4 Children | 0 (0.0%) | 0 (0.0%) |
| 5 or more Children | 0 (0.0%) | 0 (0.0%) |
| Total | 4 (0.9%) | 12 (6.9%) |
Employment Characteristics in Helmetta borough
Employment by Class of Employer in Helmetta borough
Among the 1,273 employed individuals in Helmetta borough, private company employees (946 | 74.3%), local government employees (102 | 8.0%), and state government employees (84 | 6.6%) make up the most common classes of employment.
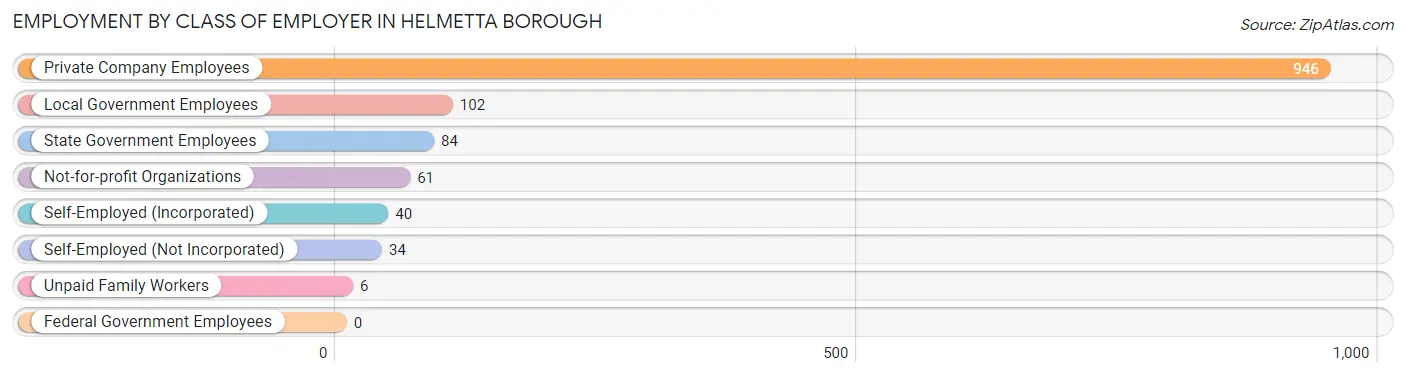
| Employer Class | # Employees | % Employees |
| Private Company Employees | 946 | 74.3% |
| Self-Employed (Incorporated) | 40 | 3.1% |
| Self-Employed (Not Incorporated) | 34 | 2.7% |
| Not-for-profit Organizations | 61 | 4.8% |
| Local Government Employees | 102 | 8.0% |
| State Government Employees | 84 | 6.6% |
| Federal Government Employees | 0 | 0.0% |
| Unpaid Family Workers | 6 | 0.5% |
| Total | 1,273 | 100.0% |
Employment Status by Age in Helmetta borough
According to the labor force statistics for Helmetta borough, out of the total population over 16 years of age (1,916), 73.6% or 1,410 individuals are in the labor force, with 6.4% or 90 of them unemployed. The age group with the highest labor force participation rate is 25 to 29 years, with 97.4% or 152 individuals in the labor force. Within the labor force, the 20 to 24 years age range has the highest percentage of unemployed individuals, with 27.5% or 25 of them being unemployed.
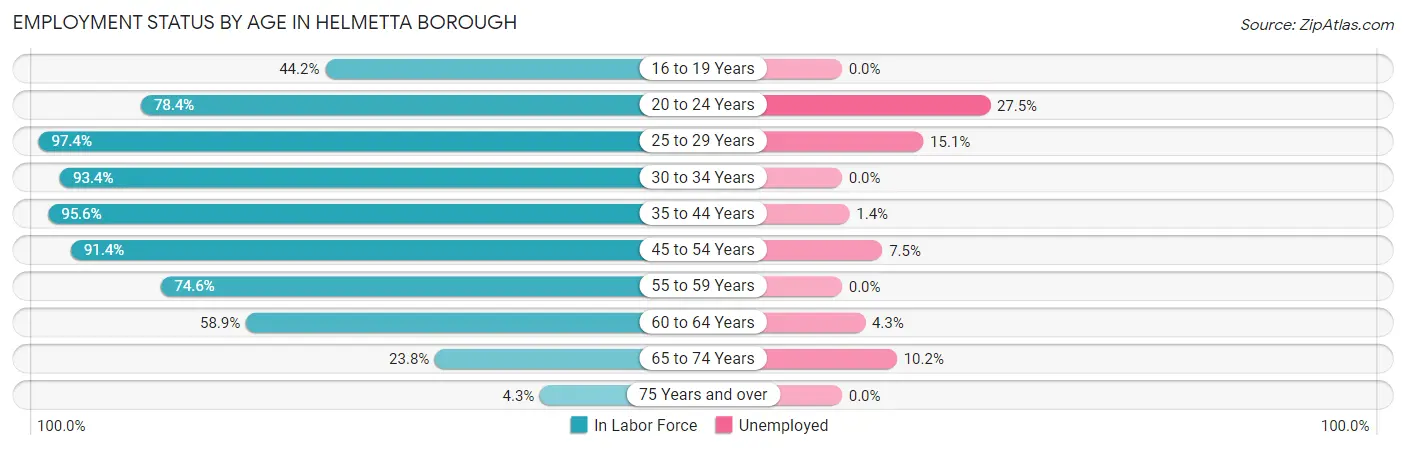
| Age Bracket | In Labor Force | Unemployed |
| 16 to 19 Years | 46 (44.2%) | 0 (0.0%) |
| 20 to 24 Years | 91 (78.4%) | 25 (27.5%) |
| 25 to 29 Years | 152 (97.4%) | 23 (15.1%) |
| 30 to 34 Years | 198 (93.4%) | 0 (0.0%) |
| 35 to 44 Years | 285 (95.6%) | 4 (1.4%) |
| 45 to 54 Years | 385 (91.4%) | 29 (7.5%) |
| 55 to 59 Years | 85 (74.6%) | 0 (0.0%) |
| 60 to 64 Years | 116 (58.9%) | 5 (4.3%) |
| 65 to 74 Years | 49 (23.8%) | 5 (10.2%) |
| 75 Years and over | 4 (4.3%) | 0 (0.0%) |
| Total | 1,410 (73.6%) | 90 (6.4%) |
Employment Status by Educational Attainment in Helmetta borough
According to labor force statistics for Helmetta borough, 87.3% of individuals (1,220) out of the total population between 25 and 64 years of age (1,398) are in the labor force, with 5.0% or 61 of them being unemployed. The group with the highest labor force participation rate are those with the educational attainment of bachelor's degree or higher, with 93.7% or 564 individuals in the labor force. Within the labor force, individuals with high school diploma education have the highest percentage of unemployment, with 7.0% or 23 of them being unemployed.
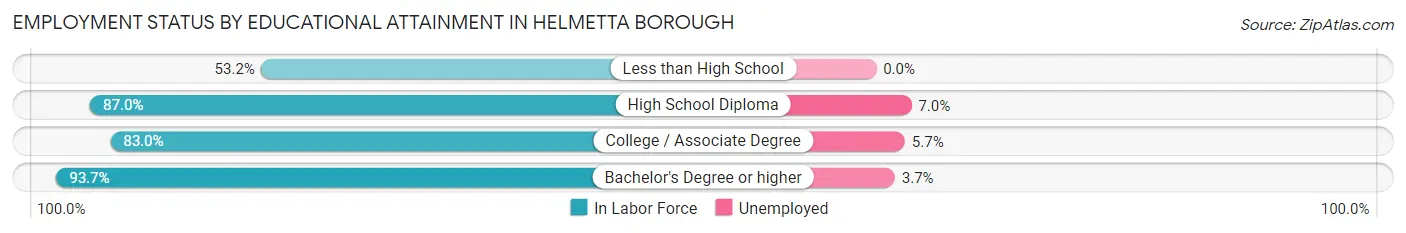
| Educational Attainment | In Labor Force | Unemployed |
| Less than High School | 33 (53.2%) | 0 (0.0%) |
| High School Diploma | 327 (87.0%) | 26 (7.0%) |
| College / Associate Degree | 297 (83.0%) | 20 (5.7%) |
| Bachelor's Degree or higher | 564 (93.7%) | 22 (3.7%) |
| Total | 1,220 (87.3%) | 70 (5.0%) |
Employment Occupations by Sex in Helmetta borough
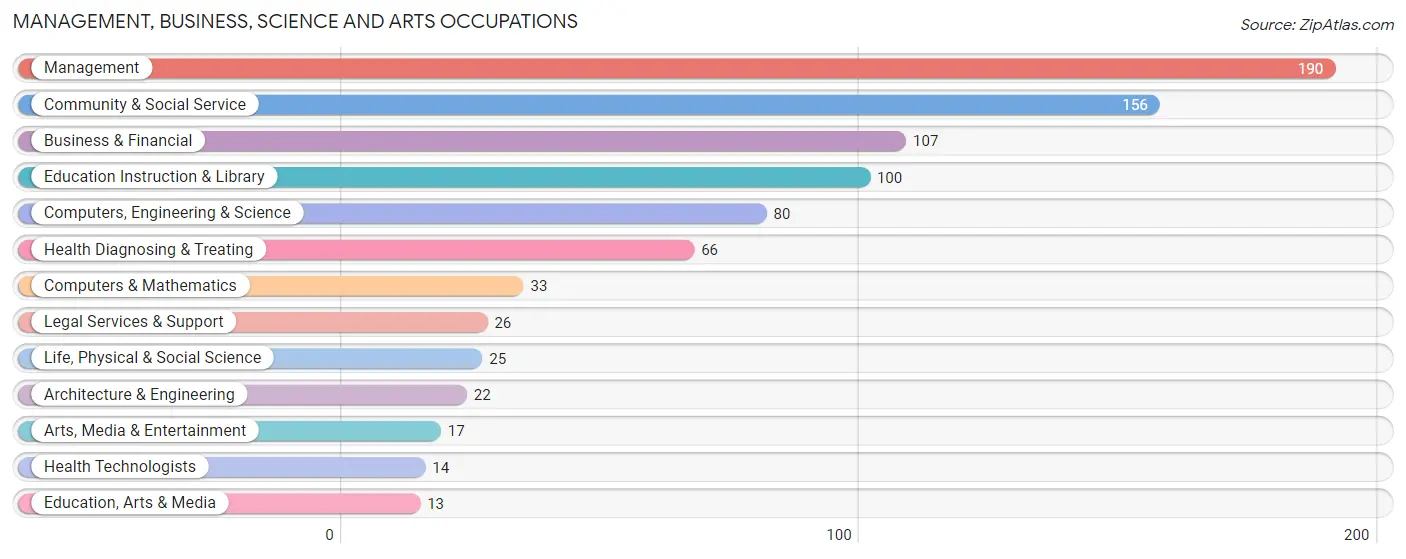
Management, Business, Science and Arts Occupations
The most common Management, Business, Science and Arts occupations in Helmetta borough are Management (190 | 14.4%), Community & Social Service (156 | 11.8%), Business & Financial (107 | 8.1%), Education Instruction & Library (100 | 7.6%), and Computers, Engineering & Science (80 | 6.1%).
Management, Business, Science and Arts Occupations by Sex
Within the Management, Business, Science and Arts occupations in Helmetta borough, the most male-oriented occupations are Architecture & Engineering (100.0%), Computers & Mathematics (84.9%), and Computers, Engineering & Science (68.8%), while the most female-oriented occupations are Education, Arts & Media (100.0%), Legal Services & Support (100.0%), and Health Technologists (100.0%).
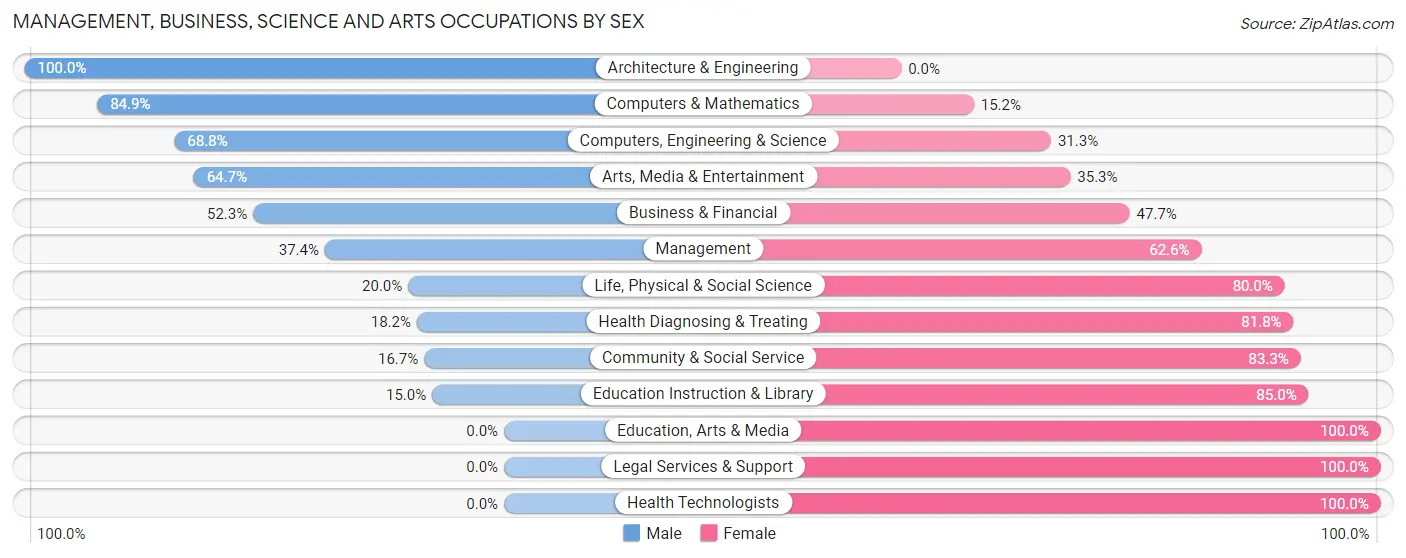
| Occupation | Male | Female |
| Management | 71 (37.4%) | 119 (62.6%) |
| Business & Financial | 56 (52.3%) | 51 (47.7%) |
| Computers, Engineering & Science | 55 (68.8%) | 25 (31.2%) |
| Computers & Mathematics | 28 (84.9%) | 5 (15.1%) |
| Architecture & Engineering | 22 (100.0%) | 0 (0.0%) |
| Life, Physical & Social Science | 5 (20.0%) | 20 (80.0%) |
| Community & Social Service | 26 (16.7%) | 130 (83.3%) |
| Education, Arts & Media | 0 (0.0%) | 13 (100.0%) |
| Legal Services & Support | 0 (0.0%) | 26 (100.0%) |
| Education Instruction & Library | 15 (15.0%) | 85 (85.0%) |
| Arts, Media & Entertainment | 11 (64.7%) | 6 (35.3%) |
| Health Diagnosing & Treating | 12 (18.2%) | 54 (81.8%) |
| Health Technologists | 0 (0.0%) | 14 (100.0%) |
| Total (Category) | 220 (36.7%) | 379 (63.3%) |
| Total (Overall) | 685 (51.9%) | 635 (48.1%) |
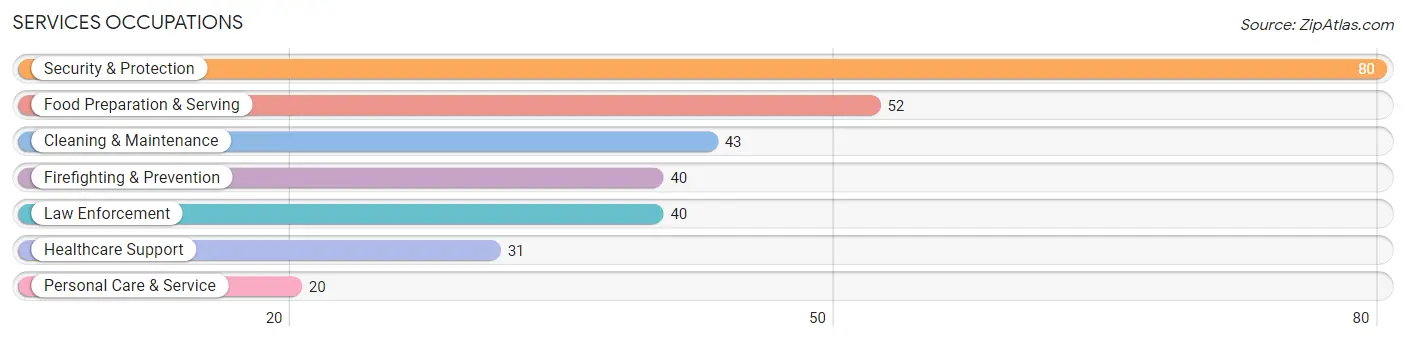
Services Occupations
The most common Services occupations in Helmetta borough are Security & Protection (80 | 6.1%), Food Preparation & Serving (52 | 3.9%), Cleaning & Maintenance (43 | 3.3%), Firefighting & Prevention (40 | 3.0%), and Law Enforcement (40 | 3.0%).
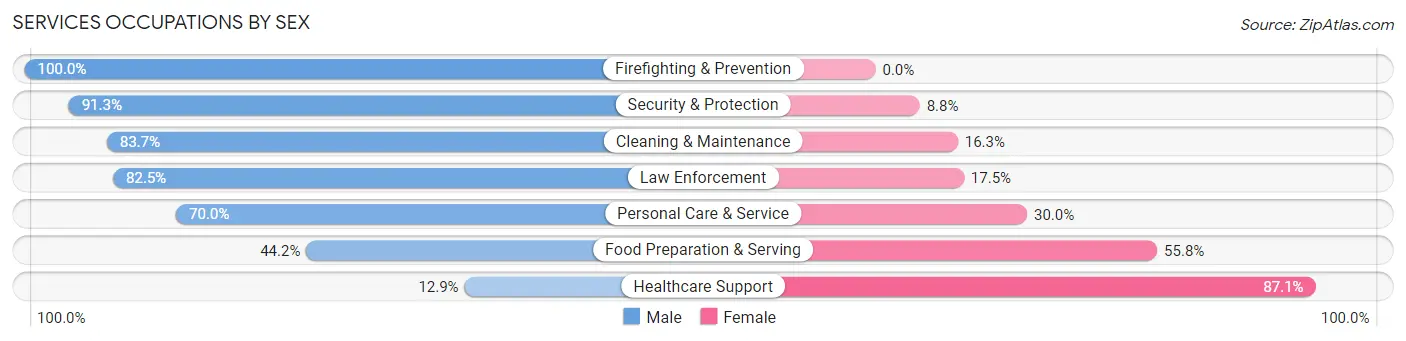
Services Occupations by Sex
Within the Services occupations in Helmetta borough, the most male-oriented occupations are Firefighting & Prevention (100.0%), Security & Protection (91.2%), and Cleaning & Maintenance (83.7%), while the most female-oriented occupations are Healthcare Support (87.1%), Food Preparation & Serving (55.8%), and Personal Care & Service (30.0%).
| Occupation | Male | Female |
| Healthcare Support | 4 (12.9%) | 27 (87.1%) |
| Security & Protection | 73 (91.2%) | 7 (8.7%) |
| Firefighting & Prevention | 40 (100.0%) | 0 (0.0%) |
| Law Enforcement | 33 (82.5%) | 7 (17.5%) |
| Food Preparation & Serving | 23 (44.2%) | 29 (55.8%) |
| Cleaning & Maintenance | 36 (83.7%) | 7 (16.3%) |
| Personal Care & Service | 14 (70.0%) | 6 (30.0%) |
| Total (Category) | 150 (66.4%) | 76 (33.6%) |
| Total (Overall) | 685 (51.9%) | 635 (48.1%) |
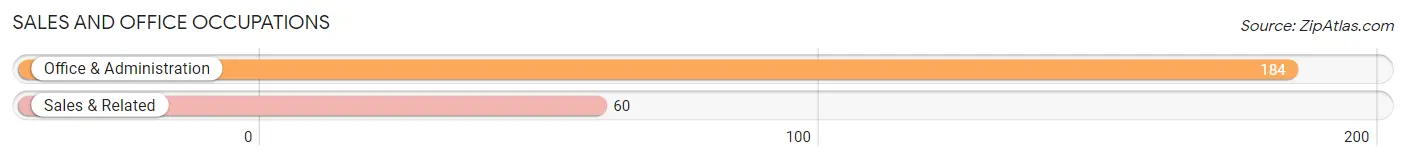
Sales and Office Occupations
The most common Sales and Office occupations in Helmetta borough are Office & Administration (184 | 13.9%), and Sales & Related (60 | 4.5%).
Sales and Office Occupations by Sex
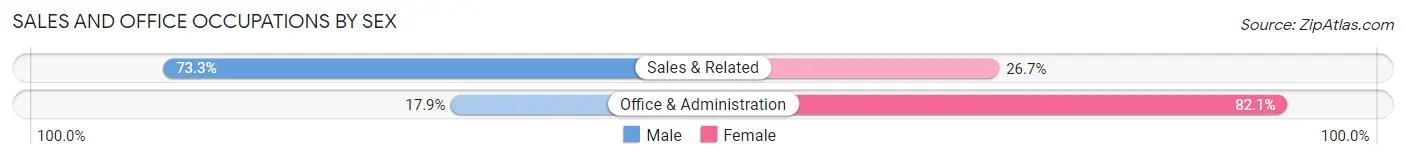
| Occupation | Male | Female |
| Sales & Related | 44 (73.3%) | 16 (26.7%) |
| Office & Administration | 33 (17.9%) | 151 (82.1%) |
| Total (Category) | 77 (31.6%) | 167 (68.4%) |
| Total (Overall) | 685 (51.9%) | 635 (48.1%) |
Natural Resources, Construction and Maintenance Occupations
The most common Natural Resources, Construction and Maintenance occupations in Helmetta borough are Construction & Extraction (84 | 6.4%), Installation, Maintenance & Repair (24 | 1.8%), and Farming, Fishing & Forestry (6 | 0.4%).
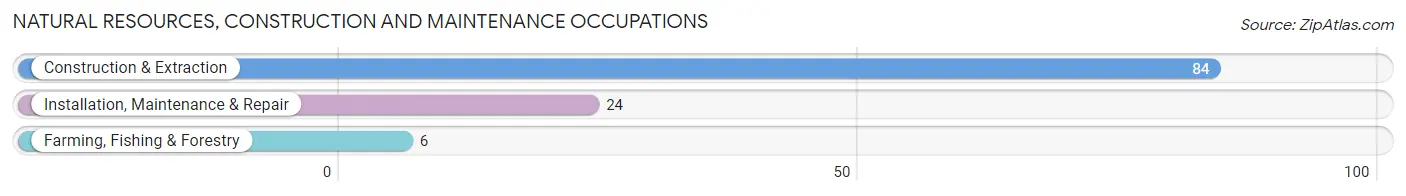
Natural Resources, Construction and Maintenance Occupations by Sex
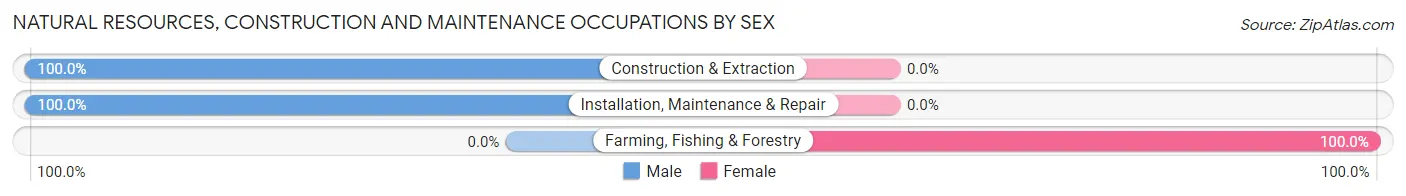
| Occupation | Male | Female |
| Farming, Fishing & Forestry | 0 (0.0%) | 6 (100.0%) |
| Construction & Extraction | 84 (100.0%) | 0 (0.0%) |
| Installation, Maintenance & Repair | 24 (100.0%) | 0 (0.0%) |
| Total (Category) | 108 (94.7%) | 6 (5.3%) |
| Total (Overall) | 685 (51.9%) | 635 (48.1%) |
Production, Transportation and Moving Occupations
The most common Production, Transportation and Moving occupations in Helmetta borough are Transportation (80 | 6.1%), Material Moving (35 | 2.6%), and Production (22 | 1.7%).
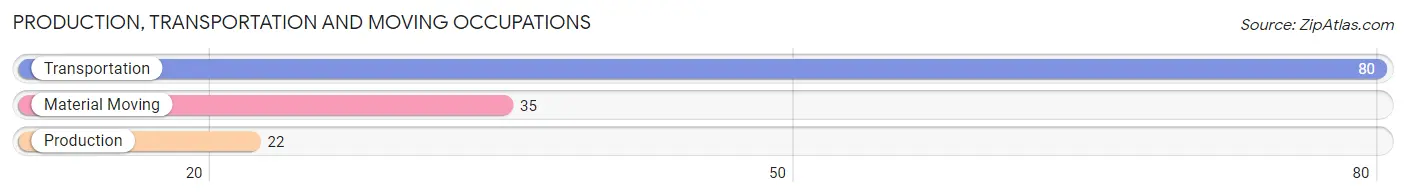
Production, Transportation and Moving Occupations by Sex
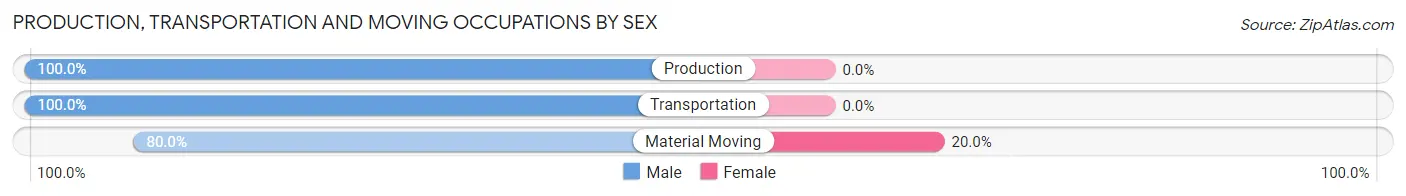
| Occupation | Male | Female |
| Production | 22 (100.0%) | 0 (0.0%) |
| Transportation | 80 (100.0%) | 0 (0.0%) |
| Material Moving | 28 (80.0%) | 7 (20.0%) |
| Total (Category) | 130 (94.9%) | 7 (5.1%) |
| Total (Overall) | 685 (51.9%) | 635 (48.1%) |
Employment Industries by Sex in Helmetta borough
Employment Industries in Helmetta borough
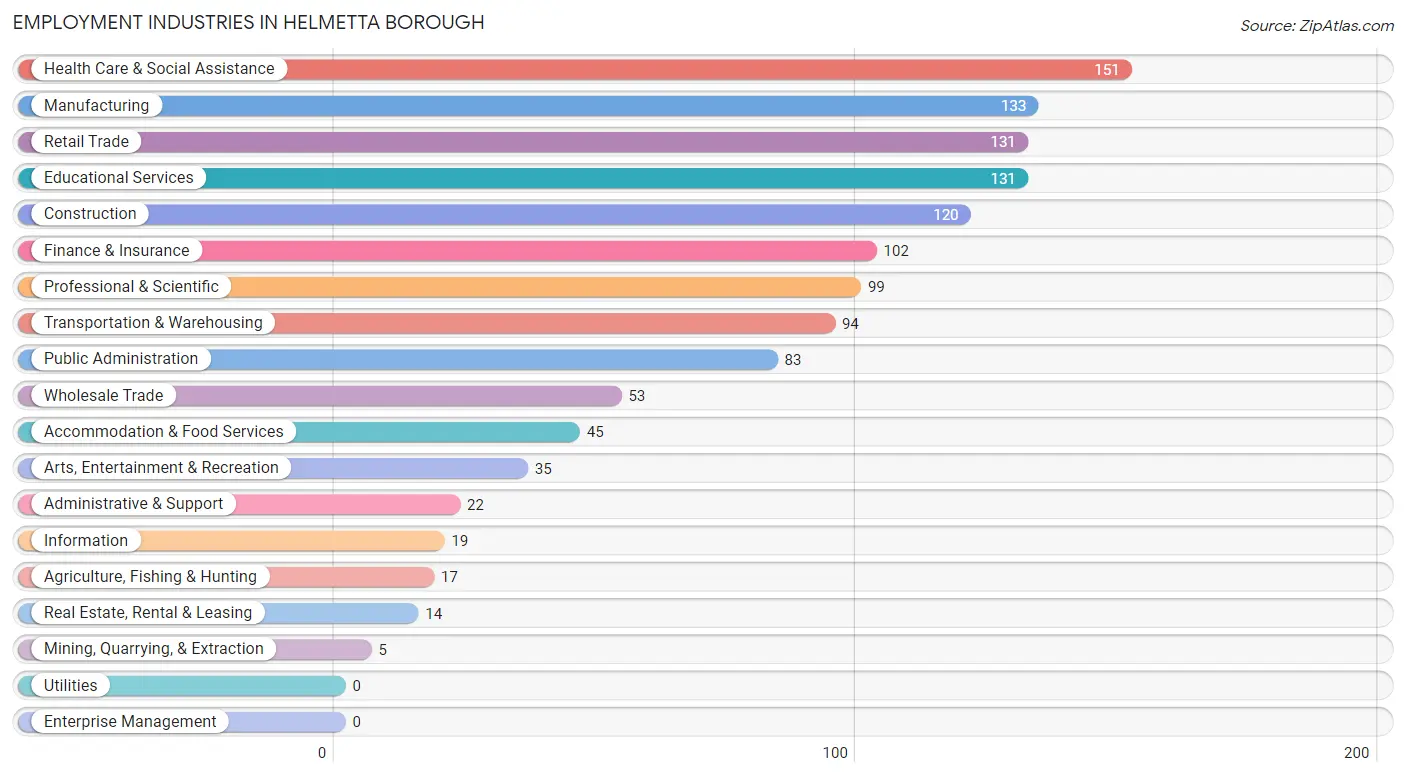
The major employment industries in Helmetta borough include Health Care & Social Assistance (151 | 11.4%), Manufacturing (133 | 10.1%), Retail Trade (131 | 9.9%), Educational Services (131 | 9.9%), and Construction (120 | 9.1%).
Employment Industries by Sex in Helmetta borough
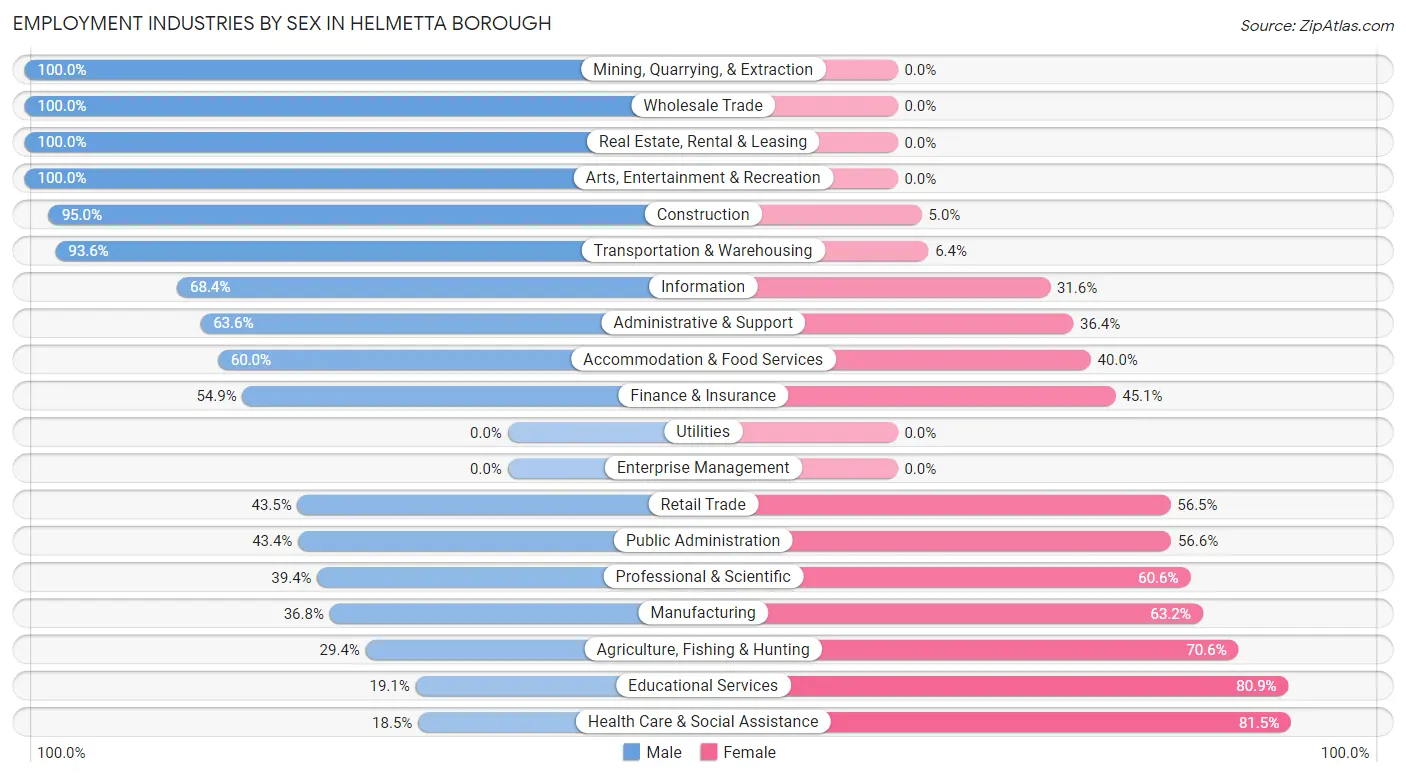
The Helmetta borough industries that see more men than women are Mining, Quarrying, & Extraction (100.0%), Wholesale Trade (100.0%), and Real Estate, Rental & Leasing (100.0%), whereas the industries that tend to have a higher number of women are Health Care & Social Assistance (81.5%), Educational Services (80.9%), and Agriculture, Fishing & Hunting (70.6%).
| Industry | Male | Female |
| Agriculture, Fishing & Hunting | 5 (29.4%) | 12 (70.6%) |
| Mining, Quarrying, & Extraction | 5 (100.0%) | 0 (0.0%) |
| Construction | 114 (95.0%) | 6 (5.0%) |
| Manufacturing | 49 (36.8%) | 84 (63.2%) |
| Wholesale Trade | 53 (100.0%) | 0 (0.0%) |
| Retail Trade | 57 (43.5%) | 74 (56.5%) |
| Transportation & Warehousing | 88 (93.6%) | 6 (6.4%) |
| Utilities | 0 (0.0%) | 0 (0.0%) |
| Information | 13 (68.4%) | 6 (31.6%) |
| Finance & Insurance | 56 (54.9%) | 46 (45.1%) |
| Real Estate, Rental & Leasing | 14 (100.0%) | 0 (0.0%) |
| Professional & Scientific | 39 (39.4%) | 60 (60.6%) |
| Enterprise Management | 0 (0.0%) | 0 (0.0%) |
| Administrative & Support | 14 (63.6%) | 8 (36.4%) |
| Educational Services | 25 (19.1%) | 106 (80.9%) |
| Health Care & Social Assistance | 28 (18.5%) | 123 (81.5%) |
| Arts, Entertainment & Recreation | 35 (100.0%) | 0 (0.0%) |
| Accommodation & Food Services | 27 (60.0%) | 18 (40.0%) |
| Public Administration | 36 (43.4%) | 47 (56.6%) |
| Total | 685 (51.9%) | 635 (48.1%) |
Education in Helmetta borough
School Enrollment in Helmetta borough
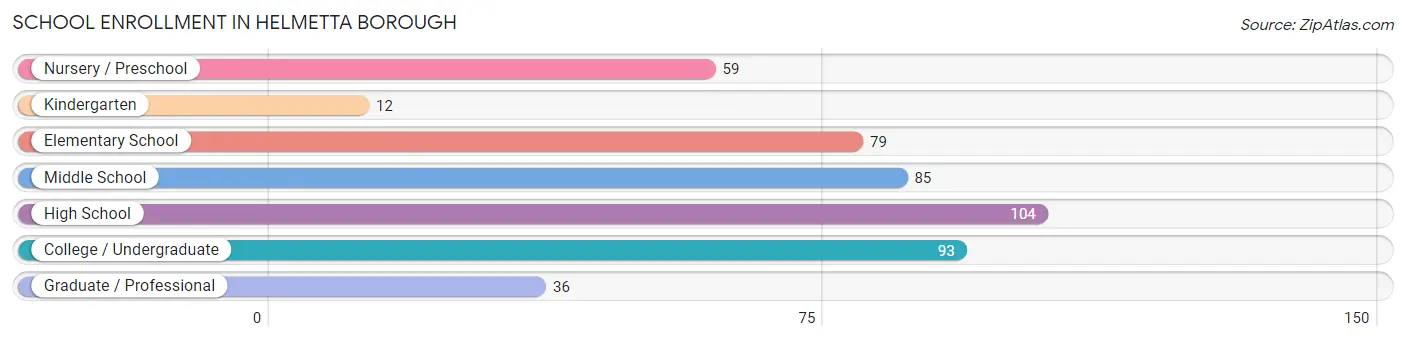
The most common levels of schooling among the 468 students in Helmetta borough are high school (104 | 22.2%), college / undergraduate (93 | 19.9%), and middle school (85 | 18.2%).
| School Level | # Students | % Students |
| Nursery / Preschool | 59 | 12.6% |
| Kindergarten | 12 | 2.6% |
| Elementary School | 79 | 16.9% |
| Middle School | 85 | 18.2% |
| High School | 104 | 22.2% |
| College / Undergraduate | 93 | 19.9% |
| Graduate / Professional | 36 | 7.7% |
| Total | 468 | 100.0% |
School Enrollment by Age by Funding Source in Helmetta borough
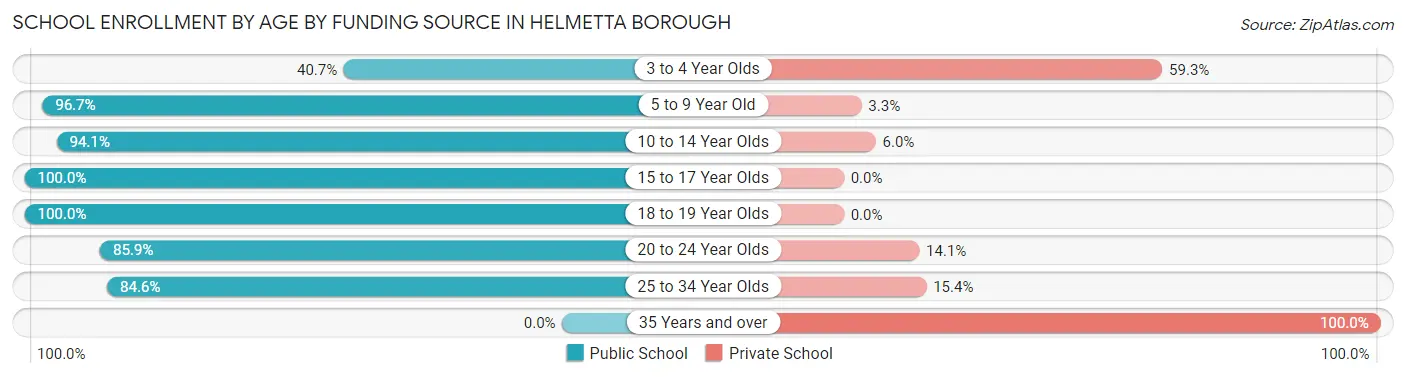
Out of a total of 468 students who are enrolled in schools in Helmetta borough, 72 (15.4%) attend a private institution, while the remaining 396 (84.6%) are enrolled in public schools. The age group of 35 years and over has the highest likelihood of being enrolled in private schools, with 14 (100.0% in the age bracket) enrolled. Conversely, the age group of 15 to 17 year olds has the lowest likelihood of being enrolled in a private school, with 72 (100.0% in the age bracket) attending a public institution.
| Age Bracket | Public School | Private School |
| 3 to 4 Year Olds | 24 (40.7%) | 35 (59.3%) |
| 5 to 9 Year Old | 88 (96.7%) | 3 (3.3%) |
| 10 to 14 Year Olds | 79 (94.1%) | 5 (5.9%) |
| 15 to 17 Year Olds | 72 (100.0%) | 0 (0.0%) |
| 18 to 19 Year Olds | 45 (100.0%) | 0 (0.0%) |
| 20 to 24 Year Olds | 55 (85.9%) | 9 (14.1%) |
| 25 to 34 Year Olds | 33 (84.6%) | 6 (15.4%) |
| 35 Years and over | 0 (0.0%) | 14 (100.0%) |
| Total | 396 (84.6%) | 72 (15.4%) |
Educational Attainment by Field of Study in Helmetta borough
Business (191 | 25.7%), social sciences (98 | 13.2%), education (84 | 11.3%), psychology (51 | 6.9%), and communications (42 | 5.7%) are the most common fields of study among 744 individuals in Helmetta borough who have obtained a bachelor's degree or higher.
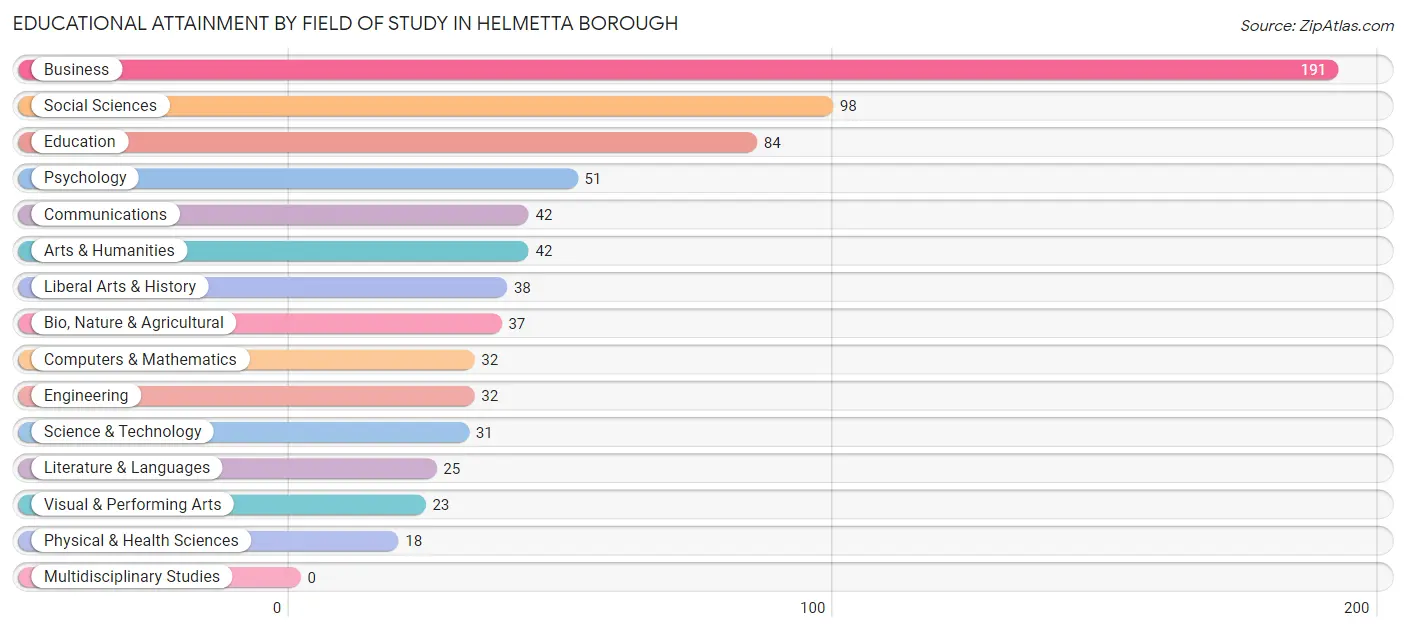
| Field of Study | # Graduates | % Graduates |
| Computers & Mathematics | 32 | 4.3% |
| Bio, Nature & Agricultural | 37 | 5.0% |
| Physical & Health Sciences | 18 | 2.4% |
| Psychology | 51 | 6.9% |
| Social Sciences | 98 | 13.2% |
| Engineering | 32 | 4.3% |
| Multidisciplinary Studies | 0 | 0.0% |
| Science & Technology | 31 | 4.2% |
| Business | 191 | 25.7% |
| Education | 84 | 11.3% |
| Literature & Languages | 25 | 3.4% |
| Liberal Arts & History | 38 | 5.1% |
| Visual & Performing Arts | 23 | 3.1% |
| Communications | 42 | 5.7% |
| Arts & Humanities | 42 | 5.7% |
| Total | 744 | 100.0% |
Transportation & Commute in Helmetta borough
Vehicle Availability by Sex in Helmetta borough
The most prevalent vehicle ownership categories in Helmetta borough are males with 2 vehicles (301, accounting for 45.3%) and females with 2 vehicles (244, making up 49.5%).
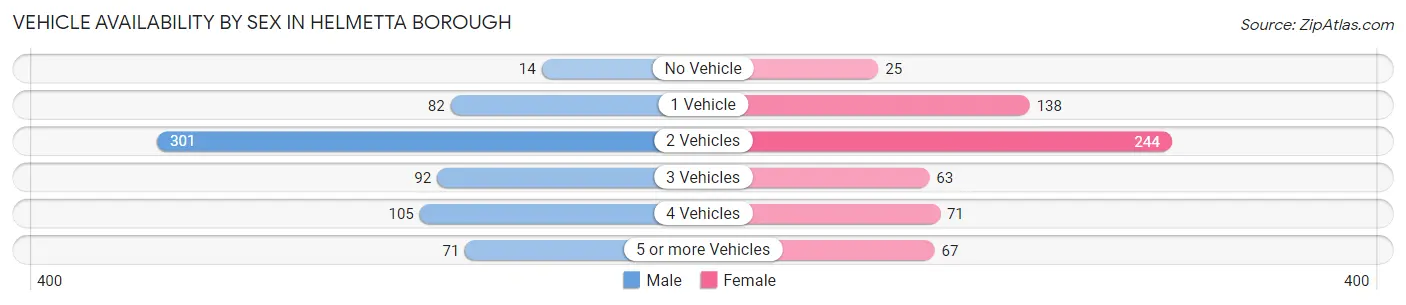
| Vehicles Available | Male | Female |
| No Vehicle | 14 (2.1%) | 25 (4.1%) |
| 1 Vehicle | 82 (12.3%) | 138 (22.7%) |
| 2 Vehicles | 301 (45.3%) | 244 (40.1%) |
| 3 Vehicles | 92 (13.8%) | 63 (10.4%) |
| 4 Vehicles | 105 (15.8%) | 71 (11.7%) |
| 5 or more Vehicles | 71 (10.7%) | 67 (11.0%) |
| Total | 665 (100.0%) | 608 (100.0%) |
Commute Time in Helmetta borough
The most frequently occuring commute durations in Helmetta borough are 30 to 34 minutes (260 commuters, 22.7%), 45 to 59 minutes (139 commuters, 12.1%), and 15 to 19 minutes (119 commuters, 10.4%).
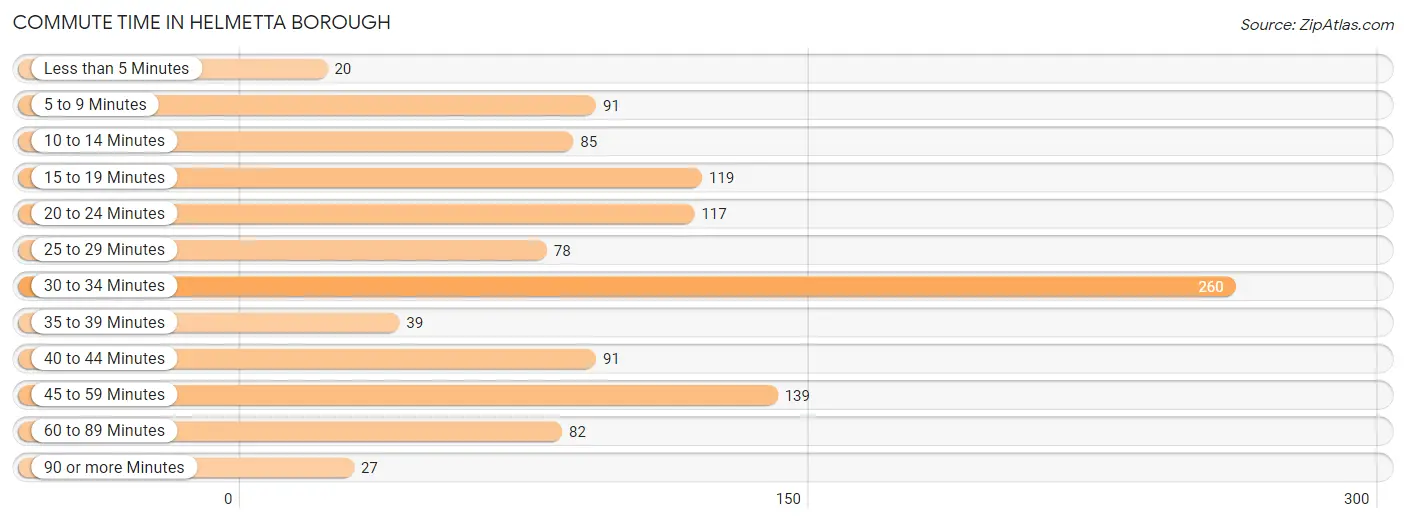
| Commute Time | # Commuters | % Commuters |
| Less than 5 Minutes | 20 | 1.7% |
| 5 to 9 Minutes | 91 | 7.9% |
| 10 to 14 Minutes | 85 | 7.4% |
| 15 to 19 Minutes | 119 | 10.4% |
| 20 to 24 Minutes | 117 | 10.2% |
| 25 to 29 Minutes | 78 | 6.8% |
| 30 to 34 Minutes | 260 | 22.7% |
| 35 to 39 Minutes | 39 | 3.4% |
| 40 to 44 Minutes | 91 | 7.9% |
| 45 to 59 Minutes | 139 | 12.1% |
| 60 to 89 Minutes | 82 | 7.1% |
| 90 or more Minutes | 27 | 2.4% |
Commute Time by Sex in Helmetta borough
The most common commute times in Helmetta borough are 30 to 34 minutes (180 commuters, 29.4%) for males and 15 to 19 minutes (85 commuters, 15.9%) for females.
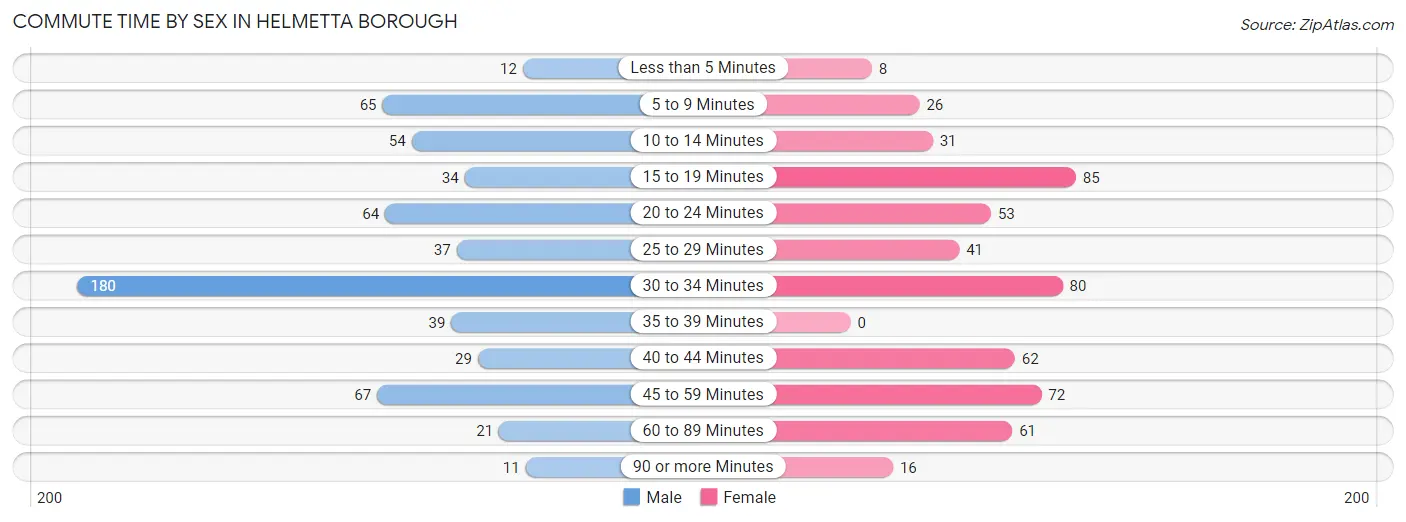
| Commute Time | Male | Female |
| Less than 5 Minutes | 12 (2.0%) | 8 (1.5%) |
| 5 to 9 Minutes | 65 (10.6%) | 26 (4.9%) |
| 10 to 14 Minutes | 54 (8.8%) | 31 (5.8%) |
| 15 to 19 Minutes | 34 (5.6%) | 85 (15.9%) |
| 20 to 24 Minutes | 64 (10.4%) | 53 (9.9%) |
| 25 to 29 Minutes | 37 (6.0%) | 41 (7.7%) |
| 30 to 34 Minutes | 180 (29.4%) | 80 (14.9%) |
| 35 to 39 Minutes | 39 (6.4%) | 0 (0.0%) |
| 40 to 44 Minutes | 29 (4.7%) | 62 (11.6%) |
| 45 to 59 Minutes | 67 (10.9%) | 72 (13.5%) |
| 60 to 89 Minutes | 21 (3.4%) | 61 (11.4%) |
| 90 or more Minutes | 11 (1.8%) | 16 (3.0%) |
Time of Departure to Work by Sex in Helmetta borough
The most frequent times of departure to work in Helmetta borough are 6:30 AM to 6:59 AM (114, 18.6%) for males and 8:00 AM to 8:29 AM (128, 23.9%) for females.
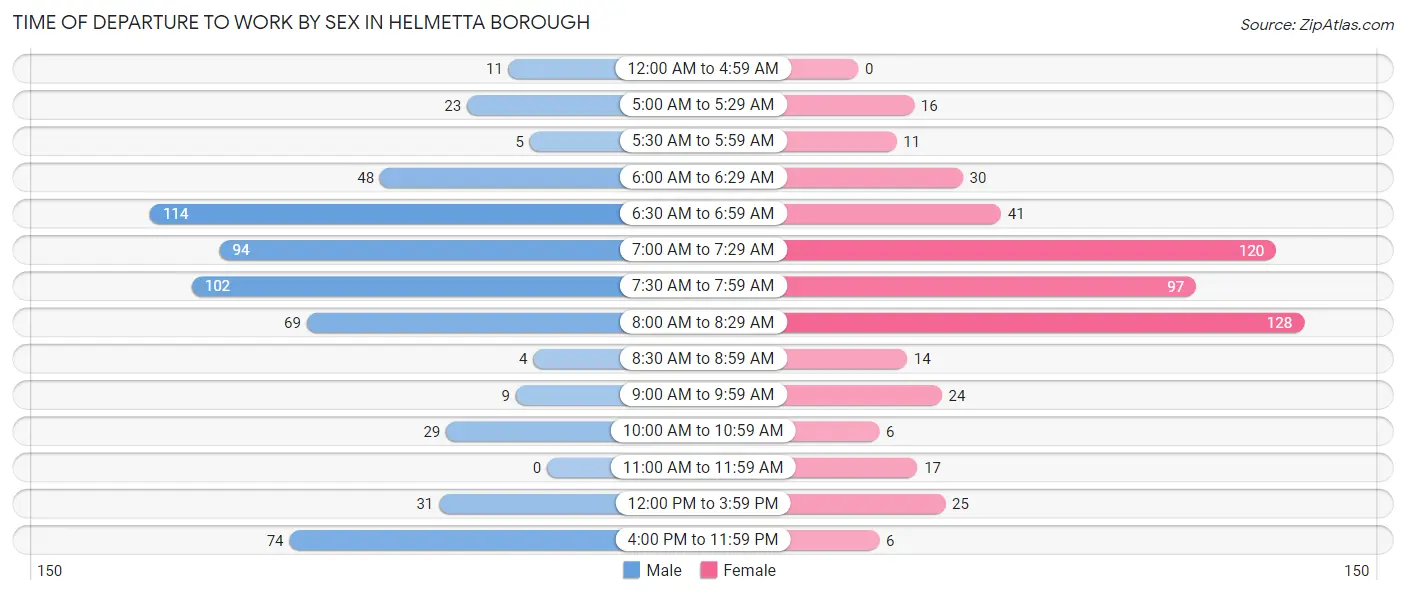
| Time of Departure | Male | Female |
| 12:00 AM to 4:59 AM | 11 (1.8%) | 0 (0.0%) |
| 5:00 AM to 5:29 AM | 23 (3.7%) | 16 (3.0%) |
| 5:30 AM to 5:59 AM | 5 (0.8%) | 11 (2.1%) |
| 6:00 AM to 6:29 AM | 48 (7.8%) | 30 (5.6%) |
| 6:30 AM to 6:59 AM | 114 (18.6%) | 41 (7.7%) |
| 7:00 AM to 7:29 AM | 94 (15.3%) | 120 (22.4%) |
| 7:30 AM to 7:59 AM | 102 (16.6%) | 97 (18.1%) |
| 8:00 AM to 8:29 AM | 69 (11.3%) | 128 (23.9%) |
| 8:30 AM to 8:59 AM | 4 (0.6%) | 14 (2.6%) |
| 9:00 AM to 9:59 AM | 9 (1.5%) | 24 (4.5%) |
| 10:00 AM to 10:59 AM | 29 (4.7%) | 6 (1.1%) |
| 11:00 AM to 11:59 AM | 0 (0.0%) | 17 (3.2%) |
| 12:00 PM to 3:59 PM | 31 (5.1%) | 25 (4.7%) |
| 4:00 PM to 11:59 PM | 74 (12.1%) | 6 (1.1%) |
| Total | 613 (100.0%) | 535 (100.0%) |
Housing Occupancy in Helmetta borough
Occupancy by Ownership in Helmetta borough
Of the total 968 dwellings in Helmetta borough, owner-occupied units account for 677 (69.9%), while renter-occupied units make up 291 (30.1%).
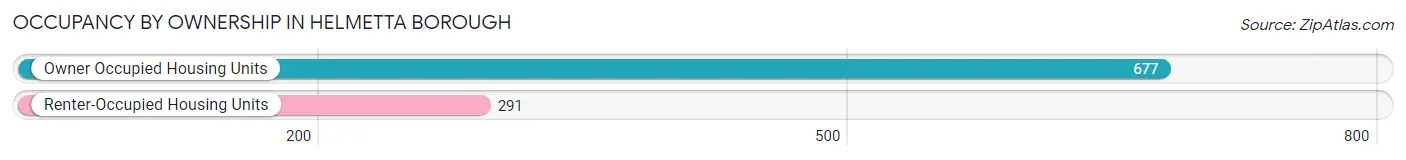
| Occupancy | # Housing Units | % Housing Units |
| Owner Occupied Housing Units | 677 | 69.9% |
| Renter-Occupied Housing Units | 291 | 30.1% |
| Total Occupied Housing Units | 968 | 100.0% |
Occupancy by Household Size in Helmetta borough
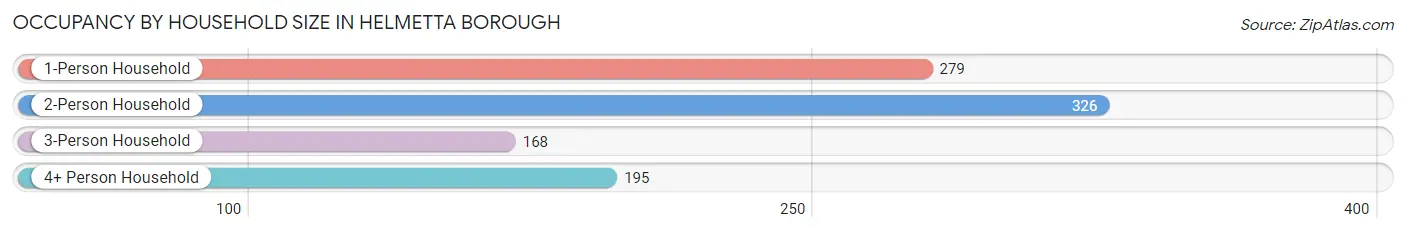
| Household Size | # Housing Units | % Housing Units |
| 1-Person Household | 279 | 28.8% |
| 2-Person Household | 326 | 33.7% |
| 3-Person Household | 168 | 17.4% |
| 4+ Person Household | 195 | 20.1% |
| Total Housing Units | 968 | 100.0% |
Occupancy by Ownership by Household Size in Helmetta borough
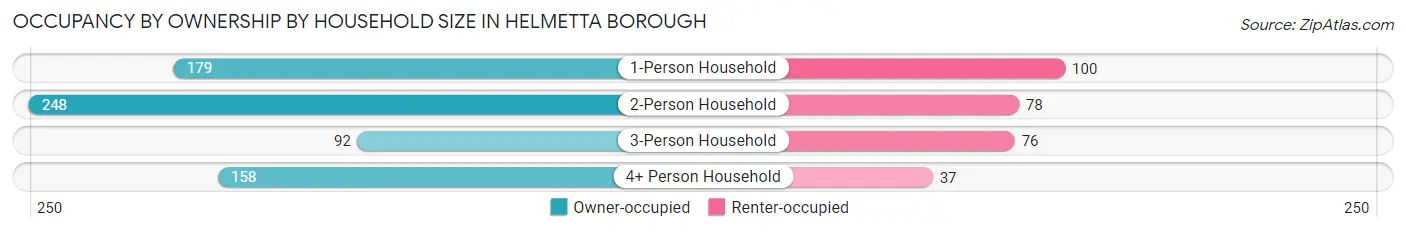
| Household Size | Owner-occupied | Renter-occupied |
| 1-Person Household | 179 (64.2%) | 100 (35.8%) |
| 2-Person Household | 248 (76.1%) | 78 (23.9%) |
| 3-Person Household | 92 (54.8%) | 76 (45.2%) |
| 4+ Person Household | 158 (81.0%) | 37 (19.0%) |
| Total Housing Units | 677 (69.9%) | 291 (30.1%) |
Occupancy by Educational Attainment in Helmetta borough
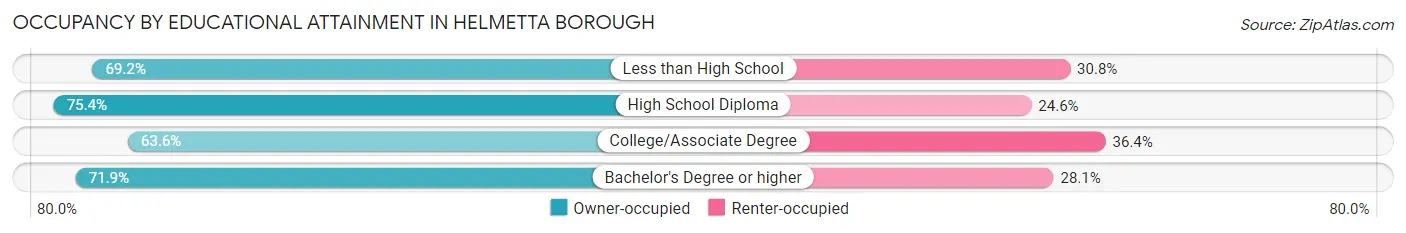
| Household Size | Owner-occupied | Renter-occupied |
| Less than High School | 36 (69.2%) | 16 (30.8%) |
| High School Diploma | 150 (75.4%) | 49 (24.6%) |
| College/Associate Degree | 187 (63.6%) | 107 (36.4%) |
| Bachelor's Degree or higher | 304 (71.9%) | 119 (28.1%) |
Occupancy by Age of Householder in Helmetta borough
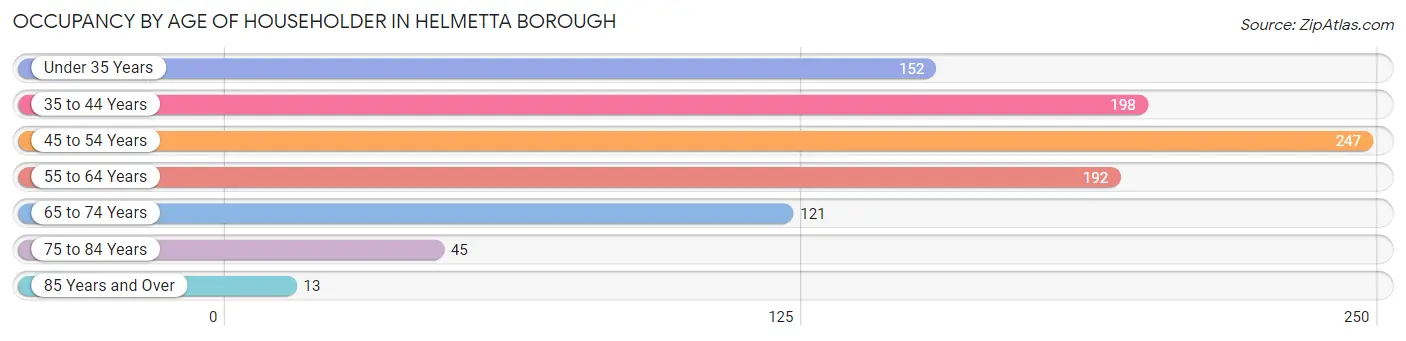
| Age Bracket | # Households | % Households |
| Under 35 Years | 152 | 15.7% |
| 35 to 44 Years | 198 | 20.4% |
| 45 to 54 Years | 247 | 25.5% |
| 55 to 64 Years | 192 | 19.8% |
| 65 to 74 Years | 121 | 12.5% |
| 75 to 84 Years | 45 | 4.6% |
| 85 Years and Over | 13 | 1.3% |
| Total | 968 | 100.0% |
Housing Finances in Helmetta borough
Median Income by Occupancy in Helmetta borough
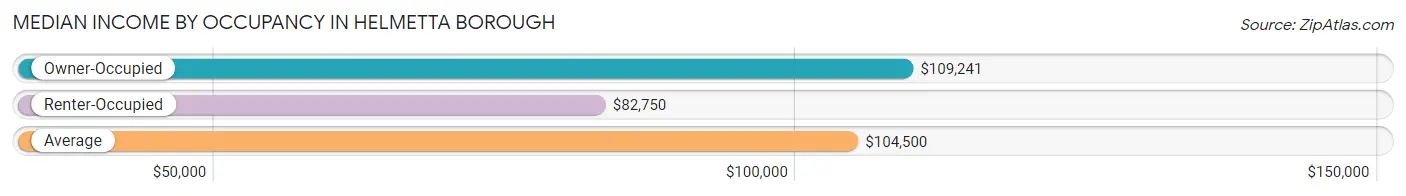
| Occupancy Type | # Households | Median Income |
| Owner-Occupied | 677 (69.9%) | $109,241 |
| Renter-Occupied | 291 (30.1%) | $82,750 |
| Average | 968 (100.0%) | $104,500 |
Occupancy by Householder Income Bracket in Helmetta borough
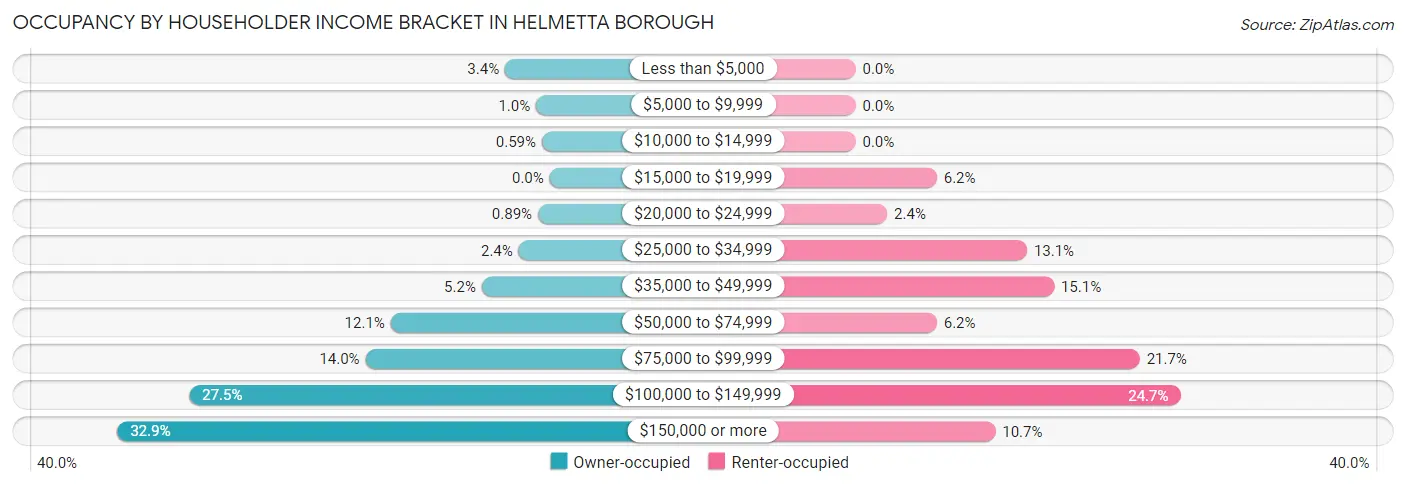
| Income Bracket | Owner-occupied | Renter-occupied |
| Less than $5,000 | 23 (3.4%) | 0 (0.0%) |
| $5,000 to $9,999 | 7 (1.0%) | 0 (0.0%) |
| $10,000 to $14,999 | 4 (0.6%) | 0 (0.0%) |
| $15,000 to $19,999 | 0 (0.0%) | 18 (6.2%) |
| $20,000 to $24,999 | 6 (0.9%) | 7 (2.4%) |
| $25,000 to $34,999 | 16 (2.4%) | 38 (13.1%) |
| $35,000 to $49,999 | 35 (5.2%) | 44 (15.1%) |
| $50,000 to $74,999 | 82 (12.1%) | 18 (6.2%) |
| $75,000 to $99,999 | 95 (14.0%) | 63 (21.6%) |
| $100,000 to $149,999 | 186 (27.5%) | 72 (24.7%) |
| $150,000 or more | 223 (32.9%) | 31 (10.6%) |
| Total | 677 (100.0%) | 291 (100.0%) |
Monthly Housing Cost Tiers in Helmetta borough
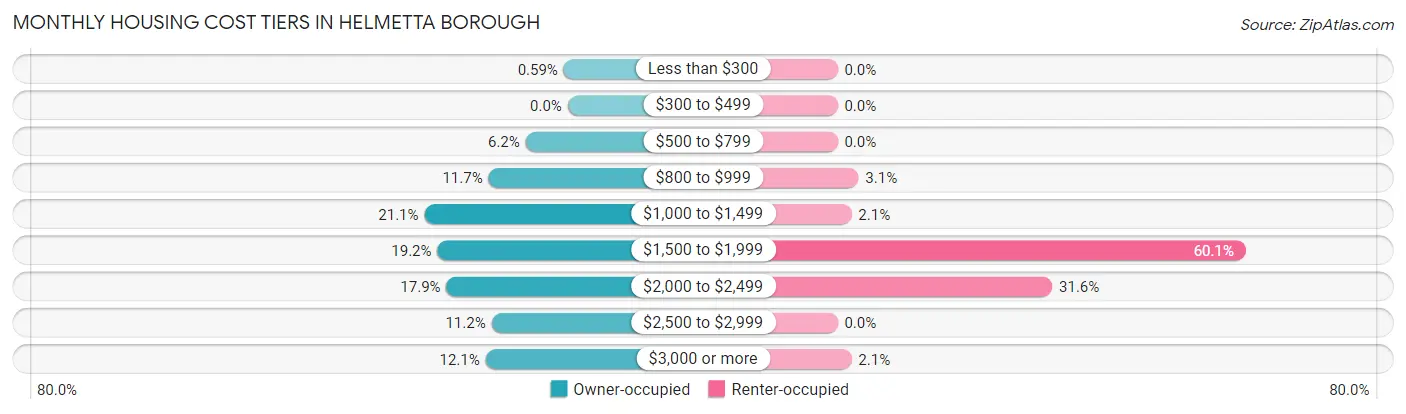
| Monthly Cost | Owner-occupied | Renter-occupied |
| Less than $300 | 4 (0.6%) | 0 (0.0%) |
| $300 to $499 | 0 (0.0%) | 0 (0.0%) |
| $500 to $799 | 42 (6.2%) | 0 (0.0%) |
| $800 to $999 | 79 (11.7%) | 9 (3.1%) |
| $1,000 to $1,499 | 143 (21.1%) | 6 (2.1%) |
| $1,500 to $1,999 | 130 (19.2%) | 175 (60.1%) |
| $2,000 to $2,499 | 121 (17.9%) | 92 (31.6%) |
| $2,500 to $2,999 | 76 (11.2%) | 0 (0.0%) |
| $3,000 or more | 82 (12.1%) | 6 (2.1%) |
| Total | 677 (100.0%) | 291 (100.0%) |
Physical Housing Characteristics in Helmetta borough
Housing Structures in Helmetta borough
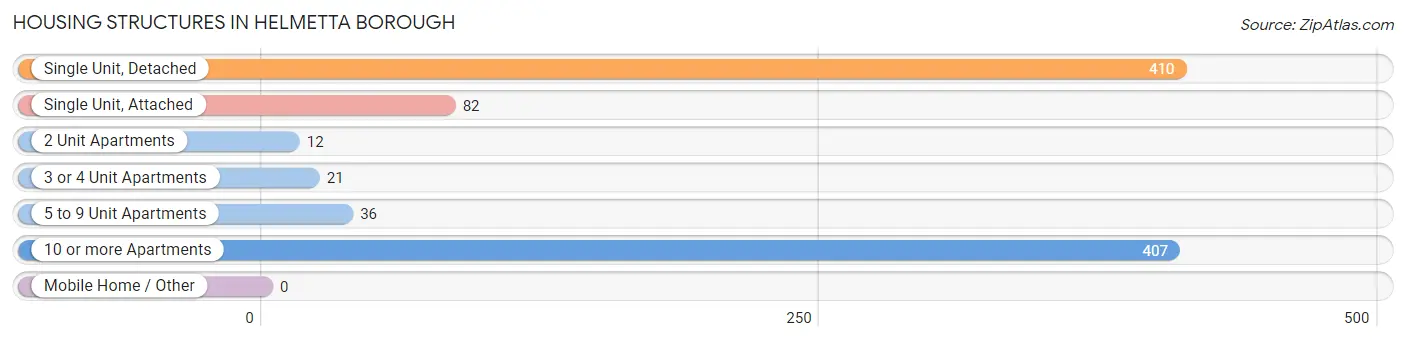
| Structure Type | # Housing Units | % Housing Units |
| Single Unit, Detached | 410 | 42.4% |
| Single Unit, Attached | 82 | 8.5% |
| 2 Unit Apartments | 12 | 1.2% |
| 3 or 4 Unit Apartments | 21 | 2.2% |
| 5 to 9 Unit Apartments | 36 | 3.7% |
| 10 or more Apartments | 407 | 42.0% |
| Mobile Home / Other | 0 | 0.0% |
| Total | 968 | 100.0% |
Housing Structures by Occupancy in Helmetta borough
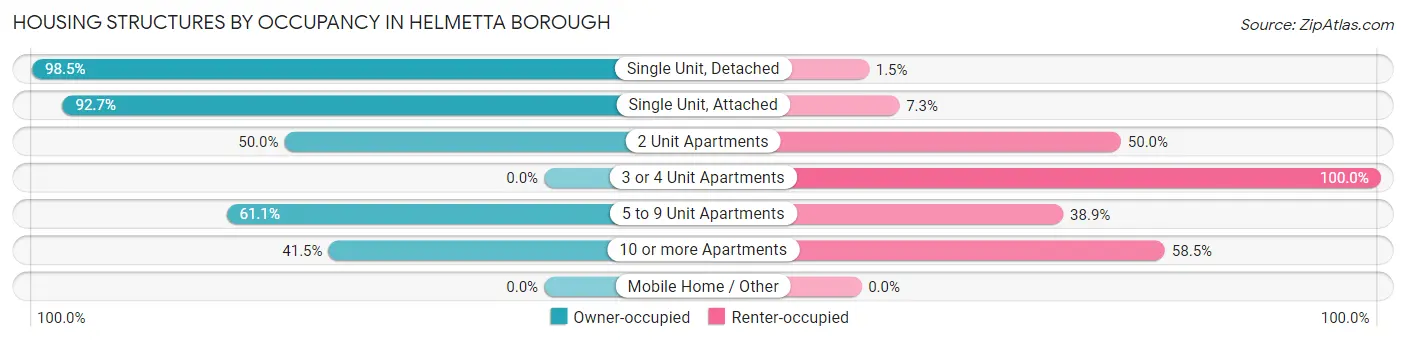
| Structure Type | Owner-occupied | Renter-occupied |
| Single Unit, Detached | 404 (98.5%) | 6 (1.5%) |
| Single Unit, Attached | 76 (92.7%) | 6 (7.3%) |
| 2 Unit Apartments | 6 (50.0%) | 6 (50.0%) |
| 3 or 4 Unit Apartments | 0 (0.0%) | 21 (100.0%) |
| 5 to 9 Unit Apartments | 22 (61.1%) | 14 (38.9%) |
| 10 or more Apartments | 169 (41.5%) | 238 (58.5%) |
| Mobile Home / Other | 0 (0.0%) | 0 (0.0%) |
| Total | 677 (69.9%) | 291 (30.1%) |
Housing Structures by Number of Rooms in Helmetta borough
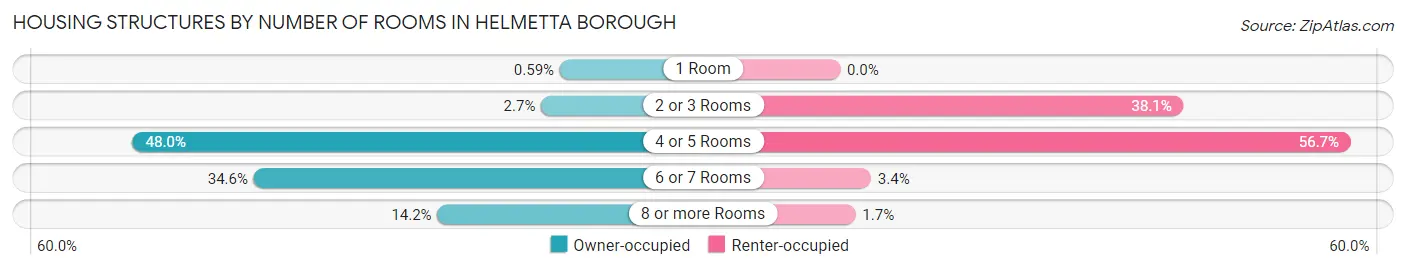
| Number of Rooms | Owner-occupied | Renter-occupied |
| 1 Room | 4 (0.6%) | 0 (0.0%) |
| 2 or 3 Rooms | 18 (2.7%) | 111 (38.1%) |
| 4 or 5 Rooms | 325 (48.0%) | 165 (56.7%) |
| 6 or 7 Rooms | 234 (34.6%) | 10 (3.4%) |
| 8 or more Rooms | 96 (14.2%) | 5 (1.7%) |
| Total | 677 (100.0%) | 291 (100.0%) |
Housing Structure by Heating Type in Helmetta borough
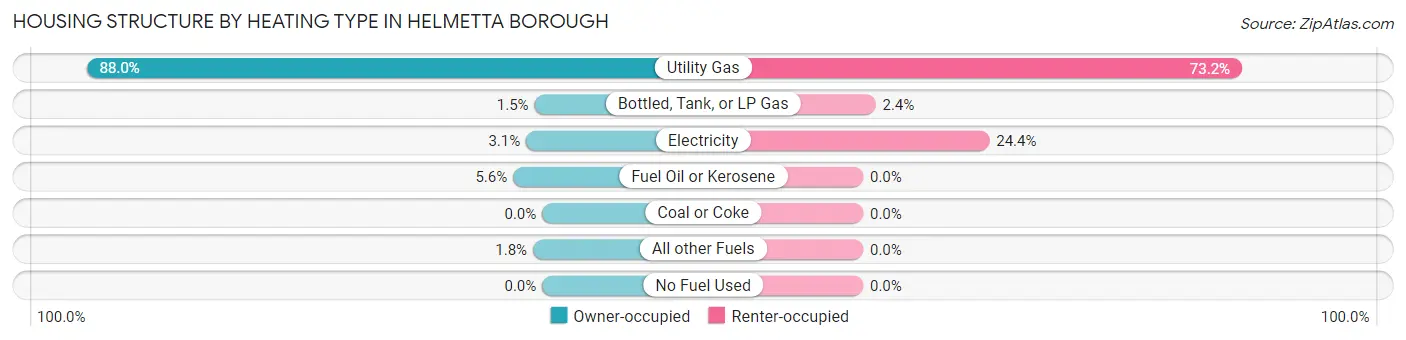
| Heating Type | Owner-occupied | Renter-occupied |
| Utility Gas | 596 (88.0%) | 213 (73.2%) |
| Bottled, Tank, or LP Gas | 10 (1.5%) | 7 (2.4%) |
| Electricity | 21 (3.1%) | 71 (24.4%) |
| Fuel Oil or Kerosene | 38 (5.6%) | 0 (0.0%) |
| Coal or Coke | 0 (0.0%) | 0 (0.0%) |
| All other Fuels | 12 (1.8%) | 0 (0.0%) |
| No Fuel Used | 0 (0.0%) | 0 (0.0%) |
| Total | 677 (100.0%) | 291 (100.0%) |
Household Vehicle Usage in Helmetta borough
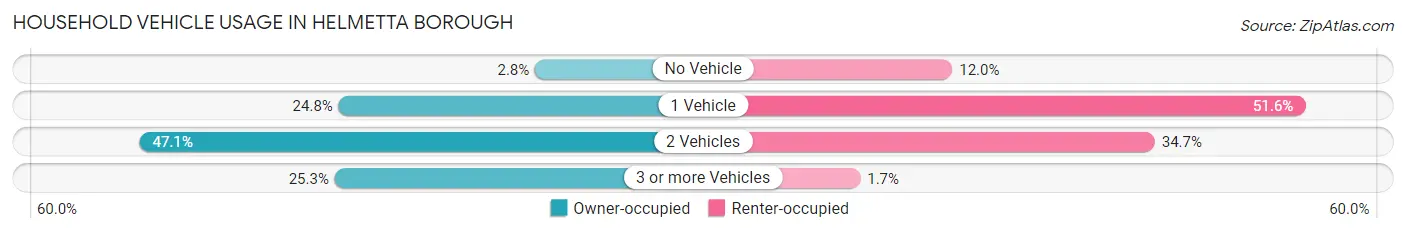
| Vehicles per Household | Owner-occupied | Renter-occupied |
| No Vehicle | 19 (2.8%) | 35 (12.0%) |
| 1 Vehicle | 168 (24.8%) | 150 (51.5%) |
| 2 Vehicles | 319 (47.1%) | 101 (34.7%) |
| 3 or more Vehicles | 171 (25.3%) | 5 (1.7%) |
| Total | 677 (100.0%) | 291 (100.0%) |
Real Estate & Mortgages in Helmetta borough
Real Estate and Mortgage Overview in Helmetta borough
| Characteristic | Without Mortgage | With Mortgage |
| Housing Units | 240 | 437 |
| Median Property Value | $280,000 | $311,100 |
| Median Household Income | $95,417 | $174 |
| Monthly Housing Costs | $989 | $82 |
| Real Estate Taxes | $7,070 | $4 |
Property Value by Mortgage Status in Helmetta borough
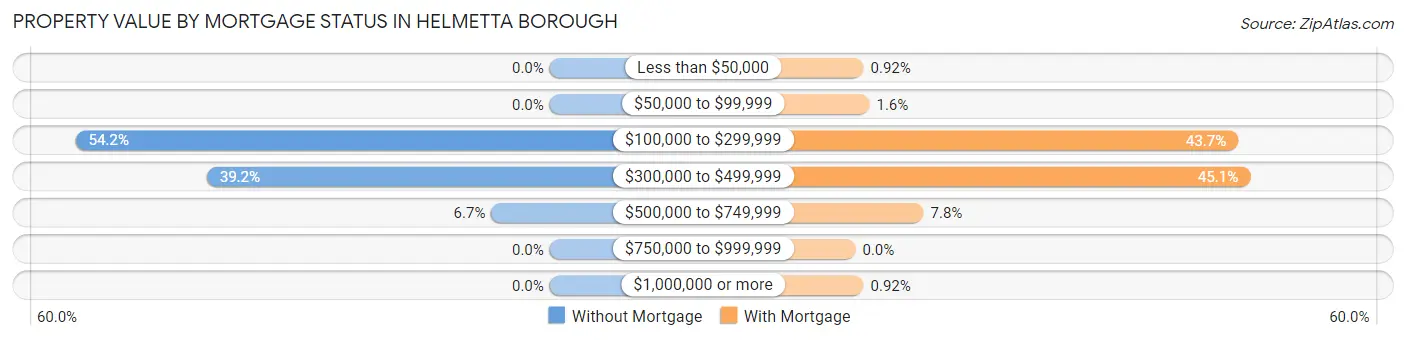
| Property Value | Without Mortgage | With Mortgage |
| Less than $50,000 | 0 (0.0%) | 4 (0.9%) |
| $50,000 to $99,999 | 0 (0.0%) | 7 (1.6%) |
| $100,000 to $299,999 | 130 (54.2%) | 191 (43.7%) |
| $300,000 to $499,999 | 94 (39.2%) | 197 (45.1%) |
| $500,000 to $749,999 | 16 (6.7%) | 34 (7.8%) |
| $750,000 to $999,999 | 0 (0.0%) | 0 (0.0%) |
| $1,000,000 or more | 0 (0.0%) | 4 (0.9%) |
| Total | 240 (100.0%) | 437 (100.0%) |
Household Income by Mortgage Status in Helmetta borough
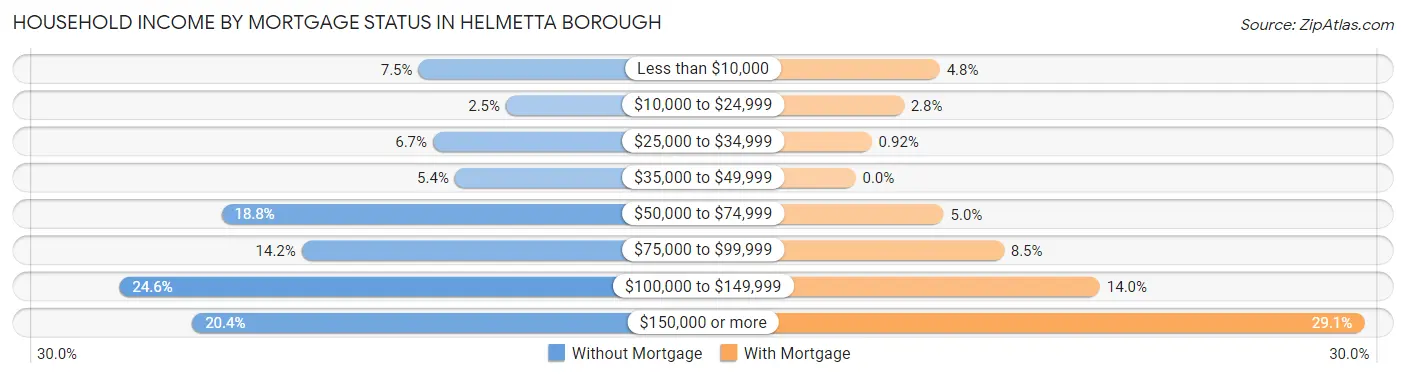
| Household Income | Without Mortgage | With Mortgage |
| Less than $10,000 | 18 (7.5%) | 21 (4.8%) |
| $10,000 to $24,999 | 6 (2.5%) | 12 (2.8%) |
| $25,000 to $34,999 | 16 (6.7%) | 4 (0.9%) |
| $35,000 to $49,999 | 13 (5.4%) | 0 (0.0%) |
| $50,000 to $74,999 | 45 (18.8%) | 22 (5.0%) |
| $75,000 to $99,999 | 34 (14.2%) | 37 (8.5%) |
| $100,000 to $149,999 | 59 (24.6%) | 61 (14.0%) |
| $150,000 or more | 49 (20.4%) | 127 (29.1%) |
| Total | 240 (100.0%) | 437 (100.0%) |
Property Value to Household Income Ratio in Helmetta borough
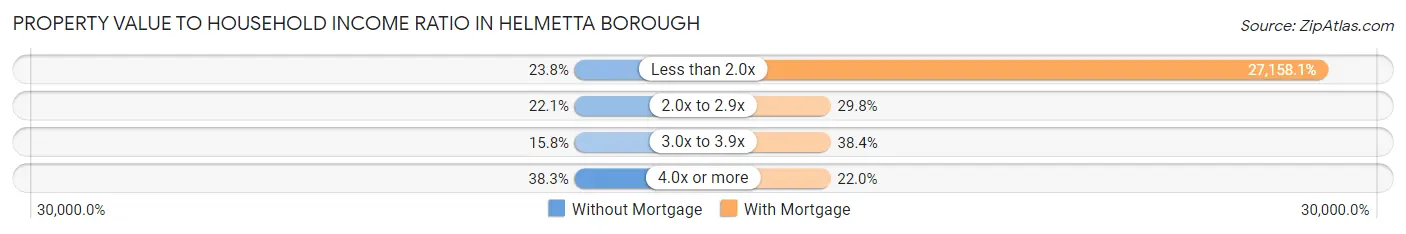
| Value-to-Income Ratio | Without Mortgage | With Mortgage |
| Less than 2.0x | 57 (23.7%) | 118,681 (27,158.1%) |
| 2.0x to 2.9x | 53 (22.1%) | 130 (29.7%) |
| 3.0x to 3.9x | 38 (15.8%) | 168 (38.4%) |
| 4.0x or more | 92 (38.3%) | 96 (22.0%) |
| Total | 240 (100.0%) | 437 (100.0%) |
Real Estate Taxes by Mortgage Status in Helmetta borough
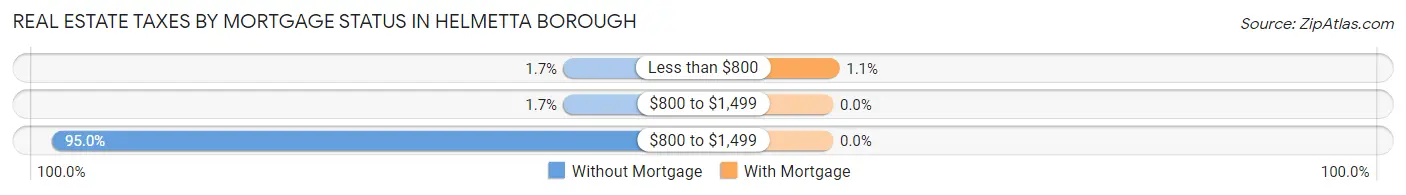
| Property Taxes | Without Mortgage | With Mortgage |
| Less than $800 | 4 (1.7%) | 5 (1.1%) |
| $800 to $1,499 | 4 (1.7%) | 0 (0.0%) |
| $800 to $1,499 | 228 (95.0%) | 0 (0.0%) |
| Total | 240 (100.0%) | 437 (100.0%) |
Health & Disability in Helmetta borough
Health Insurance Coverage by Age in Helmetta borough
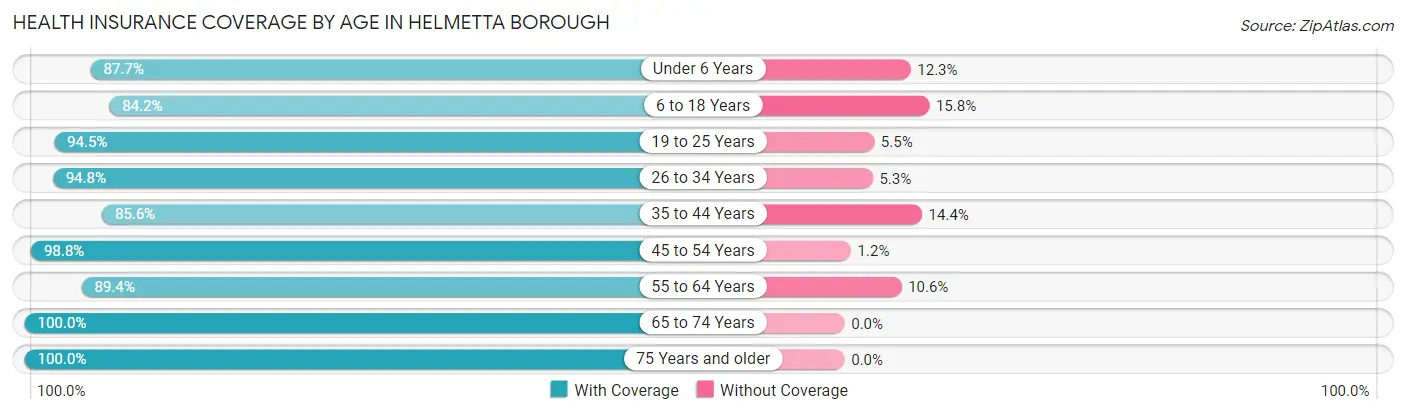
| Age Bracket | With Coverage | Without Coverage |
| Under 6 Years | 178 (87.7%) | 25 (12.3%) |
| 6 to 18 Years | 208 (84.2%) | 39 (15.8%) |
| 19 to 25 Years | 171 (94.5%) | 10 (5.5%) |
| 26 to 34 Years | 325 (94.8%) | 18 (5.2%) |
| 35 to 44 Years | 255 (85.6%) | 43 (14.4%) |
| 45 to 54 Years | 416 (98.8%) | 5 (1.2%) |
| 55 to 64 Years | 278 (89.4%) | 33 (10.6%) |
| 65 to 74 Years | 206 (100.0%) | 0 (0.0%) |
| 75 Years and older | 92 (100.0%) | 0 (0.0%) |
| Total | 2,129 (92.5%) | 173 (7.5%) |
Health Insurance Coverage by Citizenship Status in Helmetta borough
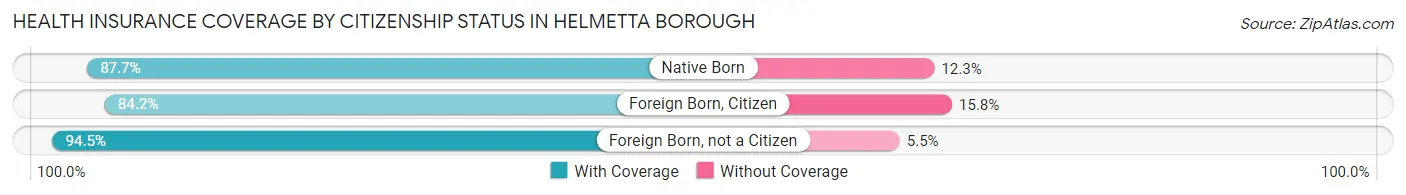
| Citizenship Status | With Coverage | Without Coverage |
| Native Born | 178 (87.7%) | 25 (12.3%) |
| Foreign Born, Citizen | 208 (84.2%) | 39 (15.8%) |
| Foreign Born, not a Citizen | 171 (94.5%) | 10 (5.5%) |
Health Insurance Coverage by Household Income in Helmetta borough
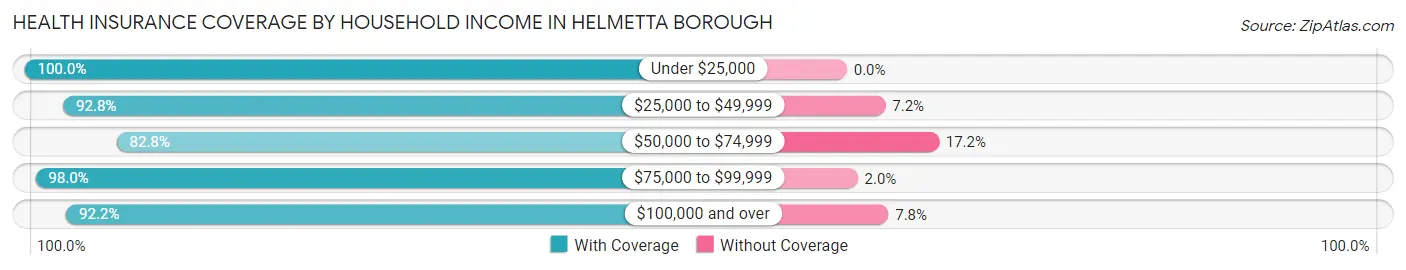
| Household Income | With Coverage | Without Coverage |
| Under $25,000 | 87 (100.0%) | 0 (0.0%) |
| $25,000 to $49,999 | 218 (92.8%) | 17 (7.2%) |
| $50,000 to $74,999 | 168 (82.8%) | 35 (17.2%) |
| $75,000 to $99,999 | 290 (98.0%) | 6 (2.0%) |
| $100,000 and over | 1,366 (92.2%) | 115 (7.8%) |
Public vs Private Health Insurance Coverage by Age in Helmetta borough
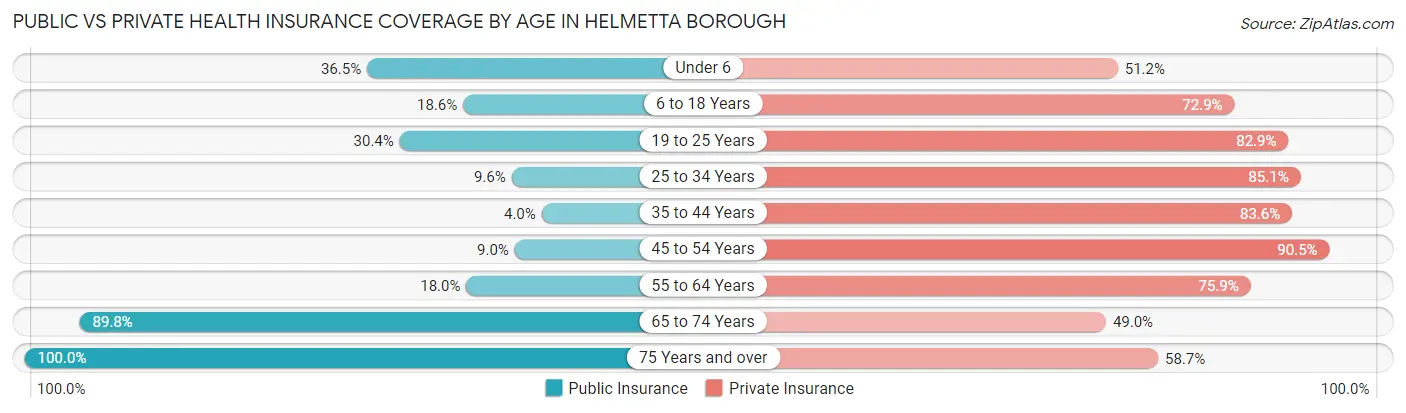
| Age Bracket | Public Insurance | Private Insurance |
| Under 6 | 74 (36.4%) | 104 (51.2%) |
| 6 to 18 Years | 46 (18.6%) | 180 (72.9%) |
| 19 to 25 Years | 55 (30.4%) | 150 (82.9%) |
| 25 to 34 Years | 33 (9.6%) | 292 (85.1%) |
| 35 to 44 Years | 12 (4.0%) | 249 (83.6%) |
| 45 to 54 Years | 38 (9.0%) | 381 (90.5%) |
| 55 to 64 Years | 56 (18.0%) | 236 (75.9%) |
| 65 to 74 Years | 185 (89.8%) | 101 (49.0%) |
| 75 Years and over | 92 (100.0%) | 54 (58.7%) |
| Total | 591 (25.7%) | 1,747 (75.9%) |
Disability Status by Sex by Age in Helmetta borough
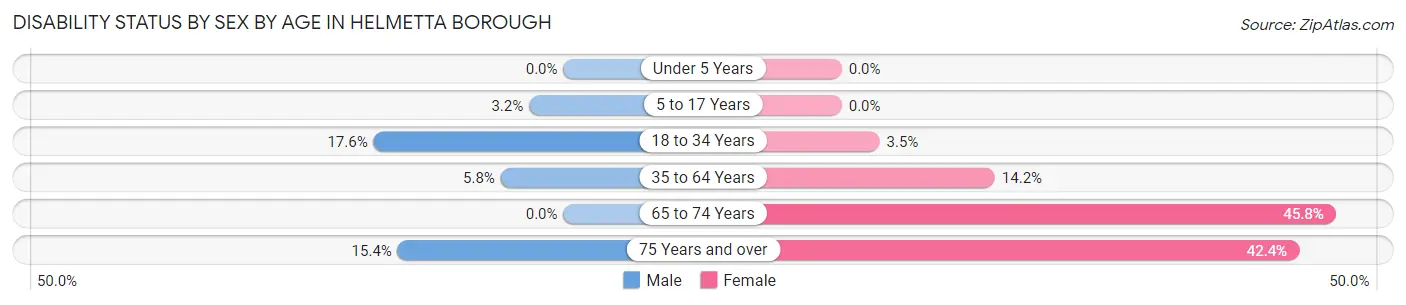
| Age Bracket | Male | Female |
| Under 5 Years | 0 (0.0%) | 0 (0.0%) |
| 5 to 17 Years | 5 (3.2%) | 0 (0.0%) |
| 18 to 34 Years | 43 (17.6%) | 10 (3.5%) |
| 35 to 64 Years | 28 (5.8%) | 78 (14.2%) |
| 65 to 74 Years | 0 (0.0%) | 44 (45.8%) |
| 75 Years and over | 4 (15.4%) | 28 (42.4%) |
Disability Class by Sex by Age in Helmetta borough
Disability Class: Hearing Difficulty
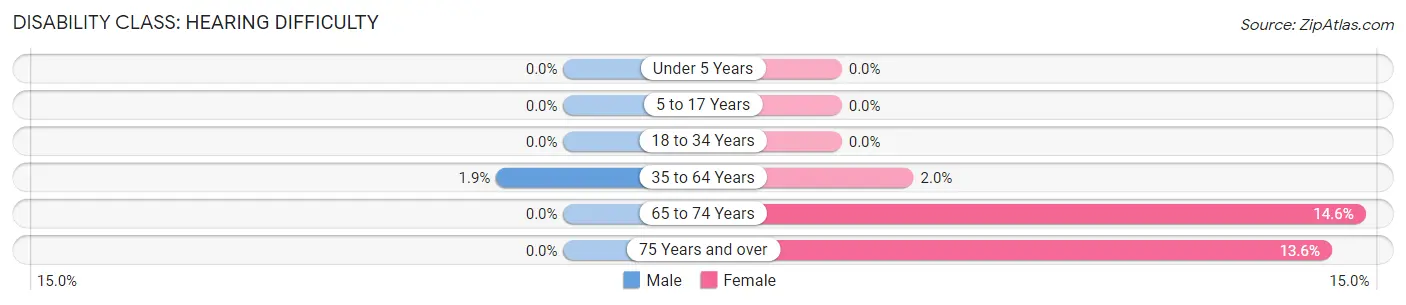
| Age Bracket | Male | Female |
| Under 5 Years | 0 (0.0%) | 0 (0.0%) |
| 5 to 17 Years | 0 (0.0%) | 0 (0.0%) |
| 18 to 34 Years | 0 (0.0%) | 0 (0.0%) |
| 35 to 64 Years | 9 (1.9%) | 11 (2.0%) |
| 65 to 74 Years | 0 (0.0%) | 14 (14.6%) |
| 75 Years and over | 0 (0.0%) | 9 (13.6%) |
Disability Class: Vision Difficulty
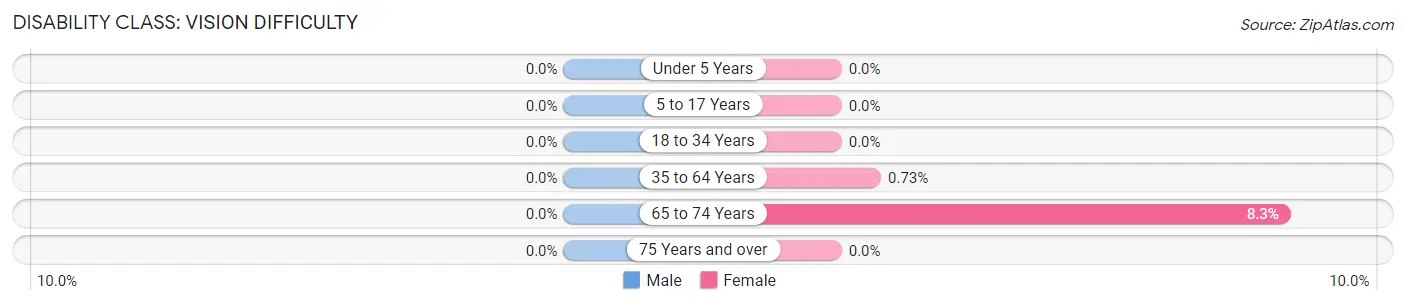
| Age Bracket | Male | Female |
| Under 5 Years | 0 (0.0%) | 0 (0.0%) |
| 5 to 17 Years | 0 (0.0%) | 0 (0.0%) |
| 18 to 34 Years | 0 (0.0%) | 0 (0.0%) |
| 35 to 64 Years | 0 (0.0%) | 4 (0.7%) |
| 65 to 74 Years | 0 (0.0%) | 8 (8.3%) |
| 75 Years and over | 0 (0.0%) | 0 (0.0%) |
Disability Class: Cognitive Difficulty
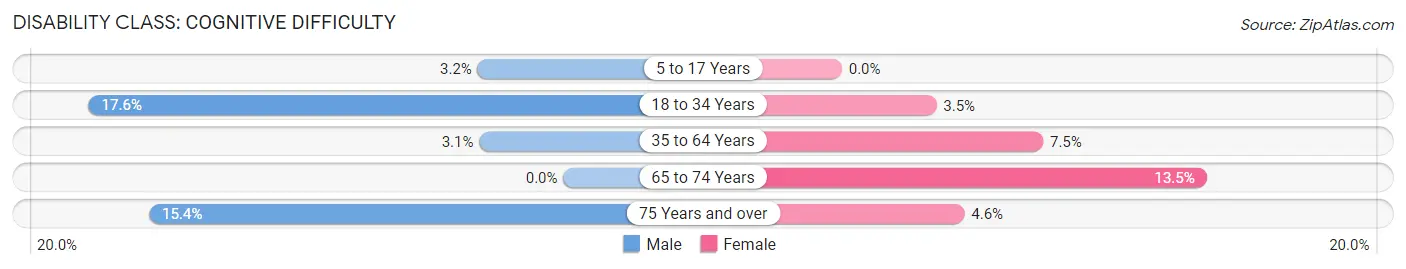
| Age Bracket | Male | Female |
| 5 to 17 Years | 5 (3.2%) | 0 (0.0%) |
| 18 to 34 Years | 43 (17.6%) | 10 (3.5%) |
| 35 to 64 Years | 15 (3.1%) | 41 (7.5%) |
| 65 to 74 Years | 0 (0.0%) | 13 (13.5%) |
| 75 Years and over | 4 (15.4%) | 3 (4.5%) |
Disability Class: Ambulatory Difficulty
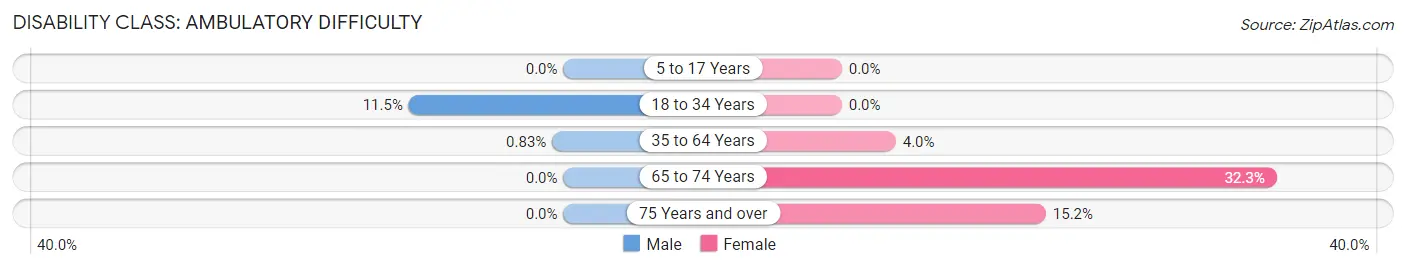
| Age Bracket | Male | Female |
| 5 to 17 Years | 0 (0.0%) | 0 (0.0%) |
| 18 to 34 Years | 28 (11.5%) | 0 (0.0%) |
| 35 to 64 Years | 4 (0.8%) | 22 (4.0%) |
| 65 to 74 Years | 0 (0.0%) | 31 (32.3%) |
| 75 Years and over | 0 (0.0%) | 10 (15.1%) |
Disability Class: Self-Care Difficulty
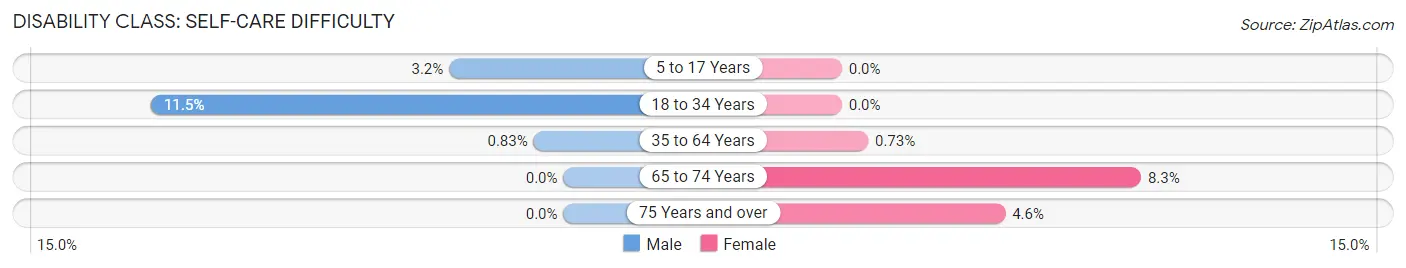
| Age Bracket | Male | Female |
| 5 to 17 Years | 5 (3.2%) | 0 (0.0%) |
| 18 to 34 Years | 28 (11.5%) | 0 (0.0%) |
| 35 to 64 Years | 4 (0.8%) | 4 (0.7%) |
| 65 to 74 Years | 0 (0.0%) | 8 (8.3%) |
| 75 Years and over | 0 (0.0%) | 3 (4.5%) |
Technology Access in Helmetta borough
Computing Device Access in Helmetta borough
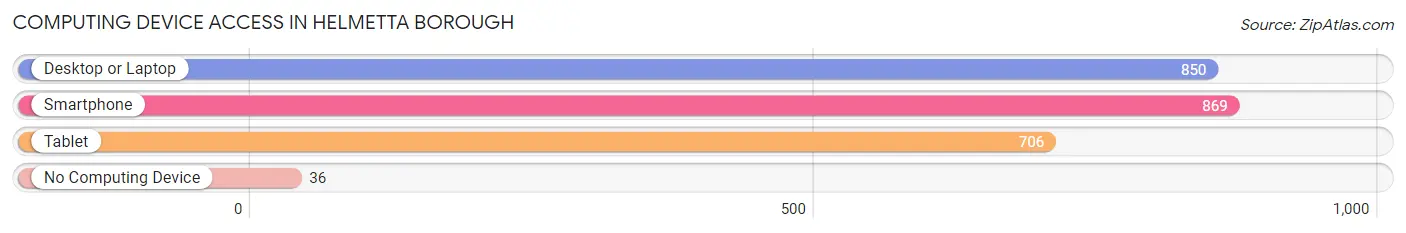
| Device Type | # Households | % Households |
| Desktop or Laptop | 850 | 87.8% |
| Smartphone | 869 | 89.8% |
| Tablet | 706 | 72.9% |
| No Computing Device | 36 | 3.7% |
| Total | 968 | 100.0% |
Internet Access in Helmetta borough
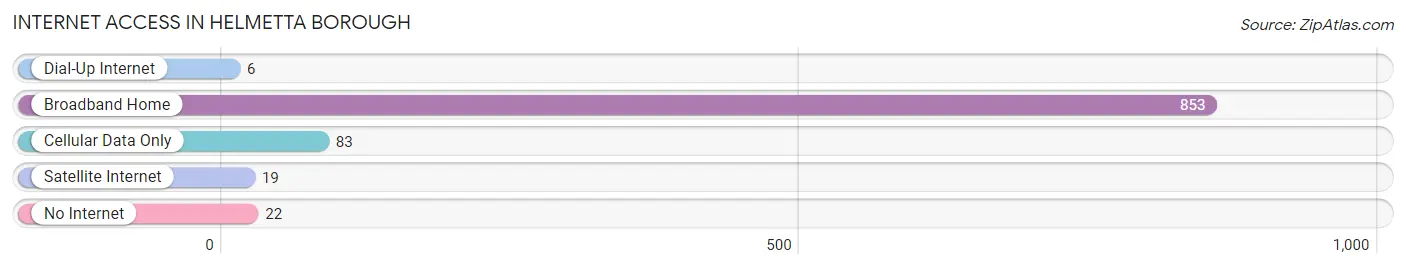
| Internet Type | # Households | % Households |
| Dial-Up Internet | 6 | 0.6% |
| Broadband Home | 853 | 88.1% |
| Cellular Data Only | 83 | 8.6% |
| Satellite Internet | 19 | 2.0% |
| No Internet | 22 | 2.3% |
| Total | 968 | 100.0% |
Helmetta borough Summary
Helmetta Borough is a small borough located in Middlesex County, New Jersey. It is situated in the southern part of the state, about 25 miles from New York City. The borough is bordered by East Brunswick Township to the north, Spotswood Borough to the east, Monroe Township to the south, and South River Borough to the west. As of the 2010 United States Census, the borough had a total population of 2,178.
Geography
Helmetta Borough is located at 40°21'25" North, 74°25'45" West (40.356944, -74.429167). It has a total area of 0.7 square miles, all of which is land. The borough is located in the Raritan Valley region of New Jersey.
The borough is located in the Raritan Valley region of New Jersey. The Raritan River forms the western border of the borough, and the South River forms the eastern border. The borough is located in the Raritan Valley region of New Jersey.
Climate
Helmetta Borough has a humid subtropical climate, with hot, humid summers and cold, wet winters. The average annual temperature is 54°F, with an average high of 79°F in July and an average low of 29°F in January. The average annual precipitation is 45.5 inches.
Demographics
As of the 2010 United States Census, there were 2,178 people, 845 households, and 590 families residing in the borough. The population density was 3,093.3 people per square mile. There were 845 housing units at an average density of 1,203.3 per square mile. The racial makeup of the borough was 87.2% White, 5.2% African American, 0.2% Native American, 2.2% Asian, 0.1% Pacific Islander, 3.2% from other races, and 1.9% from two or more races. Hispanic or Latino of any race were 8.7% of the population.
There were 845 households, out of which 28.2% had children under the age of 18 living with them, 51.2% were married couples living together, 12.2% had a female householder with no husband present, and 30.7% were non-families. 24.7% of all households were made up of individuals, and 10.2% had someone living alone who was 65 years of age or older. The average household size was 2.58 and the average family size was 3.09.
In the borough, the population was spread out, with 22.2% under the age of 18, 7.2% from 18 to 24, 28.2% from 25 to 44, 28.2% from 45 to 64, and 14.2% who were 65 years of age or older. The median age was 40 years. For every 100 females, there were 95.2 males. For every 100 females age 18 and over, there were 92.3 males.
The median income for a household in the borough was $60,000, and the median income for a family was $68,750. Males had a median income of $45,000 versus $35,000 for females. The per capita income for the borough was $25,945. About 4.2% of families and 5.2% of the population were below the poverty line, including 6.2% of those under age 18 and 5.2% of those age 65 or over.
Economy
Helmetta Borough is home to several small businesses, including a few restaurants, a gas station, a convenience store, and a few small retail stores. The borough is also home to a few industrial businesses, including a plastics manufacturer and a metal fabrication shop.
The borough is served by the New Jersey Transit bus system, which provides service to New York City and other nearby towns. The closest airport is Newark Liberty International Airport, located about 25 miles away.
The borough is home to a few parks, including the Helmetta Park, which features a playground, basketball court, and picnic area. The borough also has a few public schools, including the Helmetta Elementary School and the Helmetta Middle School.
Conclusion
Helmetta Borough is a small borough located in Middlesex County, New Jersey. It is situated in the southern part of the state, about 25 miles from New York City. The borough has a total population of 2,178, and is home to several small businesses, including restaurants, gas stations, convenience stores, and retail stores. The borough is served by the New Jersey Transit bus system, and is home to a few parks and public schools. The borough has a humid subtropical climate, with hot, humid summers and cold, wet winters. The median income for a household in the borough is $60,000, and the median income for a family is $68,750.
Common Questions
What is the Total Population of Helmetta borough?
Total Population of Helmetta borough is 2,302.
What is the Total Male Population of Helmetta borough?
Total Male Population of Helmetta borough is 1,154.
What is the Total Female Population of Helmetta borough?
Total Female Population of Helmetta borough is 1,148.
What is the Ratio of Males per 100 Females in Helmetta borough?
There are 100.52 Males per 100 Females in Helmetta borough.
What is the Ratio of Females per 100 Males in Helmetta borough?
There are 99.48 Females per 100 Males in Helmetta borough.
What is the Median Population Age in Helmetta borough?
Median Population Age in Helmetta borough is 39.0 Years.
What is the Average Family Size in Helmetta borough
Average Family Size in Helmetta borough is 3.0 People.
What is the Average Household Size in Helmetta borough
Average Household Size in Helmetta borough is 2.4 People.
What is Per Capita Income in Helmetta borough?
Per Capita income in Helmetta borough is $50,000.
What is the Median Family Income in Helmetta borough?
Median Family Income in Helmetta borough is $113,041.
What is the Median Household income in Helmetta borough?
Median Household Income in Helmetta borough is $104,500.
What is Income or Wage Gap in Helmetta borough?
Income or Wage Gap in Helmetta borough is 8.3%.
Women in Helmetta borough earn 91.7 cents for every dollar earned by a man.
What is Inequality or Gini Index in Helmetta borough?
Inequality or Gini Index in Helmetta borough is 0.37.
How Large is the Labor Force in Helmetta borough?
There are 1,410 People in the Labor Forcein in Helmetta borough.
What is the Percentage of People in the Labor Force in Helmetta borough?
73.6% of People are in the Labor Force in Helmetta borough.
What is the Unemployment Rate in Helmetta borough?
Unemployment Rate in Helmetta borough is 6.4%.