Cedar Point, NC
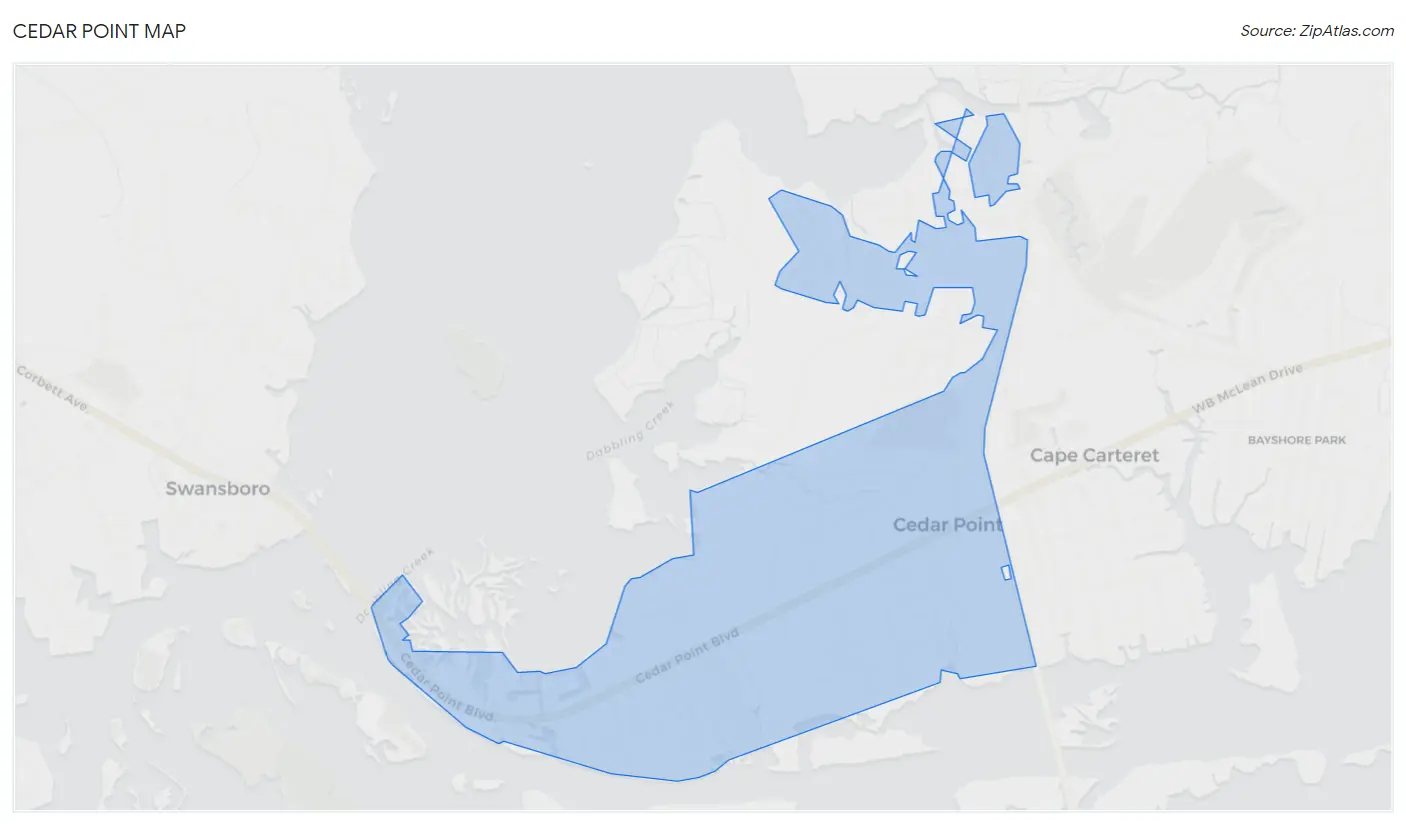
Cedar Point Map
Cedar Point Overview
2,198
TOTAL POPULATION
1,053
MALE POPULATION
1,145
FEMALE POPULATION
91.97
MALES / 100 FEMALES
108.74
FEMALES / 100 MALES
41.8
MEDIAN AGE
3.2
AVG FAMILY SIZE
2.7
AVG HOUSEHOLD SIZE
$43,149
PER CAPITA INCOME
$102,692
AVG FAMILY INCOME
$87,981
AVG HOUSEHOLD INCOME
44.4%
WAGE / INCOME GAP [ % ]
55.6¢/ $1
WAGE / INCOME GAP [ $ ]
0.44
INEQUALITY / GINI INDEX
964
LABOR FORCE [ PEOPLE ]
59.7%
PERCENT IN LABOR FORCE
4.1%
UNEMPLOYMENT RATE
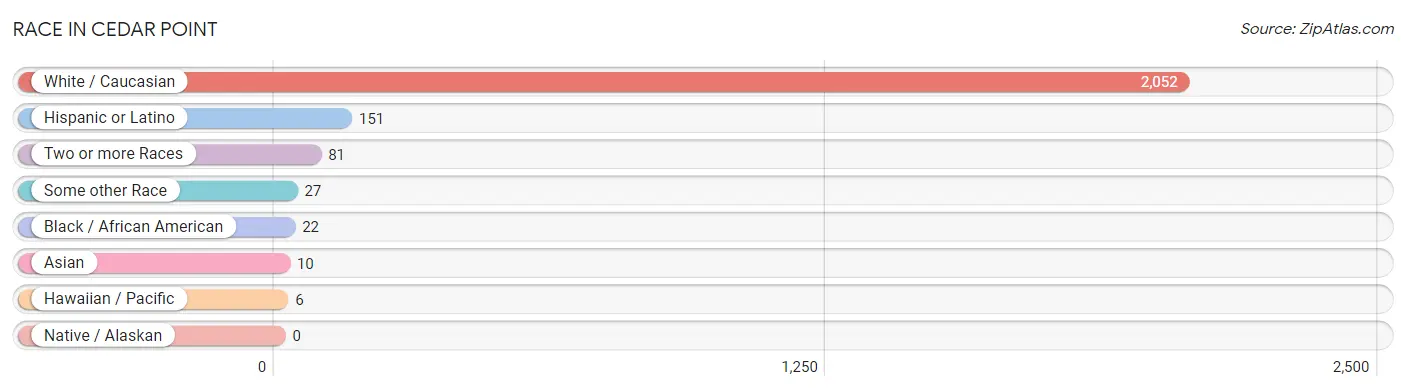
Race in Cedar Point
The most populous races in Cedar Point are White / Caucasian (2,052 | 93.4%), Hispanic or Latino (151 | 6.9%), and Two or more Races (81 | 3.7%).
| Race | # Population | % Population |
| Asian | 10 | 0.4% |
| Black / African American | 22 | 1.0% |
| Hawaiian / Pacific | 6 | 0.3% |
| Hispanic or Latino | 151 | 6.9% |
| Native / Alaskan | 0 | 0.0% |
| White / Caucasian | 2,052 | 93.4% |
| Two or more Races | 81 | 3.7% |
| Some other Race | 27 | 1.2% |
| Total | 2,198 | 100.0% |
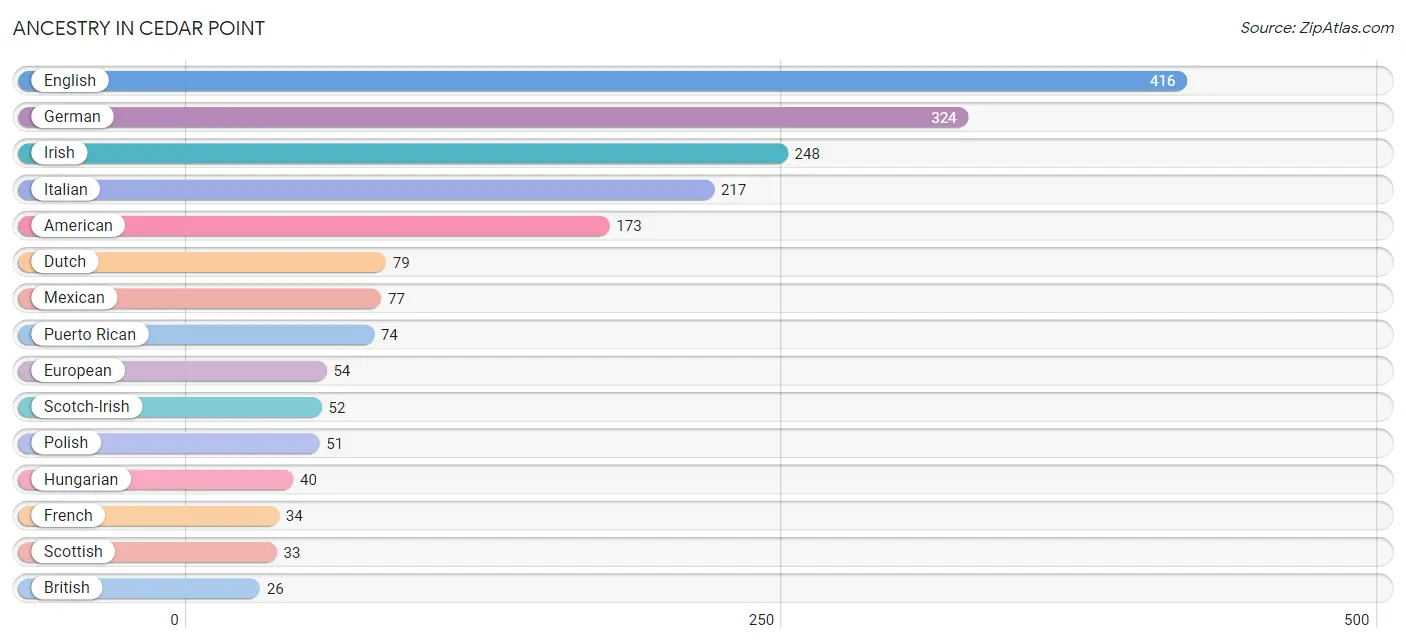
Ancestry in Cedar Point
The most populous ancestries reported in Cedar Point are English (416 | 18.9%), German (324 | 14.7%), Irish (248 | 11.3%), Italian (217 | 9.9%), and American (173 | 7.9%), together accounting for 62.7% of all Cedar Point residents.
| Ancestry | # Population | % Population |
| American | 173 | 7.9% |
| Austrian | 18 | 0.8% |
| British | 26 | 1.2% |
| Burmese | 17 | 0.8% |
| Canadian | 3 | 0.1% |
| Cherokee | 4 | 0.2% |
| Czechoslovakian | 3 | 0.1% |
| Dutch | 79 | 3.6% |
| Eastern European | 23 | 1.1% |
| English | 416 | 18.9% |
| European | 54 | 2.5% |
| French | 34 | 1.5% |
| French Canadian | 6 | 0.3% |
| German | 324 | 14.7% |
| Guamanian / Chamorro | 17 | 0.8% |
| Guyanese | 10 | 0.4% |
| Hungarian | 40 | 1.8% |
| Irish | 248 | 11.3% |
| Italian | 217 | 9.9% |
| Korean | 19 | 0.9% |
| Latvian | 4 | 0.2% |
| Lithuanian | 3 | 0.1% |
| Mexican | 77 | 3.5% |
| Norwegian | 8 | 0.4% |
| Polish | 51 | 2.3% |
| Puerto Rican | 74 | 3.4% |
| Russian | 13 | 0.6% |
| Scotch-Irish | 52 | 2.4% |
| Scottish | 33 | 1.5% |
| Serbian | 3 | 0.1% |
| Slovak | 21 | 1.0% |
| Sri Lankan | 2 | 0.1% |
| Swedish | 16 | 0.7% |
| Ukrainian | 7 | 0.3% |
| Welsh | 24 | 1.1% | View All 35 Rows |
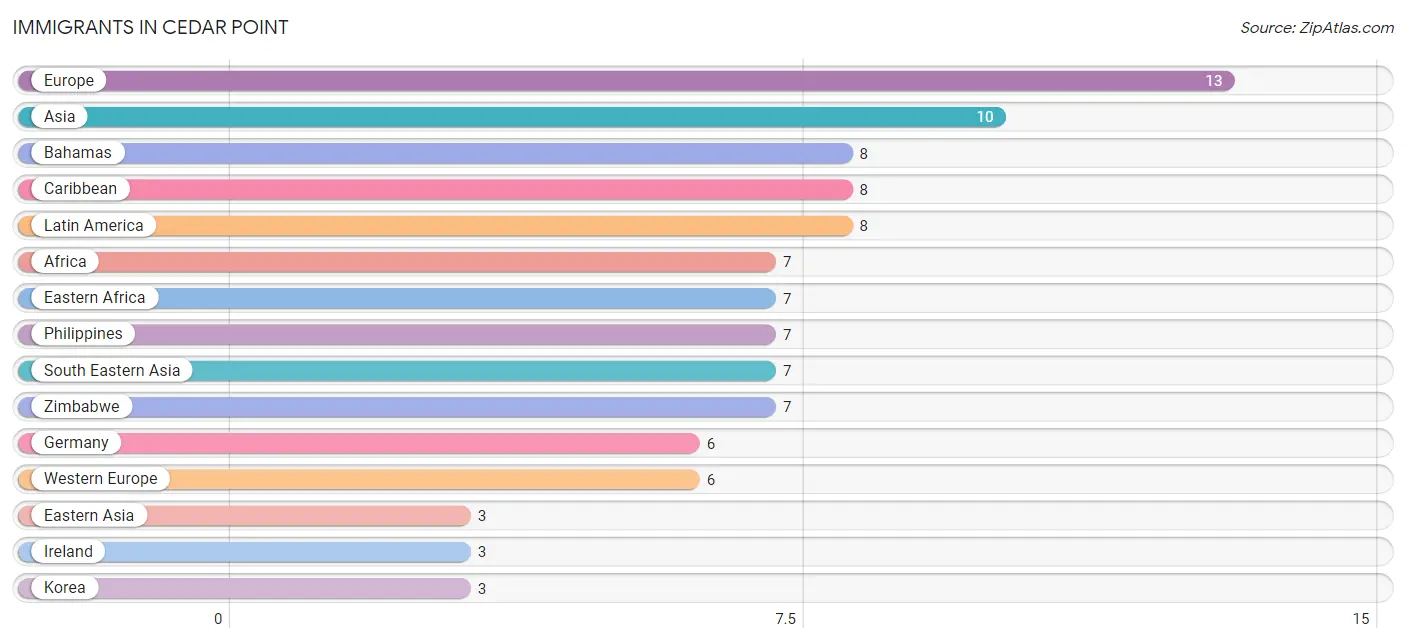
Immigrants in Cedar Point
The most numerous immigrant groups reported in Cedar Point came from Europe (13 | 0.6%), Asia (10 | 0.4%), Bahamas (8 | 0.4%), Caribbean (8 | 0.4%), and Latin America (8 | 0.4%), together accounting for 2.1% of all Cedar Point residents.
| Immigration Origin | # Population | % Population |
| Africa | 7 | 0.3% |
| Asia | 10 | 0.4% |
| Bahamas | 8 | 0.4% |
| Caribbean | 8 | 0.4% |
| Eastern Africa | 7 | 0.3% |
| Eastern Asia | 3 | 0.1% |
| Eastern Europe | 2 | 0.1% |
| Europe | 13 | 0.6% |
| Germany | 6 | 0.3% |
| Ireland | 3 | 0.1% |
| Italy | 2 | 0.1% |
| Korea | 3 | 0.1% |
| Latin America | 8 | 0.4% |
| Northern Europe | 3 | 0.1% |
| Philippines | 7 | 0.3% |
| Poland | 2 | 0.1% |
| South Eastern Asia | 7 | 0.3% |
| Southern Europe | 2 | 0.1% |
| Western Europe | 6 | 0.3% |
| Zimbabwe | 7 | 0.3% | View All 20 Rows |
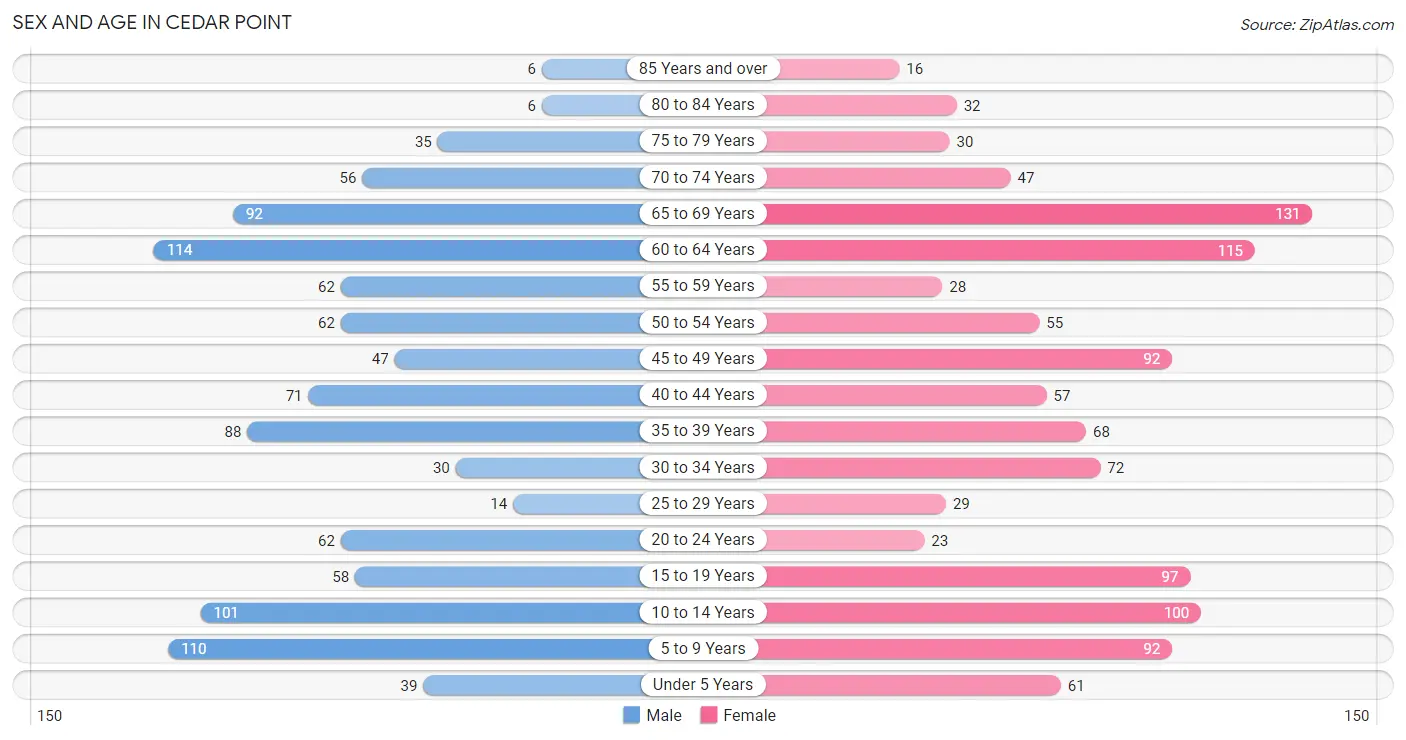
Sex and Age in Cedar Point
Sex and Age in Cedar Point
The most populous age groups in Cedar Point are 60 to 64 Years (114 | 10.8%) for men and 65 to 69 Years (131 | 11.4%) for women.
| Age Bracket | Male | Female |
| Under 5 Years | 39 (3.7%) | 61 (5.3%) |
| 5 to 9 Years | 110 (10.4%) | 92 (8.0%) |
| 10 to 14 Years | 101 (9.6%) | 100 (8.7%) |
| 15 to 19 Years | 58 (5.5%) | 97 (8.5%) |
| 20 to 24 Years | 62 (5.9%) | 23 (2.0%) |
| 25 to 29 Years | 14 (1.3%) | 29 (2.5%) |
| 30 to 34 Years | 30 (2.9%) | 72 (6.3%) |
| 35 to 39 Years | 88 (8.4%) | 68 (5.9%) |
| 40 to 44 Years | 71 (6.7%) | 57 (5.0%) |
| 45 to 49 Years | 47 (4.5%) | 92 (8.0%) |
| 50 to 54 Years | 62 (5.9%) | 55 (4.8%) |
| 55 to 59 Years | 62 (5.9%) | 28 (2.5%) |
| 60 to 64 Years | 114 (10.8%) | 115 (10.0%) |
| 65 to 69 Years | 92 (8.7%) | 131 (11.4%) |
| 70 to 74 Years | 56 (5.3%) | 47 (4.1%) |
| 75 to 79 Years | 35 (3.3%) | 30 (2.6%) |
| 80 to 84 Years | 6 (0.6%) | 32 (2.8%) |
| 85 Years and over | 6 (0.6%) | 16 (1.4%) |
| Total | 1,053 (100.0%) | 1,145 (100.0%) |
Families and Households in Cedar Point
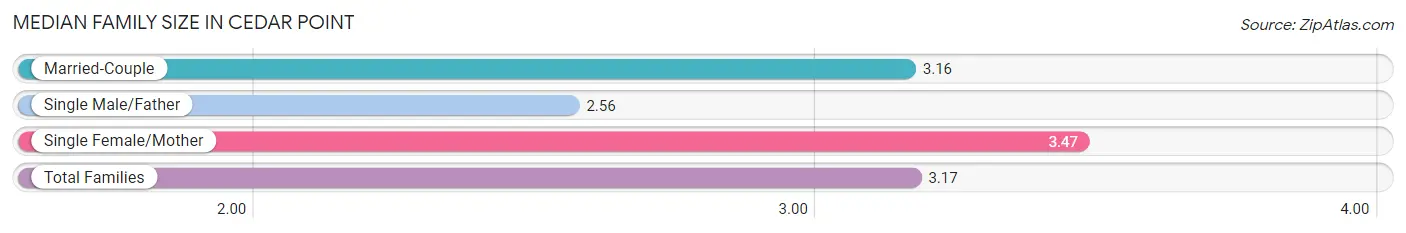
Median Family Size in Cedar Point
The median family size in Cedar Point is 3.17 persons per family, with single female/mother families (47 | 7.5%) accounting for the largest median family size of 3.47 persons per family. On the other hand, single male/father families (18 | 2.9%) represent the smallest median family size with 2.56 persons per family.
| Family Type | # Families | Family Size |
| Married-Couple | 559 (89.6%) | 3.16 |
| Single Male/Father | 18 (2.9%) | 2.56 |
| Single Female/Mother | 47 (7.5%) | 3.47 |
| Total Families | 624 (100.0%) | 3.17 |
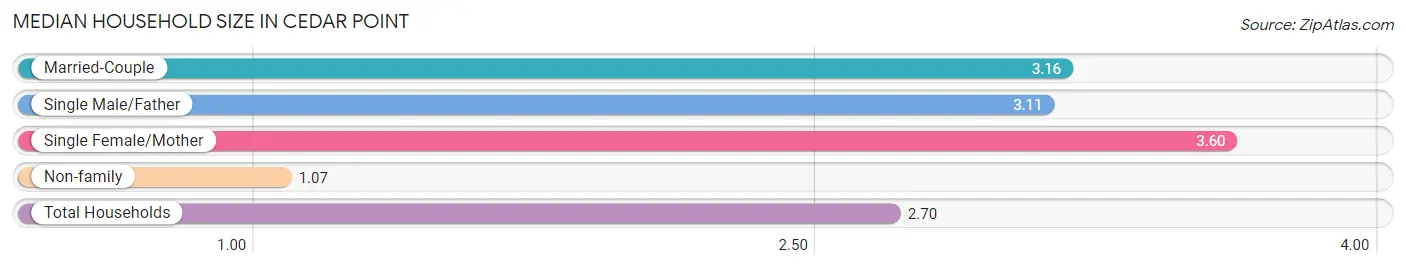
Median Household Size in Cedar Point
The median household size in Cedar Point is 2.70 persons per household, with single female/mother households (47 | 5.8%) accounting for the largest median household size of 3.6 persons per household. non-family households (191 | 23.4%) represent the smallest median household size with 1.07 persons per household.
| Household Type | # Households | Household Size |
| Married-Couple | 559 (68.6%) | 3.16 |
| Single Male/Father | 18 (2.2%) | 3.11 |
| Single Female/Mother | 47 (5.8%) | 3.60 |
| Non-family | 191 (23.4%) | 1.07 |
| Total Households | 815 (100.0%) | 2.70 |
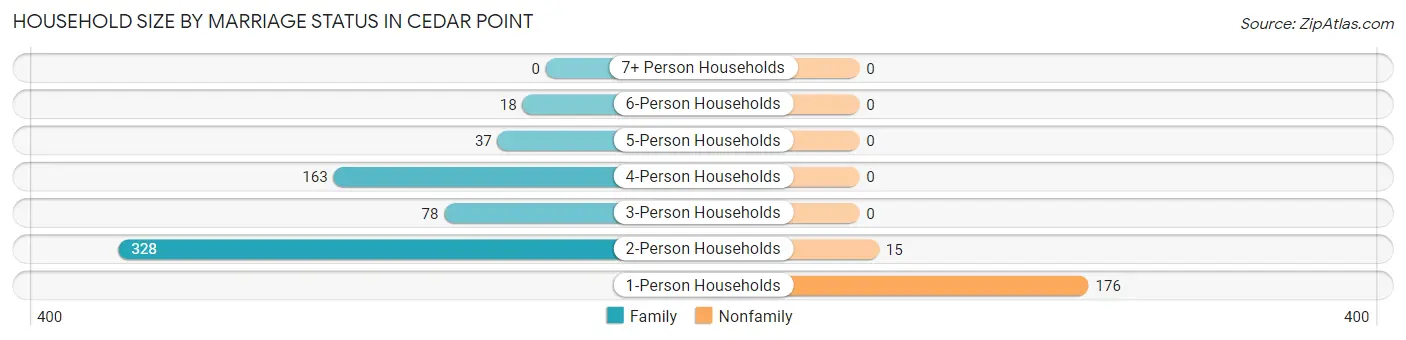
Household Size by Marriage Status in Cedar Point
Out of a total of 815 households in Cedar Point, 624 (76.6%) are family households, while 191 (23.4%) are nonfamily households. The most numerous type of family households are 2-person households, comprising 328, and the most common type of nonfamily households are 1-person households, comprising 176.
| Household Size | Family Households | Nonfamily Households |
| 1-Person Households | - | 176 (21.6%) |
| 2-Person Households | 328 (40.3%) | 15 (1.8%) |
| 3-Person Households | 78 (9.6%) | 0 (0.0%) |
| 4-Person Households | 163 (20.0%) | 0 (0.0%) |
| 5-Person Households | 37 (4.5%) | 0 (0.0%) |
| 6-Person Households | 18 (2.2%) | 0 (0.0%) |
| 7+ Person Households | 0 (0.0%) | 0 (0.0%) |
| Total | 624 (76.6%) | 191 (23.4%) |
Female Fertility in Cedar Point
Fertility by Age in Cedar Point
Average fertility rate in Cedar Point is 7.0 births per 1,000 women. Women in the age bracket of 35 to 50 years have the highest fertility rate with 14.0 births per 1,000 women. Women in the age bracket of 35 to 50 years acount for 100.0% of all women with births.
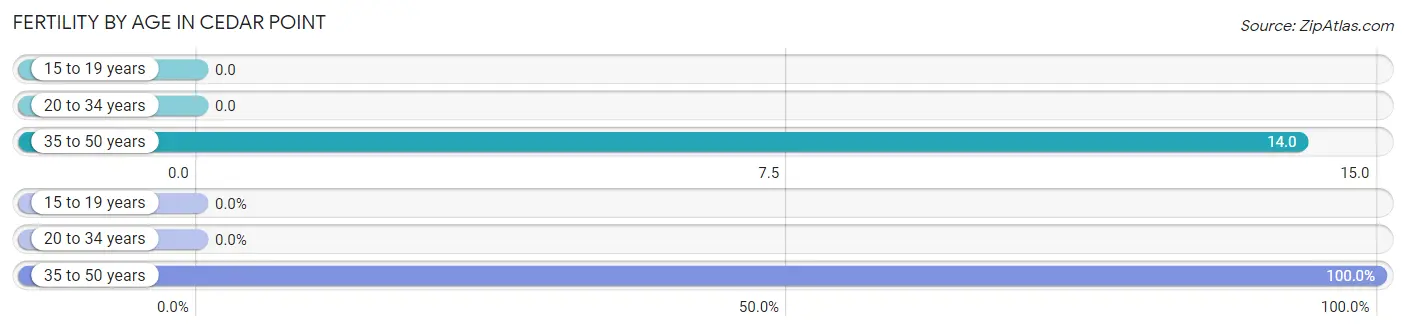
| Age Bracket | Women with Births | Births / 1,000 Women |
| 15 to 19 years | 0 (0.0%) | 0.0 |
| 20 to 34 years | 0 (0.0%) | 0.0 |
| 35 to 50 years | 3 (100.0%) | 14.0 |
| Total | 3 (100.0%) | 7.0 |
Fertility by Age by Marriage Status in Cedar Point
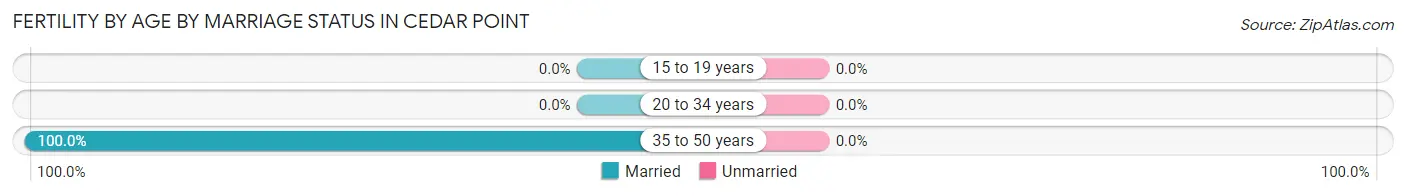
| Age Bracket | Married | Unmarried |
| 15 to 19 years | 0 (0.0%) | 0 (0.0%) |
| 20 to 34 years | 0 (0.0%) | 0 (0.0%) |
| 35 to 50 years | 3 (100.0%) | 0 (0.0%) |
| Total | 3 (100.0%) | 0 (0.0%) |
Fertility by Education in Cedar Point
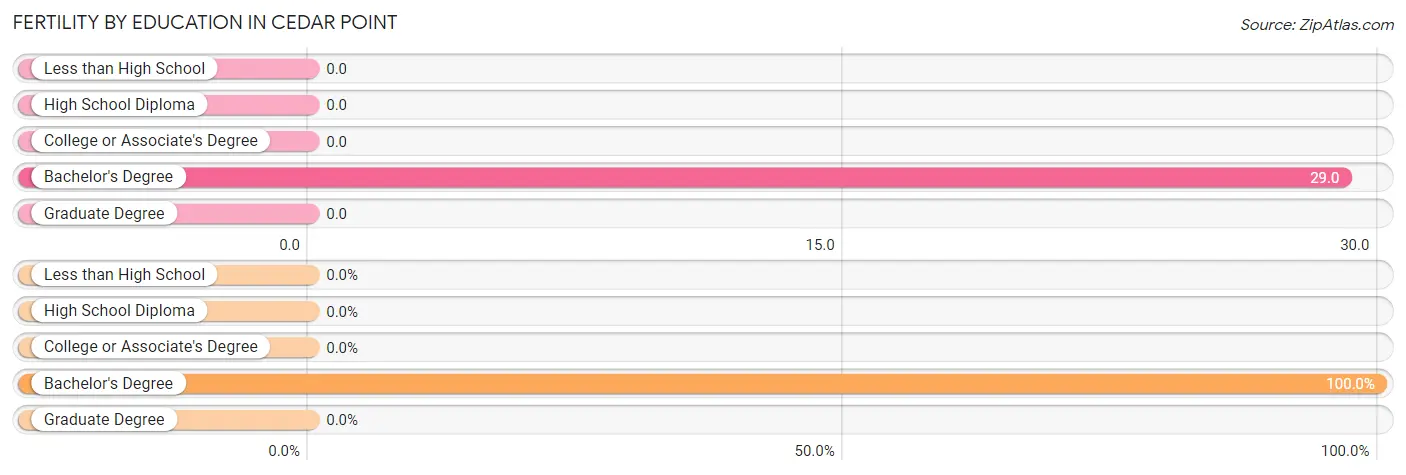
| Educational Attainment | Women with Births | Births / 1,000 Women |
| Less than High School | 0 (0.0%) | 0.0 |
| High School Diploma | 0 (0.0%) | 0.0 |
| College or Associate's Degree | 0 (0.0%) | 0.0 |
| Bachelor's Degree | 3 (100.0%) | 29.0 |
| Graduate Degree | 0 (0.0%) | 0.0 |
| Total | 3 (100.0%) | 7.0 |
Fertility by Education by Marriage Status in Cedar Point
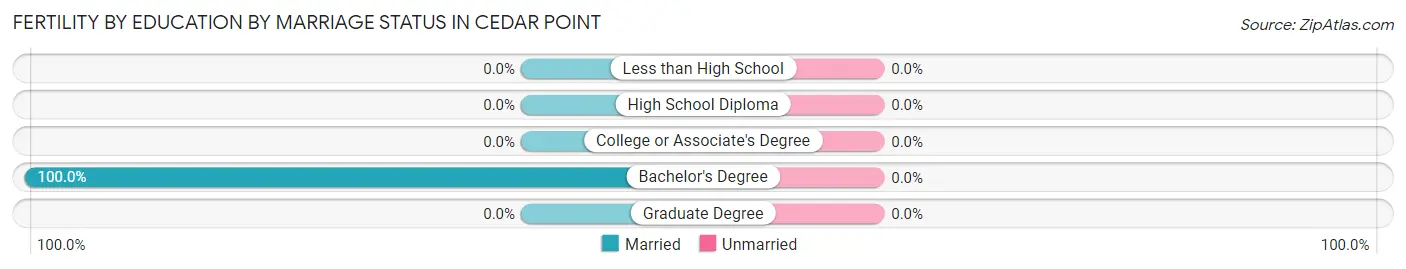
| Educational Attainment | Married | Unmarried |
| Less than High School | 0 (0.0%) | 0 (0.0%) |
| High School Diploma | 0 (0.0%) | 0 (0.0%) |
| College or Associate's Degree | 0 (0.0%) | 0 (0.0%) |
| Bachelor's Degree | 3 (100.0%) | 0 (0.0%) |
| Graduate Degree | 0 (0.0%) | 0 (0.0%) |
| Total | 3 (100.0%) | 0 (0.0%) |
Income in Cedar Point
Income Overview in Cedar Point
Per Capita Income in Cedar Point is $43,149, while median incomes of families and households are $102,692 and $87,981 respectively.
| Characteristic | Number | Measure |
| Per Capita Income | 2,198 | $43,149 |
| Median Family Income | 624 | $102,692 |
| Mean Family Income | 624 | $130,136 |
| Median Household Income | 815 | $87,981 |
| Mean Household Income | 815 | $111,437 |
| Income Deficit | 624 | $0 |
| Wage / Income Gap (%) | 2,198 | 44.45% |
| Wage / Income Gap ($) | 2,198 | 55.55¢ per $1 |
| Gini / Inequality Index | 2,198 | 0.44 |
Earnings by Sex in Cedar Point
Average Earnings in Cedar Point are $46,083, $51,979 for men and $28,875 for women, a difference of 44.5%.
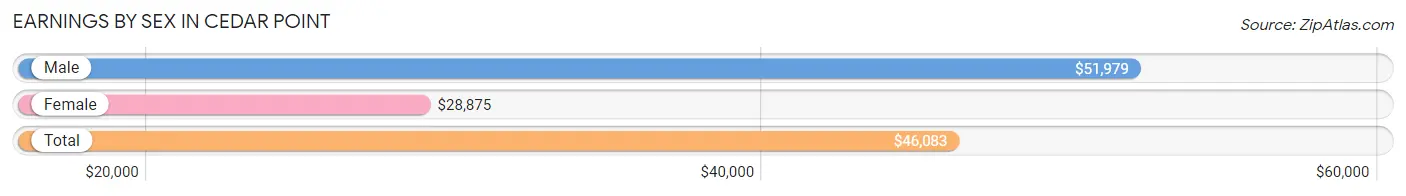
| Sex | Number | Average Earnings |
| Male | 593 (55.5%) | $51,979 |
| Female | 476 (44.5%) | $28,875 |
| Total | 1,069 (100.0%) | $46,083 |
Earnings by Sex by Income Bracket in Cedar Point
The most common earnings brackets in Cedar Point are $100,000+ for men (136 | 22.9%) and $12,500 to $14,999 for women (54 | 11.3%).
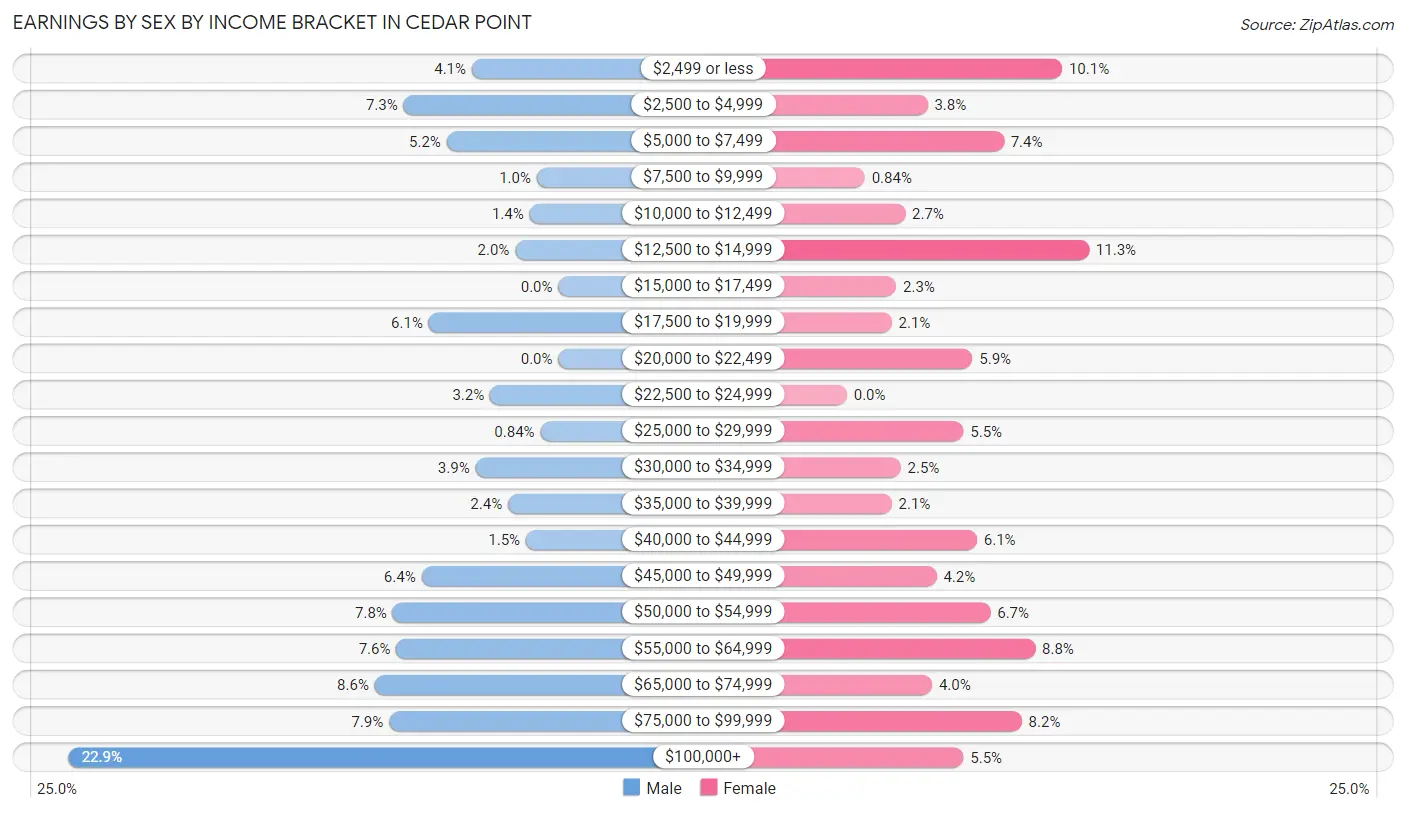
| Income | Male | Female |
| $2,499 or less | 24 (4.1%) | 48 (10.1%) |
| $2,500 to $4,999 | 43 (7.2%) | 18 (3.8%) |
| $5,000 to $7,499 | 31 (5.2%) | 35 (7.3%) |
| $7,500 to $9,999 | 6 (1.0%) | 4 (0.8%) |
| $10,000 to $12,499 | 8 (1.3%) | 13 (2.7%) |
| $12,500 to $14,999 | 12 (2.0%) | 54 (11.3%) |
| $15,000 to $17,499 | 0 (0.0%) | 11 (2.3%) |
| $17,500 to $19,999 | 36 (6.1%) | 10 (2.1%) |
| $20,000 to $22,499 | 0 (0.0%) | 28 (5.9%) |
| $22,500 to $24,999 | 19 (3.2%) | 0 (0.0%) |
| $25,000 to $29,999 | 5 (0.8%) | 26 (5.5%) |
| $30,000 to $34,999 | 23 (3.9%) | 12 (2.5%) |
| $35,000 to $39,999 | 14 (2.4%) | 10 (2.1%) |
| $40,000 to $44,999 | 9 (1.5%) | 29 (6.1%) |
| $45,000 to $49,999 | 38 (6.4%) | 20 (4.2%) |
| $50,000 to $54,999 | 46 (7.8%) | 32 (6.7%) |
| $55,000 to $64,999 | 45 (7.6%) | 42 (8.8%) |
| $65,000 to $74,999 | 51 (8.6%) | 19 (4.0%) |
| $75,000 to $99,999 | 47 (7.9%) | 39 (8.2%) |
| $100,000+ | 136 (22.9%) | 26 (5.5%) |
| Total | 593 (100.0%) | 476 (100.0%) |
Earnings by Sex by Educational Attainment in Cedar Point
Average earnings in Cedar Point are $62,578 for men and $31,250 for women, a difference of 50.1%. Men with an educational attainment of graduate degree enjoy the highest average annual earnings of $128,125, while those with high school diploma education earn the least with $50,357. Women with an educational attainment of graduate degree earn the most with the average annual earnings of $53,203, while those with bachelor's degree education have the smallest earnings of $41,250.
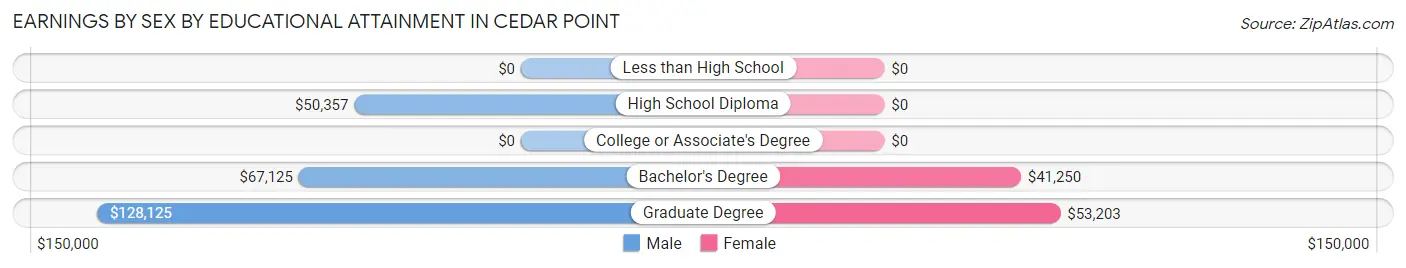
| Educational Attainment | Male Income | Female Income |
| Less than High School | - | - |
| High School Diploma | $50,357 | $0 |
| College or Associate's Degree | - | - |
| Bachelor's Degree | $67,125 | $41,250 |
| Graduate Degree | $128,125 | $53,203 |
| Total | $62,578 | $31,250 |
Family Income in Cedar Point
Family Income Brackets in Cedar Point
According to the Cedar Point family income data, there are 177 families falling into the $100,000 to $149,999 income range, which is the most common income bracket and makes up 28.4% of all families. Conversely, the $15,000 to $24,999 income bracket is the least frequent group with only 7 families (1.1%) belonging to this category.
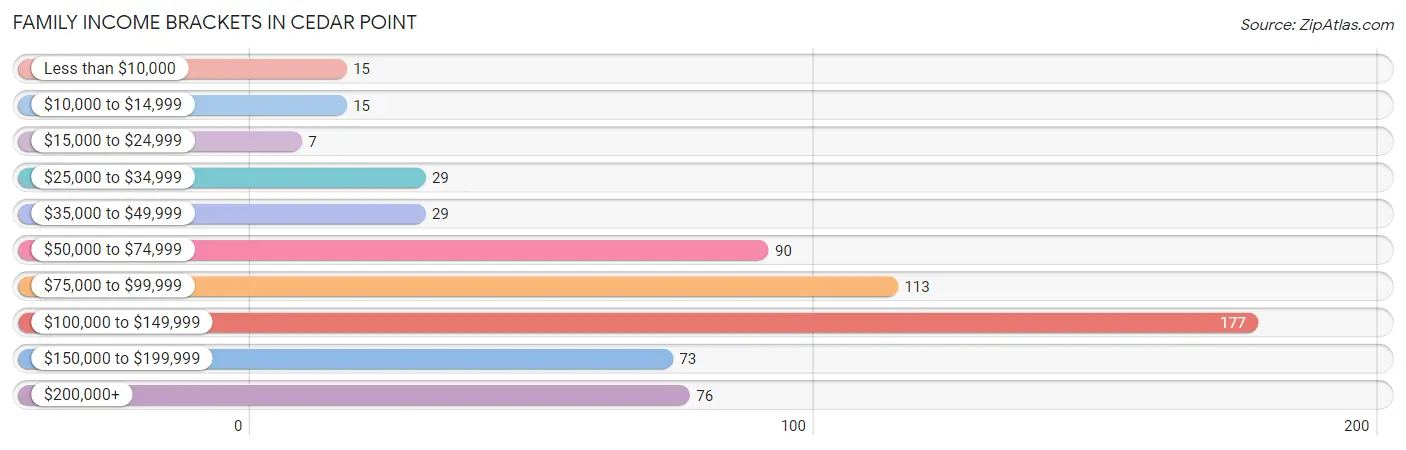
| Income Bracket | # Families | % Families |
| Less than $10,000 | 15 | 2.4% |
| $10,000 to $14,999 | 15 | 2.4% |
| $15,000 to $24,999 | 7 | 1.1% |
| $25,000 to $34,999 | 29 | 4.6% |
| $35,000 to $49,999 | 29 | 4.6% |
| $50,000 to $74,999 | 90 | 14.4% |
| $75,000 to $99,999 | 113 | 18.1% |
| $100,000 to $149,999 | 177 | 28.4% |
| $150,000 to $199,999 | 73 | 11.7% |
| $200,000+ | 76 | 12.2% |
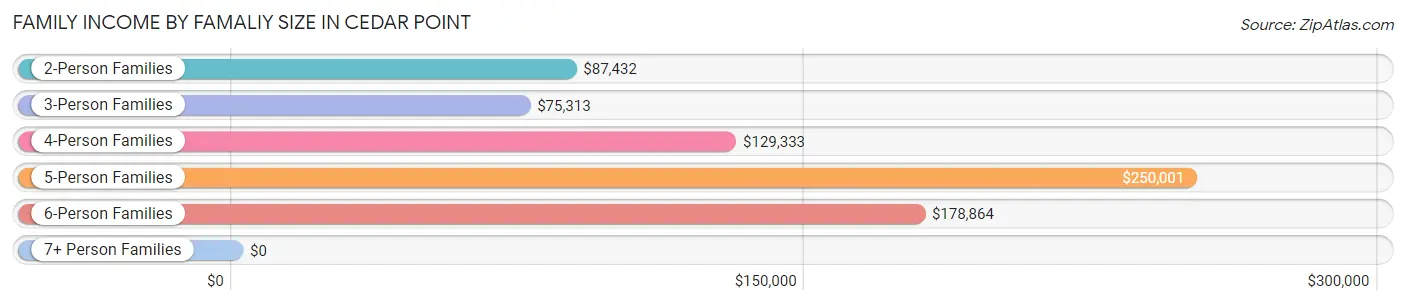
Family Income by Famaliy Size in Cedar Point
5-person families (37 | 5.9%) account for the highest median family income in Cedar Point with $250,001 per family, while 5-person families (37 | 5.9%) have the highest median income of $50,000 per family member.
| Income Bracket | # Families | Median Income |
| 2-Person Families | 328 (52.6%) | $87,432 |
| 3-Person Families | 91 (14.6%) | $75,313 |
| 4-Person Families | 150 (24.0%) | $129,333 |
| 5-Person Families | 37 (5.9%) | $250,001 |
| 6-Person Families | 18 (2.9%) | $178,864 |
| 7+ Person Families | 0 (0.0%) | $0 |
| Total | 624 (100.0%) | $102,692 |
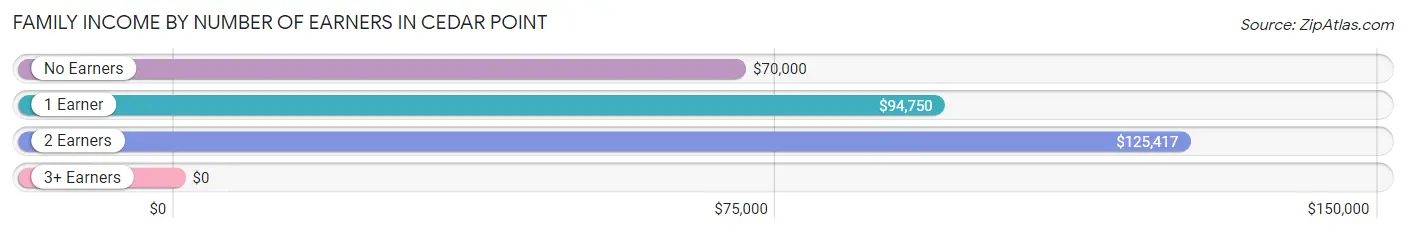
Family Income by Number of Earners in Cedar Point
| Number of Earners | # Families | Median Income |
| No Earners | 92 (14.7%) | $70,000 |
| 1 Earner | 181 (29.0%) | $94,750 |
| 2 Earners | 317 (50.8%) | $125,417 |
| 3+ Earners | 34 (5.4%) | $0 |
| Total | 624 (100.0%) | $102,692 |
Household Income in Cedar Point
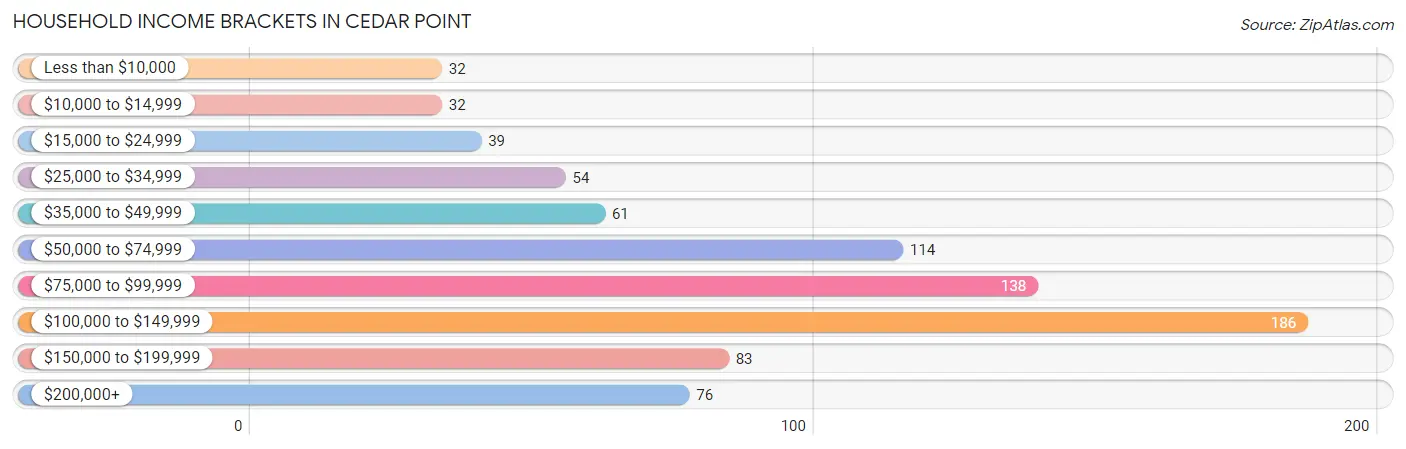
Household Income Brackets in Cedar Point
With 186 households falling in the category, the $100,000 to $149,999 income range is the most frequent in Cedar Point, accounting for 22.8% of all households. In contrast, only 32 households (3.9%) fall into the less than $10,000 income bracket, making it the least populous group.
| Income Bracket | # Households | % Households |
| Less than $10,000 | 32 | 3.9% |
| $10,000 to $14,999 | 32 | 3.9% |
| $15,000 to $24,999 | 39 | 4.8% |
| $25,000 to $34,999 | 54 | 6.6% |
| $35,000 to $49,999 | 61 | 7.5% |
| $50,000 to $74,999 | 114 | 14.0% |
| $75,000 to $99,999 | 138 | 16.9% |
| $100,000 to $149,999 | 186 | 22.8% |
| $150,000 to $199,999 | 83 | 10.2% |
| $200,000+ | 76 | 9.3% |
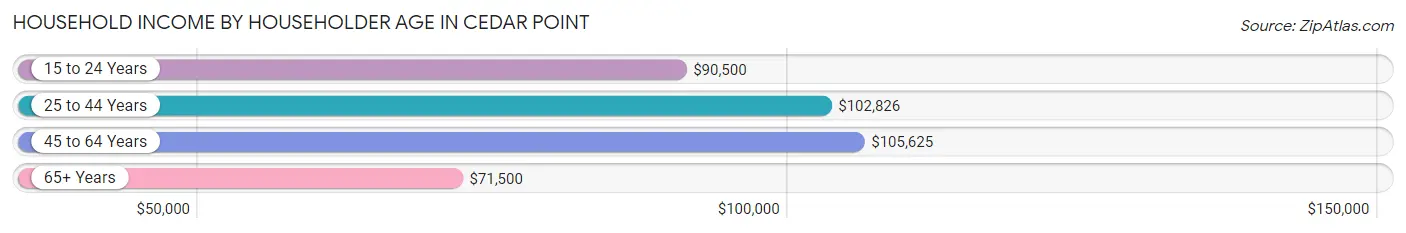
Household Income by Householder Age in Cedar Point
The median household income in Cedar Point is $87,981, with the highest median household income of $105,625 found in the 45 to 64 years age bracket for the primary householder. A total of 315 households (38.7%) fall into this category. Meanwhile, the 65+ years age bracket for the primary householder has the lowest median household income of $71,500, with 258 households (31.7%) in this group.
| Income Bracket | # Households | Median Income |
| 15 to 24 Years | 16 (2.0%) | $90,500 |
| 25 to 44 Years | 226 (27.7%) | $102,826 |
| 45 to 64 Years | 315 (38.7%) | $105,625 |
| 65+ Years | 258 (31.7%) | $71,500 |
| Total | 815 (100.0%) | $87,981 |
Poverty in Cedar Point
Income Below Poverty by Sex and Age in Cedar Point
With 7.8% poverty level for males and 6.9% for females among the residents of Cedar Point, 16 and 17 year old males and 45 to 54 year old females are the most vulnerable to poverty, with 13 males (40.6%) and 21 females (14.3%) in their respective age groups living below the poverty level.
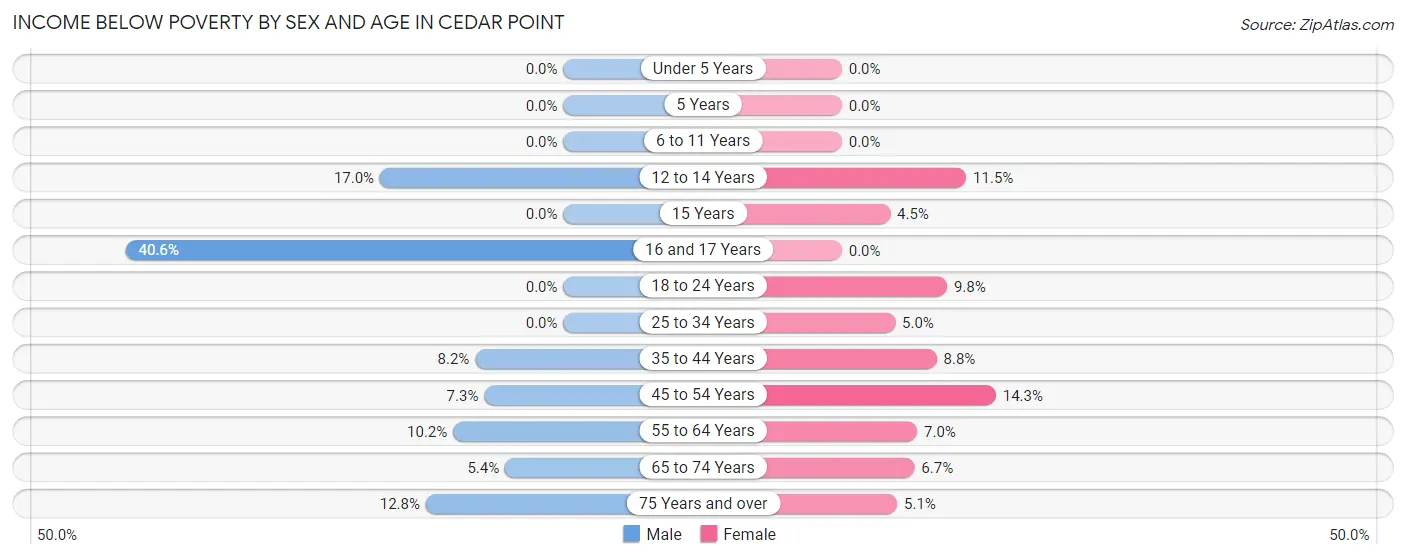
| Age Bracket | Male | Female |
| Under 5 Years | 0 (0.0%) | 0 (0.0%) |
| 5 Years | 0 (0.0%) | 0 (0.0%) |
| 6 to 11 Years | 0 (0.0%) | 0 (0.0%) |
| 12 to 14 Years | 16 (17.0%) | 9 (11.5%) |
| 15 Years | 0 (0.0%) | 3 (4.5%) |
| 16 and 17 Years | 13 (40.6%) | 0 (0.0%) |
| 18 to 24 Years | 0 (0.0%) | 4 (9.8%) |
| 25 to 34 Years | 0 (0.0%) | 5 (5.0%) |
| 35 to 44 Years | 13 (8.2%) | 11 (8.8%) |
| 45 to 54 Years | 8 (7.3%) | 21 (14.3%) |
| 55 to 64 Years | 18 (10.2%) | 10 (7.0%) |
| 65 to 74 Years | 8 (5.4%) | 12 (6.7%) |
| 75 Years and over | 6 (12.8%) | 4 (5.1%) |
| Total | 82 (7.8%) | 79 (6.9%) |
Income Above Poverty by Sex and Age in Cedar Point
According to the poverty statistics in Cedar Point, males aged under 5 years and females aged under 5 years are the age groups that are most secure financially, with 100.0% of males and 100.0% of females in these age groups living above the poverty line.
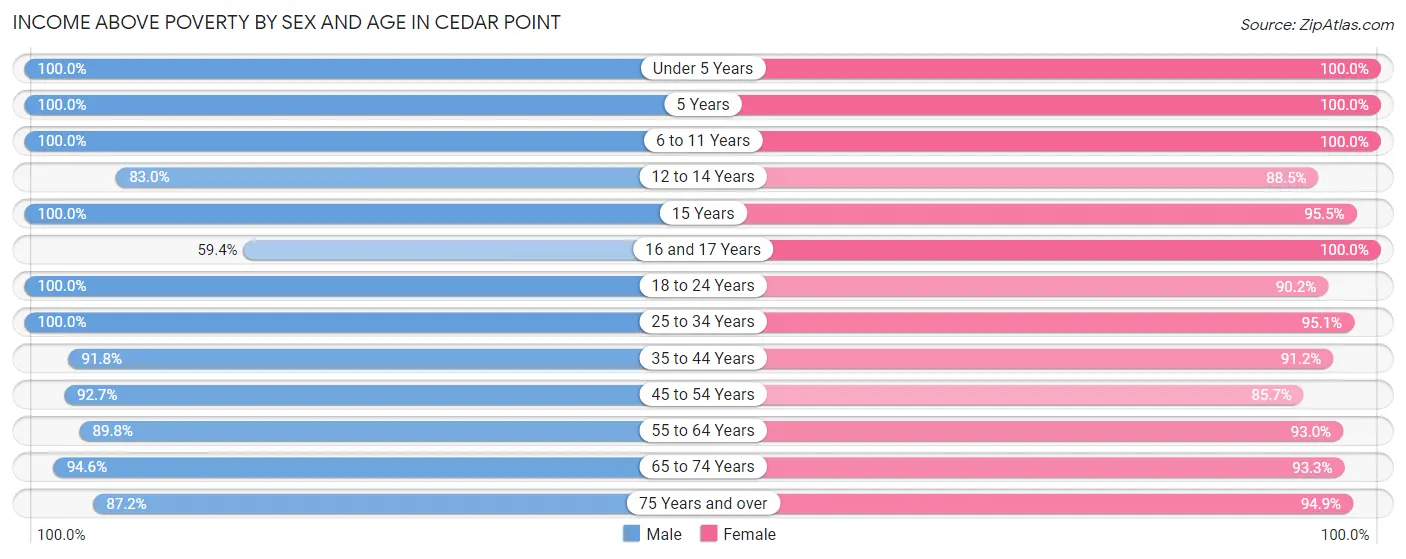
| Age Bracket | Male | Female |
| Under 5 Years | 39 (100.0%) | 61 (100.0%) |
| 5 Years | 21 (100.0%) | 30 (100.0%) |
| 6 to 11 Years | 96 (100.0%) | 84 (100.0%) |
| 12 to 14 Years | 78 (83.0%) | 69 (88.5%) |
| 15 Years | 13 (100.0%) | 64 (95.5%) |
| 16 and 17 Years | 19 (59.4%) | 12 (100.0%) |
| 18 to 24 Years | 75 (100.0%) | 37 (90.2%) |
| 25 to 34 Years | 44 (100.0%) | 96 (95.1%) |
| 35 to 44 Years | 146 (91.8%) | 114 (91.2%) |
| 45 to 54 Years | 101 (92.7%) | 126 (85.7%) |
| 55 to 64 Years | 158 (89.8%) | 133 (93.0%) |
| 65 to 74 Years | 140 (94.6%) | 166 (93.3%) |
| 75 Years and over | 41 (87.2%) | 74 (94.9%) |
| Total | 971 (92.2%) | 1,066 (93.1%) |
Income Below Poverty Among Married-Couple Families in Cedar Point
The poverty statistics for married-couple families in Cedar Point show that 7.0% or 39 of the total 559 families live below the poverty line. Families with 1 or 2 children have the highest poverty rate of 9.1%, comprising of 17 families. On the other hand, families with 3 or 4 children have the lowest poverty rate of 0.0%, which includes 0 families.
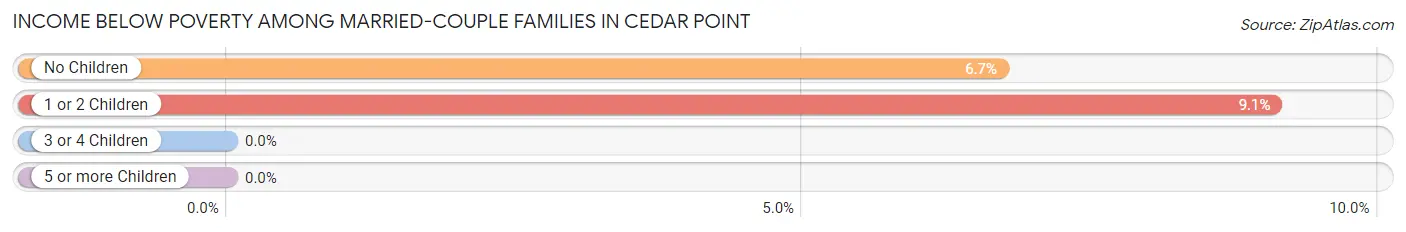
| Children | Above Poverty | Below Poverty |
| No Children | 306 (93.3%) | 22 (6.7%) |
| 1 or 2 Children | 170 (90.9%) | 17 (9.1%) |
| 3 or 4 Children | 44 (100.0%) | 0 (0.0%) |
| 5 or more Children | 0 (0.0%) | 0 (0.0%) |
| Total | 520 (93.0%) | 39 (7.0%) |
Income Below Poverty Among Single-Parent Households in Cedar Point
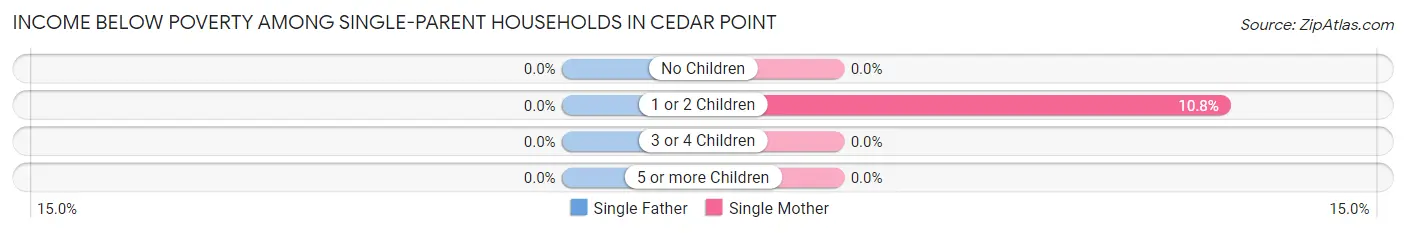
| Children | Single Father | Single Mother |
| No Children | 0 (0.0%) | 0 (0.0%) |
| 1 or 2 Children | 0 (0.0%) | 4 (10.8%) |
| 3 or 4 Children | 0 (0.0%) | 0 (0.0%) |
| 5 or more Children | 0 (0.0%) | 0 (0.0%) |
| Total | 0 (0.0%) | 4 (8.5%) |
Income Below Poverty Among Married-Couple vs Single-Parent Households in Cedar Point
The poverty data for Cedar Point shows that 39 of the married-couple family households (7.0%) and 4 of the single-parent households (6.1%) are living below the poverty level. Within the married-couple family households, those with 1 or 2 children have the highest poverty rate, with 17 households (9.1%) falling below the poverty line. Among the single-parent households, those with 1 or 2 children have the highest poverty rate, with 4 household (7.7%) living below poverty.
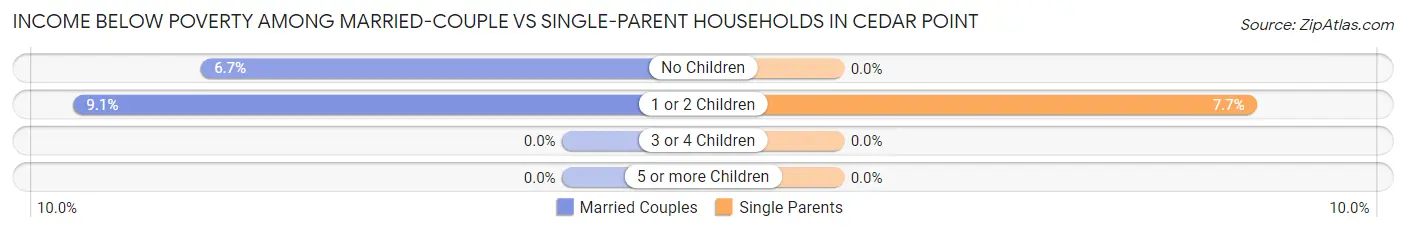
| Children | Married-Couple Families | Single-Parent Households |
| No Children | 22 (6.7%) | 0 (0.0%) |
| 1 or 2 Children | 17 (9.1%) | 4 (7.7%) |
| 3 or 4 Children | 0 (0.0%) | 0 (0.0%) |
| 5 or more Children | 0 (0.0%) | 0 (0.0%) |
| Total | 39 (7.0%) | 4 (6.1%) |
Employment Characteristics in Cedar Point
Employment by Class of Employer in Cedar Point
Among the 904 employed individuals in Cedar Point, private company employees (521 | 57.6%), federal government employees (112 | 12.4%), and self-employed (incorporated) (69 | 7.6%) make up the most common classes of employment.
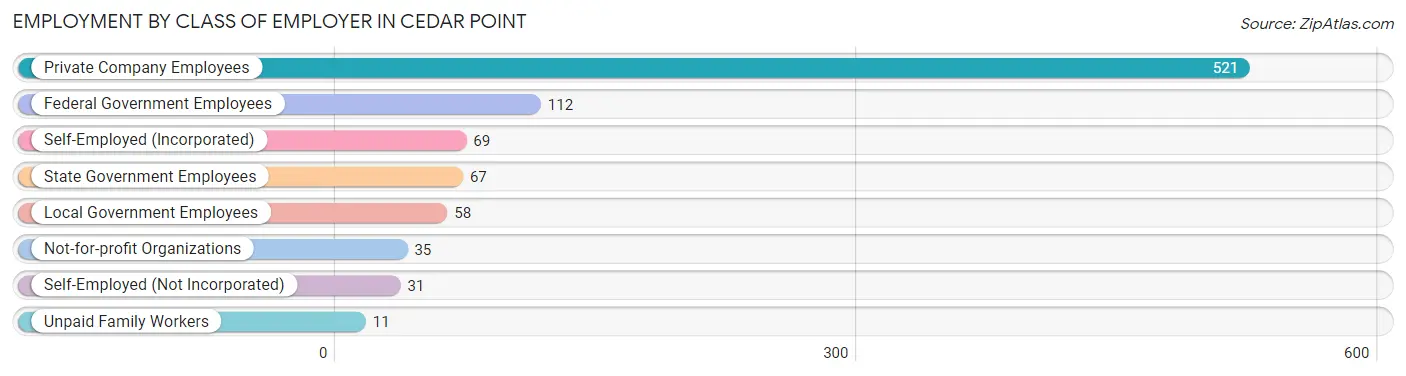
| Employer Class | # Employees | % Employees |
| Private Company Employees | 521 | 57.6% |
| Self-Employed (Incorporated) | 69 | 7.6% |
| Self-Employed (Not Incorporated) | 31 | 3.4% |
| Not-for-profit Organizations | 35 | 3.9% |
| Local Government Employees | 58 | 6.4% |
| State Government Employees | 67 | 7.4% |
| Federal Government Employees | 112 | 12.4% |
| Unpaid Family Workers | 11 | 1.2% |
| Total | 904 | 100.0% |
Employment Status by Age in Cedar Point
According to the labor force statistics for Cedar Point, out of the total population over 16 years of age (1,615), 59.7% or 964 individuals are in the labor force, with 4.1% or 40 of them unemployed. The age group with the highest labor force participation rate is 45 to 54 years, with 83.2% or 213 individuals in the labor force. Within the labor force, the 16 to 19 years age range has the highest percentage of unemployed individuals, with 28.9% or 13 of them being unemployed.
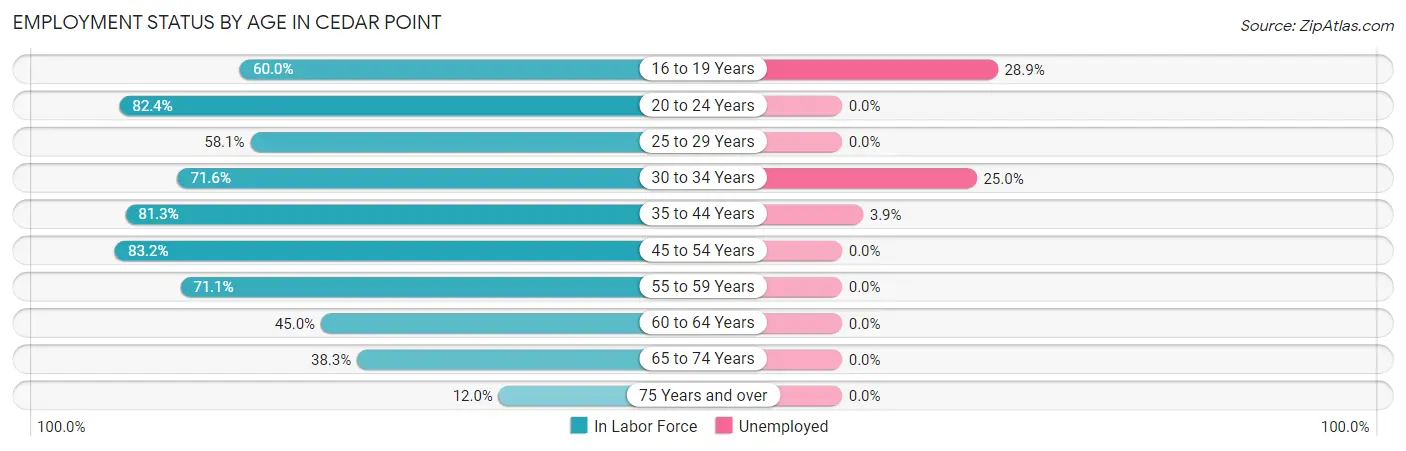
| Age Bracket | In Labor Force | Unemployed |
| 16 to 19 Years | 45 (60.0%) | 13 (28.9%) |
| 20 to 24 Years | 70 (82.4%) | 0 (0.0%) |
| 25 to 29 Years | 25 (58.1%) | 0 (0.0%) |
| 30 to 34 Years | 73 (71.6%) | 18 (25.0%) |
| 35 to 44 Years | 231 (81.3%) | 9 (3.9%) |
| 45 to 54 Years | 213 (83.2%) | 0 (0.0%) |
| 55 to 59 Years | 64 (71.1%) | 0 (0.0%) |
| 60 to 64 Years | 103 (45.0%) | 0 (0.0%) |
| 65 to 74 Years | 125 (38.3%) | 0 (0.0%) |
| 75 Years and over | 15 (12.0%) | 0 (0.0%) |
| Total | 964 (59.7%) | 40 (4.1%) |
Employment Status by Educational Attainment in Cedar Point
According to labor force statistics for Cedar Point, 70.6% of individuals (709) out of the total population between 25 and 64 years of age (1,004) are in the labor force, with 3.7% or 26 of them being unemployed. The group with the highest labor force participation rate are those with the educational attainment of bachelor's degree or higher, with 81.2% or 414 individuals in the labor force. Within the labor force, individuals with college / associate degree education have the highest percentage of unemployment, with 11.0% or 18 of them being unemployed.
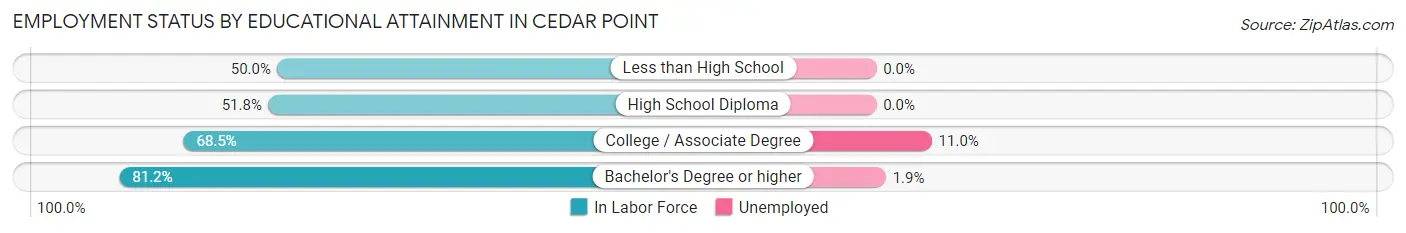
| Educational Attainment | In Labor Force | Unemployed |
| Less than High School | 15 (50.0%) | 0 (0.0%) |
| High School Diploma | 117 (51.8%) | 0 (0.0%) |
| College / Associate Degree | 163 (68.5%) | 26 (11.0%) |
| Bachelor's Degree or higher | 414 (81.2%) | 10 (1.9%) |
| Total | 709 (70.6%) | 37 (3.7%) |
Employment Occupations by Sex in Cedar Point
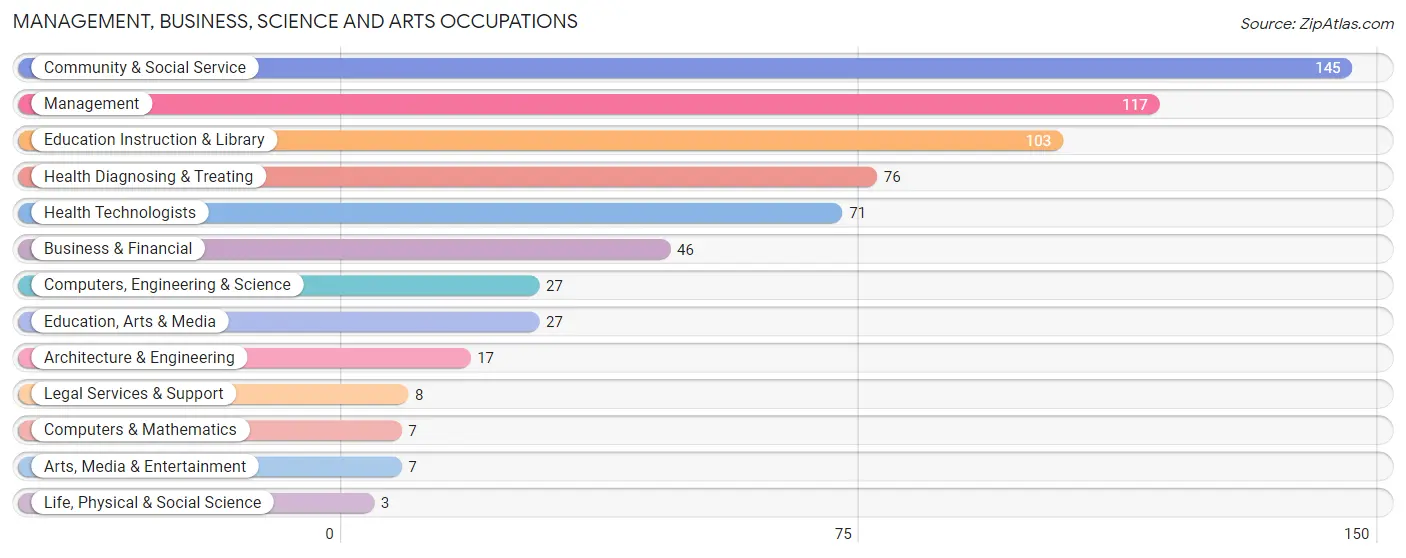
Management, Business, Science and Arts Occupations
The most common Management, Business, Science and Arts occupations in Cedar Point are Community & Social Service (145 | 16.8%), Management (117 | 13.5%), Education Instruction & Library (103 | 11.9%), Health Diagnosing & Treating (76 | 8.8%), and Health Technologists (71 | 8.2%).
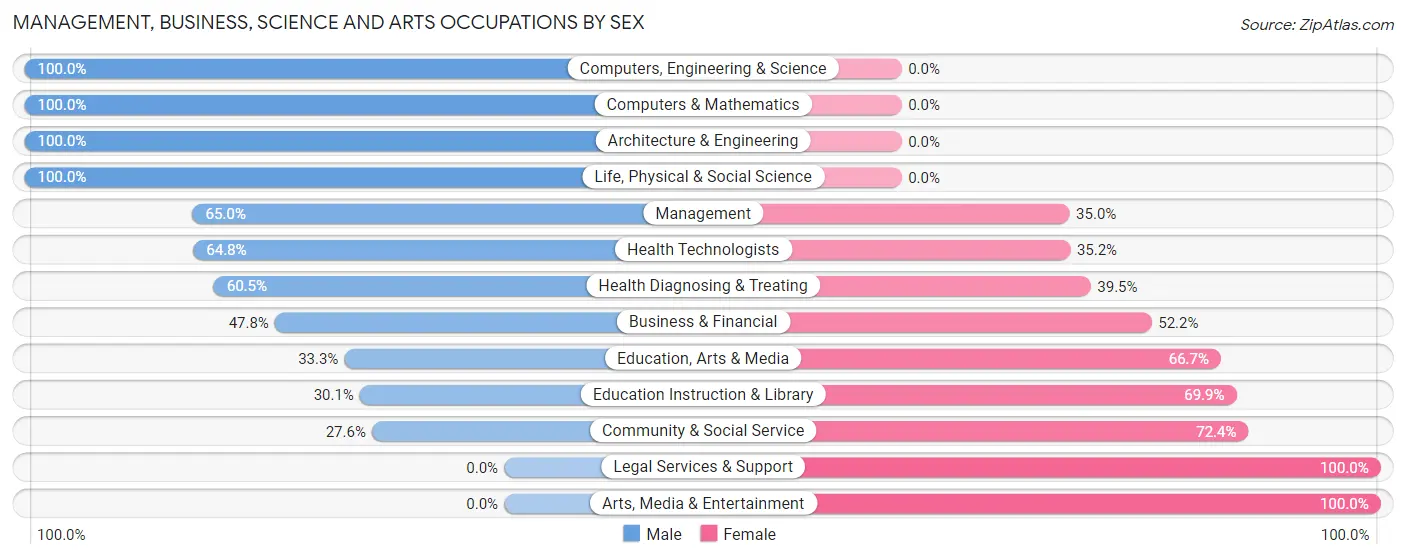
Management, Business, Science and Arts Occupations by Sex
Within the Management, Business, Science and Arts occupations in Cedar Point, the most male-oriented occupations are Computers, Engineering & Science (100.0%), Computers & Mathematics (100.0%), and Architecture & Engineering (100.0%), while the most female-oriented occupations are Legal Services & Support (100.0%), Arts, Media & Entertainment (100.0%), and Community & Social Service (72.4%).
| Occupation | Male | Female |
| Management | 76 (65.0%) | 41 (35.0%) |
| Business & Financial | 22 (47.8%) | 24 (52.2%) |
| Computers, Engineering & Science | 27 (100.0%) | 0 (0.0%) |
| Computers & Mathematics | 7 (100.0%) | 0 (0.0%) |
| Architecture & Engineering | 17 (100.0%) | 0 (0.0%) |
| Life, Physical & Social Science | 3 (100.0%) | 0 (0.0%) |
| Community & Social Service | 40 (27.6%) | 105 (72.4%) |
| Education, Arts & Media | 9 (33.3%) | 18 (66.7%) |
| Legal Services & Support | 0 (0.0%) | 8 (100.0%) |
| Education Instruction & Library | 31 (30.1%) | 72 (69.9%) |
| Arts, Media & Entertainment | 0 (0.0%) | 7 (100.0%) |
| Health Diagnosing & Treating | 46 (60.5%) | 30 (39.5%) |
| Health Technologists | 46 (64.8%) | 25 (35.2%) |
| Total (Category) | 211 (51.3%) | 200 (48.7%) |
| Total (Overall) | 450 (52.1%) | 414 (47.9%) |
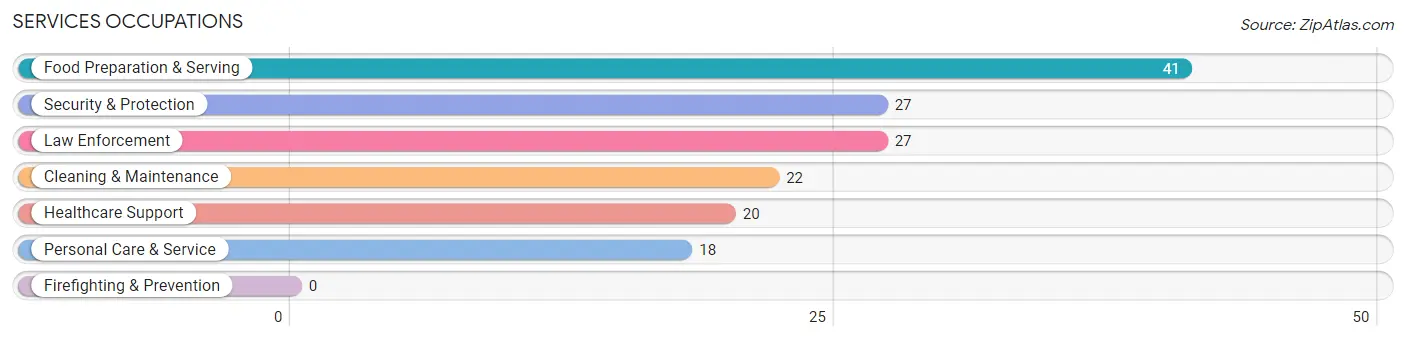
Services Occupations
The most common Services occupations in Cedar Point are Food Preparation & Serving (41 | 4.8%), Security & Protection (27 | 3.1%), Law Enforcement (27 | 3.1%), Cleaning & Maintenance (22 | 2.5%), and Healthcare Support (20 | 2.3%).
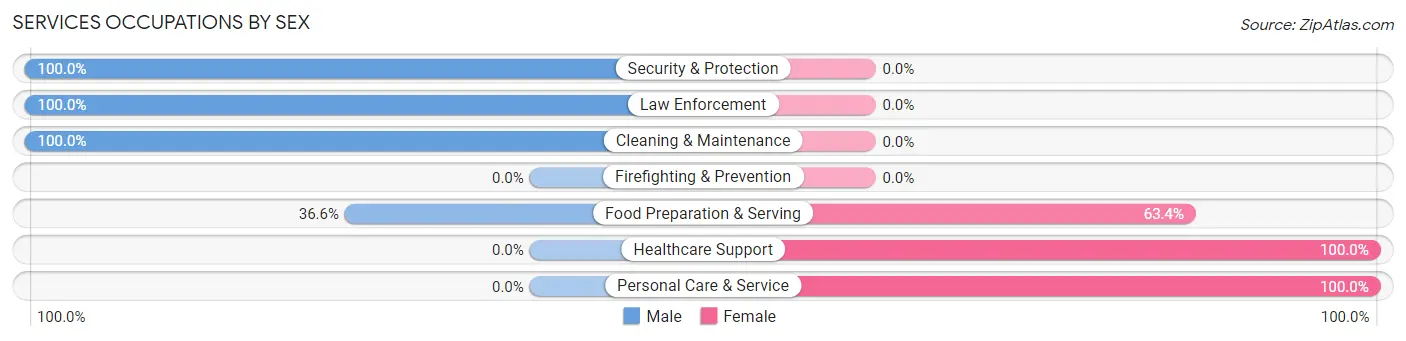
Services Occupations by Sex
Within the Services occupations in Cedar Point, the most male-oriented occupations are Security & Protection (100.0%), Law Enforcement (100.0%), and Cleaning & Maintenance (100.0%), while the most female-oriented occupations are Healthcare Support (100.0%), Personal Care & Service (100.0%), and Food Preparation & Serving (63.4%).
| Occupation | Male | Female |
| Healthcare Support | 0 (0.0%) | 20 (100.0%) |
| Security & Protection | 27 (100.0%) | 0 (0.0%) |
| Firefighting & Prevention | 0 (0.0%) | 0 (0.0%) |
| Law Enforcement | 27 (100.0%) | 0 (0.0%) |
| Food Preparation & Serving | 15 (36.6%) | 26 (63.4%) |
| Cleaning & Maintenance | 22 (100.0%) | 0 (0.0%) |
| Personal Care & Service | 0 (0.0%) | 18 (100.0%) |
| Total (Category) | 64 (50.0%) | 64 (50.0%) |
| Total (Overall) | 450 (52.1%) | 414 (47.9%) |
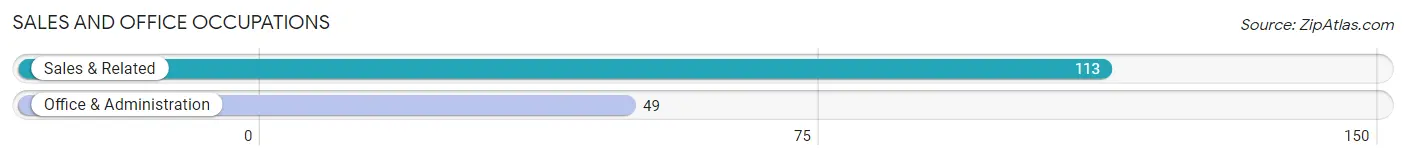
Sales and Office Occupations
The most common Sales and Office occupations in Cedar Point are Sales & Related (113 | 13.1%), and Office & Administration (49 | 5.7%).
Sales and Office Occupations by Sex
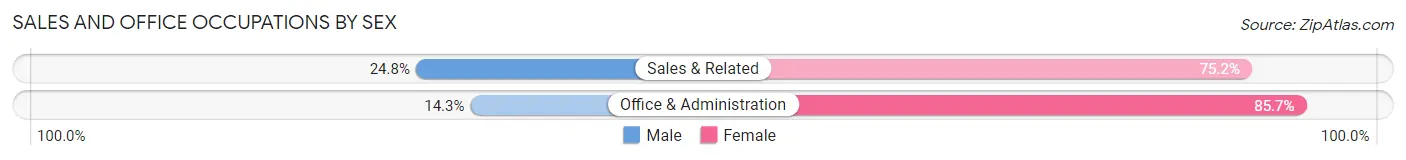
| Occupation | Male | Female |
| Sales & Related | 28 (24.8%) | 85 (75.2%) |
| Office & Administration | 7 (14.3%) | 42 (85.7%) |
| Total (Category) | 35 (21.6%) | 127 (78.4%) |
| Total (Overall) | 450 (52.1%) | 414 (47.9%) |
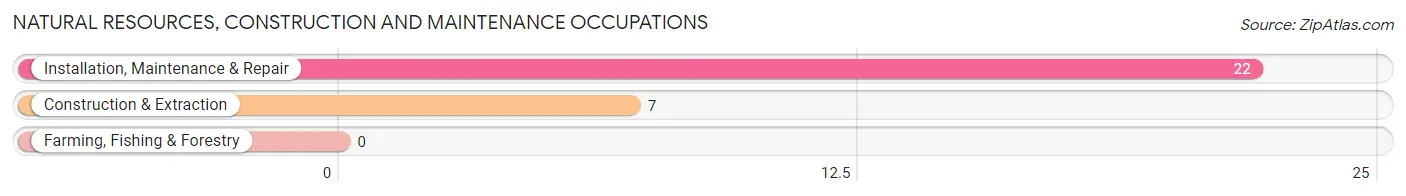
Natural Resources, Construction and Maintenance Occupations
The most common Natural Resources, Construction and Maintenance occupations in Cedar Point are Installation, Maintenance & Repair (22 | 2.5%), and Construction & Extraction (7 | 0.8%).
Natural Resources, Construction and Maintenance Occupations by Sex
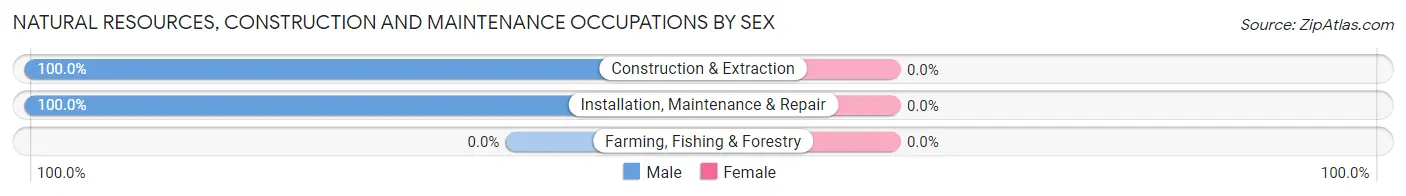
| Occupation | Male | Female |
| Farming, Fishing & Forestry | 0 (0.0%) | 0 (0.0%) |
| Construction & Extraction | 7 (100.0%) | 0 (0.0%) |
| Installation, Maintenance & Repair | 22 (100.0%) | 0 (0.0%) |
| Total (Category) | 29 (100.0%) | 0 (0.0%) |
| Total (Overall) | 450 (52.1%) | 414 (47.9%) |
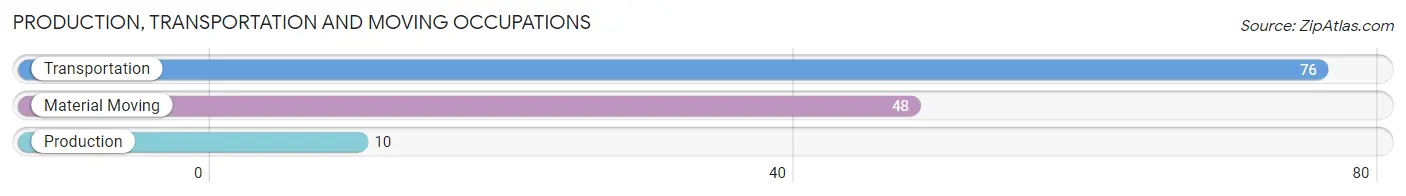
Production, Transportation and Moving Occupations
The most common Production, Transportation and Moving occupations in Cedar Point are Transportation (76 | 8.8%), Material Moving (48 | 5.6%), and Production (10 | 1.2%).
Production, Transportation and Moving Occupations by Sex
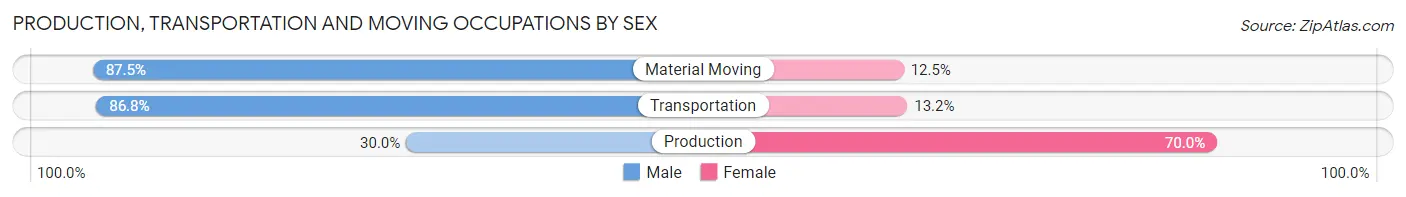
| Occupation | Male | Female |
| Production | 3 (30.0%) | 7 (70.0%) |
| Transportation | 66 (86.8%) | 10 (13.2%) |
| Material Moving | 42 (87.5%) | 6 (12.5%) |
| Total (Category) | 111 (82.8%) | 23 (17.2%) |
| Total (Overall) | 450 (52.1%) | 414 (47.9%) |
Employment Industries by Sex in Cedar Point
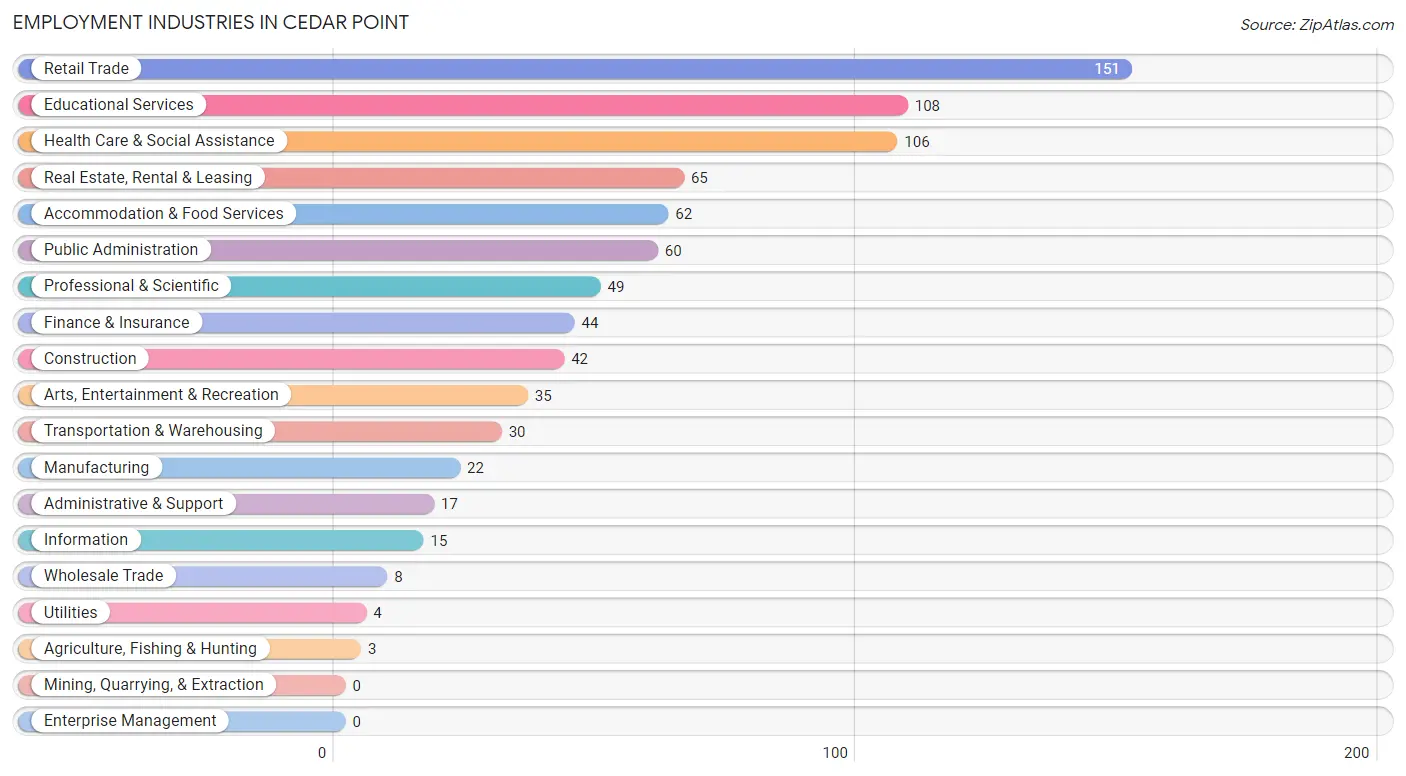
Employment Industries in Cedar Point
The major employment industries in Cedar Point include Retail Trade (151 | 17.5%), Educational Services (108 | 12.5%), Health Care & Social Assistance (106 | 12.3%), Real Estate, Rental & Leasing (65 | 7.5%), and Accommodation & Food Services (62 | 7.2%).
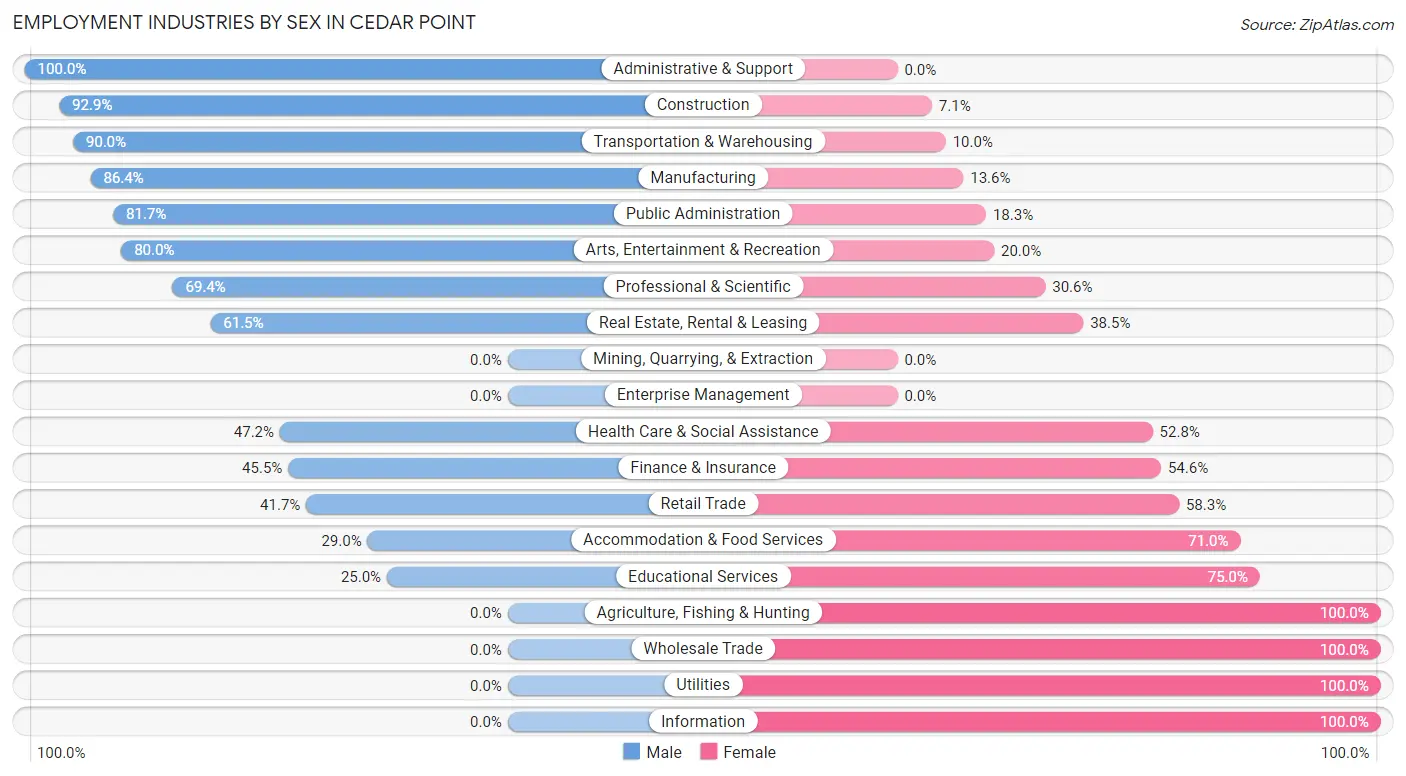
Employment Industries by Sex in Cedar Point
The Cedar Point industries that see more men than women are Administrative & Support (100.0%), Construction (92.9%), and Transportation & Warehousing (90.0%), whereas the industries that tend to have a higher number of women are Agriculture, Fishing & Hunting (100.0%), Wholesale Trade (100.0%), and Utilities (100.0%).
| Industry | Male | Female |
| Agriculture, Fishing & Hunting | 0 (0.0%) | 3 (100.0%) |
| Mining, Quarrying, & Extraction | 0 (0.0%) | 0 (0.0%) |
| Construction | 39 (92.9%) | 3 (7.1%) |
| Manufacturing | 19 (86.4%) | 3 (13.6%) |
| Wholesale Trade | 0 (0.0%) | 8 (100.0%) |
| Retail Trade | 63 (41.7%) | 88 (58.3%) |
| Transportation & Warehousing | 27 (90.0%) | 3 (10.0%) |
| Utilities | 0 (0.0%) | 4 (100.0%) |
| Information | 0 (0.0%) | 15 (100.0%) |
| Finance & Insurance | 20 (45.5%) | 24 (54.5%) |
| Real Estate, Rental & Leasing | 40 (61.5%) | 25 (38.5%) |
| Professional & Scientific | 34 (69.4%) | 15 (30.6%) |
| Enterprise Management | 0 (0.0%) | 0 (0.0%) |
| Administrative & Support | 17 (100.0%) | 0 (0.0%) |
| Educational Services | 27 (25.0%) | 81 (75.0%) |
| Health Care & Social Assistance | 50 (47.2%) | 56 (52.8%) |
| Arts, Entertainment & Recreation | 28 (80.0%) | 7 (20.0%) |
| Accommodation & Food Services | 18 (29.0%) | 44 (71.0%) |
| Public Administration | 49 (81.7%) | 11 (18.3%) |
| Total | 450 (52.1%) | 414 (47.9%) |
Education in Cedar Point
School Enrollment in Cedar Point
The most common levels of schooling among the 612 students in Cedar Point are middle school (185 | 30.2%), elementary school (143 | 23.4%), and high school (135 | 22.1%).
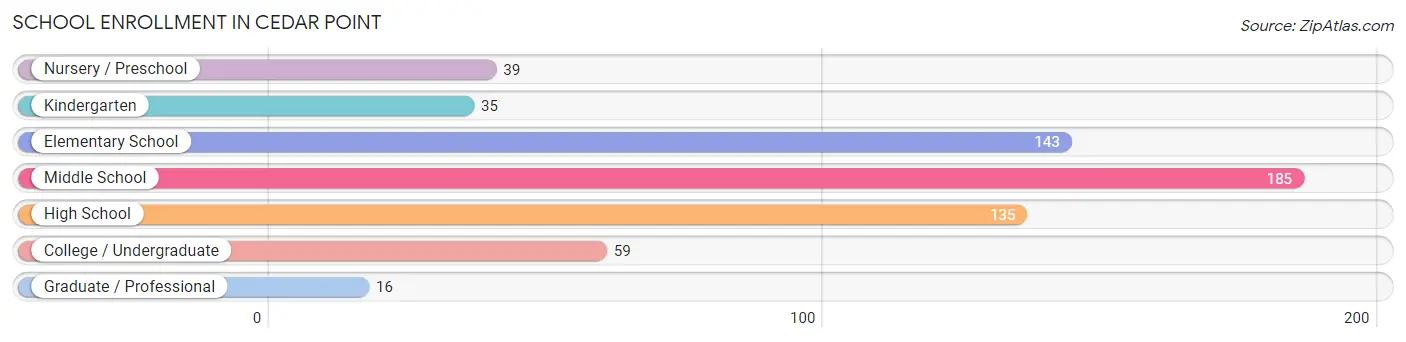
| School Level | # Students | % Students |
| Nursery / Preschool | 39 | 6.4% |
| Kindergarten | 35 | 5.7% |
| Elementary School | 143 | 23.4% |
| Middle School | 185 | 30.2% |
| High School | 135 | 22.1% |
| College / Undergraduate | 59 | 9.6% |
| Graduate / Professional | 16 | 2.6% |
| Total | 612 | 100.0% |
School Enrollment by Age by Funding Source in Cedar Point
Out of a total of 612 students who are enrolled in schools in Cedar Point, 118 (19.3%) attend a private institution, while the remaining 494 (80.7%) are enrolled in public schools. The age group of 3 to 4 year olds has the highest likelihood of being enrolled in private schools, with 18 (100.0% in the age bracket) enrolled. Conversely, the age group of 18 to 19 year olds has the lowest likelihood of being enrolled in a private school, with 30 (100.0% in the age bracket) attending a public institution.
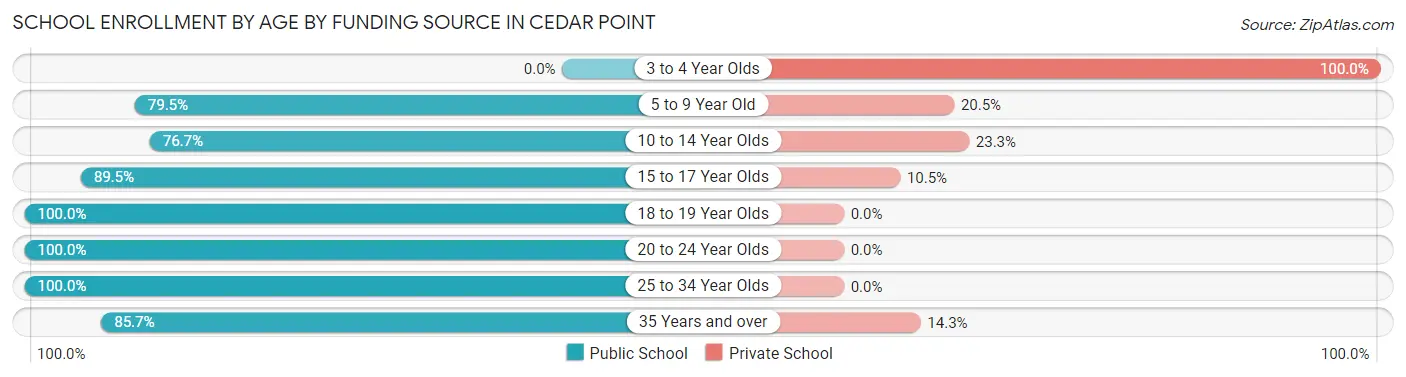
| Age Bracket | Public School | Private School |
| 3 to 4 Year Olds | 0 (0.0%) | 18 (100.0%) |
| 5 to 9 Year Old | 147 (79.5%) | 38 (20.5%) |
| 10 to 14 Year Olds | 148 (76.7%) | 45 (23.3%) |
| 15 to 17 Year Olds | 111 (89.5%) | 13 (10.5%) |
| 18 to 19 Year Olds | 30 (100.0%) | 0 (0.0%) |
| 20 to 24 Year Olds | 20 (100.0%) | 0 (0.0%) |
| 25 to 34 Year Olds | 14 (100.0%) | 0 (0.0%) |
| 35 Years and over | 24 (85.7%) | 4 (14.3%) |
| Total | 494 (80.7%) | 118 (19.3%) |
Educational Attainment by Field of Study in Cedar Point
Business (133 | 18.0%), education (102 | 13.8%), science & technology (98 | 13.3%), arts & humanities (94 | 12.8%), and bio, nature & agricultural (71 | 9.6%) are the most common fields of study among 737 individuals in Cedar Point who have obtained a bachelor's degree or higher.
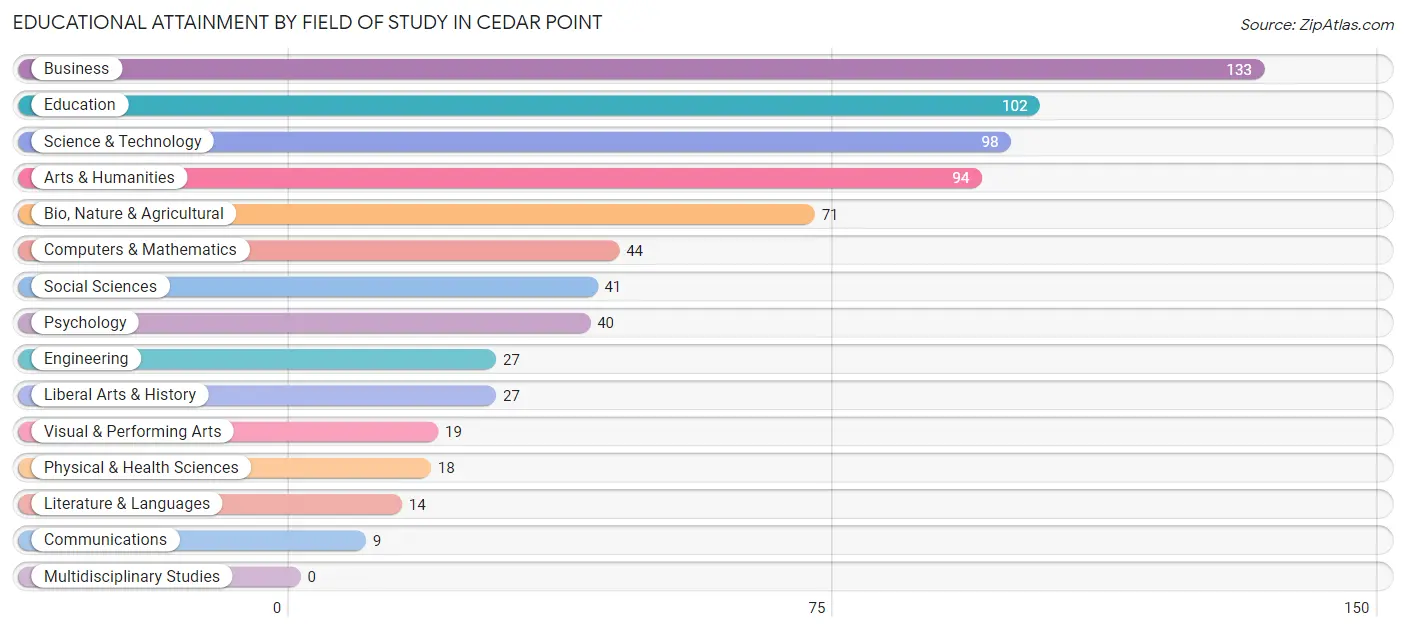
| Field of Study | # Graduates | % Graduates |
| Computers & Mathematics | 44 | 6.0% |
| Bio, Nature & Agricultural | 71 | 9.6% |
| Physical & Health Sciences | 18 | 2.4% |
| Psychology | 40 | 5.4% |
| Social Sciences | 41 | 5.6% |
| Engineering | 27 | 3.7% |
| Multidisciplinary Studies | 0 | 0.0% |
| Science & Technology | 98 | 13.3% |
| Business | 133 | 18.0% |
| Education | 102 | 13.8% |
| Literature & Languages | 14 | 1.9% |
| Liberal Arts & History | 27 | 3.7% |
| Visual & Performing Arts | 19 | 2.6% |
| Communications | 9 | 1.2% |
| Arts & Humanities | 94 | 12.8% |
| Total | 737 | 100.0% |
Transportation & Commute in Cedar Point
Vehicle Availability by Sex in Cedar Point
The most prevalent vehicle ownership categories in Cedar Point are males with 2 vehicles (269, accounting for 53.4%) and females with 2 vehicles (226, making up 67.2%).
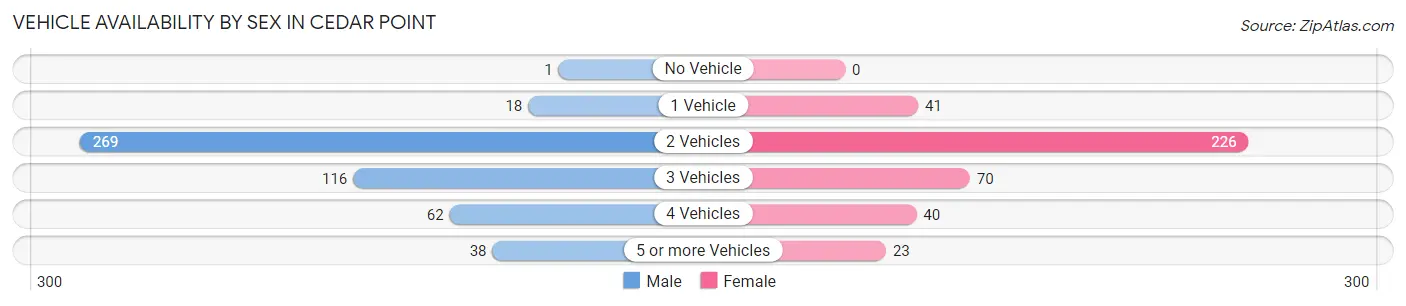
| Vehicles Available | Male | Female |
| No Vehicle | 1 (0.2%) | 0 (0.0%) |
| 1 Vehicle | 18 (3.6%) | 41 (10.2%) |
| 2 Vehicles | 269 (53.4%) | 226 (56.5%) |
| 3 Vehicles | 116 (23.0%) | 70 (17.5%) |
| 4 Vehicles | 62 (12.3%) | 40 (10.0%) |
| 5 or more Vehicles | 38 (7.5%) | 23 (5.8%) |
| Total | 504 (100.0%) | 400 (100.0%) |
Commute Time in Cedar Point
The most frequently occuring commute durations in Cedar Point are 10 to 14 minutes (240 commuters, 29.7%), 30 to 34 minutes (152 commuters, 18.8%), and 5 to 9 minutes (93 commuters, 11.5%).
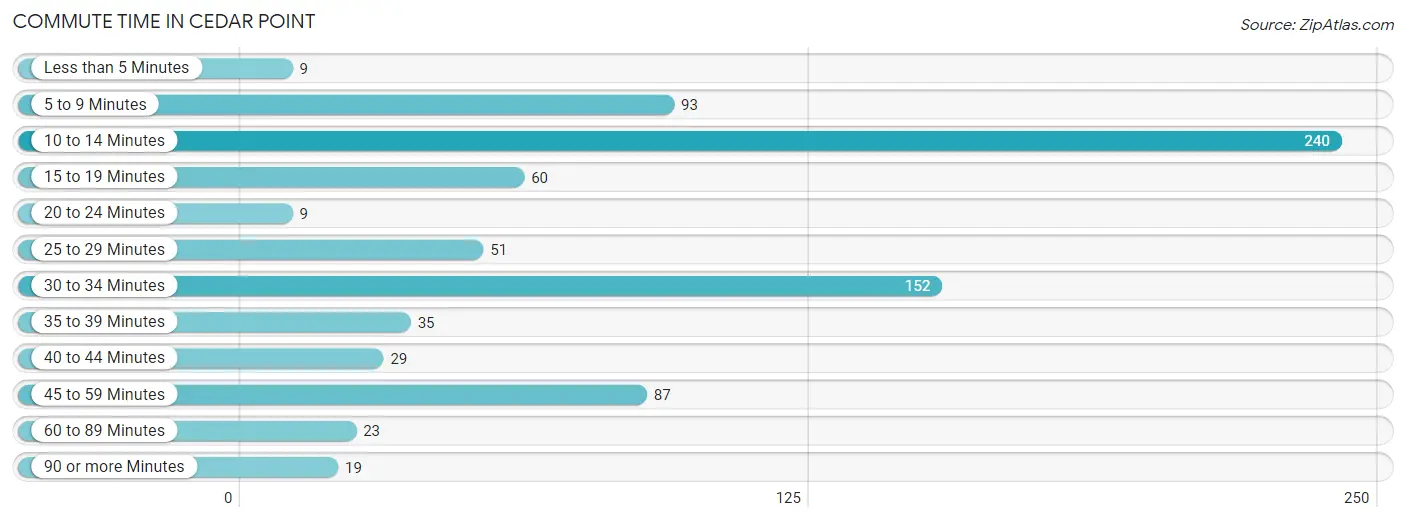
| Commute Time | # Commuters | % Commuters |
| Less than 5 Minutes | 9 | 1.1% |
| 5 to 9 Minutes | 93 | 11.5% |
| 10 to 14 Minutes | 240 | 29.7% |
| 15 to 19 Minutes | 60 | 7.4% |
| 20 to 24 Minutes | 9 | 1.1% |
| 25 to 29 Minutes | 51 | 6.3% |
| 30 to 34 Minutes | 152 | 18.8% |
| 35 to 39 Minutes | 35 | 4.3% |
| 40 to 44 Minutes | 29 | 3.6% |
| 45 to 59 Minutes | 87 | 10.8% |
| 60 to 89 Minutes | 23 | 2.9% |
| 90 or more Minutes | 19 | 2.4% |
Commute Time by Sex in Cedar Point
The most common commute times in Cedar Point are 30 to 34 minutes (103 commuters, 21.3%) for males and 10 to 14 minutes (141 commuters, 43.5%) for females.
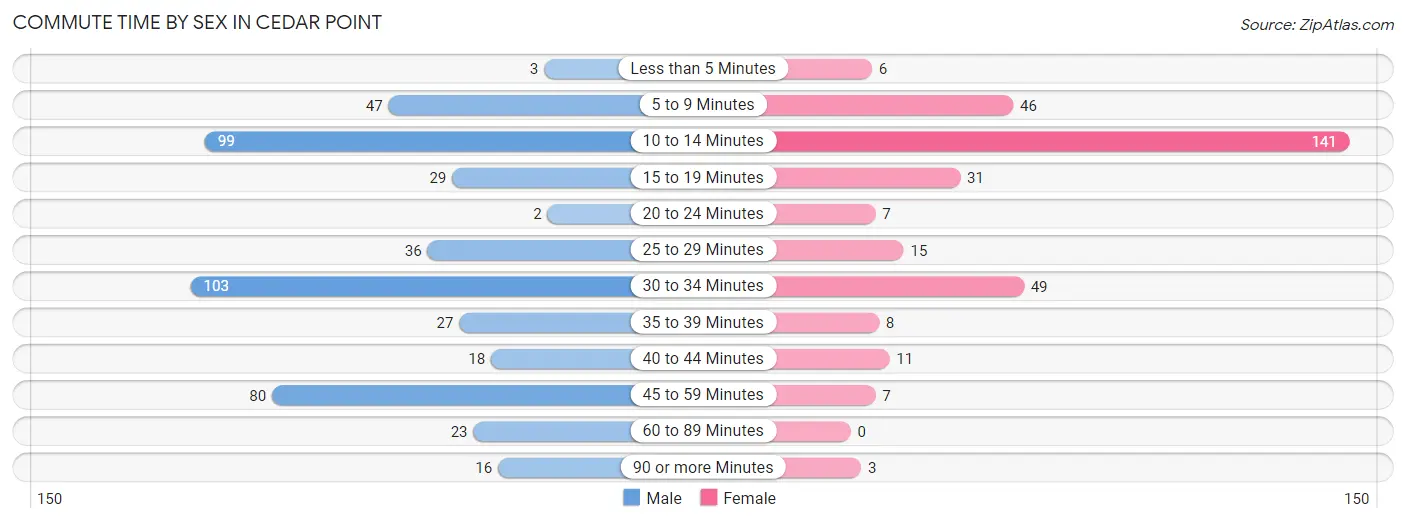
| Commute Time | Male | Female |
| Less than 5 Minutes | 3 (0.6%) | 6 (1.8%) |
| 5 to 9 Minutes | 47 (9.7%) | 46 (14.2%) |
| 10 to 14 Minutes | 99 (20.5%) | 141 (43.5%) |
| 15 to 19 Minutes | 29 (6.0%) | 31 (9.6%) |
| 20 to 24 Minutes | 2 (0.4%) | 7 (2.2%) |
| 25 to 29 Minutes | 36 (7.4%) | 15 (4.6%) |
| 30 to 34 Minutes | 103 (21.3%) | 49 (15.1%) |
| 35 to 39 Minutes | 27 (5.6%) | 8 (2.5%) |
| 40 to 44 Minutes | 18 (3.7%) | 11 (3.4%) |
| 45 to 59 Minutes | 80 (16.6%) | 7 (2.2%) |
| 60 to 89 Minutes | 23 (4.8%) | 0 (0.0%) |
| 90 or more Minutes | 16 (3.3%) | 3 (0.9%) |
Time of Departure to Work by Sex in Cedar Point
The most frequent times of departure to work in Cedar Point are 7:00 AM to 7:29 AM (102, 21.1%) for males and 6:30 AM to 6:59 AM (68, 21.0%) for females.
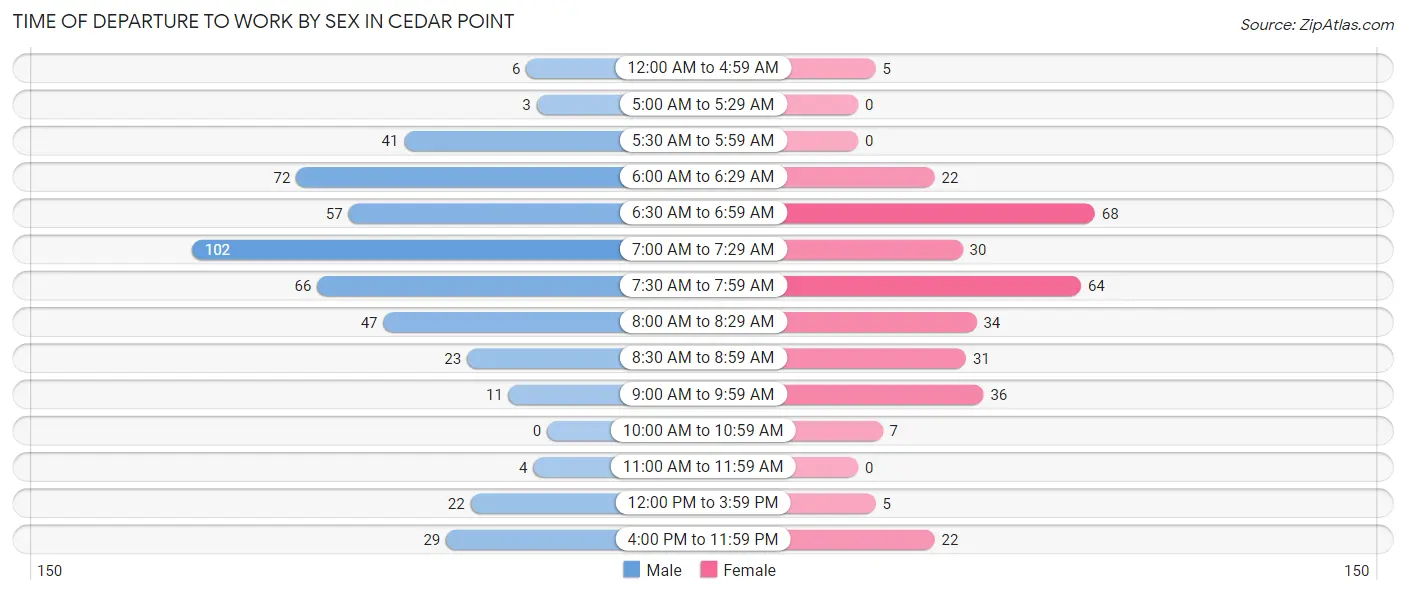
| Time of Departure | Male | Female |
| 12:00 AM to 4:59 AM | 6 (1.2%) | 5 (1.5%) |
| 5:00 AM to 5:29 AM | 3 (0.6%) | 0 (0.0%) |
| 5:30 AM to 5:59 AM | 41 (8.5%) | 0 (0.0%) |
| 6:00 AM to 6:29 AM | 72 (14.9%) | 22 (6.8%) |
| 6:30 AM to 6:59 AM | 57 (11.8%) | 68 (21.0%) |
| 7:00 AM to 7:29 AM | 102 (21.1%) | 30 (9.3%) |
| 7:30 AM to 7:59 AM | 66 (13.7%) | 64 (19.8%) |
| 8:00 AM to 8:29 AM | 47 (9.7%) | 34 (10.5%) |
| 8:30 AM to 8:59 AM | 23 (4.8%) | 31 (9.6%) |
| 9:00 AM to 9:59 AM | 11 (2.3%) | 36 (11.1%) |
| 10:00 AM to 10:59 AM | 0 (0.0%) | 7 (2.2%) |
| 11:00 AM to 11:59 AM | 4 (0.8%) | 0 (0.0%) |
| 12:00 PM to 3:59 PM | 22 (4.5%) | 5 (1.5%) |
| 4:00 PM to 11:59 PM | 29 (6.0%) | 22 (6.8%) |
| Total | 483 (100.0%) | 324 (100.0%) |
Housing Occupancy in Cedar Point
Occupancy by Ownership in Cedar Point
Of the total 815 dwellings in Cedar Point, owner-occupied units account for 685 (84.1%), while renter-occupied units make up 130 (16.0%).
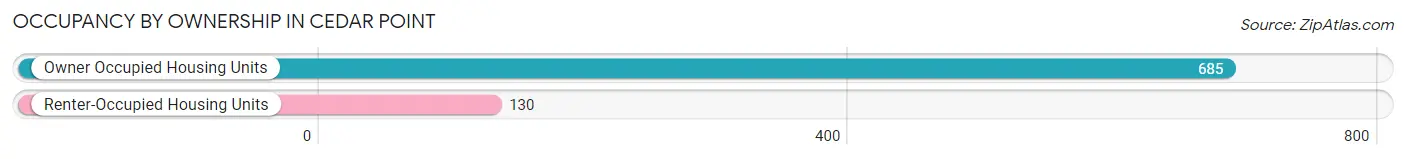
| Occupancy | # Housing Units | % Housing Units |
| Owner Occupied Housing Units | 685 | 84.1% |
| Renter-Occupied Housing Units | 130 | 16.0% |
| Total Occupied Housing Units | 815 | 100.0% |
Occupancy by Household Size in Cedar Point
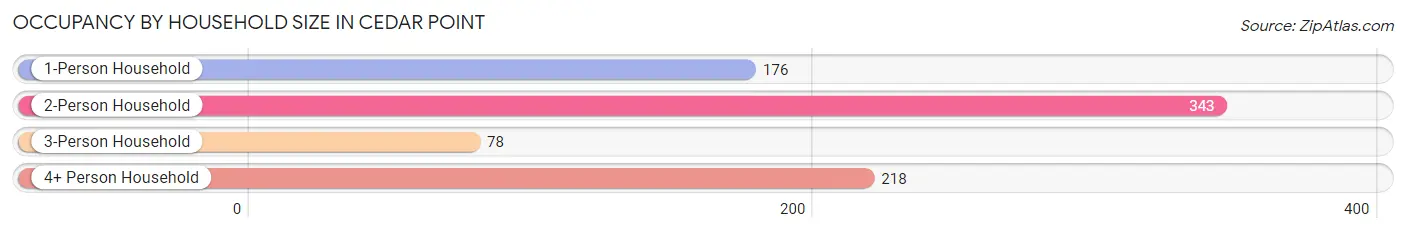
| Household Size | # Housing Units | % Housing Units |
| 1-Person Household | 176 | 21.6% |
| 2-Person Household | 343 | 42.1% |
| 3-Person Household | 78 | 9.6% |
| 4+ Person Household | 218 | 26.8% |
| Total Housing Units | 815 | 100.0% |
Occupancy by Ownership by Household Size in Cedar Point
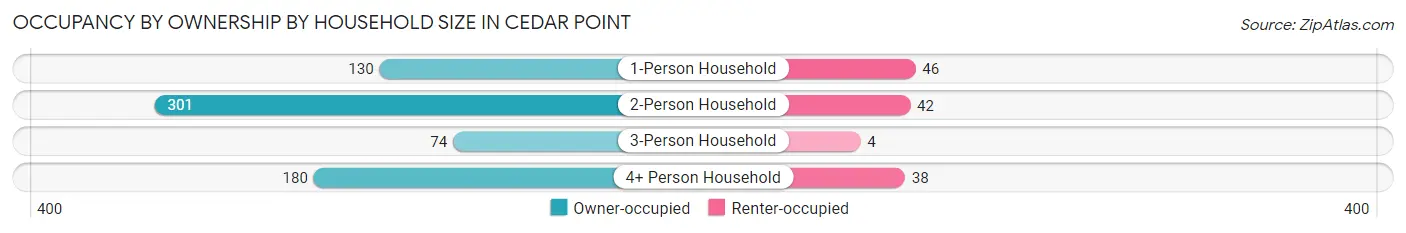
| Household Size | Owner-occupied | Renter-occupied |
| 1-Person Household | 130 (73.9%) | 46 (26.1%) |
| 2-Person Household | 301 (87.8%) | 42 (12.2%) |
| 3-Person Household | 74 (94.9%) | 4 (5.1%) |
| 4+ Person Household | 180 (82.6%) | 38 (17.4%) |
| Total Housing Units | 685 (84.1%) | 130 (16.0%) |
Occupancy by Educational Attainment in Cedar Point
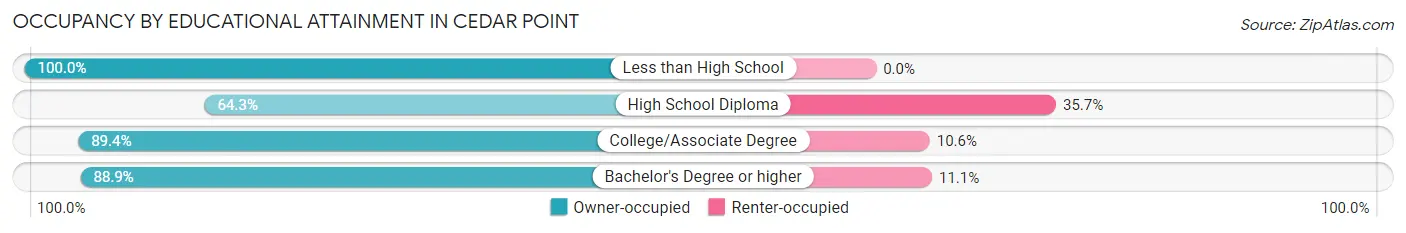
| Household Size | Owner-occupied | Renter-occupied |
| Less than High School | 12 (100.0%) | 0 (0.0%) |
| High School Diploma | 110 (64.3%) | 61 (35.7%) |
| College/Associate Degree | 210 (89.4%) | 25 (10.6%) |
| Bachelor's Degree or higher | 353 (88.9%) | 44 (11.1%) |
Occupancy by Age of Householder in Cedar Point
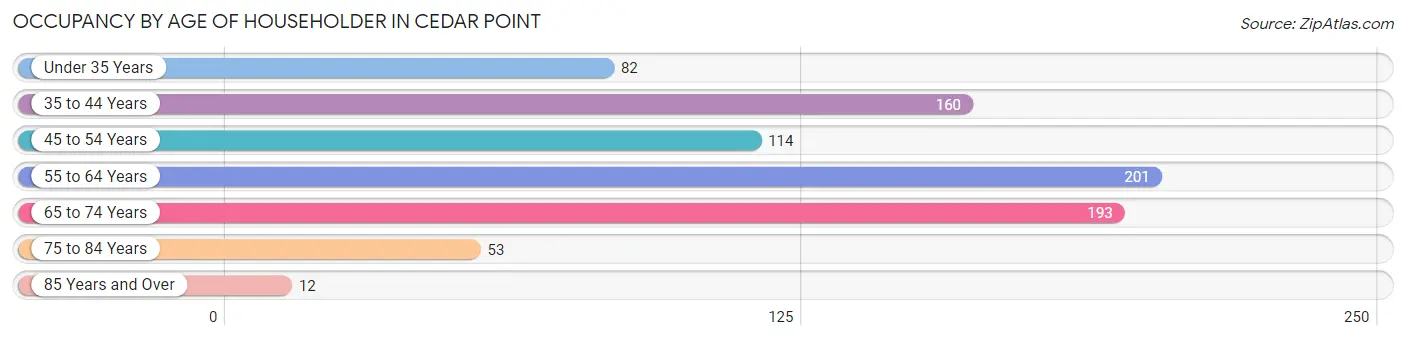
| Age Bracket | # Households | % Households |
| Under 35 Years | 82 | 10.1% |
| 35 to 44 Years | 160 | 19.6% |
| 45 to 54 Years | 114 | 14.0% |
| 55 to 64 Years | 201 | 24.7% |
| 65 to 74 Years | 193 | 23.7% |
| 75 to 84 Years | 53 | 6.5% |
| 85 Years and Over | 12 | 1.5% |
| Total | 815 | 100.0% |
Housing Finances in Cedar Point
Median Income by Occupancy in Cedar Point
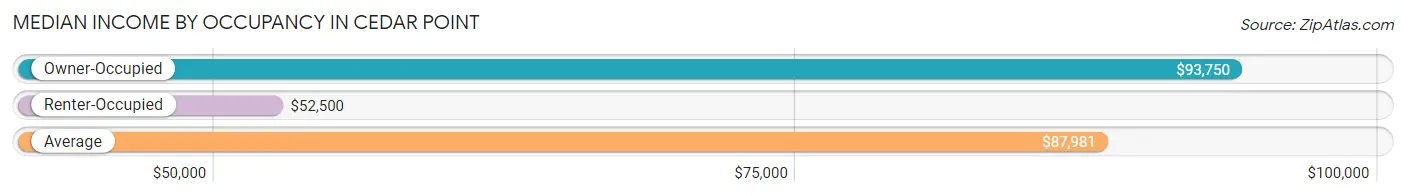
| Occupancy Type | # Households | Median Income |
| Owner-Occupied | 685 (84.1%) | $93,750 |
| Renter-Occupied | 130 (16.0%) | $52,500 |
| Average | 815 (100.0%) | $87,981 |
Occupancy by Householder Income Bracket in Cedar Point
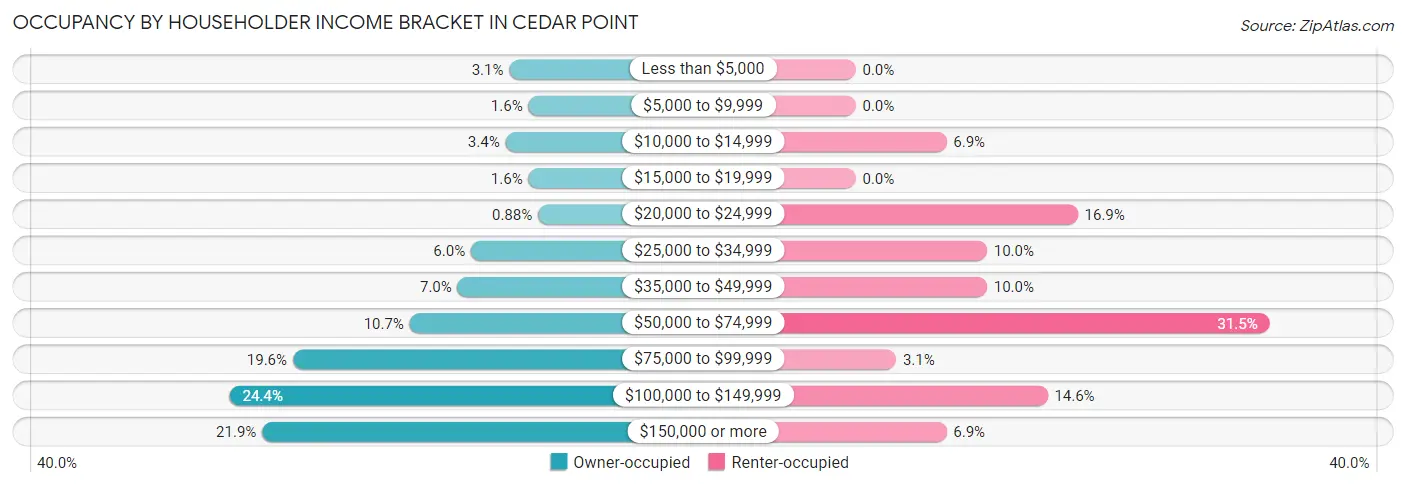
| Income Bracket | Owner-occupied | Renter-occupied |
| Less than $5,000 | 21 (3.1%) | 0 (0.0%) |
| $5,000 to $9,999 | 11 (1.6%) | 0 (0.0%) |
| $10,000 to $14,999 | 23 (3.4%) | 9 (6.9%) |
| $15,000 to $19,999 | 11 (1.6%) | 0 (0.0%) |
| $20,000 to $24,999 | 6 (0.9%) | 22 (16.9%) |
| $25,000 to $34,999 | 41 (6.0%) | 13 (10.0%) |
| $35,000 to $49,999 | 48 (7.0%) | 13 (10.0%) |
| $50,000 to $74,999 | 73 (10.7%) | 41 (31.5%) |
| $75,000 to $99,999 | 134 (19.6%) | 4 (3.1%) |
| $100,000 to $149,999 | 167 (24.4%) | 19 (14.6%) |
| $150,000 or more | 150 (21.9%) | 9 (6.9%) |
| Total | 685 (100.0%) | 130 (100.0%) |
Monthly Housing Cost Tiers in Cedar Point
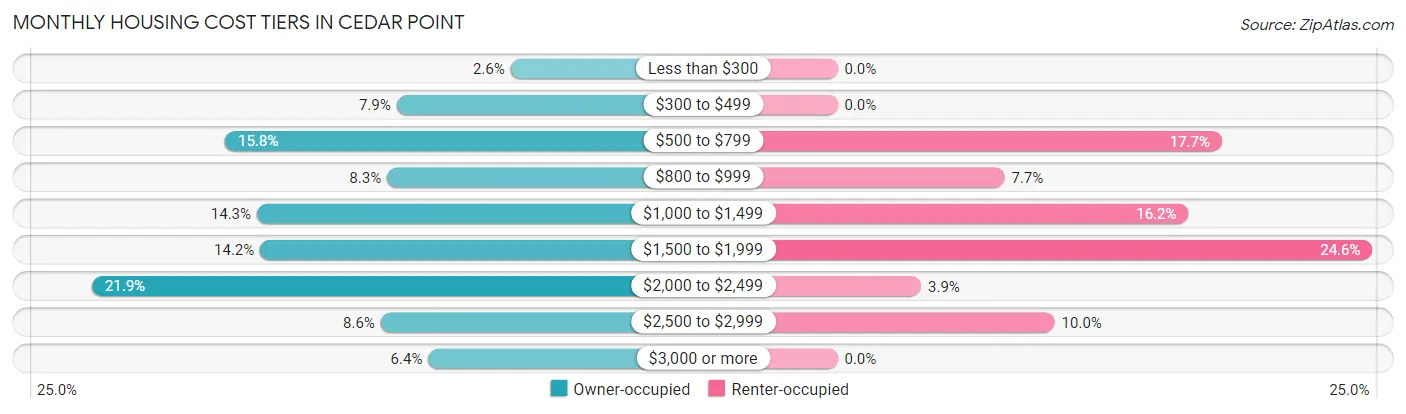
| Monthly Cost | Owner-occupied | Renter-occupied |
| Less than $300 | 18 (2.6%) | 0 (0.0%) |
| $300 to $499 | 54 (7.9%) | 0 (0.0%) |
| $500 to $799 | 108 (15.8%) | 23 (17.7%) |
| $800 to $999 | 57 (8.3%) | 10 (7.7%) |
| $1,000 to $1,499 | 98 (14.3%) | 21 (16.2%) |
| $1,500 to $1,999 | 97 (14.2%) | 32 (24.6%) |
| $2,000 to $2,499 | 150 (21.9%) | 5 (3.8%) |
| $2,500 to $2,999 | 59 (8.6%) | 13 (10.0%) |
| $3,000 or more | 44 (6.4%) | 0 (0.0%) |
| Total | 685 (100.0%) | 130 (100.0%) |
Physical Housing Characteristics in Cedar Point
Housing Structures in Cedar Point
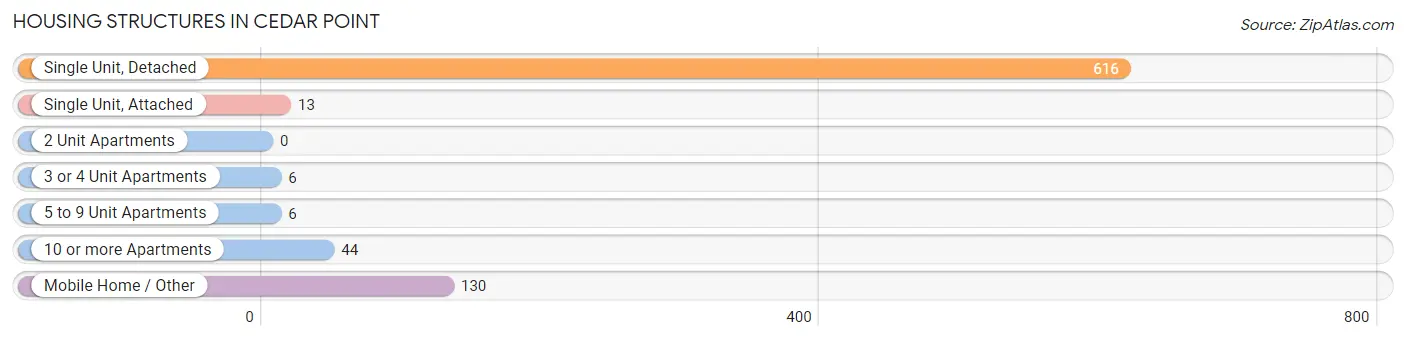
| Structure Type | # Housing Units | % Housing Units |
| Single Unit, Detached | 616 | 75.6% |
| Single Unit, Attached | 13 | 1.6% |
| 2 Unit Apartments | 0 | 0.0% |
| 3 or 4 Unit Apartments | 6 | 0.7% |
| 5 to 9 Unit Apartments | 6 | 0.7% |
| 10 or more Apartments | 44 | 5.4% |
| Mobile Home / Other | 130 | 16.0% |
| Total | 815 | 100.0% |
Housing Structures by Occupancy in Cedar Point
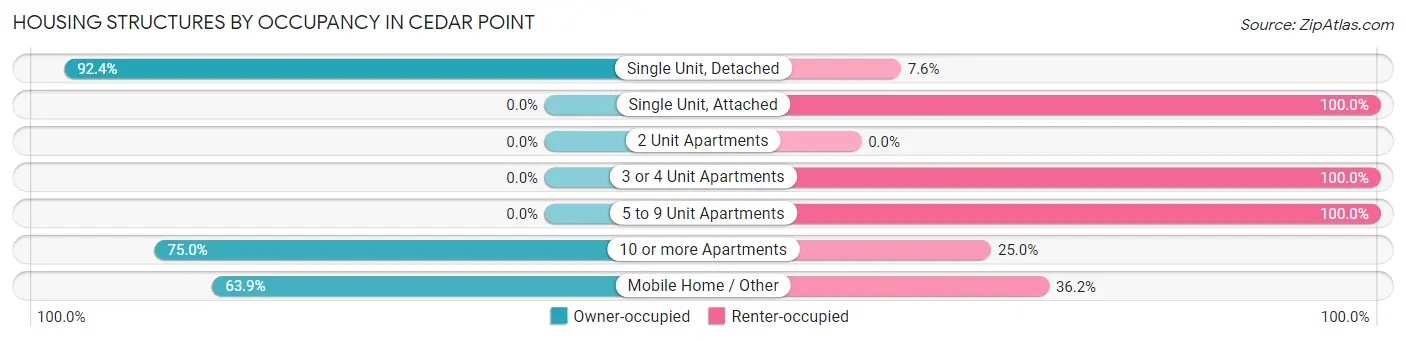
| Structure Type | Owner-occupied | Renter-occupied |
| Single Unit, Detached | 569 (92.4%) | 47 (7.6%) |
| Single Unit, Attached | 0 (0.0%) | 13 (100.0%) |
| 2 Unit Apartments | 0 (0.0%) | 0 (0.0%) |
| 3 or 4 Unit Apartments | 0 (0.0%) | 6 (100.0%) |
| 5 to 9 Unit Apartments | 0 (0.0%) | 6 (100.0%) |
| 10 or more Apartments | 33 (75.0%) | 11 (25.0%) |
| Mobile Home / Other | 83 (63.8%) | 47 (36.1%) |
| Total | 685 (84.1%) | 130 (16.0%) |
Housing Structures by Number of Rooms in Cedar Point
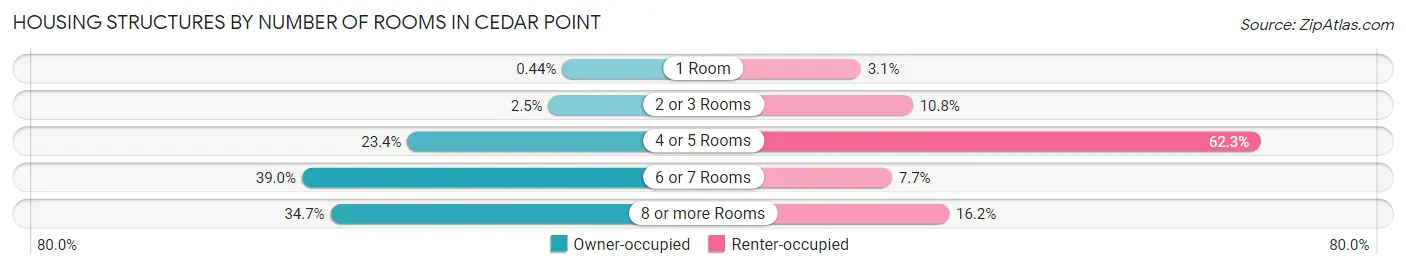
| Number of Rooms | Owner-occupied | Renter-occupied |
| 1 Room | 3 (0.4%) | 4 (3.1%) |
| 2 or 3 Rooms | 17 (2.5%) | 14 (10.8%) |
| 4 or 5 Rooms | 160 (23.4%) | 81 (62.3%) |
| 6 or 7 Rooms | 267 (39.0%) | 10 (7.7%) |
| 8 or more Rooms | 238 (34.7%) | 21 (16.2%) |
| Total | 685 (100.0%) | 130 (100.0%) |
Housing Structure by Heating Type in Cedar Point
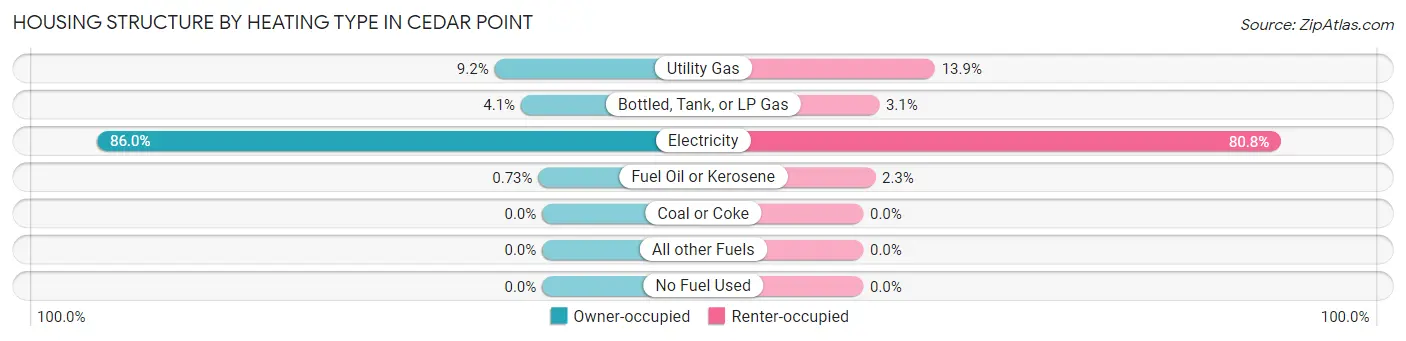
| Heating Type | Owner-occupied | Renter-occupied |
| Utility Gas | 63 (9.2%) | 18 (13.9%) |
| Bottled, Tank, or LP Gas | 28 (4.1%) | 4 (3.1%) |
| Electricity | 589 (86.0%) | 105 (80.8%) |
| Fuel Oil or Kerosene | 5 (0.7%) | 3 (2.3%) |
| Coal or Coke | 0 (0.0%) | 0 (0.0%) |
| All other Fuels | 0 (0.0%) | 0 (0.0%) |
| No Fuel Used | 0 (0.0%) | 0 (0.0%) |
| Total | 685 (100.0%) | 130 (100.0%) |
Household Vehicle Usage in Cedar Point
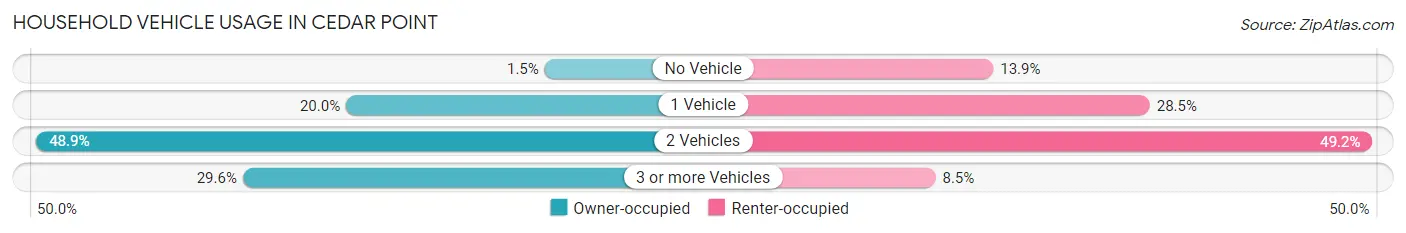
| Vehicles per Household | Owner-occupied | Renter-occupied |
| No Vehicle | 10 (1.5%) | 18 (13.9%) |
| 1 Vehicle | 137 (20.0%) | 37 (28.5%) |
| 2 Vehicles | 335 (48.9%) | 64 (49.2%) |
| 3 or more Vehicles | 203 (29.6%) | 11 (8.5%) |
| Total | 685 (100.0%) | 130 (100.0%) |
Real Estate & Mortgages in Cedar Point
Real Estate and Mortgage Overview in Cedar Point
| Characteristic | Without Mortgage | With Mortgage |
| Housing Units | 238 | 447 |
| Median Property Value | $356,400 | $416,300 |
| Median Household Income | $60,833 | $138 |
| Monthly Housing Costs | $584 | $37 |
| Real Estate Taxes | $1,939 | $0 |
Property Value by Mortgage Status in Cedar Point
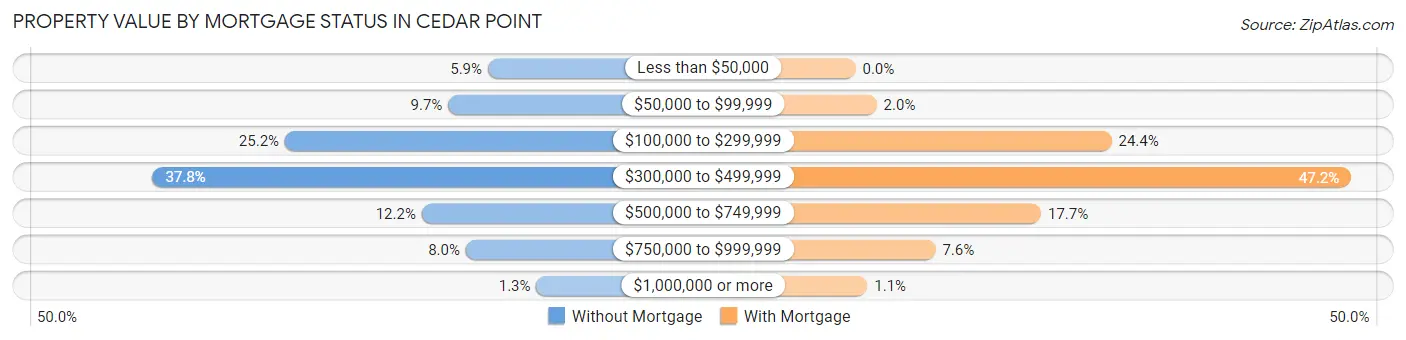
| Property Value | Without Mortgage | With Mortgage |
| Less than $50,000 | 14 (5.9%) | 0 (0.0%) |
| $50,000 to $99,999 | 23 (9.7%) | 9 (2.0%) |
| $100,000 to $299,999 | 60 (25.2%) | 109 (24.4%) |
| $300,000 to $499,999 | 90 (37.8%) | 211 (47.2%) |
| $500,000 to $749,999 | 29 (12.2%) | 79 (17.7%) |
| $750,000 to $999,999 | 19 (8.0%) | 34 (7.6%) |
| $1,000,000 or more | 3 (1.3%) | 5 (1.1%) |
| Total | 238 (100.0%) | 447 (100.0%) |
Household Income by Mortgage Status in Cedar Point
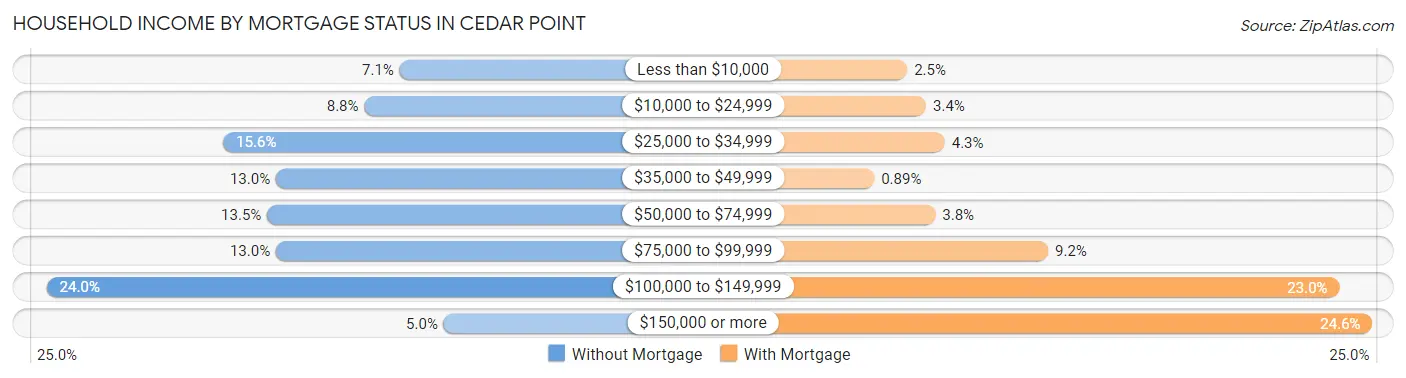
| Household Income | Without Mortgage | With Mortgage |
| Less than $10,000 | 17 (7.1%) | 11 (2.5%) |
| $10,000 to $24,999 | 21 (8.8%) | 15 (3.4%) |
| $25,000 to $34,999 | 37 (15.5%) | 19 (4.3%) |
| $35,000 to $49,999 | 31 (13.0%) | 4 (0.9%) |
| $50,000 to $74,999 | 32 (13.5%) | 17 (3.8%) |
| $75,000 to $99,999 | 31 (13.0%) | 41 (9.2%) |
| $100,000 to $149,999 | 57 (23.9%) | 103 (23.0%) |
| $150,000 or more | 12 (5.0%) | 110 (24.6%) |
| Total | 238 (100.0%) | 447 (100.0%) |
Property Value to Household Income Ratio in Cedar Point
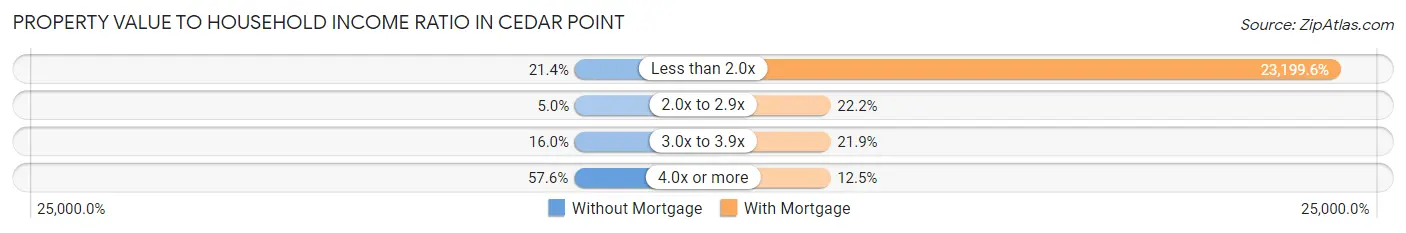
| Value-to-Income Ratio | Without Mortgage | With Mortgage |
| Less than 2.0x | 51 (21.4%) | 103,702 (23,199.5%) |
| 2.0x to 2.9x | 12 (5.0%) | 99 (22.2%) |
| 3.0x to 3.9x | 38 (16.0%) | 98 (21.9%) |
| 4.0x or more | 137 (57.6%) | 56 (12.5%) |
| Total | 238 (100.0%) | 447 (100.0%) |
Real Estate Taxes by Mortgage Status in Cedar Point
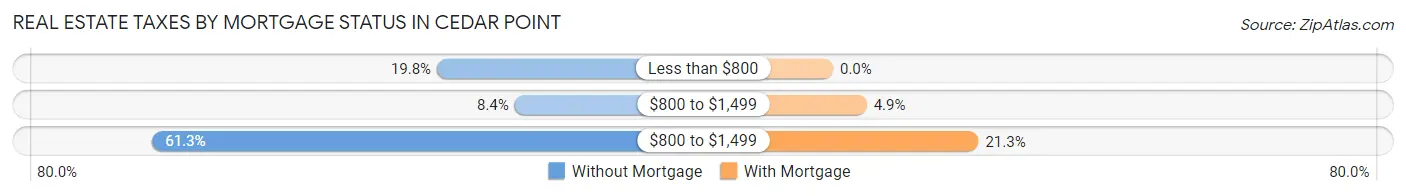
| Property Taxes | Without Mortgage | With Mortgage |
| Less than $800 | 47 (19.8%) | 0 (0.0%) |
| $800 to $1,499 | 20 (8.4%) | 22 (4.9%) |
| $800 to $1,499 | 146 (61.3%) | 95 (21.2%) |
| Total | 238 (100.0%) | 447 (100.0%) |
Health & Disability in Cedar Point
Health Insurance Coverage by Age in Cedar Point
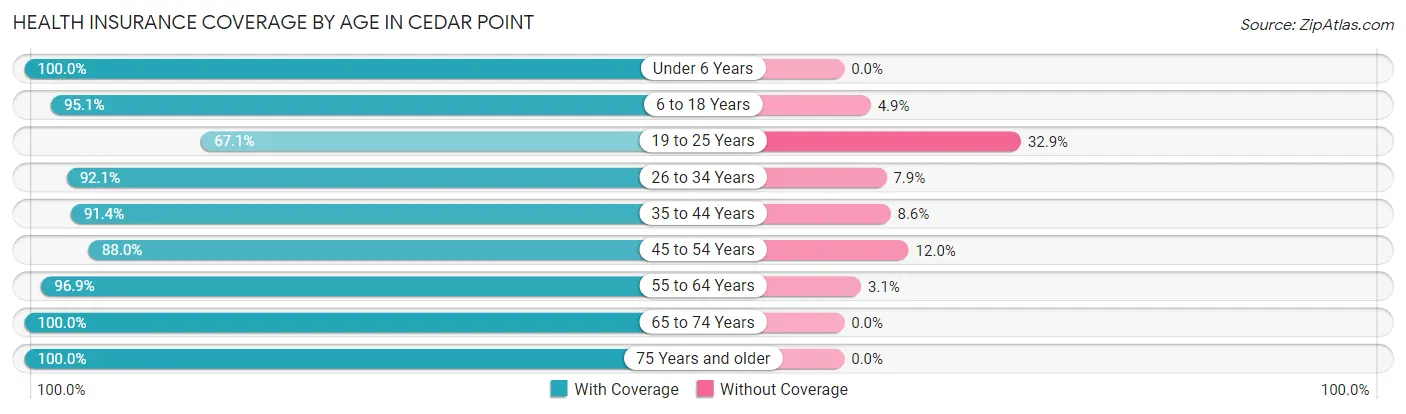
| Age Bracket | With Coverage | Without Coverage |
| Under 6 Years | 151 (100.0%) | 0 (0.0%) |
| 6 to 18 Years | 482 (95.1%) | 25 (4.9%) |
| 19 to 25 Years | 57 (67.1%) | 28 (32.9%) |
| 26 to 34 Years | 129 (92.1%) | 11 (7.9%) |
| 35 to 44 Years | 212 (91.4%) | 20 (8.6%) |
| 45 to 54 Years | 220 (88.0%) | 30 (12.0%) |
| 55 to 64 Years | 309 (96.9%) | 10 (3.1%) |
| 65 to 74 Years | 326 (100.0%) | 0 (0.0%) |
| 75 Years and older | 125 (100.0%) | 0 (0.0%) |
| Total | 2,011 (94.2%) | 124 (5.8%) |
Health Insurance Coverage by Citizenship Status in Cedar Point
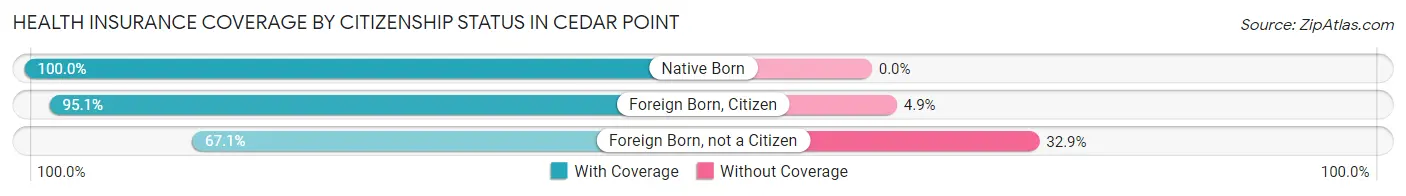
| Citizenship Status | With Coverage | Without Coverage |
| Native Born | 151 (100.0%) | 0 (0.0%) |
| Foreign Born, Citizen | 482 (95.1%) | 25 (4.9%) |
| Foreign Born, not a Citizen | 57 (67.1%) | 28 (32.9%) |
Health Insurance Coverage by Household Income in Cedar Point
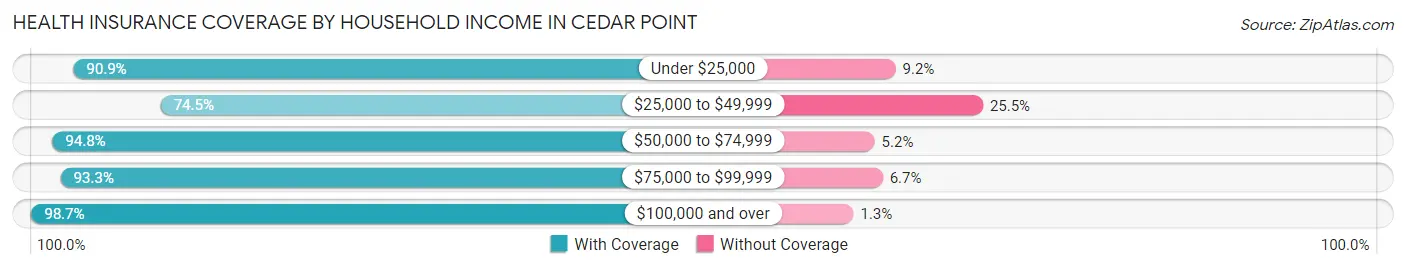
| Household Income | With Coverage | Without Coverage |
| Under $25,000 | 139 (90.8%) | 14 (9.1%) |
| $25,000 to $49,999 | 181 (74.5%) | 62 (25.5%) |
| $50,000 to $74,999 | 236 (94.8%) | 13 (5.2%) |
| $75,000 to $99,999 | 277 (93.3%) | 20 (6.7%) |
| $100,000 and over | 1,178 (98.7%) | 15 (1.3%) |
Public vs Private Health Insurance Coverage by Age in Cedar Point
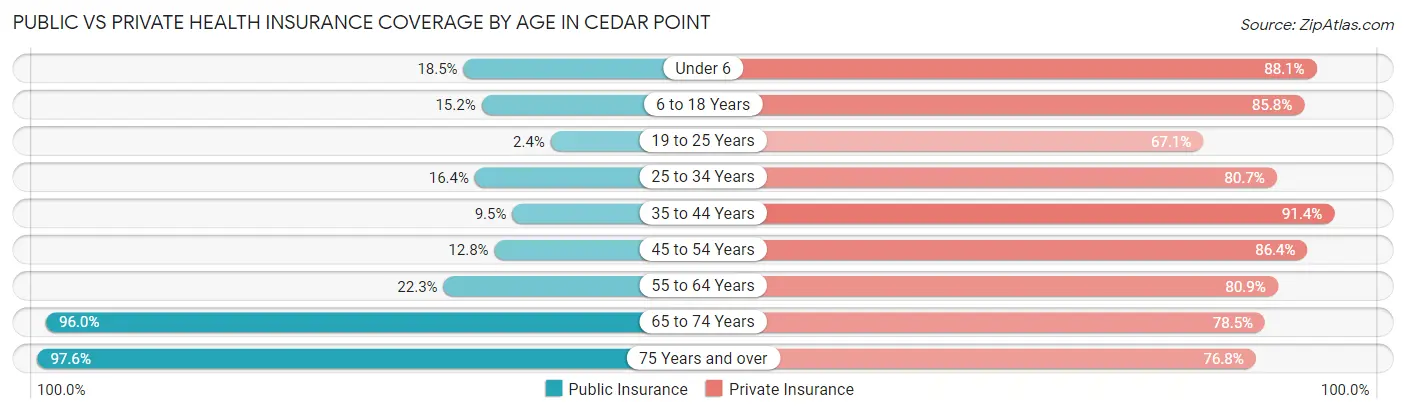
| Age Bracket | Public Insurance | Private Insurance |
| Under 6 | 28 (18.5%) | 133 (88.1%) |
| 6 to 18 Years | 77 (15.2%) | 435 (85.8%) |
| 19 to 25 Years | 2 (2.4%) | 57 (67.1%) |
| 25 to 34 Years | 23 (16.4%) | 113 (80.7%) |
| 35 to 44 Years | 22 (9.5%) | 212 (91.4%) |
| 45 to 54 Years | 32 (12.8%) | 216 (86.4%) |
| 55 to 64 Years | 71 (22.3%) | 258 (80.9%) |
| 65 to 74 Years | 313 (96.0%) | 256 (78.5%) |
| 75 Years and over | 122 (97.6%) | 96 (76.8%) |
| Total | 690 (32.3%) | 1,776 (83.2%) |
Disability Status by Sex by Age in Cedar Point
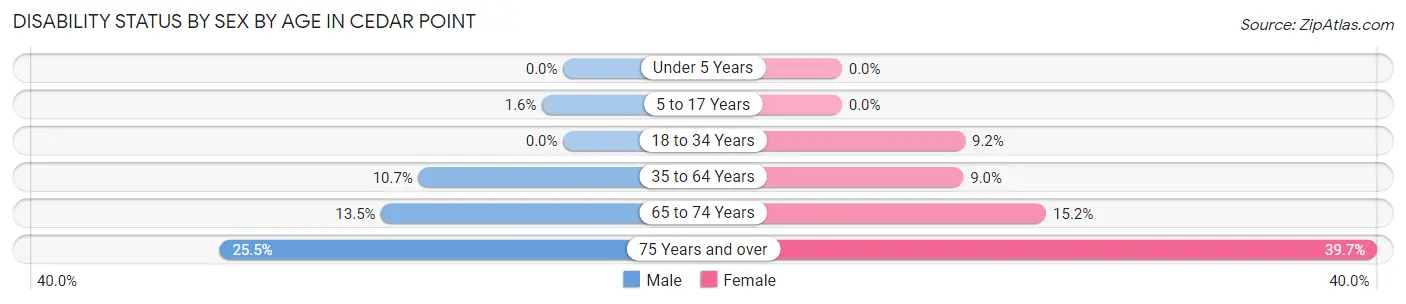
| Age Bracket | Male | Female |
| Under 5 Years | 0 (0.0%) | 0 (0.0%) |
| 5 to 17 Years | 4 (1.6%) | 0 (0.0%) |
| 18 to 34 Years | 0 (0.0%) | 13 (9.1%) |
| 35 to 64 Years | 42 (10.7%) | 37 (9.0%) |
| 65 to 74 Years | 20 (13.5%) | 27 (15.2%) |
| 75 Years and over | 12 (25.5%) | 31 (39.7%) |
Disability Class by Sex by Age in Cedar Point
Disability Class: Hearing Difficulty
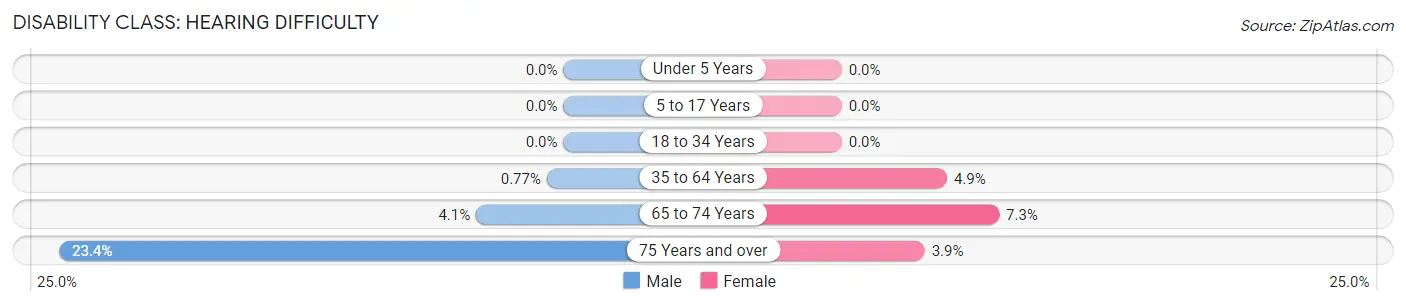
| Age Bracket | Male | Female |
| Under 5 Years | 0 (0.0%) | 0 (0.0%) |
| 5 to 17 Years | 0 (0.0%) | 0 (0.0%) |
| 18 to 34 Years | 0 (0.0%) | 0 (0.0%) |
| 35 to 64 Years | 3 (0.8%) | 20 (4.9%) |
| 65 to 74 Years | 6 (4.1%) | 13 (7.3%) |
| 75 Years and over | 11 (23.4%) | 3 (3.8%) |
Disability Class: Vision Difficulty
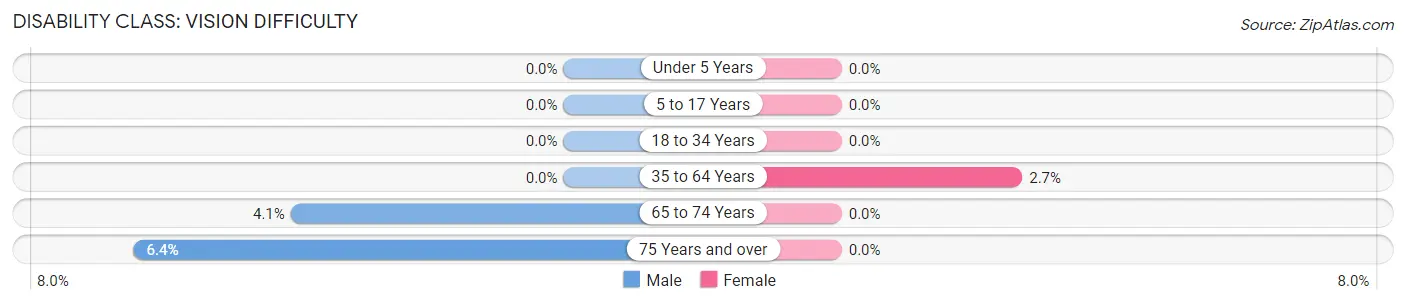
| Age Bracket | Male | Female |
| Under 5 Years | 0 (0.0%) | 0 (0.0%) |
| 5 to 17 Years | 0 (0.0%) | 0 (0.0%) |
| 18 to 34 Years | 0 (0.0%) | 0 (0.0%) |
| 35 to 64 Years | 0 (0.0%) | 11 (2.7%) |
| 65 to 74 Years | 6 (4.1%) | 0 (0.0%) |
| 75 Years and over | 3 (6.4%) | 0 (0.0%) |
Disability Class: Cognitive Difficulty
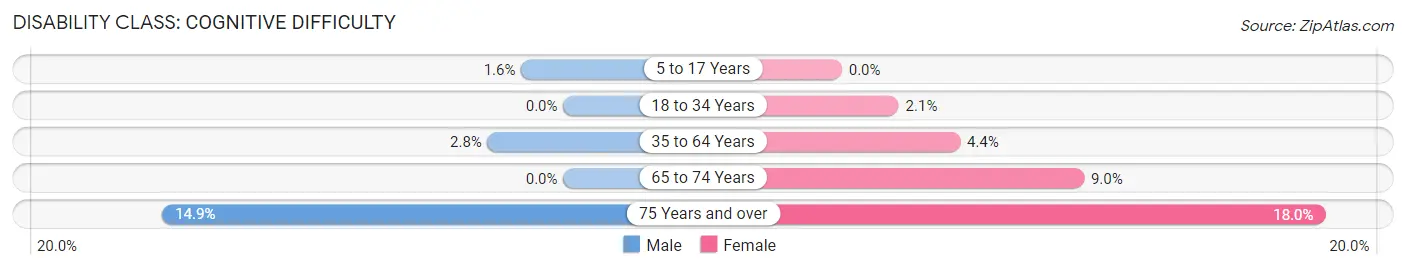
| Age Bracket | Male | Female |
| 5 to 17 Years | 4 (1.6%) | 0 (0.0%) |
| 18 to 34 Years | 0 (0.0%) | 3 (2.1%) |
| 35 to 64 Years | 11 (2.8%) | 18 (4.4%) |
| 65 to 74 Years | 0 (0.0%) | 16 (9.0%) |
| 75 Years and over | 7 (14.9%) | 14 (17.9%) |
Disability Class: Ambulatory Difficulty
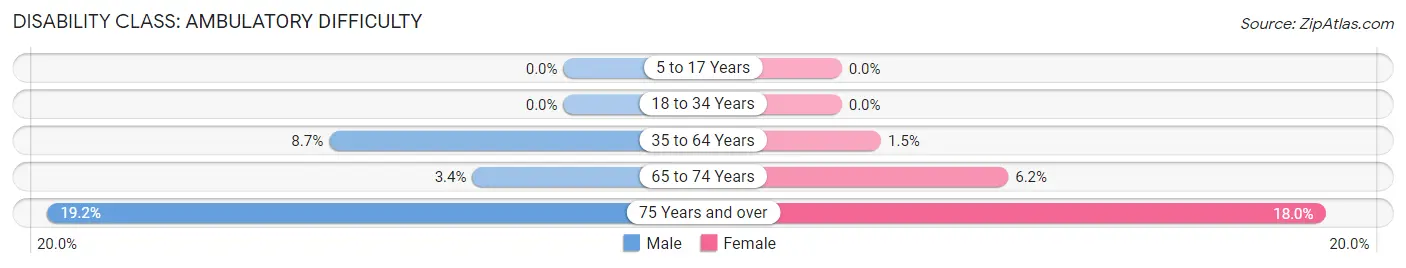
| Age Bracket | Male | Female |
| 5 to 17 Years | 0 (0.0%) | 0 (0.0%) |
| 18 to 34 Years | 0 (0.0%) | 0 (0.0%) |
| 35 to 64 Years | 34 (8.7%) | 6 (1.5%) |
| 65 to 74 Years | 5 (3.4%) | 11 (6.2%) |
| 75 Years and over | 9 (19.2%) | 14 (17.9%) |
Disability Class: Self-Care Difficulty
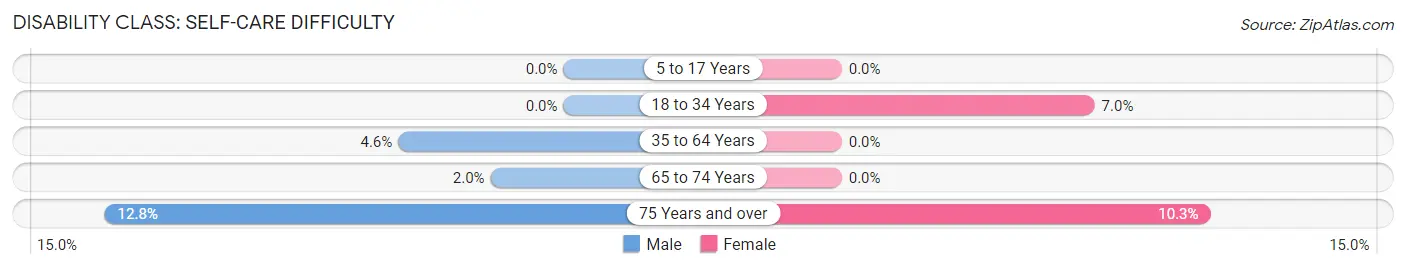
| Age Bracket | Male | Female |
| 5 to 17 Years | 0 (0.0%) | 0 (0.0%) |
| 18 to 34 Years | 0 (0.0%) | 10 (7.0%) |
| 35 to 64 Years | 18 (4.6%) | 0 (0.0%) |
| 65 to 74 Years | 3 (2.0%) | 0 (0.0%) |
| 75 Years and over | 6 (12.8%) | 8 (10.3%) |
Technology Access in Cedar Point
Computing Device Access in Cedar Point
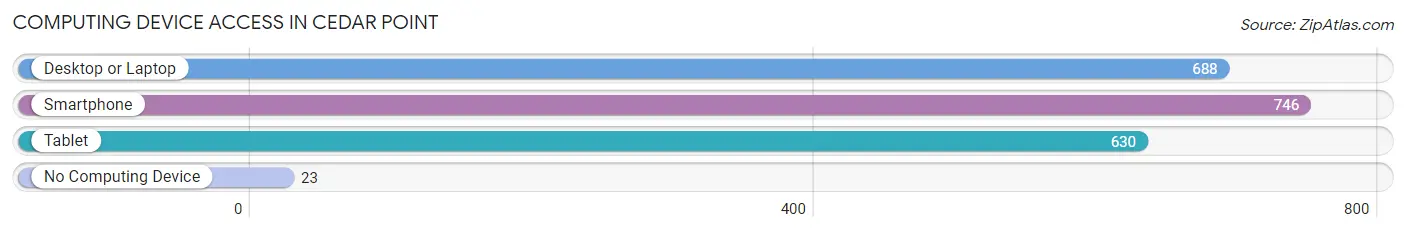
| Device Type | # Households | % Households |
| Desktop or Laptop | 688 | 84.4% |
| Smartphone | 746 | 91.5% |
| Tablet | 630 | 77.3% |
| No Computing Device | 23 | 2.8% |
| Total | 815 | 100.0% |
Internet Access in Cedar Point
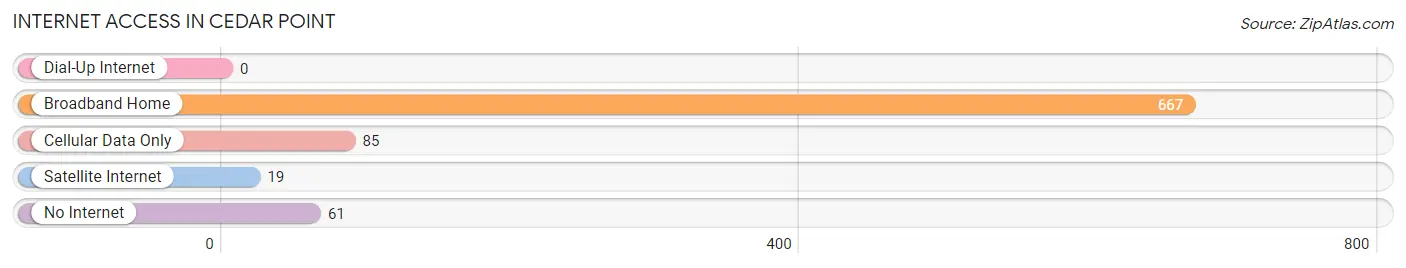
| Internet Type | # Households | % Households |
| Dial-Up Internet | 0 | 0.0% |
| Broadband Home | 667 | 81.8% |
| Cellular Data Only | 85 | 10.4% |
| Satellite Internet | 19 | 2.3% |
| No Internet | 61 | 7.5% |
| Total | 815 | 100.0% |
Cedar Point Summary
Cedar Point is a small town located in Carteret County, North Carolina. It is situated on the western shore of the Core Sound, a large estuary that separates the mainland from the Outer Banks. The town is bordered by the Atlantic Ocean to the east and the White Oak River to the west. The population of Cedar Point was 1,845 as of the 2010 census.
Geography
Cedar Point is located at 34°45'N 76°41'W (34.75, -76.68). It is situated on the western shore of the Core Sound, a large estuary that separates the mainland from the Outer Banks. The town is bordered by the Atlantic Ocean to the east and the White Oak River to the west. The town is located on the mainland, but is only a few miles from the Outer Banks.
The town is located in the Coastal Plain region of North Carolina. The terrain is generally flat, with some rolling hills. The climate is humid subtropical, with hot, humid summers and mild winters. The average annual temperature is around 70°F (21°C).
Economy
Cedar Point is a small, rural town with a limited economy. The town is primarily a fishing and tourism-based economy. The town is home to several seafood restaurants, as well as a few small shops and businesses. The town is also home to a few marinas, which provide access to the Core Sound and the Atlantic Ocean.
The town is also home to a few small manufacturing companies, including a boat building company and a furniture manufacturing company. The town is also home to a few small farms, which produce a variety of crops, including corn, soybeans, and cotton.
Demographics
As of the 2010 census, the population of Cedar Point was 1,845. The racial makeup of the town was 94.3% White, 2.2% African American, 0.7% Native American, 0.3% Asian, 0.1% Pacific Islander, 0.7% from other races, and 1.9% from two or more races. Hispanic or Latino of any race were 2.2% of the population.
The median income for a household in the town was $37,917, and the median income for a family was $45,625. The per capita income for the town was $19,945. About 11.2% of families and 14.2% of the population were below the poverty line, including 19.2% of those under age 18 and 8.3% of those age 65 or over.
Conclusion
Cedar Point is a small, rural town located in Carteret County, North Carolina. It is situated on the western shore of the Core Sound, a large estuary that separates the mainland from the Outer Banks. The town is bordered by the Atlantic Ocean to the east and the White Oak River to the west. The population of Cedar Point was 1,845 as of the 2010 census. The town is primarily a fishing and tourism-based economy, with a few small manufacturing companies and farms. The racial makeup of the town was 94.3% White, 2.2% African American, 0.7% Native American, 0.3% Asian, 0.1% Pacific Islander, 0.7% from other races, and 1.9% from two or more races. The median income for a household in the town was $37,917, and the median income for a family was $45,625. The per capita income for the town was $19,945. About 11.2% of families and 14.2% of the population were below the poverty line.
Common Questions
What is the Total Population of Cedar Point?
Total Population of Cedar Point is 2,198.
What is the Total Male Population of Cedar Point?
Total Male Population of Cedar Point is 1,053.
What is the Total Female Population of Cedar Point?
Total Female Population of Cedar Point is 1,145.
What is the Ratio of Males per 100 Females in Cedar Point?
There are 91.97 Males per 100 Females in Cedar Point.
What is the Ratio of Females per 100 Males in Cedar Point?
There are 108.74 Females per 100 Males in Cedar Point.
What is the Median Population Age in Cedar Point?
Median Population Age in Cedar Point is 41.8 Years.
What is the Average Family Size in Cedar Point
Average Family Size in Cedar Point is 3.2 People.
What is the Average Household Size in Cedar Point
Average Household Size in Cedar Point is 2.7 People.
What is Per Capita Income in Cedar Point?
Per Capita income in Cedar Point is $43,149.
What is the Median Family Income in Cedar Point?
Median Family Income in Cedar Point is $102,692.
What is the Median Household income in Cedar Point?
Median Household Income in Cedar Point is $87,981.
What is Income or Wage Gap in Cedar Point?
Income or Wage Gap in Cedar Point is 44.4%.
Women in Cedar Point earn 55.6 cents for every dollar earned by a man.
What is Inequality or Gini Index in Cedar Point?
Inequality or Gini Index in Cedar Point is 0.44.
How Large is the Labor Force in Cedar Point?
There are 964 People in the Labor Forcein in Cedar Point.
What is the Percentage of People in the Labor Force in Cedar Point?
59.7% of People are in the Labor Force in Cedar Point.
What is the Unemployment Rate in Cedar Point?
Unemployment Rate in Cedar Point is 4.1%.