Cities with the Most Immigrants from Eastern Europe in Louisiana
RELATED REPORTS & OPTIONS
Eastern Europe
Louisiana
Compare Cities
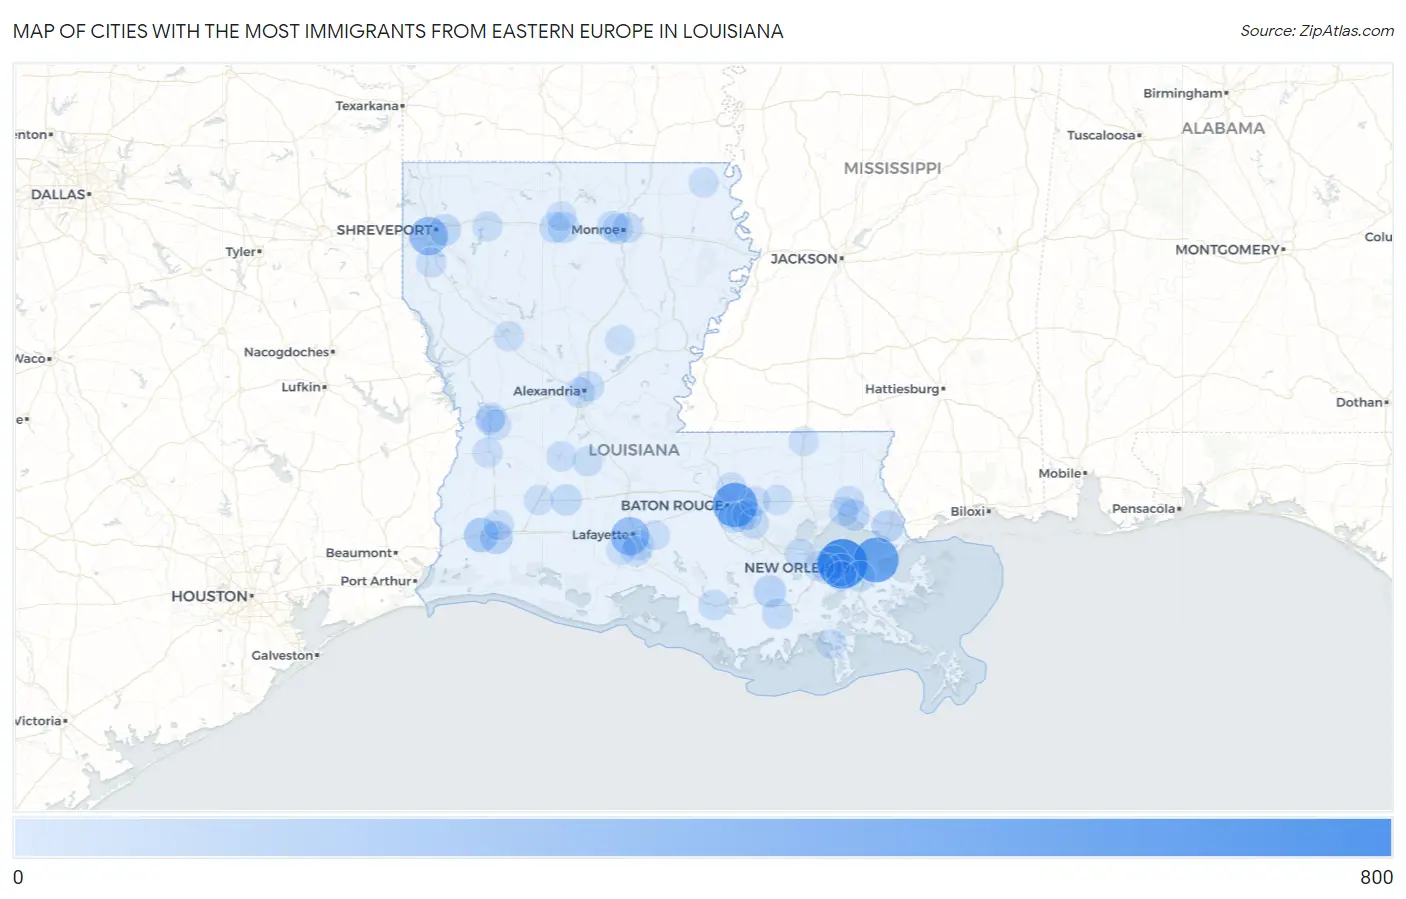
Map of Cities with the Most Immigrants from Eastern Europe in Louisiana
0
800
Cities with the Most Immigrants from Eastern Europe in Louisiana
| City | Eastern Europe | vs State | vs National | |
| 1. | Metairie | 787 | 5,320(14.79%)#1 | 2,208,794(0.04%)#403 |
| 2. | New Orleans | 594 | 5,320(11.17%)#2 | 2,208,794(0.03%)#525 |
| 3. | Baton Rouge | 576 | 5,320(10.83%)#3 | 2,208,794(0.03%)#542 |
| 4. | Shreveport | 331 | 5,320(6.22%)#4 | 2,208,794(0.01%)#909 |
| 5. | Lafayette | 318 | 5,320(5.98%)#5 | 2,208,794(0.01%)#953 |
| 6. | Sulphur | 178 | 5,320(3.35%)#6 | 2,208,794(0.01%)#1,535 |
| 7. | Kenner | 164 | 5,320(3.08%)#7 | 2,208,794(0.01%)#1,630 |
| 8. | Lake Charles | 113 | 5,320(2.12%)#8 | 2,208,794(0.01%)#2,126 |
| 9. | Elmwood | 106 | 5,320(1.99%)#9 | 2,208,794(0.00%)#2,231 |
| 10. | Thibodaux | 93 | 5,320(1.75%)#10 | 2,208,794(0.00%)#2,403 |
| 11. | Slidell | 78 | 5,320(1.47%)#11 | 2,208,794(0.00%)#2,677 |
| 12. | Bossier City | 72 | 5,320(1.35%)#12 | 2,208,794(0.00%)#2,798 |
| 13. | Mandeville | 60 | 5,320(1.13%)#13 | 2,208,794(0.00%)#3,056 |
| 14. | Ruston | 54 | 5,320(1.02%)#14 | 2,208,794(0.00%)#3,223 |
| 15. | Basile | 48 | 5,320(0.90%)#15 | 2,208,794(0.00%)#3,449 |
| 16. | Grambling | 46 | 5,320(0.86%)#16 | 2,208,794(0.00%)#3,513 |
| 17. | Bayou Cane | 38 | 5,320(0.71%)#17 | 2,208,794(0.00%)#3,828 |
| 18. | Village St George | 38 | 5,320(0.71%)#18 | 2,208,794(0.00%)#3,842 |
| 19. | Gardere | 36 | 5,320(0.68%)#19 | 2,208,794(0.00%)#3,924 |
| 20. | Claiborne | 35 | 5,320(0.66%)#20 | 2,208,794(0.00%)#3,957 |
| 21. | Terrytown | 33 | 5,320(0.62%)#21 | 2,208,794(0.00%)#4,046 |
| 22. | Covington | 31 | 5,320(0.58%)#22 | 2,208,794(0.00%)#4,167 |
| 23. | Patterson | 28 | 5,320(0.53%)#23 | 2,208,794(0.00%)#4,342 |
| 24. | Prairieville | 27 | 5,320(0.51%)#24 | 2,208,794(0.00%)#4,379 |
| 25. | West Monroe | 23 | 5,320(0.43%)#25 | 2,208,794(0.00%)#4,652 |
| 26. | Reserve | 23 | 5,320(0.43%)#26 | 2,208,794(0.00%)#4,668 |
| 27. | Broussard | 21 | 5,320(0.39%)#27 | 2,208,794(0.00%)#4,811 |
| 28. | Monroe | 20 | 5,320(0.38%)#28 | 2,208,794(0.00%)#4,887 |
| 29. | Pineville | 20 | 5,320(0.38%)#29 | 2,208,794(0.00%)#4,894 |
| 30. | Old Jefferson | 18 | 5,320(0.34%)#30 | 2,208,794(0.00%)#5,085 |
| 31. | Stonewall | 18 | 5,320(0.34%)#31 | 2,208,794(0.00%)#5,145 |
| 32. | St Rose | 17 | 5,320(0.32%)#32 | 2,208,794(0.00%)#5,198 |
| 33. | Alexandria | 14 | 5,320(0.26%)#33 | 2,208,794(0.00%)#5,514 |
| 34. | Deridder | 14 | 5,320(0.26%)#34 | 2,208,794(0.00%)#5,549 |
| 35. | Oakdale | 14 | 5,320(0.26%)#35 | 2,208,794(0.00%)#5,571 |
| 36. | Moss Bluff | 12 | 5,320(0.23%)#36 | 2,208,794(0.00%)#5,811 |
| 37. | Denham Springs | 11 | 5,320(0.21%)#37 | 2,208,794(0.00%)#5,954 |
| 38. | Youngsville | 10 | 5,320(0.19%)#38 | 2,208,794(0.00%)#6,098 |
| 39. | Avondale | 10 | 5,320(0.19%)#39 | 2,208,794(0.00%)#6,148 |
| 40. | Baker | 9 | 5,320(0.17%)#40 | 2,208,794(0.00%)#6,274 |
| 41. | Fort Polk South | 9 | 5,320(0.17%)#41 | 2,208,794(0.00%)#6,282 |
| 42. | Pine Prairie | 9 | 5,320(0.17%)#42 | 2,208,794(0.00%)#6,365 |
| 43. | Sibley | 9 | 5,320(0.17%)#43 | 2,208,794(0.00%)#6,366 |
| 44. | Leesville | 7 | 5,320(0.13%)#44 | 2,208,794(0.00%)#6,632 |
| 45. | New Llano | 7 | 5,320(0.13%)#45 | 2,208,794(0.00%)#6,694 |
| 46. | Golden Meadow | 6 | 5,320(0.11%)#46 | 2,208,794(0.00%)#6,886 |
| 47. | New Sarpy | 6 | 5,320(0.11%)#47 | 2,208,794(0.00%)#6,935 |
| 48. | Livingston | 5 | 5,320(0.09%)#48 | 2,208,794(0.00%)#7,079 |
| 49. | Kentwood | 5 | 5,320(0.09%)#49 | 2,208,794(0.00%)#7,086 |
| 50. | Kinder | 4 | 5,320(0.08%)#50 | 2,208,794(0.00%)#7,259 |
| 51. | Oak Grove | 4 | 5,320(0.08%)#51 | 2,208,794(0.00%)#7,285 |
| 52. | Natchitoches | 3 | 5,320(0.06%)#52 | 2,208,794(0.00%)#7,405 |
| 53. | Madisonville | 3 | 5,320(0.06%)#53 | 2,208,794(0.00%)#7,532 |
| 54. | Jena | 2 | 5,320(0.04%)#54 | 2,208,794(0.00%)#7,672 |
| 55. | Maurice | 2 | 5,320(0.04%)#55 | 2,208,794(0.00%)#7,689 |
| 56. | Vienna | 2 | 5,320(0.04%)#56 | 2,208,794(0.00%)#7,811 |
| 57. | Parks | 1 | 5,320(0.02%)#57 | 2,208,794(0.00%)#8,002 |
Common Questions
What are the Top 10 Cities with the Most Immigrants from Eastern Europe in Louisiana?
Top 10 Cities with the Most Immigrants from Eastern Europe in Louisiana are:
#1
787
#2
594
#3
576
#4
331
#5
318
#6
178
#7
164
#8
113
#9
106
#10
93
What city has the Most Immigrants from Eastern Europe in Louisiana?
Metairie has the Most Immigrants from Eastern Europe in Louisiana with 787.
What is the Total Immigrants from Eastern Europe in the State of Louisiana?
Total Immigrants from Eastern Europe in Louisiana is 5,320.
What is the Total Immigrants from Eastern Europe in the United States?
Total Immigrants from Eastern Europe in the United States is 2,208,794.