Cities with the Most Immigrants from Eastern Europe in Delaware
RELATED REPORTS & OPTIONS
Eastern Europe
Delaware
Compare Cities
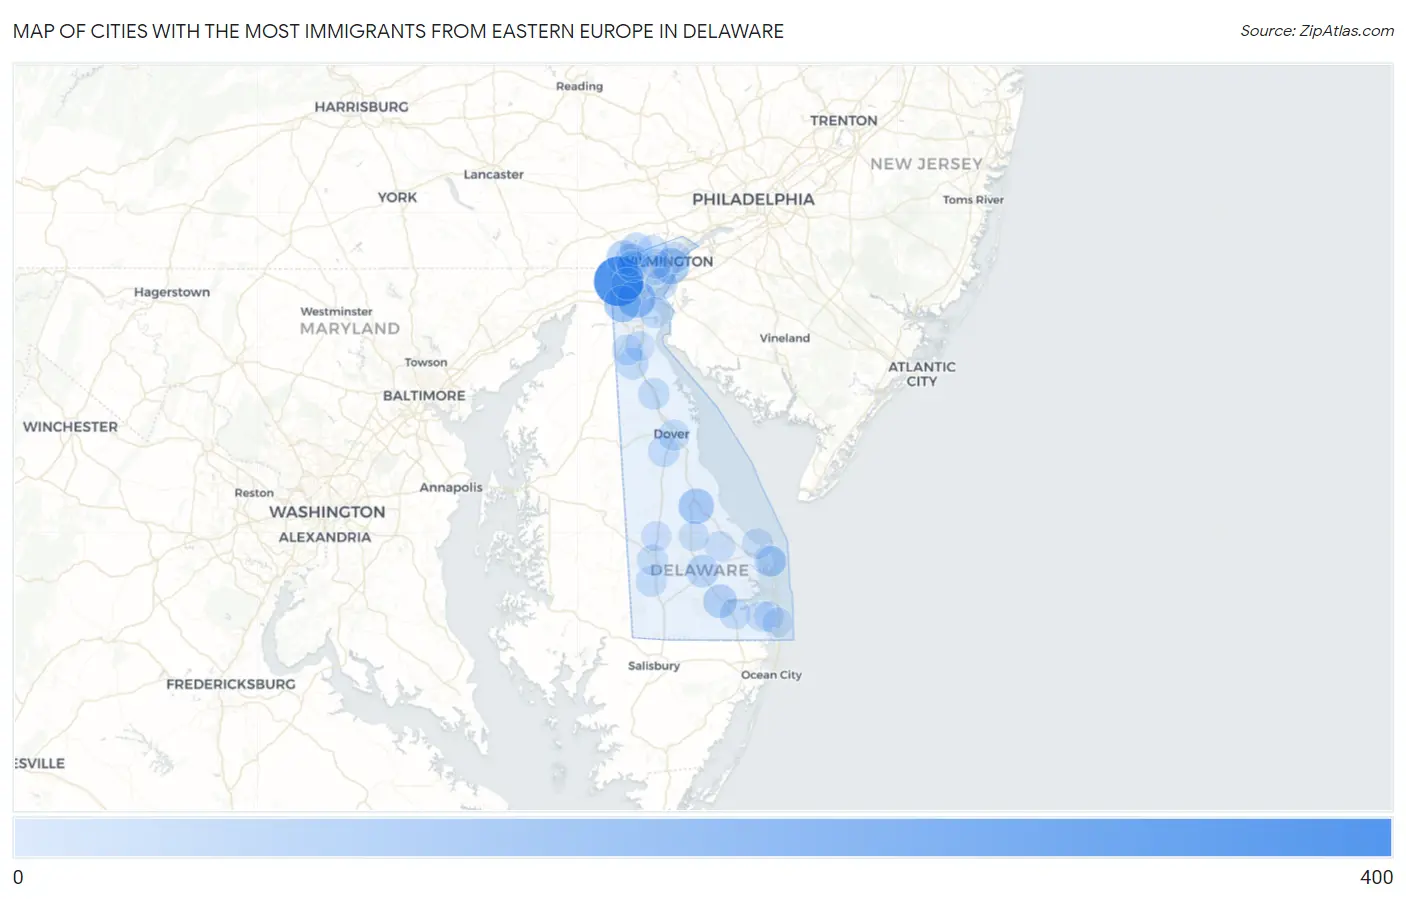
Map of Cities with the Most Immigrants from Eastern Europe in Delaware
0
400
Cities with the Most Immigrants from Eastern Europe in Delaware
| City | Eastern Europe | vs State | vs National | |
| 1. | Newark | 344 | 3,267(10.53%)#1 | 2,208,794(0.02%)#874 |
| 2. | Bear | 136 | 3,267(4.16%)#2 | 2,208,794(0.01%)#1,894 |
| 3. | Glasgow | 111 | 3,267(3.40%)#3 | 2,208,794(0.01%)#2,155 |
| 4. | Wilmington | 100 | 3,267(3.06%)#4 | 2,208,794(0.00%)#2,296 |
| 5. | Milford | 93 | 3,267(2.85%)#5 | 2,208,794(0.00%)#2,406 |
| 6. | North Star | 70 | 3,267(2.14%)#6 | 2,208,794(0.00%)#2,858 |
| 7. | Millsboro | 60 | 3,267(1.84%)#7 | 2,208,794(0.00%)#3,063 |
| 8. | Georgetown | 41 | 3,267(1.25%)#8 | 2,208,794(0.00%)#3,712 |
| 9. | Pike Creek | 40 | 3,267(1.22%)#9 | 2,208,794(0.00%)#3,757 |
| 10. | Hockessin | 39 | 3,267(1.19%)#10 | 2,208,794(0.00%)#3,791 |
| 11. | Brookside | 33 | 3,267(1.01%)#11 | 2,208,794(0.00%)#4,053 |
| 12. | Rehoboth Beach | 31 | 3,267(0.95%)#12 | 2,208,794(0.00%)#4,203 |
| 13. | New Castle | 28 | 3,267(0.86%)#13 | 2,208,794(0.00%)#4,345 |
| 14. | Camden | 25 | 3,267(0.77%)#14 | 2,208,794(0.00%)#4,537 |
| 15. | Greenville | 25 | 3,267(0.77%)#15 | 2,208,794(0.00%)#4,547 |
| 16. | Townsend | 25 | 3,267(0.77%)#16 | 2,208,794(0.00%)#4,549 |
| 17. | Smyrna | 23 | 3,267(0.70%)#17 | 2,208,794(0.00%)#4,653 |
| 18. | Pike Creek Valley | 23 | 3,267(0.70%)#18 | 2,208,794(0.00%)#4,656 |
| 19. | Delaware City | 20 | 3,267(0.61%)#19 | 2,208,794(0.00%)#4,941 |
| 20. | Middletown | 17 | 3,267(0.52%)#20 | 2,208,794(0.00%)#5,176 |
| 21. | Dagsboro | 17 | 3,267(0.52%)#21 | 2,208,794(0.00%)#5,264 |
| 22. | Dover | 15 | 3,267(0.46%)#22 | 2,208,794(0.00%)#5,396 |
| 23. | Seaford | 15 | 3,267(0.46%)#23 | 2,208,794(0.00%)#5,429 |
| 24. | Lewes | 14 | 3,267(0.43%)#24 | 2,208,794(0.00%)#5,597 |
| 25. | Millville | 12 | 3,267(0.37%)#25 | 2,208,794(0.00%)#5,879 |
| 26. | Edgemoor | 10 | 3,267(0.31%)#26 | 2,208,794(0.00%)#6,131 |
| 27. | Bridgeville | 10 | 3,267(0.31%)#27 | 2,208,794(0.00%)#6,181 |
| 28. | Milton | 7 | 3,267(0.21%)#28 | 2,208,794(0.00%)#6,662 |
| 29. | Greenwood | 5 | 3,267(0.15%)#29 | 2,208,794(0.00%)#7,104 |
| 30. | Newport | 5 | 3,267(0.15%)#30 | 2,208,794(0.00%)#7,120 |
| 31. | Ocean View | 4 | 3,267(0.12%)#31 | 2,208,794(0.00%)#7,239 |
| 32. | Ellendale | 4 | 3,267(0.12%)#32 | 2,208,794(0.00%)#7,354 |
| 33. | South Bethany | 2 | 3,267(0.06%)#33 | 2,208,794(0.00%)#7,835 |
| 34. | Odessa | 2 | 3,267(0.06%)#34 | 2,208,794(0.00%)#7,854 |
| 35. | Henlopen Acres | 2 | 3,267(0.06%)#35 | 2,208,794(0.00%)#7,907 |
| 36. | Elsmere | 1 | 3,267(0.03%)#36 | 2,208,794(0.00%)#7,942 |
1
Common Questions
What are the Top 10 Cities with the Most Immigrants from Eastern Europe in Delaware?
Top 10 Cities with the Most Immigrants from Eastern Europe in Delaware are:
#1
344
#2
136
#3
111
#4
100
#5
93
#6
70
#7
60
#8
41
#9
40
#10
39
What city has the Most Immigrants from Eastern Europe in Delaware?
Newark has the Most Immigrants from Eastern Europe in Delaware with 344.
What is the Total Immigrants from Eastern Europe in the State of Delaware?
Total Immigrants from Eastern Europe in Delaware is 3,267.
What is the Total Immigrants from Eastern Europe in the United States?
Total Immigrants from Eastern Europe in the United States is 2,208,794.