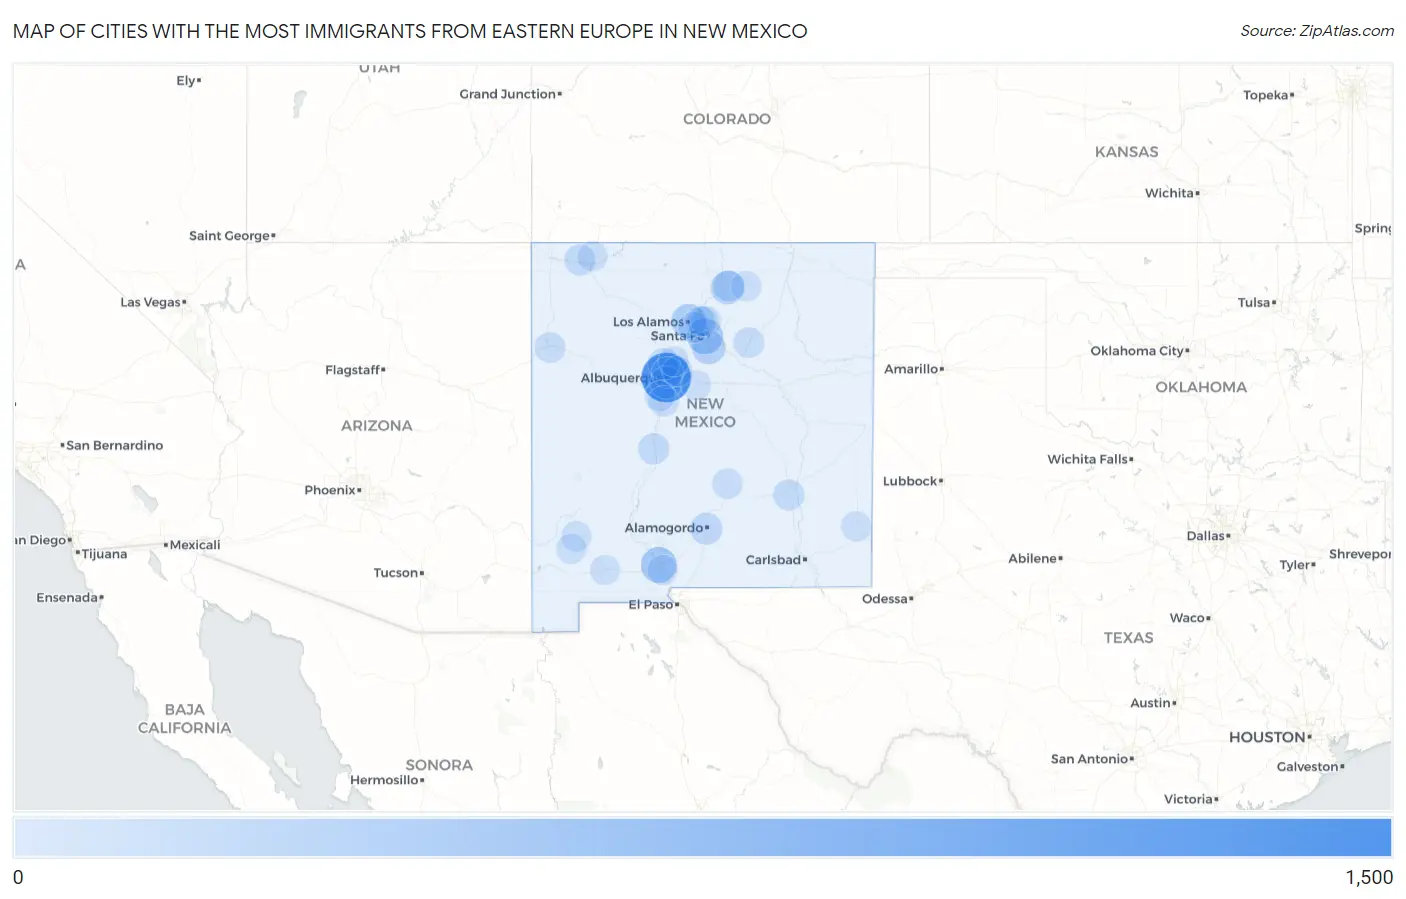
Cities with the Most Immigrants from Eastern Europe in New Mexico
RELATED REPORTS & OPTIONS
Eastern Europe
New Mexico
Compare Cities
Map of Cities with the Most Immigrants from Eastern Europe in New Mexico
0
1,500
Cities with the Most Immigrants from Eastern Europe in New Mexico
| City | Eastern Europe | vs State | vs National | |
| 1. | Albuquerque | 1,028 | 3,360(30.60%)#1 | 2,208,794(0.05%)#291 |
| 2. | Las Cruces | 294 | 3,360(8.75%)#2 | 2,208,794(0.01%)#1,029 |
| 3. | Santa Fe | 284 | 3,360(8.45%)#3 | 2,208,794(0.01%)#1,061 |
| 4. | Los Alamos | 230 | 3,360(6.85%)#4 | 2,208,794(0.01%)#1,269 |
| 5. | Ranchos De Taos | 171 | 3,360(5.09%)#5 | 2,208,794(0.01%)#1,582 |
| 6. | Eldorado At Santa Fe | 170 | 3,360(5.06%)#6 | 2,208,794(0.01%)#1,587 |
| 7. | South Valley | 101 | 3,360(3.01%)#7 | 2,208,794(0.00%)#2,289 |
| 8. | Alamogordo | 89 | 3,360(2.65%)#8 | 2,208,794(0.00%)#2,462 |
| 9. | Rio Rancho | 71 | 3,360(2.11%)#9 | 2,208,794(0.00%)#2,817 |
| 10. | Socorro | 58 | 3,360(1.73%)#10 | 2,208,794(0.00%)#3,115 |
| 11. | Taos | 53 | 3,360(1.58%)#11 | 2,208,794(0.00%)#3,269 |
| 12. | Farmington | 47 | 3,360(1.40%)#12 | 2,208,794(0.00%)#3,455 |
| 13. | Roswell | 44 | 3,360(1.31%)#13 | 2,208,794(0.00%)#3,561 |
| 14. | Los Ranchos De Albuquerque | 38 | 3,360(1.13%)#14 | 2,208,794(0.00%)#3,849 |
| 15. | White Rock | 37 | 3,360(1.10%)#15 | 2,208,794(0.00%)#3,889 |
| 16. | Las Vegas | 33 | 3,360(0.98%)#16 | 2,208,794(0.00%)#4,054 |
| 17. | Gallup | 26 | 3,360(0.77%)#17 | 2,208,794(0.00%)#4,435 |
| 18. | Tome | 22 | 3,360(0.65%)#18 | 2,208,794(0.00%)#4,788 |
| 19. | Capitan | 15 | 3,360(0.45%)#19 | 2,208,794(0.00%)#5,489 |
| 20. | Silver City | 13 | 3,360(0.39%)#20 | 2,208,794(0.00%)#5,687 |
| 21. | South River | 13 | 3,360(0.39%)#21 | 2,208,794(0.00%)#5,762 |
| 22. | Sandia Heights | 10 | 3,360(0.30%)#22 | 2,208,794(0.00%)#6,171 |
| 23. | Nambe | 10 | 3,360(0.30%)#23 | 2,208,794(0.00%)#6,189 |
| 24. | Las Campanas | 10 | 3,360(0.30%)#24 | 2,208,794(0.00%)#6,203 |
| 25. | University Park | 9 | 3,360(0.27%)#25 | 2,208,794(0.00%)#6,342 |
| 26. | Aztec | 8 | 3,360(0.24%)#26 | 2,208,794(0.00%)#6,452 |
| 27. | Angel Fire | 8 | 3,360(0.24%)#27 | 2,208,794(0.00%)#6,554 |
| 28. | Paa-Ko | 8 | 3,360(0.24%)#28 | 2,208,794(0.00%)#6,569 |
| 29. | Bernalillo | 7 | 3,360(0.21%)#29 | 2,208,794(0.00%)#6,613 |
| 30. | Deming | 6 | 3,360(0.18%)#30 | 2,208,794(0.00%)#6,803 |
| 31. | Indian Hills | 6 | 3,360(0.18%)#31 | 2,208,794(0.00%)#6,932 |
| 32. | Mogollon | 6 | 3,360(0.18%)#32 | 2,208,794(0.00%)#6,984 |
| 33. | Los Lunas | 5 | 3,360(0.15%)#33 | 2,208,794(0.00%)#6,993 |
| 34. | White Signal | 4 | 3,360(0.12%)#34 | 2,208,794(0.00%)#7,395 |
| 35. | El Rancho | 2 | 3,360(0.06%)#35 | 2,208,794(0.00%)#7,712 |
| 36. | Jacona | 2 | 3,360(0.06%)#36 | 2,208,794(0.00%)#7,861 |
| 37. | Edith Enclave | 2 | 3,360(0.06%)#37 | 2,208,794(0.00%)#7,895 |
| 38. | Lovington | 1 | 3,360(0.03%)#38 | 2,208,794(0.00%)#7,933 |
Common Questions
What are the Top 10 Cities with the Most Immigrants from Eastern Europe in New Mexico?
Top 10 Cities with the Most Immigrants from Eastern Europe in New Mexico are:
#1
1,028
#2
294
#3
284
#4
230
#5
171
#6
170
#7
101
#8
89
#9
71
#10
58
What city has the Most Immigrants from Eastern Europe in New Mexico?
Albuquerque has the Most Immigrants from Eastern Europe in New Mexico with 1,028.
What is the Total Immigrants from Eastern Europe in the State of New Mexico?
Total Immigrants from Eastern Europe in New Mexico is 3,360.
What is the Total Immigrants from Eastern Europe in the United States?
Total Immigrants from Eastern Europe in the United States is 2,208,794.