Swayzee, IN
Swayzee Map
Swayzee Overview
921
TOTAL POPULATION
439
MALE POPULATION
482
FEMALE POPULATION
91.08
MALES / 100 FEMALES
109.79
FEMALES / 100 MALES
42.5
MEDIAN AGE
2.9
AVG FAMILY SIZE
2.3
AVG HOUSEHOLD SIZE
$33,298
PER CAPITA INCOME
$75,875
AVG FAMILY INCOME
$67,500
AVG HOUSEHOLD INCOME
40.3%
WAGE / INCOME GAP [ % ]
59.7¢/ $1
WAGE / INCOME GAP [ $ ]
0.41
INEQUALITY / GINI INDEX
421
LABOR FORCE [ PEOPLE ]
58.5%
PERCENT IN LABOR FORCE
4.5%
UNEMPLOYMENT RATE
Swayzee Zip Codes
Swayzee Area Codes
Race in Swayzee
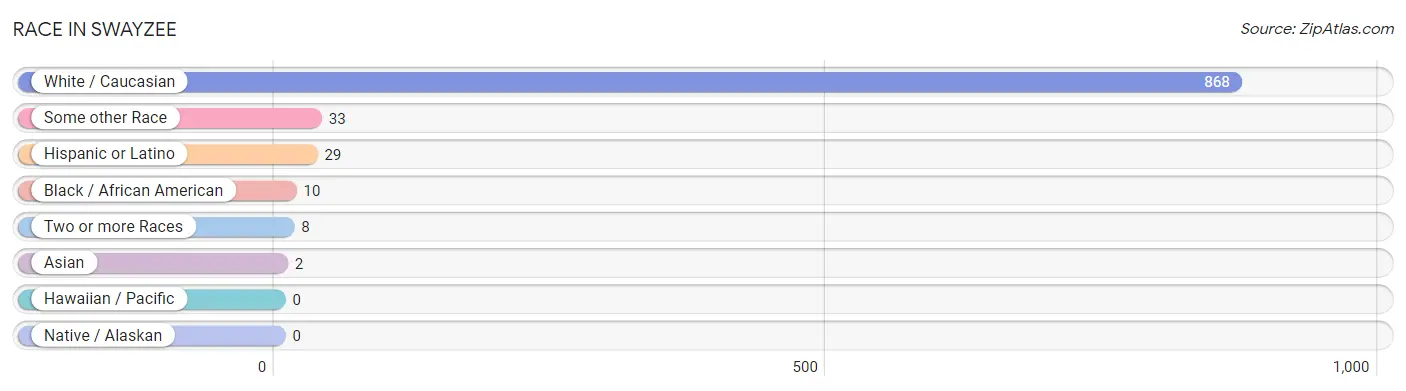
The most populous races in Swayzee are White / Caucasian (868 | 94.3%), Some other Race (33 | 3.6%), and Hispanic or Latino (29 | 3.2%).
| Race | # Population | % Population |
| Asian | 2 | 0.2% |
| Black / African American | 10 | 1.1% |
| Hawaiian / Pacific | 0 | 0.0% |
| Hispanic or Latino | 29 | 3.2% |
| Native / Alaskan | 0 | 0.0% |
| White / Caucasian | 868 | 94.3% |
| Two or more Races | 8 | 0.9% |
| Some other Race | 33 | 3.6% |
| Total | 921 | 100.0% |
Ancestry in Swayzee
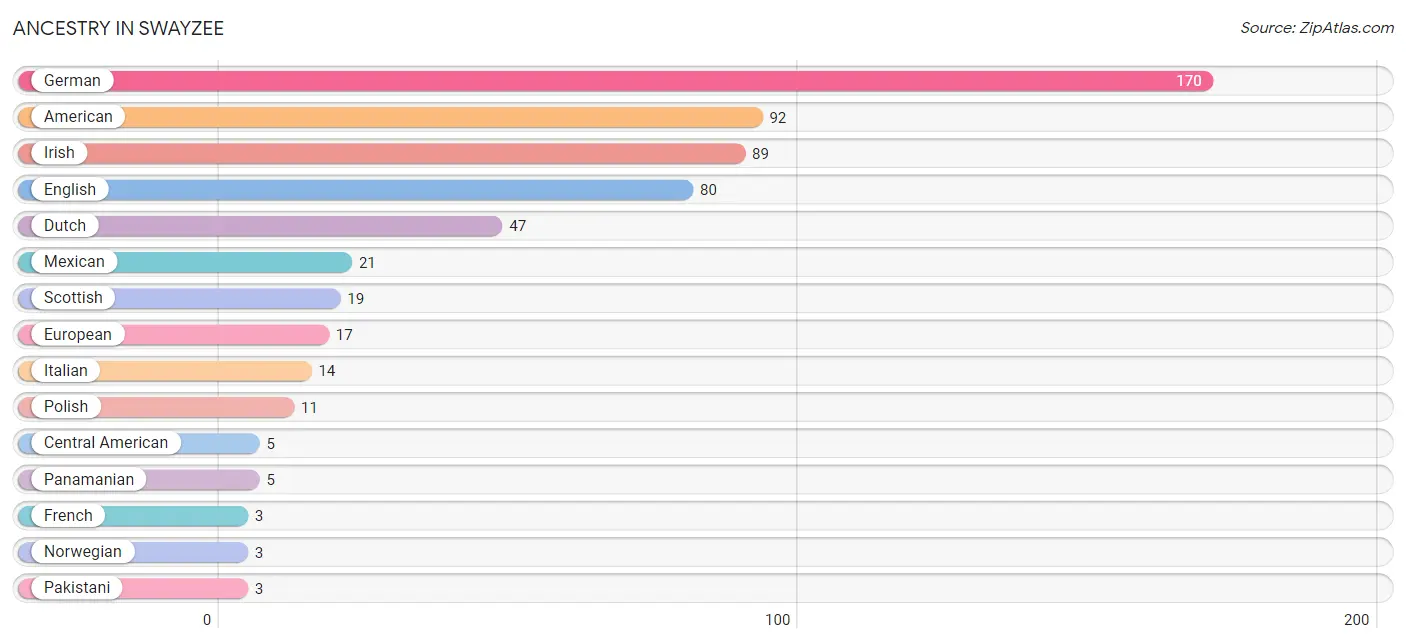
The most populous ancestries reported in Swayzee are German (170 | 18.5%), American (92 | 10.0%), Irish (89 | 9.7%), English (80 | 8.7%), and Dutch (47 | 5.1%), together accounting for 51.9% of all Swayzee residents.
| Ancestry | # Population | % Population |
| American | 92 | 10.0% |
| Arab | 2 | 0.2% |
| Central American | 5 | 0.5% |
| Cherokee | 1 | 0.1% |
| Dutch | 47 | 5.1% |
| English | 80 | 8.7% |
| Ethiopian | 2 | 0.2% |
| European | 17 | 1.8% |
| French | 3 | 0.3% |
| French American Indian | 1 | 0.1% |
| German | 170 | 18.5% |
| Irish | 89 | 9.7% |
| Italian | 14 | 1.5% |
| Japanese | 2 | 0.2% |
| Mexican | 21 | 2.3% |
| Norwegian | 3 | 0.3% |
| Pakistani | 3 | 0.3% |
| Panamanian | 5 | 0.5% |
| Polish | 11 | 1.2% |
| Puerto Rican | 3 | 0.3% |
| Scandinavian | 2 | 0.2% |
| Scotch-Irish | 1 | 0.1% |
| Scottish | 19 | 2.1% |
| Subsaharan African | 2 | 0.2% |
| Swiss | 2 | 0.2% |
| Welsh | 1 | 0.1% | View All 26 Rows |
Immigrants in Swayzee
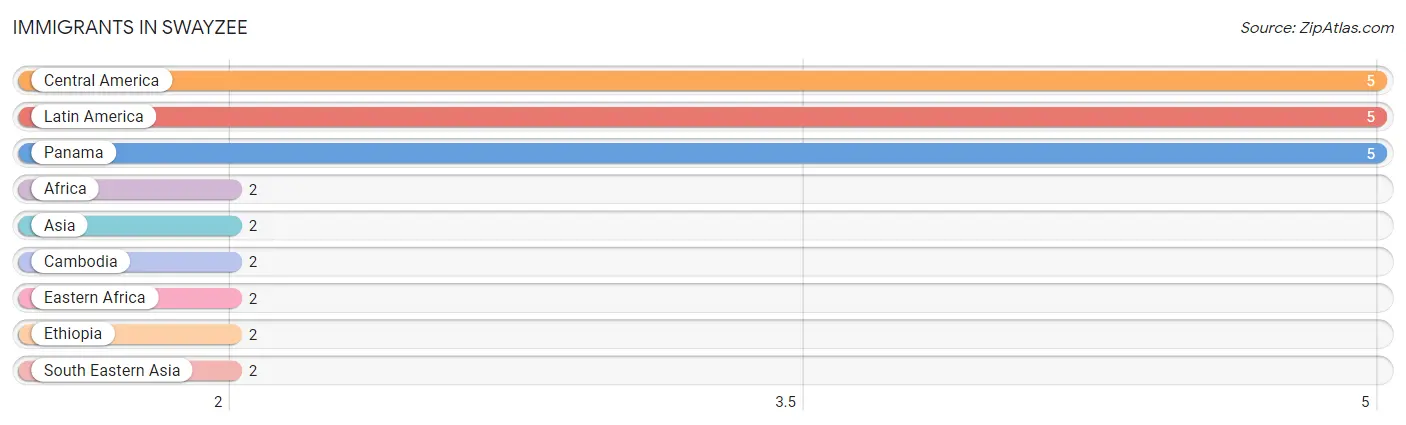
The most numerous immigrant groups reported in Swayzee came from Central America (5 | 0.5%), Latin America (5 | 0.5%), Panama (5 | 0.5%), Africa (2 | 0.2%), and Asia (2 | 0.2%), together accounting for 2.1% of all Swayzee residents.
| Immigration Origin | # Population | % Population |
| Africa | 2 | 0.2% |
| Asia | 2 | 0.2% |
| Cambodia | 2 | 0.2% |
| Central America | 5 | 0.5% |
| Eastern Africa | 2 | 0.2% |
| Ethiopia | 2 | 0.2% |
| Latin America | 5 | 0.5% |
| Panama | 5 | 0.5% |
| South Eastern Asia | 2 | 0.2% | View All 9 Rows |
Sex and Age in Swayzee
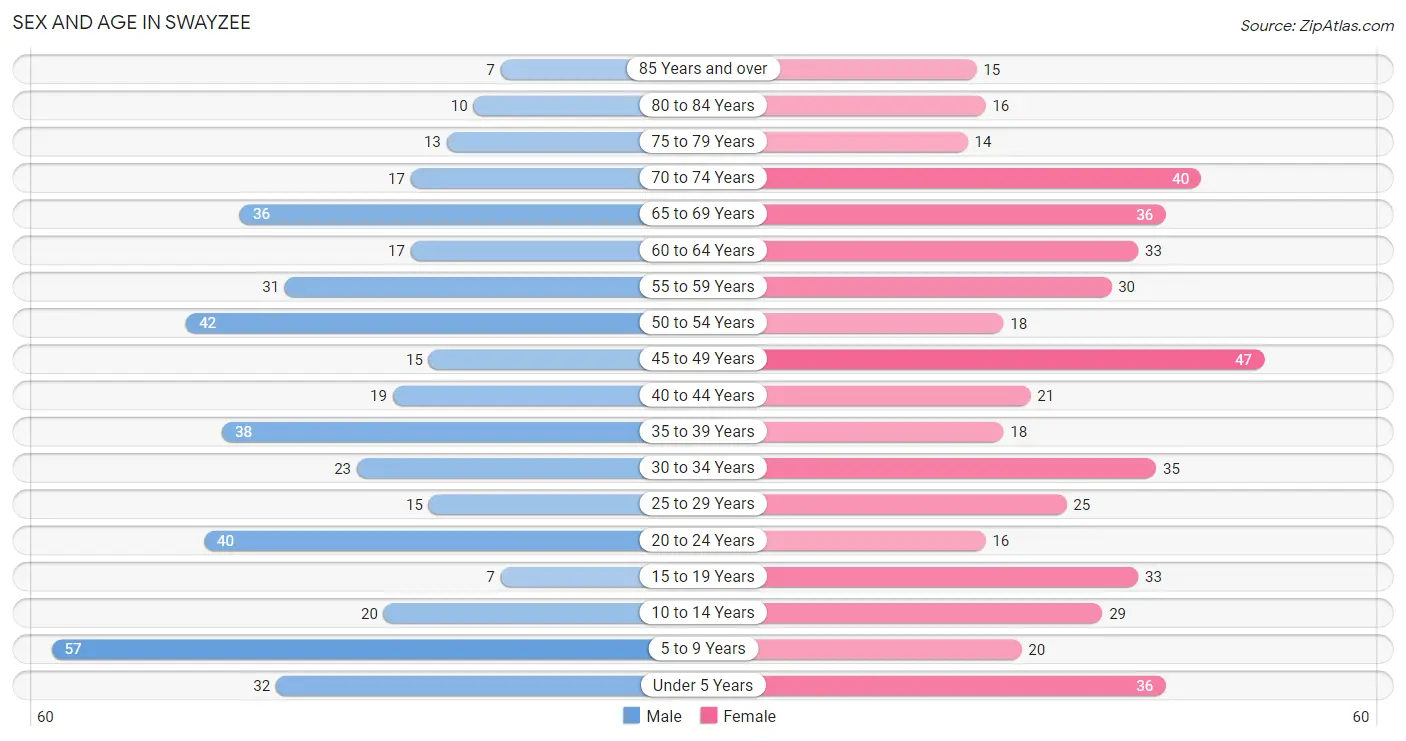
Sex and Age in Swayzee
The most populous age groups in Swayzee are 5 to 9 Years (57 | 13.0%) for men and 45 to 49 Years (47 | 9.8%) for women.
| Age Bracket | Male | Female |
| Under 5 Years | 32 (7.3%) | 36 (7.5%) |
| 5 to 9 Years | 57 (13.0%) | 20 (4.2%) |
| 10 to 14 Years | 20 (4.6%) | 29 (6.0%) |
| 15 to 19 Years | 7 (1.6%) | 33 (6.9%) |
| 20 to 24 Years | 40 (9.1%) | 16 (3.3%) |
| 25 to 29 Years | 15 (3.4%) | 25 (5.2%) |
| 30 to 34 Years | 23 (5.2%) | 35 (7.3%) |
| 35 to 39 Years | 38 (8.7%) | 18 (3.7%) |
| 40 to 44 Years | 19 (4.3%) | 21 (4.4%) |
| 45 to 49 Years | 15 (3.4%) | 47 (9.8%) |
| 50 to 54 Years | 42 (9.6%) | 18 (3.7%) |
| 55 to 59 Years | 31 (7.1%) | 30 (6.2%) |
| 60 to 64 Years | 17 (3.9%) | 33 (6.9%) |
| 65 to 69 Years | 36 (8.2%) | 36 (7.5%) |
| 70 to 74 Years | 17 (3.9%) | 40 (8.3%) |
| 75 to 79 Years | 13 (3.0%) | 14 (2.9%) |
| 80 to 84 Years | 10 (2.3%) | 16 (3.3%) |
| 85 Years and over | 7 (1.6%) | 15 (3.1%) |
| Total | 439 (100.0%) | 482 (100.0%) |
Families and Households in Swayzee
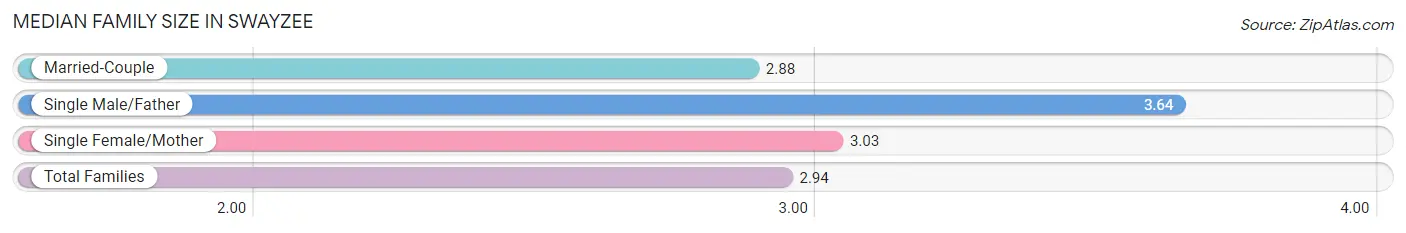
Median Family Size in Swayzee
The median family size in Swayzee is 2.94 persons per family, with single male/father families (14 | 5.7%) accounting for the largest median family size of 3.64 persons per family. On the other hand, married-couple families (199 | 80.6%) represent the smallest median family size with 2.88 persons per family.
| Family Type | # Families | Family Size |
| Married-Couple | 199 (80.6%) | 2.88 |
| Single Male/Father | 14 (5.7%) | 3.64 |
| Single Female/Mother | 34 (13.8%) | 3.03 |
| Total Families | 247 (100.0%) | 2.94 |
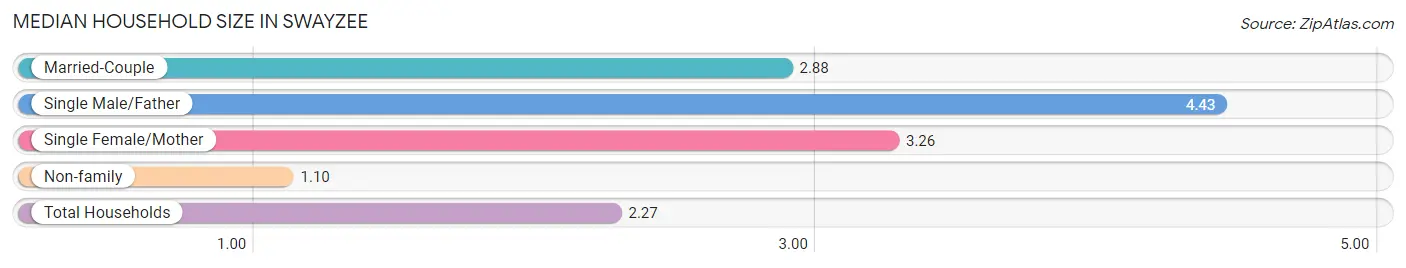
Median Household Size in Swayzee
The median household size in Swayzee is 2.27 persons per household, with single male/father households (14 | 3.5%) accounting for the largest median household size of 4.43 persons per household. non-family households (159 | 39.2%) represent the smallest median household size with 1.10 persons per household.
| Household Type | # Households | Household Size |
| Married-Couple | 199 (49.0%) | 2.88 |
| Single Male/Father | 14 (3.5%) | 4.43 |
| Single Female/Mother | 34 (8.4%) | 3.26 |
| Non-family | 159 (39.2%) | 1.10 |
| Total Households | 406 (100.0%) | 2.27 |
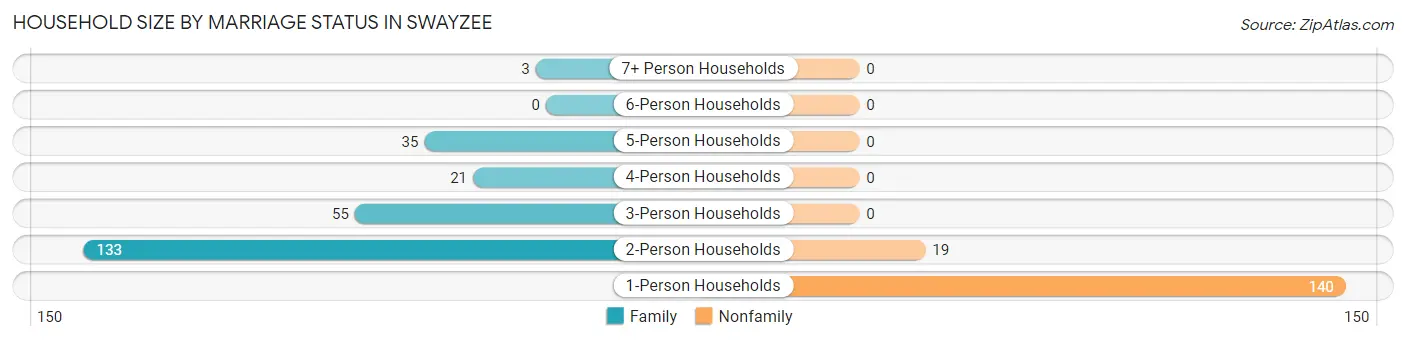
Household Size by Marriage Status in Swayzee
Out of a total of 406 households in Swayzee, 247 (60.8%) are family households, while 159 (39.2%) are nonfamily households. The most numerous type of family households are 2-person households, comprising 133, and the most common type of nonfamily households are 1-person households, comprising 140.
| Household Size | Family Households | Nonfamily Households |
| 1-Person Households | - | 140 (34.5%) |
| 2-Person Households | 133 (32.8%) | 19 (4.7%) |
| 3-Person Households | 55 (13.6%) | 0 (0.0%) |
| 4-Person Households | 21 (5.2%) | 0 (0.0%) |
| 5-Person Households | 35 (8.6%) | 0 (0.0%) |
| 6-Person Households | 0 (0.0%) | 0 (0.0%) |
| 7+ Person Households | 3 (0.7%) | 0 (0.0%) |
| Total | 247 (60.8%) | 159 (39.2%) |
Female Fertility in Swayzee
Fertility by Age in Swayzee
Average fertility rate in Swayzee is 101.0 births per 1,000 women. Women in the age bracket of 20 to 34 years have the highest fertility rate with 197.0 births per 1,000 women. Women in the age bracket of 20 to 34 years acount for 71.4% of all women with births.
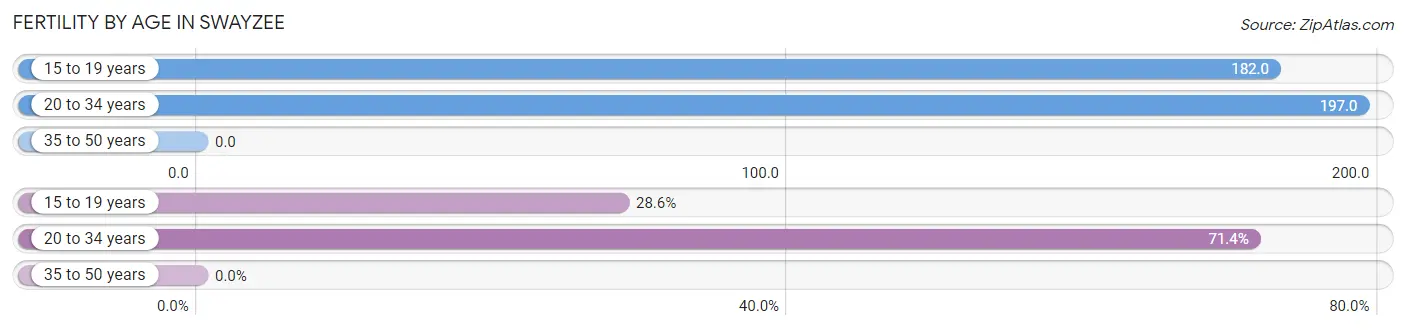
| Age Bracket | Women with Births | Births / 1,000 Women |
| 15 to 19 years | 6 (28.6%) | 182.0 |
| 20 to 34 years | 15 (71.4%) | 197.0 |
| 35 to 50 years | 0 (0.0%) | 0.0 |
| Total | 21 (100.0%) | 101.0 |
Fertility by Age by Marriage Status in Swayzee
66.7% of women with births (21) in Swayzee are married. The highest percentage of unmarried women with births falls into 15 to 19 years age bracket with 100.0% of them unmarried at the time of birth, while the lowest percentage of unmarried women with births belong to 20 to 34 years age bracket with 6.7% of them unmarried.
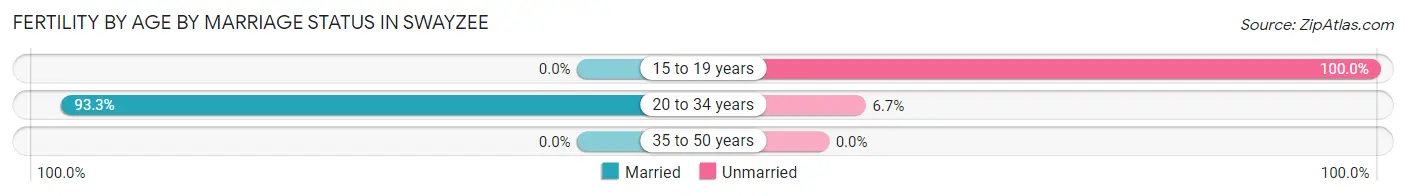
| Age Bracket | Married | Unmarried |
| 15 to 19 years | 0 (0.0%) | 6 (100.0%) |
| 20 to 34 years | 14 (93.3%) | 1 (6.7%) |
| 35 to 50 years | 0 (0.0%) | 0 (0.0%) |
| Total | 14 (66.7%) | 7 (33.3%) |
Fertility by Education in Swayzee
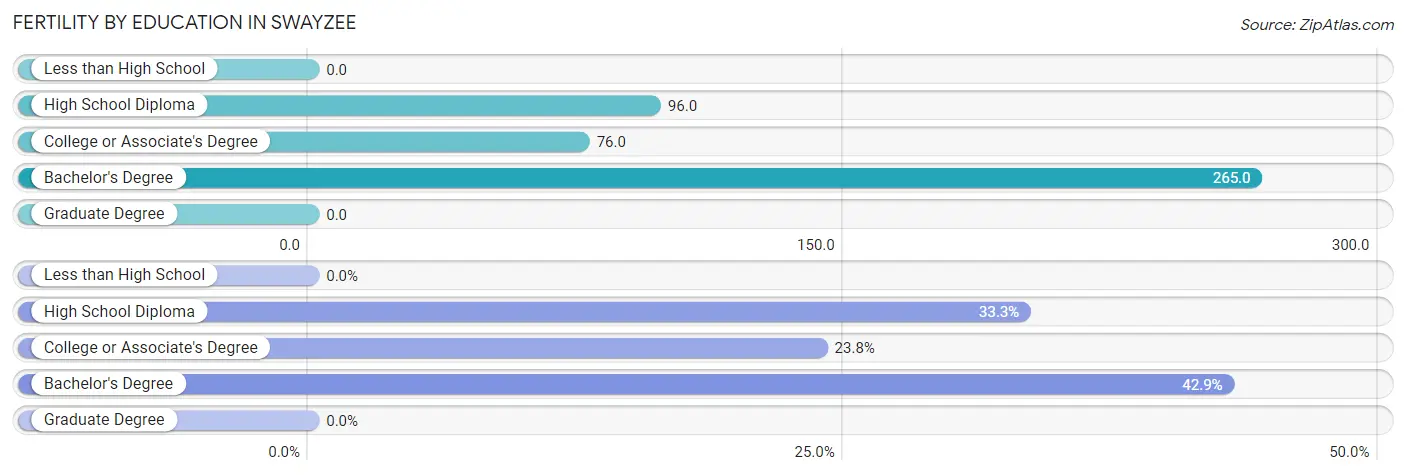
| Educational Attainment | Women with Births | Births / 1,000 Women |
| Less than High School | 0 (0.0%) | 0.0 |
| High School Diploma | 7 (33.3%) | 96.0 |
| College or Associate's Degree | 5 (23.8%) | 76.0 |
| Bachelor's Degree | 9 (42.9%) | 265.0 |
| Graduate Degree | 0 (0.0%) | 0.0 |
| Total | 21 (100.0%) | 101.0 |
Fertility by Education by Marriage Status in Swayzee
33.3% of women with births in Swayzee are unmarried. Women with the educational attainment of college or associate's degree are most likely to be married with 100.0% of them married at childbirth, while women with the educational attainment of high school diploma are least likely to be married with 100.0% of them unmarried at childbirth.
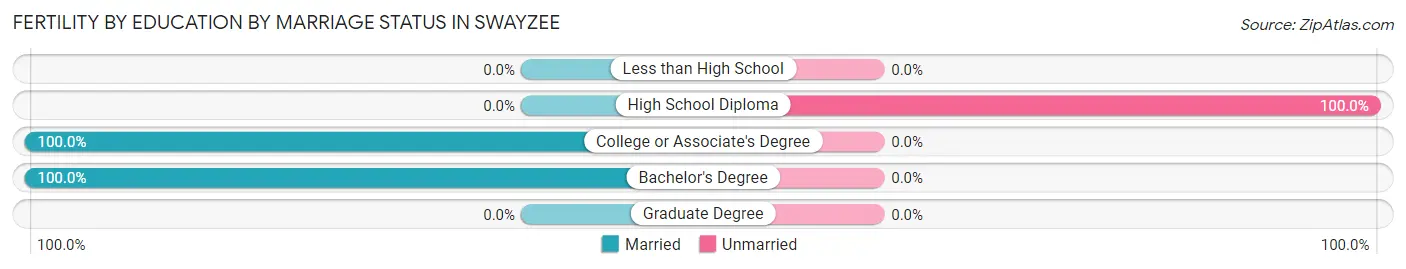
| Educational Attainment | Married | Unmarried |
| Less than High School | 0 (0.0%) | 0 (0.0%) |
| High School Diploma | 0 (0.0%) | 7 (100.0%) |
| College or Associate's Degree | 5 (100.0%) | 0 (0.0%) |
| Bachelor's Degree | 9 (100.0%) | 0 (0.0%) |
| Graduate Degree | 0 (0.0%) | 0 (0.0%) |
| Total | 14 (66.7%) | 7 (33.3%) |
Income in Swayzee
Income Overview in Swayzee
Per Capita Income in Swayzee is $33,298, while median incomes of families and households are $75,875 and $67,500 respectively.
| Characteristic | Number | Measure |
| Per Capita Income | 921 | $33,298 |
| Median Family Income | 247 | $75,875 |
| Mean Family Income | 247 | $83,519 |
| Median Household Income | 406 | $67,500 |
| Mean Household Income | 406 | $75,136 |
| Income Deficit | 247 | $0 |
| Wage / Income Gap (%) | 921 | 40.31% |
| Wage / Income Gap ($) | 921 | 59.69¢ per $1 |
| Gini / Inequality Index | 921 | 0.41 |
Earnings by Sex in Swayzee
Average Earnings in Swayzee are $46,250, $50,862 for men and $30,357 for women, a difference of 40.3%.
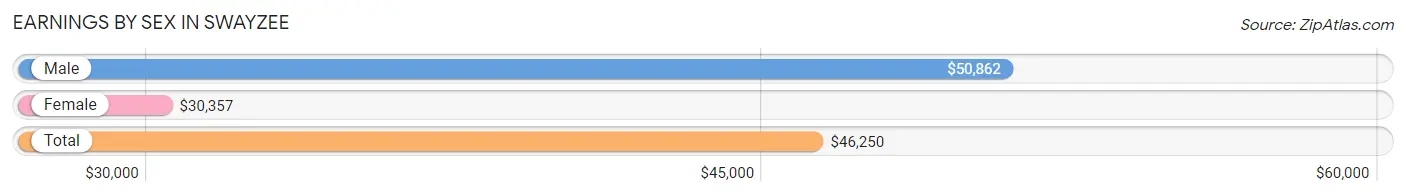
| Sex | Number | Average Earnings |
| Male | 240 (54.3%) | $50,862 |
| Female | 202 (45.7%) | $30,357 |
| Total | 442 (100.0%) | $46,250 |
Earnings by Sex by Income Bracket in Swayzee
The most common earnings brackets in Swayzee are $50,000 to $54,999 for men (35 | 14.6%) and $25,000 to $29,999 for women (24 | 11.9%).
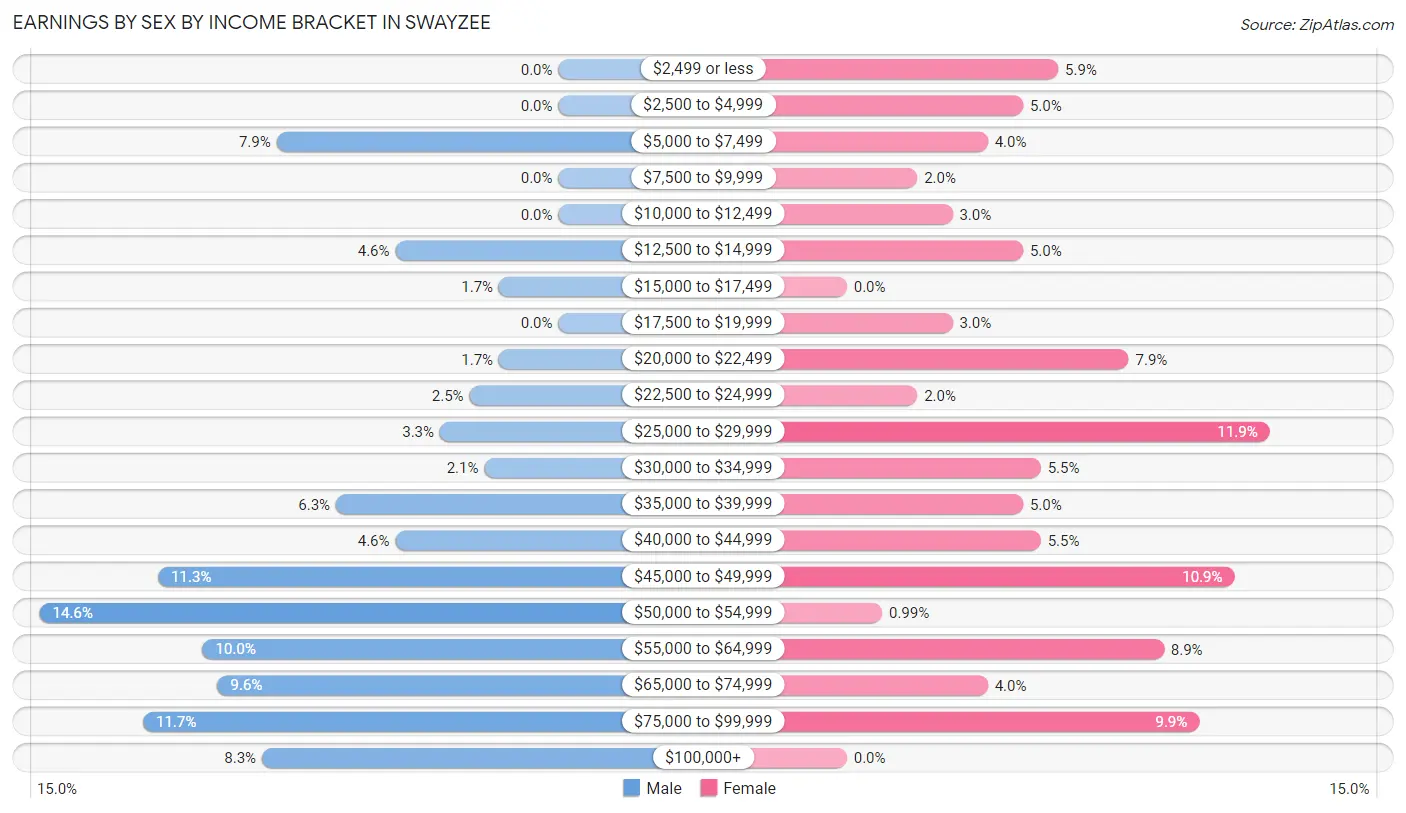
| Income | Male | Female |
| $2,499 or less | 0 (0.0%) | 12 (5.9%) |
| $2,500 to $4,999 | 0 (0.0%) | 10 (5.0%) |
| $5,000 to $7,499 | 19 (7.9%) | 8 (4.0%) |
| $7,500 to $9,999 | 0 (0.0%) | 4 (2.0%) |
| $10,000 to $12,499 | 0 (0.0%) | 6 (3.0%) |
| $12,500 to $14,999 | 11 (4.6%) | 10 (5.0%) |
| $15,000 to $17,499 | 4 (1.7%) | 0 (0.0%) |
| $17,500 to $19,999 | 0 (0.0%) | 6 (3.0%) |
| $20,000 to $22,499 | 4 (1.7%) | 16 (7.9%) |
| $22,500 to $24,999 | 6 (2.5%) | 4 (2.0%) |
| $25,000 to $29,999 | 8 (3.3%) | 24 (11.9%) |
| $30,000 to $34,999 | 5 (2.1%) | 11 (5.4%) |
| $35,000 to $39,999 | 15 (6.2%) | 10 (5.0%) |
| $40,000 to $44,999 | 11 (4.6%) | 11 (5.4%) |
| $45,000 to $49,999 | 27 (11.3%) | 22 (10.9%) |
| $50,000 to $54,999 | 35 (14.6%) | 2 (1.0%) |
| $55,000 to $64,999 | 24 (10.0%) | 18 (8.9%) |
| $65,000 to $74,999 | 23 (9.6%) | 8 (4.0%) |
| $75,000 to $99,999 | 28 (11.7%) | 20 (9.9%) |
| $100,000+ | 20 (8.3%) | 0 (0.0%) |
| Total | 240 (100.0%) | 202 (100.0%) |
Earnings by Sex by Educational Attainment in Swayzee
Average earnings in Swayzee are $52,917 for men and $33,438 for women, a difference of 36.8%. Men with an educational attainment of graduate degree enjoy the highest average annual earnings of $103,125, while those with college or associate's degree education earn the least with $49,306. Women with an educational attainment of graduate degree earn the most with the average annual earnings of $70,833, while those with less than high school education have the smallest earnings of $14,375.
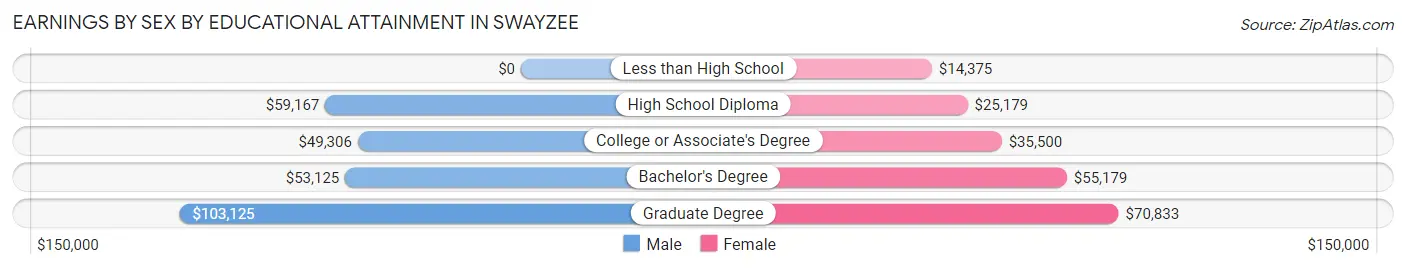
| Educational Attainment | Male Income | Female Income |
| Less than High School | - | - |
| High School Diploma | $59,167 | $25,179 |
| College or Associate's Degree | $49,306 | $35,500 |
| Bachelor's Degree | $53,125 | $55,179 |
| Graduate Degree | $103,125 | $70,833 |
| Total | $52,917 | $33,438 |
Family Income in Swayzee
Family Income Brackets in Swayzee
According to the Swayzee family income data, there are 54 families falling into the $100,000 to $149,999 income range, which is the most common income bracket and makes up 21.9% of all families. Conversely, the $150,000 to $199,999 income bracket is the least frequent group with only 3 families (1.2%) belonging to this category.
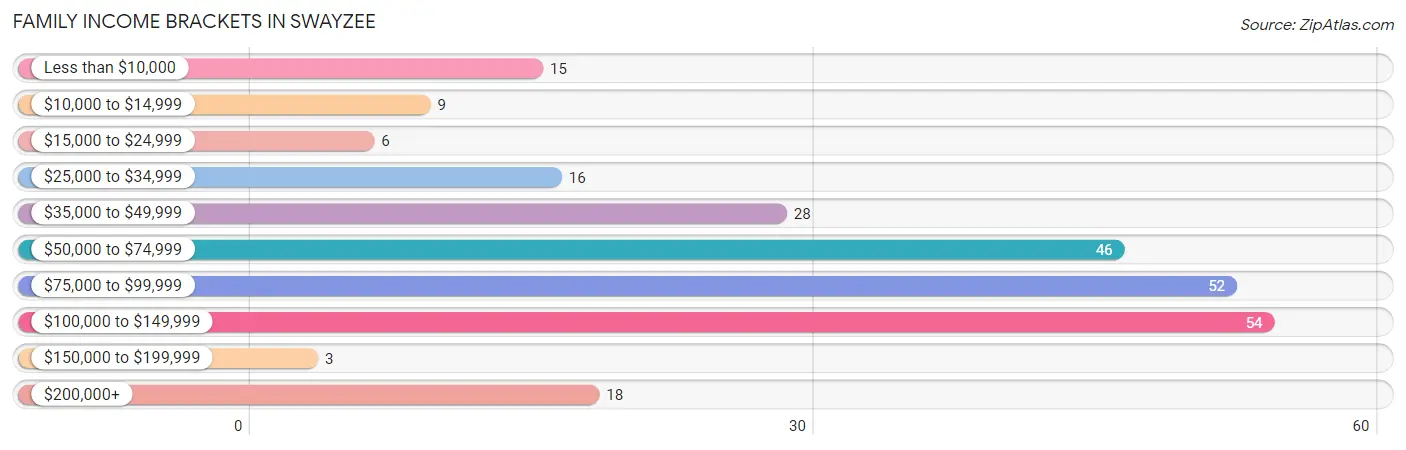
| Income Bracket | # Families | % Families |
| Less than $10,000 | 15 | 6.1% |
| $10,000 to $14,999 | 9 | 3.6% |
| $15,000 to $24,999 | 6 | 2.4% |
| $25,000 to $34,999 | 16 | 6.5% |
| $35,000 to $49,999 | 28 | 11.3% |
| $50,000 to $74,999 | 46 | 18.6% |
| $75,000 to $99,999 | 52 | 21.1% |
| $100,000 to $149,999 | 54 | 21.9% |
| $150,000 to $199,999 | 3 | 1.2% |
| $200,000+ | 18 | 7.3% |
Family Income by Famaliy Size in Swayzee
3-person families (57 | 23.1%) account for the highest median family income in Swayzee with $95,625 per family, while 2-person families (136 | 55.1%) have the highest median income of $37,678 per family member.
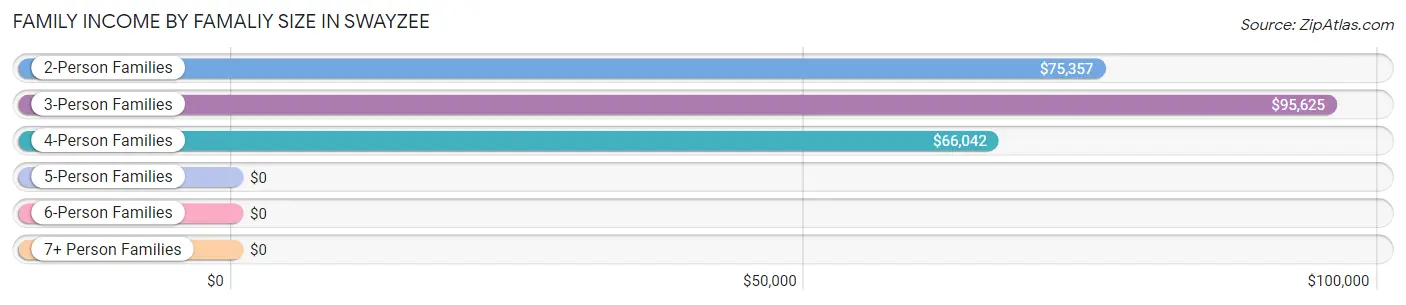
| Income Bracket | # Families | Median Income |
| 2-Person Families | 136 (55.1%) | $75,357 |
| 3-Person Families | 57 (23.1%) | $95,625 |
| 4-Person Families | 25 (10.1%) | $66,042 |
| 5-Person Families | 26 (10.5%) | $0 |
| 6-Person Families | 0 (0.0%) | $0 |
| 7+ Person Families | 3 (1.2%) | $0 |
| Total | 247 (100.0%) | $75,875 |
Family Income by Number of Earners in Swayzee
The median family income in Swayzee is $75,875, with families comprising 3+ earners (31) having the highest median family income of $139,519, while families with no earners (38) have the lowest median family income of $41,250, accounting for 12.6% and 15.4% of families, respectively.
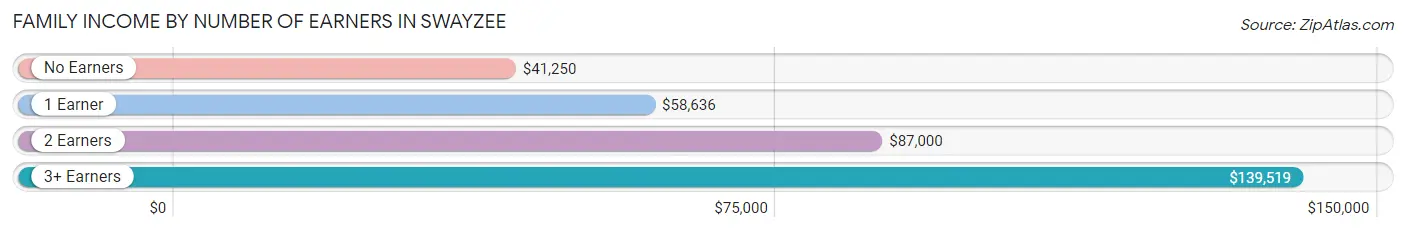
| Number of Earners | # Families | Median Income |
| No Earners | 38 (15.4%) | $41,250 |
| 1 Earner | 80 (32.4%) | $58,636 |
| 2 Earners | 98 (39.7%) | $87,000 |
| 3+ Earners | 31 (12.6%) | $139,519 |
| Total | 247 (100.0%) | $75,875 |
Household Income in Swayzee
Household Income Brackets in Swayzee
With 104 households falling in the category, the $50,000 to $74,999 income range is the most frequent in Swayzee, accounting for 25.6% of all households. In contrast, only 3 households (0.7%) fall into the $150,000 to $199,999 income bracket, making it the least populous group.
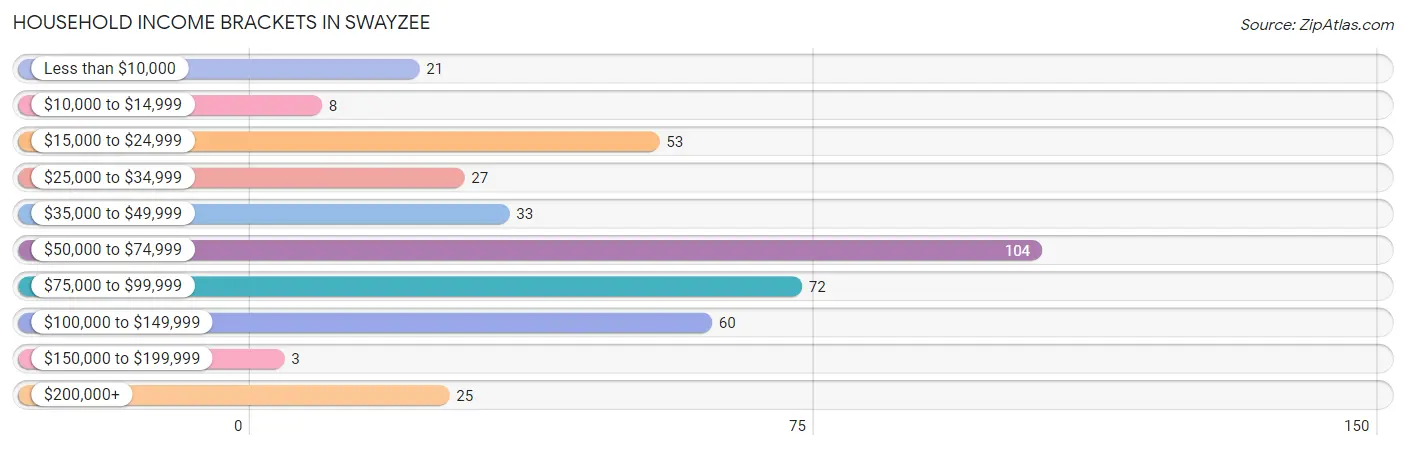
| Income Bracket | # Households | % Households |
| Less than $10,000 | 21 | 5.2% |
| $10,000 to $14,999 | 8 | 2.0% |
| $15,000 to $24,999 | 53 | 13.1% |
| $25,000 to $34,999 | 27 | 6.7% |
| $35,000 to $49,999 | 33 | 8.1% |
| $50,000 to $74,999 | 104 | 25.6% |
| $75,000 to $99,999 | 72 | 17.7% |
| $100,000 to $149,999 | 60 | 14.8% |
| $150,000 to $199,999 | 3 | 0.7% |
| $200,000+ | 25 | 6.2% |
Household Income by Householder Age in Swayzee
The median household income in Swayzee is $67,500, with the highest median household income of $81,806 found in the 15 to 24 years age bracket for the primary householder. A total of 21 households (5.2%) fall into this category. Meanwhile, the 65+ years age bracket for the primary householder has the lowest median household income of $57,813, with 148 households (36.4%) in this group.
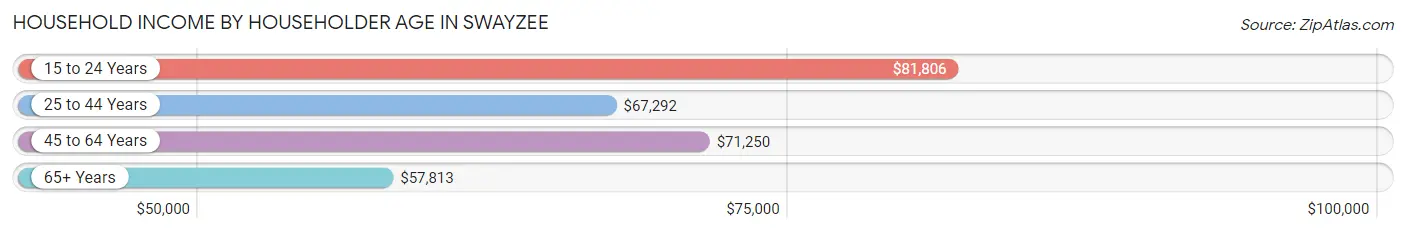
| Income Bracket | # Households | Median Income |
| 15 to 24 Years | 21 (5.2%) | $81,806 |
| 25 to 44 Years | 101 (24.9%) | $67,292 |
| 45 to 64 Years | 136 (33.5%) | $71,250 |
| 65+ Years | 148 (36.4%) | $57,813 |
| Total | 406 (100.0%) | $67,500 |
Poverty in Swayzee
Income Below Poverty by Sex and Age in Swayzee
With 12.5% poverty level for males and 18.3% for females among the residents of Swayzee, 5 year old males and 5 year old females are the most vulnerable to poverty, with 3 males (100.0%) and 1 females (100.0%) in their respective age groups living below the poverty level.
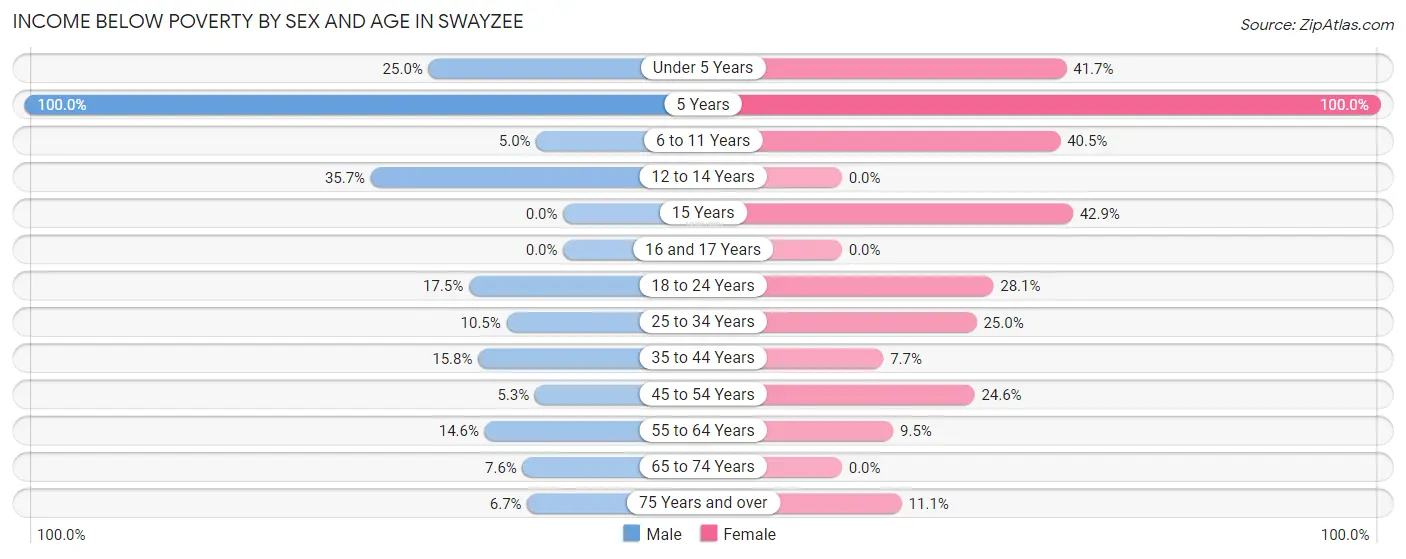
| Age Bracket | Male | Female |
| Under 5 Years | 8 (25.0%) | 15 (41.7%) |
| 5 Years | 3 (100.0%) | 1 (100.0%) |
| 6 to 11 Years | 3 (5.0%) | 15 (40.5%) |
| 12 to 14 Years | 5 (35.7%) | 0 (0.0%) |
| 15 Years | 0 (0.0%) | 3 (42.9%) |
| 16 and 17 Years | 0 (0.0%) | 0 (0.0%) |
| 18 to 24 Years | 7 (17.5%) | 9 (28.1%) |
| 25 to 34 Years | 4 (10.5%) | 15 (25.0%) |
| 35 to 44 Years | 9 (15.8%) | 3 (7.7%) |
| 45 to 54 Years | 3 (5.3%) | 16 (24.6%) |
| 55 to 64 Years | 7 (14.6%) | 6 (9.5%) |
| 65 to 74 Years | 4 (7.5%) | 0 (0.0%) |
| 75 Years and over | 2 (6.7%) | 5 (11.1%) |
| Total | 55 (12.5%) | 88 (18.3%) |
Income Above Poverty by Sex and Age in Swayzee
According to the poverty statistics in Swayzee, males aged 16 and 17 years and females aged 12 to 14 years are the age groups that are most secure financially, with 100.0% of males and 100.0% of females in these age groups living above the poverty line.
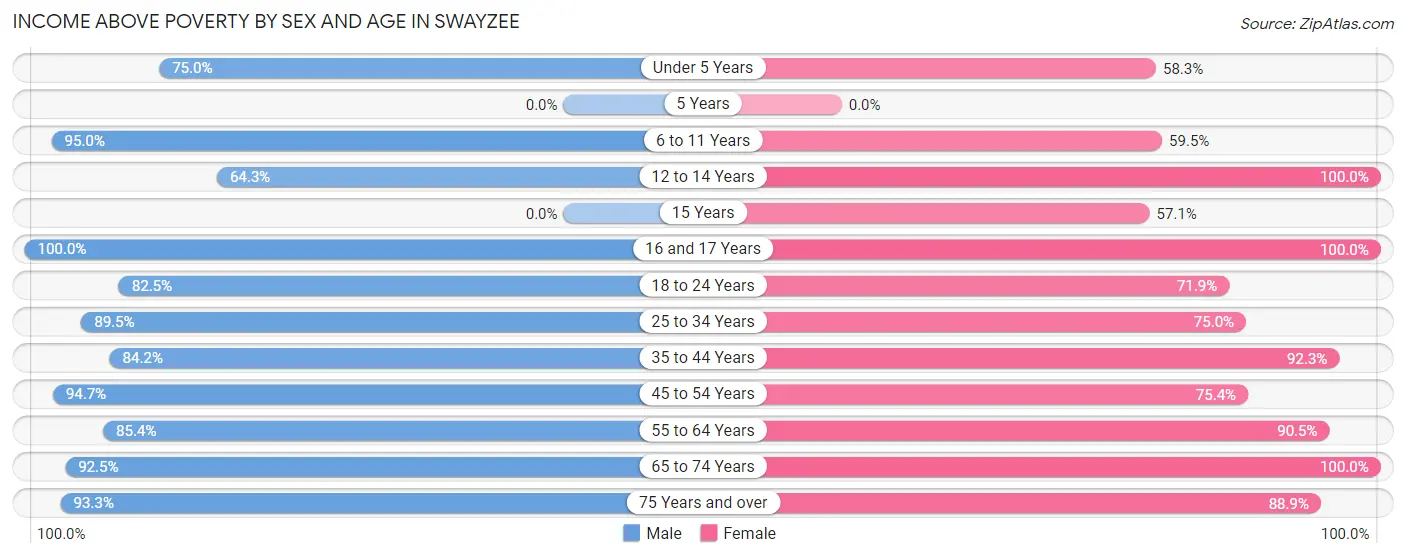
| Age Bracket | Male | Female |
| Under 5 Years | 24 (75.0%) | 21 (58.3%) |
| 5 Years | 0 (0.0%) | 0 (0.0%) |
| 6 to 11 Years | 57 (95.0%) | 22 (59.5%) |
| 12 to 14 Years | 9 (64.3%) | 11 (100.0%) |
| 15 Years | 0 (0.0%) | 4 (57.1%) |
| 16 and 17 Years | 7 (100.0%) | 10 (100.0%) |
| 18 to 24 Years | 33 (82.5%) | 23 (71.9%) |
| 25 to 34 Years | 34 (89.5%) | 45 (75.0%) |
| 35 to 44 Years | 48 (84.2%) | 36 (92.3%) |
| 45 to 54 Years | 54 (94.7%) | 49 (75.4%) |
| 55 to 64 Years | 41 (85.4%) | 57 (90.5%) |
| 65 to 74 Years | 49 (92.4%) | 76 (100.0%) |
| 75 Years and over | 28 (93.3%) | 40 (88.9%) |
| Total | 384 (87.5%) | 394 (81.7%) |
Income Below Poverty Among Married-Couple Families in Swayzee
The poverty statistics for married-couple families in Swayzee show that 8.0% or 16 of the total 199 families live below the poverty line. Families with 3 or 4 children have the highest poverty rate of 40.0%, comprising of 8 families. On the other hand, families with 1 or 2 children have the lowest poverty rate of 0.0%, which includes 0 families.
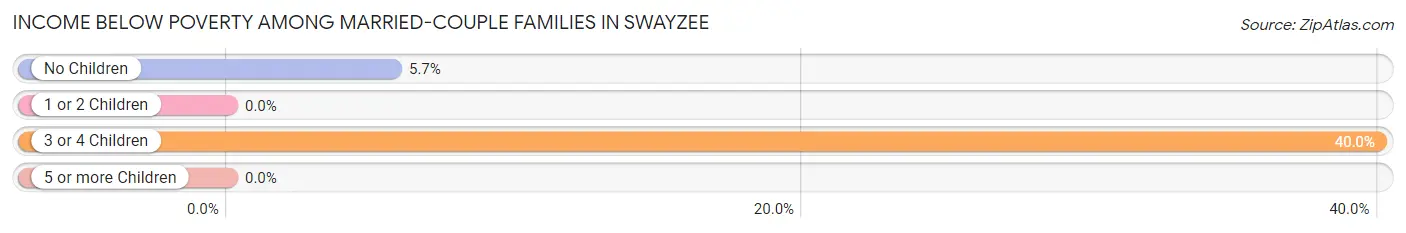
| Children | Above Poverty | Below Poverty |
| No Children | 132 (94.3%) | 8 (5.7%) |
| 1 or 2 Children | 39 (100.0%) | 0 (0.0%) |
| 3 or 4 Children | 12 (60.0%) | 8 (40.0%) |
| 5 or more Children | 0 (0.0%) | 0 (0.0%) |
| Total | 183 (92.0%) | 16 (8.0%) |
Income Below Poverty Among Single-Parent Households in Swayzee
According to the poverty data in Swayzee, 35.7% or 5 single-father households and 41.2% or 14 single-mother households are living below the poverty line. Among single-father households, those with 1 or 2 children have the highest poverty rate, with 5 households (62.5%) experiencing poverty. Likewise, among single-mother households, those with 1 or 2 children have the highest poverty rate, with 11 households (50.0%) falling below the poverty line.
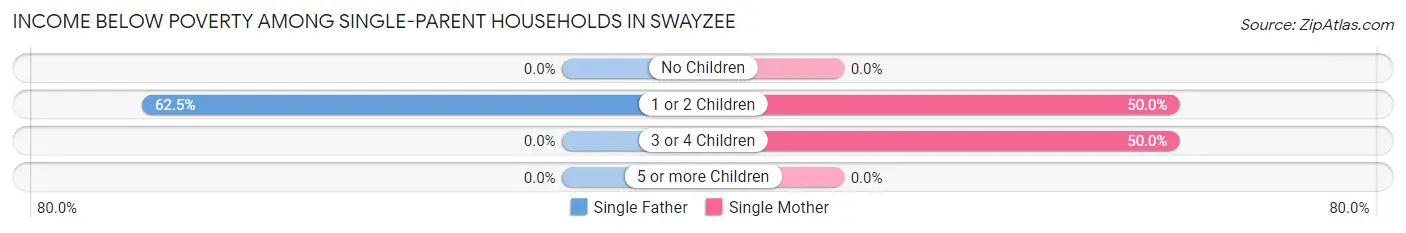
| Children | Single Father | Single Mother |
| No Children | 0 (0.0%) | 0 (0.0%) |
| 1 or 2 Children | 5 (62.5%) | 11 (50.0%) |
| 3 or 4 Children | 0 (0.0%) | 3 (50.0%) |
| 5 or more Children | 0 (0.0%) | 0 (0.0%) |
| Total | 5 (35.7%) | 14 (41.2%) |
Income Below Poverty Among Married-Couple vs Single-Parent Households in Swayzee
The poverty data for Swayzee shows that 16 of the married-couple family households (8.0%) and 19 of the single-parent households (39.6%) are living below the poverty level. Within the married-couple family households, those with 3 or 4 children have the highest poverty rate, with 8 households (40.0%) falling below the poverty line. Among the single-parent households, those with 1 or 2 children have the highest poverty rate, with 16 household (53.3%) living below poverty.
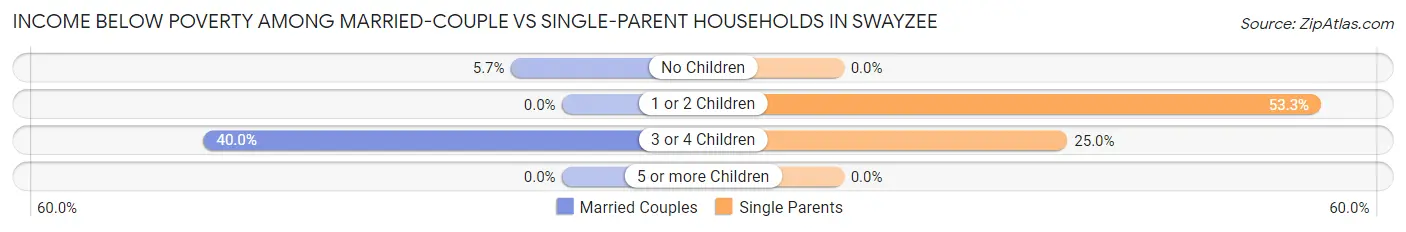
| Children | Married-Couple Families | Single-Parent Households |
| No Children | 8 (5.7%) | 0 (0.0%) |
| 1 or 2 Children | 0 (0.0%) | 16 (53.3%) |
| 3 or 4 Children | 8 (40.0%) | 3 (25.0%) |
| 5 or more Children | 0 (0.0%) | 0 (0.0%) |
| Total | 16 (8.0%) | 19 (39.6%) |
Employment Characteristics in Swayzee
Employment by Class of Employer in Swayzee
Among the 385 employed individuals in Swayzee, private company employees (275 | 71.4%), local government employees (39 | 10.1%), and not-for-profit organizations (34 | 8.8%) make up the most common classes of employment.
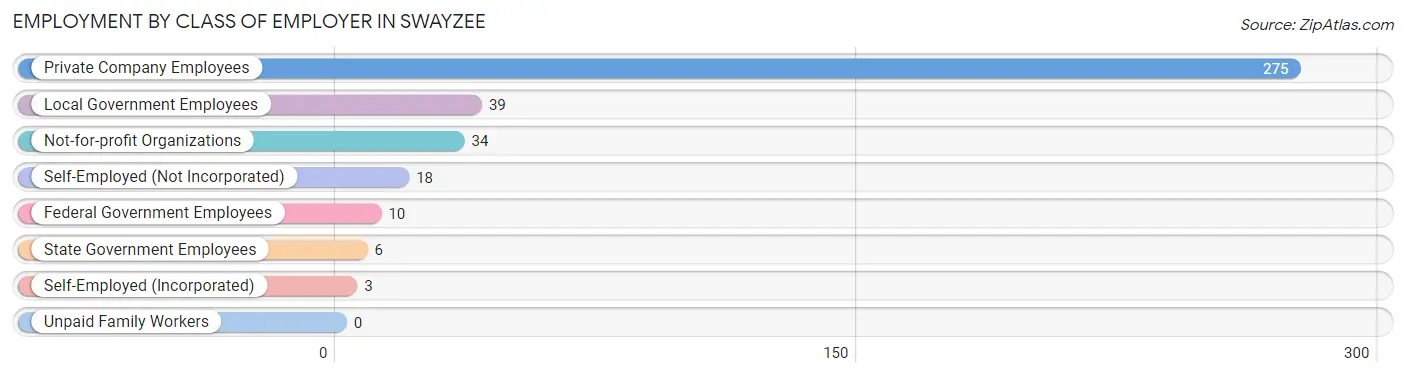
| Employer Class | # Employees | % Employees |
| Private Company Employees | 275 | 71.4% |
| Self-Employed (Incorporated) | 3 | 0.8% |
| Self-Employed (Not Incorporated) | 18 | 4.7% |
| Not-for-profit Organizations | 34 | 8.8% |
| Local Government Employees | 39 | 10.1% |
| State Government Employees | 6 | 1.6% |
| Federal Government Employees | 10 | 2.6% |
| Unpaid Family Workers | 0 | 0.0% |
| Total | 385 | 100.0% |
Employment Status by Age in Swayzee
According to the labor force statistics for Swayzee, out of the total population over 16 years of age (720), 58.5% or 421 individuals are in the labor force, with 4.5% or 19 of them unemployed. The age group with the highest labor force participation rate is 20 to 24 years, with 94.6% or 53 individuals in the labor force. Within the labor force, the 16 to 19 years age range has the highest percentage of unemployed individuals, with 16.7% or 1 of them being unemployed.
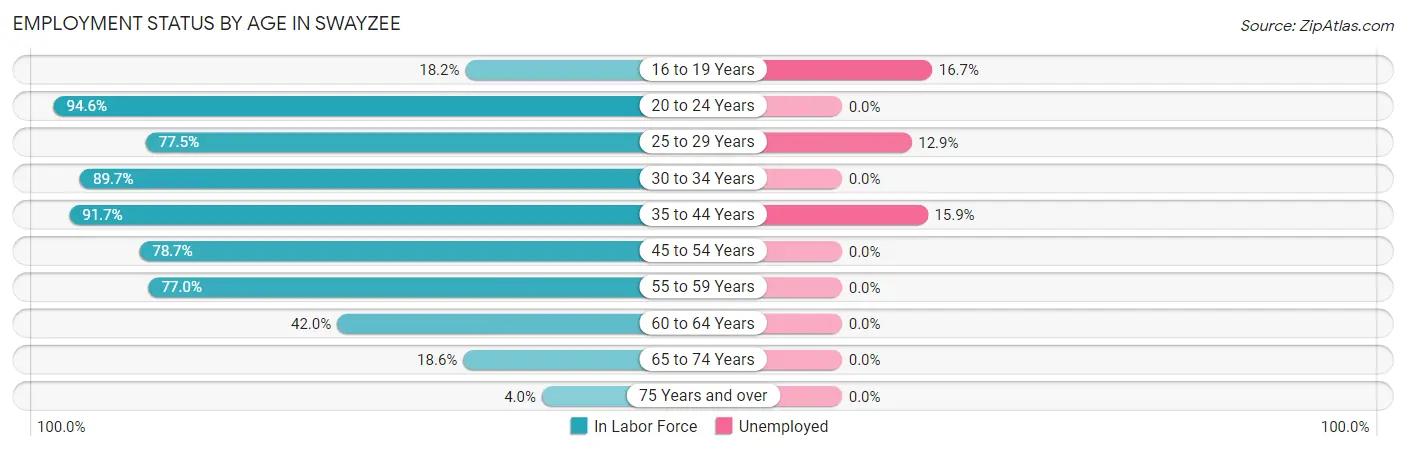
| Age Bracket | In Labor Force | Unemployed |
| 16 to 19 Years | 6 (18.2%) | 1 (16.7%) |
| 20 to 24 Years | 53 (94.6%) | 0 (0.0%) |
| 25 to 29 Years | 31 (77.5%) | 4 (12.9%) |
| 30 to 34 Years | 52 (89.7%) | 0 (0.0%) |
| 35 to 44 Years | 88 (91.7%) | 14 (15.9%) |
| 45 to 54 Years | 96 (78.7%) | 0 (0.0%) |
| 55 to 59 Years | 47 (77.0%) | 0 (0.0%) |
| 60 to 64 Years | 21 (42.0%) | 0 (0.0%) |
| 65 to 74 Years | 24 (18.6%) | 0 (0.0%) |
| 75 Years and over | 3 (4.0%) | 0 (0.0%) |
| Total | 421 (58.5%) | 19 (4.5%) |
Employment Status by Educational Attainment in Swayzee
According to labor force statistics for Swayzee, 78.5% of individuals (335) out of the total population between 25 and 64 years of age (427) are in the labor force, with 5.4% or 18 of them being unemployed. The group with the highest labor force participation rate are those with the educational attainment of less than high school, with 87.5% or 21 individuals in the labor force. Within the labor force, individuals with college / associate degree education have the highest percentage of unemployment, with 8.6% or 10 of them being unemployed.
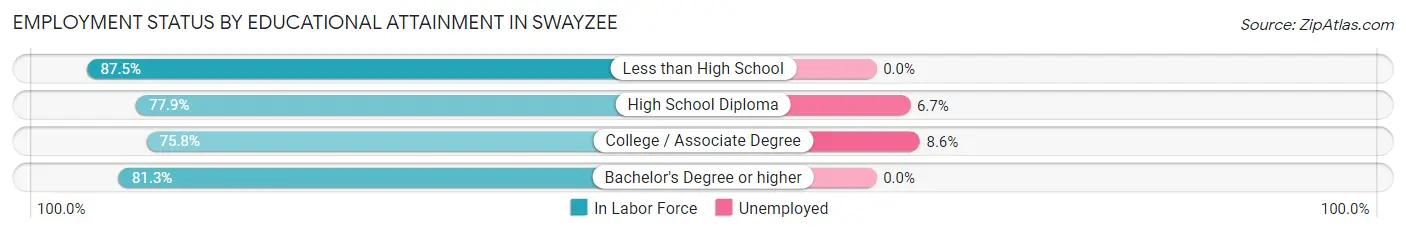
| Educational Attainment | In Labor Force | Unemployed |
| Less than High School | 21 (87.5%) | 0 (0.0%) |
| High School Diploma | 120 (77.9%) | 10 (6.7%) |
| College / Associate Degree | 116 (75.8%) | 13 (8.6%) |
| Bachelor's Degree or higher | 78 (81.3%) | 0 (0.0%) |
| Total | 335 (78.5%) | 23 (5.4%) |
Employment Occupations by Sex in Swayzee
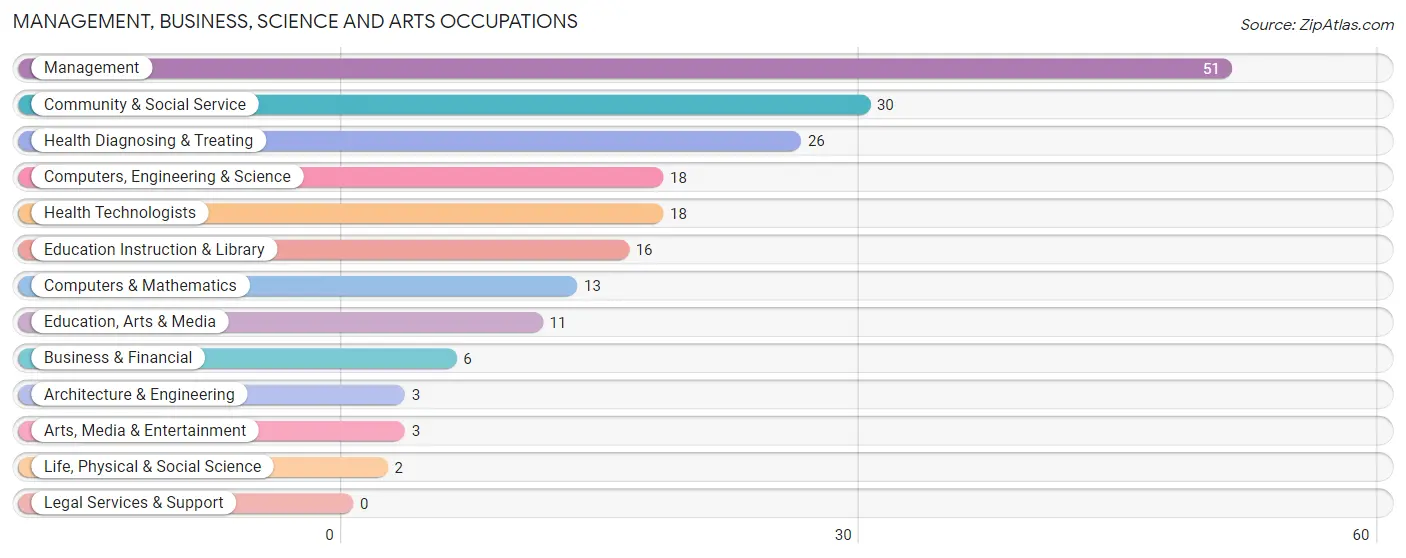
Management, Business, Science and Arts Occupations
The most common Management, Business, Science and Arts occupations in Swayzee are Management (51 | 12.7%), Community & Social Service (30 | 7.5%), Health Diagnosing & Treating (26 | 6.5%), Computers, Engineering & Science (18 | 4.5%), and Health Technologists (18 | 4.5%).
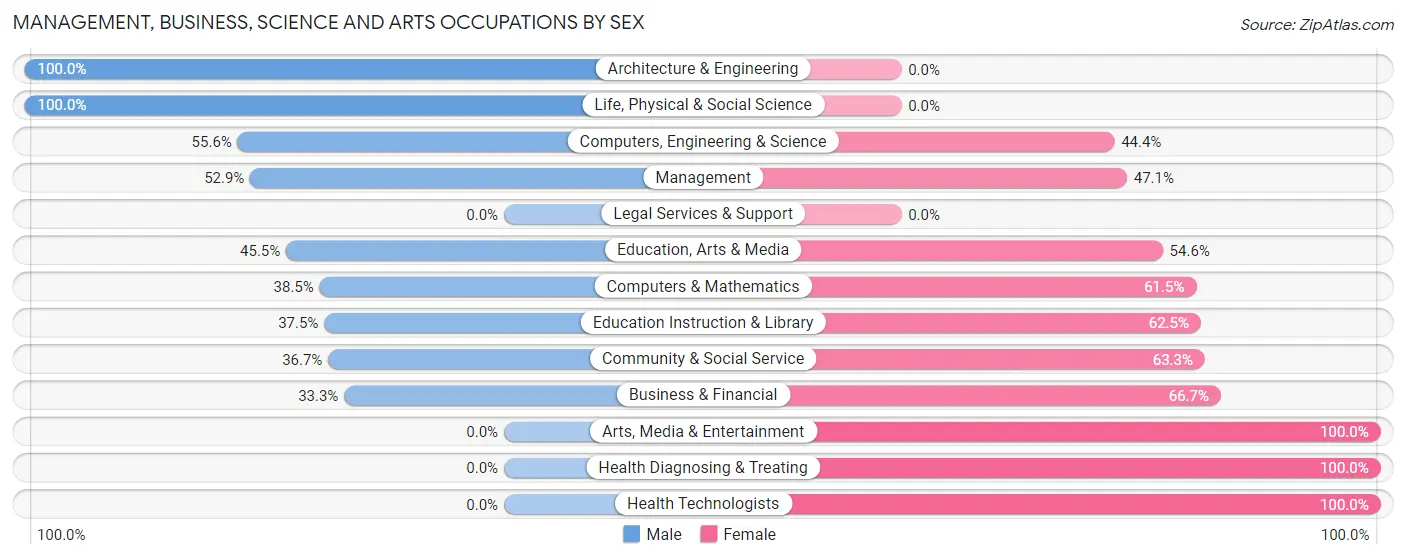
Management, Business, Science and Arts Occupations by Sex
Within the Management, Business, Science and Arts occupations in Swayzee, the most male-oriented occupations are Architecture & Engineering (100.0%), Life, Physical & Social Science (100.0%), and Computers, Engineering & Science (55.6%), while the most female-oriented occupations are Arts, Media & Entertainment (100.0%), Health Diagnosing & Treating (100.0%), and Health Technologists (100.0%).
| Occupation | Male | Female |
| Management | 27 (52.9%) | 24 (47.1%) |
| Business & Financial | 2 (33.3%) | 4 (66.7%) |
| Computers, Engineering & Science | 10 (55.6%) | 8 (44.4%) |
| Computers & Mathematics | 5 (38.5%) | 8 (61.5%) |
| Architecture & Engineering | 3 (100.0%) | 0 (0.0%) |
| Life, Physical & Social Science | 2 (100.0%) | 0 (0.0%) |
| Community & Social Service | 11 (36.7%) | 19 (63.3%) |
| Education, Arts & Media | 5 (45.5%) | 6 (54.5%) |
| Legal Services & Support | 0 (0.0%) | 0 (0.0%) |
| Education Instruction & Library | 6 (37.5%) | 10 (62.5%) |
| Arts, Media & Entertainment | 0 (0.0%) | 3 (100.0%) |
| Health Diagnosing & Treating | 0 (0.0%) | 26 (100.0%) |
| Health Technologists | 0 (0.0%) | 18 (100.0%) |
| Total (Category) | 50 (38.2%) | 81 (61.8%) |
| Total (Overall) | 224 (55.7%) | 178 (44.3%) |
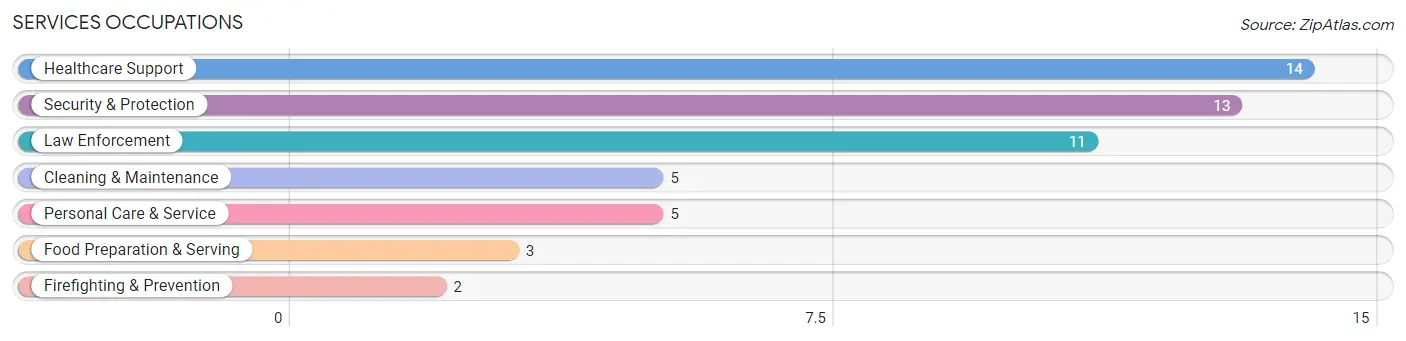
Services Occupations
The most common Services occupations in Swayzee are Healthcare Support (14 | 3.5%), Security & Protection (13 | 3.2%), Law Enforcement (11 | 2.7%), Cleaning & Maintenance (5 | 1.2%), and Personal Care & Service (5 | 1.2%).
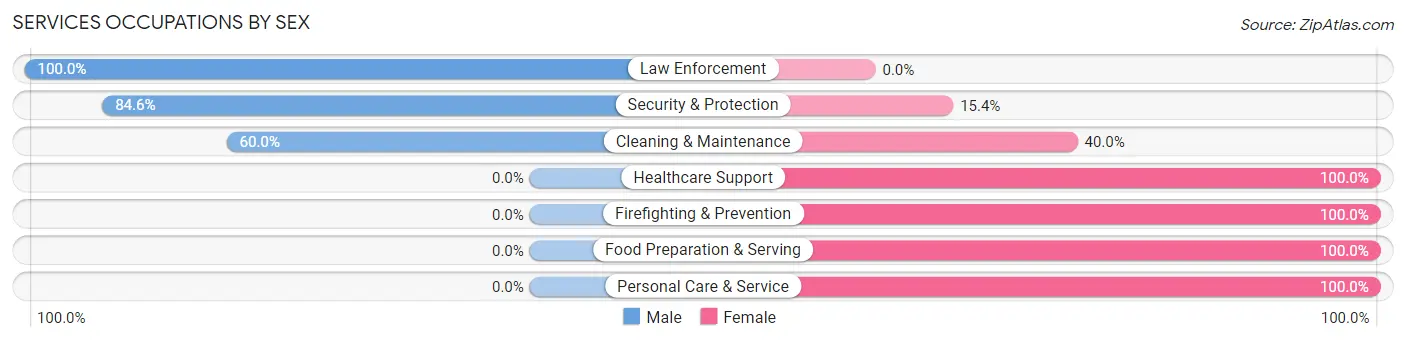
Services Occupations by Sex
Within the Services occupations in Swayzee, the most male-oriented occupations are Law Enforcement (100.0%), Security & Protection (84.6%), and Cleaning & Maintenance (60.0%), while the most female-oriented occupations are Healthcare Support (100.0%), Firefighting & Prevention (100.0%), and Food Preparation & Serving (100.0%).
| Occupation | Male | Female |
| Healthcare Support | 0 (0.0%) | 14 (100.0%) |
| Security & Protection | 11 (84.6%) | 2 (15.4%) |
| Firefighting & Prevention | 0 (0.0%) | 2 (100.0%) |
| Law Enforcement | 11 (100.0%) | 0 (0.0%) |
| Food Preparation & Serving | 0 (0.0%) | 3 (100.0%) |
| Cleaning & Maintenance | 3 (60.0%) | 2 (40.0%) |
| Personal Care & Service | 0 (0.0%) | 5 (100.0%) |
| Total (Category) | 14 (35.0%) | 26 (65.0%) |
| Total (Overall) | 224 (55.7%) | 178 (44.3%) |
Sales and Office Occupations
The most common Sales and Office occupations in Swayzee are Office & Administration (47 | 11.7%), and Sales & Related (15 | 3.7%).
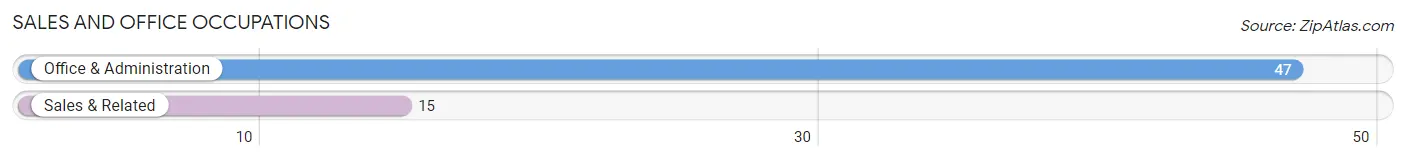
Sales and Office Occupations by Sex
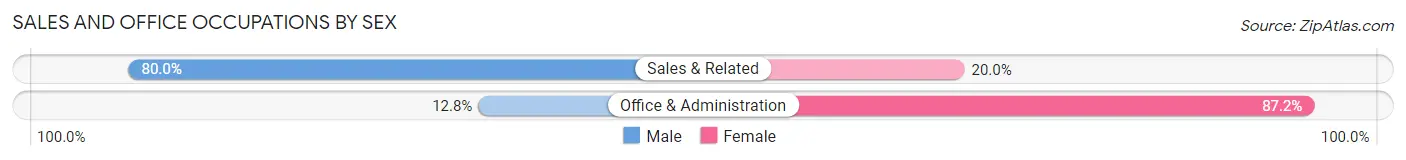
| Occupation | Male | Female |
| Sales & Related | 12 (80.0%) | 3 (20.0%) |
| Office & Administration | 6 (12.8%) | 41 (87.2%) |
| Total (Category) | 18 (29.0%) | 44 (71.0%) |
| Total (Overall) | 224 (55.7%) | 178 (44.3%) |
Natural Resources, Construction and Maintenance Occupations
The most common Natural Resources, Construction and Maintenance occupations in Swayzee are Construction & Extraction (19 | 4.7%), and Installation, Maintenance & Repair (4 | 1.0%).
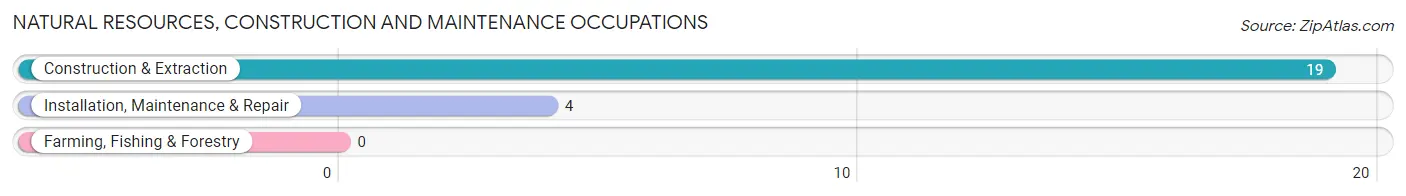
Natural Resources, Construction and Maintenance Occupations by Sex
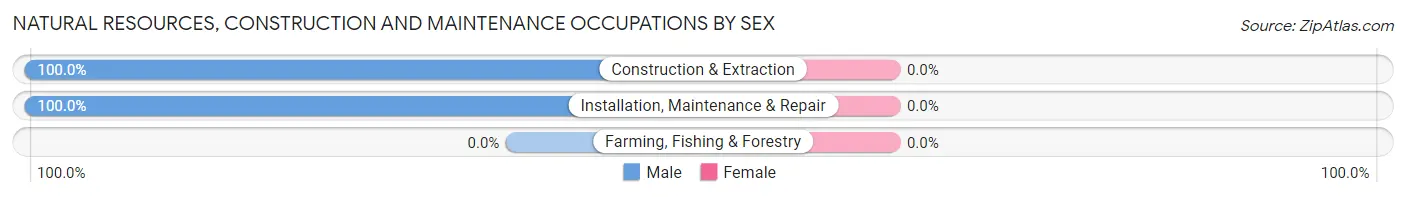
| Occupation | Male | Female |
| Farming, Fishing & Forestry | 0 (0.0%) | 0 (0.0%) |
| Construction & Extraction | 19 (100.0%) | 0 (0.0%) |
| Installation, Maintenance & Repair | 4 (100.0%) | 0 (0.0%) |
| Total (Category) | 23 (100.0%) | 0 (0.0%) |
| Total (Overall) | 224 (55.7%) | 178 (44.3%) |
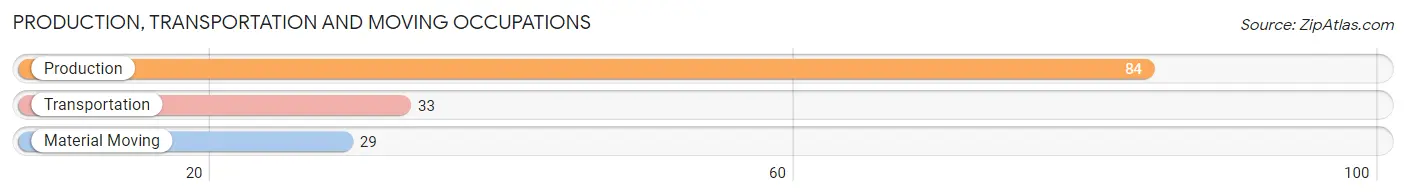
Production, Transportation and Moving Occupations
The most common Production, Transportation and Moving occupations in Swayzee are Production (84 | 20.9%), Transportation (33 | 8.2%), and Material Moving (29 | 7.2%).
Production, Transportation and Moving Occupations by Sex
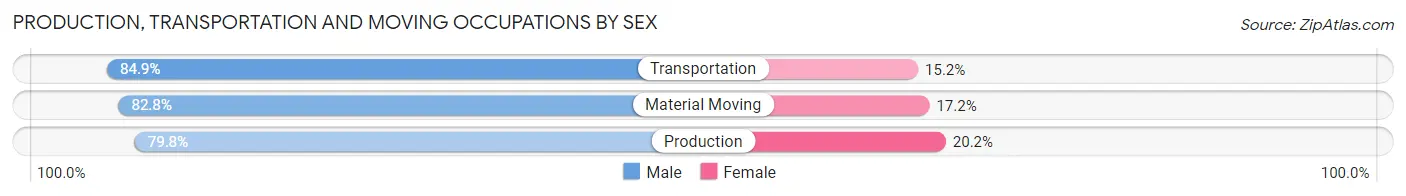
| Occupation | Male | Female |
| Production | 67 (79.8%) | 17 (20.2%) |
| Transportation | 28 (84.9%) | 5 (15.1%) |
| Material Moving | 24 (82.8%) | 5 (17.2%) |
| Total (Category) | 119 (81.5%) | 27 (18.5%) |
| Total (Overall) | 224 (55.7%) | 178 (44.3%) |
Employment Industries by Sex in Swayzee
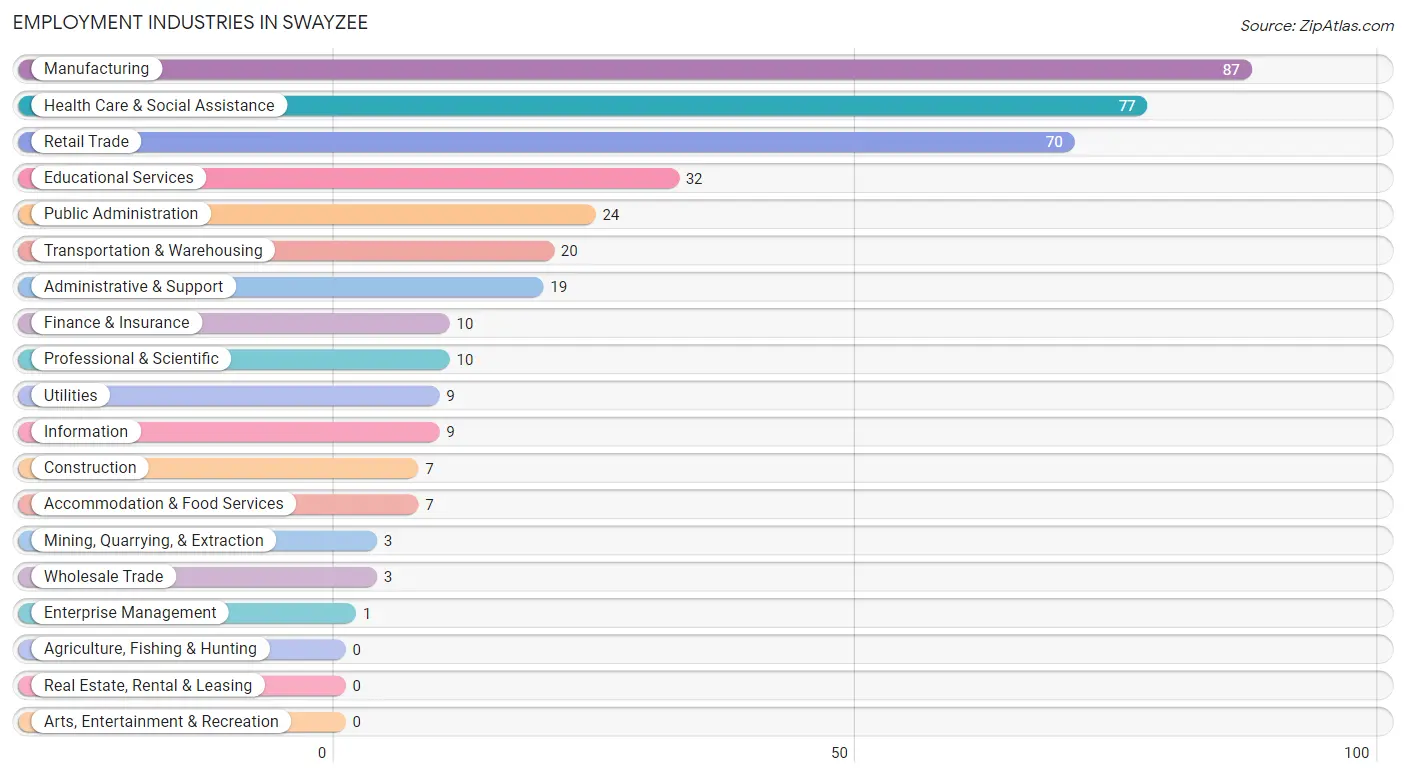
Employment Industries in Swayzee
The major employment industries in Swayzee include Manufacturing (87 | 21.6%), Health Care & Social Assistance (77 | 19.2%), Retail Trade (70 | 17.4%), Educational Services (32 | 8.0%), and Public Administration (24 | 6.0%).
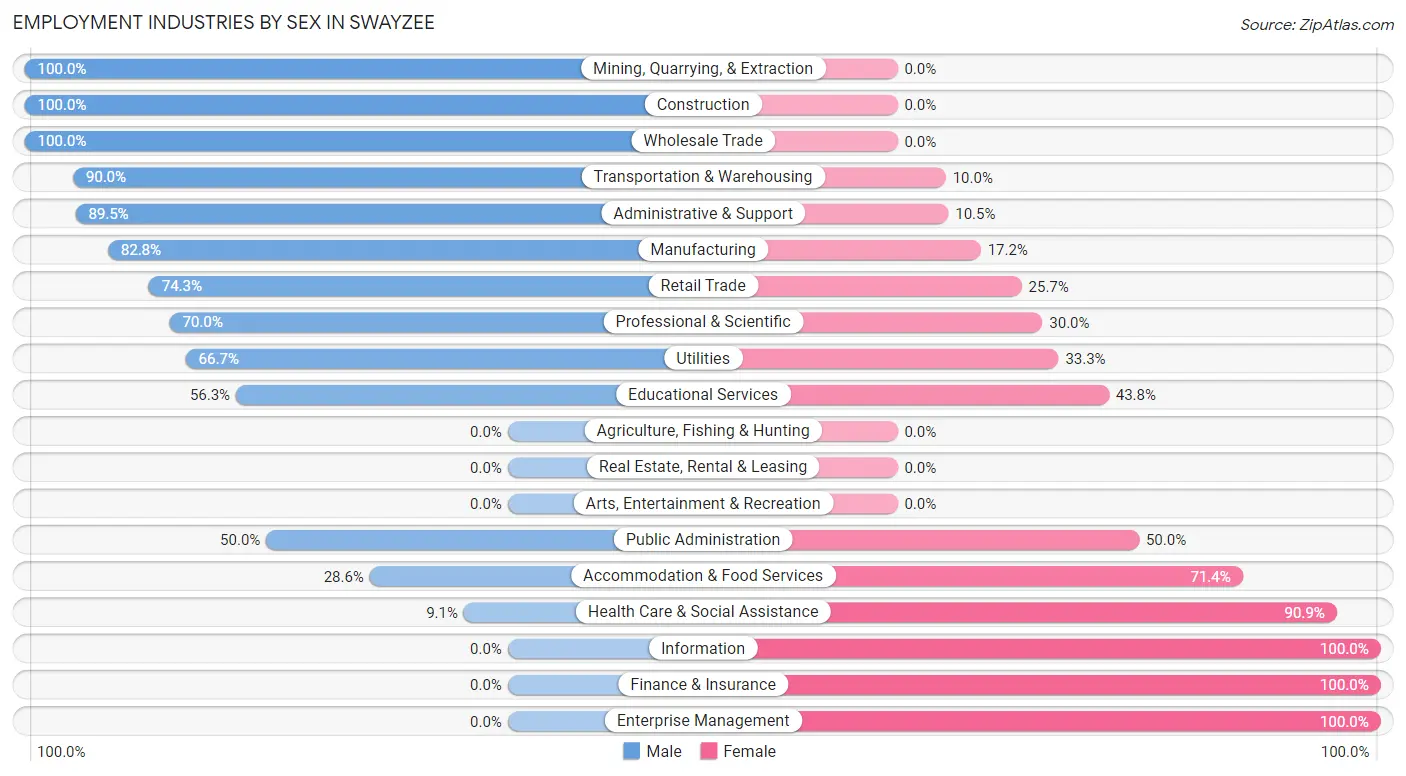
Employment Industries by Sex in Swayzee
The Swayzee industries that see more men than women are Mining, Quarrying, & Extraction (100.0%), Construction (100.0%), and Wholesale Trade (100.0%), whereas the industries that tend to have a higher number of women are Information (100.0%), Finance & Insurance (100.0%), and Enterprise Management (100.0%).
| Industry | Male | Female |
| Agriculture, Fishing & Hunting | 0 (0.0%) | 0 (0.0%) |
| Mining, Quarrying, & Extraction | 3 (100.0%) | 0 (0.0%) |
| Construction | 7 (100.0%) | 0 (0.0%) |
| Manufacturing | 72 (82.8%) | 15 (17.2%) |
| Wholesale Trade | 3 (100.0%) | 0 (0.0%) |
| Retail Trade | 52 (74.3%) | 18 (25.7%) |
| Transportation & Warehousing | 18 (90.0%) | 2 (10.0%) |
| Utilities | 6 (66.7%) | 3 (33.3%) |
| Information | 0 (0.0%) | 9 (100.0%) |
| Finance & Insurance | 0 (0.0%) | 10 (100.0%) |
| Real Estate, Rental & Leasing | 0 (0.0%) | 0 (0.0%) |
| Professional & Scientific | 7 (70.0%) | 3 (30.0%) |
| Enterprise Management | 0 (0.0%) | 1 (100.0%) |
| Administrative & Support | 17 (89.5%) | 2 (10.5%) |
| Educational Services | 18 (56.2%) | 14 (43.8%) |
| Health Care & Social Assistance | 7 (9.1%) | 70 (90.9%) |
| Arts, Entertainment & Recreation | 0 (0.0%) | 0 (0.0%) |
| Accommodation & Food Services | 2 (28.6%) | 5 (71.4%) |
| Public Administration | 12 (50.0%) | 12 (50.0%) |
| Total | 224 (55.7%) | 178 (44.3%) |
Education in Swayzee
School Enrollment in Swayzee
The most common levels of schooling among the 203 students in Swayzee are elementary school (84 | 41.4%), middle school (36 | 17.7%), and college / undergraduate (25 | 12.3%).
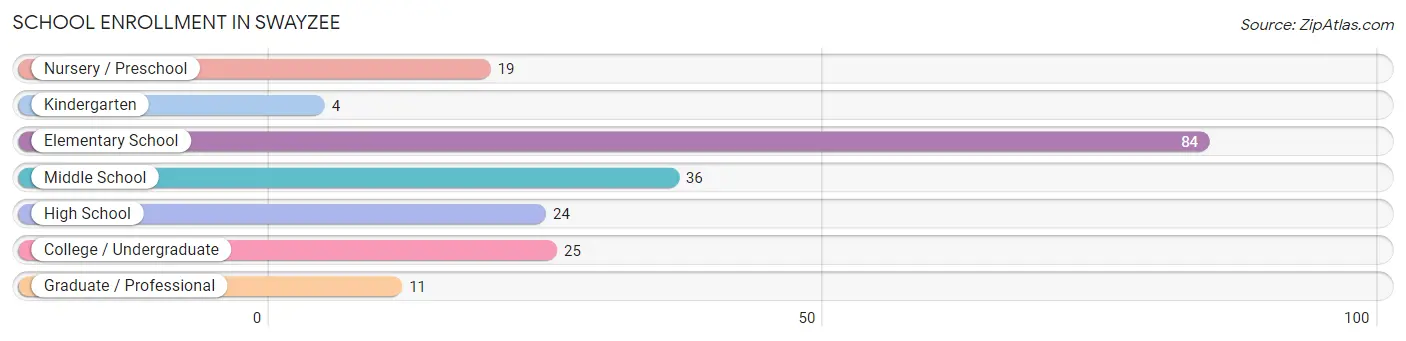
| School Level | # Students | % Students |
| Nursery / Preschool | 19 | 9.4% |
| Kindergarten | 4 | 2.0% |
| Elementary School | 84 | 41.4% |
| Middle School | 36 | 17.7% |
| High School | 24 | 11.8% |
| College / Undergraduate | 25 | 12.3% |
| Graduate / Professional | 11 | 5.4% |
| Total | 203 | 100.0% |
School Enrollment by Age by Funding Source in Swayzee
Out of a total of 203 students who are enrolled in schools in Swayzee, 27 (13.3%) attend a private institution, while the remaining 176 (86.7%) are enrolled in public schools. The age group of 35 years and over has the highest likelihood of being enrolled in private schools, with 2 (100.0% in the age bracket) enrolled. Conversely, the age group of 15 to 17 year olds has the lowest likelihood of being enrolled in a private school, with 21 (100.0% in the age bracket) attending a public institution.
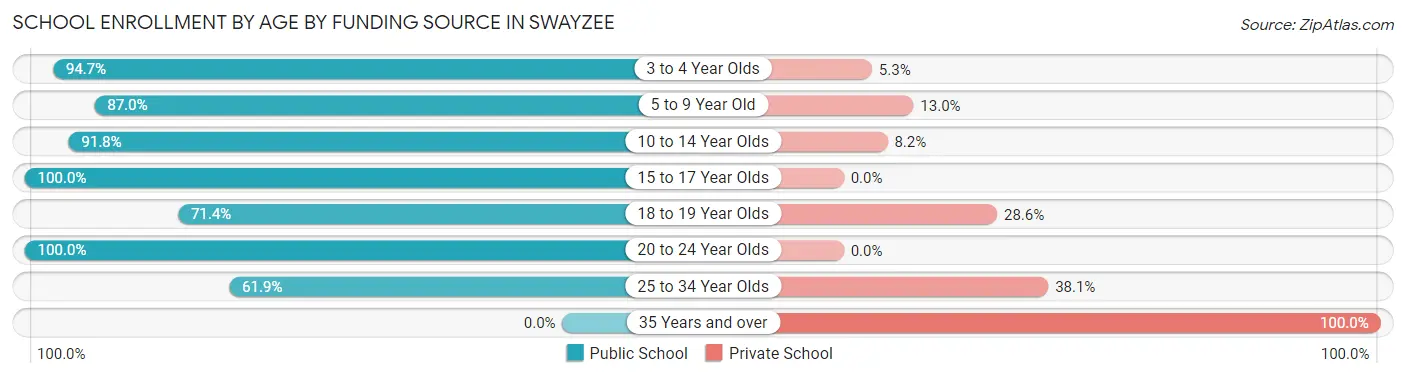
| Age Bracket | Public School | Private School |
| 3 to 4 Year Olds | 18 (94.7%) | 1 (5.3%) |
| 5 to 9 Year Old | 67 (87.0%) | 10 (13.0%) |
| 10 to 14 Year Olds | 45 (91.8%) | 4 (8.2%) |
| 15 to 17 Year Olds | 21 (100.0%) | 0 (0.0%) |
| 18 to 19 Year Olds | 5 (71.4%) | 2 (28.6%) |
| 20 to 24 Year Olds | 7 (100.0%) | 0 (0.0%) |
| 25 to 34 Year Olds | 13 (61.9%) | 8 (38.1%) |
| 35 Years and over | 0 (0.0%) | 2 (100.0%) |
| Total | 176 (86.7%) | 27 (13.3%) |
Educational Attainment by Field of Study in Swayzee
Education (40 | 32.3%), business (18 | 14.5%), arts & humanities (17 | 13.7%), science & technology (16 | 12.9%), and liberal arts & history (9 | 7.3%) are the most common fields of study among 124 individuals in Swayzee who have obtained a bachelor's degree or higher.
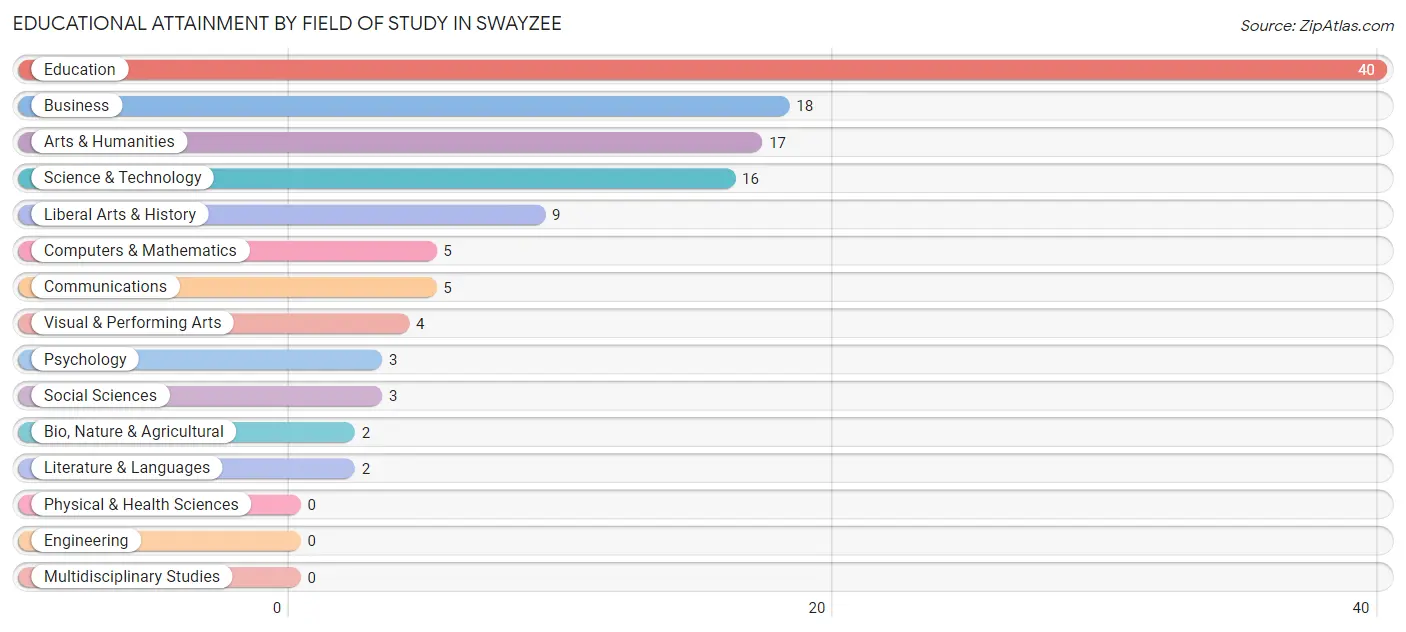
| Field of Study | # Graduates | % Graduates |
| Computers & Mathematics | 5 | 4.0% |
| Bio, Nature & Agricultural | 2 | 1.6% |
| Physical & Health Sciences | 0 | 0.0% |
| Psychology | 3 | 2.4% |
| Social Sciences | 3 | 2.4% |
| Engineering | 0 | 0.0% |
| Multidisciplinary Studies | 0 | 0.0% |
| Science & Technology | 16 | 12.9% |
| Business | 18 | 14.5% |
| Education | 40 | 32.3% |
| Literature & Languages | 2 | 1.6% |
| Liberal Arts & History | 9 | 7.3% |
| Visual & Performing Arts | 4 | 3.2% |
| Communications | 5 | 4.0% |
| Arts & Humanities | 17 | 13.7% |
| Total | 124 | 100.0% |
Transportation & Commute in Swayzee
Vehicle Availability by Sex in Swayzee
The most prevalent vehicle ownership categories in Swayzee are males with 2 vehicles (80, accounting for 38.3%) and females with 2 vehicles (75, making up 45.5%).
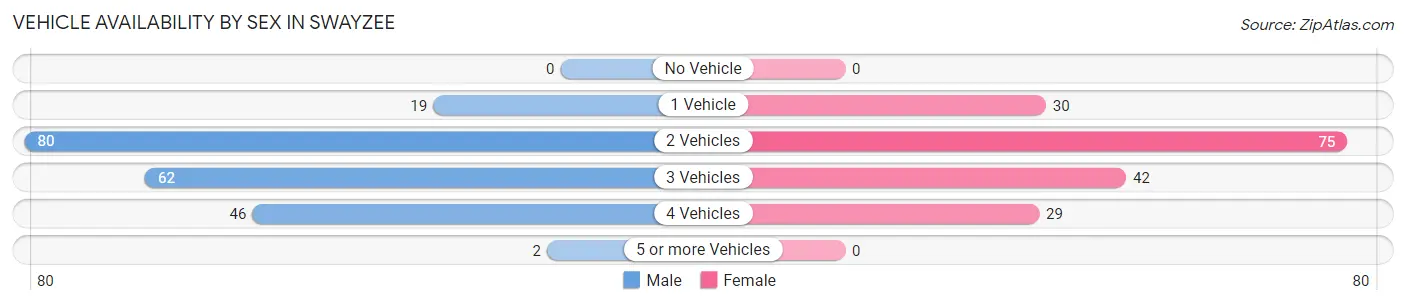
| Vehicles Available | Male | Female |
| No Vehicle | 0 (0.0%) | 0 (0.0%) |
| 1 Vehicle | 19 (9.1%) | 30 (17.1%) |
| 2 Vehicles | 80 (38.3%) | 75 (42.6%) |
| 3 Vehicles | 62 (29.7%) | 42 (23.9%) |
| 4 Vehicles | 46 (22.0%) | 29 (16.5%) |
| 5 or more Vehicles | 2 (1.0%) | 0 (0.0%) |
| Total | 209 (100.0%) | 176 (100.0%) |
Commute Time in Swayzee
The most frequently occuring commute durations in Swayzee are 20 to 24 minutes (101 commuters, 26.9%), 15 to 19 minutes (75 commuters, 20.0%), and 30 to 34 minutes (41 commuters, 10.9%).
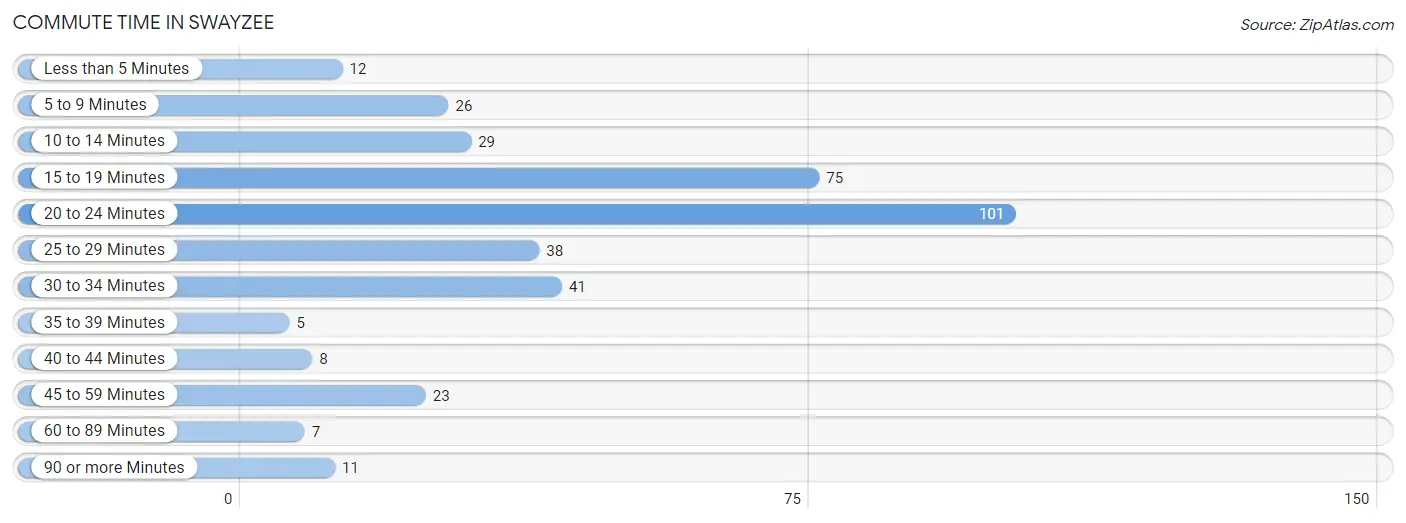
| Commute Time | # Commuters | % Commuters |
| Less than 5 Minutes | 12 | 3.2% |
| 5 to 9 Minutes | 26 | 6.9% |
| 10 to 14 Minutes | 29 | 7.7% |
| 15 to 19 Minutes | 75 | 20.0% |
| 20 to 24 Minutes | 101 | 26.9% |
| 25 to 29 Minutes | 38 | 10.1% |
| 30 to 34 Minutes | 41 | 10.9% |
| 35 to 39 Minutes | 5 | 1.3% |
| 40 to 44 Minutes | 8 | 2.1% |
| 45 to 59 Minutes | 23 | 6.1% |
| 60 to 89 Minutes | 7 | 1.9% |
| 90 or more Minutes | 11 | 2.9% |
Commute Time by Sex in Swayzee
The most common commute times in Swayzee are 20 to 24 minutes (51 commuters, 24.6%) for males and 20 to 24 minutes (50 commuters, 29.6%) for females.
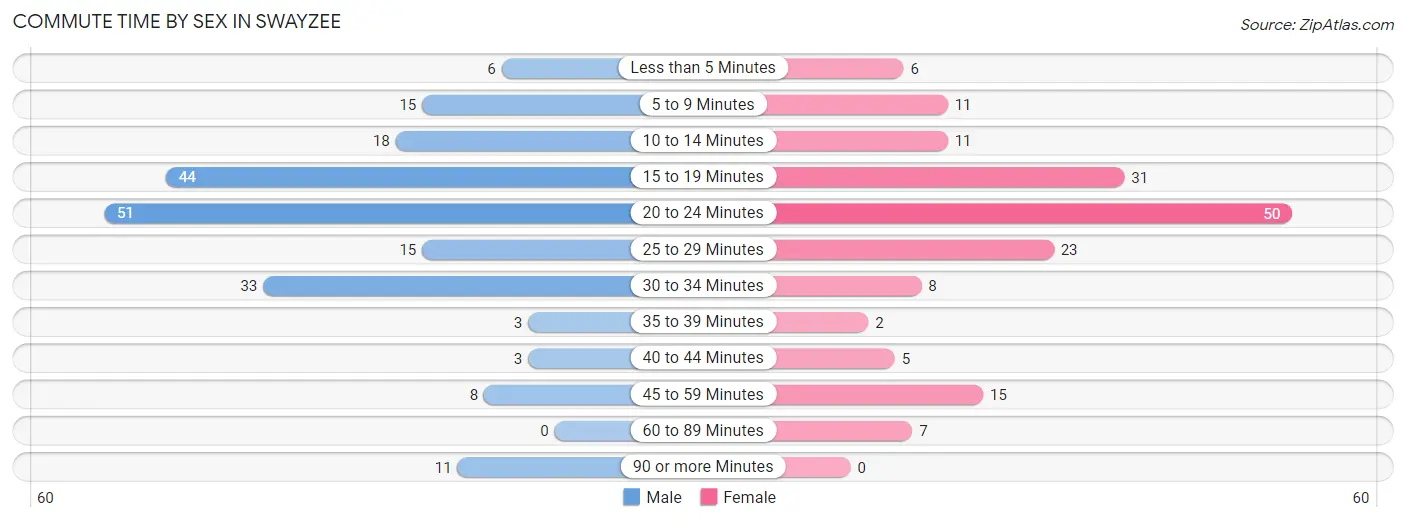
| Commute Time | Male | Female |
| Less than 5 Minutes | 6 (2.9%) | 6 (3.5%) |
| 5 to 9 Minutes | 15 (7.2%) | 11 (6.5%) |
| 10 to 14 Minutes | 18 (8.7%) | 11 (6.5%) |
| 15 to 19 Minutes | 44 (21.3%) | 31 (18.3%) |
| 20 to 24 Minutes | 51 (24.6%) | 50 (29.6%) |
| 25 to 29 Minutes | 15 (7.2%) | 23 (13.6%) |
| 30 to 34 Minutes | 33 (15.9%) | 8 (4.7%) |
| 35 to 39 Minutes | 3 (1.5%) | 2 (1.2%) |
| 40 to 44 Minutes | 3 (1.5%) | 5 (3.0%) |
| 45 to 59 Minutes | 8 (3.9%) | 15 (8.9%) |
| 60 to 89 Minutes | 0 (0.0%) | 7 (4.1%) |
| 90 or more Minutes | 11 (5.3%) | 0 (0.0%) |
Time of Departure to Work by Sex in Swayzee
The most frequent times of departure to work in Swayzee are 4:00 PM to 11:59 PM (42, 20.3%) for males and 7:30 AM to 7:59 AM (45, 26.6%) for females.
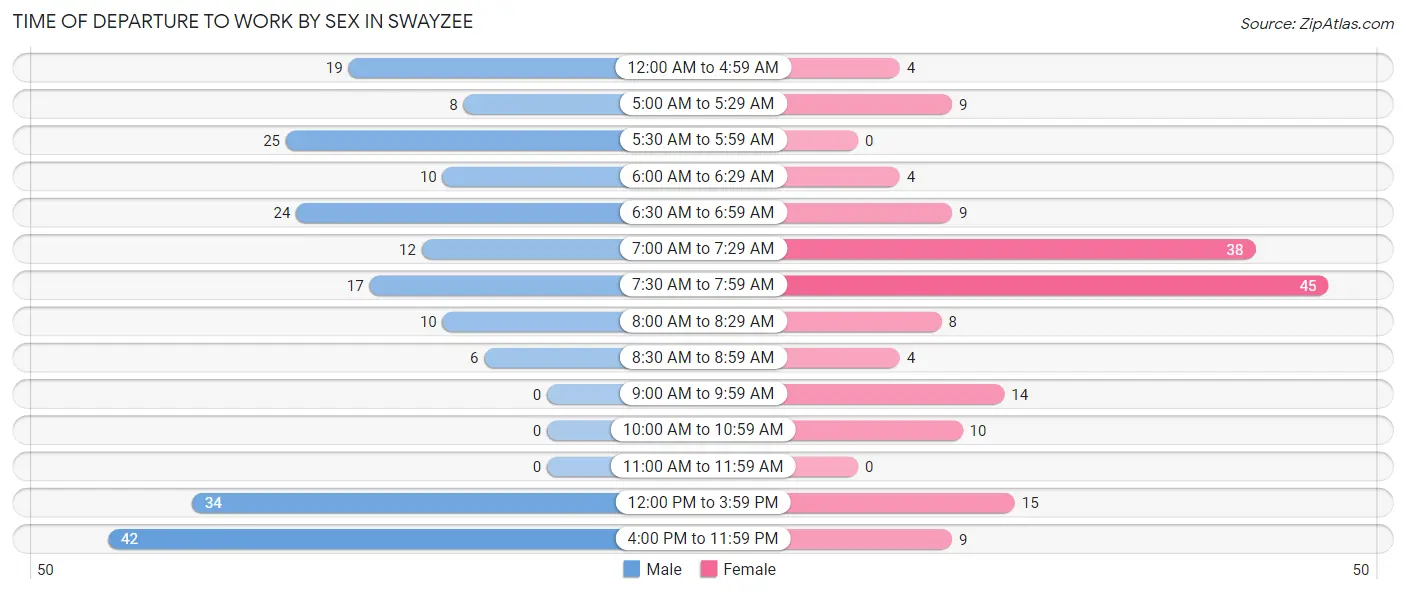
| Time of Departure | Male | Female |
| 12:00 AM to 4:59 AM | 19 (9.2%) | 4 (2.4%) |
| 5:00 AM to 5:29 AM | 8 (3.9%) | 9 (5.3%) |
| 5:30 AM to 5:59 AM | 25 (12.1%) | 0 (0.0%) |
| 6:00 AM to 6:29 AM | 10 (4.8%) | 4 (2.4%) |
| 6:30 AM to 6:59 AM | 24 (11.6%) | 9 (5.3%) |
| 7:00 AM to 7:29 AM | 12 (5.8%) | 38 (22.5%) |
| 7:30 AM to 7:59 AM | 17 (8.2%) | 45 (26.6%) |
| 8:00 AM to 8:29 AM | 10 (4.8%) | 8 (4.7%) |
| 8:30 AM to 8:59 AM | 6 (2.9%) | 4 (2.4%) |
| 9:00 AM to 9:59 AM | 0 (0.0%) | 14 (8.3%) |
| 10:00 AM to 10:59 AM | 0 (0.0%) | 10 (5.9%) |
| 11:00 AM to 11:59 AM | 0 (0.0%) | 0 (0.0%) |
| 12:00 PM to 3:59 PM | 34 (16.4%) | 15 (8.9%) |
| 4:00 PM to 11:59 PM | 42 (20.3%) | 9 (5.3%) |
| Total | 207 (100.0%) | 169 (100.0%) |
Housing Occupancy in Swayzee
Occupancy by Ownership in Swayzee
Of the total 406 dwellings in Swayzee, owner-occupied units account for 343 (84.5%), while renter-occupied units make up 63 (15.5%).
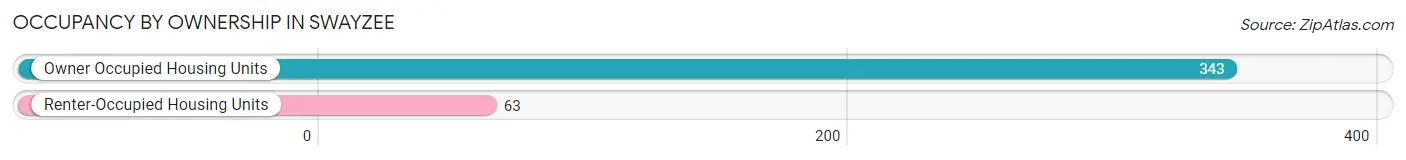
| Occupancy | # Housing Units | % Housing Units |
| Owner Occupied Housing Units | 343 | 84.5% |
| Renter-Occupied Housing Units | 63 | 15.5% |
| Total Occupied Housing Units | 406 | 100.0% |
Occupancy by Household Size in Swayzee
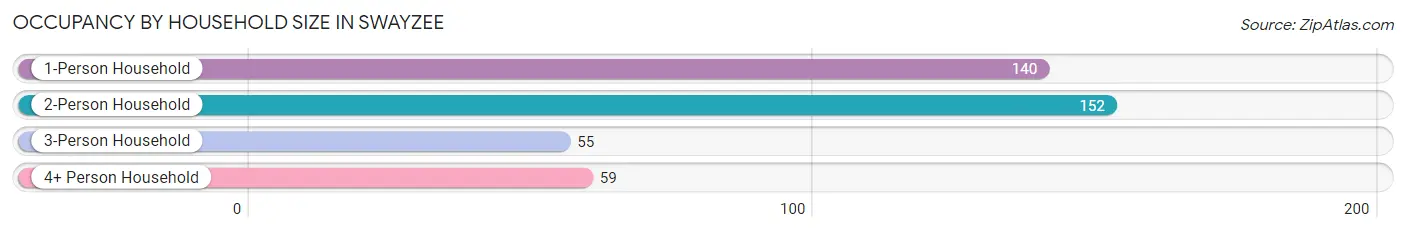
| Household Size | # Housing Units | % Housing Units |
| 1-Person Household | 140 | 34.5% |
| 2-Person Household | 152 | 37.4% |
| 3-Person Household | 55 | 13.6% |
| 4+ Person Household | 59 | 14.5% |
| Total Housing Units | 406 | 100.0% |
Occupancy by Ownership by Household Size in Swayzee
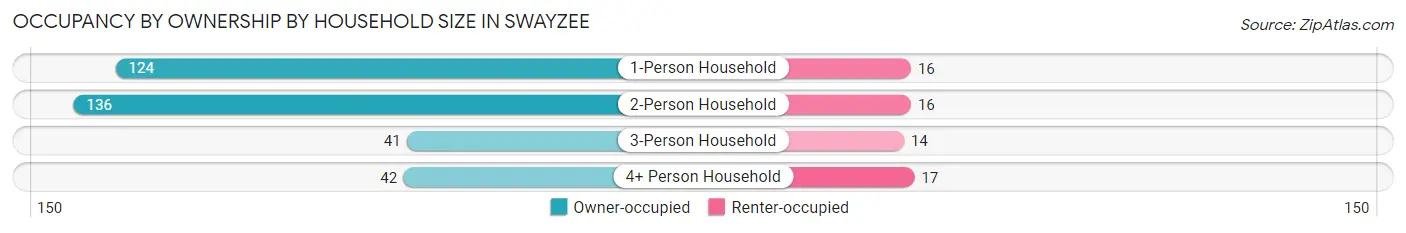
| Household Size | Owner-occupied | Renter-occupied |
| 1-Person Household | 124 (88.6%) | 16 (11.4%) |
| 2-Person Household | 136 (89.5%) | 16 (10.5%) |
| 3-Person Household | 41 (74.6%) | 14 (25.5%) |
| 4+ Person Household | 42 (71.2%) | 17 (28.8%) |
| Total Housing Units | 343 (84.5%) | 63 (15.5%) |
Occupancy by Educational Attainment in Swayzee
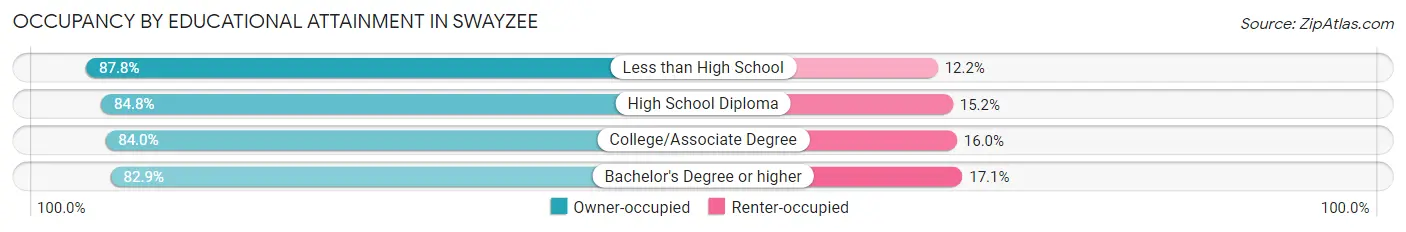
| Household Size | Owner-occupied | Renter-occupied |
| Less than High School | 36 (87.8%) | 5 (12.2%) |
| High School Diploma | 134 (84.8%) | 24 (15.2%) |
| College/Associate Degree | 105 (84.0%) | 20 (16.0%) |
| Bachelor's Degree or higher | 68 (82.9%) | 14 (17.1%) |
Occupancy by Age of Householder in Swayzee
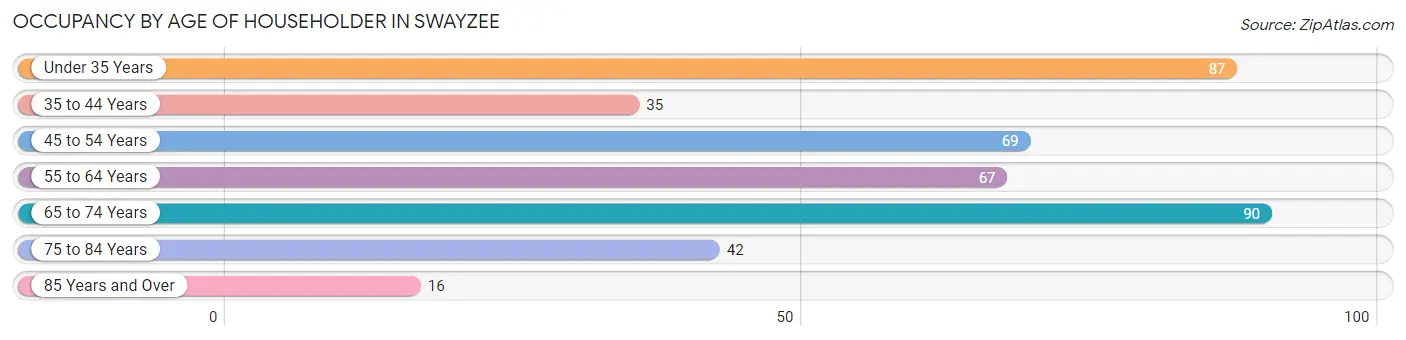
| Age Bracket | # Households | % Households |
| Under 35 Years | 87 | 21.4% |
| 35 to 44 Years | 35 | 8.6% |
| 45 to 54 Years | 69 | 17.0% |
| 55 to 64 Years | 67 | 16.5% |
| 65 to 74 Years | 90 | 22.2% |
| 75 to 84 Years | 42 | 10.3% |
| 85 Years and Over | 16 | 3.9% |
| Total | 406 | 100.0% |
Housing Finances in Swayzee
Median Income by Occupancy in Swayzee
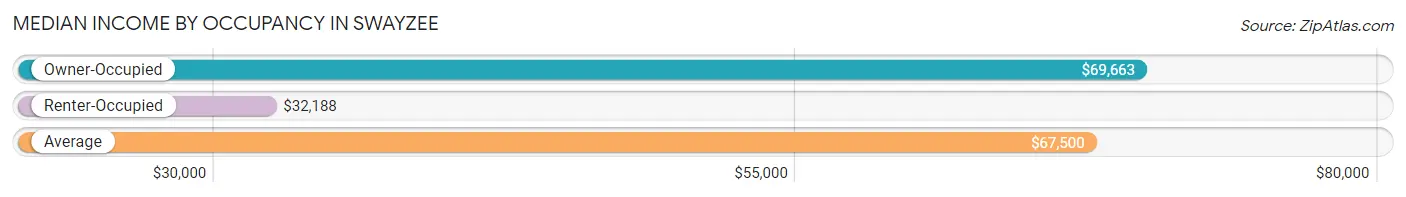
| Occupancy Type | # Households | Median Income |
| Owner-Occupied | 343 (84.5%) | $69,663 |
| Renter-Occupied | 63 (15.5%) | $32,188 |
| Average | 406 (100.0%) | $67,500 |
Occupancy by Householder Income Bracket in Swayzee
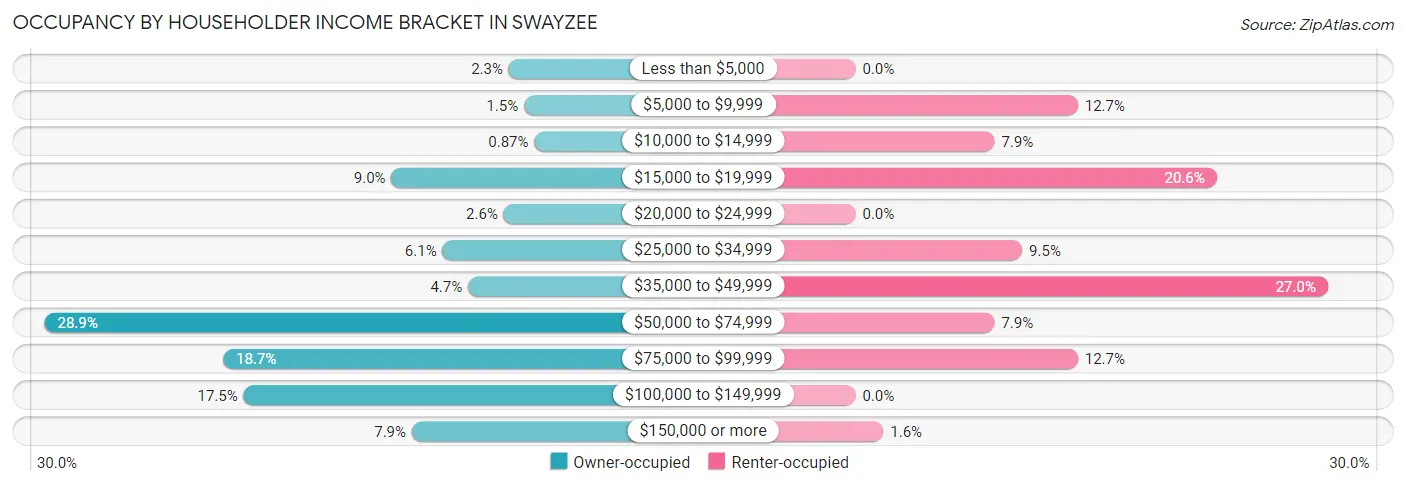
| Income Bracket | Owner-occupied | Renter-occupied |
| Less than $5,000 | 8 (2.3%) | 0 (0.0%) |
| $5,000 to $9,999 | 5 (1.5%) | 8 (12.7%) |
| $10,000 to $14,999 | 3 (0.9%) | 5 (7.9%) |
| $15,000 to $19,999 | 31 (9.0%) | 13 (20.6%) |
| $20,000 to $24,999 | 9 (2.6%) | 0 (0.0%) |
| $25,000 to $34,999 | 21 (6.1%) | 6 (9.5%) |
| $35,000 to $49,999 | 16 (4.7%) | 17 (27.0%) |
| $50,000 to $74,999 | 99 (28.9%) | 5 (7.9%) |
| $75,000 to $99,999 | 64 (18.7%) | 8 (12.7%) |
| $100,000 to $149,999 | 60 (17.5%) | 0 (0.0%) |
| $150,000 or more | 27 (7.9%) | 1 (1.6%) |
| Total | 343 (100.0%) | 63 (100.0%) |
Monthly Housing Cost Tiers in Swayzee
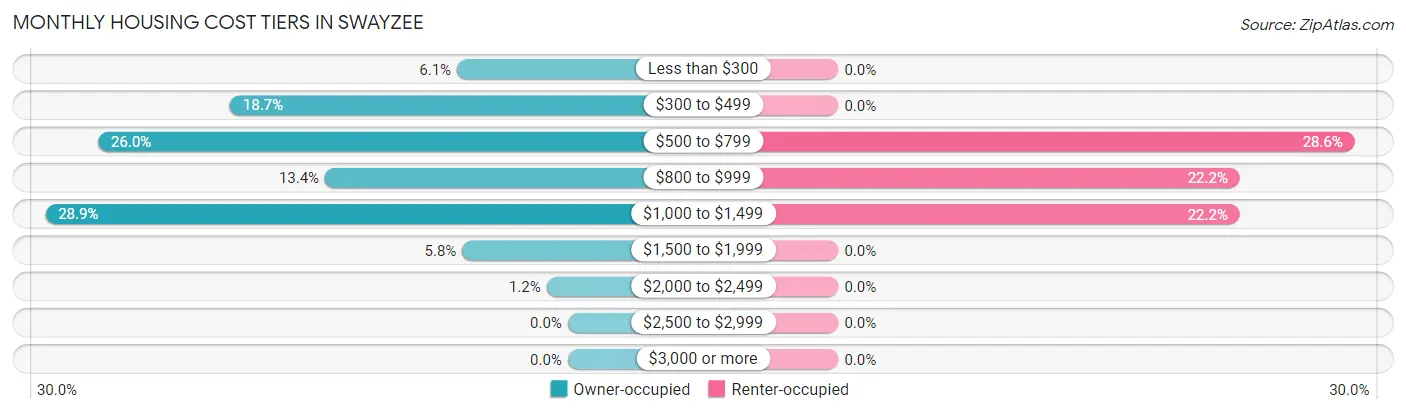
| Monthly Cost | Owner-occupied | Renter-occupied |
| Less than $300 | 21 (6.1%) | 0 (0.0%) |
| $300 to $499 | 64 (18.7%) | 0 (0.0%) |
| $500 to $799 | 89 (26.0%) | 18 (28.6%) |
| $800 to $999 | 46 (13.4%) | 14 (22.2%) |
| $1,000 to $1,499 | 99 (28.9%) | 14 (22.2%) |
| $1,500 to $1,999 | 20 (5.8%) | 0 (0.0%) |
| $2,000 to $2,499 | 4 (1.2%) | 0 (0.0%) |
| $2,500 to $2,999 | 0 (0.0%) | 0 (0.0%) |
| $3,000 or more | 0 (0.0%) | 0 (0.0%) |
| Total | 343 (100.0%) | 63 (100.0%) |
Physical Housing Characteristics in Swayzee
Housing Structures in Swayzee
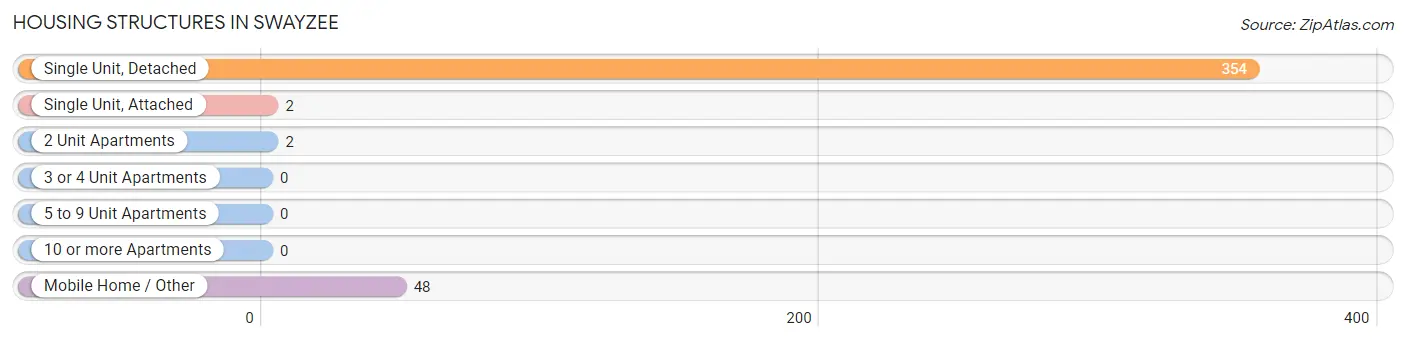
| Structure Type | # Housing Units | % Housing Units |
| Single Unit, Detached | 354 | 87.2% |
| Single Unit, Attached | 2 | 0.5% |
| 2 Unit Apartments | 2 | 0.5% |
| 3 or 4 Unit Apartments | 0 | 0.0% |
| 5 to 9 Unit Apartments | 0 | 0.0% |
| 10 or more Apartments | 0 | 0.0% |
| Mobile Home / Other | 48 | 11.8% |
| Total | 406 | 100.0% |
Housing Structures by Occupancy in Swayzee
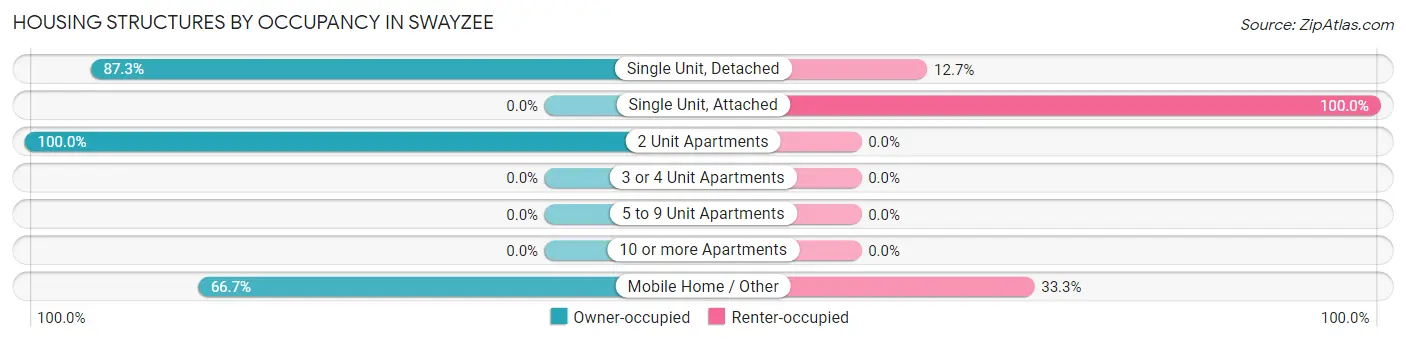
| Structure Type | Owner-occupied | Renter-occupied |
| Single Unit, Detached | 309 (87.3%) | 45 (12.7%) |
| Single Unit, Attached | 0 (0.0%) | 2 (100.0%) |
| 2 Unit Apartments | 2 (100.0%) | 0 (0.0%) |
| 3 or 4 Unit Apartments | 0 (0.0%) | 0 (0.0%) |
| 5 to 9 Unit Apartments | 0 (0.0%) | 0 (0.0%) |
| 10 or more Apartments | 0 (0.0%) | 0 (0.0%) |
| Mobile Home / Other | 32 (66.7%) | 16 (33.3%) |
| Total | 343 (84.5%) | 63 (15.5%) |
Housing Structures by Number of Rooms in Swayzee
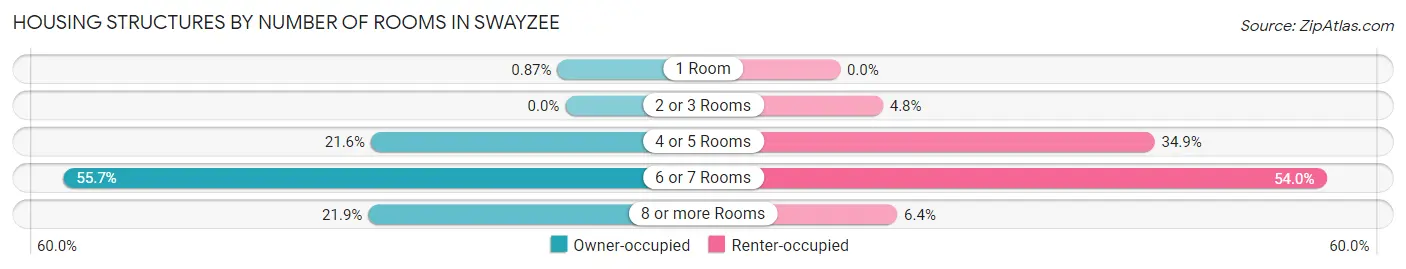
| Number of Rooms | Owner-occupied | Renter-occupied |
| 1 Room | 3 (0.9%) | 0 (0.0%) |
| 2 or 3 Rooms | 0 (0.0%) | 3 (4.8%) |
| 4 or 5 Rooms | 74 (21.6%) | 22 (34.9%) |
| 6 or 7 Rooms | 191 (55.7%) | 34 (54.0%) |
| 8 or more Rooms | 75 (21.9%) | 4 (6.4%) |
| Total | 343 (100.0%) | 63 (100.0%) |
Housing Structure by Heating Type in Swayzee
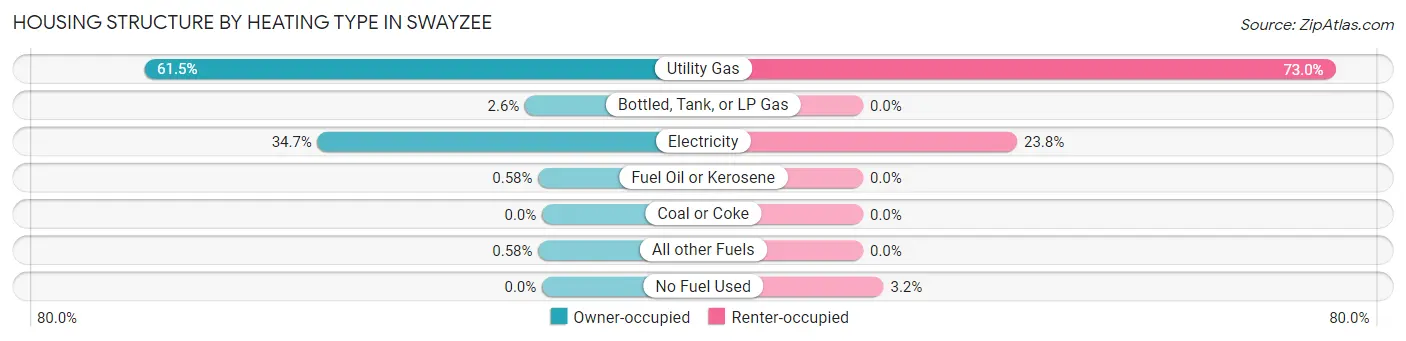
| Heating Type | Owner-occupied | Renter-occupied |
| Utility Gas | 211 (61.5%) | 46 (73.0%) |
| Bottled, Tank, or LP Gas | 9 (2.6%) | 0 (0.0%) |
| Electricity | 119 (34.7%) | 15 (23.8%) |
| Fuel Oil or Kerosene | 2 (0.6%) | 0 (0.0%) |
| Coal or Coke | 0 (0.0%) | 0 (0.0%) |
| All other Fuels | 2 (0.6%) | 0 (0.0%) |
| No Fuel Used | 0 (0.0%) | 2 (3.2%) |
| Total | 343 (100.0%) | 63 (100.0%) |
Household Vehicle Usage in Swayzee
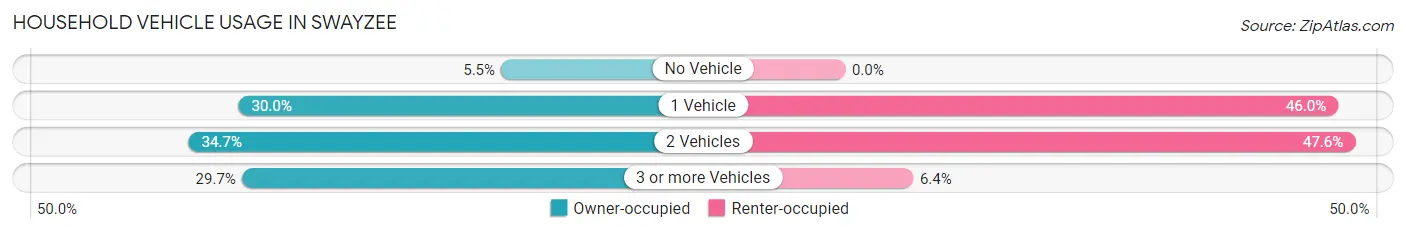
| Vehicles per Household | Owner-occupied | Renter-occupied |
| No Vehicle | 19 (5.5%) | 0 (0.0%) |
| 1 Vehicle | 103 (30.0%) | 29 (46.0%) |
| 2 Vehicles | 119 (34.7%) | 30 (47.6%) |
| 3 or more Vehicles | 102 (29.7%) | 4 (6.4%) |
| Total | 343 (100.0%) | 63 (100.0%) |
Real Estate & Mortgages in Swayzee
Real Estate and Mortgage Overview in Swayzee
| Characteristic | Without Mortgage | With Mortgage |
| Housing Units | 153 | 190 |
| Median Property Value | $97,500 | $111,300 |
| Median Household Income | $67,644 | $8 |
| Monthly Housing Costs | $486 | $0 |
| Real Estate Taxes | $861 | $27 |
Property Value by Mortgage Status in Swayzee
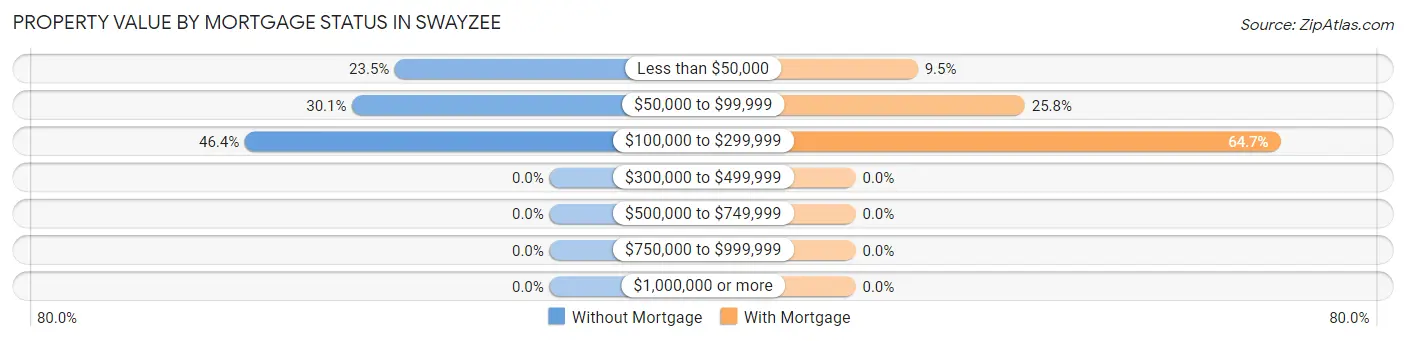
| Property Value | Without Mortgage | With Mortgage |
| Less than $50,000 | 36 (23.5%) | 18 (9.5%) |
| $50,000 to $99,999 | 46 (30.1%) | 49 (25.8%) |
| $100,000 to $299,999 | 71 (46.4%) | 123 (64.7%) |
| $300,000 to $499,999 | 0 (0.0%) | 0 (0.0%) |
| $500,000 to $749,999 | 0 (0.0%) | 0 (0.0%) |
| $750,000 to $999,999 | 0 (0.0%) | 0 (0.0%) |
| $1,000,000 or more | 0 (0.0%) | 0 (0.0%) |
| Total | 153 (100.0%) | 190 (100.0%) |
Household Income by Mortgage Status in Swayzee
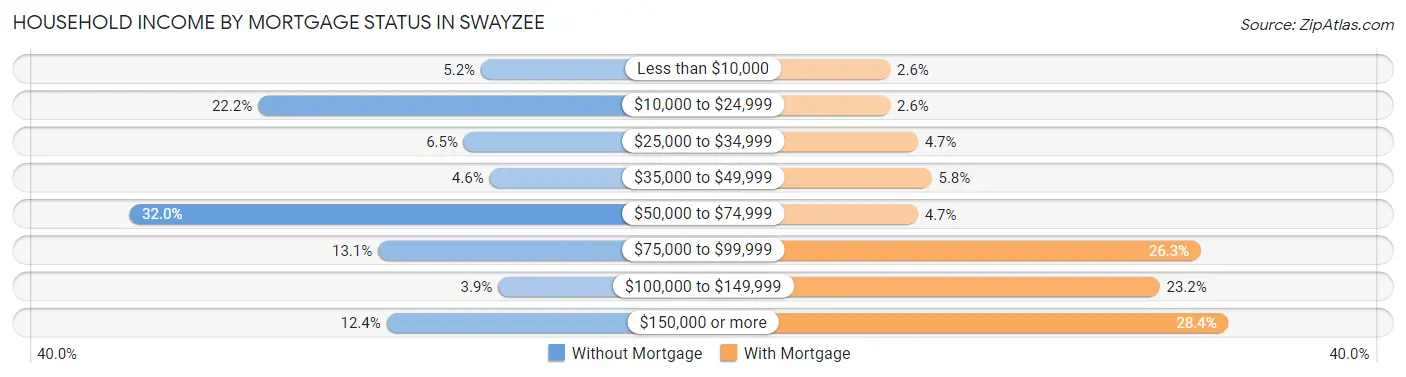
| Household Income | Without Mortgage | With Mortgage |
| Less than $10,000 | 8 (5.2%) | 5 (2.6%) |
| $10,000 to $24,999 | 34 (22.2%) | 5 (2.6%) |
| $25,000 to $34,999 | 10 (6.5%) | 9 (4.7%) |
| $35,000 to $49,999 | 7 (4.6%) | 11 (5.8%) |
| $50,000 to $74,999 | 49 (32.0%) | 9 (4.7%) |
| $75,000 to $99,999 | 20 (13.1%) | 50 (26.3%) |
| $100,000 to $149,999 | 6 (3.9%) | 44 (23.2%) |
| $150,000 or more | 19 (12.4%) | 54 (28.4%) |
| Total | 153 (100.0%) | 190 (100.0%) |
Property Value to Household Income Ratio in Swayzee
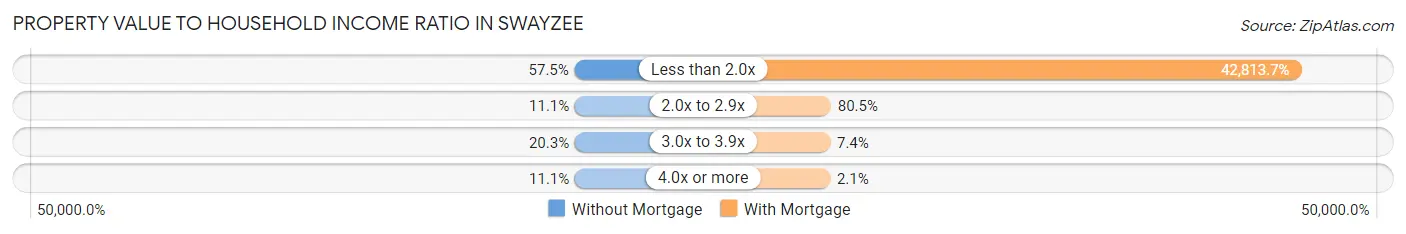
| Value-to-Income Ratio | Without Mortgage | With Mortgage |
| Less than 2.0x | 88 (57.5%) | 81,346 (42,813.7%) |
| 2.0x to 2.9x | 17 (11.1%) | 153 (80.5%) |
| 3.0x to 3.9x | 31 (20.3%) | 14 (7.4%) |
| 4.0x or more | 17 (11.1%) | 4 (2.1%) |
| Total | 153 (100.0%) | 190 (100.0%) |
Real Estate Taxes by Mortgage Status in Swayzee
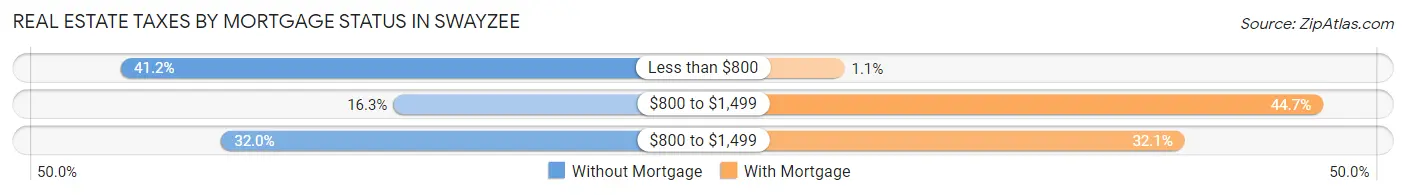
| Property Taxes | Without Mortgage | With Mortgage |
| Less than $800 | 63 (41.2%) | 2 (1.1%) |
| $800 to $1,499 | 25 (16.3%) | 85 (44.7%) |
| $800 to $1,499 | 49 (32.0%) | 61 (32.1%) |
| Total | 153 (100.0%) | 190 (100.0%) |
Health & Disability in Swayzee
Health Insurance Coverage by Age in Swayzee
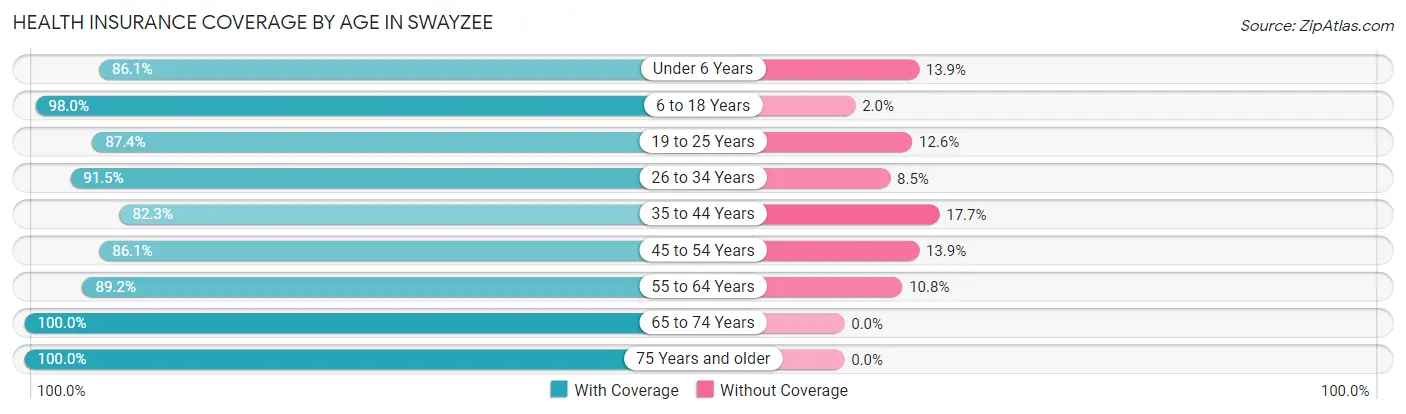
| Age Bracket | With Coverage | Without Coverage |
| Under 6 Years | 62 (86.1%) | 10 (13.9%) |
| 6 to 18 Years | 144 (98.0%) | 3 (2.0%) |
| 19 to 25 Years | 76 (87.4%) | 11 (12.6%) |
| 26 to 34 Years | 75 (91.5%) | 7 (8.5%) |
| 35 to 44 Years | 79 (82.3%) | 17 (17.7%) |
| 45 to 54 Years | 105 (86.1%) | 17 (13.9%) |
| 55 to 64 Years | 99 (89.2%) | 12 (10.8%) |
| 65 to 74 Years | 129 (100.0%) | 0 (0.0%) |
| 75 Years and older | 75 (100.0%) | 0 (0.0%) |
| Total | 844 (91.6%) | 77 (8.4%) |
Health Insurance Coverage by Citizenship Status in Swayzee
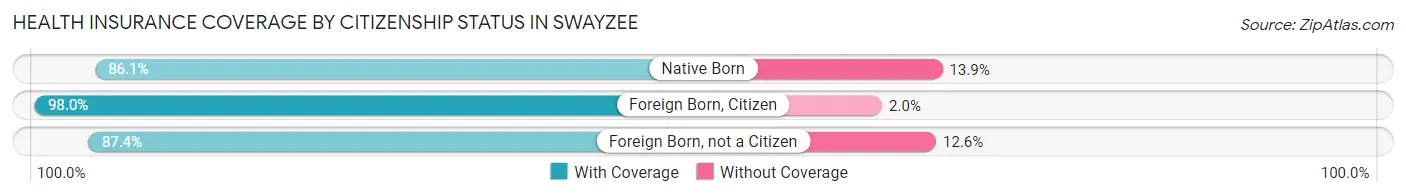
| Citizenship Status | With Coverage | Without Coverage |
| Native Born | 62 (86.1%) | 10 (13.9%) |
| Foreign Born, Citizen | 144 (98.0%) | 3 (2.0%) |
| Foreign Born, not a Citizen | 76 (87.4%) | 11 (12.6%) |
Health Insurance Coverage by Household Income in Swayzee
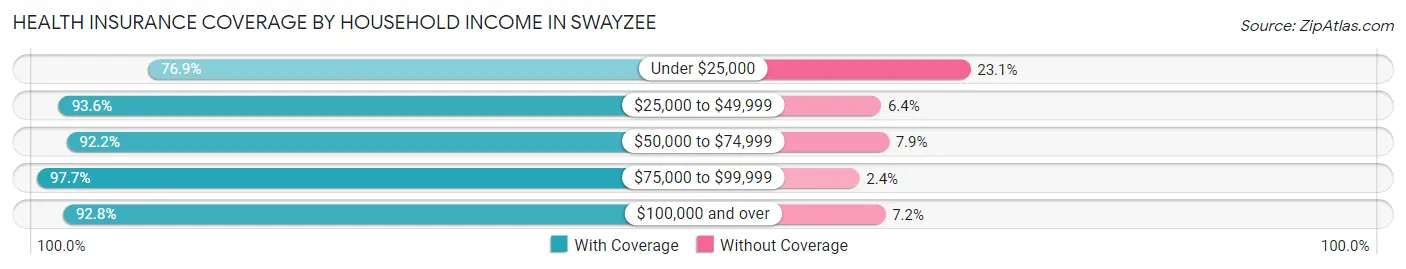
| Household Income | With Coverage | Without Coverage |
| Under $25,000 | 93 (76.9%) | 28 (23.1%) |
| $25,000 to $49,999 | 190 (93.6%) | 13 (6.4%) |
| $50,000 to $74,999 | 176 (92.1%) | 15 (7.9%) |
| $75,000 to $99,999 | 166 (97.7%) | 4 (2.4%) |
| $100,000 and over | 219 (92.8%) | 17 (7.2%) |
Public vs Private Health Insurance Coverage by Age in Swayzee
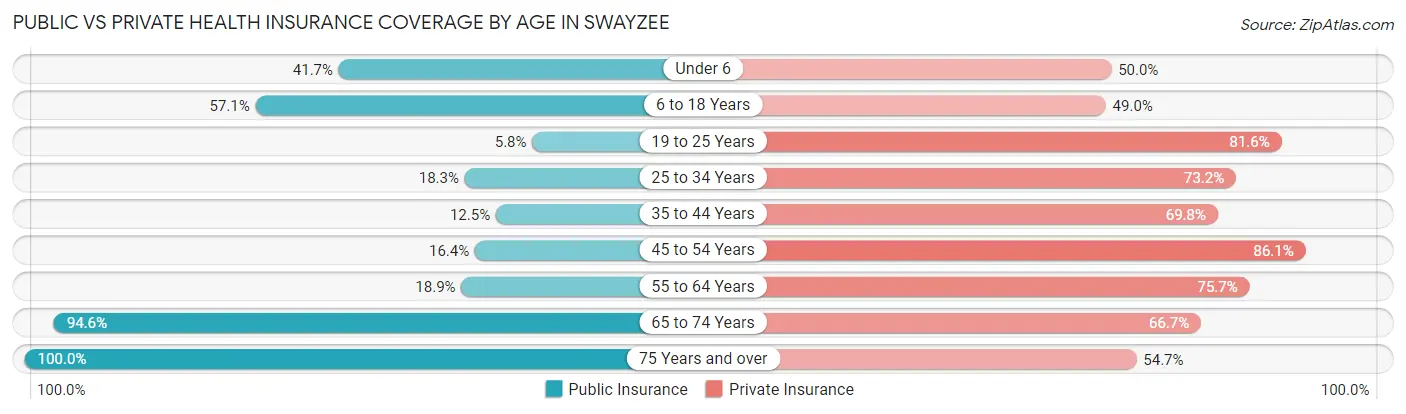
| Age Bracket | Public Insurance | Private Insurance |
| Under 6 | 30 (41.7%) | 36 (50.0%) |
| 6 to 18 Years | 84 (57.1%) | 72 (49.0%) |
| 19 to 25 Years | 5 (5.8%) | 71 (81.6%) |
| 25 to 34 Years | 15 (18.3%) | 60 (73.2%) |
| 35 to 44 Years | 12 (12.5%) | 67 (69.8%) |
| 45 to 54 Years | 20 (16.4%) | 105 (86.1%) |
| 55 to 64 Years | 21 (18.9%) | 84 (75.7%) |
| 65 to 74 Years | 122 (94.6%) | 86 (66.7%) |
| 75 Years and over | 75 (100.0%) | 41 (54.7%) |
| Total | 384 (41.7%) | 622 (67.5%) |
Disability Status by Sex by Age in Swayzee
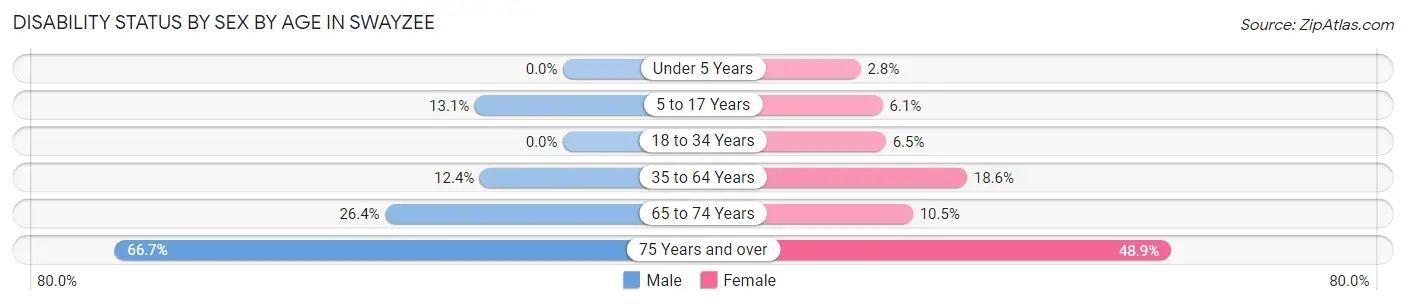
| Age Bracket | Male | Female |
| Under 5 Years | 0 (0.0%) | 1 (2.8%) |
| 5 to 17 Years | 11 (13.1%) | 4 (6.1%) |
| 18 to 34 Years | 0 (0.0%) | 6 (6.5%) |
| 35 to 64 Years | 20 (12.3%) | 31 (18.6%) |
| 65 to 74 Years | 14 (26.4%) | 8 (10.5%) |
| 75 Years and over | 20 (66.7%) | 22 (48.9%) |
Disability Class by Sex by Age in Swayzee
Disability Class: Hearing Difficulty
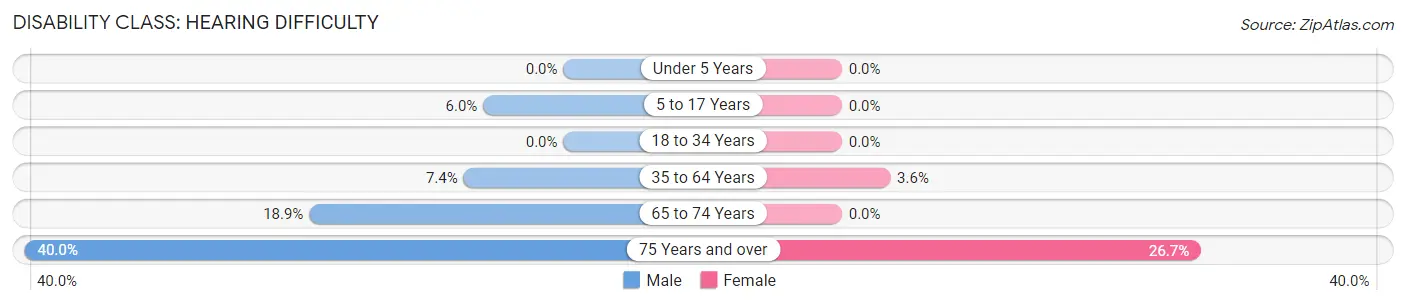
| Age Bracket | Male | Female |
| Under 5 Years | 0 (0.0%) | 0 (0.0%) |
| 5 to 17 Years | 5 (5.9%) | 0 (0.0%) |
| 18 to 34 Years | 0 (0.0%) | 0 (0.0%) |
| 35 to 64 Years | 12 (7.4%) | 6 (3.6%) |
| 65 to 74 Years | 10 (18.9%) | 0 (0.0%) |
| 75 Years and over | 12 (40.0%) | 12 (26.7%) |
Disability Class: Vision Difficulty
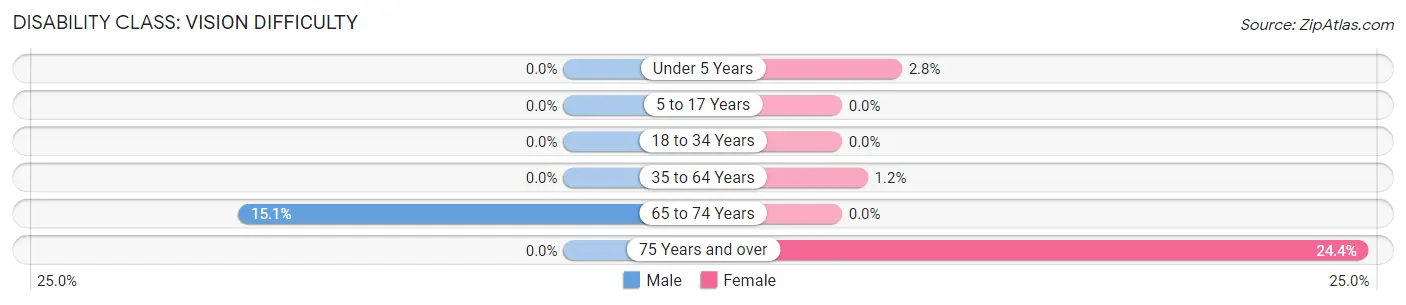
| Age Bracket | Male | Female |
| Under 5 Years | 0 (0.0%) | 1 (2.8%) |
| 5 to 17 Years | 0 (0.0%) | 0 (0.0%) |
| 18 to 34 Years | 0 (0.0%) | 0 (0.0%) |
| 35 to 64 Years | 0 (0.0%) | 2 (1.2%) |
| 65 to 74 Years | 8 (15.1%) | 0 (0.0%) |
| 75 Years and over | 0 (0.0%) | 11 (24.4%) |
Disability Class: Cognitive Difficulty
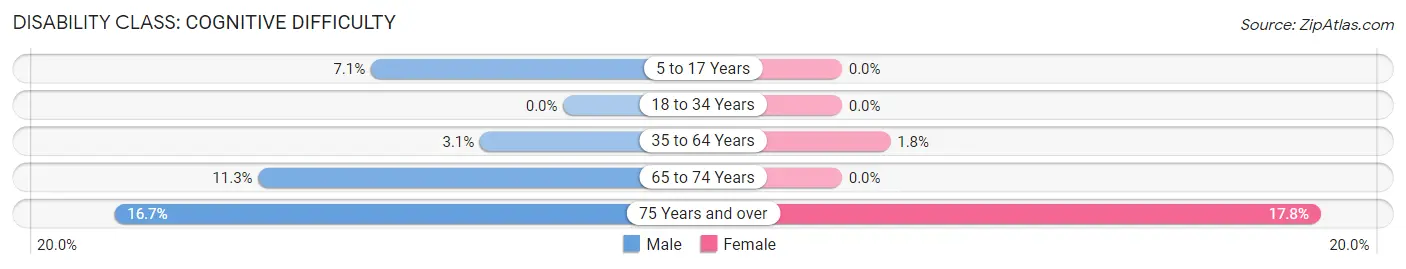
| Age Bracket | Male | Female |
| 5 to 17 Years | 6 (7.1%) | 0 (0.0%) |
| 18 to 34 Years | 0 (0.0%) | 0 (0.0%) |
| 35 to 64 Years | 5 (3.1%) | 3 (1.8%) |
| 65 to 74 Years | 6 (11.3%) | 0 (0.0%) |
| 75 Years and over | 5 (16.7%) | 8 (17.8%) |
Disability Class: Ambulatory Difficulty
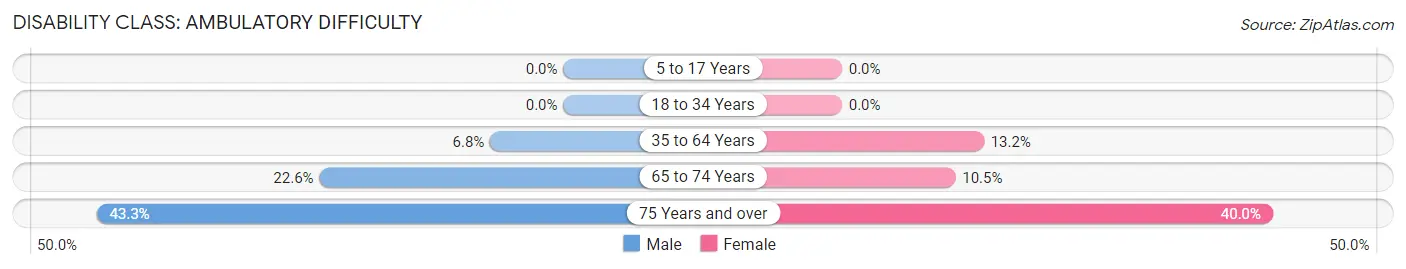
| Age Bracket | Male | Female |
| 5 to 17 Years | 0 (0.0%) | 0 (0.0%) |
| 18 to 34 Years | 0 (0.0%) | 0 (0.0%) |
| 35 to 64 Years | 11 (6.8%) | 22 (13.2%) |
| 65 to 74 Years | 12 (22.6%) | 8 (10.5%) |
| 75 Years and over | 13 (43.3%) | 18 (40.0%) |
Disability Class: Self-Care Difficulty
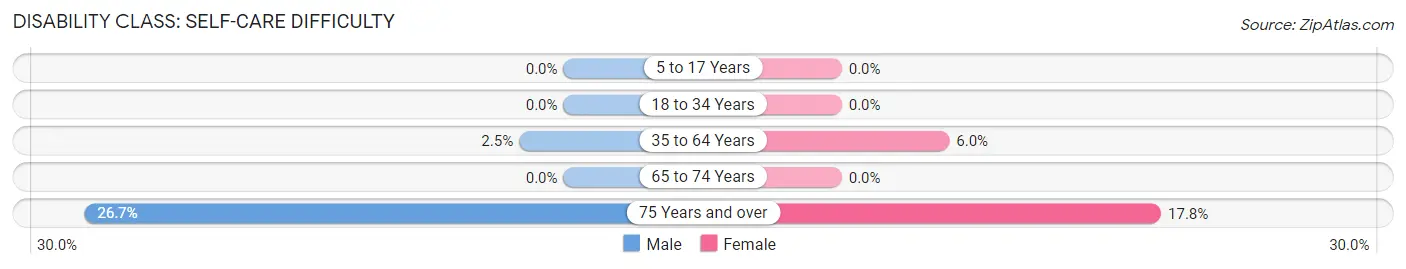
| Age Bracket | Male | Female |
| 5 to 17 Years | 0 (0.0%) | 0 (0.0%) |
| 18 to 34 Years | 0 (0.0%) | 0 (0.0%) |
| 35 to 64 Years | 4 (2.5%) | 10 (6.0%) |
| 65 to 74 Years | 0 (0.0%) | 0 (0.0%) |
| 75 Years and over | 8 (26.7%) | 8 (17.8%) |
Technology Access in Swayzee
Computing Device Access in Swayzee
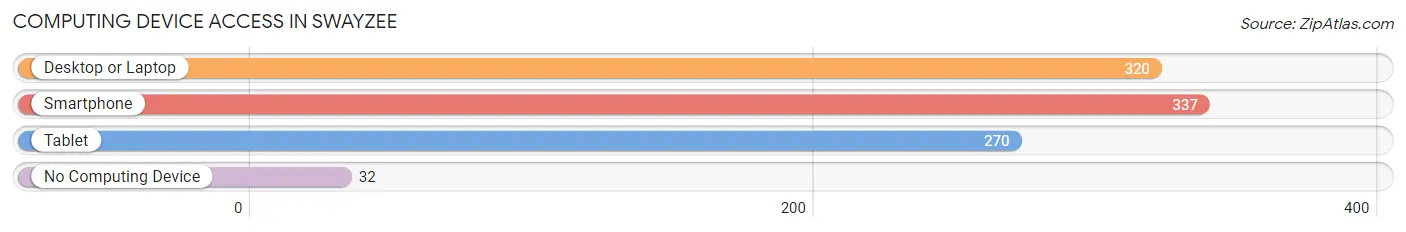
| Device Type | # Households | % Households |
| Desktop or Laptop | 320 | 78.8% |
| Smartphone | 337 | 83.0% |
| Tablet | 270 | 66.5% |
| No Computing Device | 32 | 7.9% |
| Total | 406 | 100.0% |
Internet Access in Swayzee
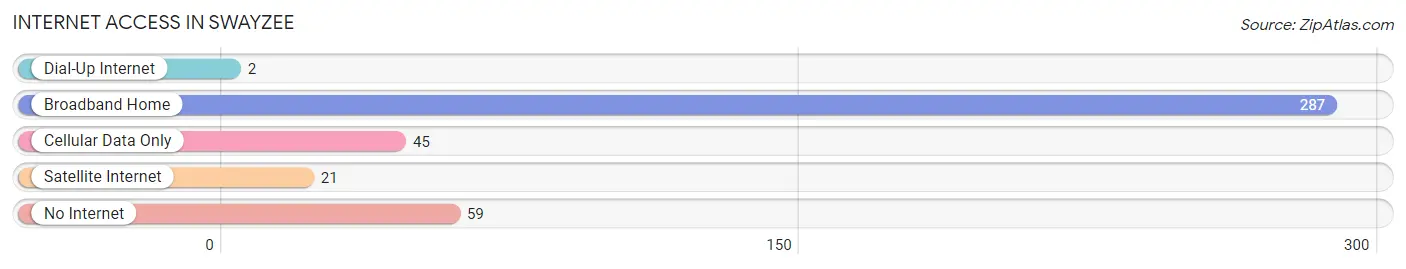
| Internet Type | # Households | % Households |
| Dial-Up Internet | 2 | 0.5% |
| Broadband Home | 287 | 70.7% |
| Cellular Data Only | 45 | 11.1% |
| Satellite Internet | 21 | 5.2% |
| No Internet | 59 | 14.5% |
| Total | 406 | 100.0% |
Swayzee Summary
History
Swayzee, Indiana is a small town located in Grant County, Indiana. It was founded in 1837 by William Swayzee, a Quaker from North Carolina. The town was originally called Swayzee’s Station, and was a stop on the Wabash and Erie Canal. The canal was an important transportation route for goods and people in the early 19th century.
The town was officially incorporated in 1867, and the name was changed to Swayzee. The town grew slowly, but steadily, and by the early 20th century, it had become a thriving agricultural community. The town was home to several businesses, including a flour mill, a sawmill, a blacksmith shop, and a general store.
In the late 19th century, the town was home to a large number of German immigrants, who brought with them their culture and traditions. This influence can still be seen in the town today, with many of the buildings and homes having a distinctly Germanic style.
The town was also home to a large number of African-American residents, who were mostly employed in the agricultural sector. The town was also home to a large number of Native Americans, who were mostly employed in the lumber industry.
The town was also home to a large number of Italian immigrants, who were mostly employed in the coal mining industry. The town was also home to a large number of Irish immigrants, who were mostly employed in the railroad industry.
The town was also home to a large number of Polish immigrants, who were mostly employed in the steel industry.
Geography
Swayzee is located in Grant County, Indiana, in the east-central part of the state. It is situated on the Wabash River, and is approximately 30 miles south of Fort Wayne. The town is located in a rural area, and is surrounded by farmland and woodlands.
The town is located at an elevation of 845 feet above sea level. The climate in the area is humid continental, with hot summers and cold winters. The average annual temperature is around 50 degrees Fahrenheit.
Economy
The economy of Swayzee is largely based on agriculture and manufacturing. The town is home to several large agricultural businesses, including a large dairy farm and a large hog farm. The town is also home to several manufacturing businesses, including a steel mill and a plastics factory.
The town is also home to several small businesses, including restaurants, retail stores, and service businesses. The town is also home to a large number of trucking companies, which provide transportation services to the surrounding area.
Demographics
As of the 2010 census, the population of Swayzee was 1,845. The racial makeup of the town was 97.3% White, 0.7% African American, 0.3% Native American, 0.2% Asian, 0.1% Pacific Islander, 0.3% from other races, and 1.1% from two or more races. Hispanic or Latino of any race were 1.2% of the population.
The median income for a household in the town was $37,500, and the median income for a family was $45,000. The per capita income for the town was $18,000. About 11.3% of families and 14.2% of the population were below the poverty line, including 18.2% of those under age 18 and 8.3% of those age 65 or over.
Common Questions
What is the Total Population of Swayzee?
Total Population of Swayzee is 921.
What is the Total Male Population of Swayzee?
Total Male Population of Swayzee is 439.
What is the Total Female Population of Swayzee?
Total Female Population of Swayzee is 482.
What is the Ratio of Males per 100 Females in Swayzee?
There are 91.08 Males per 100 Females in Swayzee.
What is the Ratio of Females per 100 Males in Swayzee?
There are 109.79 Females per 100 Males in Swayzee.
What is the Median Population Age in Swayzee?
Median Population Age in Swayzee is 42.5 Years.
What is the Average Family Size in Swayzee
Average Family Size in Swayzee is 2.9 People.
What is the Average Household Size in Swayzee
Average Household Size in Swayzee is 2.3 People.
What is Per Capita Income in Swayzee?
Per Capita income in Swayzee is $33,298.
What is the Median Family Income in Swayzee?
Median Family Income in Swayzee is $75,875.
What is the Median Household income in Swayzee?
Median Household Income in Swayzee is $67,500.
What is Income or Wage Gap in Swayzee?
Income or Wage Gap in Swayzee is 40.3%.
Women in Swayzee earn 59.7 cents for every dollar earned by a man.
What is Inequality or Gini Index in Swayzee?
Inequality or Gini Index in Swayzee is 0.41.
How Large is the Labor Force in Swayzee?
There are 421 People in the Labor Forcein in Swayzee.
What is the Percentage of People in the Labor Force in Swayzee?
58.5% of People are in the Labor Force in Swayzee.
What is the Unemployment Rate in Swayzee?
Unemployment Rate in Swayzee is 4.5%.