Centerville, GA
Centerville Map
Centerville Overview
8,220
TOTAL POPULATION
4,109
MALE POPULATION
4,111
FEMALE POPULATION
99.95
MALES / 100 FEMALES
100.05
FEMALES / 100 MALES
35.2
MEDIAN AGE
3.7
AVG FAMILY SIZE
3.0
AVG HOUSEHOLD SIZE
$26,988
PER CAPITA INCOME
$78,173
AVG FAMILY INCOME
$74,250
AVG HOUSEHOLD INCOME
22.3%
WAGE / INCOME GAP [ % ]
77.7¢/ $1
WAGE / INCOME GAP [ $ ]
$14,301
FAMILY INCOME DEFICIT
0.37
INEQUALITY / GINI INDEX
3,323
LABOR FORCE [ PEOPLE ]
54.1%
PERCENT IN LABOR FORCE
2.0%
UNEMPLOYMENT RATE
Centerville Zip Codes
Centerville Area Codes
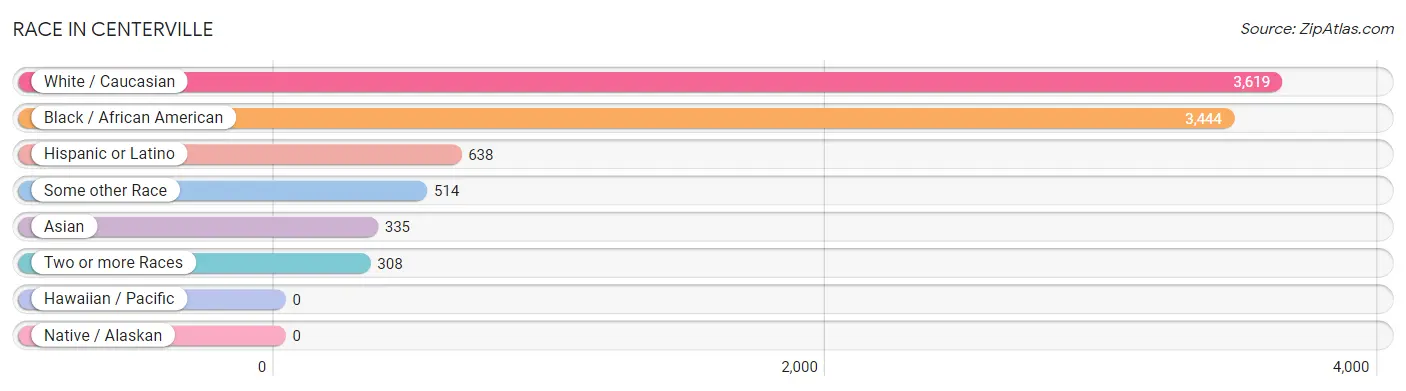
Race in Centerville
The most populous races in Centerville are White / Caucasian (3,619 | 44.0%), Black / African American (3,444 | 41.9%), and Hispanic or Latino (638 | 7.8%).
| Race | # Population | % Population |
| Asian | 335 | 4.1% |
| Black / African American | 3,444 | 41.9% |
| Hawaiian / Pacific | 0 | 0.0% |
| Hispanic or Latino | 638 | 7.8% |
| Native / Alaskan | 0 | 0.0% |
| White / Caucasian | 3,619 | 44.0% |
| Two or more Races | 308 | 3.7% |
| Some other Race | 514 | 6.2% |
| Total | 8,220 | 100.0% |
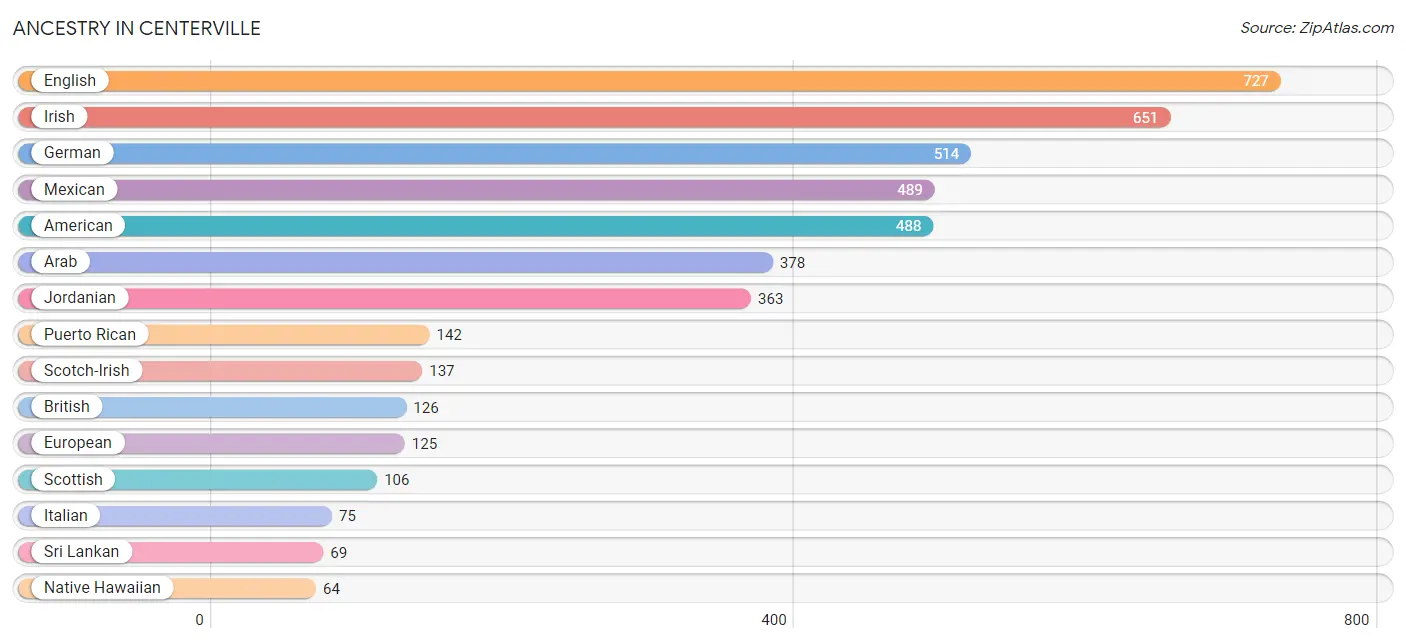
Ancestry in Centerville
The most populous ancestries reported in Centerville are English (727 | 8.8%), Irish (651 | 7.9%), German (514 | 6.2%), Mexican (489 | 5.9%), and American (488 | 5.9%), together accounting for 34.9% of all Centerville residents.
| Ancestry | # Population | % Population |
| American | 488 | 5.9% |
| Arab | 378 | 4.6% |
| Australian | 39 | 0.5% |
| British | 126 | 1.5% |
| Cherokee | 9 | 0.1% |
| Creek | 17 | 0.2% |
| Croatian | 39 | 0.5% |
| Dutch | 28 | 0.3% |
| Eastern European | 6 | 0.1% |
| English | 727 | 8.8% |
| European | 125 | 1.5% |
| French | 32 | 0.4% |
| German | 514 | 6.2% |
| Greek | 31 | 0.4% |
| Hungarian | 25 | 0.3% |
| Irish | 651 | 7.9% |
| Italian | 75 | 0.9% |
| Jordanian | 363 | 4.4% |
| Mexican | 489 | 5.9% |
| Native Hawaiian | 64 | 0.8% |
| Northern European | 57 | 0.7% |
| Norwegian | 36 | 0.4% |
| Polish | 33 | 0.4% |
| Puerto Rican | 142 | 1.7% |
| Scandinavian | 16 | 0.2% |
| Scotch-Irish | 137 | 1.7% |
| Scottish | 106 | 1.3% |
| Spaniard | 7 | 0.1% |
| Sri Lankan | 69 | 0.8% |
| Subsaharan African | 16 | 0.2% |
| Syrian | 15 | 0.2% |
| Thai | 18 | 0.2% |
| Ukrainian | 3 | 0.0% | View All 33 Rows |
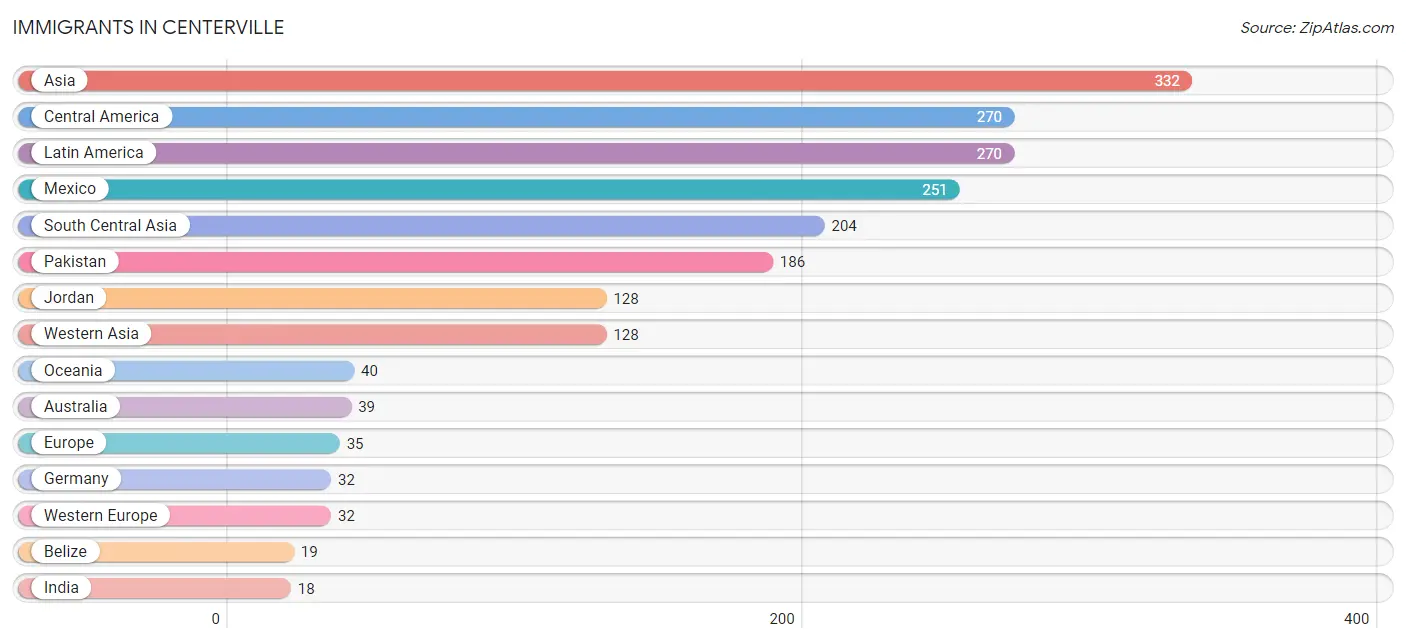
Immigrants in Centerville
The most numerous immigrant groups reported in Centerville came from Asia (332 | 4.0%), Central America (270 | 3.3%), Latin America (270 | 3.3%), Mexico (251 | 3.0%), and South Central Asia (204 | 2.5%), together accounting for 16.1% of all Centerville residents.
| Immigration Origin | # Population | % Population |
| Asia | 332 | 4.0% |
| Australia | 39 | 0.5% |
| Belize | 19 | 0.2% |
| Central America | 270 | 3.3% |
| Eastern Europe | 3 | 0.0% |
| Europe | 35 | 0.4% |
| Germany | 32 | 0.4% |
| India | 18 | 0.2% |
| Jordan | 128 | 1.6% |
| Latin America | 270 | 3.3% |
| Mexico | 251 | 3.0% |
| Oceania | 40 | 0.5% |
| Pakistan | 186 | 2.3% |
| Russia | 3 | 0.0% |
| South Central Asia | 204 | 2.5% |
| Western Asia | 128 | 1.6% |
| Western Europe | 32 | 0.4% | View All 17 Rows |
Sex and Age in Centerville
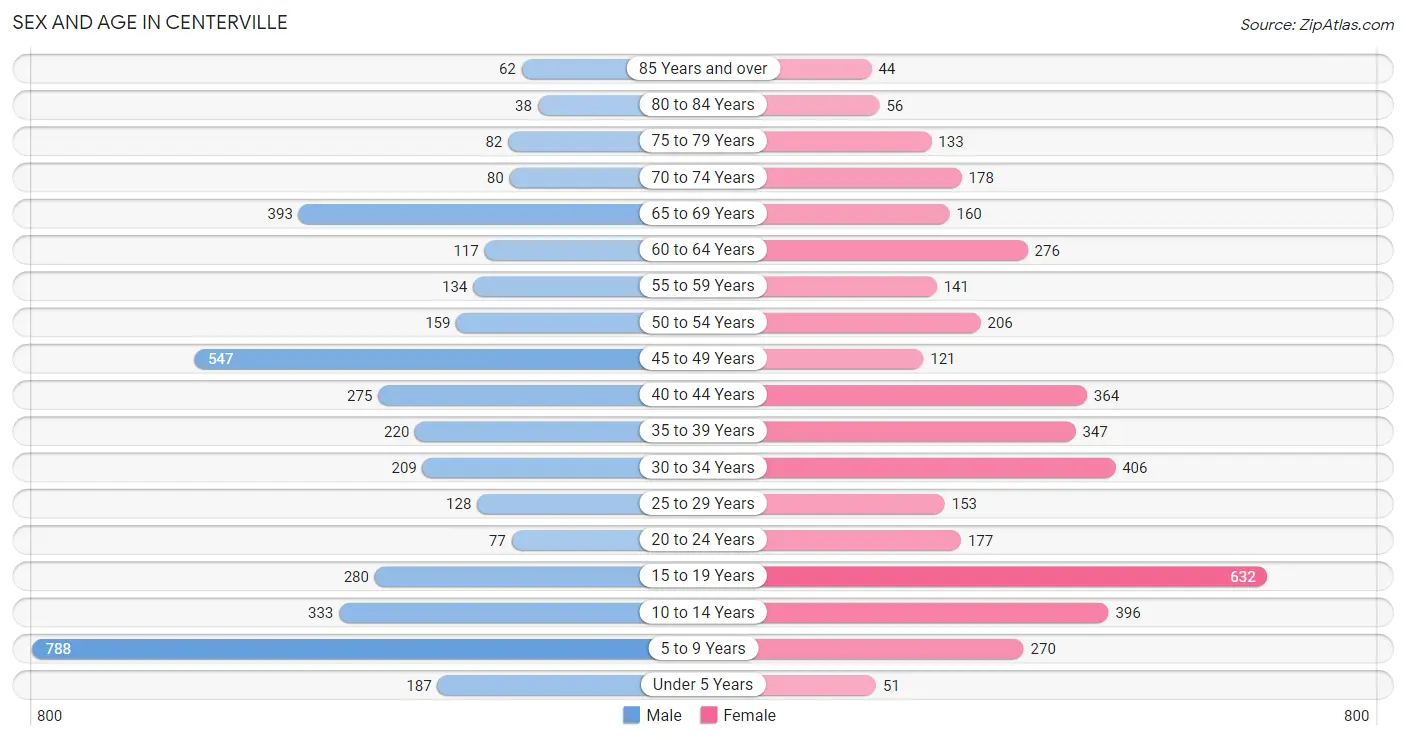
Sex and Age in Centerville
The most populous age groups in Centerville are 5 to 9 Years (788 | 19.2%) for men and 15 to 19 Years (632 | 15.4%) for women.
| Age Bracket | Male | Female |
| Under 5 Years | 187 (4.5%) | 51 (1.2%) |
| 5 to 9 Years | 788 (19.2%) | 270 (6.6%) |
| 10 to 14 Years | 333 (8.1%) | 396 (9.6%) |
| 15 to 19 Years | 280 (6.8%) | 632 (15.4%) |
| 20 to 24 Years | 77 (1.9%) | 177 (4.3%) |
| 25 to 29 Years | 128 (3.1%) | 153 (3.7%) |
| 30 to 34 Years | 209 (5.1%) | 406 (9.9%) |
| 35 to 39 Years | 220 (5.3%) | 347 (8.4%) |
| 40 to 44 Years | 275 (6.7%) | 364 (8.8%) |
| 45 to 49 Years | 547 (13.3%) | 121 (2.9%) |
| 50 to 54 Years | 159 (3.9%) | 206 (5.0%) |
| 55 to 59 Years | 134 (3.3%) | 141 (3.4%) |
| 60 to 64 Years | 117 (2.9%) | 276 (6.7%) |
| 65 to 69 Years | 393 (9.6%) | 160 (3.9%) |
| 70 to 74 Years | 80 (1.9%) | 178 (4.3%) |
| 75 to 79 Years | 82 (2.0%) | 133 (3.2%) |
| 80 to 84 Years | 38 (0.9%) | 56 (1.4%) |
| 85 Years and over | 62 (1.5%) | 44 (1.1%) |
| Total | 4,109 (100.0%) | 4,111 (100.0%) |
Families and Households in Centerville
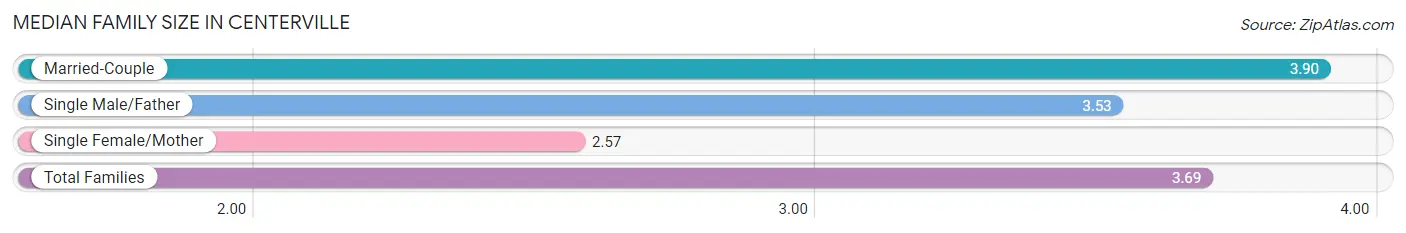
Median Family Size in Centerville
The median family size in Centerville is 3.69 persons per family, with married-couple families (1,546 | 78.2%) accounting for the largest median family size of 3.9 persons per family. On the other hand, single female/mother families (264 | 13.4%) represent the smallest median family size with 2.57 persons per family.
| Family Type | # Families | Family Size |
| Married-Couple | 1,546 (78.2%) | 3.90 |
| Single Male/Father | 168 (8.5%) | 3.53 |
| Single Female/Mother | 264 (13.4%) | 2.57 |
| Total Families | 1,978 (100.0%) | 3.69 |
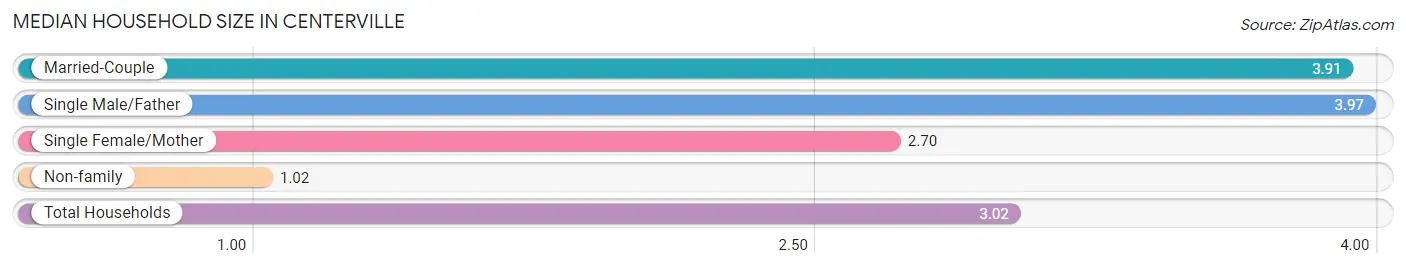
Median Household Size in Centerville
The median household size in Centerville is 3.02 persons per household, with single male/father households (168 | 6.2%) accounting for the largest median household size of 3.97 persons per household. non-family households (725 | 26.8%) represent the smallest median household size with 1.02 persons per household.
| Household Type | # Households | Household Size |
| Married-Couple | 1,546 (57.2%) | 3.91 |
| Single Male/Father | 168 (6.2%) | 3.97 |
| Single Female/Mother | 264 (9.8%) | 2.70 |
| Non-family | 725 (26.8%) | 1.02 |
| Total Households | 2,703 (100.0%) | 3.02 |
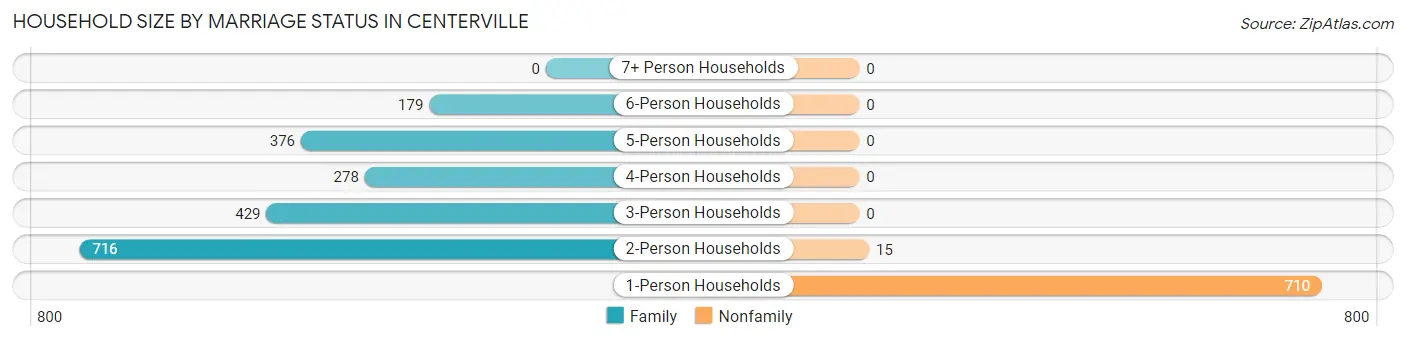
Household Size by Marriage Status in Centerville
Out of a total of 2,703 households in Centerville, 1,978 (73.2%) are family households, while 725 (26.8%) are nonfamily households. The most numerous type of family households are 2-person households, comprising 716, and the most common type of nonfamily households are 1-person households, comprising 710.
| Household Size | Family Households | Nonfamily Households |
| 1-Person Households | - | 710 (26.3%) |
| 2-Person Households | 716 (26.5%) | 15 (0.5%) |
| 3-Person Households | 429 (15.9%) | 0 (0.0%) |
| 4-Person Households | 278 (10.3%) | 0 (0.0%) |
| 5-Person Households | 376 (13.9%) | 0 (0.0%) |
| 6-Person Households | 179 (6.6%) | 0 (0.0%) |
| 7+ Person Households | 0 (0.0%) | 0 (0.0%) |
| Total | 1,978 (73.2%) | 725 (26.8%) |
Female Fertility in Centerville
Fertility by Age in Centerville
| Age Bracket | Women with Births | Births / 1,000 Women |
| 15 to 19 years | 0 (0.0%) | 0.0 |
| 20 to 34 years | 0 (0.0%) | 0.0 |
| 35 to 50 years | 0 (0.0%) | 0.0 |
| Total | 0 (0.0%) | 0.0 |
Fertility by Age by Marriage Status in Centerville
| Age Bracket | Married | Unmarried |
| 15 to 19 years | 0 (0.0%) | 0 (0.0%) |
| 20 to 34 years | 0 (0.0%) | 0 (0.0%) |
| 35 to 50 years | 0 (0.0%) | 0 (0.0%) |
| Total | 0 (0.0%) | 0 (0.0%) |
Fertility by Education in Centerville
| Educational Attainment | Women with Births | Births / 1,000 Women |
| Less than High School | 0 (0.0%) | 0.0 |
| High School Diploma | 0 (0.0%) | 0.0 |
| College or Associate's Degree | 0 (0.0%) | 0.0 |
| Bachelor's Degree | 0 (0.0%) | 0.0 |
| Graduate Degree | 0 (0.0%) | 0.0 |
| Total | 0 (0.0%) | 0.0 |
Fertility by Education by Marriage Status in Centerville
| Educational Attainment | Married | Unmarried |
| Less than High School | 0 (0.0%) | 0 (0.0%) |
| High School Diploma | 0 (0.0%) | 0 (0.0%) |
| College or Associate's Degree | 0 (0.0%) | 0 (0.0%) |
| Bachelor's Degree | 0 (0.0%) | 0 (0.0%) |
| Graduate Degree | 0 (0.0%) | 0 (0.0%) |
| Total | 0 (0.0%) | 0 (0.0%) |
Income in Centerville
Income Overview in Centerville
Per Capita Income in Centerville is $26,988, while median incomes of families and households are $78,173 and $74,250 respectively.
| Characteristic | Number | Measure |
| Per Capita Income | 8,220 | $26,988 |
| Median Family Income | 1,978 | $78,173 |
| Mean Family Income | 1,978 | $82,354 |
| Median Household Income | 2,703 | $74,250 |
| Mean Household Income | 2,703 | $79,708 |
| Income Deficit | 1,978 | $14,301 |
| Wage / Income Gap (%) | 8,220 | 22.35% |
| Wage / Income Gap ($) | 8,220 | 77.65¢ per $1 |
| Gini / Inequality Index | 8,220 | 0.37 |
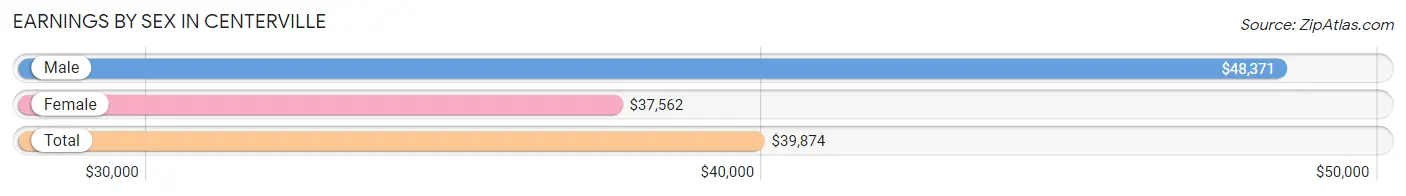
Earnings by Sex in Centerville
Average Earnings in Centerville are $39,874, $48,371 for men and $37,562 for women, a difference of 22.4%.
| Sex | Number | Average Earnings |
| Male | 1,597 (47.5%) | $48,371 |
| Female | 1,762 (52.5%) | $37,562 |
| Total | 3,359 (100.0%) | $39,874 |
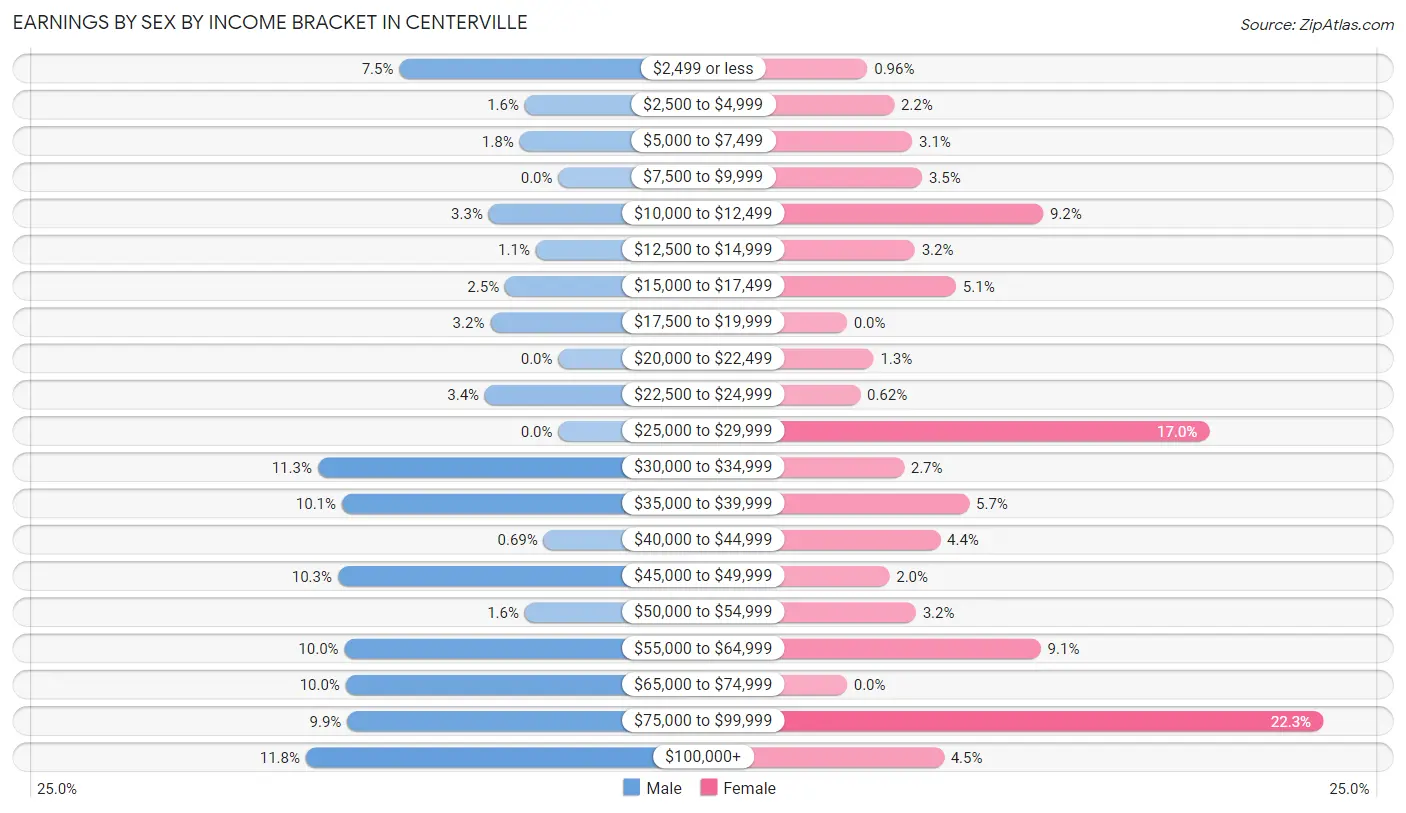
Earnings by Sex by Income Bracket in Centerville
The most common earnings brackets in Centerville are $100,000+ for men (189 | 11.8%) and $75,000 to $99,999 for women (393 | 22.3%).
| Income | Male | Female |
| $2,499 or less | 119 (7.4%) | 17 (1.0%) |
| $2,500 to $4,999 | 25 (1.6%) | 39 (2.2%) |
| $5,000 to $7,499 | 29 (1.8%) | 54 (3.1%) |
| $7,500 to $9,999 | 0 (0.0%) | 62 (3.5%) |
| $10,000 to $12,499 | 52 (3.3%) | 162 (9.2%) |
| $12,500 to $14,999 | 17 (1.1%) | 56 (3.2%) |
| $15,000 to $17,499 | 40 (2.5%) | 90 (5.1%) |
| $17,500 to $19,999 | 51 (3.2%) | 0 (0.0%) |
| $20,000 to $22,499 | 0 (0.0%) | 22 (1.3%) |
| $22,500 to $24,999 | 55 (3.4%) | 11 (0.6%) |
| $25,000 to $29,999 | 0 (0.0%) | 299 (17.0%) |
| $30,000 to $34,999 | 180 (11.3%) | 47 (2.7%) |
| $35,000 to $39,999 | 162 (10.1%) | 101 (5.7%) |
| $40,000 to $44,999 | 11 (0.7%) | 77 (4.4%) |
| $45,000 to $49,999 | 165 (10.3%) | 35 (2.0%) |
| $50,000 to $54,999 | 25 (1.6%) | 57 (3.2%) |
| $55,000 to $64,999 | 160 (10.0%) | 160 (9.1%) |
| $65,000 to $74,999 | 159 (10.0%) | 0 (0.0%) |
| $75,000 to $99,999 | 158 (9.9%) | 393 (22.3%) |
| $100,000+ | 189 (11.8%) | 80 (4.5%) |
| Total | 1,597 (100.0%) | 1,762 (100.0%) |
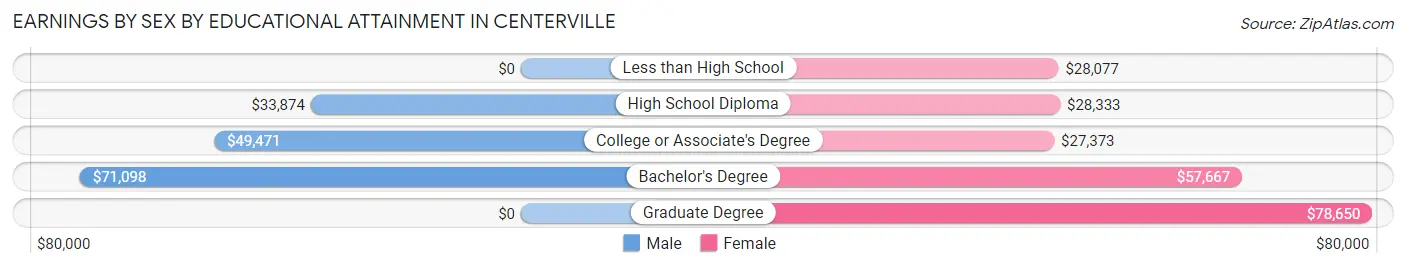
Earnings by Sex by Educational Attainment in Centerville
Average earnings in Centerville are $49,545 for men and $39,707 for women, a difference of 19.9%. Men with an educational attainment of bachelor's degree enjoy the highest average annual earnings of $71,098, while those with high school diploma education earn the least with $33,874. Women with an educational attainment of graduate degree earn the most with the average annual earnings of $78,650, while those with college or associate's degree education have the smallest earnings of $27,373.
| Educational Attainment | Male Income | Female Income |
| Less than High School | - | - |
| High School Diploma | $33,874 | $28,333 |
| College or Associate's Degree | $49,471 | $27,373 |
| Bachelor's Degree | $71,098 | $57,667 |
| Graduate Degree | - | - |
| Total | $49,545 | $39,707 |
Family Income in Centerville
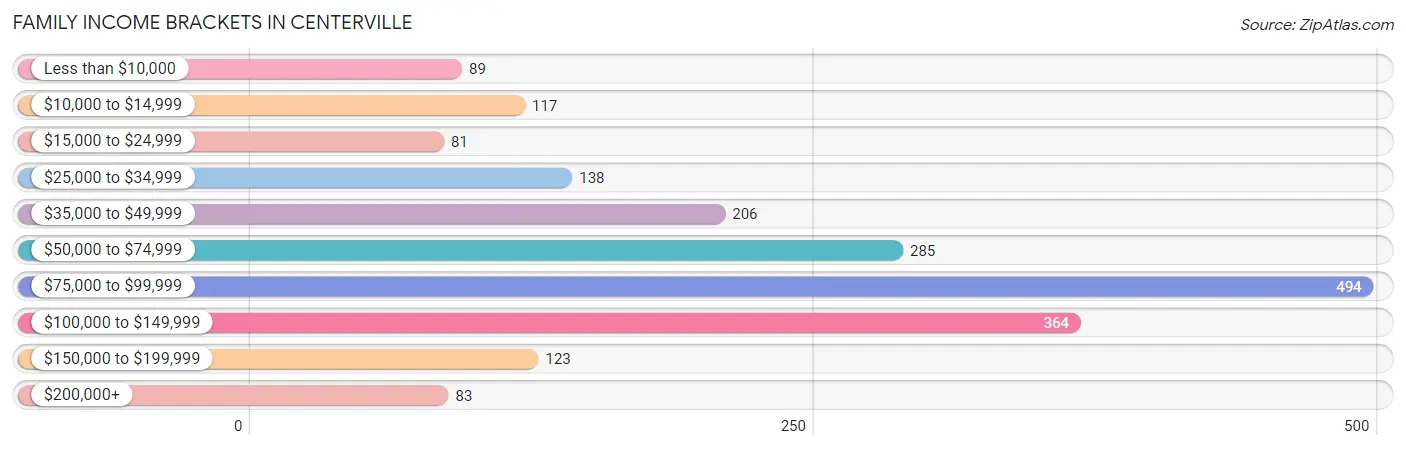
Family Income Brackets in Centerville
According to the Centerville family income data, there are 494 families falling into the $75,000 to $99,999 income range, which is the most common income bracket and makes up 25.0% of all families. Conversely, the $15,000 to $24,999 income bracket is the least frequent group with only 81 families (4.1%) belonging to this category.
| Income Bracket | # Families | % Families |
| Less than $10,000 | 89 | 4.5% |
| $10,000 to $14,999 | 117 | 5.9% |
| $15,000 to $24,999 | 81 | 4.1% |
| $25,000 to $34,999 | 138 | 7.0% |
| $35,000 to $49,999 | 206 | 10.4% |
| $50,000 to $74,999 | 285 | 14.4% |
| $75,000 to $99,999 | 494 | 25.0% |
| $100,000 to $149,999 | 364 | 18.4% |
| $150,000 to $199,999 | 123 | 6.2% |
| $200,000+ | 83 | 4.2% |
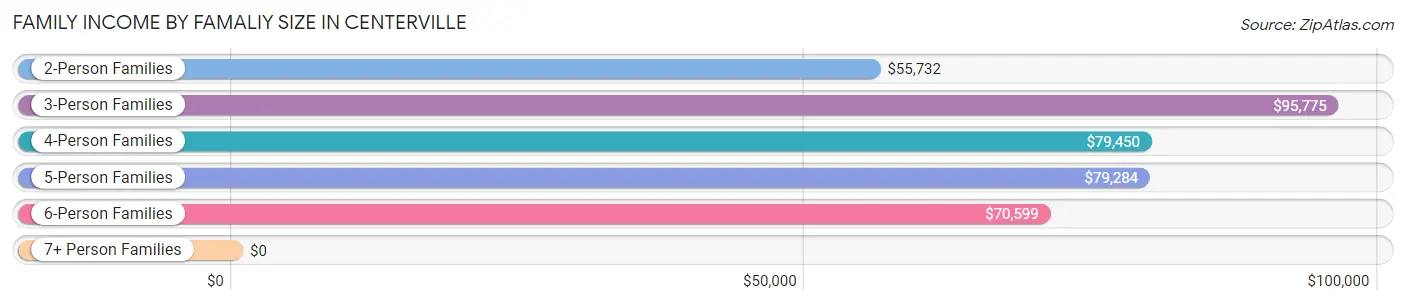
Family Income by Famaliy Size in Centerville
3-person families (462 | 23.4%) account for the highest median family income in Centerville with $95,775 per family, while 3-person families (462 | 23.4%) have the highest median income of $31,925 per family member.
| Income Bracket | # Families | Median Income |
| 2-Person Families | 732 (37.0%) | $55,732 |
| 3-Person Families | 462 (23.4%) | $95,775 |
| 4-Person Families | 291 (14.7%) | $79,450 |
| 5-Person Families | 314 (15.9%) | $79,284 |
| 6-Person Families | 179 (9.0%) | $70,599 |
| 7+ Person Families | 0 (0.0%) | $0 |
| Total | 1,978 (100.0%) | $78,173 |
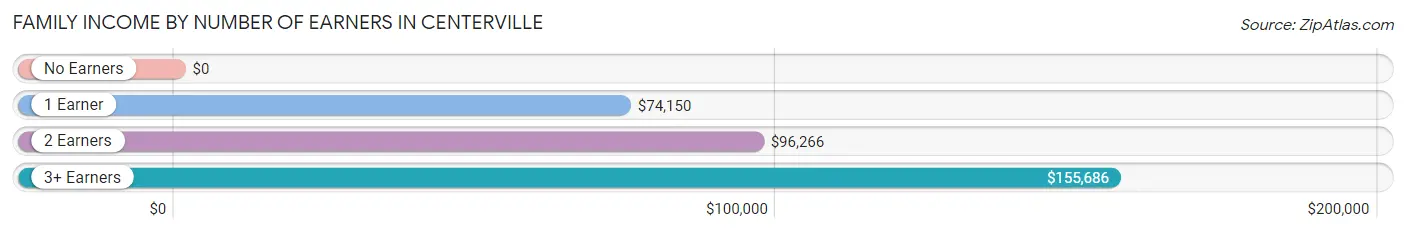
Family Income by Number of Earners in Centerville
| Number of Earners | # Families | Median Income |
| No Earners | 317 (16.0%) | $0 |
| 1 Earner | 877 (44.3%) | $74,150 |
| 2 Earners | 662 (33.5%) | $96,266 |
| 3+ Earners | 122 (6.2%) | $155,686 |
| Total | 1,978 (100.0%) | $78,173 |
Household Income in Centerville
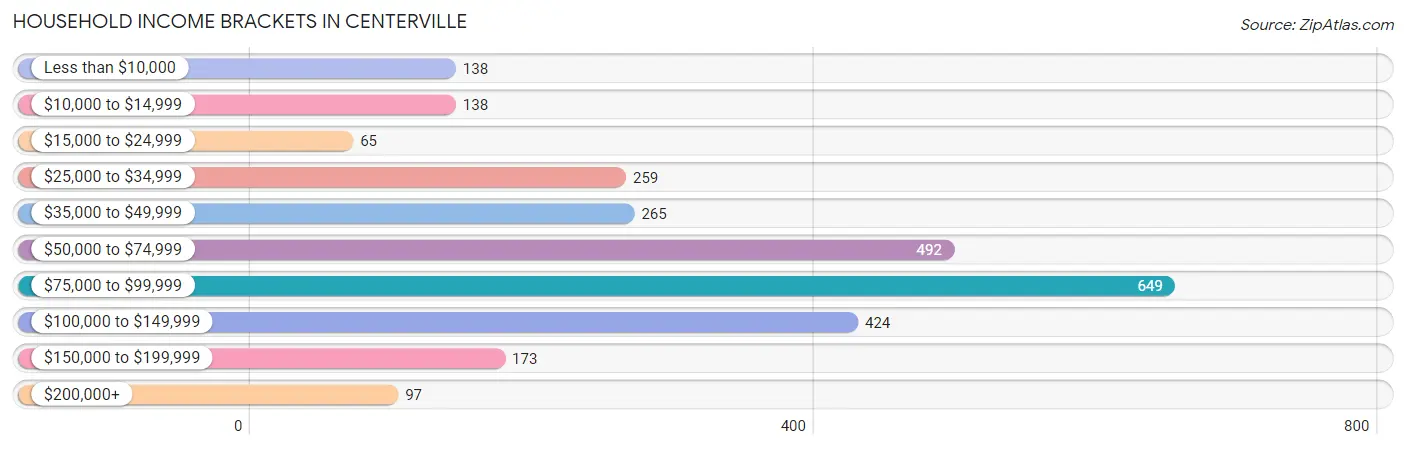
Household Income Brackets in Centerville
With 649 households falling in the category, the $75,000 to $99,999 income range is the most frequent in Centerville, accounting for 24.0% of all households. In contrast, only 65 households (2.4%) fall into the $15,000 to $24,999 income bracket, making it the least populous group.
| Income Bracket | # Households | % Households |
| Less than $10,000 | 138 | 5.1% |
| $10,000 to $14,999 | 138 | 5.1% |
| $15,000 to $24,999 | 65 | 2.4% |
| $25,000 to $34,999 | 259 | 9.6% |
| $35,000 to $49,999 | 265 | 9.8% |
| $50,000 to $74,999 | 492 | 18.2% |
| $75,000 to $99,999 | 649 | 24.0% |
| $100,000 to $149,999 | 424 | 15.7% |
| $150,000 to $199,999 | 173 | 6.4% |
| $200,000+ | 97 | 3.6% |
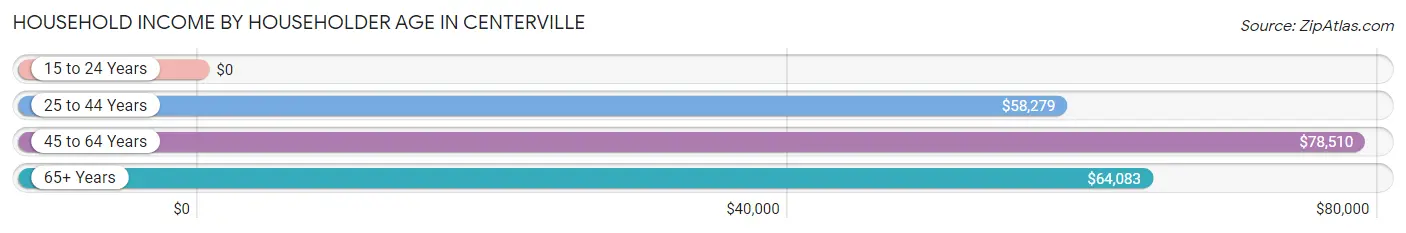
Household Income by Householder Age in Centerville
The median household income in Centerville is $74,250, with the highest median household income of $78,510 found in the 45 to 64 years age bracket for the primary householder. A total of 1,110 households (41.1%) fall into this category. Meanwhile, the 15 to 24 years age bracket for the primary householder has the lowest median household income of $0, with 35 households (1.3%) in this group.
| Income Bracket | # Households | Median Income |
| 15 to 24 Years | 35 (1.3%) | $0 |
| 25 to 44 Years | 901 (33.3%) | $58,279 |
| 45 to 64 Years | 1,110 (41.1%) | $78,510 |
| 65+ Years | 657 (24.3%) | $64,083 |
| Total | 2,703 (100.0%) | $74,250 |
Poverty in Centerville
Income Below Poverty by Sex and Age in Centerville
With 18.6% poverty level for males and 11.9% for females among the residents of Centerville, under 5 year old males and 25 to 34 year old females are the most vulnerable to poverty, with 76 males (40.6%) and 210 females (37.6%) in their respective age groups living below the poverty level.
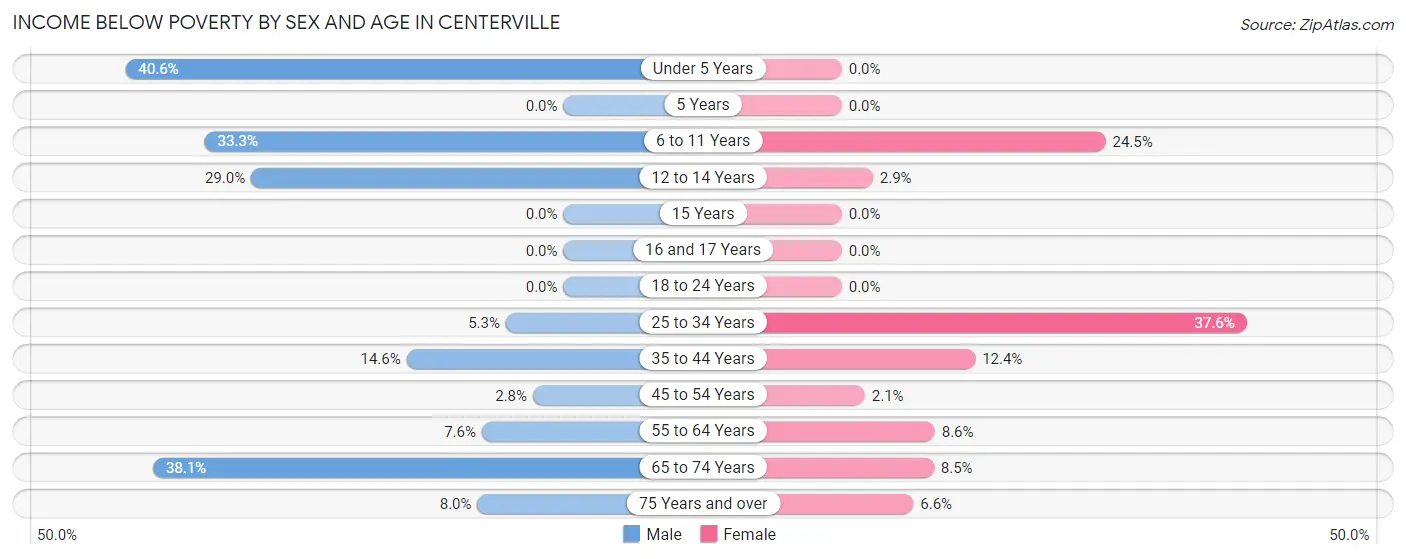
| Age Bracket | Male | Female |
| Under 5 Years | 76 (40.6%) | 0 (0.0%) |
| 5 Years | 0 (0.0%) | 0 (0.0%) |
| 6 to 11 Years | 294 (33.3%) | 95 (24.5%) |
| 12 to 14 Years | 69 (29.0%) | 8 (2.9%) |
| 15 Years | 0 (0.0%) | 0 (0.0%) |
| 16 and 17 Years | 0 (0.0%) | 0 (0.0%) |
| 18 to 24 Years | 0 (0.0%) | 0 (0.0%) |
| 25 to 34 Years | 18 (5.3%) | 210 (37.6%) |
| 35 to 44 Years | 72 (14.5%) | 88 (12.4%) |
| 45 to 54 Years | 20 (2.8%) | 7 (2.1%) |
| 55 to 64 Years | 19 (7.6%) | 36 (8.6%) |
| 65 to 74 Years | 179 (38.1%) | 28 (8.5%) |
| 75 Years and over | 13 (8.0%) | 14 (6.6%) |
| Total | 760 (18.6%) | 486 (11.9%) |
Income Above Poverty by Sex and Age in Centerville
According to the poverty statistics in Centerville, males aged 15 years and females aged under 5 years are the age groups that are most secure financially, with 100.0% of males and 100.0% of females in these age groups living above the poverty line.
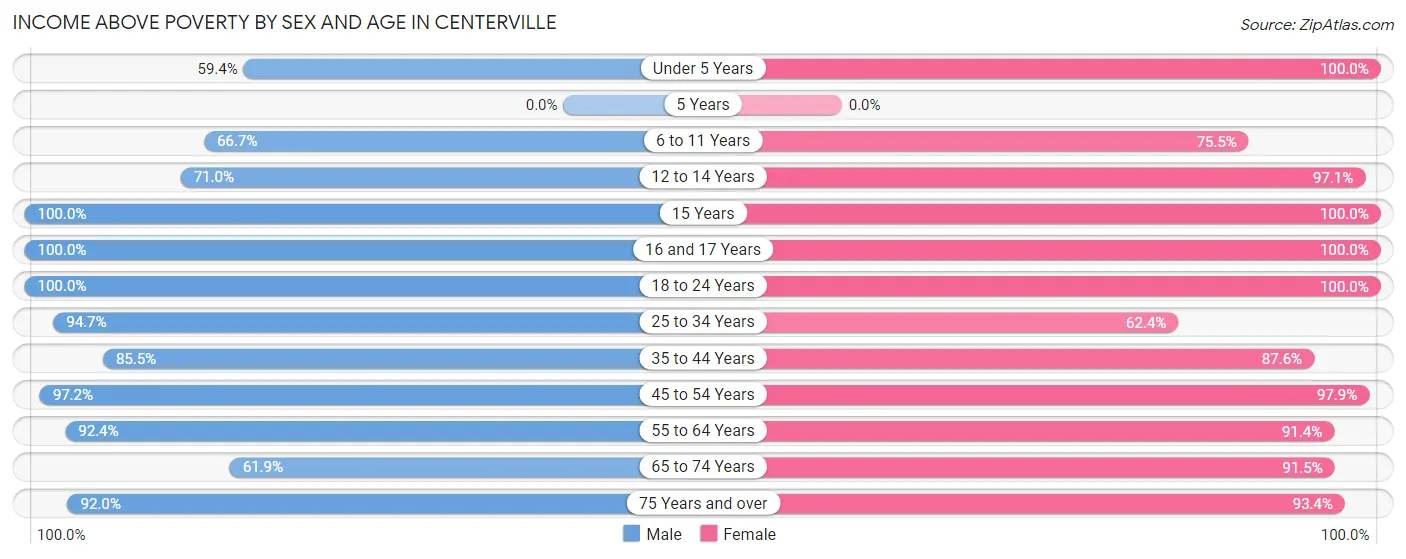
| Age Bracket | Male | Female |
| Under 5 Years | 111 (59.4%) | 51 (100.0%) |
| 5 Years | 0 (0.0%) | 0 (0.0%) |
| 6 to 11 Years | 589 (66.7%) | 293 (75.5%) |
| 12 to 14 Years | 169 (71.0%) | 270 (97.1%) |
| 15 Years | 36 (100.0%) | 16 (100.0%) |
| 16 and 17 Years | 122 (100.0%) | 230 (100.0%) |
| 18 to 24 Years | 199 (100.0%) | 563 (100.0%) |
| 25 to 34 Years | 319 (94.7%) | 349 (62.4%) |
| 35 to 44 Years | 423 (85.5%) | 623 (87.6%) |
| 45 to 54 Years | 686 (97.2%) | 320 (97.9%) |
| 55 to 64 Years | 232 (92.4%) | 381 (91.4%) |
| 65 to 74 Years | 291 (61.9%) | 300 (91.5%) |
| 75 Years and over | 150 (92.0%) | 197 (93.4%) |
| Total | 3,327 (81.4%) | 3,593 (88.1%) |
Income Below Poverty Among Married-Couple Families in Centerville
The poverty statistics for married-couple families in Centerville show that 7.9% or 122 of the total 1,546 families live below the poverty line. Families with 3 or 4 children have the highest poverty rate of 34.3%, comprising of 72 families. On the other hand, families with 1 or 2 children have the lowest poverty rate of 3.1%, which includes 18 families.
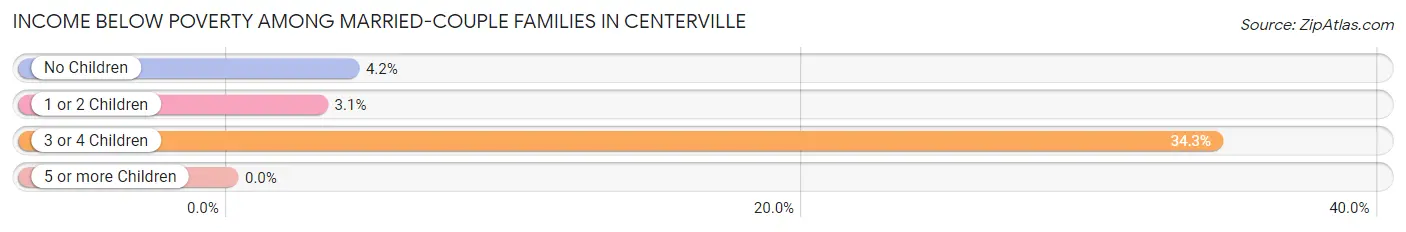
| Children | Above Poverty | Below Poverty |
| No Children | 728 (95.8%) | 32 (4.2%) |
| 1 or 2 Children | 558 (96.9%) | 18 (3.1%) |
| 3 or 4 Children | 138 (65.7%) | 72 (34.3%) |
| 5 or more Children | 0 (0.0%) | 0 (0.0%) |
| Total | 1,424 (92.1%) | 122 (7.9%) |
Income Below Poverty Among Single-Parent Households in Centerville
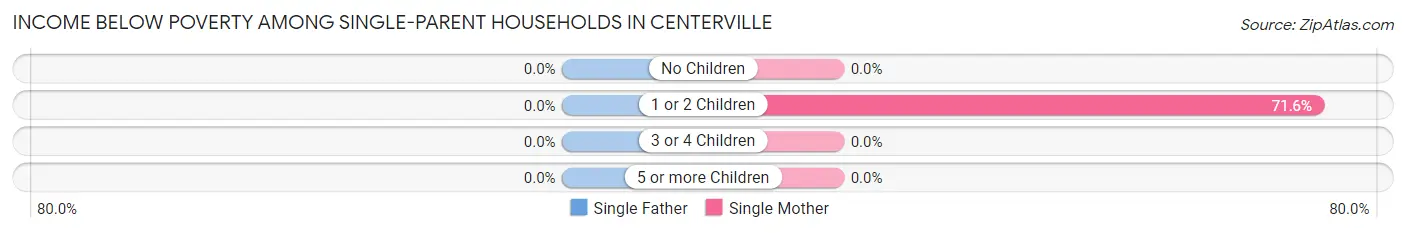
| Children | Single Father | Single Mother |
| No Children | 0 (0.0%) | 0 (0.0%) |
| 1 or 2 Children | 0 (0.0%) | 166 (71.6%) |
| 3 or 4 Children | 0 (0.0%) | 0 (0.0%) |
| 5 or more Children | 0 (0.0%) | 0 (0.0%) |
| Total | 0 (0.0%) | 166 (62.9%) |
Income Below Poverty Among Married-Couple vs Single-Parent Households in Centerville
The poverty data for Centerville shows that 122 of the married-couple family households (7.9%) and 166 of the single-parent households (38.4%) are living below the poverty level. Within the married-couple family households, those with 3 or 4 children have the highest poverty rate, with 72 households (34.3%) falling below the poverty line. Among the single-parent households, those with 1 or 2 children have the highest poverty rate, with 166 household (41.5%) living below poverty.
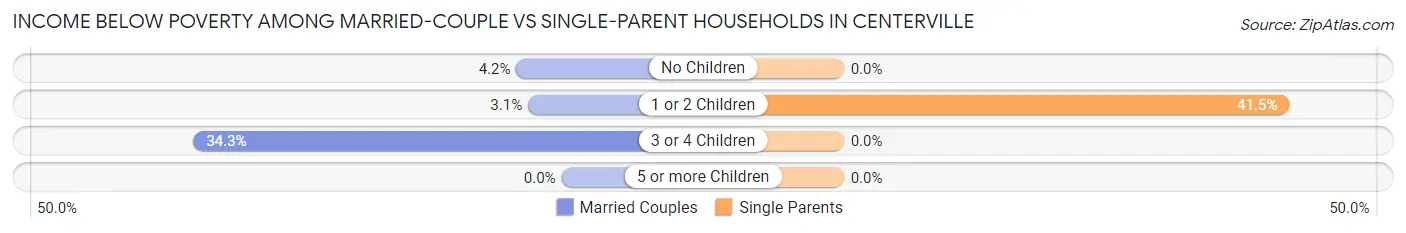
| Children | Married-Couple Families | Single-Parent Households |
| No Children | 32 (4.2%) | 0 (0.0%) |
| 1 or 2 Children | 18 (3.1%) | 166 (41.5%) |
| 3 or 4 Children | 72 (34.3%) | 0 (0.0%) |
| 5 or more Children | 0 (0.0%) | 0 (0.0%) |
| Total | 122 (7.9%) | 166 (38.4%) |
Employment Characteristics in Centerville
Employment by Class of Employer in Centerville
Among the 3,179 employed individuals in Centerville, private company employees (1,751 | 55.1%), local government employees (594 | 18.7%), and federal government employees (299 | 9.4%) make up the most common classes of employment.
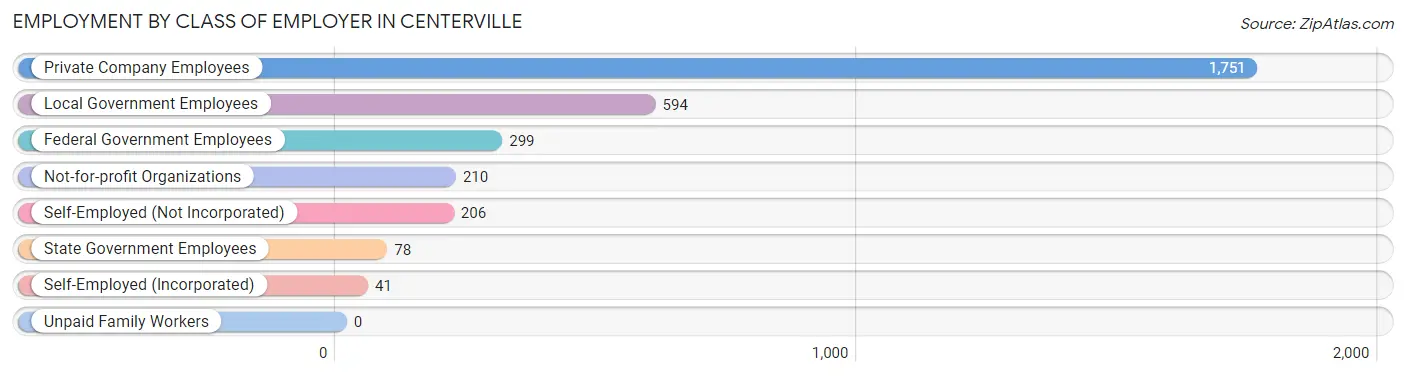
| Employer Class | # Employees | % Employees |
| Private Company Employees | 1,751 | 55.1% |
| Self-Employed (Incorporated) | 41 | 1.3% |
| Self-Employed (Not Incorporated) | 206 | 6.5% |
| Not-for-profit Organizations | 210 | 6.6% |
| Local Government Employees | 594 | 18.7% |
| State Government Employees | 78 | 2.5% |
| Federal Government Employees | 299 | 9.4% |
| Unpaid Family Workers | 0 | 0.0% |
| Total | 3,179 | 100.0% |
Employment Status by Age in Centerville
According to the labor force statistics for Centerville, out of the total population over 16 years of age (6,143), 54.1% or 3,323 individuals are in the labor force, with 2.0% or 66 of them unemployed. The age group with the highest labor force participation rate is 20 to 24 years, with 93.7% or 238 individuals in the labor force. Within the labor force, the 20 to 24 years age range has the highest percentage of unemployed individuals, with 15.1% or 36 of them being unemployed.
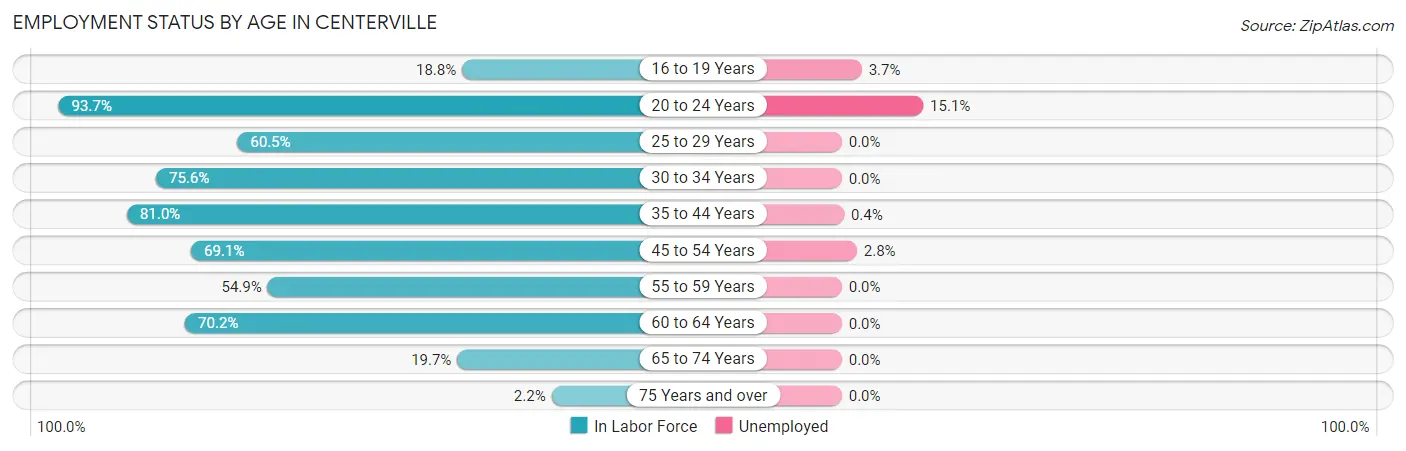
| Age Bracket | In Labor Force | Unemployed |
| 16 to 19 Years | 162 (18.8%) | 6 (3.7%) |
| 20 to 24 Years | 238 (93.7%) | 36 (15.1%) |
| 25 to 29 Years | 170 (60.5%) | 0 (0.0%) |
| 30 to 34 Years | 465 (75.6%) | 0 (0.0%) |
| 35 to 44 Years | 977 (81.0%) | 4 (0.4%) |
| 45 to 54 Years | 714 (69.1%) | 20 (2.8%) |
| 55 to 59 Years | 151 (54.9%) | 0 (0.0%) |
| 60 to 64 Years | 276 (70.2%) | 0 (0.0%) |
| 65 to 74 Years | 160 (19.7%) | 0 (0.0%) |
| 75 Years and over | 9 (2.2%) | 0 (0.0%) |
| Total | 3,323 (54.1%) | 66 (2.0%) |
Employment Status by Educational Attainment in Centerville
According to labor force statistics for Centerville, 72.4% of individuals (2,753) out of the total population between 25 and 64 years of age (3,803) are in the labor force, with 0.9% or 25 of them being unemployed. The group with the highest labor force participation rate are those with the educational attainment of high school diploma, with 83.7% or 658 individuals in the labor force. Within the labor force, individuals with high school diploma education have the highest percentage of unemployment, with 3.0% or 20 of them being unemployed.
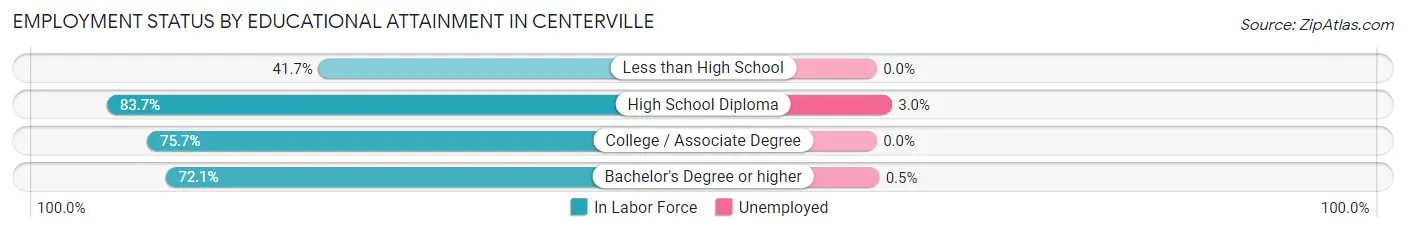
| Educational Attainment | In Labor Force | Unemployed |
| Less than High School | 177 (41.7%) | 0 (0.0%) |
| High School Diploma | 658 (83.7%) | 24 (3.0%) |
| College / Associate Degree | 1,014 (75.7%) | 0 (0.0%) |
| Bachelor's Degree or higher | 903 (72.1%) | 6 (0.5%) |
| Total | 2,753 (72.4%) | 34 (0.9%) |
Employment Occupations by Sex in Centerville
Management, Business, Science and Arts Occupations
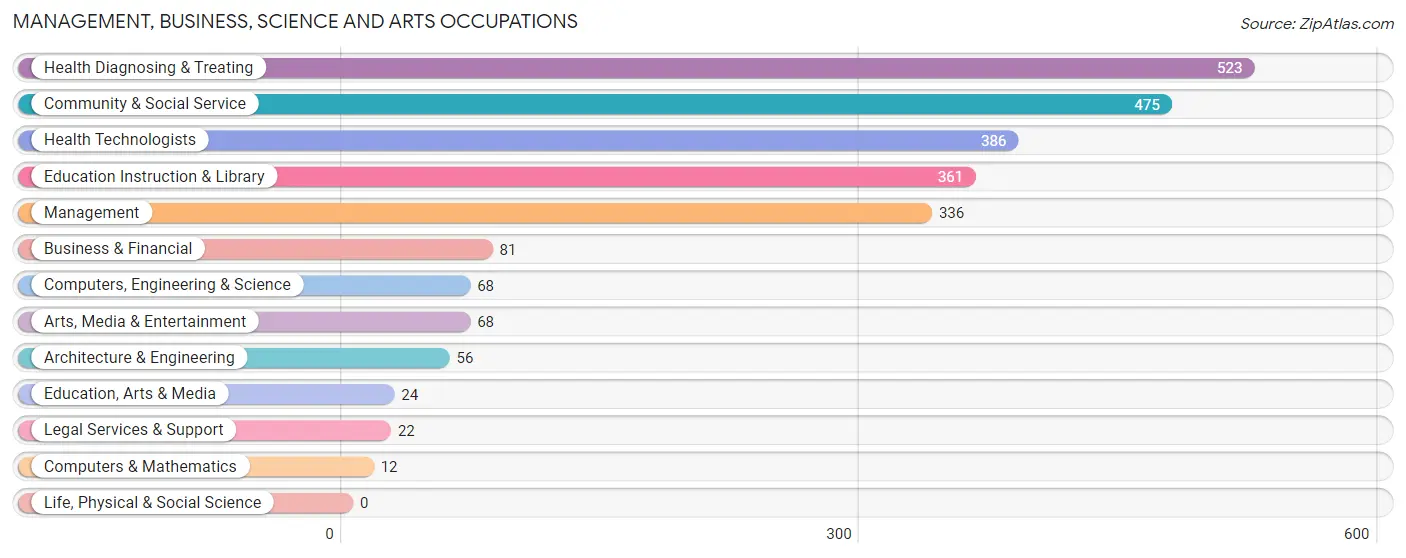
The most common Management, Business, Science and Arts occupations in Centerville are Health Diagnosing & Treating (523 | 16.2%), Community & Social Service (475 | 14.7%), Health Technologists (386 | 11.9%), Education Instruction & Library (361 | 11.2%), and Management (336 | 10.4%).
Management, Business, Science and Arts Occupations by Sex
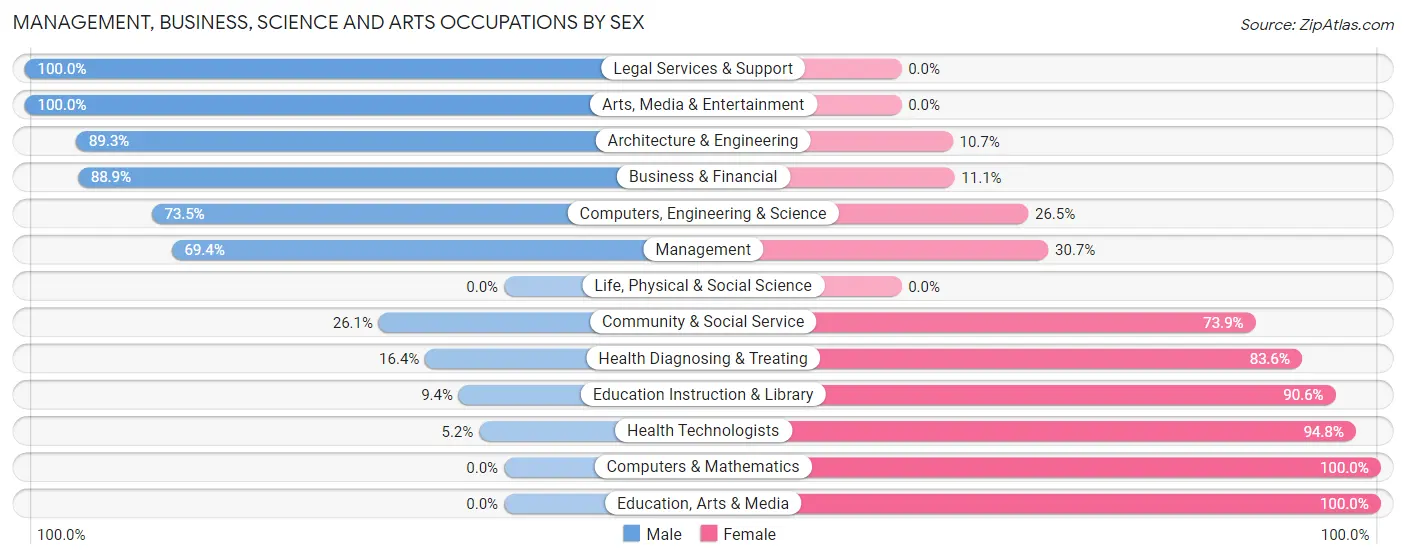
Within the Management, Business, Science and Arts occupations in Centerville, the most male-oriented occupations are Legal Services & Support (100.0%), Arts, Media & Entertainment (100.0%), and Architecture & Engineering (89.3%), while the most female-oriented occupations are Computers & Mathematics (100.0%), Education, Arts & Media (100.0%), and Health Technologists (94.8%).
| Occupation | Male | Female |
| Management | 233 (69.4%) | 103 (30.6%) |
| Business & Financial | 72 (88.9%) | 9 (11.1%) |
| Computers, Engineering & Science | 50 (73.5%) | 18 (26.5%) |
| Computers & Mathematics | 0 (0.0%) | 12 (100.0%) |
| Architecture & Engineering | 50 (89.3%) | 6 (10.7%) |
| Life, Physical & Social Science | 0 (0.0%) | 0 (0.0%) |
| Community & Social Service | 124 (26.1%) | 351 (73.9%) |
| Education, Arts & Media | 0 (0.0%) | 24 (100.0%) |
| Legal Services & Support | 22 (100.0%) | 0 (0.0%) |
| Education Instruction & Library | 34 (9.4%) | 327 (90.6%) |
| Arts, Media & Entertainment | 68 (100.0%) | 0 (0.0%) |
| Health Diagnosing & Treating | 86 (16.4%) | 437 (83.6%) |
| Health Technologists | 20 (5.2%) | 366 (94.8%) |
| Total (Category) | 565 (38.1%) | 918 (61.9%) |
| Total (Overall) | 1,517 (46.9%) | 1,714 (53.0%) |
Services Occupations
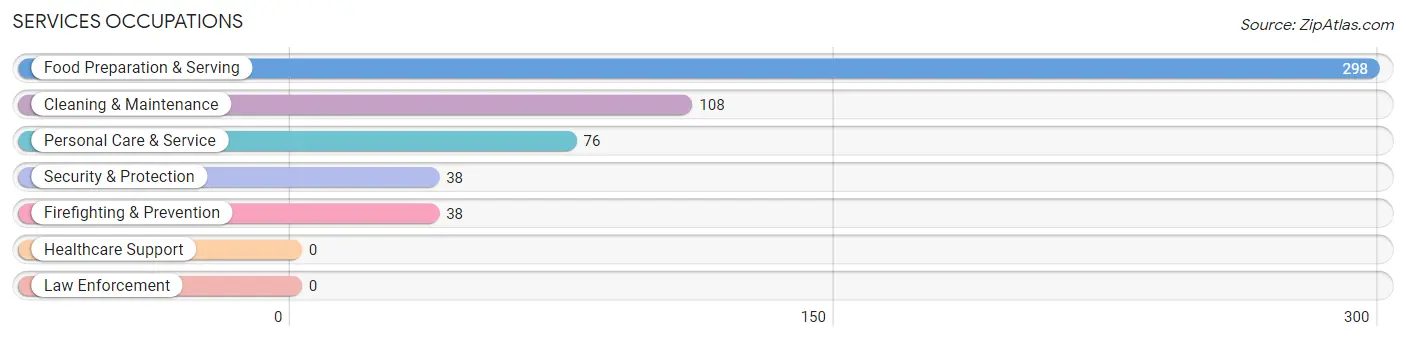
The most common Services occupations in Centerville are Food Preparation & Serving (298 | 9.2%), Cleaning & Maintenance (108 | 3.3%), Personal Care & Service (76 | 2.4%), Security & Protection (38 | 1.2%), and Firefighting & Prevention (38 | 1.2%).
Services Occupations by Sex
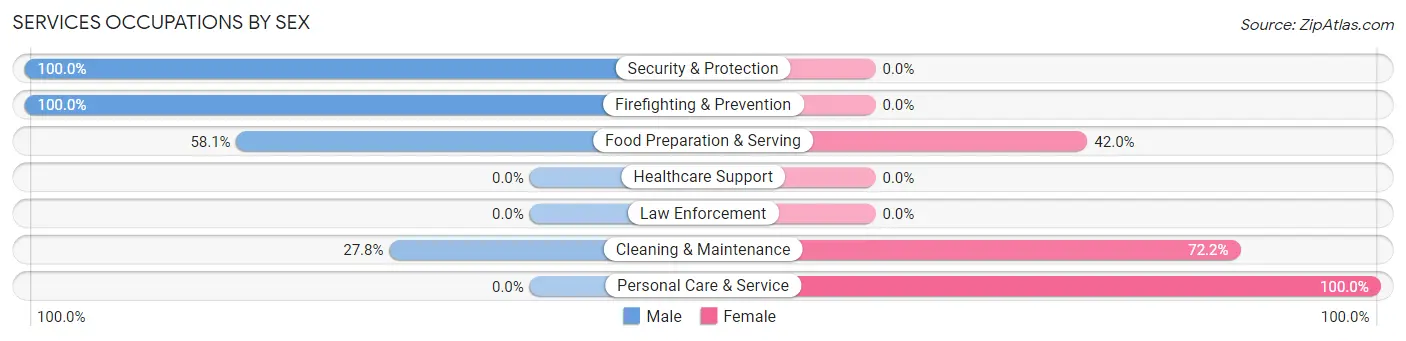
Within the Services occupations in Centerville, the most male-oriented occupations are Security & Protection (100.0%), Firefighting & Prevention (100.0%), and Food Preparation & Serving (58.1%), while the most female-oriented occupations are Personal Care & Service (100.0%), Cleaning & Maintenance (72.2%), and Food Preparation & Serving (41.9%).
| Occupation | Male | Female |
| Healthcare Support | 0 (0.0%) | 0 (0.0%) |
| Security & Protection | 38 (100.0%) | 0 (0.0%) |
| Firefighting & Prevention | 38 (100.0%) | 0 (0.0%) |
| Law Enforcement | 0 (0.0%) | 0 (0.0%) |
| Food Preparation & Serving | 173 (58.1%) | 125 (41.9%) |
| Cleaning & Maintenance | 30 (27.8%) | 78 (72.2%) |
| Personal Care & Service | 0 (0.0%) | 76 (100.0%) |
| Total (Category) | 241 (46.4%) | 279 (53.6%) |
| Total (Overall) | 1,517 (46.9%) | 1,714 (53.0%) |
Sales and Office Occupations
The most common Sales and Office occupations in Centerville are Sales & Related (277 | 8.6%), and Office & Administration (264 | 8.2%).

Sales and Office Occupations by Sex

| Occupation | Male | Female |
| Sales & Related | 160 (57.8%) | 117 (42.2%) |
| Office & Administration | 52 (19.7%) | 212 (80.3%) |
| Total (Category) | 212 (39.2%) | 329 (60.8%) |
| Total (Overall) | 1,517 (46.9%) | 1,714 (53.0%) |
Natural Resources, Construction and Maintenance Occupations
The most common Natural Resources, Construction and Maintenance occupations in Centerville are Construction & Extraction (191 | 5.9%), Installation, Maintenance & Repair (96 | 3.0%), and Farming, Fishing & Forestry (6 | 0.2%).

Natural Resources, Construction and Maintenance Occupations by Sex

| Occupation | Male | Female |
| Farming, Fishing & Forestry | 6 (100.0%) | 0 (0.0%) |
| Construction & Extraction | 191 (100.0%) | 0 (0.0%) |
| Installation, Maintenance & Repair | 96 (100.0%) | 0 (0.0%) |
| Total (Category) | 293 (100.0%) | 0 (0.0%) |
| Total (Overall) | 1,517 (46.9%) | 1,714 (53.0%) |
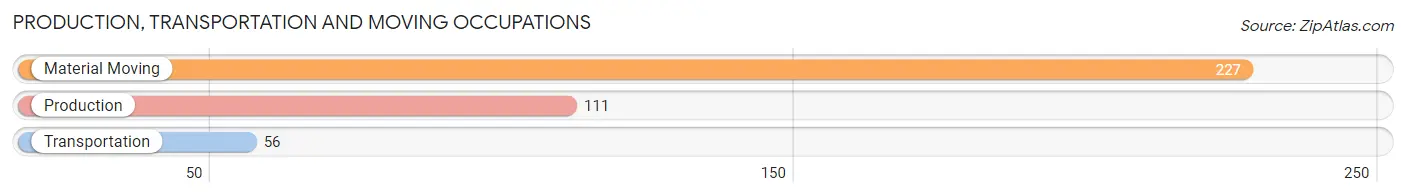
Production, Transportation and Moving Occupations
The most common Production, Transportation and Moving occupations in Centerville are Material Moving (227 | 7.0%), Production (111 | 3.4%), and Transportation (56 | 1.7%).
Production, Transportation and Moving Occupations by Sex

| Occupation | Male | Female |
| Production | 90 (81.1%) | 21 (18.9%) |
| Transportation | 46 (82.1%) | 10 (17.9%) |
| Material Moving | 70 (30.8%) | 157 (69.2%) |
| Total (Category) | 206 (52.3%) | 188 (47.7%) |
| Total (Overall) | 1,517 (46.9%) | 1,714 (53.0%) |
Employment Industries by Sex in Centerville
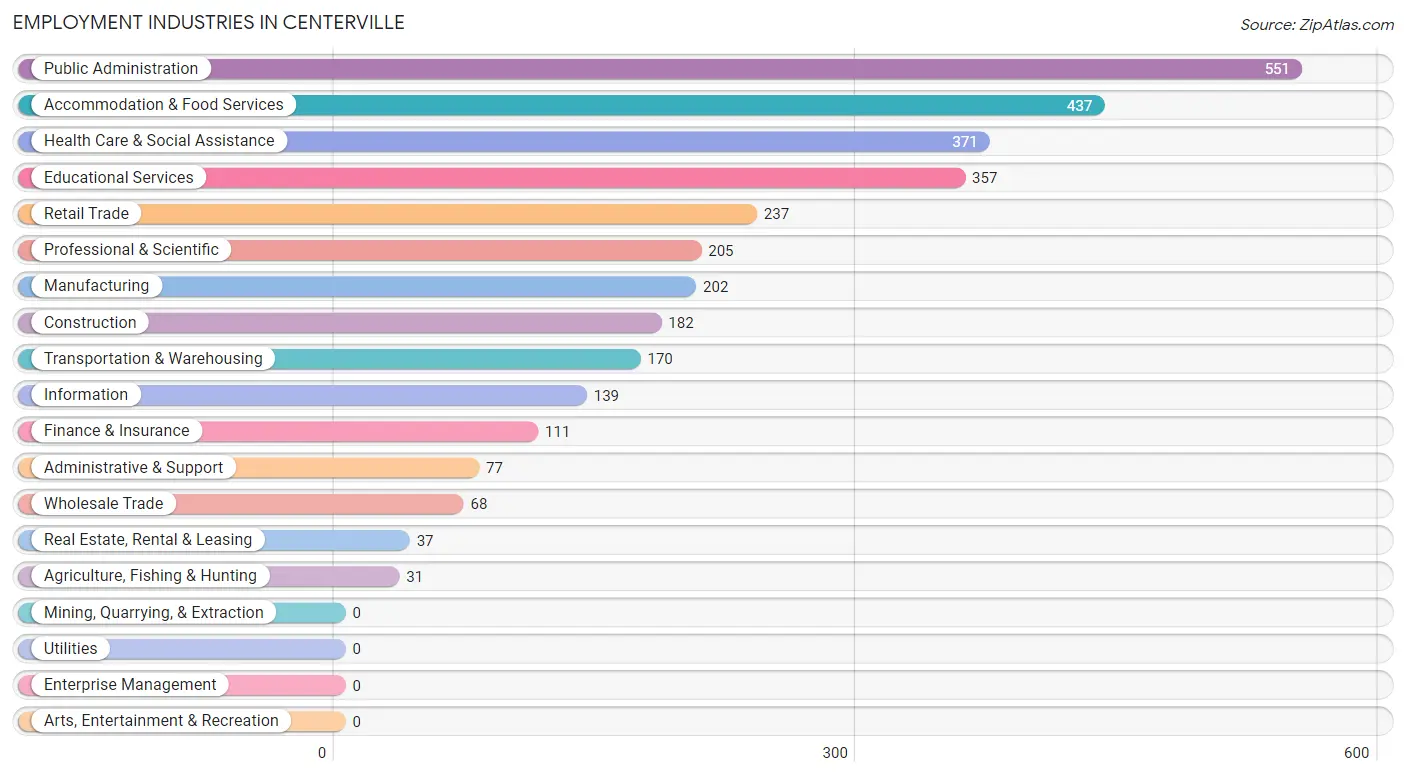
Employment Industries in Centerville
The major employment industries in Centerville include Public Administration (551 | 17.1%), Accommodation & Food Services (437 | 13.5%), Health Care & Social Assistance (371 | 11.5%), Educational Services (357 | 11.1%), and Retail Trade (237 | 7.3%).
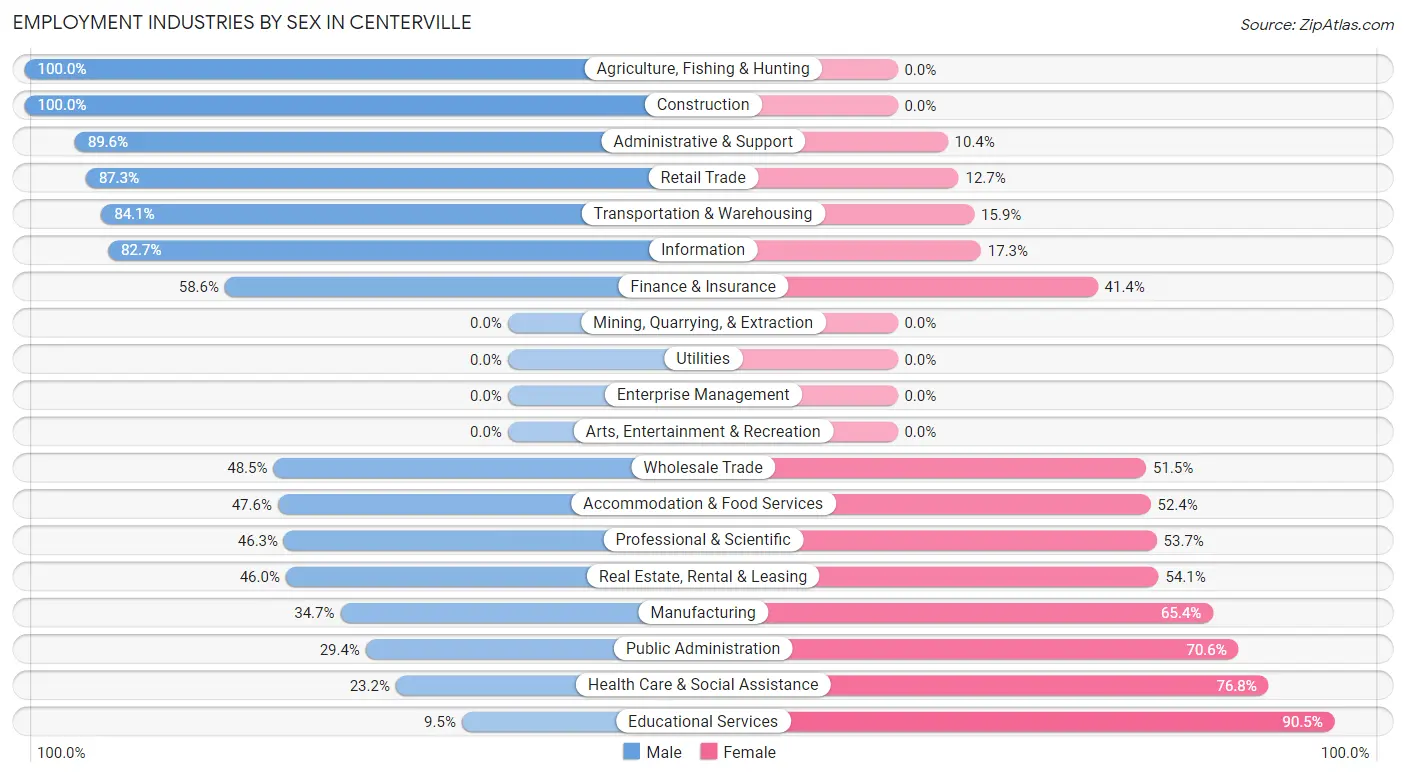
Employment Industries by Sex in Centerville
The Centerville industries that see more men than women are Agriculture, Fishing & Hunting (100.0%), Construction (100.0%), and Administrative & Support (89.6%), whereas the industries that tend to have a higher number of women are Educational Services (90.5%), Health Care & Social Assistance (76.8%), and Public Administration (70.6%).
| Industry | Male | Female |
| Agriculture, Fishing & Hunting | 31 (100.0%) | 0 (0.0%) |
| Mining, Quarrying, & Extraction | 0 (0.0%) | 0 (0.0%) |
| Construction | 182 (100.0%) | 0 (0.0%) |
| Manufacturing | 70 (34.6%) | 132 (65.3%) |
| Wholesale Trade | 33 (48.5%) | 35 (51.5%) |
| Retail Trade | 207 (87.3%) | 30 (12.7%) |
| Transportation & Warehousing | 143 (84.1%) | 27 (15.9%) |
| Utilities | 0 (0.0%) | 0 (0.0%) |
| Information | 115 (82.7%) | 24 (17.3%) |
| Finance & Insurance | 65 (58.6%) | 46 (41.4%) |
| Real Estate, Rental & Leasing | 17 (46.0%) | 20 (54.0%) |
| Professional & Scientific | 95 (46.3%) | 110 (53.7%) |
| Enterprise Management | 0 (0.0%) | 0 (0.0%) |
| Administrative & Support | 69 (89.6%) | 8 (10.4%) |
| Educational Services | 34 (9.5%) | 323 (90.5%) |
| Health Care & Social Assistance | 86 (23.2%) | 285 (76.8%) |
| Arts, Entertainment & Recreation | 0 (0.0%) | 0 (0.0%) |
| Accommodation & Food Services | 208 (47.6%) | 229 (52.4%) |
| Public Administration | 162 (29.4%) | 389 (70.6%) |
| Total | 1,517 (46.9%) | 1,714 (53.0%) |
Education in Centerville
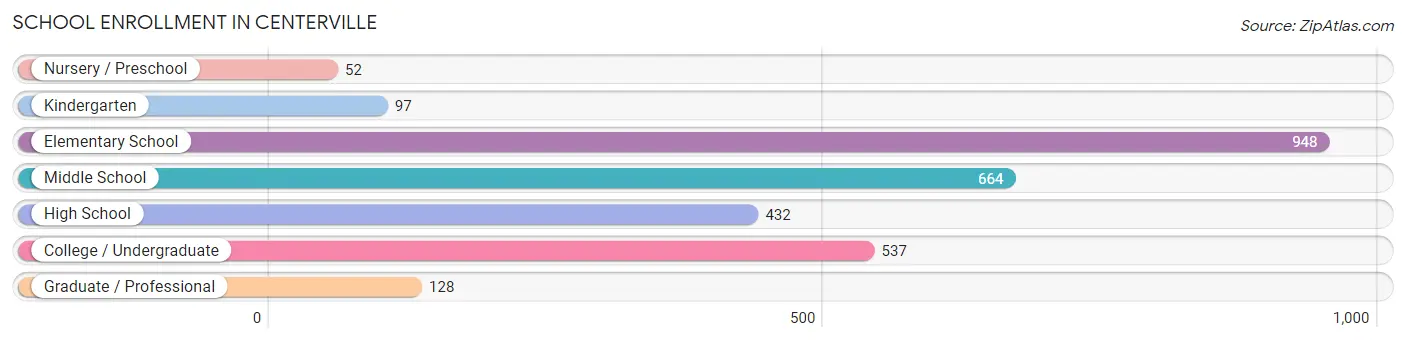
School Enrollment in Centerville
The most common levels of schooling among the 2,858 students in Centerville are elementary school (948 | 33.2%), middle school (664 | 23.2%), and college / undergraduate (537 | 18.8%).
| School Level | # Students | % Students |
| Nursery / Preschool | 52 | 1.8% |
| Kindergarten | 97 | 3.4% |
| Elementary School | 948 | 33.2% |
| Middle School | 664 | 23.2% |
| High School | 432 | 15.1% |
| College / Undergraduate | 537 | 18.8% |
| Graduate / Professional | 128 | 4.5% |
| Total | 2,858 | 100.0% |
School Enrollment by Age by Funding Source in Centerville
Out of a total of 2,858 students who are enrolled in schools in Centerville, 269 (9.4%) attend a private institution, while the remaining 2,589 (90.6%) are enrolled in public schools. The age group of 20 to 24 year olds has the highest likelihood of being enrolled in private schools, with 45 (28.3% in the age bracket) enrolled. Conversely, the age group of 3 to 4 year olds has the lowest likelihood of being enrolled in a private school, with 52 (100.0% in the age bracket) attending a public institution.
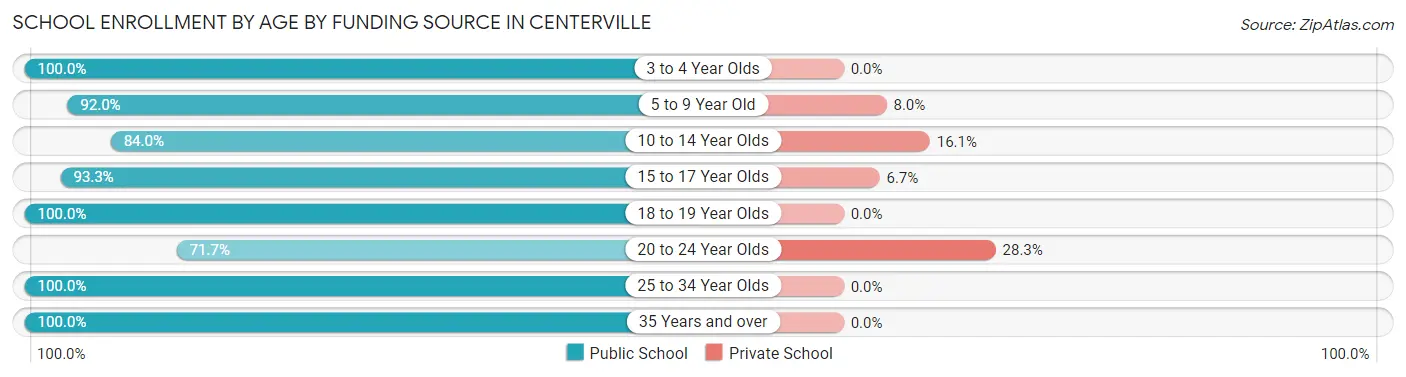
| Age Bracket | Public School | Private School |
| 3 to 4 Year Olds | 52 (100.0%) | 0 (0.0%) |
| 5 to 9 Year Old | 922 (92.0%) | 80 (8.0%) |
| 10 to 14 Year Olds | 612 (84.0%) | 117 (16.1%) |
| 15 to 17 Year Olds | 377 (93.3%) | 27 (6.7%) |
| 18 to 19 Year Olds | 407 (100.0%) | 0 (0.0%) |
| 20 to 24 Year Olds | 114 (71.7%) | 45 (28.3%) |
| 25 to 34 Year Olds | 22 (100.0%) | 0 (0.0%) |
| 35 Years and over | 83 (100.0%) | 0 (0.0%) |
| Total | 2,589 (90.6%) | 269 (9.4%) |
Educational Attainment by Field of Study in Centerville
Business (328 | 20.0%), science & technology (322 | 19.6%), literature & languages (236 | 14.4%), bio, nature & agricultural (156 | 9.5%), and education (120 | 7.3%) are the most common fields of study among 1,644 individuals in Centerville who have obtained a bachelor's degree or higher.
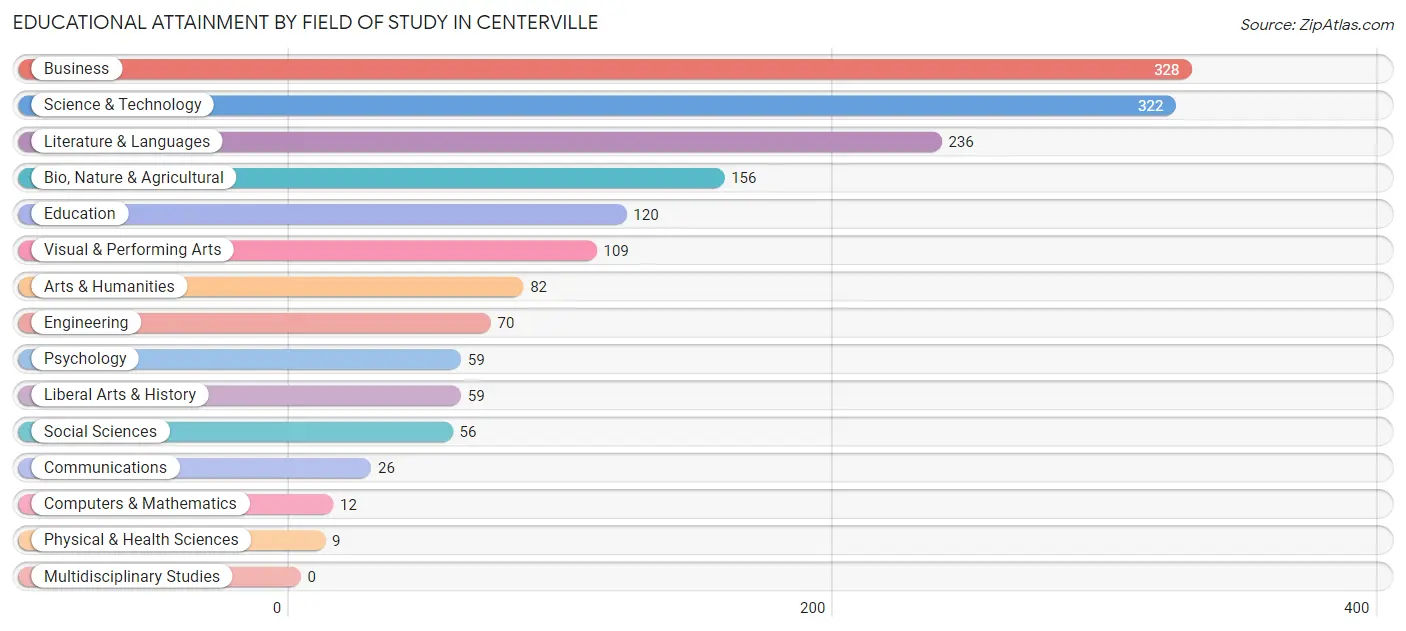
| Field of Study | # Graduates | % Graduates |
| Computers & Mathematics | 12 | 0.7% |
| Bio, Nature & Agricultural | 156 | 9.5% |
| Physical & Health Sciences | 9 | 0.5% |
| Psychology | 59 | 3.6% |
| Social Sciences | 56 | 3.4% |
| Engineering | 70 | 4.3% |
| Multidisciplinary Studies | 0 | 0.0% |
| Science & Technology | 322 | 19.6% |
| Business | 328 | 20.0% |
| Education | 120 | 7.3% |
| Literature & Languages | 236 | 14.4% |
| Liberal Arts & History | 59 | 3.6% |
| Visual & Performing Arts | 109 | 6.6% |
| Communications | 26 | 1.6% |
| Arts & Humanities | 82 | 5.0% |
| Total | 1,644 | 100.0% |
Transportation & Commute in Centerville
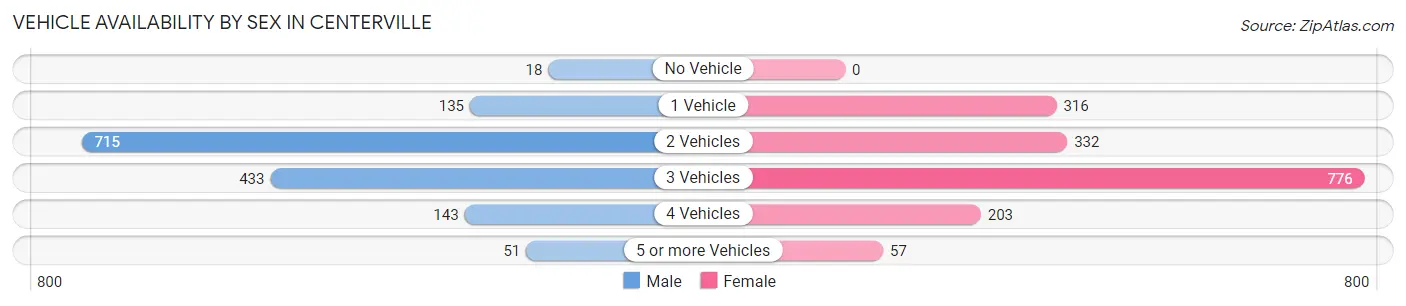
Vehicle Availability by Sex in Centerville
The most prevalent vehicle ownership categories in Centerville are males with 2 vehicles (715, accounting for 47.8%) and females with 2 vehicles (332, making up 42.5%).
| Vehicles Available | Male | Female |
| No Vehicle | 18 (1.2%) | 0 (0.0%) |
| 1 Vehicle | 135 (9.0%) | 316 (18.8%) |
| 2 Vehicles | 715 (47.8%) | 332 (19.7%) |
| 3 Vehicles | 433 (29.0%) | 776 (46.1%) |
| 4 Vehicles | 143 (9.6%) | 203 (12.0%) |
| 5 or more Vehicles | 51 (3.4%) | 57 (3.4%) |
| Total | 1,495 (100.0%) | 1,684 (100.0%) |
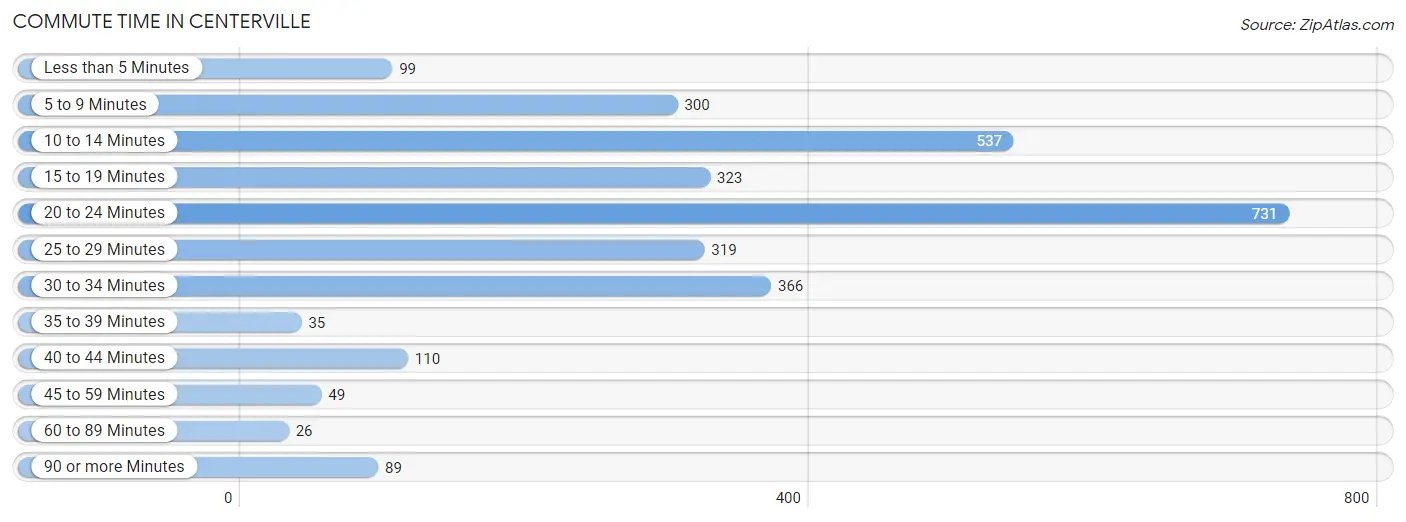
Commute Time in Centerville
The most frequently occuring commute durations in Centerville are 20 to 24 minutes (731 commuters, 24.5%), 10 to 14 minutes (537 commuters, 18.0%), and 30 to 34 minutes (366 commuters, 12.3%).
| Commute Time | # Commuters | % Commuters |
| Less than 5 Minutes | 99 | 3.3% |
| 5 to 9 Minutes | 300 | 10.1% |
| 10 to 14 Minutes | 537 | 18.0% |
| 15 to 19 Minutes | 323 | 10.8% |
| 20 to 24 Minutes | 731 | 24.5% |
| 25 to 29 Minutes | 319 | 10.7% |
| 30 to 34 Minutes | 366 | 12.3% |
| 35 to 39 Minutes | 35 | 1.2% |
| 40 to 44 Minutes | 110 | 3.7% |
| 45 to 59 Minutes | 49 | 1.6% |
| 60 to 89 Minutes | 26 | 0.9% |
| 90 or more Minutes | 89 | 3.0% |
Commute Time by Sex in Centerville
The most common commute times in Centerville are 10 to 14 minutes (293 commuters, 20.7%) for males and 20 to 24 minutes (471 commuters, 30.1%) for females.
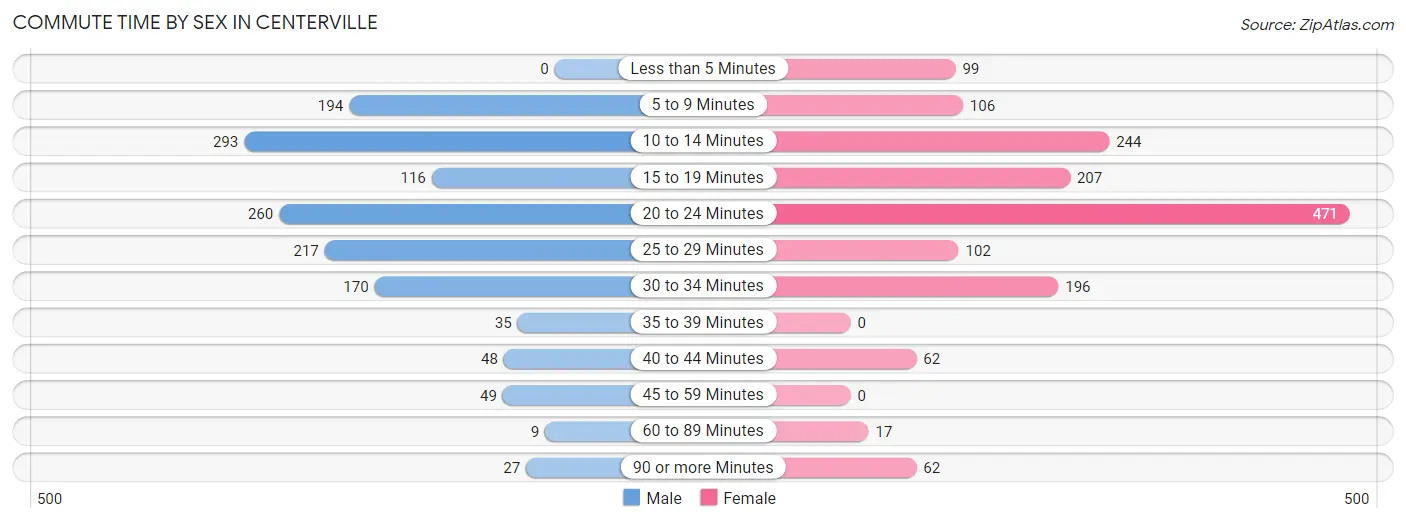
| Commute Time | Male | Female |
| Less than 5 Minutes | 0 (0.0%) | 99 (6.3%) |
| 5 to 9 Minutes | 194 (13.7%) | 106 (6.8%) |
| 10 to 14 Minutes | 293 (20.7%) | 244 (15.6%) |
| 15 to 19 Minutes | 116 (8.2%) | 207 (13.2%) |
| 20 to 24 Minutes | 260 (18.3%) | 471 (30.1%) |
| 25 to 29 Minutes | 217 (15.3%) | 102 (6.5%) |
| 30 to 34 Minutes | 170 (12.0%) | 196 (12.5%) |
| 35 to 39 Minutes | 35 (2.5%) | 0 (0.0%) |
| 40 to 44 Minutes | 48 (3.4%) | 62 (4.0%) |
| 45 to 59 Minutes | 49 (3.5%) | 0 (0.0%) |
| 60 to 89 Minutes | 9 (0.6%) | 17 (1.1%) |
| 90 or more Minutes | 27 (1.9%) | 62 (4.0%) |
Time of Departure to Work by Sex in Centerville
The most frequent times of departure to work in Centerville are 7:00 AM to 7:29 AM (353, 24.9%) for males and 5:30 AM to 5:59 AM (345, 22.0%) for females.
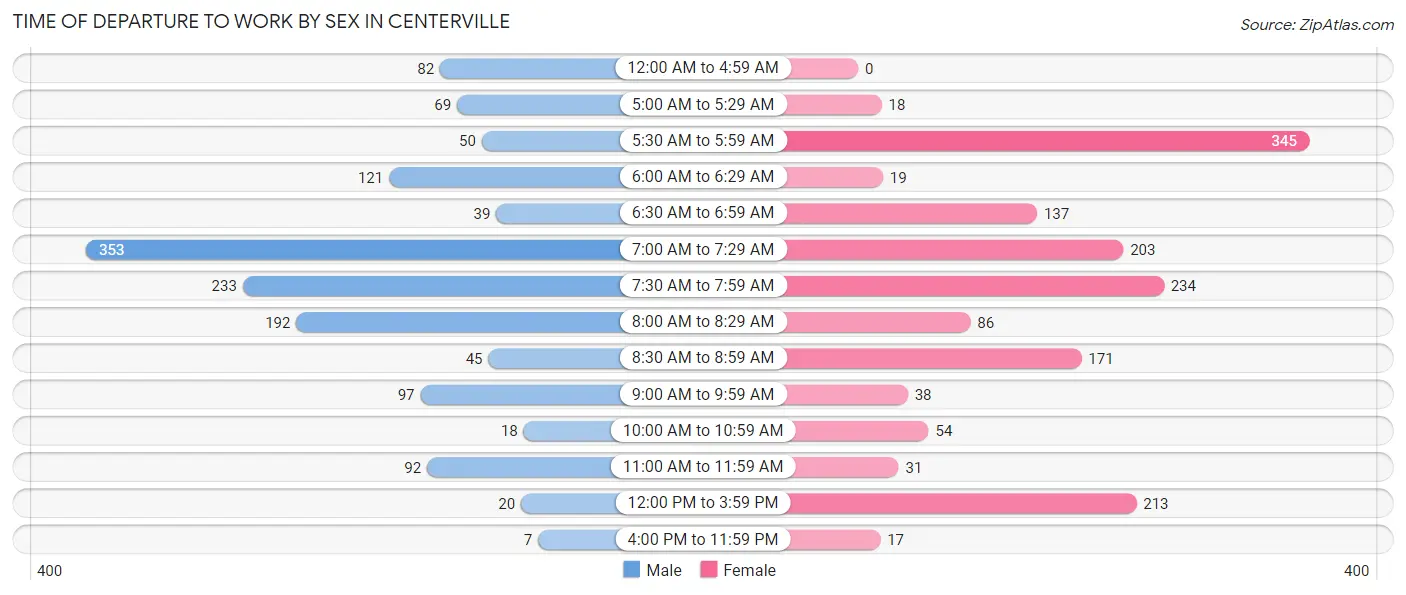
| Time of Departure | Male | Female |
| 12:00 AM to 4:59 AM | 82 (5.8%) | 0 (0.0%) |
| 5:00 AM to 5:29 AM | 69 (4.9%) | 18 (1.1%) |
| 5:30 AM to 5:59 AM | 50 (3.5%) | 345 (22.0%) |
| 6:00 AM to 6:29 AM | 121 (8.5%) | 19 (1.2%) |
| 6:30 AM to 6:59 AM | 39 (2.8%) | 137 (8.7%) |
| 7:00 AM to 7:29 AM | 353 (24.9%) | 203 (13.0%) |
| 7:30 AM to 7:59 AM | 233 (16.4%) | 234 (14.9%) |
| 8:00 AM to 8:29 AM | 192 (13.5%) | 86 (5.5%) |
| 8:30 AM to 8:59 AM | 45 (3.2%) | 171 (10.9%) |
| 9:00 AM to 9:59 AM | 97 (6.8%) | 38 (2.4%) |
| 10:00 AM to 10:59 AM | 18 (1.3%) | 54 (3.5%) |
| 11:00 AM to 11:59 AM | 92 (6.5%) | 31 (2.0%) |
| 12:00 PM to 3:59 PM | 20 (1.4%) | 213 (13.6%) |
| 4:00 PM to 11:59 PM | 7 (0.5%) | 17 (1.1%) |
| Total | 1,418 (100.0%) | 1,566 (100.0%) |
Housing Occupancy in Centerville
Occupancy by Ownership in Centerville
Of the total 2,703 dwellings in Centerville, owner-occupied units account for 1,983 (73.4%), while renter-occupied units make up 720 (26.6%).
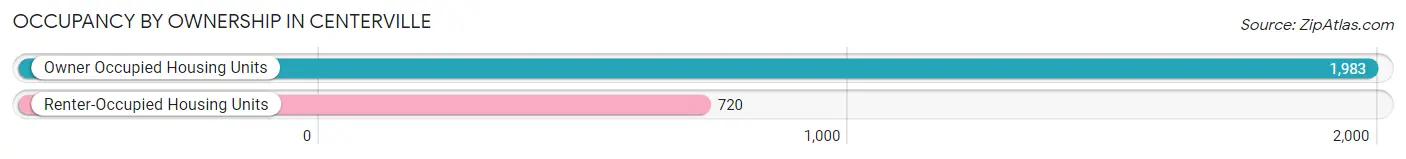
| Occupancy | # Housing Units | % Housing Units |
| Owner Occupied Housing Units | 1,983 | 73.4% |
| Renter-Occupied Housing Units | 720 | 26.6% |
| Total Occupied Housing Units | 2,703 | 100.0% |
Occupancy by Household Size in Centerville
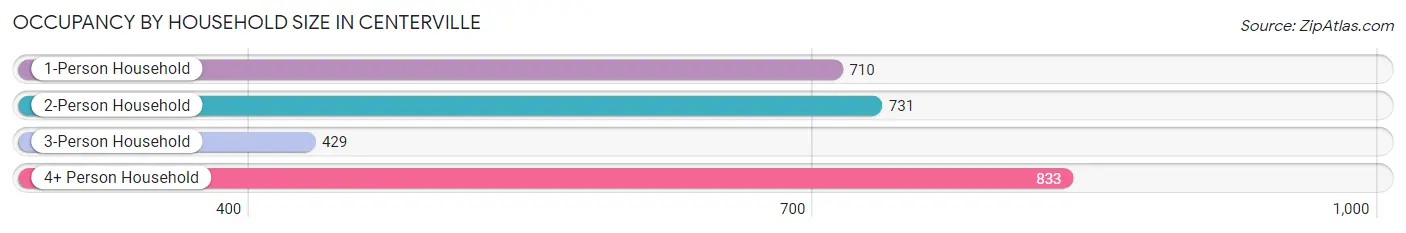
| Household Size | # Housing Units | % Housing Units |
| 1-Person Household | 710 | 26.3% |
| 2-Person Household | 731 | 27.0% |
| 3-Person Household | 429 | 15.9% |
| 4+ Person Household | 833 | 30.8% |
| Total Housing Units | 2,703 | 100.0% |
Occupancy by Ownership by Household Size in Centerville
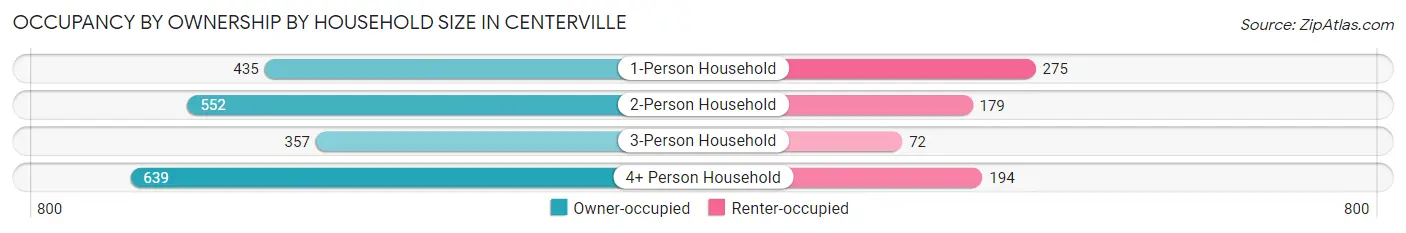
| Household Size | Owner-occupied | Renter-occupied |
| 1-Person Household | 435 (61.3%) | 275 (38.7%) |
| 2-Person Household | 552 (75.5%) | 179 (24.5%) |
| 3-Person Household | 357 (83.2%) | 72 (16.8%) |
| 4+ Person Household | 639 (76.7%) | 194 (23.3%) |
| Total Housing Units | 1,983 (73.4%) | 720 (26.6%) |
Occupancy by Educational Attainment in Centerville
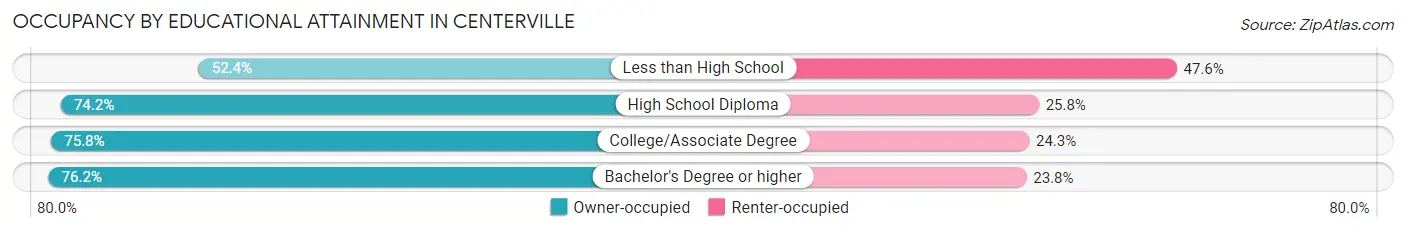
| Household Size | Owner-occupied | Renter-occupied |
| Less than High School | 133 (52.4%) | 121 (47.6%) |
| High School Diploma | 452 (74.2%) | 157 (25.8%) |
| College/Associate Degree | 656 (75.7%) | 210 (24.2%) |
| Bachelor's Degree or higher | 742 (76.2%) | 232 (23.8%) |
Occupancy by Age of Householder in Centerville
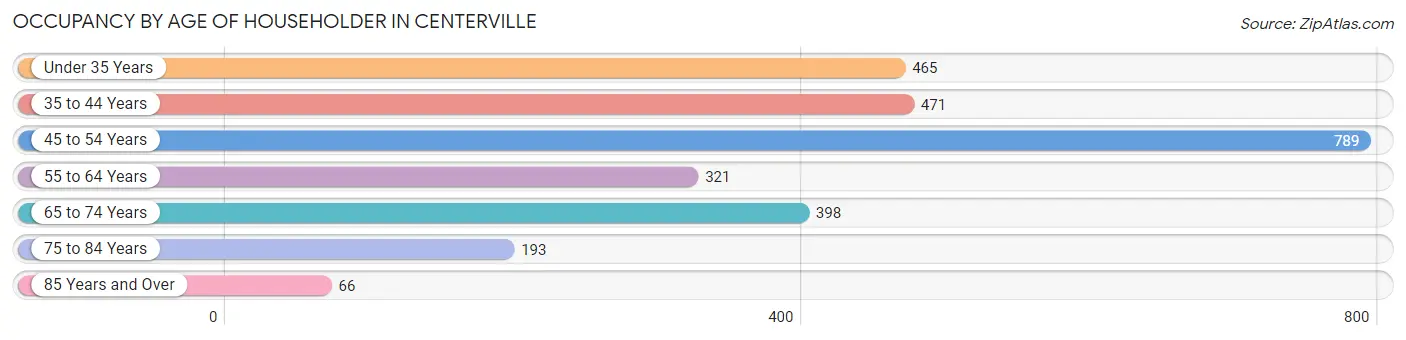
| Age Bracket | # Households | % Households |
| Under 35 Years | 465 | 17.2% |
| 35 to 44 Years | 471 | 17.4% |
| 45 to 54 Years | 789 | 29.2% |
| 55 to 64 Years | 321 | 11.9% |
| 65 to 74 Years | 398 | 14.7% |
| 75 to 84 Years | 193 | 7.1% |
| 85 Years and Over | 66 | 2.4% |
| Total | 2,703 | 100.0% |
Housing Finances in Centerville
Median Income by Occupancy in Centerville
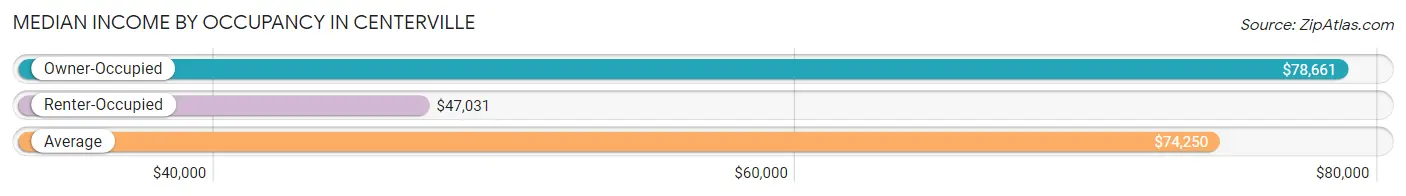
| Occupancy Type | # Households | Median Income |
| Owner-Occupied | 1,983 (73.4%) | $78,661 |
| Renter-Occupied | 720 (26.6%) | $47,031 |
| Average | 2,703 (100.0%) | $74,250 |
Occupancy by Householder Income Bracket in Centerville
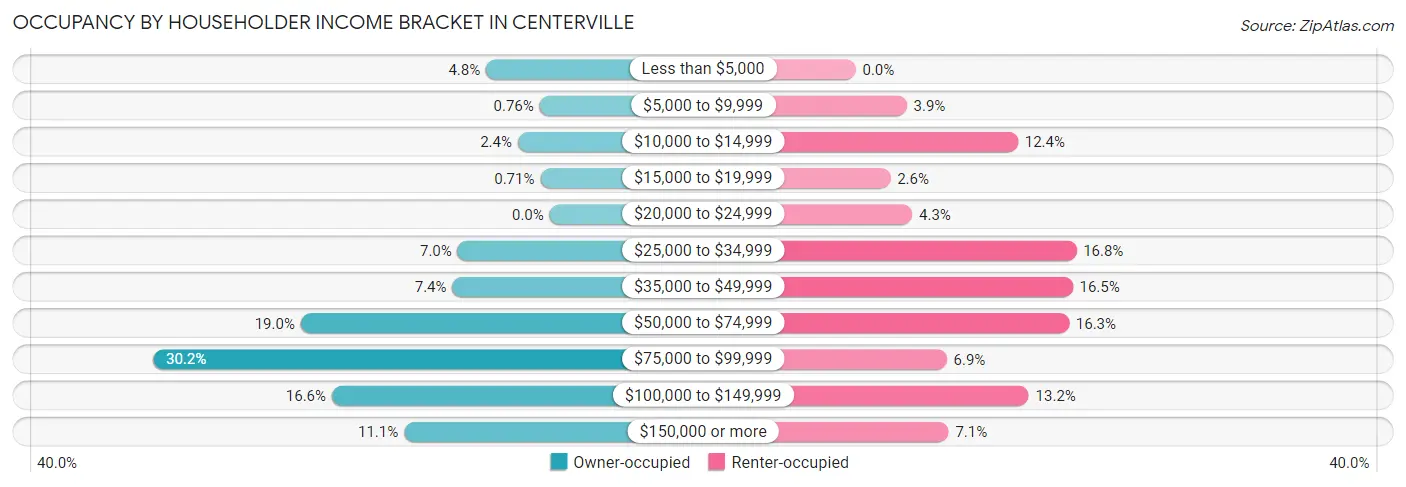
| Income Bracket | Owner-occupied | Renter-occupied |
| Less than $5,000 | 96 (4.8%) | 0 (0.0%) |
| $5,000 to $9,999 | 15 (0.8%) | 28 (3.9%) |
| $10,000 to $14,999 | 48 (2.4%) | 89 (12.4%) |
| $15,000 to $19,999 | 14 (0.7%) | 19 (2.6%) |
| $20,000 to $24,999 | 0 (0.0%) | 31 (4.3%) |
| $25,000 to $34,999 | 139 (7.0%) | 121 (16.8%) |
| $35,000 to $49,999 | 147 (7.4%) | 119 (16.5%) |
| $50,000 to $74,999 | 376 (19.0%) | 117 (16.3%) |
| $75,000 to $99,999 | 599 (30.2%) | 50 (6.9%) |
| $100,000 to $149,999 | 329 (16.6%) | 95 (13.2%) |
| $150,000 or more | 220 (11.1%) | 51 (7.1%) |
| Total | 1,983 (100.0%) | 720 (100.0%) |
Monthly Housing Cost Tiers in Centerville
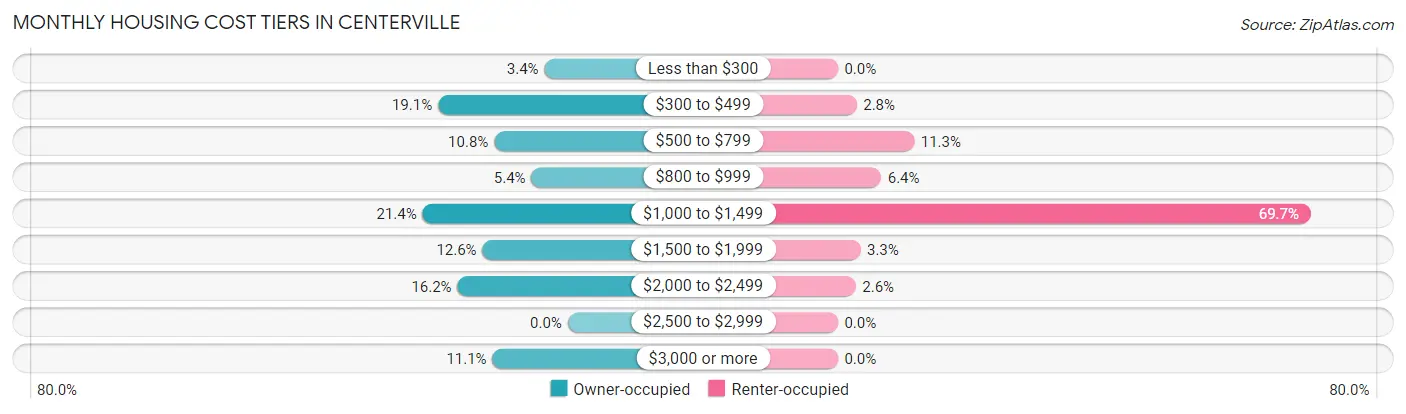
| Monthly Cost | Owner-occupied | Renter-occupied |
| Less than $300 | 68 (3.4%) | 0 (0.0%) |
| $300 to $499 | 379 (19.1%) | 20 (2.8%) |
| $500 to $799 | 215 (10.8%) | 81 (11.3%) |
| $800 to $999 | 106 (5.3%) | 46 (6.4%) |
| $1,000 to $1,499 | 424 (21.4%) | 502 (69.7%) |
| $1,500 to $1,999 | 249 (12.6%) | 24 (3.3%) |
| $2,000 to $2,499 | 322 (16.2%) | 19 (2.6%) |
| $2,500 to $2,999 | 0 (0.0%) | 0 (0.0%) |
| $3,000 or more | 220 (11.1%) | 0 (0.0%) |
| Total | 1,983 (100.0%) | 720 (100.0%) |
Physical Housing Characteristics in Centerville
Housing Structures in Centerville
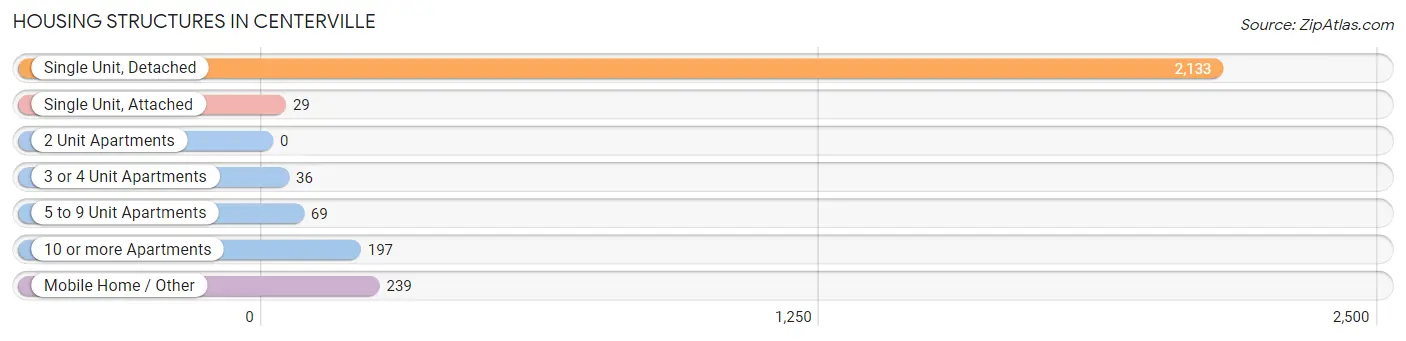
| Structure Type | # Housing Units | % Housing Units |
| Single Unit, Detached | 2,133 | 78.9% |
| Single Unit, Attached | 29 | 1.1% |
| 2 Unit Apartments | 0 | 0.0% |
| 3 or 4 Unit Apartments | 36 | 1.3% |
| 5 to 9 Unit Apartments | 69 | 2.5% |
| 10 or more Apartments | 197 | 7.3% |
| Mobile Home / Other | 239 | 8.8% |
| Total | 2,703 | 100.0% |
Housing Structures by Occupancy in Centerville
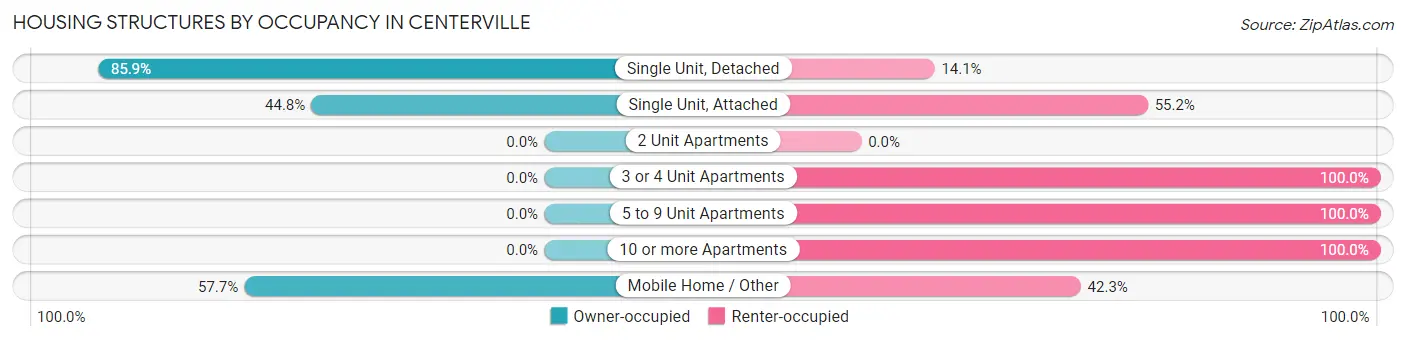
| Structure Type | Owner-occupied | Renter-occupied |
| Single Unit, Detached | 1,832 (85.9%) | 301 (14.1%) |
| Single Unit, Attached | 13 (44.8%) | 16 (55.2%) |
| 2 Unit Apartments | 0 (0.0%) | 0 (0.0%) |
| 3 or 4 Unit Apartments | 0 (0.0%) | 36 (100.0%) |
| 5 to 9 Unit Apartments | 0 (0.0%) | 69 (100.0%) |
| 10 or more Apartments | 0 (0.0%) | 197 (100.0%) |
| Mobile Home / Other | 138 (57.7%) | 101 (42.3%) |
| Total | 1,983 (73.4%) | 720 (26.6%) |
Housing Structures by Number of Rooms in Centerville
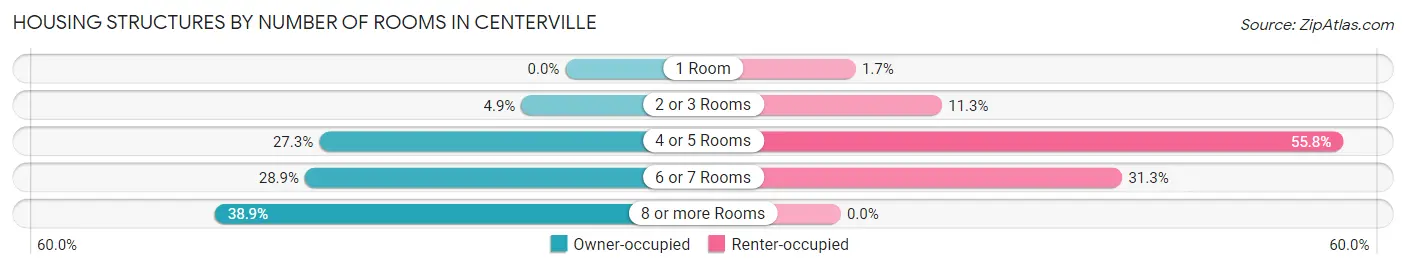
| Number of Rooms | Owner-occupied | Renter-occupied |
| 1 Room | 0 (0.0%) | 12 (1.7%) |
| 2 or 3 Rooms | 97 (4.9%) | 81 (11.3%) |
| 4 or 5 Rooms | 542 (27.3%) | 402 (55.8%) |
| 6 or 7 Rooms | 573 (28.9%) | 225 (31.2%) |
| 8 or more Rooms | 771 (38.9%) | 0 (0.0%) |
| Total | 1,983 (100.0%) | 720 (100.0%) |
Housing Structure by Heating Type in Centerville
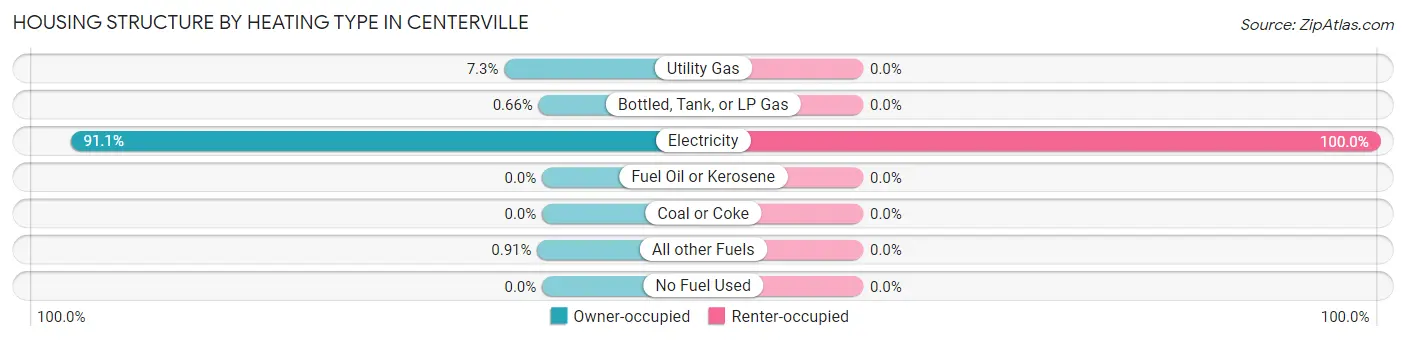
| Heating Type | Owner-occupied | Renter-occupied |
| Utility Gas | 145 (7.3%) | 0 (0.0%) |
| Bottled, Tank, or LP Gas | 13 (0.7%) | 0 (0.0%) |
| Electricity | 1,807 (91.1%) | 720 (100.0%) |
| Fuel Oil or Kerosene | 0 (0.0%) | 0 (0.0%) |
| Coal or Coke | 0 (0.0%) | 0 (0.0%) |
| All other Fuels | 18 (0.9%) | 0 (0.0%) |
| No Fuel Used | 0 (0.0%) | 0 (0.0%) |
| Total | 1,983 (100.0%) | 720 (100.0%) |
Household Vehicle Usage in Centerville
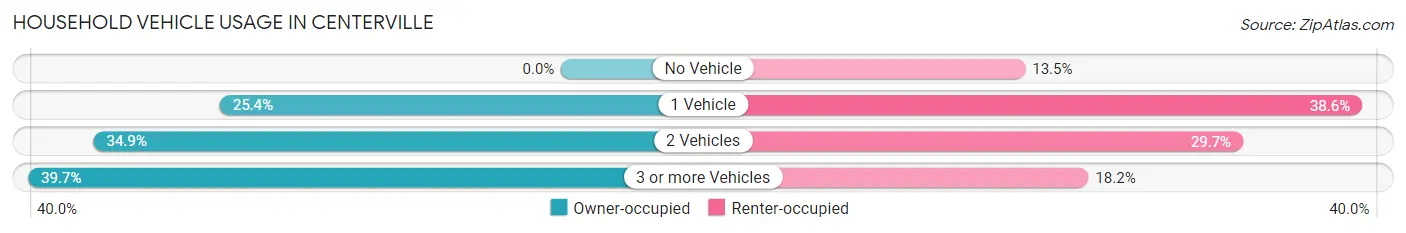
| Vehicles per Household | Owner-occupied | Renter-occupied |
| No Vehicle | 0 (0.0%) | 97 (13.5%) |
| 1 Vehicle | 504 (25.4%) | 278 (38.6%) |
| 2 Vehicles | 691 (34.8%) | 214 (29.7%) |
| 3 or more Vehicles | 788 (39.7%) | 131 (18.2%) |
| Total | 1,983 (100.0%) | 720 (100.0%) |
Real Estate & Mortgages in Centerville
Real Estate and Mortgage Overview in Centerville
| Characteristic | Without Mortgage | With Mortgage |
| Housing Units | 643 | 1,340 |
| Median Property Value | $176,200 | $197,600 |
| Median Household Income | $72,176 | $133 |
| Monthly Housing Costs | $454 | $220 |
| Real Estate Taxes | $1,361 | $20 |
Property Value by Mortgage Status in Centerville
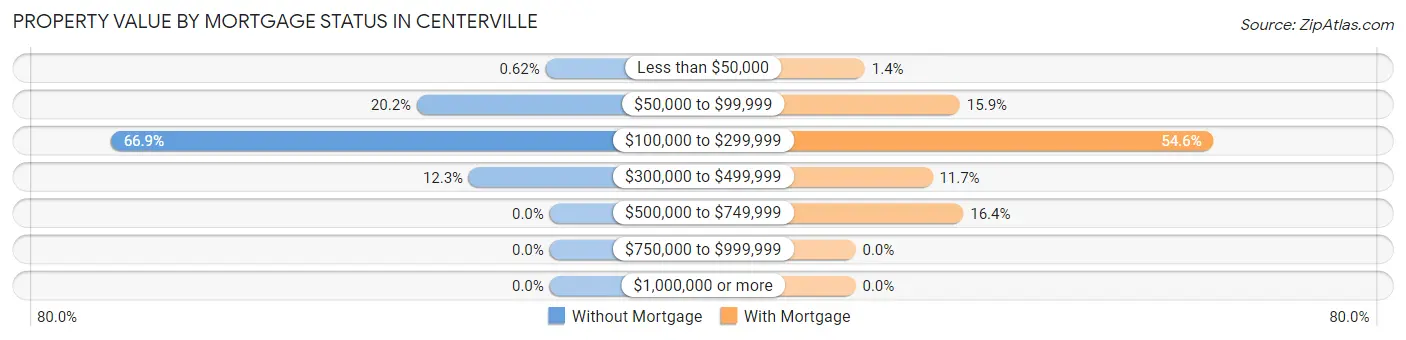
| Property Value | Without Mortgage | With Mortgage |
| Less than $50,000 | 4 (0.6%) | 19 (1.4%) |
| $50,000 to $99,999 | 130 (20.2%) | 213 (15.9%) |
| $100,000 to $299,999 | 430 (66.9%) | 731 (54.5%) |
| $300,000 to $499,999 | 79 (12.3%) | 157 (11.7%) |
| $500,000 to $749,999 | 0 (0.0%) | 220 (16.4%) |
| $750,000 to $999,999 | 0 (0.0%) | 0 (0.0%) |
| $1,000,000 or more | 0 (0.0%) | 0 (0.0%) |
| Total | 643 (100.0%) | 1,340 (100.0%) |
Household Income by Mortgage Status in Centerville
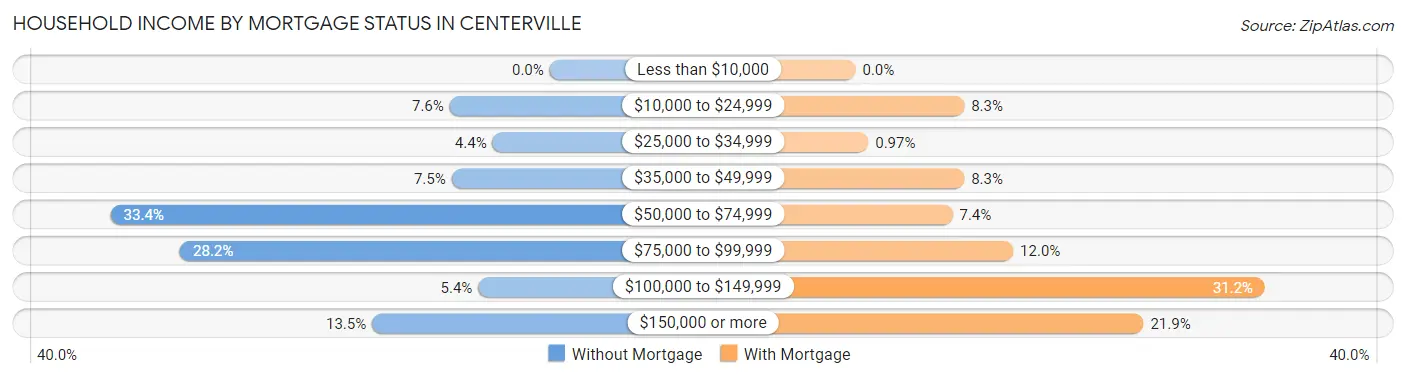
| Household Income | Without Mortgage | With Mortgage |
| Less than $10,000 | 0 (0.0%) | 0 (0.0%) |
| $10,000 to $24,999 | 49 (7.6%) | 111 (8.3%) |
| $25,000 to $34,999 | 28 (4.3%) | 13 (1.0%) |
| $35,000 to $49,999 | 48 (7.5%) | 111 (8.3%) |
| $50,000 to $74,999 | 215 (33.4%) | 99 (7.4%) |
| $75,000 to $99,999 | 181 (28.1%) | 161 (12.0%) |
| $100,000 to $149,999 | 35 (5.4%) | 418 (31.2%) |
| $150,000 or more | 87 (13.5%) | 294 (21.9%) |
| Total | 643 (100.0%) | 1,340 (100.0%) |
Property Value to Household Income Ratio in Centerville
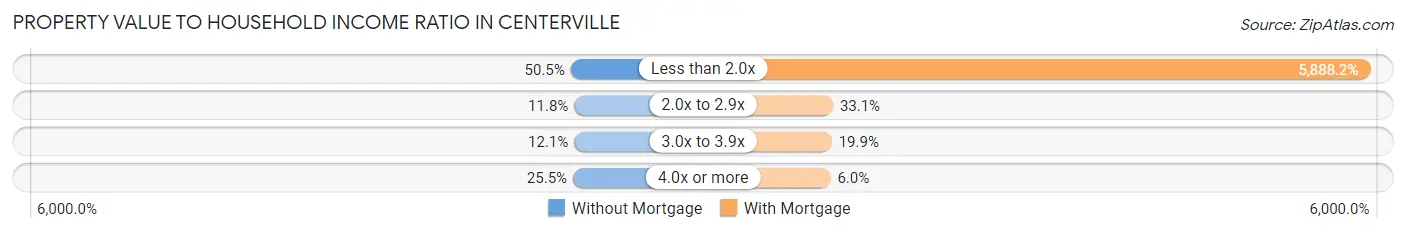
| Value-to-Income Ratio | Without Mortgage | With Mortgage |
| Less than 2.0x | 325 (50.5%) | 78,902 (5,888.2%) |
| 2.0x to 2.9x | 76 (11.8%) | 444 (33.1%) |
| 3.0x to 3.9x | 78 (12.1%) | 266 (19.9%) |
| 4.0x or more | 164 (25.5%) | 80 (6.0%) |
| Total | 643 (100.0%) | 1,340 (100.0%) |
Real Estate Taxes by Mortgage Status in Centerville

| Property Taxes | Without Mortgage | With Mortgage |
| Less than $800 | 119 (18.5%) | 89 (6.6%) |
| $800 to $1,499 | 252 (39.2%) | 179 (13.4%) |
| $800 to $1,499 | 245 (38.1%) | 274 (20.4%) |
| Total | 643 (100.0%) | 1,340 (100.0%) |
Health & Disability in Centerville
Health Insurance Coverage by Age in Centerville
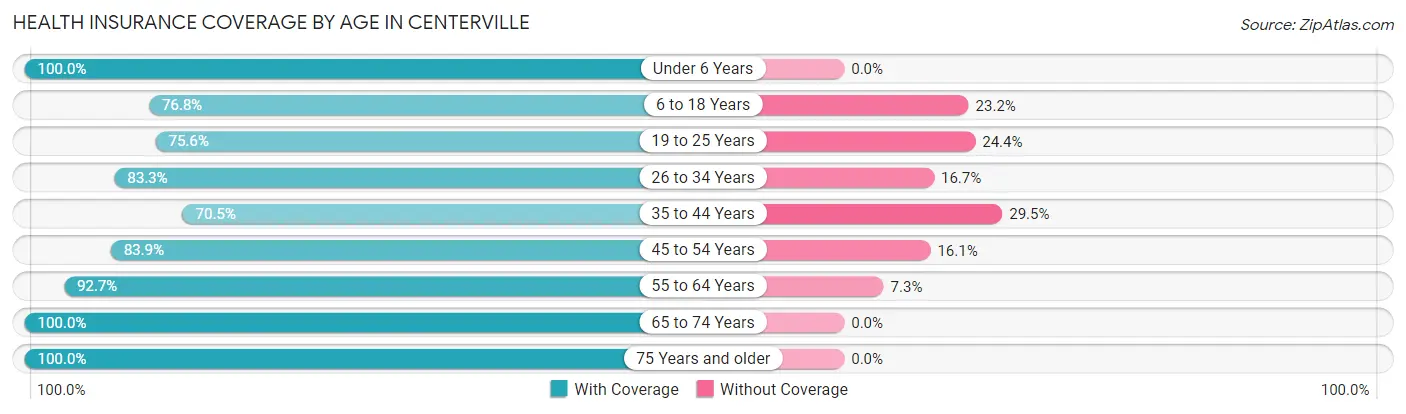
| Age Bracket | With Coverage | Without Coverage |
| Under 6 Years | 238 (100.0%) | 0 (0.0%) |
| 6 to 18 Years | 1,765 (76.8%) | 533 (23.2%) |
| 19 to 25 Years | 495 (75.6%) | 160 (24.4%) |
| 26 to 34 Years | 746 (83.3%) | 150 (16.7%) |
| 35 to 44 Years | 833 (70.5%) | 348 (29.5%) |
| 45 to 54 Years | 867 (83.9%) | 166 (16.1%) |
| 55 to 64 Years | 619 (92.7%) | 49 (7.3%) |
| 65 to 74 Years | 798 (100.0%) | 0 (0.0%) |
| 75 Years and older | 374 (100.0%) | 0 (0.0%) |
| Total | 6,735 (82.7%) | 1,406 (17.3%) |
Health Insurance Coverage by Citizenship Status in Centerville

| Citizenship Status | With Coverage | Without Coverage |
| Native Born | 238 (100.0%) | 0 (0.0%) |
| Foreign Born, Citizen | 1,765 (76.8%) | 533 (23.2%) |
| Foreign Born, not a Citizen | 495 (75.6%) | 160 (24.4%) |
Health Insurance Coverage by Household Income in Centerville
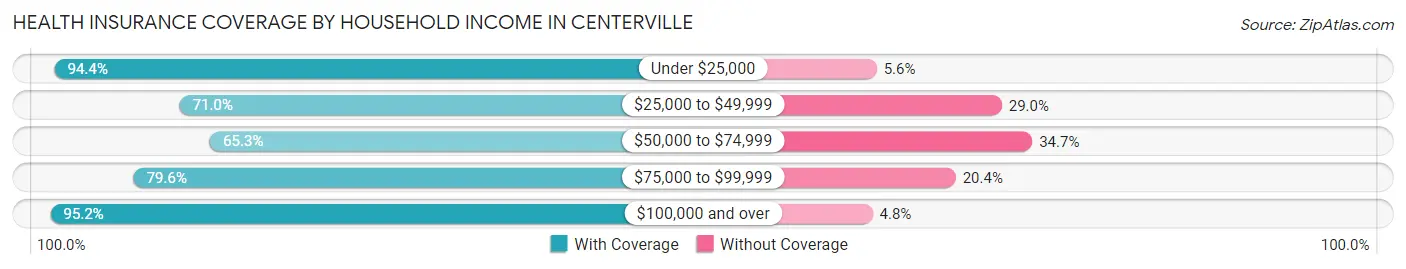
| Household Income | With Coverage | Without Coverage |
| Under $25,000 | 1,059 (94.4%) | 63 (5.6%) |
| $25,000 to $49,999 | 760 (71.0%) | 311 (29.0%) |
| $50,000 to $74,999 | 682 (65.3%) | 363 (34.7%) |
| $75,000 to $99,999 | 2,207 (79.6%) | 566 (20.4%) |
| $100,000 and over | 2,027 (95.2%) | 103 (4.8%) |
Public vs Private Health Insurance Coverage by Age in Centerville
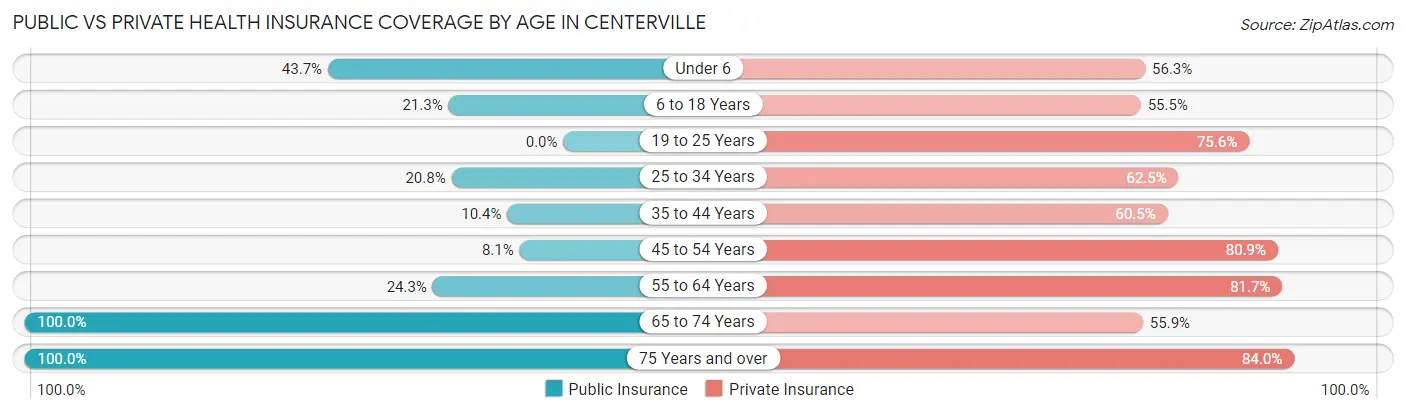
| Age Bracket | Public Insurance | Private Insurance |
| Under 6 | 104 (43.7%) | 134 (56.3%) |
| 6 to 18 Years | 490 (21.3%) | 1,275 (55.5%) |
| 19 to 25 Years | 0 (0.0%) | 495 (75.6%) |
| 25 to 34 Years | 186 (20.8%) | 560 (62.5%) |
| 35 to 44 Years | 123 (10.4%) | 714 (60.5%) |
| 45 to 54 Years | 84 (8.1%) | 836 (80.9%) |
| 55 to 64 Years | 162 (24.2%) | 546 (81.7%) |
| 65 to 74 Years | 798 (100.0%) | 446 (55.9%) |
| 75 Years and over | 374 (100.0%) | 314 (84.0%) |
| Total | 2,321 (28.5%) | 5,320 (65.3%) |
Disability Status by Sex by Age in Centerville
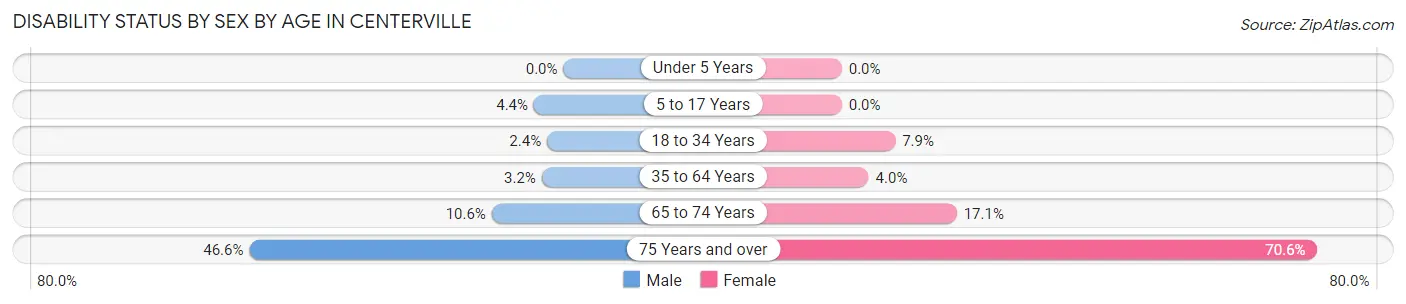
| Age Bracket | Male | Female |
| Under 5 Years | 0 (0.0%) | 0 (0.0%) |
| 5 to 17 Years | 56 (4.4%) | 0 (0.0%) |
| 18 to 34 Years | 13 (2.4%) | 89 (7.9%) |
| 35 to 64 Years | 46 (3.2%) | 58 (4.0%) |
| 65 to 74 Years | 50 (10.6%) | 56 (17.1%) |
| 75 Years and over | 76 (46.6%) | 149 (70.6%) |
Disability Class by Sex by Age in Centerville
Disability Class: Hearing Difficulty
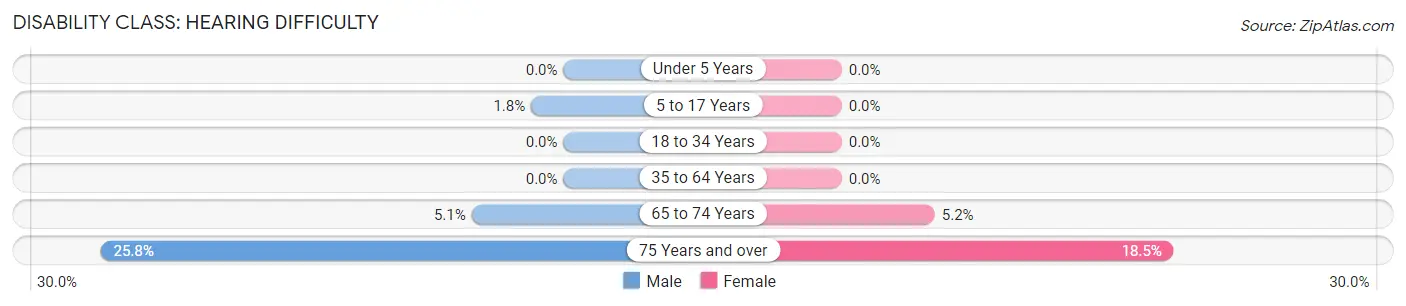
| Age Bracket | Male | Female |
| Under 5 Years | 0 (0.0%) | 0 (0.0%) |
| 5 to 17 Years | 23 (1.8%) | 0 (0.0%) |
| 18 to 34 Years | 0 (0.0%) | 0 (0.0%) |
| 35 to 64 Years | 0 (0.0%) | 0 (0.0%) |
| 65 to 74 Years | 24 (5.1%) | 17 (5.2%) |
| 75 Years and over | 42 (25.8%) | 39 (18.5%) |
Disability Class: Vision Difficulty
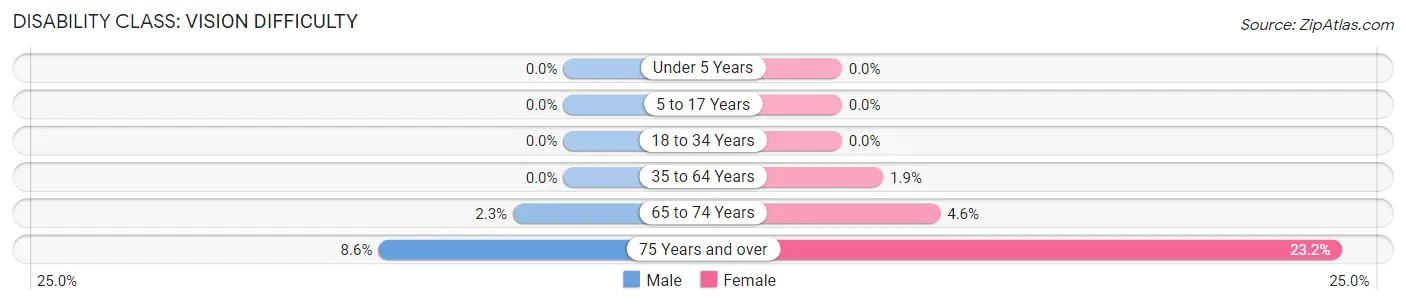
| Age Bracket | Male | Female |
| Under 5 Years | 0 (0.0%) | 0 (0.0%) |
| 5 to 17 Years | 0 (0.0%) | 0 (0.0%) |
| 18 to 34 Years | 0 (0.0%) | 0 (0.0%) |
| 35 to 64 Years | 0 (0.0%) | 28 (1.9%) |
| 65 to 74 Years | 11 (2.3%) | 15 (4.6%) |
| 75 Years and over | 14 (8.6%) | 49 (23.2%) |
Disability Class: Cognitive Difficulty
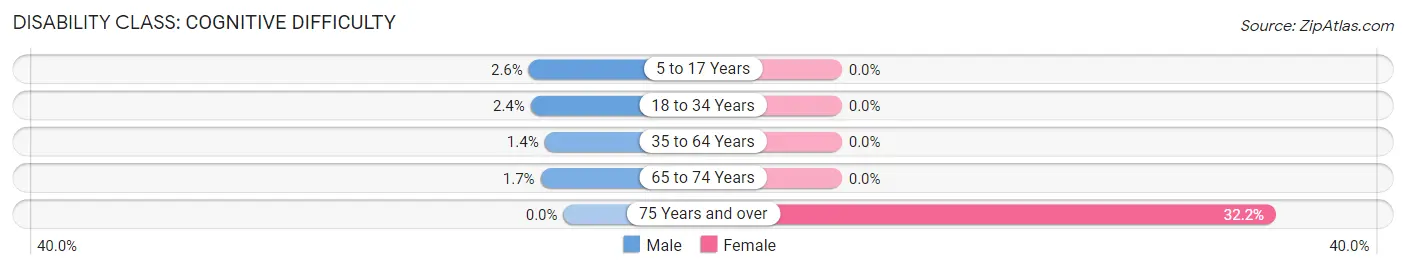
| Age Bracket | Male | Female |
| 5 to 17 Years | 33 (2.6%) | 0 (0.0%) |
| 18 to 34 Years | 13 (2.4%) | 0 (0.0%) |
| 35 to 64 Years | 20 (1.4%) | 0 (0.0%) |
| 65 to 74 Years | 8 (1.7%) | 0 (0.0%) |
| 75 Years and over | 0 (0.0%) | 68 (32.2%) |
Disability Class: Ambulatory Difficulty
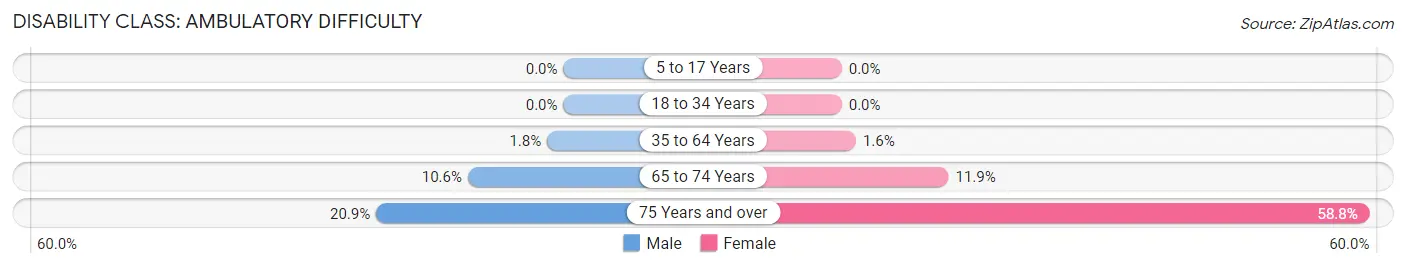
| Age Bracket | Male | Female |
| 5 to 17 Years | 0 (0.0%) | 0 (0.0%) |
| 18 to 34 Years | 0 (0.0%) | 0 (0.0%) |
| 35 to 64 Years | 26 (1.8%) | 23 (1.6%) |
| 65 to 74 Years | 50 (10.6%) | 39 (11.9%) |
| 75 Years and over | 34 (20.9%) | 124 (58.8%) |
Disability Class: Self-Care Difficulty
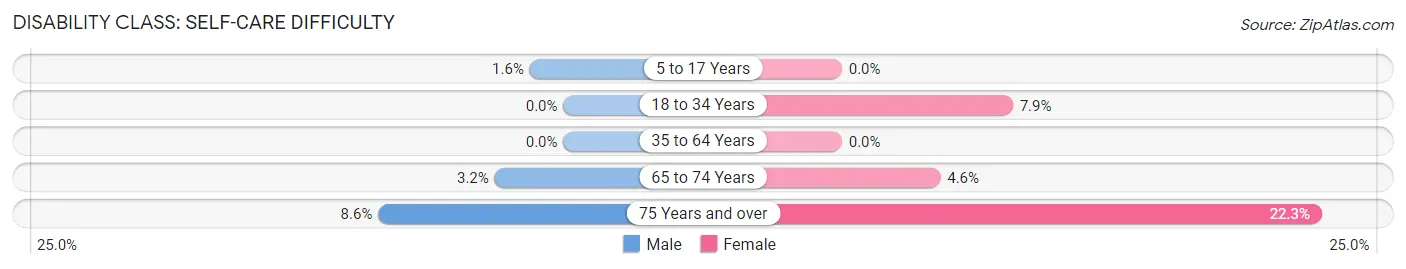
| Age Bracket | Male | Female |
| 5 to 17 Years | 20 (1.6%) | 0 (0.0%) |
| 18 to 34 Years | 0 (0.0%) | 89 (7.9%) |
| 35 to 64 Years | 0 (0.0%) | 0 (0.0%) |
| 65 to 74 Years | 15 (3.2%) | 15 (4.6%) |
| 75 Years and over | 14 (8.6%) | 47 (22.3%) |
Technology Access in Centerville
Computing Device Access in Centerville
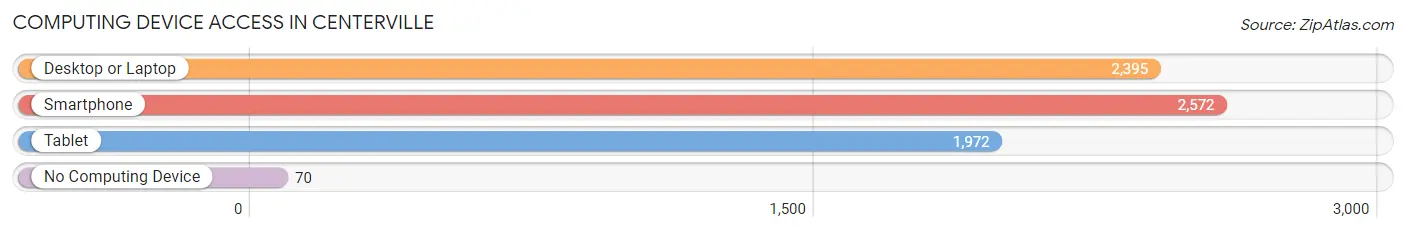
| Device Type | # Households | % Households |
| Desktop or Laptop | 2,395 | 88.6% |
| Smartphone | 2,572 | 95.2% |
| Tablet | 1,972 | 73.0% |
| No Computing Device | 70 | 2.6% |
| Total | 2,703 | 100.0% |
Internet Access in Centerville
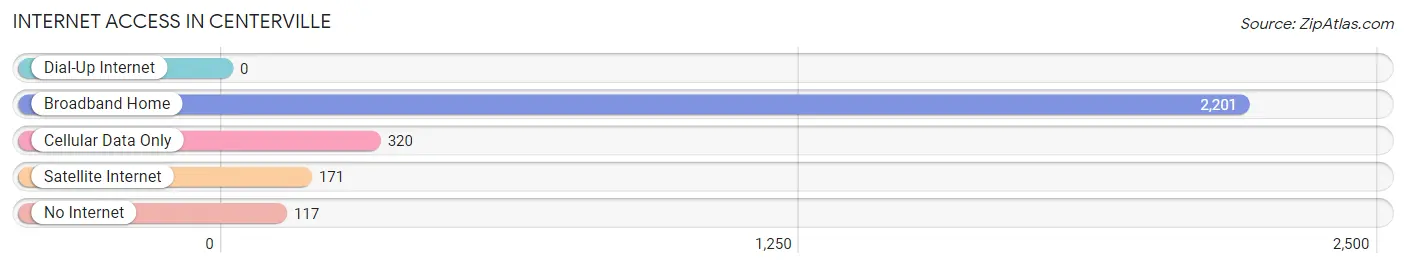
| Internet Type | # Households | % Households |
| Dial-Up Internet | 0 | 0.0% |
| Broadband Home | 2,201 | 81.4% |
| Cellular Data Only | 320 | 11.8% |
| Satellite Internet | 171 | 6.3% |
| No Internet | 117 | 4.3% |
| Total | 2,703 | 100.0% |
Centerville Summary
Centerville is a city located in Houston County, Georgia, United States. It is part of the Warner Robins, Georgia Metropolitan Statistical Area. The population was 8,845 at the 2010 census, up from 6,967 at the 2000 census.
History
Centerville was founded in 1821 as the county seat of Houston County. It was named for its central location in the county. The city was incorporated in 1871.
Geography
Centerville is located in the center of Houston County at 32°33'25" North, 83°45'17" West (32.556945, -83.754720). It is bordered to the north by Warner Robins, to the east by Perry, to the south by Bonaire, and to the west by Byron.
According to the United States Census Bureau, the city has a total area of 11.2sqmi, of which 11.1sqmi is land and 0.1sqmi (0.72%) is water.
Economy
Centerville is home to several large employers, including Robins Air Force Base, Houston Healthcare, and the Houston County Board of Education. The city also has a thriving retail sector, with several large shopping centers and numerous restaurants.
Demographics
As of the census of 2000, there were 6,967 people, 2,717 households, and 1,919 families residing in the city. The population density was 627.7 people per square mile (242.2/km^2). There were 2,945 housing units at an average density of 263.7 per square mile (101.7/km^2). The racial makeup of the city was 68.45% White, 28.17% African American, 0.37% Native American, 0.90% Asian, 0.02% Pacific Islander, 0.50% from other races, and 1.59% from two or more races. Hispanic or Latino of any race were 1.45% of the population.
There were 2,717 households, out of which 33.2% had children under the age of 18 living with them, 51.2% were married couples living together, 14.3% had a female householder with no husband present, and 30.7% were non-families. 26.2% of all households were made up of individuals, and 9.7% had someone living alone who was 65 years of age or older. The average household size was 2.54 and the average family size was 3.07.
In the city, the population was spread out, with 26.2% under the age of 18, 9.2% from 18 to 24, 30.2% from 25 to 44, 21.7% from 45 to 64, and 12.7% who were 65 years of age or older. The median age was 35 years. For every 100 females, there were 91.2 males. For every 100 females age 18 and over, there were 87.2 males.
The median income for a household in the city was $37,845, and the median income for a family was $45,945. Males had a median income of $32,813 versus $23,958 for females. The per capita income for the city was $18,945. About 8.2% of families and 10.3% of the population were below the poverty line, including 13.2% of those under age 18 and 10.2% of those age 65 or over.
Common Questions
What is the Total Population of Centerville?
Total Population of Centerville is 8,220.
What is the Total Male Population of Centerville?
Total Male Population of Centerville is 4,109.
What is the Total Female Population of Centerville?
Total Female Population of Centerville is 4,111.
What is the Ratio of Males per 100 Females in Centerville?
There are 99.95 Males per 100 Females in Centerville.
What is the Ratio of Females per 100 Males in Centerville?
There are 100.05 Females per 100 Males in Centerville.
What is the Median Population Age in Centerville?
Median Population Age in Centerville is 35.2 Years.
What is the Average Family Size in Centerville
Average Family Size in Centerville is 3.7 People.
What is the Average Household Size in Centerville
Average Household Size in Centerville is 3.0 People.
What is Per Capita Income in Centerville?
Per Capita income in Centerville is $26,988.
What is the Median Family Income in Centerville?
Median Family Income in Centerville is $78,173.
What is the Median Household income in Centerville?
Median Household Income in Centerville is $74,250.
What is Income or Wage Gap in Centerville?
Income or Wage Gap in Centerville is 22.3%.
Women in Centerville earn 77.7 cents for every dollar earned by a man.
What is Family Income Deficit in Centerville?
Family Income Deficit in Centerville is $14,301.
Families that are below poverty line in Centerville earn $14,301 less on average than the poverty threshold level.
What is Inequality or Gini Index in Centerville?
Inequality or Gini Index in Centerville is 0.37.
How Large is the Labor Force in Centerville?
There are 3,323 People in the Labor Forcein in Centerville.
What is the Percentage of People in the Labor Force in Centerville?
54.1% of People are in the Labor Force in Centerville.
What is the Unemployment Rate in Centerville?
Unemployment Rate in Centerville is 2.0%.