Ugandan vs Macedonian College, 1 year or more
COMPARE
Ugandan
Macedonian
College, 1 year or more
College, 1 year or more Comparison
Ugandans
Macedonians
61.2%
COLLEGE, 1 YEAR OR MORE
90.7/ 100
METRIC RATING
129th/ 347
METRIC RANK
61.8%
COLLEGE, 1 YEAR OR MORE
95.6/ 100
METRIC RATING
111th/ 347
METRIC RANK
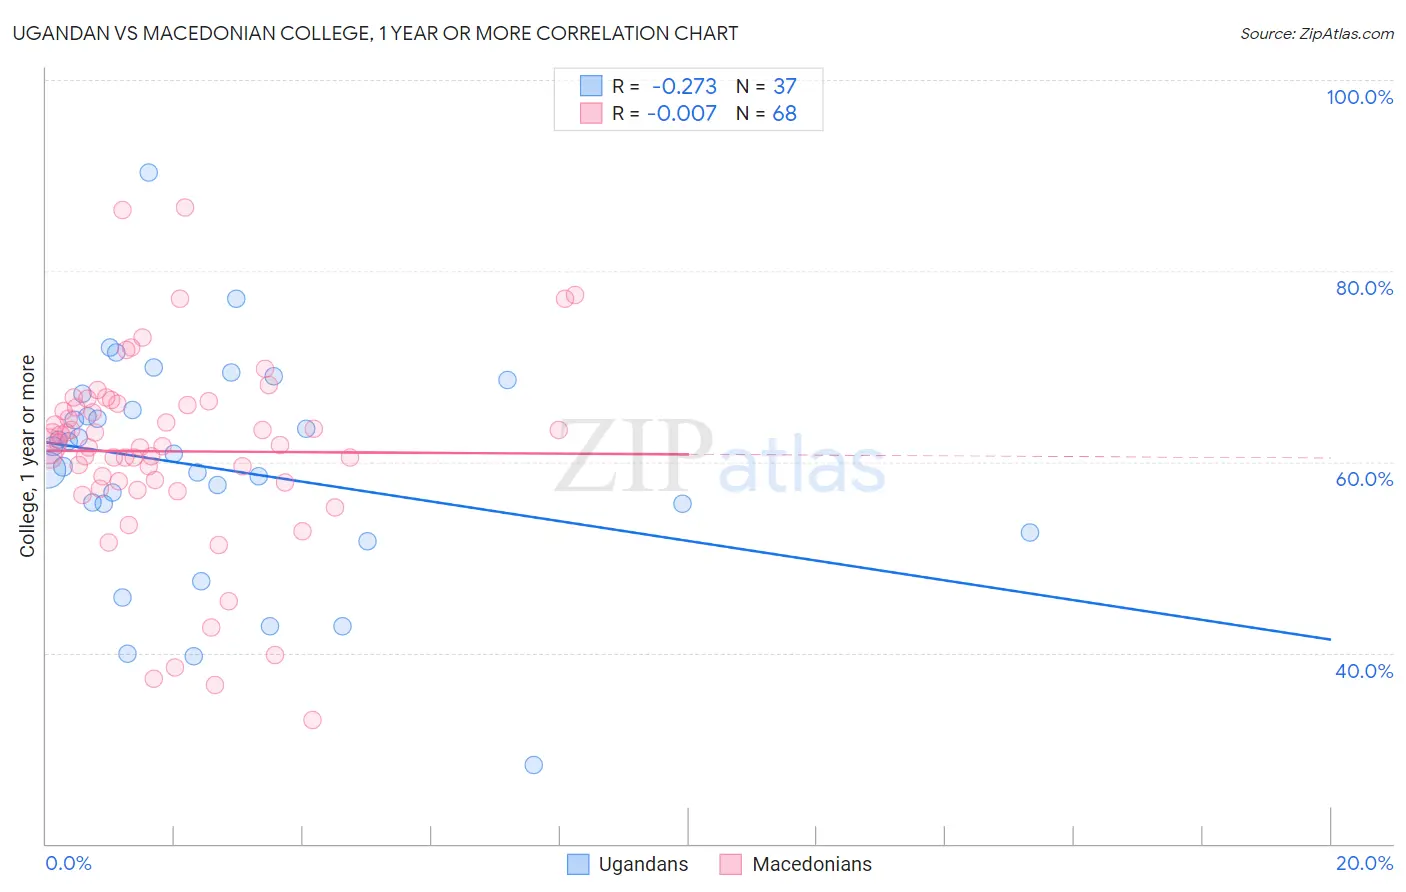
Ugandan vs Macedonian College, 1 year or more Correlation Chart
The statistical analysis conducted on geographies consisting of 94,018,576 people shows a weak negative correlation between the proportion of Ugandans and percentage of population with at least college, 1 year or more education in the United States with a correlation coefficient (R) of -0.273 and weighted average of 61.2%. Similarly, the statistical analysis conducted on geographies consisting of 132,646,607 people shows no correlation between the proportion of Macedonians and percentage of population with at least college, 1 year or more education in the United States with a correlation coefficient (R) of -0.007 and weighted average of 61.8%, a difference of 1.0%.
College, 1 year or more Correlation Summary
| Measurement | Ugandan | Macedonian |
| Minimum | 28.3% | 33.0% |
| Maximum | 90.3% | 86.6% |
| Range | 62.0% | 53.6% |
| Mean | 59.3% | 61.1% |
| Median | 60.9% | 61.7% |
| Interquartile 25% (IQ1) | 54.1% | 57.9% |
| Interquartile 75% (IQ3) | 66.3% | 66.0% |
| Interquartile Range (IQR) | 12.2% | 8.1% |
| Standard Deviation (Sample) | 11.7% | 10.1% |
| Standard Deviation (Population) | 11.6% | 10.1% |
Demographics Similar to Ugandans and Macedonians by College, 1 year or more
In terms of college, 1 year or more, the demographic groups most similar to Ugandans are Immigrants from Italy (61.2%, a difference of 0.060%), Immigrants from Eastern Africa (61.2%, a difference of 0.070%), Alsatian (61.3%, a difference of 0.090%), Immigrants from Syria (61.3%, a difference of 0.14%), and Italian (61.1%, a difference of 0.18%). Similarly, the demographic groups most similar to Macedonians are European (61.8%, a difference of 0.0%), Austrian (61.8%, a difference of 0.060%), Ukrainian (61.8%, a difference of 0.13%), Danish (61.7%, a difference of 0.24%), and Norwegian (61.7%, a difference of 0.31%).
| Demographics | Rating | Rank | College, 1 year or more |
| Europeans | 95.6 /100 | #110 | Exceptional 61.8% |
| Macedonians | 95.6 /100 | #111 | Exceptional 61.8% |
| Austrians | 95.4 /100 | #112 | Exceptional 61.8% |
| Ukrainians | 95.2 /100 | #113 | Exceptional 61.8% |
| Danes | 94.8 /100 | #114 | Exceptional 61.7% |
| Norwegians | 94.5 /100 | #115 | Exceptional 61.7% |
| Lebanese | 94.1 /100 | #116 | Exceptional 61.6% |
| Arabs | 93.9 /100 | #117 | Exceptional 61.6% |
| Immigrants | Brazil | 93.9 /100 | #118 | Exceptional 61.6% |
| Assyrians/Chaldeans/Syriacs | 93.3 /100 | #119 | Exceptional 61.5% |
| Pakistanis | 93.2 /100 | #120 | Exceptional 61.5% |
| Immigrants | Jordan | 92.7 /100 | #121 | Exceptional 61.4% |
| Immigrants | Chile | 92.3 /100 | #122 | Exceptional 61.4% |
| Serbians | 92.2 /100 | #123 | Exceptional 61.4% |
| Venezuelans | 92.1 /100 | #124 | Exceptional 61.3% |
| Immigrants | Syria | 91.6 /100 | #125 | Exceptional 61.3% |
| Alsatians | 91.3 /100 | #126 | Exceptional 61.3% |
| Immigrants | Eastern Africa | 91.1 /100 | #127 | Exceptional 61.2% |
| Immigrants | Italy | 91.1 /100 | #128 | Exceptional 61.2% |
| Ugandans | 90.7 /100 | #129 | Exceptional 61.2% |
| Italians | 89.5 /100 | #130 | Excellent 61.1% |