Cities with the Highest Percentage of Immigrants from Ireland in Connecticut

RELATED REPORTS & OPTIONS

Ireland
Population
Families and Households
Female Fertility
Female Fertility (Unmarried)
Race (Community Size)
Race (Percentage)
Ancestry (Community Size)
AfghanAfricanAlaska NativeAlaskan AthabascanAlbanianAleutAlsatianAmericanApacheArabArapahoArgentineanArmenianAssyrian / Chaldean / SyriacAustralianAustrianBahamianBangladeshiBarbadianBasqueBelgianBelizeanBermudanBhutaneseBlackfeetBolivianBrazilianBritishBritish West IndianBulgarianBurmeseCajunCambodianCanadianCape VerdeanCarpatho RusynCelticCentral AmericanCentral American IndianCherokeeCheyenneChickasawChileanChineseChippewaChoctawColombianColvilleComancheCosta RicanCreeCreekCroatianCrowCubanCypriotCzechCzechoslovakianDanishDelawareDominicanDutchDutch West IndianEastern EuropeanEcuadorianEgyptianEnglishEstonianEthiopianEuropeanFijianFilipinoFinnishFrenchFrench American IndianFrench CanadianGermanGerman RussianGhanaianGreekGuamanian / ChamorroGuatemalanGuyaneseHaitianHmongHonduranHopiHoumaHungarianIcelanderIndian (Asian)IndonesianInupiatIranianIraqiIrishIroquoisIsraeliItalianJamaicanJapaneseJordanianKenyanKiowaKoreanLaotianLatvianLebaneseLiberianLithuanianLumbeeLuxembourgerMacedonianMalaysianMalteseMarshalleseMenomineeMexicanMexican American IndianMongolianMoroccanNative HawaiianNavajoNepaleseNew ZealanderNicaraguanNigerianNorthern EuropeanNorwegianOkinawanOsageOttawaPaiutePakistaniPalestinianPanamanianParaguayanPennsylvania GermanPeruvianPimaPolishPortuguesePotawatomiPuebloPuerto RicanPuget Sound SalishRomanianRussianSalvadoranSamoanScandinavianScotch-IrishScottishSeminoleSenegaleseSerbianShoshoneSierra LeoneanSiouxSlavicSlovakSloveneSomaliSouth AfricanSouth AmericanSouth American IndianSoviet UnionSpaniardSpanishSpanish AmericanSpanish American IndianSri LankanSubsaharan AfricanSudaneseSwedishSwissSyrianTaiwaneseThaiTlingit-HaidaTohono O'OdhamTonganTrinidadian and TobagonianTsimshianTurkishU.S. Virgin IslanderUgandanUkrainianUruguayanUteVenezuelanVietnameseWelshWest IndianYakamaYaquiYugoslavianYumanYup'ikZimbabwean
Ancestry (Percentage)
AfghanAfricanAlaska NativeAlaskan AthabascanAlbanianAleutAlsatianAmericanApacheArabArapahoArgentineanArmenianAssyrian / Chaldean / SyriacAustralianAustrianBahamianBangladeshiBarbadianBasqueBelgianBelizeanBermudanBhutaneseBlackfeetBolivianBrazilianBritishBritish West IndianBulgarianBurmeseCajunCambodianCanadianCape VerdeanCarpatho RusynCelticCentral AmericanCentral American IndianCherokeeCheyenneChickasawChileanChineseChippewaChoctawColombianColvilleComancheCosta RicanCreeCreekCroatianCrowCubanCypriotCzechCzechoslovakianDanishDelawareDominicanDutchDutch West IndianEastern EuropeanEcuadorianEgyptianEnglishEstonianEthiopianEuropeanFijianFilipinoFinnishFrenchFrench American IndianFrench CanadianGermanGerman RussianGhanaianGreekGuamanian / ChamorroGuatemalanGuyaneseHaitianHmongHonduranHopiHoumaHungarianIcelanderIndian (Asian)IndonesianInupiatIranianIraqiIrishIroquoisIsraeliItalianJamaicanJapaneseJordanianKenyanKiowaKoreanLaotianLatvianLebaneseLiberianLithuanianLumbeeLuxembourgerMacedonianMalaysianMalteseMarshalleseMenomineeMexicanMexican American IndianMongolianMoroccanNative HawaiianNavajoNepaleseNew ZealanderNicaraguanNigerianNorthern EuropeanNorwegianOkinawanOsageOttawaPaiutePakistaniPalestinianPanamanianParaguayanPennsylvania GermanPeruvianPimaPolishPortuguesePotawatomiPuebloPuerto RicanPuget Sound SalishRomanianRussianSalvadoranSamoanScandinavianScotch-IrishScottishSeminoleSenegaleseSerbianShoshoneSierra LeoneanSiouxSlavicSlovakSloveneSomaliSouth AfricanSouth AmericanSouth American IndianSoviet UnionSpaniardSpanishSpanish AmericanSpanish American IndianSri LankanSubsaharan AfricanSudaneseSwedishSwissSyrianTaiwaneseThaiTlingit-HaidaTohono O'OdhamTonganTrinidadian and TobagonianTsimshianTurkishU.S. Virgin IslanderUgandanUkrainianUruguayanUteVenezuelanVietnameseWelshWest IndianYakamaYaquiYugoslavianYumanYup'ikZimbabwean
Immigrant Origin (Total)
AfghanistanAfricaAlbaniaArgentinaArmeniaAsiaAustraliaAustriaAzoresBahamasBangladeshBarbadosBelarusBelgiumBelizeBoliviaBosnia and HerzegovinaBrazilBulgariaBurma / MyanmarCabo VerdeCambodiaCameroonCanadaCaribbeanCentral AmericaChileChinaColombiaCongoCosta RicaCroatiaCubaCzechoslovakiaDenmarkDominicaDominican RepublicEastern AfricaEastern AsiaEastern EuropeEcuadorEgyptEl SalvadorEnglandEritreaEthiopiaEuropeFijiFranceGermanyGhanaGreeceGrenadaGuatemalaGuyanaHaitiHondurasHong KongHungaryIndiaIndonesiaIranIraqIrelandIsraelItalyJamaicaJapanJordanKazakhstanKenyaKoreaKuwaitLaosLatin AmericaLatviaLebanonLiberiaLithuaniaMalaysiaMexicoMicronesiaMiddle AfricaMoldovaMoroccoNepalNetherlandsNicaraguaNigeriaNorth MacedoniaNorthern AfricaNorthern EuropeNorwayOceaniaPakistanPanamaPeruPhilippinesPolandPortugalRomaniaRussiaSaudi ArabiaScotlandSenegalSerbiaSierra LeoneSingaporeSomaliaSouth AfricaSouth AmericaSouth Central AsiaSouth Eastern AsiaSouthern EuropeSpainSri LankaSt. Vincent and the GrenadinesSudanSwedenSwitzerlandSyriaTaiwanThailandTrinidad and TobagoTurkeyUgandaUkraineUruguayUzbekistanVenezuelaVietnamWest IndiesWestern AfricaWestern AsiaWestern EuropeYemenZaireZimbabwe
Immigrant Origin (Percentage)
AfghanistanAfricaAlbaniaArgentinaArmeniaAsiaAustraliaAustriaAzoresBahamasBangladeshBarbadosBelarusBelgiumBelizeBoliviaBosnia and HerzegovinaBrazilBulgariaBurma / MyanmarCabo VerdeCambodiaCameroonCanadaCaribbeanCentral AmericaChileChinaColombiaCongoCosta RicaCroatiaCubaCzechoslovakiaDenmarkDominicaDominican RepublicEastern AfricaEastern AsiaEastern EuropeEcuadorEgyptEl SalvadorEnglandEritreaEthiopiaEuropeFijiFranceGermanyGhanaGreeceGrenadaGuatemalaGuyanaHaitiHondurasHong KongHungaryIndiaIndonesiaIranIraqIrelandIsraelItalyJamaicaJapanJordanKazakhstanKenyaKoreaKuwaitLaosLatin AmericaLatviaLebanonLiberiaLithuaniaMalaysiaMexicoMicronesiaMiddle AfricaMoldovaMoroccoNepalNetherlandsNicaraguaNigeriaNorth MacedoniaNorthern AfricaNorthern EuropeNorwayOceaniaPakistanPanamaPeruPhilippinesPolandPortugalRomaniaRussiaSaudi ArabiaScotlandSenegalSerbiaSierra LeoneSingaporeSomaliaSouth AfricaSouth AmericaSouth Central AsiaSouth Eastern AsiaSouthern EuropeSpainSri LankaSt. Vincent and the GrenadinesSudanSwedenSwitzerlandSyriaTaiwanThailandTrinidad and TobagoTurkeyUgandaUkraineUruguayUzbekistanVenezuelaVietnamWest IndiesWestern AfricaWestern AsiaWestern EuropeYemenZaireZimbabwe
Income
Income (Families)
Income (Households)
Poverty
Poverty (Families)
Unemployment
Employment Occupations
Employment Industries
Employer Class
Commute Time
Commute Means
School Enrollment
Education by Degree Field
Occupancy
Finances
Physical Characteristics
Connecticut
Compare Cities
Comparison Subject

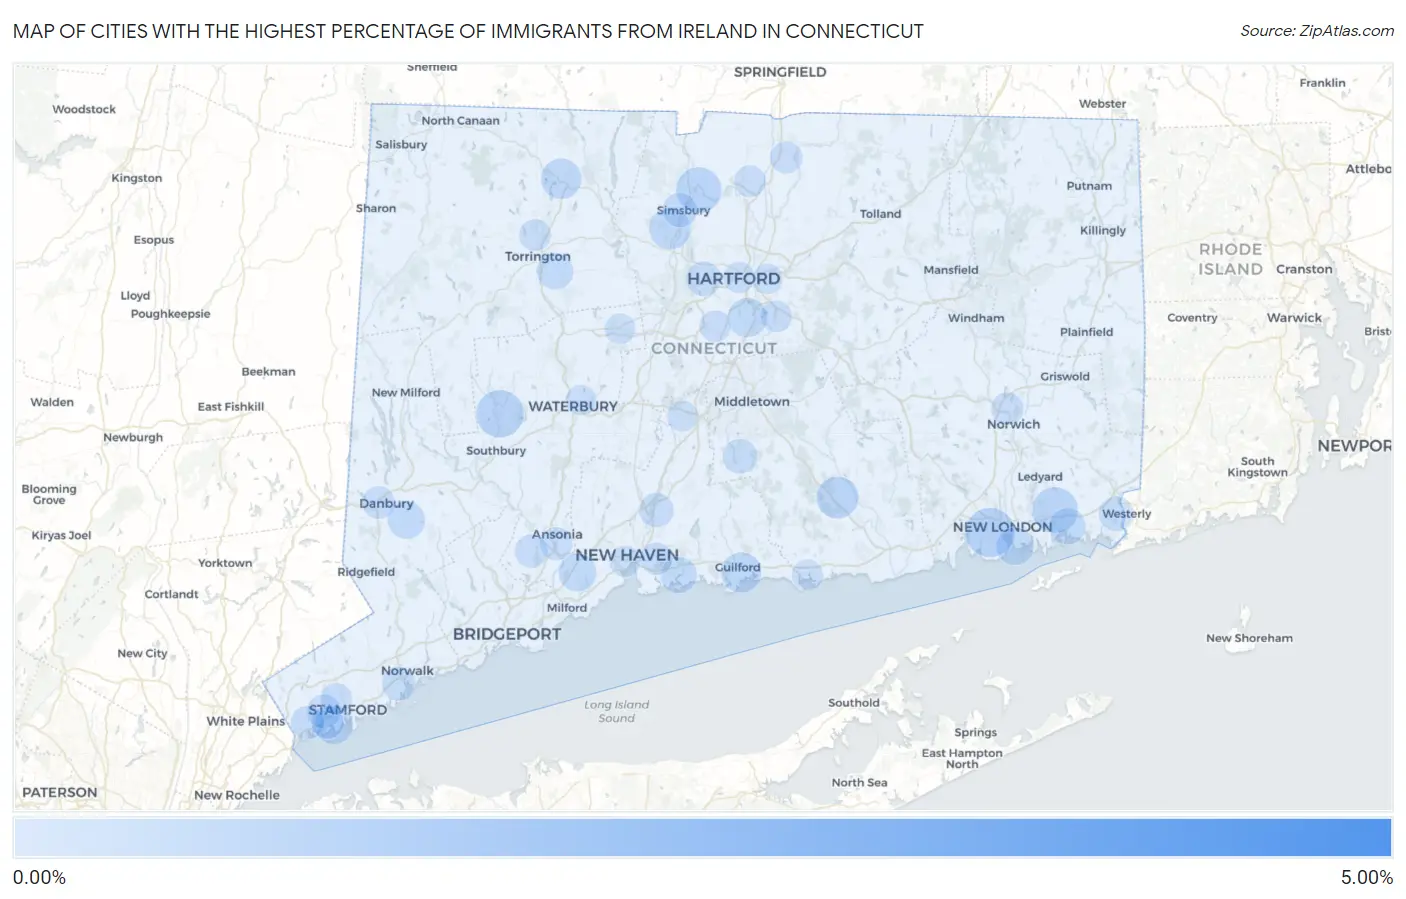
Map of Cities with the Highest Percentage of Immigrants from Ireland in Connecticut

0.00%
5.00%
Cities with the Highest Percentage of Immigrants from Ireland in Connecticut Map

Cities with the Highest Percentage of Immigrants from Ireland in Connecticut

City Ireland vs State vs National
1.Fenwick Borough5.00%0.086%(+4.91)#10.036%(+4.96)#5
2.Taylor Corners1.77%0.086%(+1.68)#20.036%(+1.73)#55
3.Cornwall Bridge1.31%0.086%(+1.22)#30.036%(+1.27)#94
4.Inglenook1.20%0.086%(+1.12)#40.036%(+1.17)#111
5.Staples1.15%0.086%(+1.07)#50.036%(+1.12)#118
6.Waterford0.76%0.086%(+0.677)#60.036%(+0.727)#188
7.Woodbury Center0.69%0.086%(+0.606)#70.036%(+0.656)#215
8.Old Mystic0.62%0.086%(+0.534)#80.036%(+0.584)#249
9.Tariffville0.61%0.086%(+0.524)#90.036%(+0.574)#253
10.Trumbull Center0.56%0.086%(+0.475)#100.036%(+0.525)#286
11.Old Hill0.49%0.086%(+0.404)#110.036%(+0.454)#324
12.Chester Center0.46%0.086%(+0.376)#120.036%(+0.427)#342
13.Weatogue0.45%0.086%(+0.363)#130.036%(+0.413)#354
14.Mill Plain0.43%0.086%(+0.348)#140.036%(+0.398)#369
15.Winsted0.41%0.086%(+0.321)#150.036%(+0.371)#388
16.Guilford Center0.39%0.086%(+0.307)#160.036%(+0.357)#401
17.Wethersfield0.37%0.086%(+0.281)#170.036%(+0.332)#436
18.Greens Farms0.36%0.086%(+0.274)#180.036%(+0.324)#443
19.Ball Pond0.36%0.086%(+0.269)#190.036%(+0.319)#449
20.Noroton0.34%0.086%(+0.253)#200.036%(+0.303)#475
21.Old Greenwich0.33%0.086%(+0.240)#210.036%(+0.290)#496
22.Orange0.31%0.086%(+0.223)#220.036%(+0.273)#519
23.Groton0.30%0.086%(+0.213)#230.036%(+0.263)#534
24.Bethel0.29%0.086%(+0.208)#240.036%(+0.258)#540
25.Northwest Harwinton0.25%0.086%(+0.164)#250.036%(+0.214)#641
26.Mystic0.25%0.086%(+0.163)#260.036%(+0.213)#643
27.Branford Center0.24%0.086%(+0.156)#270.036%(+0.206)#663
28.Tokeneke0.19%0.086%(+0.108)#280.036%(+0.158)#777
29.Pawcatuck0.18%0.086%(+0.093)#290.036%(+0.143)#836
30.West Hartford0.18%0.086%(+0.093)#300.036%(+0.143)#837
31.Durham0.17%0.086%(+0.087)#310.036%(+0.137)#854
32.North Haven0.17%0.086%(+0.083)#320.036%(+0.133)#871
33.Simsbury Center0.16%0.086%(+0.077)#330.036%(+0.127)#895
34.Newtown Borough0.15%0.086%(+0.067)#340.036%(+0.117)#931
35.Norwalk0.14%0.086%(+0.055)#350.036%(+0.105)#984
36.Cos Cob0.14%0.086%(+0.052)#360.036%(+0.102)#998
37.Greenwich0.13%0.086%(+0.042)#370.036%(+0.092)#1,054
38.Shelton0.12%0.086%(+0.030)#380.036%(+0.080)#1,108
39.Derby0.11%0.086%(+0.019)#390.036%(+0.069)#1,172
40.Danbury0.099%0.086%(+0.013)#400.036%(+0.063)#1,206
41.Riverside0.099%0.086%(+0.013)#410.036%(+0.063)#1,207
42.Norwich0.092%0.086%(+0.006)#420.036%(+0.056)#1,238
43.East Haven0.079%0.086%(-0.007)#430.036%(+0.043)#1,340
44.Southwood Acres0.076%0.086%(-0.011)#440.036%(+0.039)#1,360
45.Sandy Hook0.073%0.086%(-0.013)#450.036%(+0.037)#1,377
46.Naugatuck Borough0.070%0.086%(-0.017)#460.036%(+0.033)#1,396
47.Torrington0.068%0.086%(-0.019)#470.036%(+0.031)#1,414
48.Windsor Locks0.064%0.086%(-0.023)#480.036%(+0.027)#1,447
49.Stamford0.056%0.086%(-0.030)#490.036%(+0.020)#1,509
50.Glastonbury Center0.050%0.086%(-0.036)#500.036%(+0.014)#1,564
51.Newington0.046%0.086%(-0.040)#510.036%(+0.010)#1,607
52.Hartford0.040%0.086%(-0.046)#520.036%(+0.004)#1,664
53.New Haven0.035%0.086%(-0.052)#530.036%(-0.002)#1,728
54.Clinton0.032%0.086%(-0.054)#540.036%(-0.004)#1,763
55.Meriden0.023%0.086%(-0.063)#550.036%(-0.013)#1,892
56.Bristol0.021%0.086%(-0.065)#560.036%(-0.015)#1,928
57.East Hartford0.0079%0.086%(-0.078)#570.036%(-0.028)#2,158
58.Waterbury0.0035%0.086%(-0.083)#580.036%(-0.033)#2,219

Common Questions

What are the Top 10 Cities with the Highest Percentage of Immigrants from Ireland in Connecticut?
Top 10 Cities with the Highest Percentage of Immigrants from Ireland in Connecticut are:
What city has the Highest Percentage of Immigrants from Ireland in Connecticut?
Waterford has the Highest Percentage of Immigrants from Ireland in Connecticut with 0.76%.
What is the Percentage of Immigrants from Ireland in the State of Connecticut?
Percentage of Immigrants from Ireland in Connecticut is 0.086%.
What is the Percentage of Immigrants from Ireland in the United States?
Percentage of Immigrants from Ireland in the United States is 0.036%.