Noank, CT
Noank Map
Noank Overview
1,708
TOTAL POPULATION
793
MALE POPULATION
915
FEMALE POPULATION
86.67
MALES / 100 FEMALES
115.38
FEMALES / 100 MALES
57.3
MEDIAN AGE
2.6
AVG FAMILY SIZE
2.2
AVG HOUSEHOLD SIZE
$86,514
PER CAPITA INCOME
$168,750
AVG FAMILY INCOME
$156,842
AVG HOUSEHOLD INCOME
21.2%
WAGE / INCOME GAP [ % ]
78.8¢/ $1
WAGE / INCOME GAP [ $ ]
0.40
INEQUALITY / GINI INDEX
976
LABOR FORCE [ PEOPLE ]
63.0%
PERCENT IN LABOR FORCE
0.9%
UNEMPLOYMENT RATE
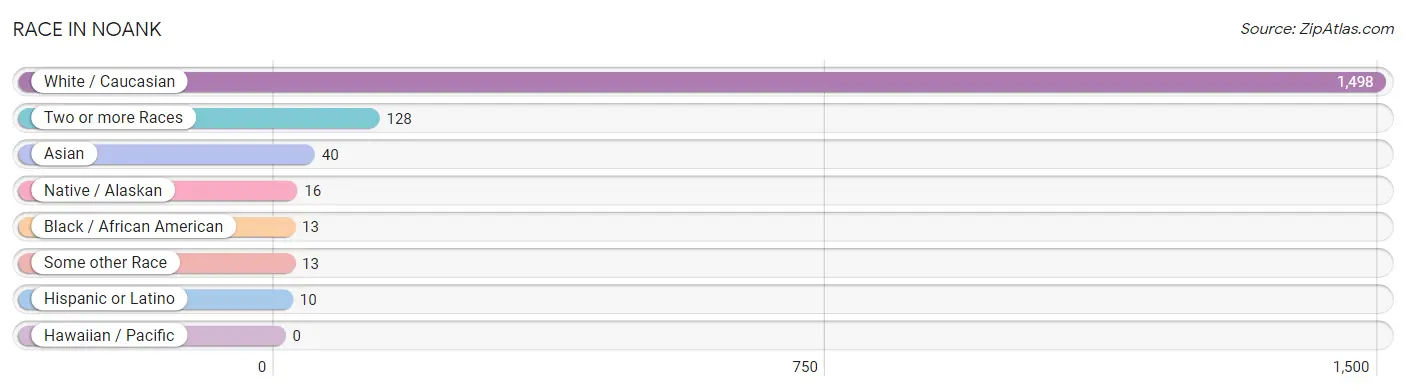
Race in Noank
The most populous races in Noank are White / Caucasian (1,498 | 87.7%), Two or more Races (128 | 7.5%), and Asian (40 | 2.3%).
| Race | # Population | % Population |
| Asian | 40 | 2.3% |
| Black / African American | 13 | 0.8% |
| Hawaiian / Pacific | 0 | 0.0% |
| Hispanic or Latino | 10 | 0.6% |
| Native / Alaskan | 16 | 0.9% |
| White / Caucasian | 1,498 | 87.7% |
| Two or more Races | 128 | 7.5% |
| Some other Race | 13 | 0.8% |
| Total | 1,708 | 100.0% |
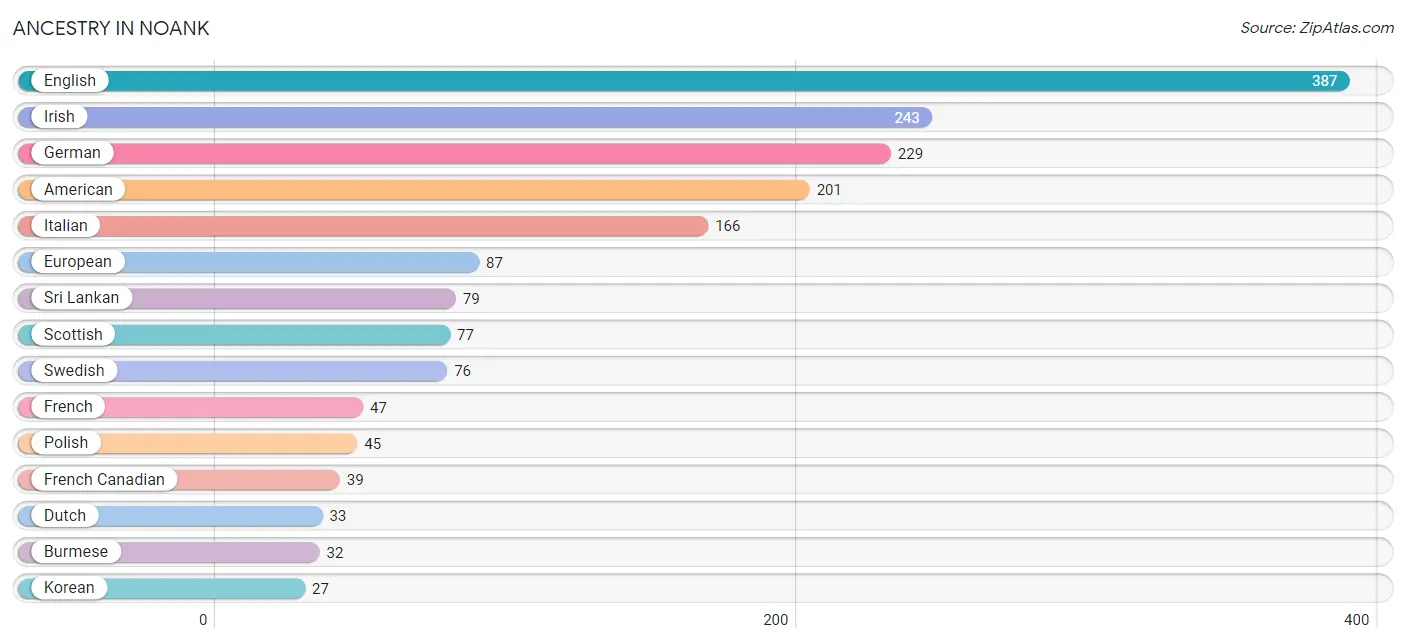
Ancestry in Noank
The most populous ancestries reported in Noank are English (387 | 22.7%), Irish (243 | 14.2%), German (229 | 13.4%), American (201 | 11.8%), and Italian (166 | 9.7%), together accounting for 71.8% of all Noank residents.
| Ancestry | # Population | % Population |
| American | 201 | 11.8% |
| Arab | 14 | 0.8% |
| British | 7 | 0.4% |
| Burmese | 32 | 1.9% |
| Canadian | 6 | 0.4% |
| Chilean | 4 | 0.2% |
| Danish | 8 | 0.5% |
| Dutch | 33 | 1.9% |
| English | 387 | 22.7% |
| European | 87 | 5.1% |
| French | 47 | 2.8% |
| French Canadian | 39 | 2.3% |
| German | 229 | 13.4% |
| Hungarian | 18 | 1.1% |
| Irish | 243 | 14.2% |
| Italian | 166 | 9.7% |
| Korean | 27 | 1.6% |
| Lebanese | 14 | 0.8% |
| Northern European | 7 | 0.4% |
| Norwegian | 16 | 0.9% |
| Polish | 45 | 2.6% |
| Portuguese | 24 | 1.4% |
| Puerto Rican | 1 | 0.1% |
| Russian | 10 | 0.6% |
| Scotch-Irish | 16 | 0.9% |
| Scottish | 77 | 4.5% |
| Slovak | 6 | 0.4% |
| Slovene | 8 | 0.5% |
| South American | 4 | 0.2% |
| Sri Lankan | 79 | 4.6% |
| Swedish | 76 | 4.4% |
| Swiss | 18 | 1.1% | View All 32 Rows |
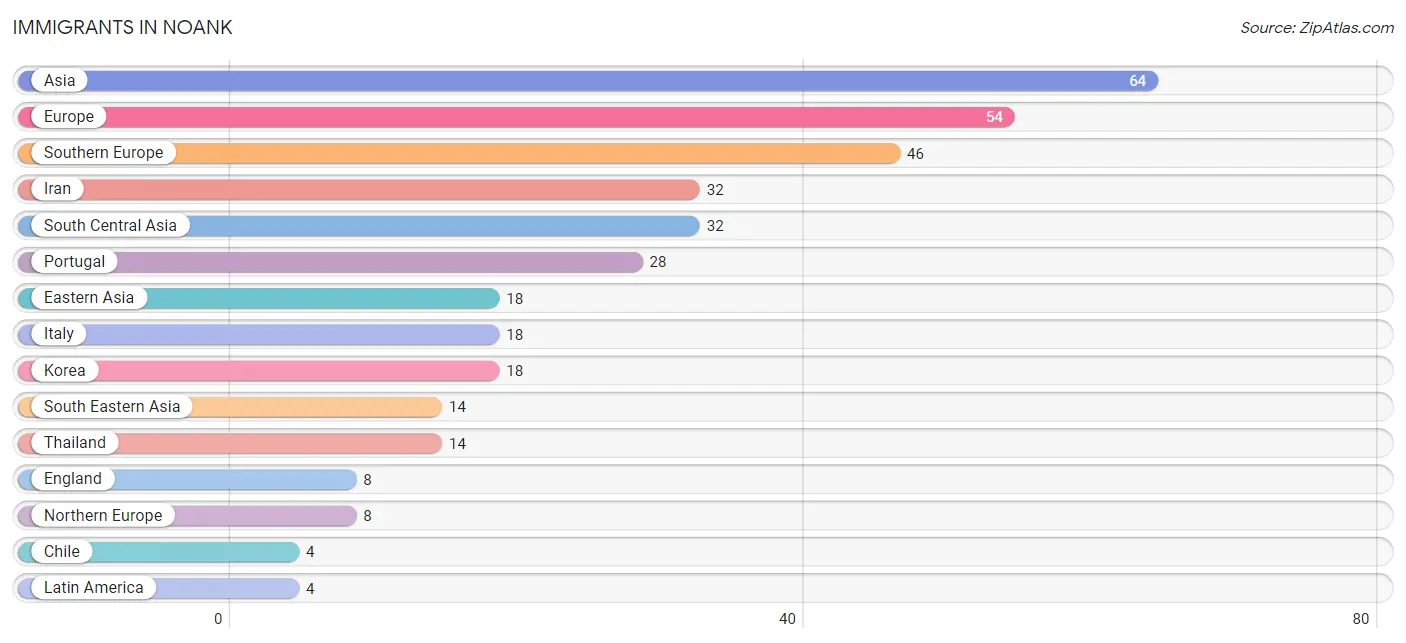
Immigrants in Noank
The most numerous immigrant groups reported in Noank came from Asia (64 | 3.7%), Europe (54 | 3.2%), Southern Europe (46 | 2.7%), Iran (32 | 1.9%), and South Central Asia (32 | 1.9%), together accounting for 13.3% of all Noank residents.
| Immigration Origin | # Population | % Population |
| Asia | 64 | 3.7% |
| Chile | 4 | 0.2% |
| Eastern Asia | 18 | 1.1% |
| England | 8 | 0.5% |
| Europe | 54 | 3.2% |
| Iran | 32 | 1.9% |
| Italy | 18 | 1.1% |
| Korea | 18 | 1.1% |
| Latin America | 4 | 0.2% |
| Northern Europe | 8 | 0.5% |
| Portugal | 28 | 1.6% |
| South America | 4 | 0.2% |
| South Central Asia | 32 | 1.9% |
| South Eastern Asia | 14 | 0.8% |
| Southern Europe | 46 | 2.7% |
| Thailand | 14 | 0.8% | View All 16 Rows |
Sex and Age in Noank
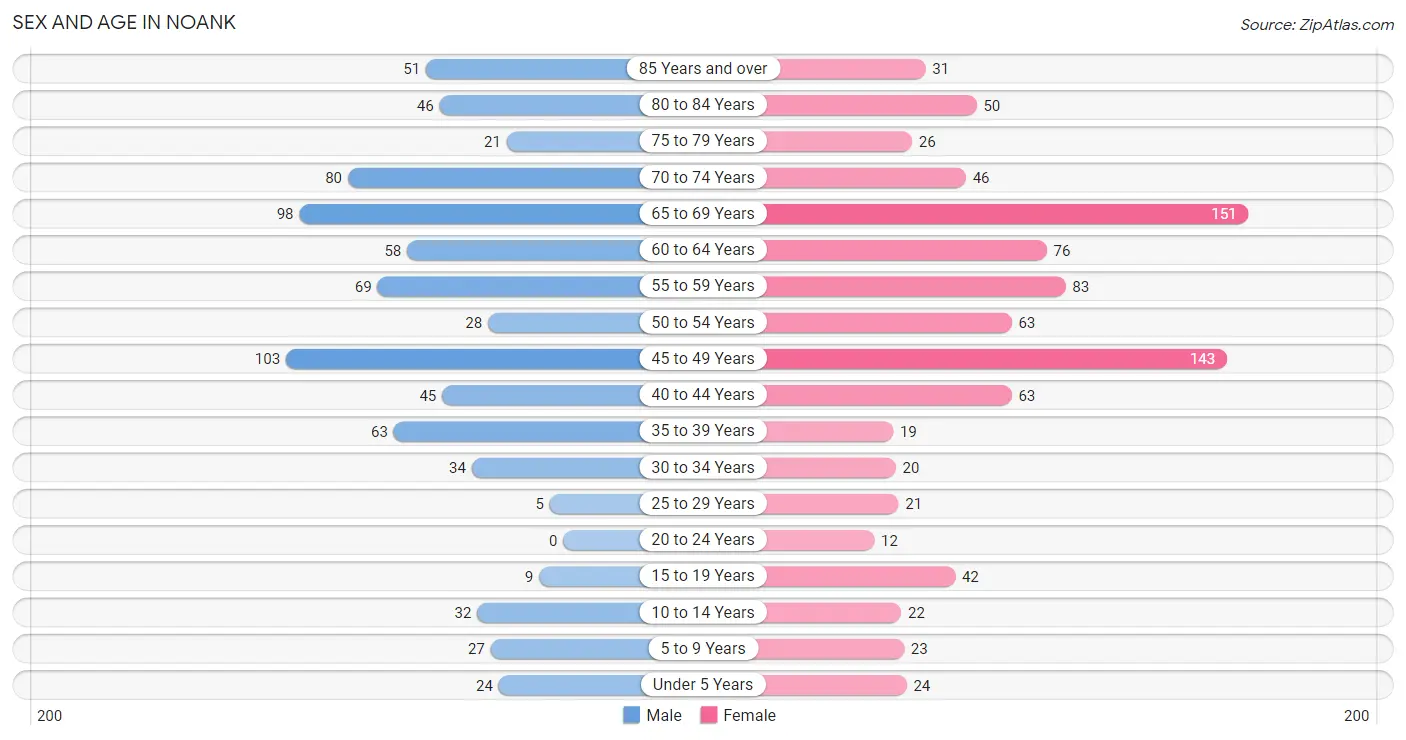
Sex and Age in Noank
The most populous age groups in Noank are 45 to 49 Years (103 | 13.0%) for men and 65 to 69 Years (151 | 16.5%) for women.
| Age Bracket | Male | Female |
| Under 5 Years | 24 (3.0%) | 24 (2.6%) |
| 5 to 9 Years | 27 (3.4%) | 23 (2.5%) |
| 10 to 14 Years | 32 (4.0%) | 22 (2.4%) |
| 15 to 19 Years | 9 (1.1%) | 42 (4.6%) |
| 20 to 24 Years | 0 (0.0%) | 12 (1.3%) |
| 25 to 29 Years | 5 (0.6%) | 21 (2.3%) |
| 30 to 34 Years | 34 (4.3%) | 20 (2.2%) |
| 35 to 39 Years | 63 (7.9%) | 19 (2.1%) |
| 40 to 44 Years | 45 (5.7%) | 63 (6.9%) |
| 45 to 49 Years | 103 (13.0%) | 143 (15.6%) |
| 50 to 54 Years | 28 (3.5%) | 63 (6.9%) |
| 55 to 59 Years | 69 (8.7%) | 83 (9.1%) |
| 60 to 64 Years | 58 (7.3%) | 76 (8.3%) |
| 65 to 69 Years | 98 (12.4%) | 151 (16.5%) |
| 70 to 74 Years | 80 (10.1%) | 46 (5.0%) |
| 75 to 79 Years | 21 (2.6%) | 26 (2.8%) |
| 80 to 84 Years | 46 (5.8%) | 50 (5.5%) |
| 85 Years and over | 51 (6.4%) | 31 (3.4%) |
| Total | 793 (100.0%) | 915 (100.0%) |
Families and Households in Noank
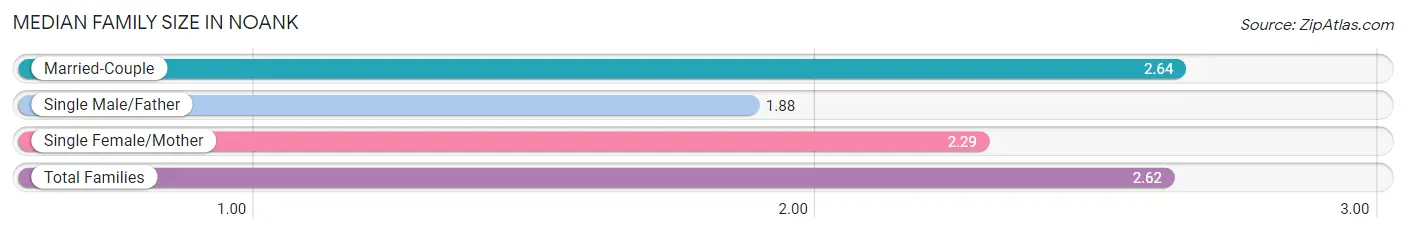
Median Family Size in Noank
The median family size in Noank is 2.62 persons per family, with married-couple families (510 | 95.9%) accounting for the largest median family size of 2.64 persons per family. On the other hand, single male/father families (8 | 1.5%) represent the smallest median family size with 1.88 persons per family.
| Family Type | # Families | Family Size |
| Married-Couple | 510 (95.9%) | 2.64 |
| Single Male/Father | 8 (1.5%) | 1.88 |
| Single Female/Mother | 14 (2.6%) | 2.29 |
| Total Families | 532 (100.0%) | 2.62 |
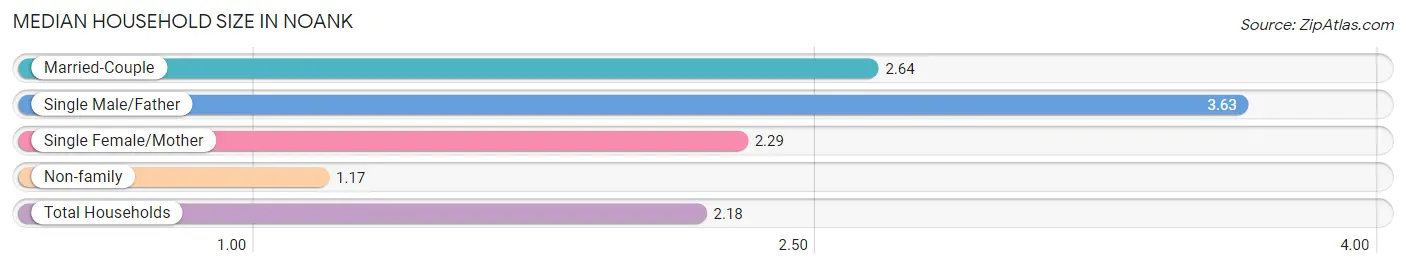
Median Household Size in Noank
The median household size in Noank is 2.18 persons per household, with single male/father households (8 | 1.0%) accounting for the largest median household size of 3.63 persons per household. non-family households (248 | 31.8%) represent the smallest median household size with 1.17 persons per household.
| Household Type | # Households | Household Size |
| Married-Couple | 510 (65.4%) | 2.64 |
| Single Male/Father | 8 (1.0%) | 3.63 |
| Single Female/Mother | 14 (1.8%) | 2.29 |
| Non-family | 248 (31.8%) | 1.17 |
| Total Households | 780 (100.0%) | 2.18 |
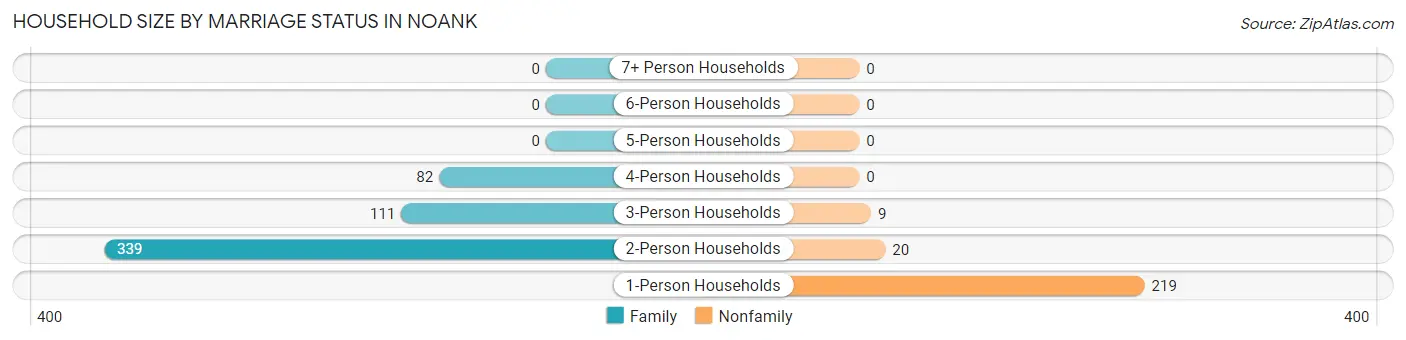
Household Size by Marriage Status in Noank
Out of a total of 780 households in Noank, 532 (68.2%) are family households, while 248 (31.8%) are nonfamily households. The most numerous type of family households are 2-person households, comprising 339, and the most common type of nonfamily households are 1-person households, comprising 219.
| Household Size | Family Households | Nonfamily Households |
| 1-Person Households | - | 219 (28.1%) |
| 2-Person Households | 339 (43.5%) | 20 (2.6%) |
| 3-Person Households | 111 (14.2%) | 9 (1.1%) |
| 4-Person Households | 82 (10.5%) | 0 (0.0%) |
| 5-Person Households | 0 (0.0%) | 0 (0.0%) |
| 6-Person Households | 0 (0.0%) | 0 (0.0%) |
| 7+ Person Households | 0 (0.0%) | 0 (0.0%) |
| Total | 532 (68.2%) | 248 (31.8%) |
Female Fertility in Noank
Fertility by Age in Noank
| Age Bracket | Women with Births | Births / 1,000 Women |
| 15 to 19 years | 0 (0.0%) | 0.0 |
| 20 to 34 years | 0 (0.0%) | 0.0 |
| 35 to 50 years | 0 (0.0%) | 0.0 |
| Total | 0 (0.0%) | 0.0 |
Fertility by Age by Marriage Status in Noank
| Age Bracket | Married | Unmarried |
| 15 to 19 years | 0 (0.0%) | 0 (0.0%) |
| 20 to 34 years | 0 (0.0%) | 0 (0.0%) |
| 35 to 50 years | 0 (0.0%) | 0 (0.0%) |
| Total | 0 (0.0%) | 0 (0.0%) |
Fertility by Education in Noank
| Educational Attainment | Women with Births | Births / 1,000 Women |
| Less than High School | 0 (0.0%) | 0.0 |
| High School Diploma | 0 (0.0%) | 0.0 |
| College or Associate's Degree | 0 (0.0%) | 0.0 |
| Bachelor's Degree | 0 (0.0%) | 0.0 |
| Graduate Degree | 0 (0.0%) | 0.0 |
| Total | 0 (0.0%) | 0.0 |
Fertility by Education by Marriage Status in Noank
| Educational Attainment | Married | Unmarried |
| Less than High School | 0 (0.0%) | 0 (0.0%) |
| High School Diploma | 0 (0.0%) | 0 (0.0%) |
| College or Associate's Degree | 0 (0.0%) | 0 (0.0%) |
| Bachelor's Degree | 0 (0.0%) | 0 (0.0%) |
| Graduate Degree | 0 (0.0%) | 0 (0.0%) |
| Total | 0 (0.0%) | 0 (0.0%) |
Income in Noank
Income Overview in Noank
Per Capita Income in Noank is $86,514, while median incomes of families and households are $168,750 and $156,842 respectively.
| Characteristic | Number | Measure |
| Per Capita Income | 1,708 | $86,514 |
| Median Family Income | 532 | $168,750 |
| Mean Family Income | 532 | $192,575 |
| Median Household Income | 780 | $156,842 |
| Mean Household Income | 780 | $177,992 |
| Income Deficit | 532 | $0 |
| Wage / Income Gap (%) | 1,708 | 21.19% |
| Wage / Income Gap ($) | 1,708 | 78.81¢ per $1 |
| Gini / Inequality Index | 1,708 | 0.40 |
Earnings by Sex in Noank
Average Earnings in Noank are $95,933, $115,781 for men and $91,250 for women, a difference of 21.2%.
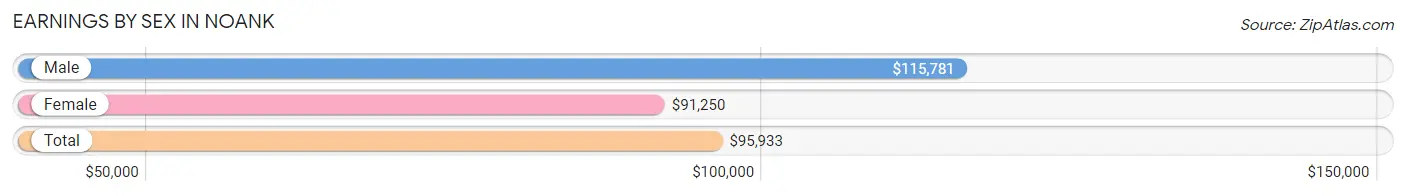
| Sex | Number | Average Earnings |
| Male | 465 (47.1%) | $115,781 |
| Female | 522 (52.9%) | $91,250 |
| Total | 987 (100.0%) | $95,933 |
Earnings by Sex by Income Bracket in Noank
The most common earnings brackets in Noank are $100,000+ for men (271 | 58.3%) and $75,000 to $99,999 for women (158 | 30.3%).
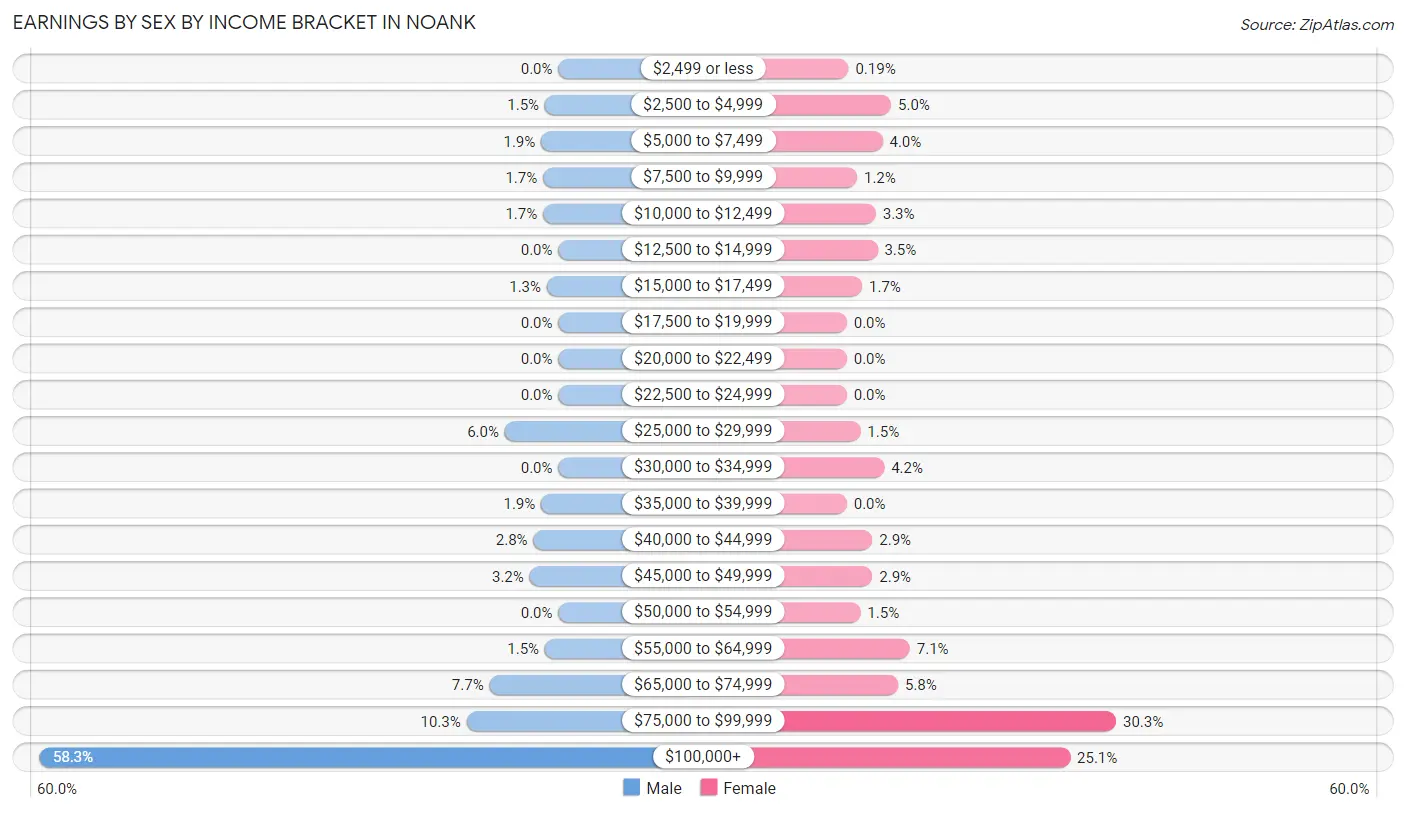
| Income | Male | Female |
| $2,499 or less | 0 (0.0%) | 1 (0.2%) |
| $2,500 to $4,999 | 7 (1.5%) | 26 (5.0%) |
| $5,000 to $7,499 | 9 (1.9%) | 21 (4.0%) |
| $7,500 to $9,999 | 8 (1.7%) | 6 (1.1%) |
| $10,000 to $12,499 | 8 (1.7%) | 17 (3.3%) |
| $12,500 to $14,999 | 0 (0.0%) | 18 (3.5%) |
| $15,000 to $17,499 | 6 (1.3%) | 9 (1.7%) |
| $17,500 to $19,999 | 0 (0.0%) | 0 (0.0%) |
| $20,000 to $22,499 | 0 (0.0%) | 0 (0.0%) |
| $22,500 to $24,999 | 0 (0.0%) | 0 (0.0%) |
| $25,000 to $29,999 | 28 (6.0%) | 8 (1.5%) |
| $30,000 to $34,999 | 0 (0.0%) | 22 (4.2%) |
| $35,000 to $39,999 | 9 (1.9%) | 0 (0.0%) |
| $40,000 to $44,999 | 13 (2.8%) | 15 (2.9%) |
| $45,000 to $49,999 | 15 (3.2%) | 15 (2.9%) |
| $50,000 to $54,999 | 0 (0.0%) | 8 (1.5%) |
| $55,000 to $64,999 | 7 (1.5%) | 37 (7.1%) |
| $65,000 to $74,999 | 36 (7.7%) | 30 (5.8%) |
| $75,000 to $99,999 | 48 (10.3%) | 158 (30.3%) |
| $100,000+ | 271 (58.3%) | 131 (25.1%) |
| Total | 465 (100.0%) | 522 (100.0%) |
Earnings by Sex by Educational Attainment in Noank
Average earnings in Noank are $117,188 for men and $95,278 for women, a difference of 18.7%. Men with an educational attainment of graduate degree enjoy the highest average annual earnings of $165,181, while those with college or associate's degree education earn the least with $74,722. Women with an educational attainment of graduate degree earn the most with the average annual earnings of $97,417, while those with college or associate's degree education have the smallest earnings of $52,188.
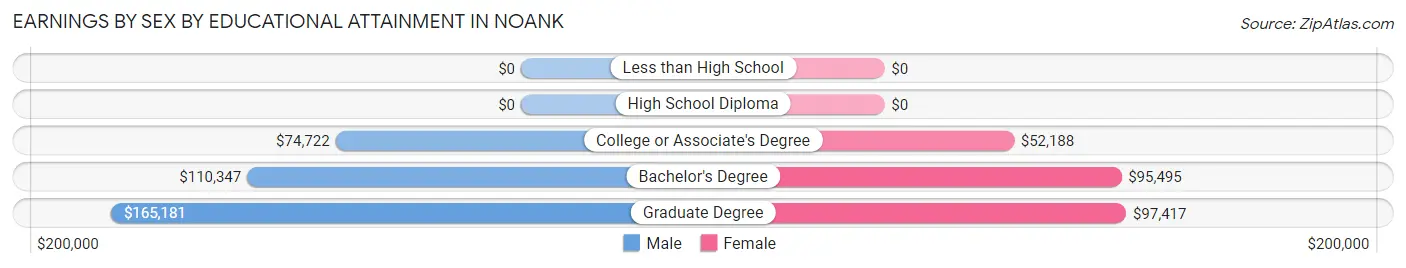
| Educational Attainment | Male Income | Female Income |
| Less than High School | - | - |
| High School Diploma | - | - |
| College or Associate's Degree | $74,722 | $52,188 |
| Bachelor's Degree | $110,347 | $95,495 |
| Graduate Degree | $165,181 | $97,417 |
| Total | $117,188 | $95,278 |
Family Income in Noank
Family Income Brackets in Noank
According to the Noank family income data, there are 227 families falling into the $200,000+ income range, which is the most common income bracket and makes up 42.7% of all families.
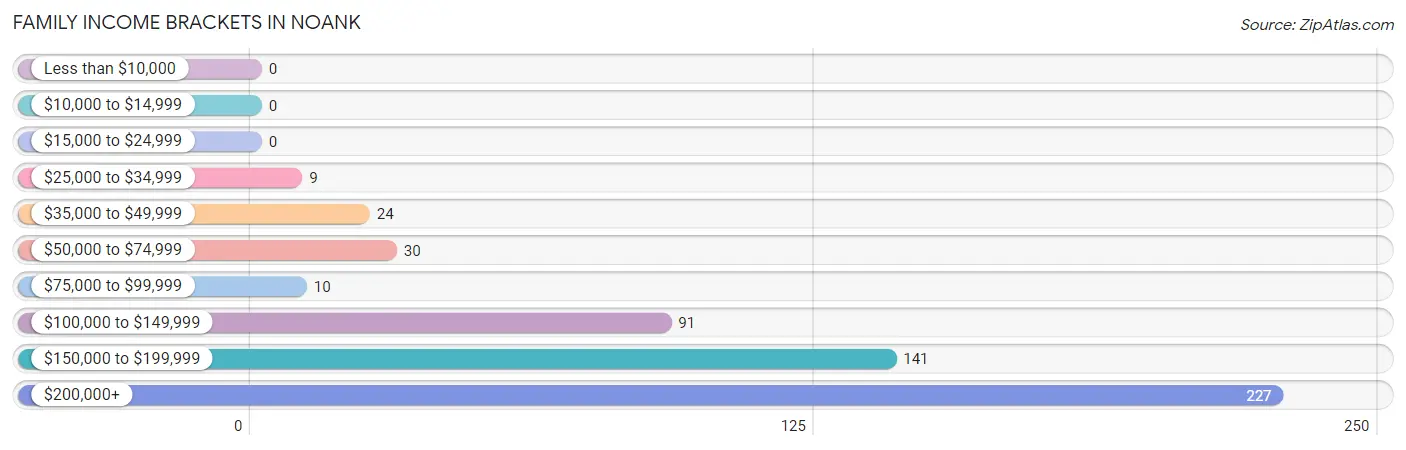
| Income Bracket | # Families | % Families |
| Less than $10,000 | 0 | 0.0% |
| $10,000 to $14,999 | 0 | 0.0% |
| $15,000 to $24,999 | 0 | 0.0% |
| $25,000 to $34,999 | 9 | 1.7% |
| $35,000 to $49,999 | 24 | 4.5% |
| $50,000 to $74,999 | 30 | 5.6% |
| $75,000 to $99,999 | 10 | 1.9% |
| $100,000 to $149,999 | 91 | 17.1% |
| $150,000 to $199,999 | 141 | 26.5% |
| $200,000+ | 227 | 42.7% |
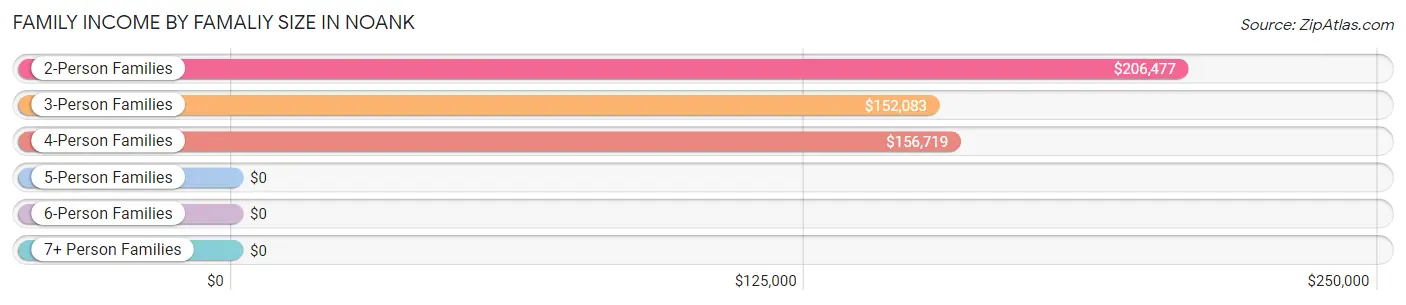
Family Income by Famaliy Size in Noank
2-person families (347 | 65.2%) account for the highest median family income in Noank with $206,477 per family, while 2-person families (347 | 65.2%) have the highest median income of $103,238 per family member.
| Income Bracket | # Families | Median Income |
| 2-Person Families | 347 (65.2%) | $206,477 |
| 3-Person Families | 103 (19.4%) | $152,083 |
| 4-Person Families | 82 (15.4%) | $156,719 |
| 5-Person Families | 0 (0.0%) | $0 |
| 6-Person Families | 0 (0.0%) | $0 |
| 7+ Person Families | 0 (0.0%) | $0 |
| Total | 532 (100.0%) | $168,750 |
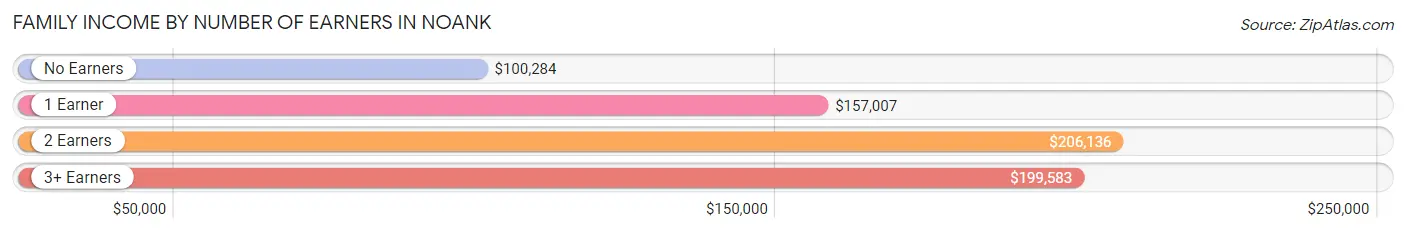
Family Income by Number of Earners in Noank
The median family income in Noank is $168,750, with families comprising 2 earners (238) having the highest median family income of $206,136, while families with no earners (99) have the lowest median family income of $100,284, accounting for 44.7% and 18.6% of families, respectively.
| Number of Earners | # Families | Median Income |
| No Earners | 99 (18.6%) | $100,284 |
| 1 Earner | 153 (28.8%) | $157,007 |
| 2 Earners | 238 (44.7%) | $206,136 |
| 3+ Earners | 42 (7.9%) | $199,583 |
| Total | 532 (100.0%) | $168,750 |
Household Income in Noank
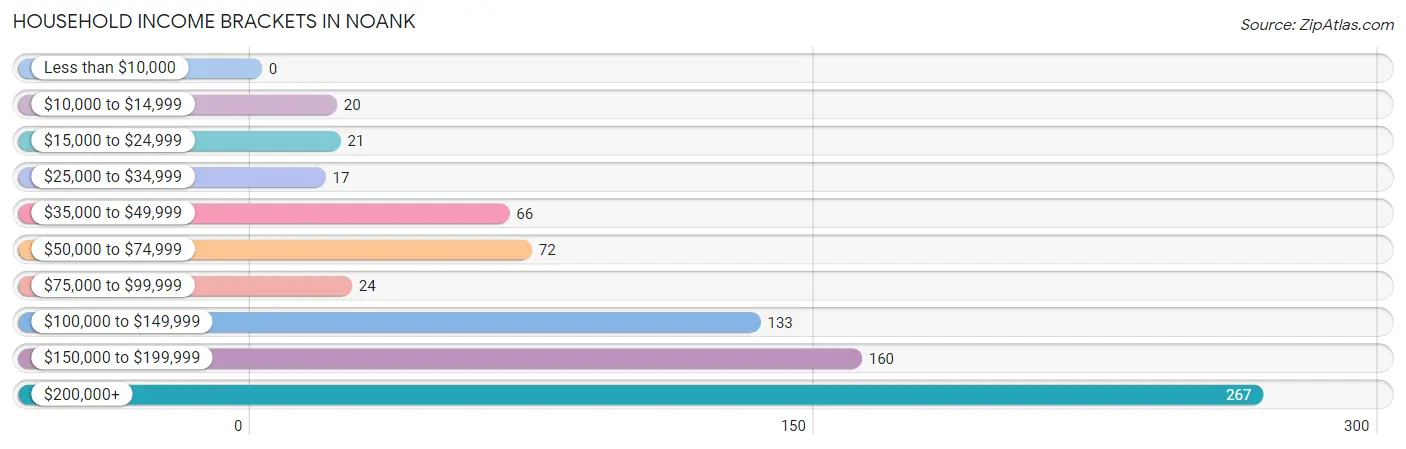
Household Income Brackets in Noank
With 267 households falling in the category, the $200,000+ income range is the most frequent in Noank, accounting for 34.2% of all households.
| Income Bracket | # Households | % Households |
| Less than $10,000 | 0 | 0.0% |
| $10,000 to $14,999 | 20 | 2.6% |
| $15,000 to $24,999 | 21 | 2.7% |
| $25,000 to $34,999 | 17 | 2.2% |
| $35,000 to $49,999 | 66 | 8.5% |
| $50,000 to $74,999 | 72 | 9.2% |
| $75,000 to $99,999 | 24 | 3.1% |
| $100,000 to $149,999 | 133 | 17.1% |
| $150,000 to $199,999 | 160 | 20.5% |
| $200,000+ | 267 | 34.2% |
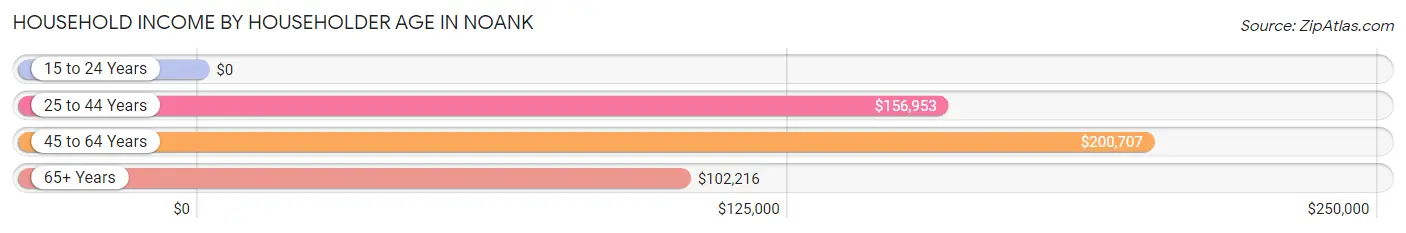
Household Income by Householder Age in Noank
The median household income in Noank is $156,842, with the highest median household income of $200,707 found in the 45 to 64 years age bracket for the primary householder. A total of 303 households (38.9%) fall into this category.
| Income Bracket | # Households | Median Income |
| 15 to 24 Years | 0 (0.0%) | $0 |
| 25 to 44 Years | 118 (15.1%) | $156,953 |
| 45 to 64 Years | 303 (38.9%) | $200,707 |
| 65+ Years | 359 (46.0%) | $102,216 |
| Total | 780 (100.0%) | $156,842 |
Poverty in Noank
Income Below Poverty by Sex and Age in Noank
With 0.1% poverty level for males and 1.9% for females among the residents of Noank, 55 to 64 year old males and 75 year old and over females are the most vulnerable to poverty, with 1 males (0.8%) and 15 females (14.0%) in their respective age groups living below the poverty level.
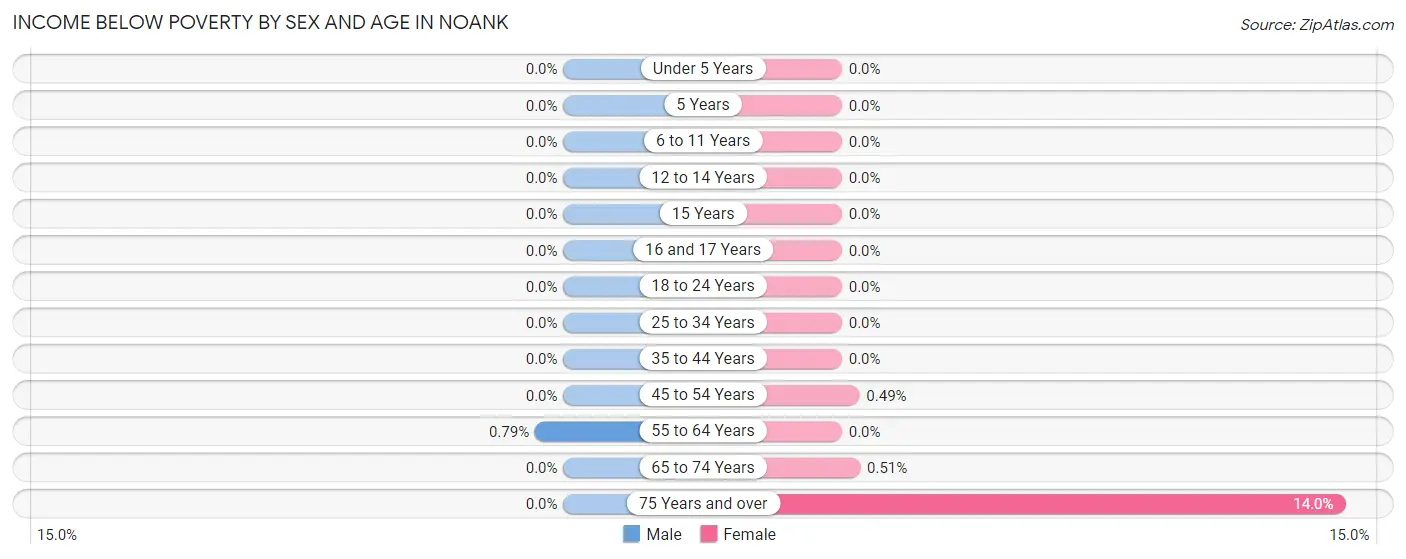
| Age Bracket | Male | Female |
| Under 5 Years | 0 (0.0%) | 0 (0.0%) |
| 5 Years | 0 (0.0%) | 0 (0.0%) |
| 6 to 11 Years | 0 (0.0%) | 0 (0.0%) |
| 12 to 14 Years | 0 (0.0%) | 0 (0.0%) |
| 15 Years | 0 (0.0%) | 0 (0.0%) |
| 16 and 17 Years | 0 (0.0%) | 0 (0.0%) |
| 18 to 24 Years | 0 (0.0%) | 0 (0.0%) |
| 25 to 34 Years | 0 (0.0%) | 0 (0.0%) |
| 35 to 44 Years | 0 (0.0%) | 0 (0.0%) |
| 45 to 54 Years | 0 (0.0%) | 1 (0.5%) |
| 55 to 64 Years | 1 (0.8%) | 0 (0.0%) |
| 65 to 74 Years | 0 (0.0%) | 1 (0.5%) |
| 75 Years and over | 0 (0.0%) | 15 (14.0%) |
| Total | 1 (0.1%) | 17 (1.9%) |
Income Above Poverty by Sex and Age in Noank
According to the poverty statistics in Noank, males aged under 5 years and females aged under 5 years are the age groups that are most secure financially, with 100.0% of males and 100.0% of females in these age groups living above the poverty line.
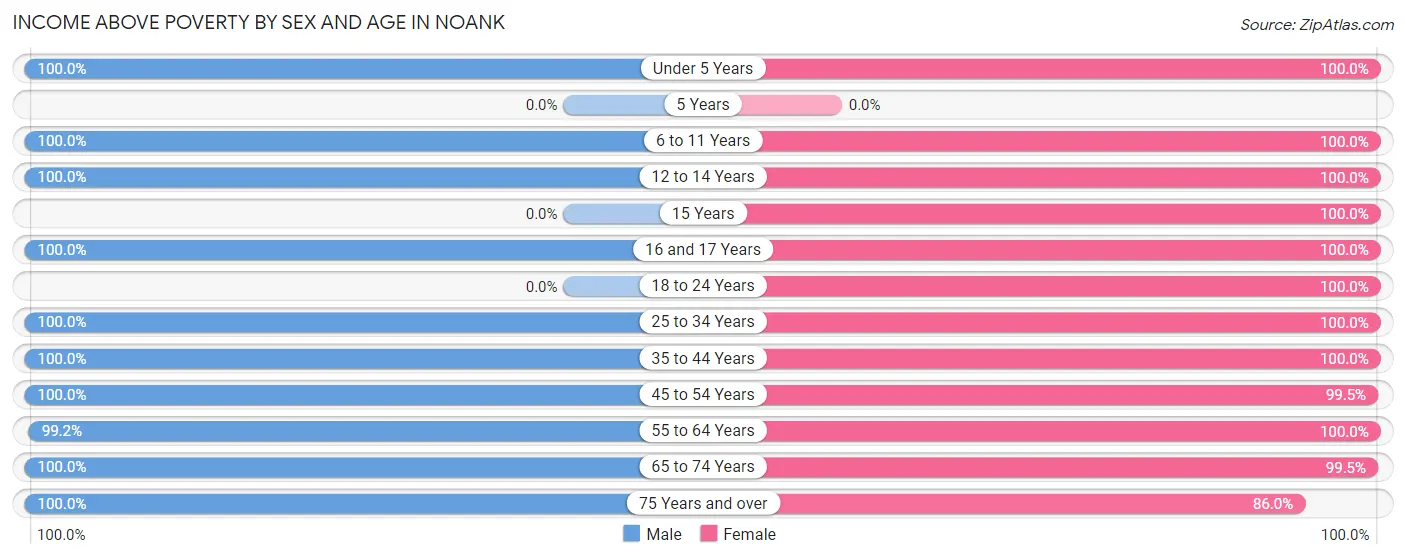
| Age Bracket | Male | Female |
| Under 5 Years | 24 (100.0%) | 24 (100.0%) |
| 5 Years | 0 (0.0%) | 0 (0.0%) |
| 6 to 11 Years | 40 (100.0%) | 23 (100.0%) |
| 12 to 14 Years | 19 (100.0%) | 21 (100.0%) |
| 15 Years | 0 (0.0%) | 6 (100.0%) |
| 16 and 17 Years | 9 (100.0%) | 24 (100.0%) |
| 18 to 24 Years | 0 (0.0%) | 21 (100.0%) |
| 25 to 34 Years | 39 (100.0%) | 41 (100.0%) |
| 35 to 44 Years | 108 (100.0%) | 82 (100.0%) |
| 45 to 54 Years | 131 (100.0%) | 205 (99.5%) |
| 55 to 64 Years | 126 (99.2%) | 159 (100.0%) |
| 65 to 74 Years | 178 (100.0%) | 196 (99.5%) |
| 75 Years and over | 118 (100.0%) | 92 (86.0%) |
| Total | 792 (99.9%) | 894 (98.1%) |
Income Below Poverty Among Married-Couple Families in Noank

| Children | Above Poverty | Below Poverty |
| No Children | 395 (100.0%) | 0 (0.0%) |
| 1 or 2 Children | 115 (100.0%) | 0 (0.0%) |
| 3 or 4 Children | 0 (0.0%) | 0 (0.0%) |
| 5 or more Children | 0 (0.0%) | 0 (0.0%) |
| Total | 510 (100.0%) | 0 (0.0%) |
Income Below Poverty Among Single-Parent Households in Noank
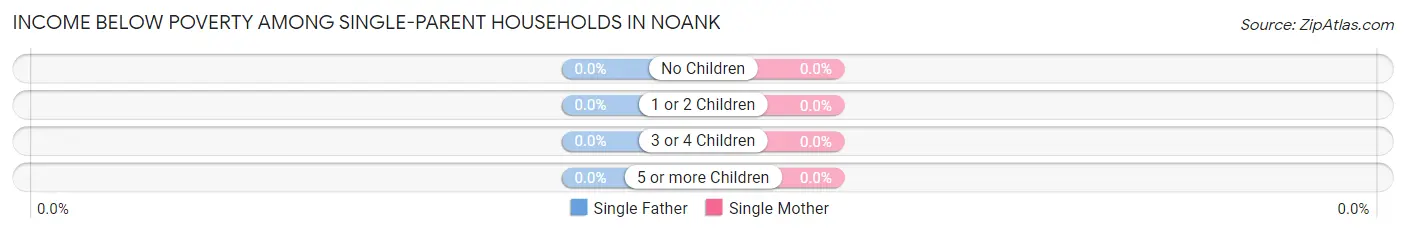
| Children | Single Father | Single Mother |
| No Children | 0 (0.0%) | 0 (0.0%) |
| 1 or 2 Children | 0 (0.0%) | 0 (0.0%) |
| 3 or 4 Children | 0 (0.0%) | 0 (0.0%) |
| 5 or more Children | 0 (0.0%) | 0 (0.0%) |
| Total | 0 (0.0%) | 0 (0.0%) |
Income Below Poverty Among Married-Couple vs Single-Parent Households in Noank
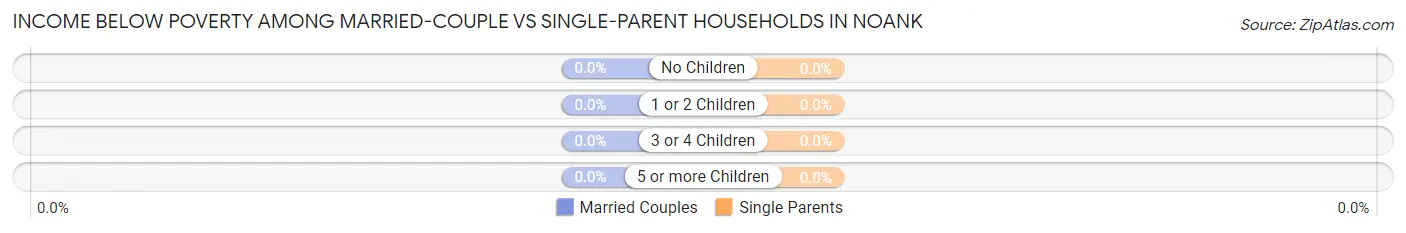
| Children | Married-Couple Families | Single-Parent Households |
| No Children | 0 (0.0%) | 0 (0.0%) |
| 1 or 2 Children | 0 (0.0%) | 0 (0.0%) |
| 3 or 4 Children | 0 (0.0%) | 0 (0.0%) |
| 5 or more Children | 0 (0.0%) | 0 (0.0%) |
| Total | 0 (0.0%) | 0 (0.0%) |
Employment Characteristics in Noank
Employment by Class of Employer in Noank
Among the 967 employed individuals in Noank, private company employees (599 | 61.9%), local government employees (154 | 15.9%), and not-for-profit organizations (77 | 8.0%) make up the most common classes of employment.
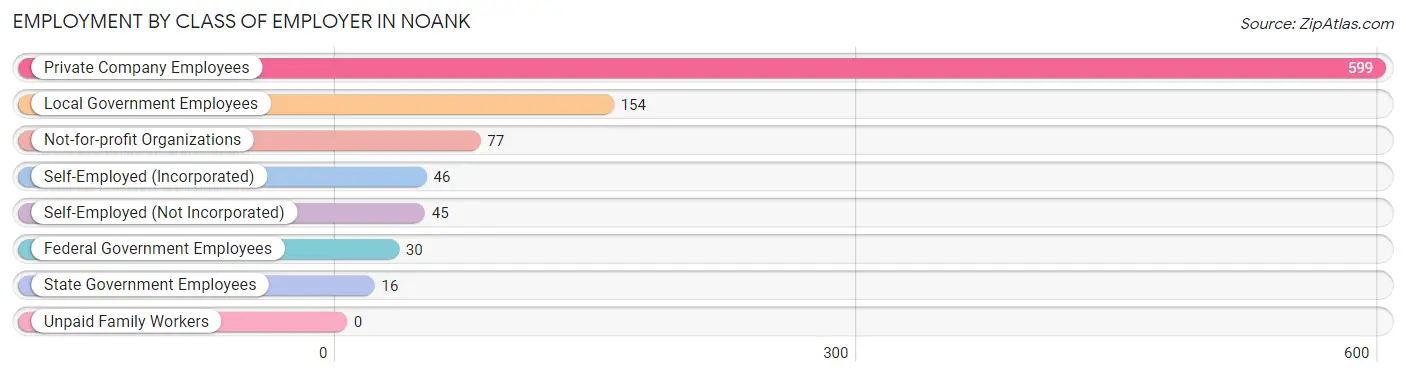
| Employer Class | # Employees | % Employees |
| Private Company Employees | 599 | 61.9% |
| Self-Employed (Incorporated) | 46 | 4.8% |
| Self-Employed (Not Incorporated) | 45 | 4.6% |
| Not-for-profit Organizations | 77 | 8.0% |
| Local Government Employees | 154 | 15.9% |
| State Government Employees | 16 | 1.7% |
| Federal Government Employees | 30 | 3.1% |
| Unpaid Family Workers | 0 | 0.0% |
| Total | 967 | 100.0% |
Employment Status by Age in Noank
According to the labor force statistics for Noank, out of the total population over 16 years of age (1,549), 63.0% or 976 individuals are in the labor force, with 0.9% or 9 of them unemployed. The age group with the highest labor force participation rate is 20 to 24 years, with 100.0% or 12 individuals in the labor force. Within the labor force, the 60 to 64 years age range has the highest percentage of unemployed individuals, with 8.4% or 9 of them being unemployed.
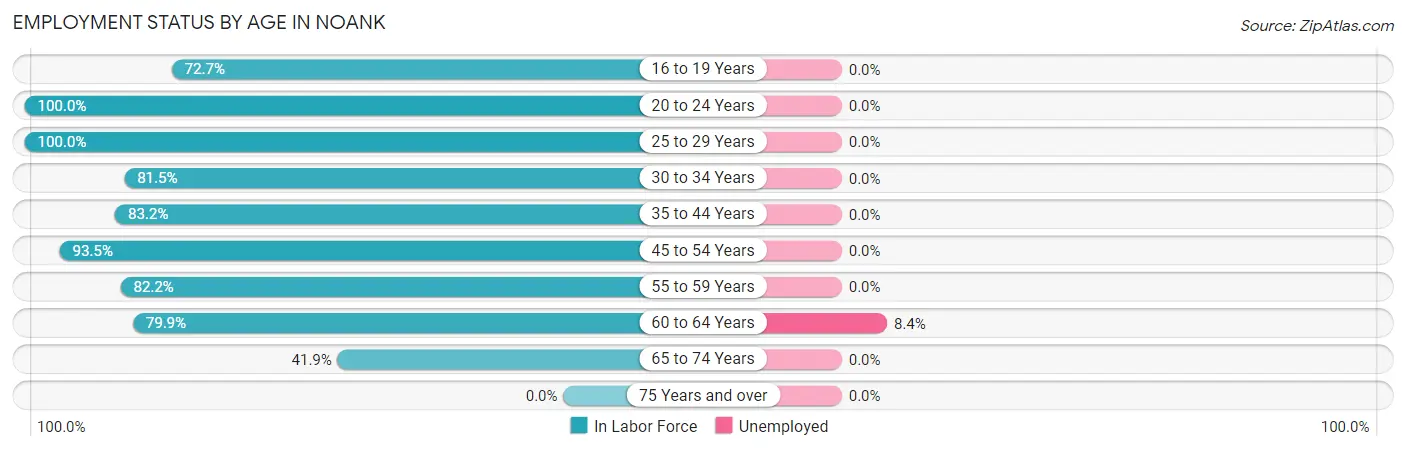
| Age Bracket | In Labor Force | Unemployed |
| 16 to 19 Years | 32 (72.7%) | 0 (0.0%) |
| 20 to 24 Years | 12 (100.0%) | 0 (0.0%) |
| 25 to 29 Years | 26 (100.0%) | 0 (0.0%) |
| 30 to 34 Years | 44 (81.5%) | 0 (0.0%) |
| 35 to 44 Years | 158 (83.2%) | 0 (0.0%) |
| 45 to 54 Years | 315 (93.5%) | 0 (0.0%) |
| 55 to 59 Years | 125 (82.2%) | 0 (0.0%) |
| 60 to 64 Years | 107 (79.9%) | 9 (8.4%) |
| 65 to 74 Years | 157 (41.9%) | 0 (0.0%) |
| 75 Years and over | 0 (0.0%) | 0 (0.0%) |
| Total | 976 (63.0%) | 9 (0.9%) |
Employment Status by Educational Attainment in Noank
According to labor force statistics for Noank, 86.8% of individuals (775) out of the total population between 25 and 64 years of age (893) are in the labor force, with 1.2% or 9 of them being unemployed. The group with the highest labor force participation rate are those with the educational attainment of bachelor's degree or higher, with 91.4% or 640 individuals in the labor force. Within the labor force, individuals with bachelor's degree or higher education have the highest percentage of unemployment, with 1.4% or 9 of them being unemployed.
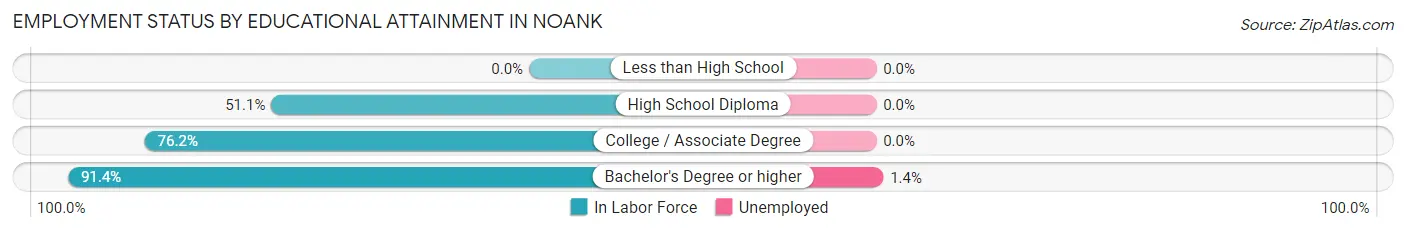
| Educational Attainment | In Labor Force | Unemployed |
| Less than High School | 0 (0.0%) | 0 (0.0%) |
| High School Diploma | 23 (51.1%) | 0 (0.0%) |
| College / Associate Degree | 112 (76.2%) | 0 (0.0%) |
| Bachelor's Degree or higher | 640 (91.4%) | 10 (1.4%) |
| Total | 775 (86.8%) | 11 (1.2%) |
Employment Occupations by Sex in Noank
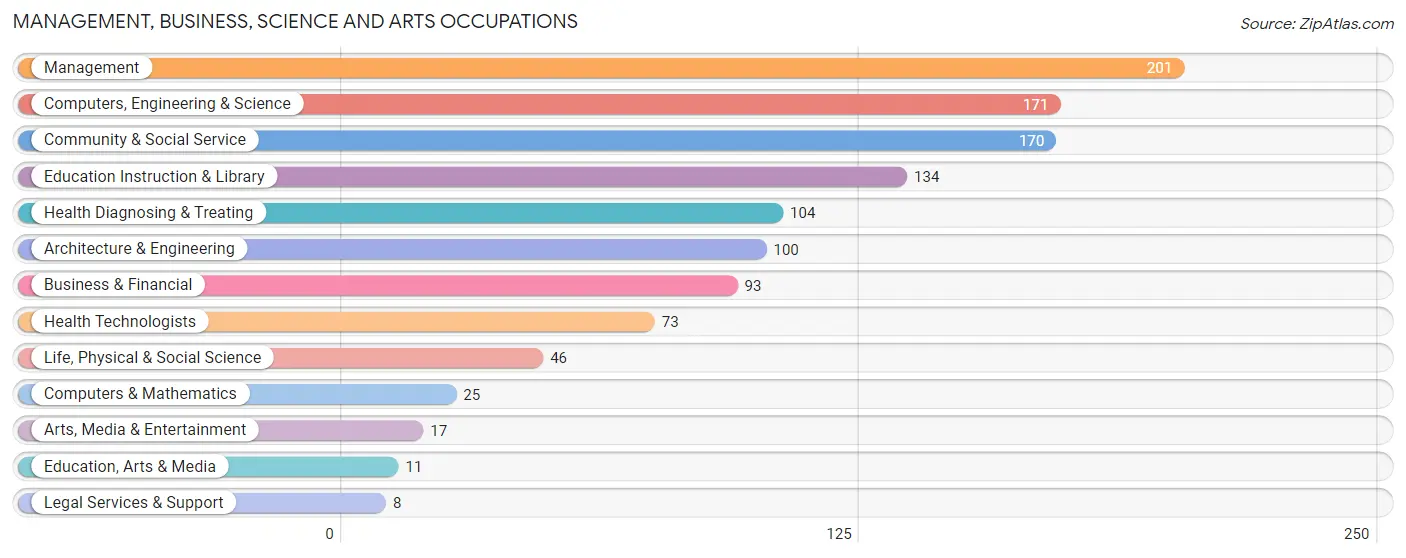
Management, Business, Science and Arts Occupations
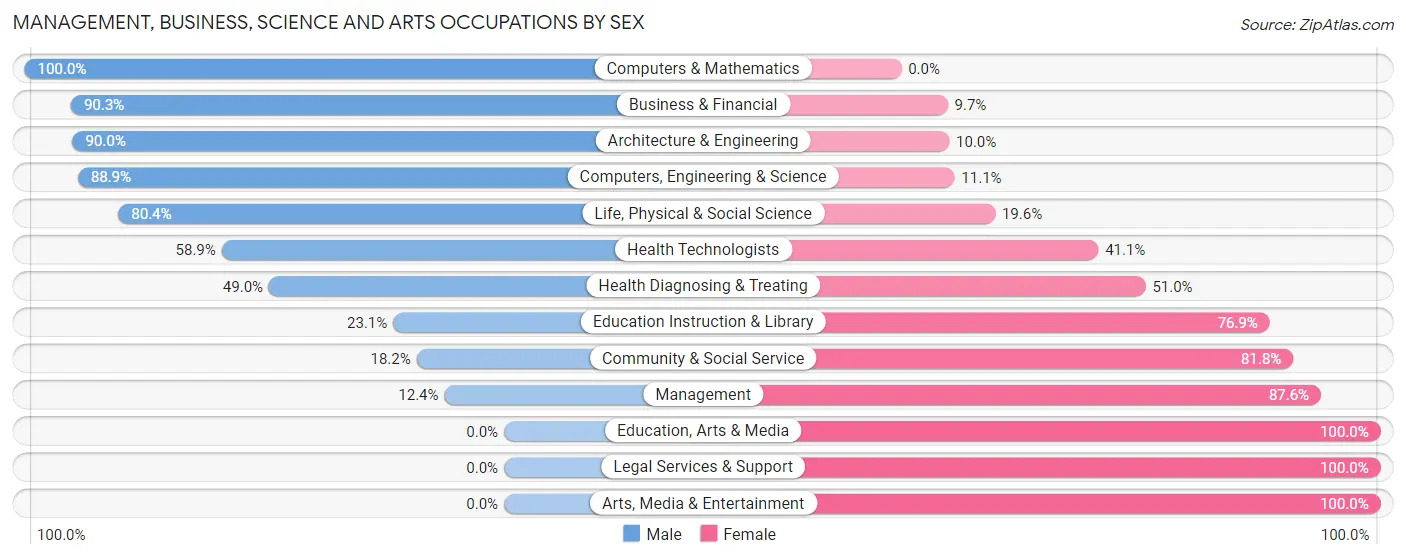
The most common Management, Business, Science and Arts occupations in Noank are Management (201 | 20.8%), Computers, Engineering & Science (171 | 17.7%), Community & Social Service (170 | 17.6%), Education Instruction & Library (134 | 13.9%), and Health Diagnosing & Treating (104 | 10.7%).
Management, Business, Science and Arts Occupations by Sex
Within the Management, Business, Science and Arts occupations in Noank, the most male-oriented occupations are Computers & Mathematics (100.0%), Business & Financial (90.3%), and Architecture & Engineering (90.0%), while the most female-oriented occupations are Education, Arts & Media (100.0%), Legal Services & Support (100.0%), and Arts, Media & Entertainment (100.0%).
| Occupation | Male | Female |
| Management | 25 (12.4%) | 176 (87.6%) |
| Business & Financial | 84 (90.3%) | 9 (9.7%) |
| Computers, Engineering & Science | 152 (88.9%) | 19 (11.1%) |
| Computers & Mathematics | 25 (100.0%) | 0 (0.0%) |
| Architecture & Engineering | 90 (90.0%) | 10 (10.0%) |
| Life, Physical & Social Science | 37 (80.4%) | 9 (19.6%) |
| Community & Social Service | 31 (18.2%) | 139 (81.8%) |
| Education, Arts & Media | 0 (0.0%) | 11 (100.0%) |
| Legal Services & Support | 0 (0.0%) | 8 (100.0%) |
| Education Instruction & Library | 31 (23.1%) | 103 (76.9%) |
| Arts, Media & Entertainment | 0 (0.0%) | 17 (100.0%) |
| Health Diagnosing & Treating | 51 (49.0%) | 53 (51.0%) |
| Health Technologists | 43 (58.9%) | 30 (41.1%) |
| Total (Category) | 343 (46.4%) | 396 (53.6%) |
| Total (Overall) | 465 (48.1%) | 502 (51.9%) |
Services Occupations
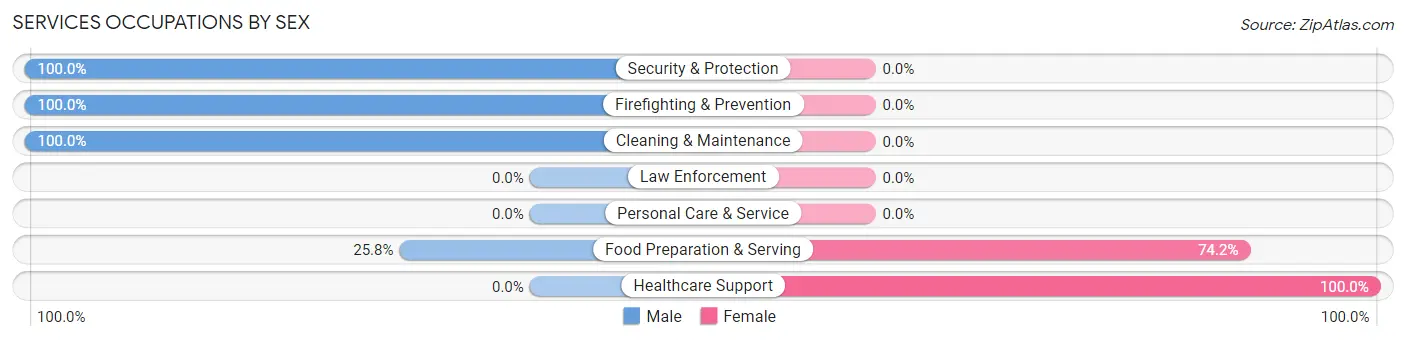
The most common Services occupations in Noank are Food Preparation & Serving (31 | 3.2%), Healthcare Support (12 | 1.2%), Security & Protection (9 | 0.9%), Firefighting & Prevention (9 | 0.9%), and Cleaning & Maintenance (9 | 0.9%).

Services Occupations by Sex
Within the Services occupations in Noank, the most male-oriented occupations are Security & Protection (100.0%), Firefighting & Prevention (100.0%), and Cleaning & Maintenance (100.0%), while the most female-oriented occupations are Healthcare Support (100.0%), and Food Preparation & Serving (74.2%).
| Occupation | Male | Female |
| Healthcare Support | 0 (0.0%) | 12 (100.0%) |
| Security & Protection | 9 (100.0%) | 0 (0.0%) |
| Firefighting & Prevention | 9 (100.0%) | 0 (0.0%) |
| Law Enforcement | 0 (0.0%) | 0 (0.0%) |
| Food Preparation & Serving | 8 (25.8%) | 23 (74.2%) |
| Cleaning & Maintenance | 9 (100.0%) | 0 (0.0%) |
| Personal Care & Service | 0 (0.0%) | 0 (0.0%) |
| Total (Category) | 26 (42.6%) | 35 (57.4%) |
| Total (Overall) | 465 (48.1%) | 502 (51.9%) |
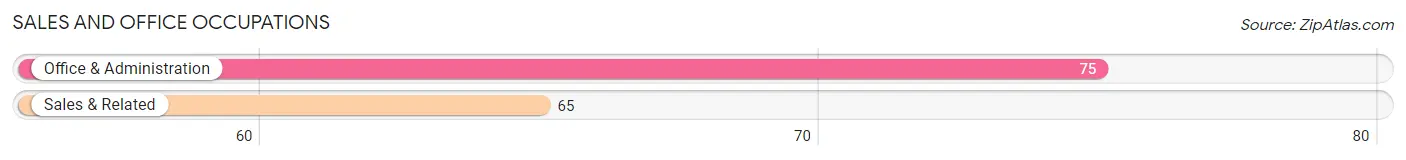
Sales and Office Occupations
The most common Sales and Office occupations in Noank are Office & Administration (75 | 7.8%), and Sales & Related (65 | 6.7%).
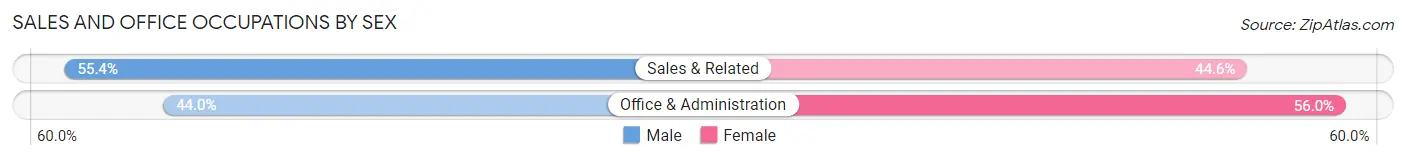
Sales and Office Occupations by Sex
| Occupation | Male | Female |
| Sales & Related | 36 (55.4%) | 29 (44.6%) |
| Office & Administration | 33 (44.0%) | 42 (56.0%) |
| Total (Category) | 69 (49.3%) | 71 (50.7%) |
| Total (Overall) | 465 (48.1%) | 502 (51.9%) |
Natural Resources, Construction and Maintenance Occupations
The most common Natural Resources, Construction and Maintenance occupations in Noank are , and Installation, Maintenance & Repair (16 | 1.7%).
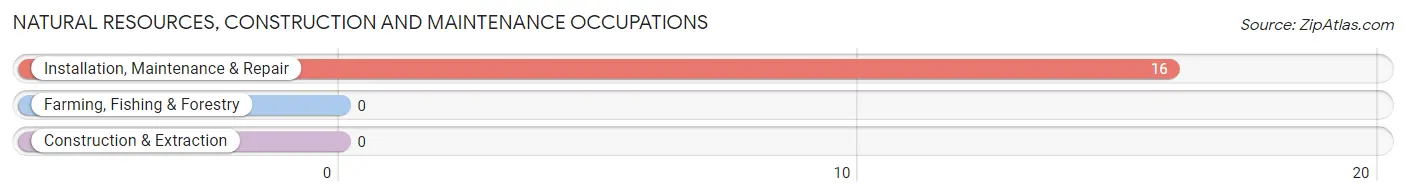
Natural Resources, Construction and Maintenance Occupations by Sex
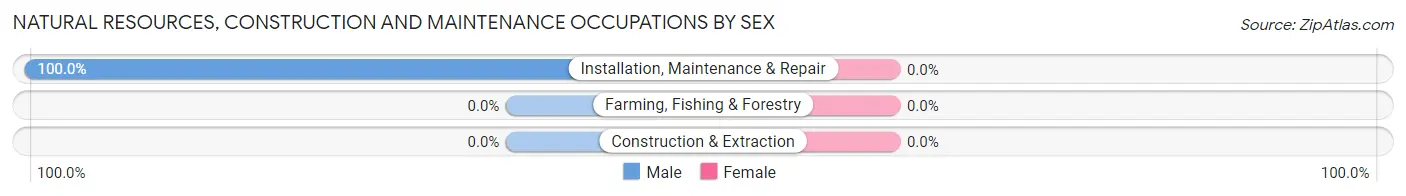
| Occupation | Male | Female |
| Farming, Fishing & Forestry | 0 (0.0%) | 0 (0.0%) |
| Construction & Extraction | 0 (0.0%) | 0 (0.0%) |
| Installation, Maintenance & Repair | 16 (100.0%) | 0 (0.0%) |
| Total (Category) | 16 (100.0%) | 0 (0.0%) |
| Total (Overall) | 465 (48.1%) | 502 (51.9%) |
Production, Transportation and Moving Occupations
The most common Production, Transportation and Moving occupations in Noank are , and Production (11 | 1.1%).
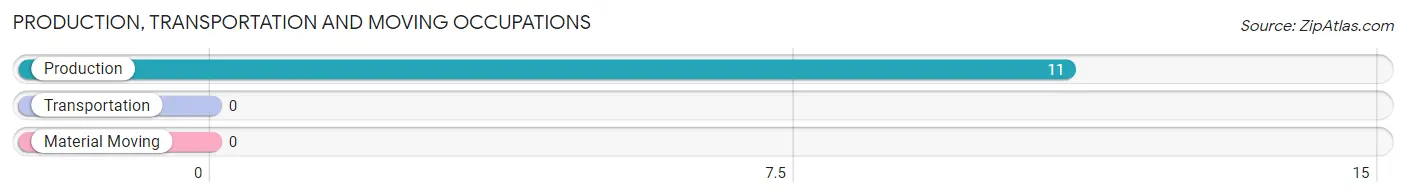
Production, Transportation and Moving Occupations by Sex
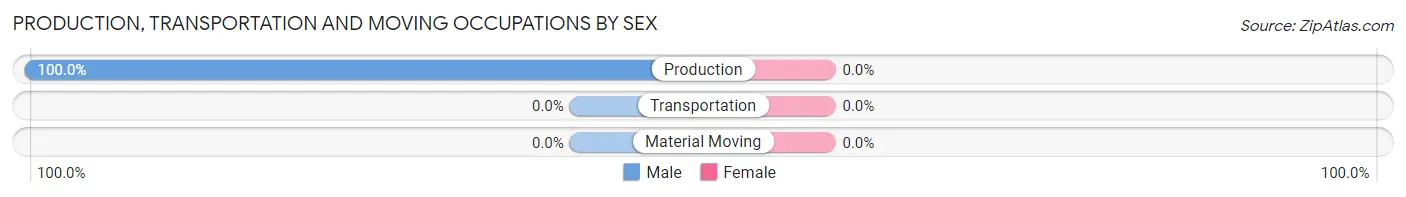
| Occupation | Male | Female |
| Production | 11 (100.0%) | 0 (0.0%) |
| Transportation | 0 (0.0%) | 0 (0.0%) |
| Material Moving | 0 (0.0%) | 0 (0.0%) |
| Total (Category) | 11 (100.0%) | 0 (0.0%) |
| Total (Overall) | 465 (48.1%) | 502 (51.9%) |
Employment Industries by Sex in Noank
Employment Industries in Noank
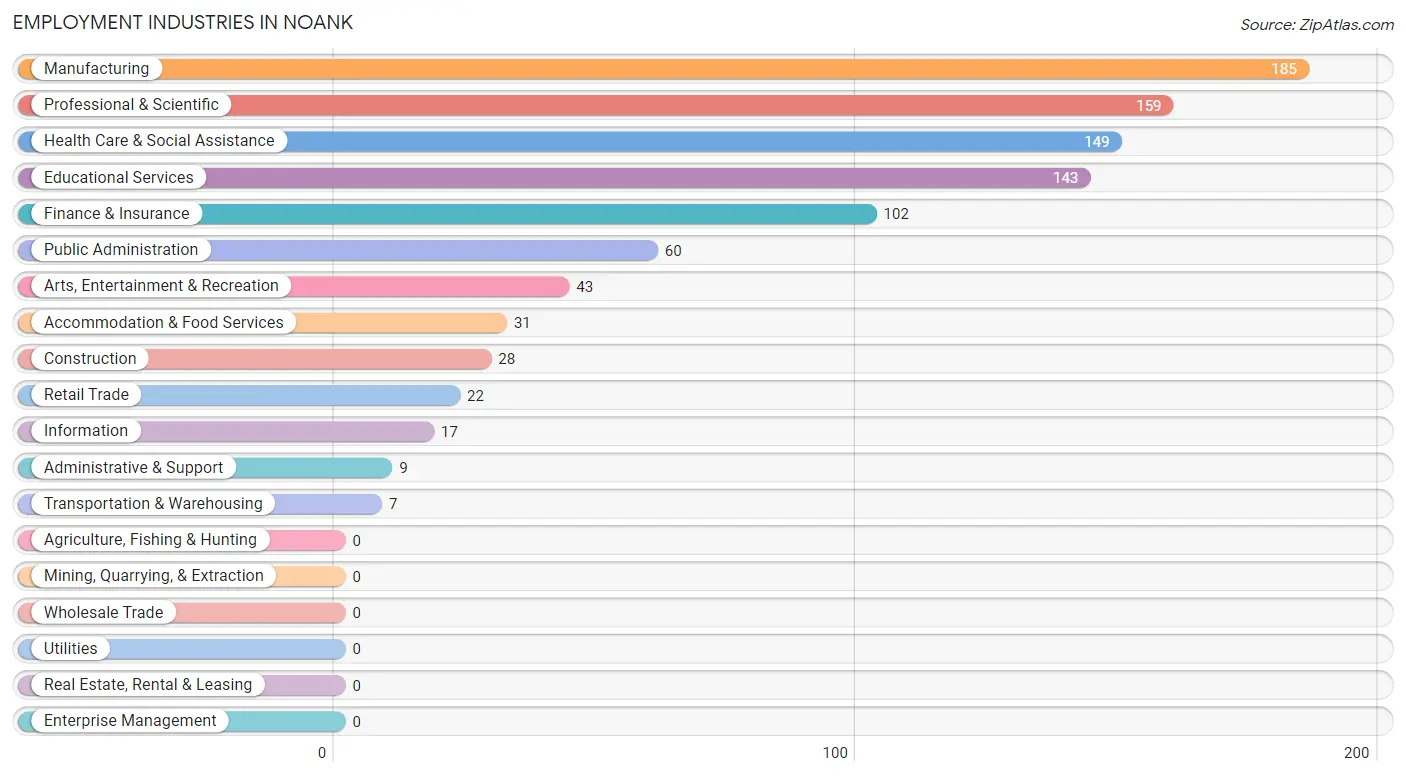
The major employment industries in Noank include Manufacturing (185 | 19.1%), Professional & Scientific (159 | 16.4%), Health Care & Social Assistance (149 | 15.4%), Educational Services (143 | 14.8%), and Finance & Insurance (102 | 10.5%).
Employment Industries by Sex in Noank
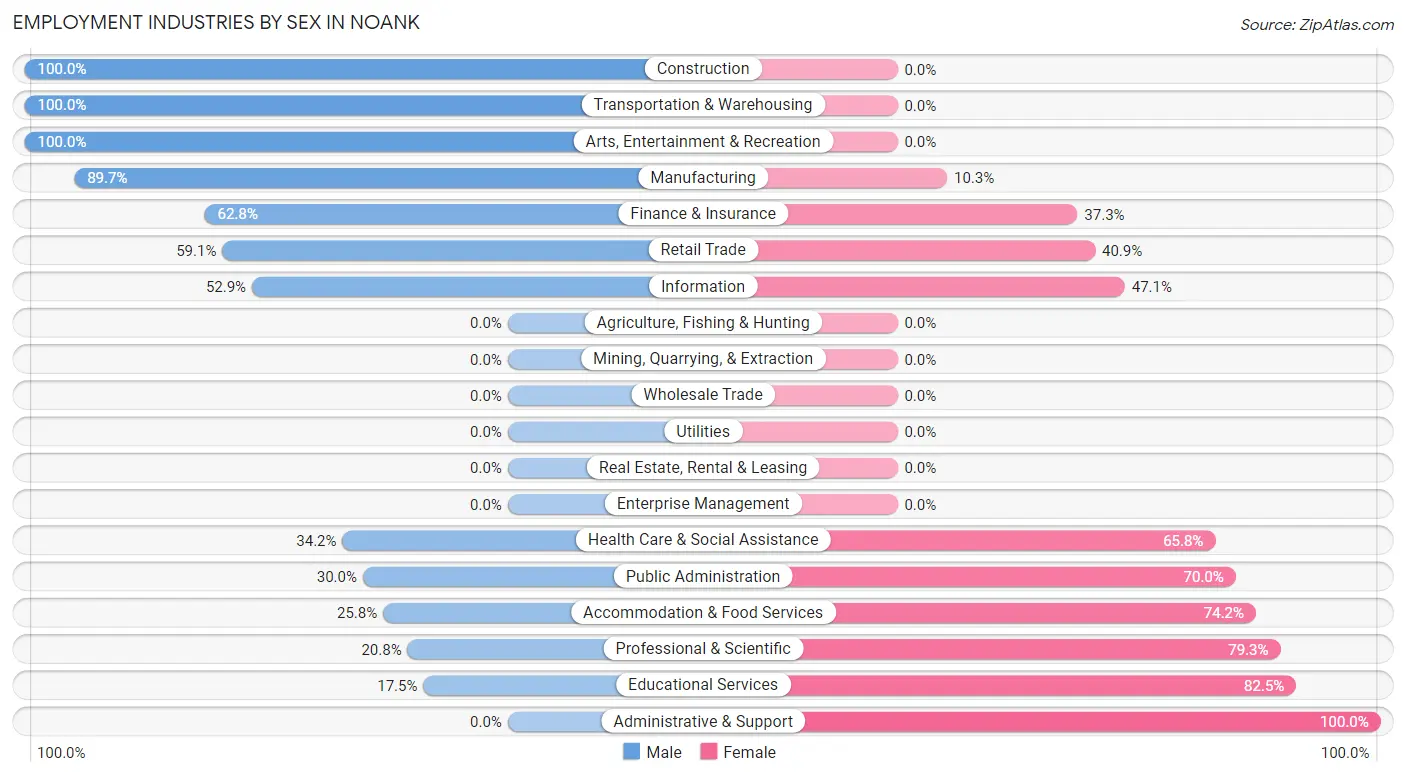
The Noank industries that see more men than women are Construction (100.0%), Transportation & Warehousing (100.0%), and Arts, Entertainment & Recreation (100.0%), whereas the industries that tend to have a higher number of women are Administrative & Support (100.0%), Educational Services (82.5%), and Professional & Scientific (79.2%).
| Industry | Male | Female |
| Agriculture, Fishing & Hunting | 0 (0.0%) | 0 (0.0%) |
| Mining, Quarrying, & Extraction | 0 (0.0%) | 0 (0.0%) |
| Construction | 28 (100.0%) | 0 (0.0%) |
| Manufacturing | 166 (89.7%) | 19 (10.3%) |
| Wholesale Trade | 0 (0.0%) | 0 (0.0%) |
| Retail Trade | 13 (59.1%) | 9 (40.9%) |
| Transportation & Warehousing | 7 (100.0%) | 0 (0.0%) |
| Utilities | 0 (0.0%) | 0 (0.0%) |
| Information | 9 (52.9%) | 8 (47.1%) |
| Finance & Insurance | 64 (62.7%) | 38 (37.2%) |
| Real Estate, Rental & Leasing | 0 (0.0%) | 0 (0.0%) |
| Professional & Scientific | 33 (20.7%) | 126 (79.2%) |
| Enterprise Management | 0 (0.0%) | 0 (0.0%) |
| Administrative & Support | 0 (0.0%) | 9 (100.0%) |
| Educational Services | 25 (17.5%) | 118 (82.5%) |
| Health Care & Social Assistance | 51 (34.2%) | 98 (65.8%) |
| Arts, Entertainment & Recreation | 43 (100.0%) | 0 (0.0%) |
| Accommodation & Food Services | 8 (25.8%) | 23 (74.2%) |
| Public Administration | 18 (30.0%) | 42 (70.0%) |
| Total | 465 (48.1%) | 502 (51.9%) |
Education in Noank
School Enrollment in Noank
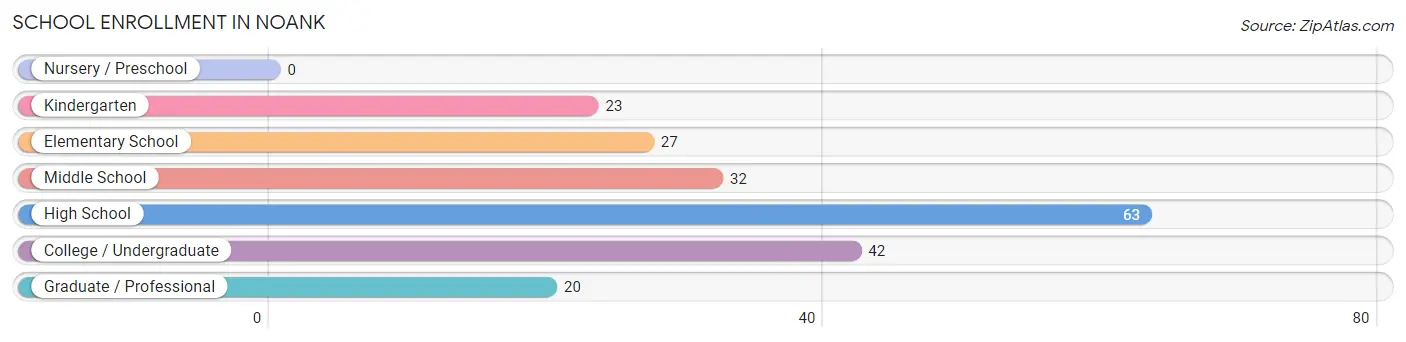
The most common levels of schooling among the 207 students in Noank are high school (63 | 30.4%), college / undergraduate (42 | 20.3%), and middle school (32 | 15.5%).
| School Level | # Students | % Students |
| Nursery / Preschool | 0 | 0.0% |
| Kindergarten | 23 | 11.1% |
| Elementary School | 27 | 13.0% |
| Middle School | 32 | 15.5% |
| High School | 63 | 30.4% |
| College / Undergraduate | 42 | 20.3% |
| Graduate / Professional | 20 | 9.7% |
| Total | 207 | 100.0% |
School Enrollment by Age by Funding Source in Noank
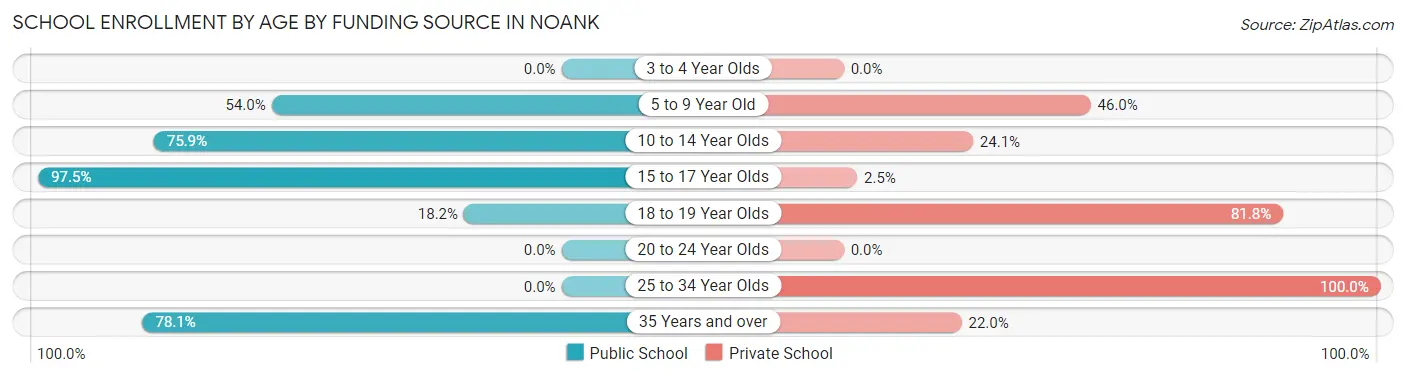
Out of a total of 207 students who are enrolled in schools in Noank, 66 (31.9%) attend a private institution, while the remaining 141 (68.1%) are enrolled in public schools. The age group of 25 to 34 year olds has the highest likelihood of being enrolled in private schools, with 11 (100.0% in the age bracket) enrolled. Conversely, the age group of 15 to 17 year olds has the lowest likelihood of being enrolled in a private school, with 39 (97.5% in the age bracket) attending a public institution.
| Age Bracket | Public School | Private School |
| 3 to 4 Year Olds | 0 (0.0%) | 0 (0.0%) |
| 5 to 9 Year Old | 27 (54.0%) | 23 (46.0%) |
| 10 to 14 Year Olds | 41 (75.9%) | 13 (24.1%) |
| 15 to 17 Year Olds | 39 (97.5%) | 1 (2.5%) |
| 18 to 19 Year Olds | 2 (18.2%) | 9 (81.8%) |
| 20 to 24 Year Olds | 0 (0.0%) | 0 (0.0%) |
| 25 to 34 Year Olds | 0 (0.0%) | 11 (100.0%) |
| 35 Years and over | 32 (78.0%) | 9 (22.0%) |
| Total | 141 (68.1%) | 66 (31.9%) |
Educational Attainment by Field of Study in Noank
Physical & health sciences (185 | 17.9%), science & technology (151 | 14.6%), literature & languages (106 | 10.2%), education (92 | 8.9%), and business (90 | 8.7%) are the most common fields of study among 1,034 individuals in Noank who have obtained a bachelor's degree or higher.
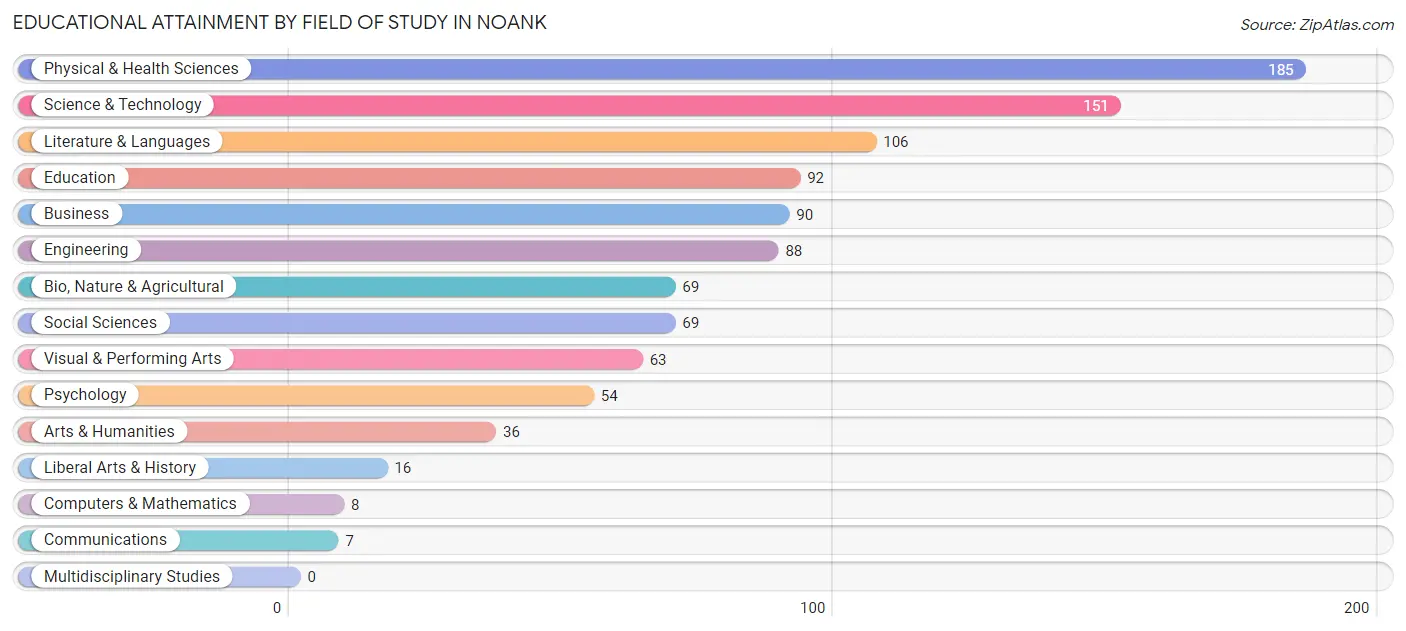
| Field of Study | # Graduates | % Graduates |
| Computers & Mathematics | 8 | 0.8% |
| Bio, Nature & Agricultural | 69 | 6.7% |
| Physical & Health Sciences | 185 | 17.9% |
| Psychology | 54 | 5.2% |
| Social Sciences | 69 | 6.7% |
| Engineering | 88 | 8.5% |
| Multidisciplinary Studies | 0 | 0.0% |
| Science & Technology | 151 | 14.6% |
| Business | 90 | 8.7% |
| Education | 92 | 8.9% |
| Literature & Languages | 106 | 10.2% |
| Liberal Arts & History | 16 | 1.5% |
| Visual & Performing Arts | 63 | 6.1% |
| Communications | 7 | 0.7% |
| Arts & Humanities | 36 | 3.5% |
| Total | 1,034 | 100.0% |
Transportation & Commute in Noank
Vehicle Availability by Sex in Noank
The most prevalent vehicle ownership categories in Noank are males with 4 vehicles (167, accounting for 35.9%) and females with 4 vehicles (130, making up 33.3%).
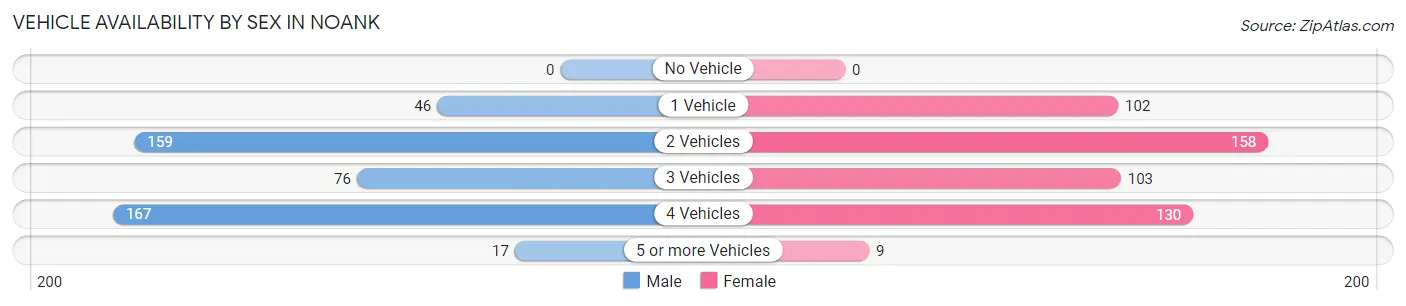
| Vehicles Available | Male | Female |
| No Vehicle | 0 (0.0%) | 0 (0.0%) |
| 1 Vehicle | 46 (9.9%) | 102 (20.3%) |
| 2 Vehicles | 159 (34.2%) | 158 (31.5%) |
| 3 Vehicles | 76 (16.3%) | 103 (20.5%) |
| 4 Vehicles | 167 (35.9%) | 130 (25.9%) |
| 5 or more Vehicles | 17 (3.7%) | 9 (1.8%) |
| Total | 465 (100.0%) | 502 (100.0%) |
Commute Time in Noank
The most frequently occuring commute durations in Noank are 15 to 19 minutes (312 commuters, 36.1%), 5 to 9 minutes (119 commuters, 13.8%), and 20 to 24 minutes (106 commuters, 12.3%).
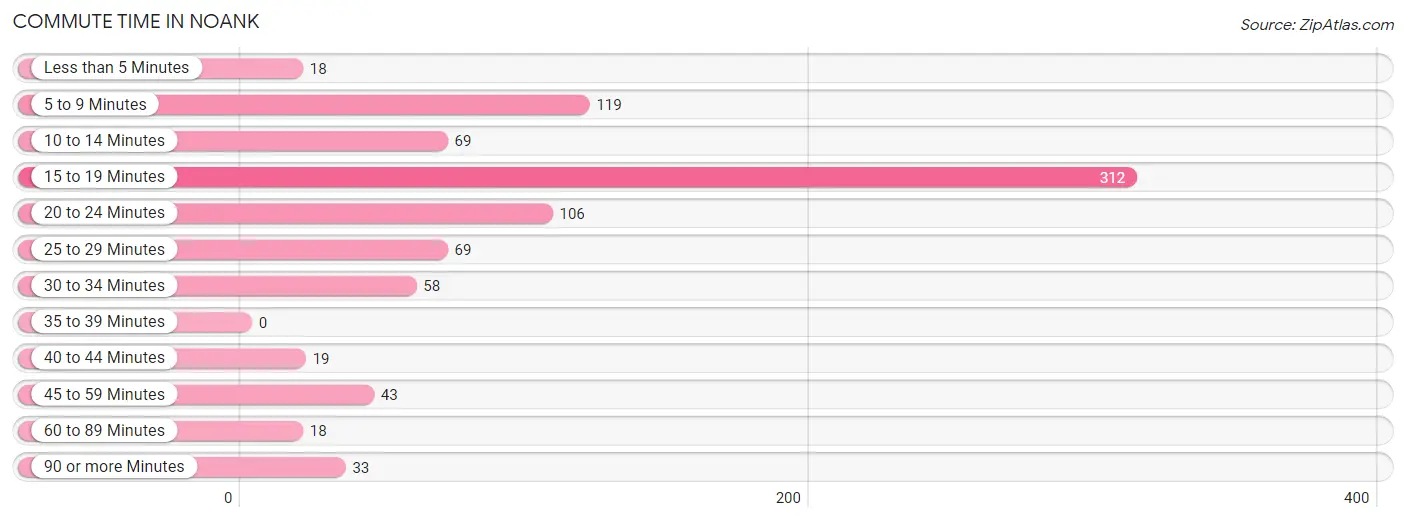
| Commute Time | # Commuters | % Commuters |
| Less than 5 Minutes | 18 | 2.1% |
| 5 to 9 Minutes | 119 | 13.8% |
| 10 to 14 Minutes | 69 | 8.0% |
| 15 to 19 Minutes | 312 | 36.1% |
| 20 to 24 Minutes | 106 | 12.3% |
| 25 to 29 Minutes | 69 | 8.0% |
| 30 to 34 Minutes | 58 | 6.7% |
| 35 to 39 Minutes | 0 | 0.0% |
| 40 to 44 Minutes | 19 | 2.2% |
| 45 to 59 Minutes | 43 | 5.0% |
| 60 to 89 Minutes | 18 | 2.1% |
| 90 or more Minutes | 33 | 3.8% |
Commute Time by Sex in Noank
The most common commute times in Noank are 15 to 19 minutes (96 commuters, 24.2%) for males and 15 to 19 minutes (216 commuters, 46.2%) for females.
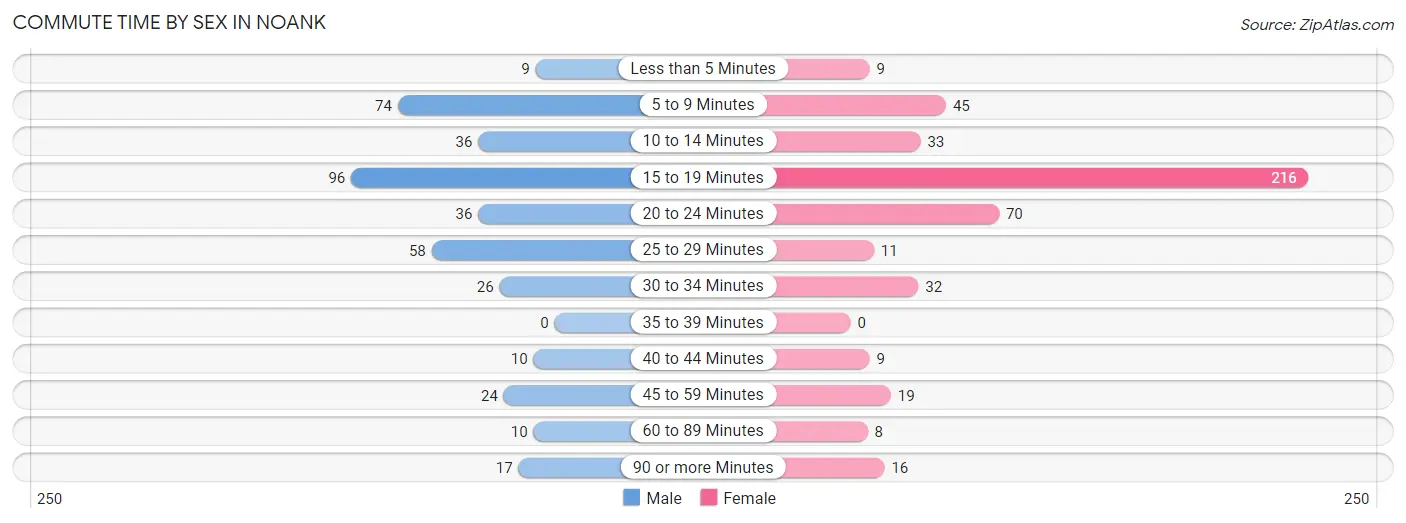
| Commute Time | Male | Female |
| Less than 5 Minutes | 9 (2.3%) | 9 (1.9%) |
| 5 to 9 Minutes | 74 (18.7%) | 45 (9.6%) |
| 10 to 14 Minutes | 36 (9.1%) | 33 (7.0%) |
| 15 to 19 Minutes | 96 (24.2%) | 216 (46.2%) |
| 20 to 24 Minutes | 36 (9.1%) | 70 (15.0%) |
| 25 to 29 Minutes | 58 (14.6%) | 11 (2.4%) |
| 30 to 34 Minutes | 26 (6.6%) | 32 (6.8%) |
| 35 to 39 Minutes | 0 (0.0%) | 0 (0.0%) |
| 40 to 44 Minutes | 10 (2.5%) | 9 (1.9%) |
| 45 to 59 Minutes | 24 (6.1%) | 19 (4.1%) |
| 60 to 89 Minutes | 10 (2.5%) | 8 (1.7%) |
| 90 or more Minutes | 17 (4.3%) | 16 (3.4%) |
Time of Departure to Work by Sex in Noank
The most frequent times of departure to work in Noank are 6:00 AM to 6:29 AM (94, 23.7%) for males and 6:00 AM to 6:29 AM (145, 31.0%) for females.
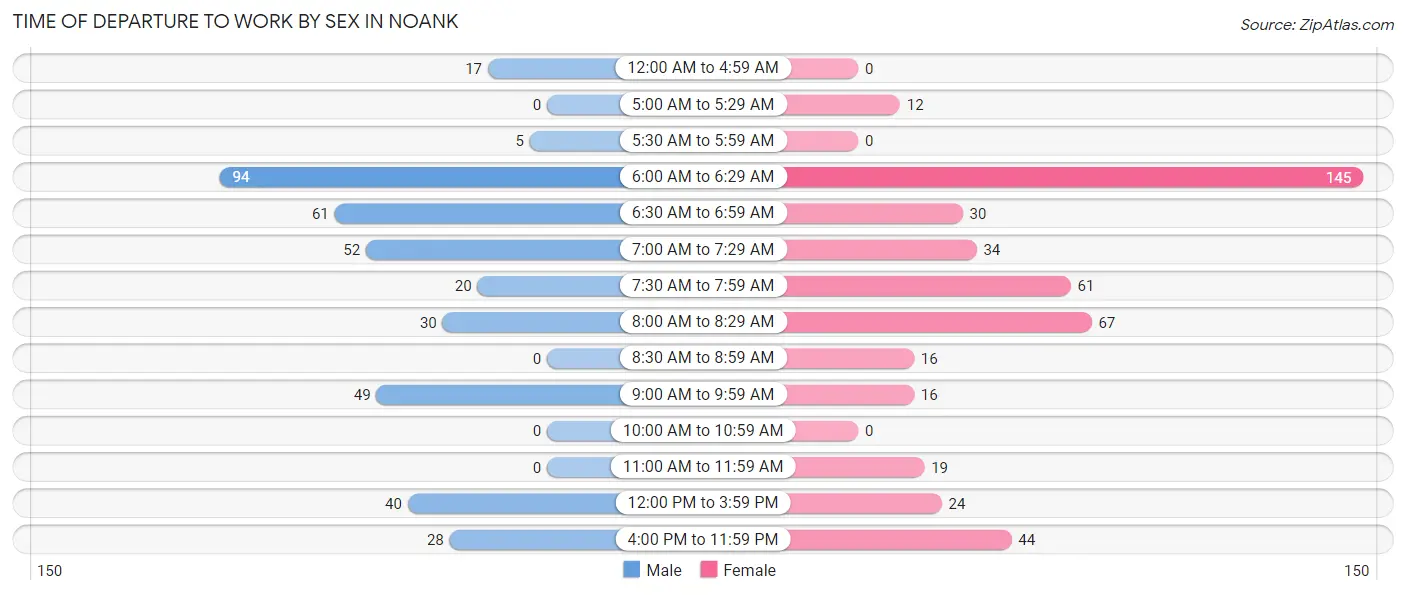
| Time of Departure | Male | Female |
| 12:00 AM to 4:59 AM | 17 (4.3%) | 0 (0.0%) |
| 5:00 AM to 5:29 AM | 0 (0.0%) | 12 (2.6%) |
| 5:30 AM to 5:59 AM | 5 (1.3%) | 0 (0.0%) |
| 6:00 AM to 6:29 AM | 94 (23.7%) | 145 (31.0%) |
| 6:30 AM to 6:59 AM | 61 (15.4%) | 30 (6.4%) |
| 7:00 AM to 7:29 AM | 52 (13.1%) | 34 (7.3%) |
| 7:30 AM to 7:59 AM | 20 (5.1%) | 61 (13.0%) |
| 8:00 AM to 8:29 AM | 30 (7.6%) | 67 (14.3%) |
| 8:30 AM to 8:59 AM | 0 (0.0%) | 16 (3.4%) |
| 9:00 AM to 9:59 AM | 49 (12.4%) | 16 (3.4%) |
| 10:00 AM to 10:59 AM | 0 (0.0%) | 0 (0.0%) |
| 11:00 AM to 11:59 AM | 0 (0.0%) | 19 (4.1%) |
| 12:00 PM to 3:59 PM | 40 (10.1%) | 24 (5.1%) |
| 4:00 PM to 11:59 PM | 28 (7.1%) | 44 (9.4%) |
| Total | 396 (100.0%) | 468 (100.0%) |
Housing Occupancy in Noank
Occupancy by Ownership in Noank
Of the total 780 dwellings in Noank, owner-occupied units account for 650 (83.3%), while renter-occupied units make up 130 (16.7%).
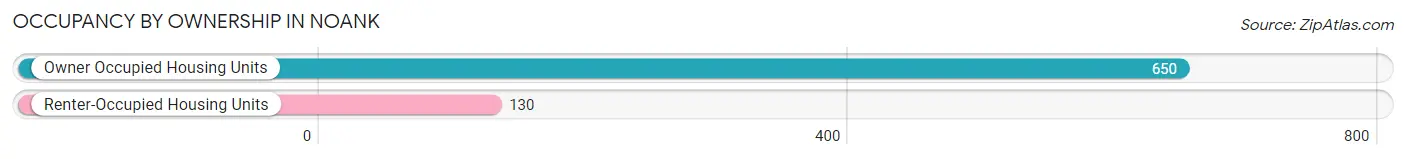
| Occupancy | # Housing Units | % Housing Units |
| Owner Occupied Housing Units | 650 | 83.3% |
| Renter-Occupied Housing Units | 130 | 16.7% |
| Total Occupied Housing Units | 780 | 100.0% |
Occupancy by Household Size in Noank

| Household Size | # Housing Units | % Housing Units |
| 1-Person Household | 219 | 28.1% |
| 2-Person Household | 359 | 46.0% |
| 3-Person Household | 120 | 15.4% |
| 4+ Person Household | 82 | 10.5% |
| Total Housing Units | 780 | 100.0% |
Occupancy by Ownership by Household Size in Noank
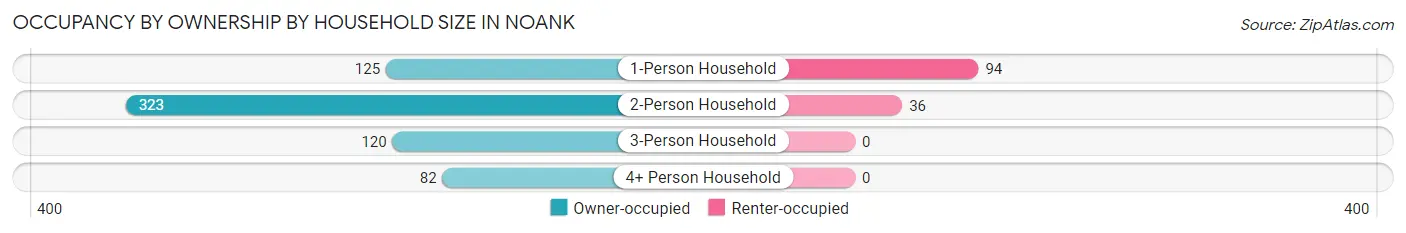
| Household Size | Owner-occupied | Renter-occupied |
| 1-Person Household | 125 (57.1%) | 94 (42.9%) |
| 2-Person Household | 323 (90.0%) | 36 (10.0%) |
| 3-Person Household | 120 (100.0%) | 0 (0.0%) |
| 4+ Person Household | 82 (100.0%) | 0 (0.0%) |
| Total Housing Units | 650 (83.3%) | 130 (16.7%) |
Occupancy by Educational Attainment in Noank
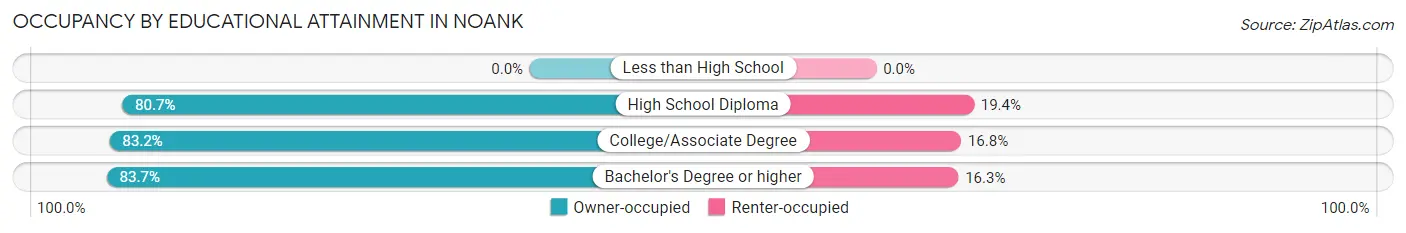
| Household Size | Owner-occupied | Renter-occupied |
| Less than High School | 0 (0.0%) | 0 (0.0%) |
| High School Diploma | 50 (80.6%) | 12 (19.4%) |
| College/Associate Degree | 183 (83.2%) | 37 (16.8%) |
| Bachelor's Degree or higher | 417 (83.7%) | 81 (16.3%) |
Occupancy by Age of Householder in Noank
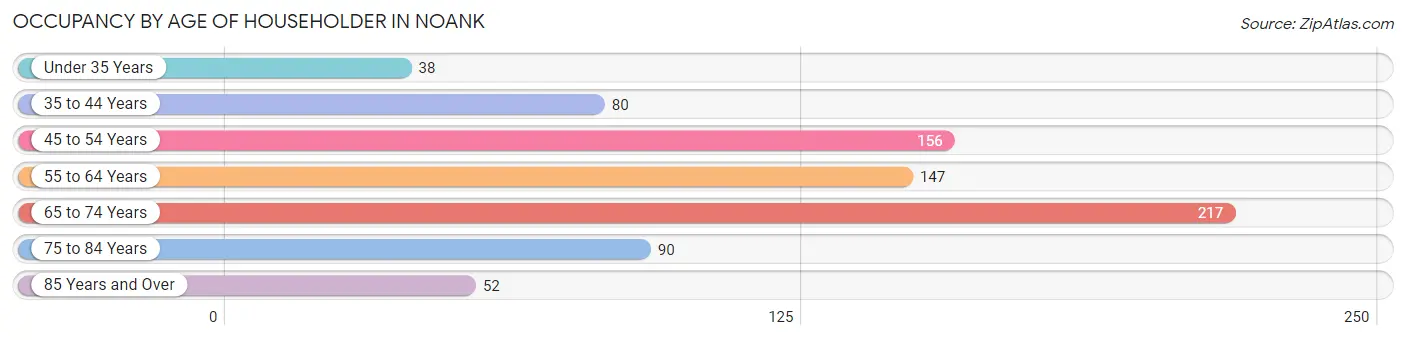
| Age Bracket | # Households | % Households |
| Under 35 Years | 38 | 4.9% |
| 35 to 44 Years | 80 | 10.3% |
| 45 to 54 Years | 156 | 20.0% |
| 55 to 64 Years | 147 | 18.9% |
| 65 to 74 Years | 217 | 27.8% |
| 75 to 84 Years | 90 | 11.5% |
| 85 Years and Over | 52 | 6.7% |
| Total | 780 | 100.0% |
Housing Finances in Noank
Median Income by Occupancy in Noank
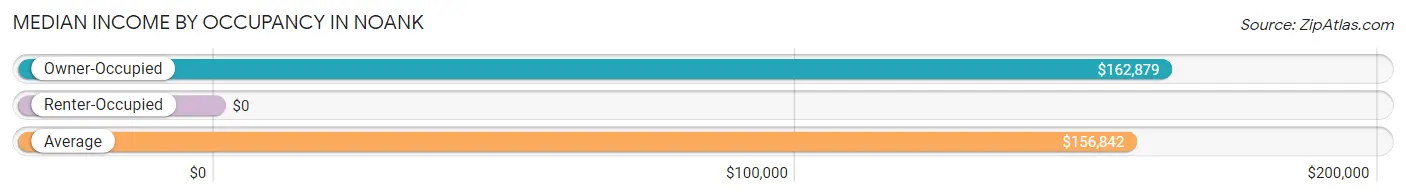
| Occupancy Type | # Households | Median Income |
| Owner-Occupied | 650 (83.3%) | $162,879 |
| Renter-Occupied | 130 (16.7%) | $0 |
| Average | 780 (100.0%) | $156,842 |
Occupancy by Householder Income Bracket in Noank
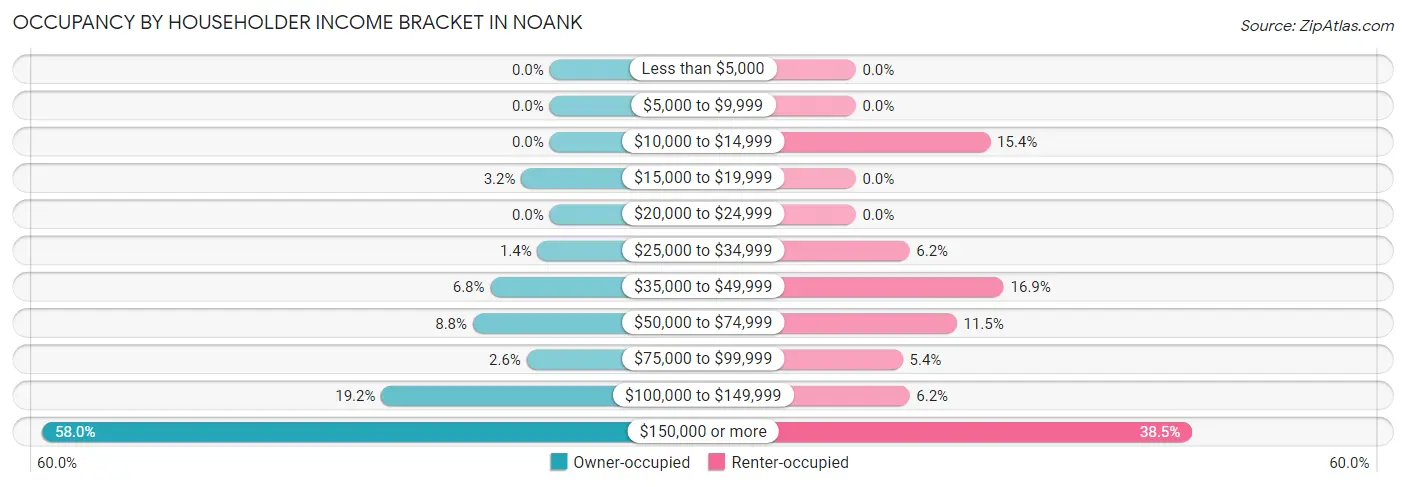
| Income Bracket | Owner-occupied | Renter-occupied |
| Less than $5,000 | 0 (0.0%) | 0 (0.0%) |
| $5,000 to $9,999 | 0 (0.0%) | 0 (0.0%) |
| $10,000 to $14,999 | 0 (0.0%) | 20 (15.4%) |
| $15,000 to $19,999 | 21 (3.2%) | 0 (0.0%) |
| $20,000 to $24,999 | 0 (0.0%) | 0 (0.0%) |
| $25,000 to $34,999 | 9 (1.4%) | 8 (6.1%) |
| $35,000 to $49,999 | 44 (6.8%) | 22 (16.9%) |
| $50,000 to $74,999 | 57 (8.8%) | 15 (11.5%) |
| $75,000 to $99,999 | 17 (2.6%) | 7 (5.4%) |
| $100,000 to $149,999 | 125 (19.2%) | 8 (6.1%) |
| $150,000 or more | 377 (58.0%) | 50 (38.5%) |
| Total | 650 (100.0%) | 130 (100.0%) |
Monthly Housing Cost Tiers in Noank
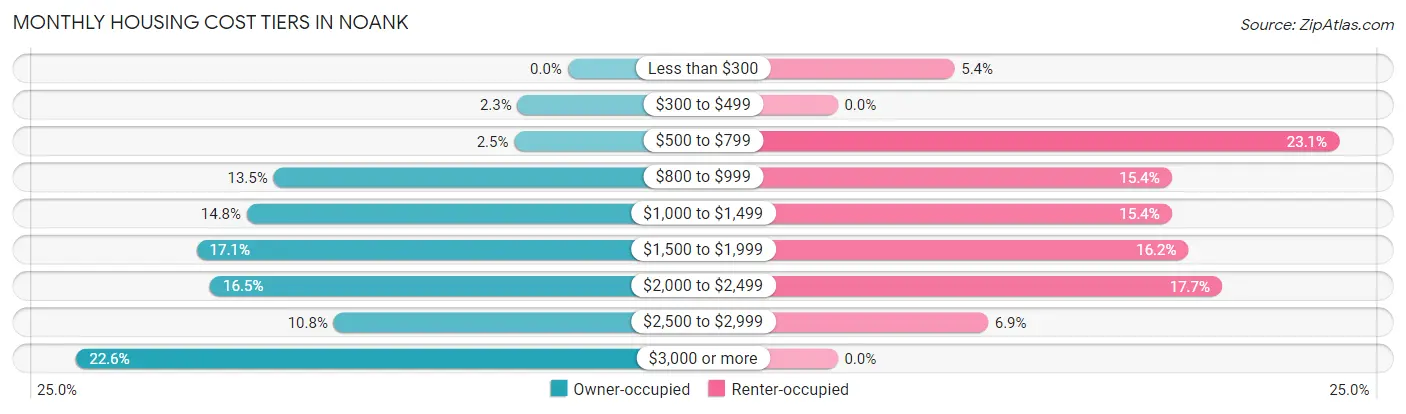
| Monthly Cost | Owner-occupied | Renter-occupied |
| Less than $300 | 0 (0.0%) | 7 (5.4%) |
| $300 to $499 | 15 (2.3%) | 0 (0.0%) |
| $500 to $799 | 16 (2.5%) | 30 (23.1%) |
| $800 to $999 | 88 (13.5%) | 20 (15.4%) |
| $1,000 to $1,499 | 96 (14.8%) | 20 (15.4%) |
| $1,500 to $1,999 | 111 (17.1%) | 21 (16.2%) |
| $2,000 to $2,499 | 107 (16.5%) | 23 (17.7%) |
| $2,500 to $2,999 | 70 (10.8%) | 9 (6.9%) |
| $3,000 or more | 147 (22.6%) | 0 (0.0%) |
| Total | 650 (100.0%) | 130 (100.0%) |
Physical Housing Characteristics in Noank
Housing Structures in Noank
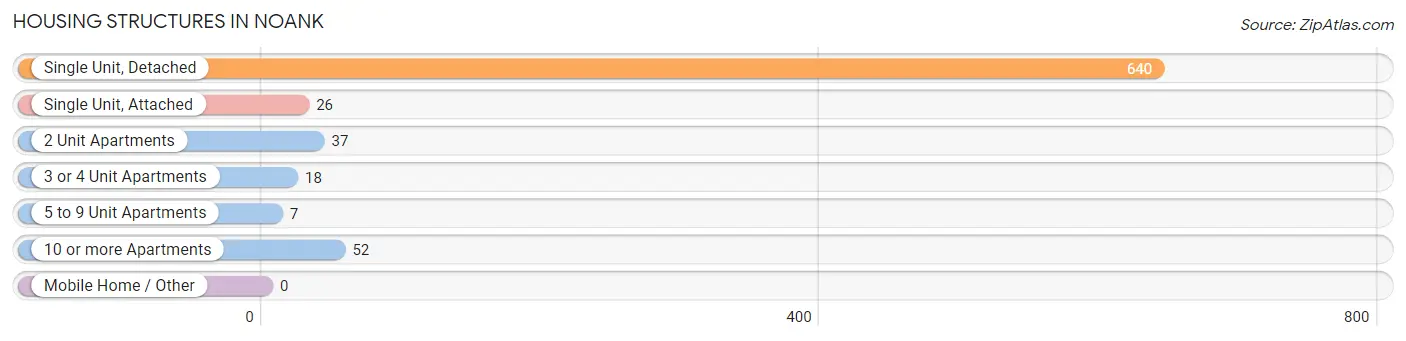
| Structure Type | # Housing Units | % Housing Units |
| Single Unit, Detached | 640 | 82.1% |
| Single Unit, Attached | 26 | 3.3% |
| 2 Unit Apartments | 37 | 4.7% |
| 3 or 4 Unit Apartments | 18 | 2.3% |
| 5 to 9 Unit Apartments | 7 | 0.9% |
| 10 or more Apartments | 52 | 6.7% |
| Mobile Home / Other | 0 | 0.0% |
| Total | 780 | 100.0% |
Housing Structures by Occupancy in Noank
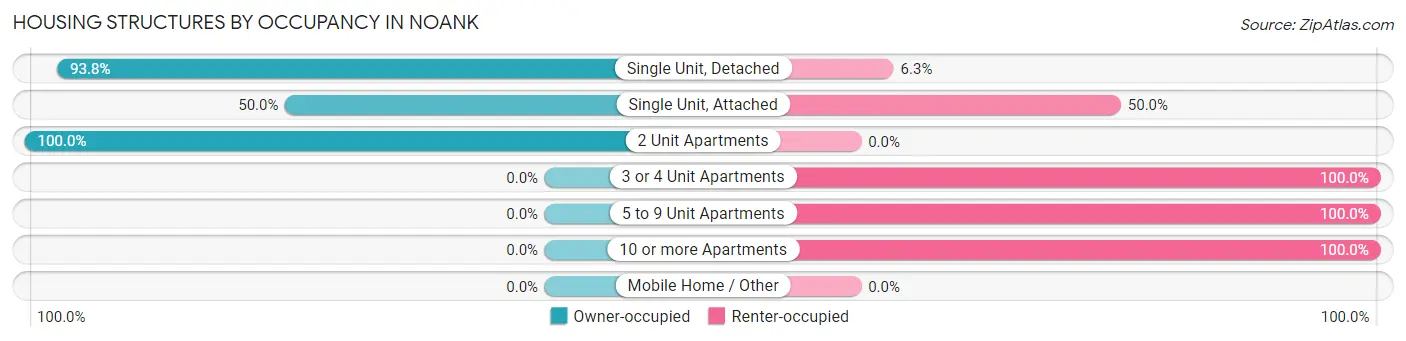
| Structure Type | Owner-occupied | Renter-occupied |
| Single Unit, Detached | 600 (93.8%) | 40 (6.2%) |
| Single Unit, Attached | 13 (50.0%) | 13 (50.0%) |
| 2 Unit Apartments | 37 (100.0%) | 0 (0.0%) |
| 3 or 4 Unit Apartments | 0 (0.0%) | 18 (100.0%) |
| 5 to 9 Unit Apartments | 0 (0.0%) | 7 (100.0%) |
| 10 or more Apartments | 0 (0.0%) | 52 (100.0%) |
| Mobile Home / Other | 0 (0.0%) | 0 (0.0%) |
| Total | 650 (83.3%) | 130 (16.7%) |
Housing Structures by Number of Rooms in Noank
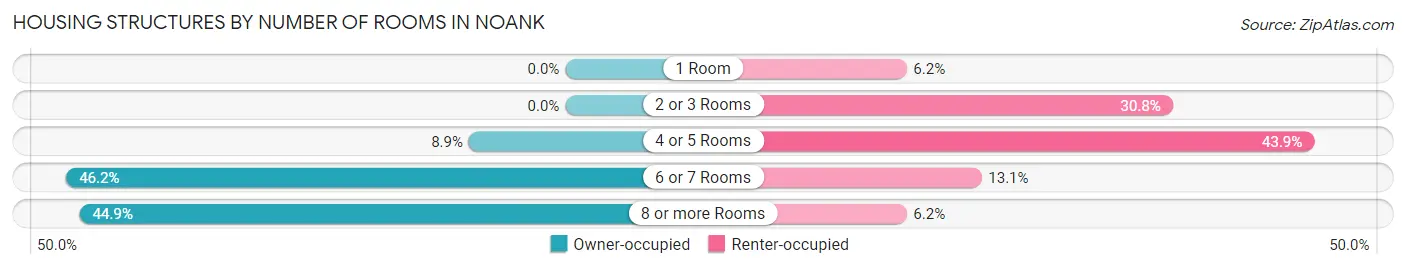
| Number of Rooms | Owner-occupied | Renter-occupied |
| 1 Room | 0 (0.0%) | 8 (6.1%) |
| 2 or 3 Rooms | 0 (0.0%) | 40 (30.8%) |
| 4 or 5 Rooms | 58 (8.9%) | 57 (43.9%) |
| 6 or 7 Rooms | 300 (46.2%) | 17 (13.1%) |
| 8 or more Rooms | 292 (44.9%) | 8 (6.1%) |
| Total | 650 (100.0%) | 130 (100.0%) |
Housing Structure by Heating Type in Noank
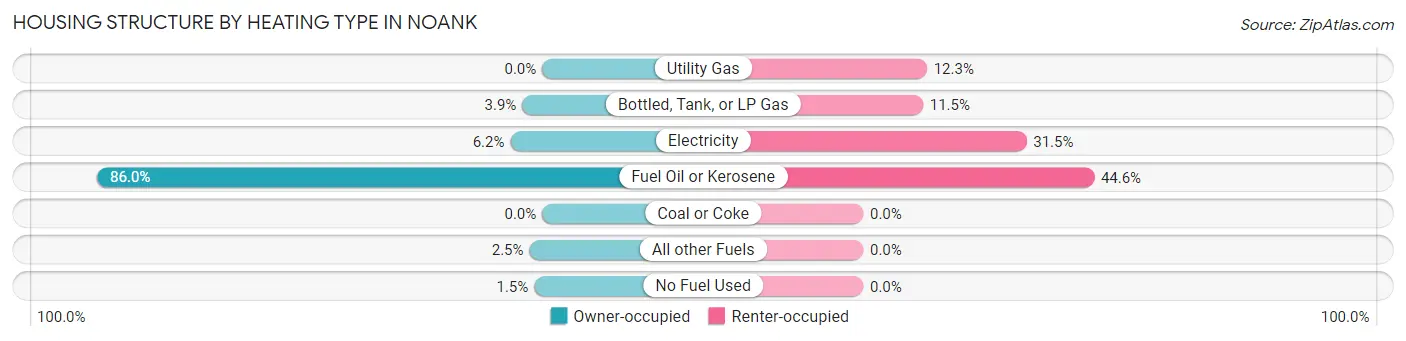
| Heating Type | Owner-occupied | Renter-occupied |
| Utility Gas | 0 (0.0%) | 16 (12.3%) |
| Bottled, Tank, or LP Gas | 25 (3.8%) | 15 (11.5%) |
| Electricity | 40 (6.1%) | 41 (31.5%) |
| Fuel Oil or Kerosene | 559 (86.0%) | 58 (44.6%) |
| Coal or Coke | 0 (0.0%) | 0 (0.0%) |
| All other Fuels | 16 (2.5%) | 0 (0.0%) |
| No Fuel Used | 10 (1.5%) | 0 (0.0%) |
| Total | 650 (100.0%) | 130 (100.0%) |
Household Vehicle Usage in Noank
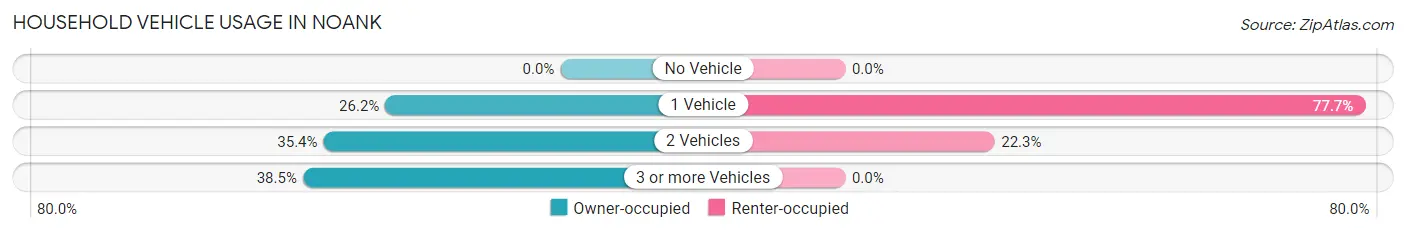
| Vehicles per Household | Owner-occupied | Renter-occupied |
| No Vehicle | 0 (0.0%) | 0 (0.0%) |
| 1 Vehicle | 170 (26.2%) | 101 (77.7%) |
| 2 Vehicles | 230 (35.4%) | 29 (22.3%) |
| 3 or more Vehicles | 250 (38.5%) | 0 (0.0%) |
| Total | 650 (100.0%) | 130 (100.0%) |
Real Estate & Mortgages in Noank
Real Estate and Mortgage Overview in Noank
| Characteristic | Without Mortgage | With Mortgage |
| Housing Units | 275 | 375 |
| Median Property Value | $607,300 | $392,100 |
| Median Household Income | $101,949 | $290 |
| Monthly Housing Costs | $1,056 | $147 |
| Real Estate Taxes | $7,041 | $0 |
Property Value by Mortgage Status in Noank
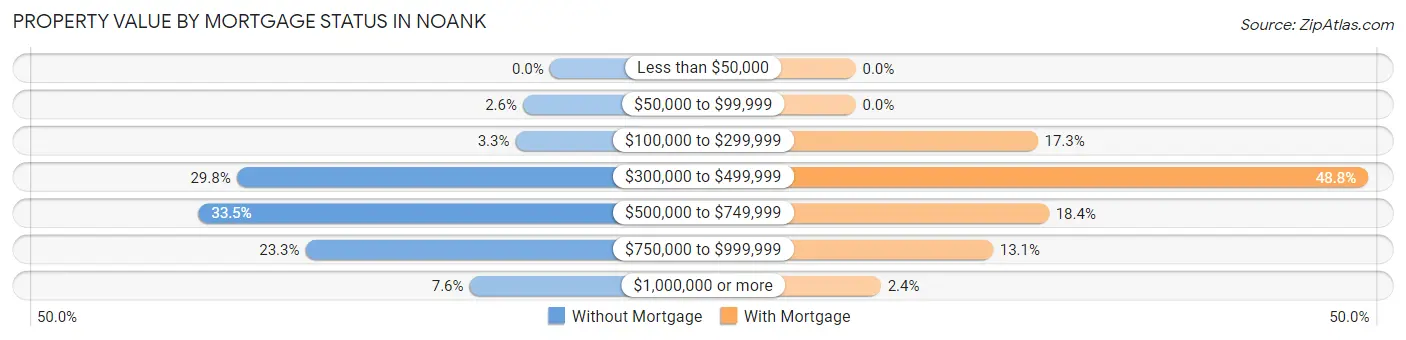
| Property Value | Without Mortgage | With Mortgage |
| Less than $50,000 | 0 (0.0%) | 0 (0.0%) |
| $50,000 to $99,999 | 7 (2.5%) | 0 (0.0%) |
| $100,000 to $299,999 | 9 (3.3%) | 65 (17.3%) |
| $300,000 to $499,999 | 82 (29.8%) | 183 (48.8%) |
| $500,000 to $749,999 | 92 (33.5%) | 69 (18.4%) |
| $750,000 to $999,999 | 64 (23.3%) | 49 (13.1%) |
| $1,000,000 or more | 21 (7.6%) | 9 (2.4%) |
| Total | 275 (100.0%) | 375 (100.0%) |
Household Income by Mortgage Status in Noank
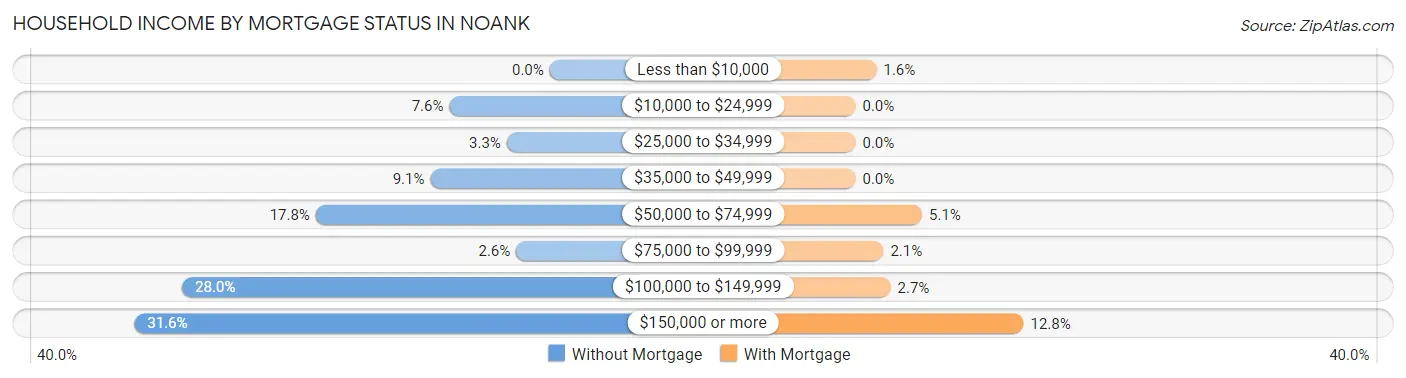
| Household Income | Without Mortgage | With Mortgage |
| Less than $10,000 | 0 (0.0%) | 6 (1.6%) |
| $10,000 to $24,999 | 21 (7.6%) | 0 (0.0%) |
| $25,000 to $34,999 | 9 (3.3%) | 0 (0.0%) |
| $35,000 to $49,999 | 25 (9.1%) | 0 (0.0%) |
| $50,000 to $74,999 | 49 (17.8%) | 19 (5.1%) |
| $75,000 to $99,999 | 7 (2.5%) | 8 (2.1%) |
| $100,000 to $149,999 | 77 (28.0%) | 10 (2.7%) |
| $150,000 or more | 87 (31.6%) | 48 (12.8%) |
| Total | 275 (100.0%) | 375 (100.0%) |
Property Value to Household Income Ratio in Noank
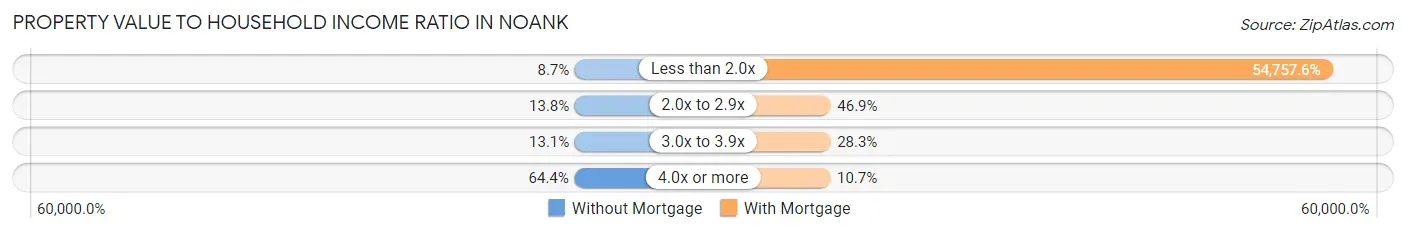
| Value-to-Income Ratio | Without Mortgage | With Mortgage |
| Less than 2.0x | 24 (8.7%) | 205,341 (54,757.6%) |
| 2.0x to 2.9x | 38 (13.8%) | 176 (46.9%) |
| 3.0x to 3.9x | 36 (13.1%) | 106 (28.3%) |
| 4.0x or more | 177 (64.4%) | 40 (10.7%) |
| Total | 275 (100.0%) | 375 (100.0%) |
Real Estate Taxes by Mortgage Status in Noank
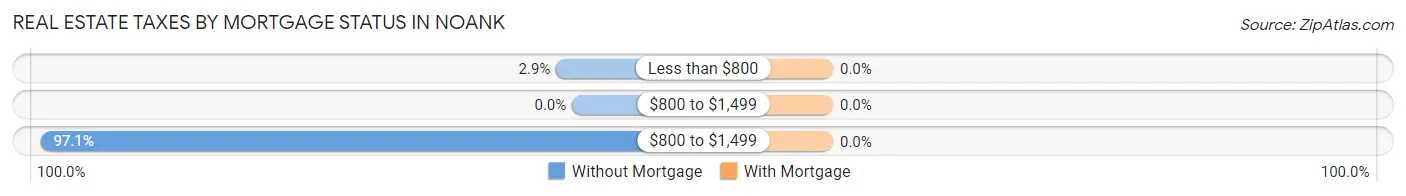
| Property Taxes | Without Mortgage | With Mortgage |
| Less than $800 | 8 (2.9%) | 0 (0.0%) |
| $800 to $1,499 | 0 (0.0%) | 0 (0.0%) |
| $800 to $1,499 | 267 (97.1%) | 0 (0.0%) |
| Total | 275 (100.0%) | 375 (100.0%) |
Health & Disability in Noank
Health Insurance Coverage by Age in Noank
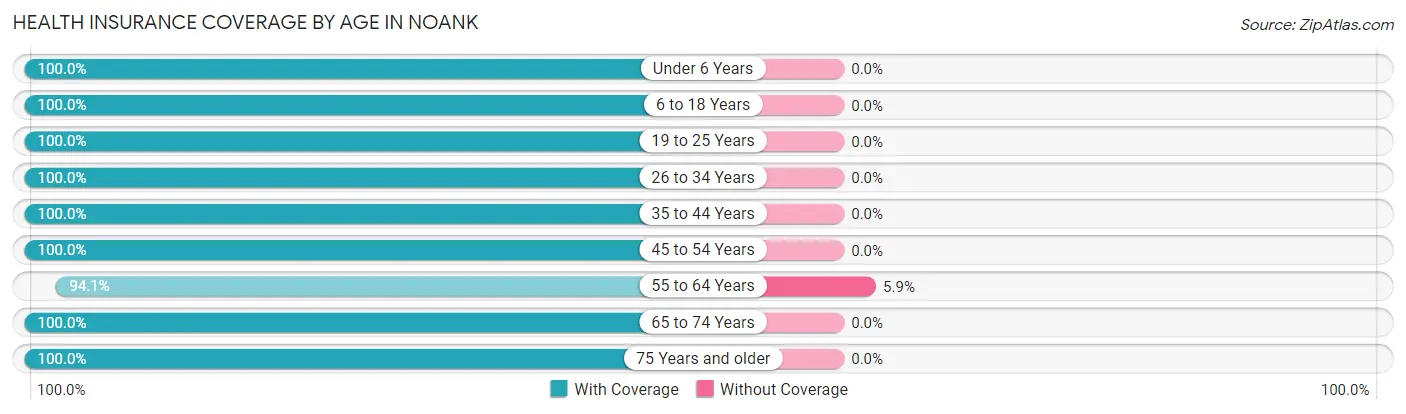
| Age Bracket | With Coverage | Without Coverage |
| Under 6 Years | 48 (100.0%) | 0 (0.0%) |
| 6 to 18 Years | 142 (100.0%) | 0 (0.0%) |
| 19 to 25 Years | 32 (100.0%) | 0 (0.0%) |
| 26 to 34 Years | 69 (100.0%) | 0 (0.0%) |
| 35 to 44 Years | 190 (100.0%) | 0 (0.0%) |
| 45 to 54 Years | 337 (100.0%) | 0 (0.0%) |
| 55 to 64 Years | 269 (94.1%) | 17 (5.9%) |
| 65 to 74 Years | 375 (100.0%) | 0 (0.0%) |
| 75 Years and older | 225 (100.0%) | 0 (0.0%) |
| Total | 1,687 (99.0%) | 17 (1.0%) |
Health Insurance Coverage by Citizenship Status in Noank
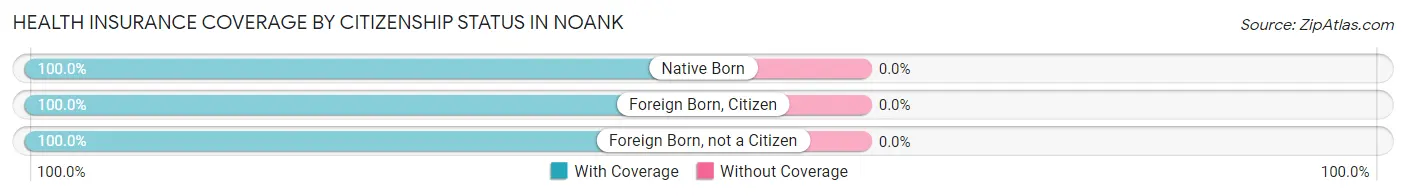
| Citizenship Status | With Coverage | Without Coverage |
| Native Born | 48 (100.0%) | 0 (0.0%) |
| Foreign Born, Citizen | 142 (100.0%) | 0 (0.0%) |
| Foreign Born, not a Citizen | 32 (100.0%) | 0 (0.0%) |
Health Insurance Coverage by Household Income in Noank
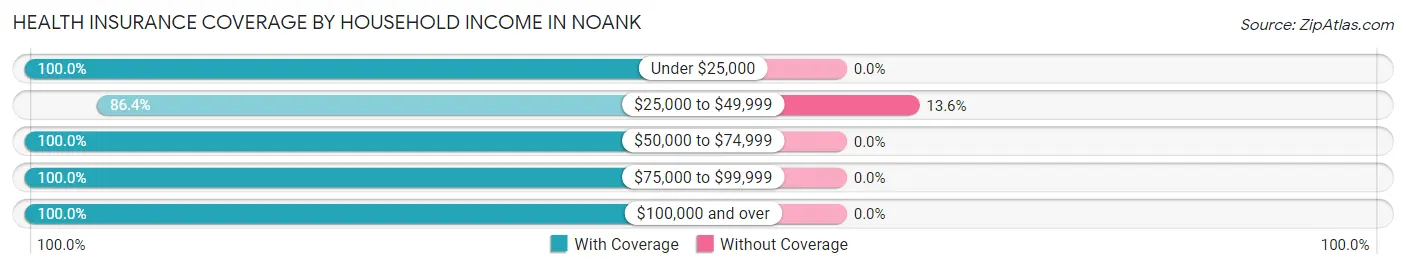
| Household Income | With Coverage | Without Coverage |
| Under $25,000 | 41 (100.0%) | 0 (0.0%) |
| $25,000 to $49,999 | 108 (86.4%) | 17 (13.6%) |
| $50,000 to $74,999 | 120 (100.0%) | 0 (0.0%) |
| $75,000 to $99,999 | 45 (100.0%) | 0 (0.0%) |
| $100,000 and over | 1,368 (100.0%) | 0 (0.0%) |
Public vs Private Health Insurance Coverage by Age in Noank
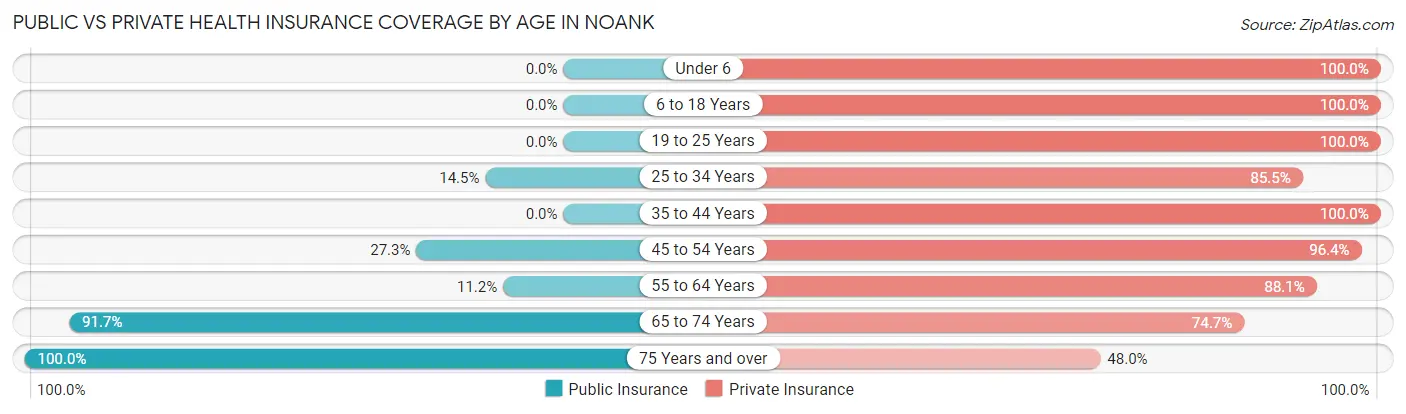
| Age Bracket | Public Insurance | Private Insurance |
| Under 6 | 0 (0.0%) | 48 (100.0%) |
| 6 to 18 Years | 0 (0.0%) | 142 (100.0%) |
| 19 to 25 Years | 0 (0.0%) | 32 (100.0%) |
| 25 to 34 Years | 10 (14.5%) | 59 (85.5%) |
| 35 to 44 Years | 0 (0.0%) | 190 (100.0%) |
| 45 to 54 Years | 92 (27.3%) | 325 (96.4%) |
| 55 to 64 Years | 32 (11.2%) | 252 (88.1%) |
| 65 to 74 Years | 344 (91.7%) | 280 (74.7%) |
| 75 Years and over | 225 (100.0%) | 108 (48.0%) |
| Total | 703 (41.3%) | 1,436 (84.3%) |
Disability Status by Sex by Age in Noank
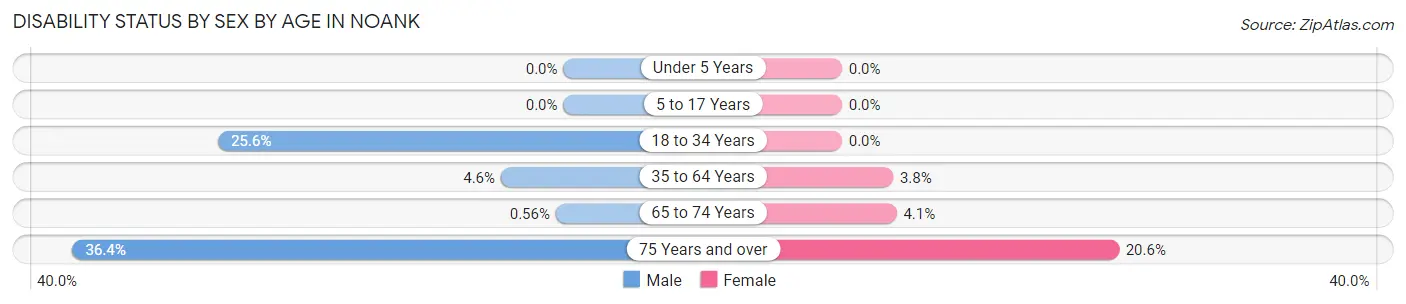
| Age Bracket | Male | Female |
| Under 5 Years | 0 (0.0%) | 0 (0.0%) |
| 5 to 17 Years | 0 (0.0%) | 0 (0.0%) |
| 18 to 34 Years | 10 (25.6%) | 0 (0.0%) |
| 35 to 64 Years | 17 (4.6%) | 17 (3.8%) |
| 65 to 74 Years | 1 (0.6%) | 8 (4.1%) |
| 75 Years and over | 43 (36.4%) | 22 (20.6%) |
Disability Class by Sex by Age in Noank
Disability Class: Hearing Difficulty
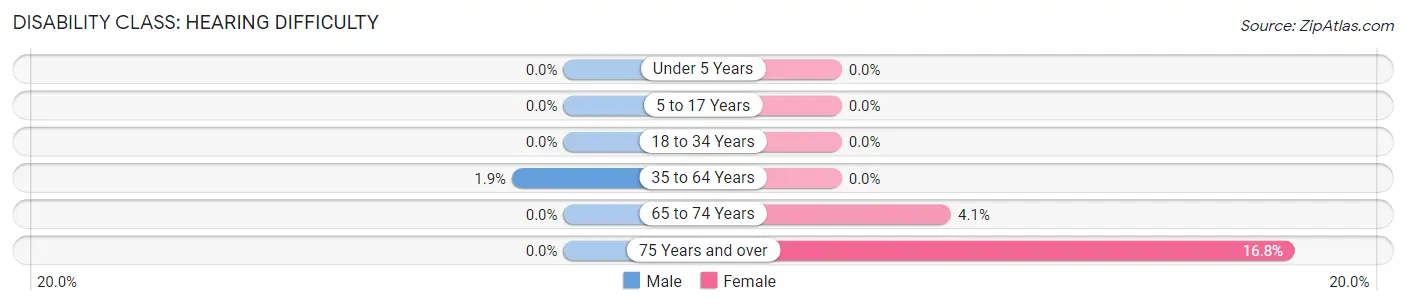
| Age Bracket | Male | Female |
| Under 5 Years | 0 (0.0%) | 0 (0.0%) |
| 5 to 17 Years | 0 (0.0%) | 0 (0.0%) |
| 18 to 34 Years | 0 (0.0%) | 0 (0.0%) |
| 35 to 64 Years | 7 (1.9%) | 0 (0.0%) |
| 65 to 74 Years | 0 (0.0%) | 8 (4.1%) |
| 75 Years and over | 0 (0.0%) | 18 (16.8%) |
Disability Class: Vision Difficulty
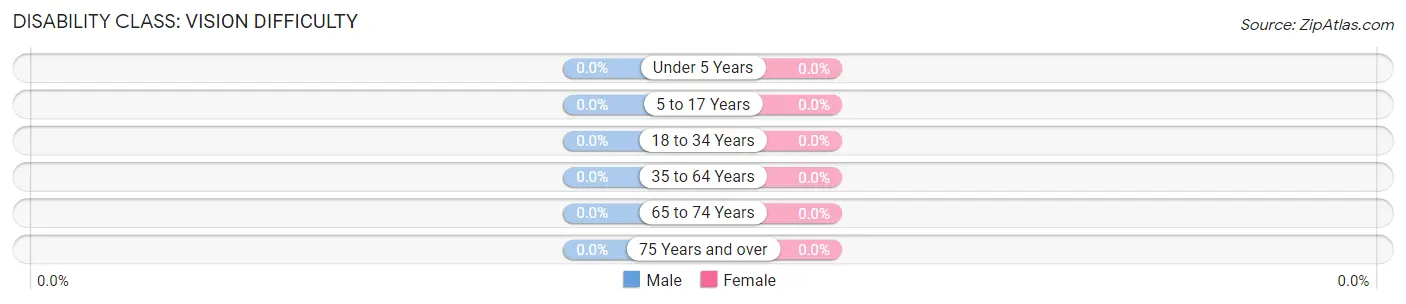
| Age Bracket | Male | Female |
| Under 5 Years | 0 (0.0%) | 0 (0.0%) |
| 5 to 17 Years | 0 (0.0%) | 0 (0.0%) |
| 18 to 34 Years | 0 (0.0%) | 0 (0.0%) |
| 35 to 64 Years | 0 (0.0%) | 0 (0.0%) |
| 65 to 74 Years | 0 (0.0%) | 0 (0.0%) |
| 75 Years and over | 0 (0.0%) | 0 (0.0%) |
Disability Class: Cognitive Difficulty
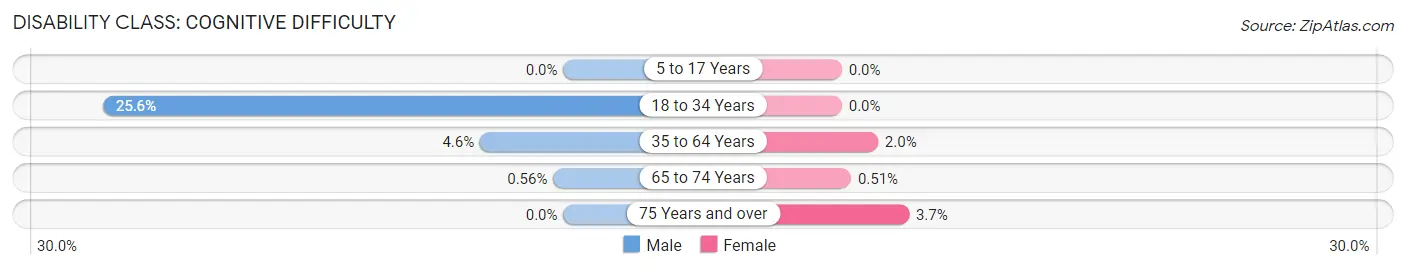
| Age Bracket | Male | Female |
| 5 to 17 Years | 0 (0.0%) | 0 (0.0%) |
| 18 to 34 Years | 10 (25.6%) | 0 (0.0%) |
| 35 to 64 Years | 17 (4.6%) | 9 (2.0%) |
| 65 to 74 Years | 1 (0.6%) | 1 (0.5%) |
| 75 Years and over | 0 (0.0%) | 4 (3.7%) |
Disability Class: Ambulatory Difficulty
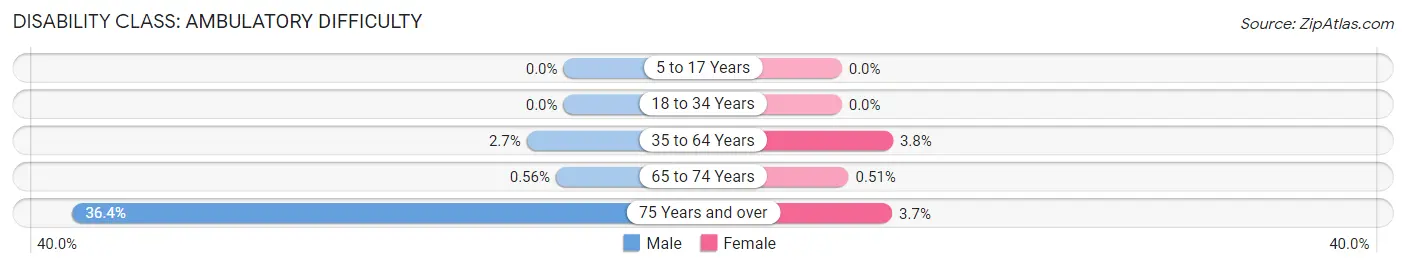
| Age Bracket | Male | Female |
| 5 to 17 Years | 0 (0.0%) | 0 (0.0%) |
| 18 to 34 Years | 0 (0.0%) | 0 (0.0%) |
| 35 to 64 Years | 10 (2.7%) | 17 (3.8%) |
| 65 to 74 Years | 1 (0.6%) | 1 (0.5%) |
| 75 Years and over | 43 (36.4%) | 4 (3.7%) |
Disability Class: Self-Care Difficulty
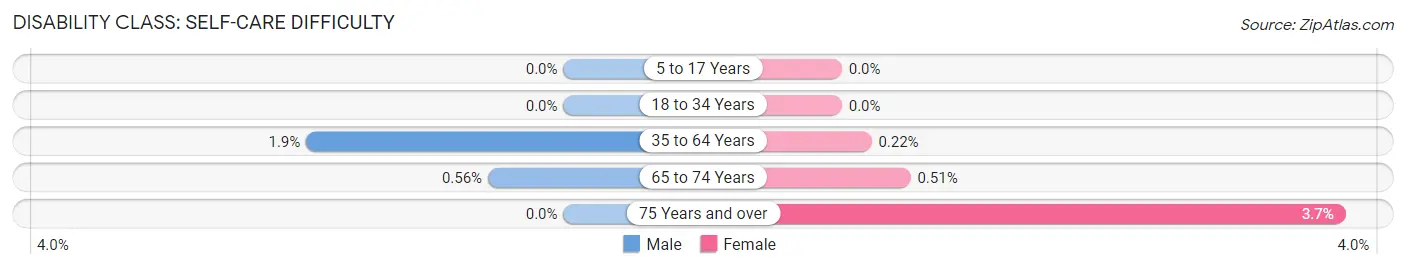
| Age Bracket | Male | Female |
| 5 to 17 Years | 0 (0.0%) | 0 (0.0%) |
| 18 to 34 Years | 0 (0.0%) | 0 (0.0%) |
| 35 to 64 Years | 7 (1.9%) | 1 (0.2%) |
| 65 to 74 Years | 1 (0.6%) | 1 (0.5%) |
| 75 Years and over | 0 (0.0%) | 4 (3.7%) |
Technology Access in Noank
Computing Device Access in Noank
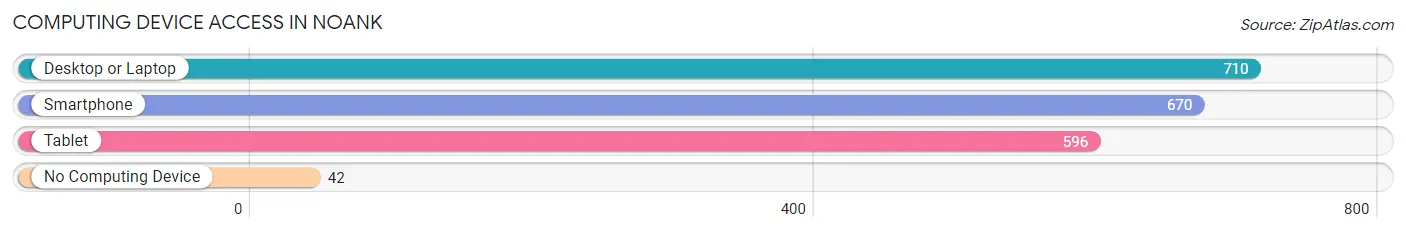
| Device Type | # Households | % Households |
| Desktop or Laptop | 710 | 91.0% |
| Smartphone | 670 | 85.9% |
| Tablet | 596 | 76.4% |
| No Computing Device | 42 | 5.4% |
| Total | 780 | 100.0% |
Internet Access in Noank
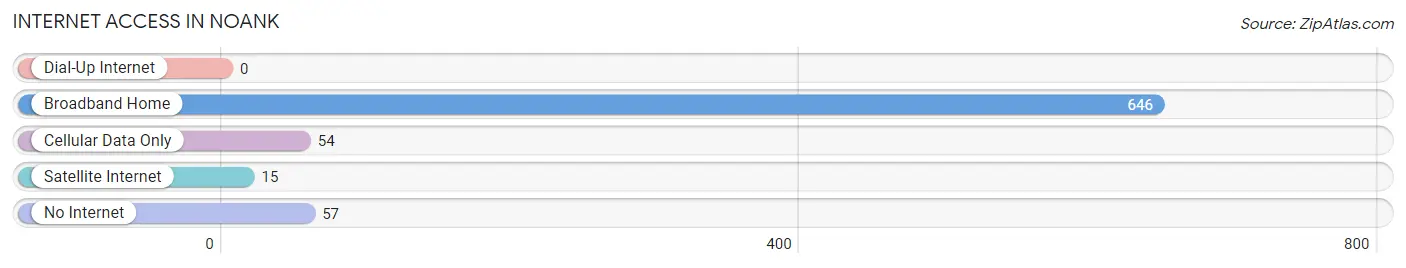
| Internet Type | # Households | % Households |
| Dial-Up Internet | 0 | 0.0% |
| Broadband Home | 646 | 82.8% |
| Cellular Data Only | 54 | 6.9% |
| Satellite Internet | 15 | 1.9% |
| No Internet | 57 | 7.3% |
| Total | 780 | 100.0% |
Noank Summary
Noank is a small village located in the town of Groton, Connecticut. It is situated on the eastern shore of the Thames River, just south of Mystic. The village has a population of just over 1,000 people and is a popular tourist destination due to its picturesque harbor and quaint New England charm.
Geography
Noank is located in the southeastern corner of Connecticut, on the eastern shore of the Thames River. It is bordered by the towns of Groton, Stonington, and Waterford. The village is situated on a peninsula, with the Thames River to the north and east, and Long Island Sound to the south. The village is approximately 4.5 square miles in size, with a total land area of 2.3 square miles.
The terrain of Noank is mostly flat, with some rolling hills in the northern part of the village. The highest point in the village is located at the intersection of Noank Road and Groton Long Point Road, at an elevation of approximately 60 feet. The village is home to several small coves and inlets, as well as a few small islands.
Climate
Noank has a humid continental climate, with warm summers and cold winters. The average annual temperature is approximately 50 degrees Fahrenheit, with an average high of 75 degrees in the summer and an average low of 25 degrees in the winter. The average annual precipitation is approximately 45 inches, with the majority of the precipitation occurring in the spring and summer months.
Demographics
As of the 2010 census, Noank had a population of 1,068 people. The racial makeup of the village was 94.3% White, 1.7% African American, 0.7% Native American, 0.7% Asian, 0.2% Pacific Islander, and 2.1% from other races. The median household income was $63,750, and the median family income was $76,250.
Economy
Noank’s economy is largely based on tourism and fishing. The village is home to several marinas, which attract visitors from all over the region. The village is also home to several seafood restaurants, which serve fresh seafood caught in the local waters. In addition, the village is home to several small businesses, including a few retail stores, a bakery, and a few art galleries.
Conclusion
Noank is a small village located in the town of Groton, Connecticut. It is situated on the eastern shore of the Thames River, just south of Mystic. The village has a population of just over 1,000 people and is a popular tourist destination due to its picturesque harbor and quaint New England charm. The village has a humid continental climate, with warm summers and cold winters. The economy of Noank is largely based on tourism and fishing, and the village is home to several small businesses.
Common Questions
What is the Total Population of Noank?
Total Population of Noank is 1,708.
What is the Total Male Population of Noank?
Total Male Population of Noank is 793.
What is the Total Female Population of Noank?
Total Female Population of Noank is 915.
What is the Ratio of Males per 100 Females in Noank?
There are 86.67 Males per 100 Females in Noank.
What is the Ratio of Females per 100 Males in Noank?
There are 115.38 Females per 100 Males in Noank.
What is the Median Population Age in Noank?
Median Population Age in Noank is 57.3 Years.
What is the Average Family Size in Noank
Average Family Size in Noank is 2.6 People.
What is the Average Household Size in Noank
Average Household Size in Noank is 2.2 People.
What is Per Capita Income in Noank?
Per Capita income in Noank is $86,514.
What is the Median Family Income in Noank?
Median Family Income in Noank is $168,750.
What is the Median Household income in Noank?
Median Household Income in Noank is $156,842.
What is Income or Wage Gap in Noank?
Income or Wage Gap in Noank is 21.2%.
Women in Noank earn 78.8 cents for every dollar earned by a man.
What is Inequality or Gini Index in Noank?
Inequality or Gini Index in Noank is 0.40.
How Large is the Labor Force in Noank?
There are 976 People in the Labor Forcein in Noank.
What is the Percentage of People in the Labor Force in Noank?
63.0% of People are in the Labor Force in Noank.
What is the Unemployment Rate in Noank?
Unemployment Rate in Noank is 0.9%.