Cities with the Highest Percentage of Population Employed in Public Administration in Connecticut
RELATED REPORTS & OPTIONS
Public Administration
Connecticut
Compare Cities
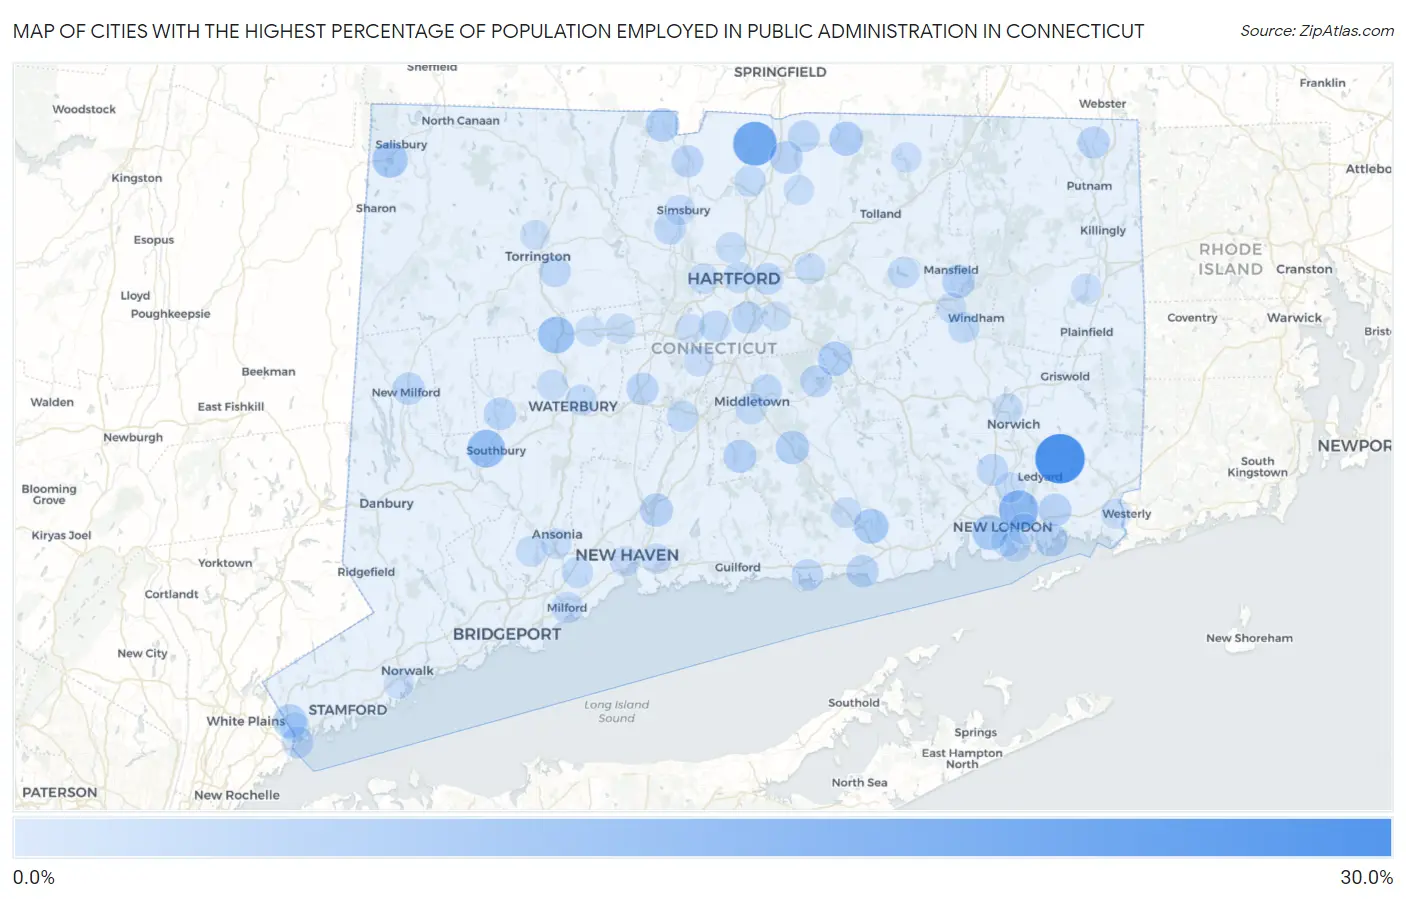
Map of Cities with the Highest Percentage of Population Employed in Public Administration in Connecticut
0.0%
30.0%
Cities with the Highest Percentage of Population Employed in Public Administration in Connecticut
| City | % Employed | vs State | vs National | |
| 1. | Mashantucket | 28.6% | 3.6%(+25.0)#1 | 4.7%(+23.9)#537 |
| 2. | Redding Center | 24.8% | 3.6%(+21.2)#2 | 4.7%(+20.1)#760 |
| 3. | Witches Woods | 23.3% | 3.6%(+19.7)#3 | 4.7%(+18.6)#872 |
| 4. | Suffield Depot | 20.7% | 3.6%(+17.1)#4 | 4.7%(+16.0)#1,104 |
| 5. | Conning Towers Nautilus Park | 14.8% | 3.6%(+11.2)#5 | 4.7%(+10.1)#2,188 |
| 6. | Heritage Village | 12.4% | 3.6%(+8.84)#6 | 4.7%(+7.74)#3,060 |
| 7. | Mamanasco Lake | 12.2% | 3.6%(+8.66)#7 | 4.7%(+7.56)#3,134 |
| 8. | Lake Chaffee | 11.9% | 3.6%(+8.36)#8 | 4.7%(+7.26)#3,296 |
| 9. | Thomaston | 11.2% | 3.6%(+7.64)#9 | 4.7%(+6.54)#3,674 |
| 10. | Lakeville | 9.6% | 3.6%(+5.98)#10 | 4.7%(+4.88)#4,816 |
| 11. | Waterford | 9.2% | 3.6%(+5.66)#11 | 4.7%(+4.56)#5,087 |
| 12. | Essex Village | 8.7% | 3.6%(+5.09)#12 | 4.7%(+3.98)#5,634 |
| 13. | Terramuggus | 8.0% | 3.6%(+4.39)#13 | 4.7%(+3.29)#6,390 |
| 14. | Somers | 7.6% | 3.6%(+4.05)#14 | 4.7%(+2.95)#6,821 |
| 15. | Glenville | 7.6% | 3.6%(+3.98)#15 | 4.7%(+2.88)#6,901 |
| 16. | Stonington Borough | 7.4% | 3.6%(+3.81)#16 | 4.7%(+2.71)#7,117 |
| 17. | Inglenook | 7.4% | 3.6%(+3.78)#17 | 4.7%(+2.68)#7,154 |
| 18. | Lakes East | 7.3% | 3.6%(+3.68)#18 | 4.7%(+2.58)#7,304 |
| 19. | North Granby | 7.2% | 3.6%(+3.57)#19 | 4.7%(+2.47)#7,428 |
| 20. | Higganum | 7.1% | 3.6%(+3.50)#20 | 4.7%(+2.40)#7,545 |
| 21. | Trumbull Center | 6.8% | 3.6%(+3.17)#21 | 4.7%(+2.07)#8,050 |
| 22. | North Haven | 6.7% | 3.6%(+3.14)#22 | 4.7%(+2.04)#8,094 |
| 23. | Durham | 6.7% | 3.6%(+3.11)#23 | 4.7%(+2.01)#8,147 |
| 24. | Mansfield Center | 6.6% | 3.6%(+2.98)#24 | 4.7%(+1.88)#8,346 |
| 25. | Murray | 6.3% | 3.6%(+2.69)#25 | 4.7%(+1.59)#8,870 |
| 26. | Noank | 6.2% | 3.6%(+2.62)#26 | 4.7%(+1.52)#8,981 |
| 27. | East | 6.1% | 3.6%(+2.51)#27 | 4.7%(+1.41)#9,194 |
| 28. | Southwood Acres | 6.1% | 3.6%(+2.51)#28 | 4.7%(+1.41)#9,208 |
| 29. | Newtown Borough | 6.0% | 3.6%(+2.43)#29 | 4.7%(+1.33)#9,341 |
| 30. | Old Mystic | 6.0% | 3.6%(+2.39)#30 | 4.7%(+1.28)#9,421 |
| 31. | Riverton | 5.9% | 3.6%(+2.34)#31 | 4.7%(+1.24)#9,508 |
| 32. | Lake Bungee | 5.8% | 3.6%(+2.18)#32 | 4.7%(+1.08)#9,853 |
| 33. | Woodbury Center | 5.8% | 3.6%(+2.17)#33 | 4.7%(+1.07)#9,868 |
| 34. | Dayville | 5.7% | 3.6%(+2.11)#34 | 4.7%(+1.01)#9,991 |
| 35. | Saybrook Manor | 5.6% | 3.6%(+2.03)#35 | 4.7%(+0.930)#10,190 |
| 36. | New Milford | 5.6% | 3.6%(+2.03)#36 | 4.7%(+0.926)#10,197 |
| 37. | Oronoque | 5.6% | 3.6%(+1.98)#37 | 4.7%(+0.874)#10,318 |
| 38. | Gaylordsville | 5.4% | 3.6%(+1.79)#38 | 4.7%(+0.688)#10,769 |
| 39. | Plantsville | 5.4% | 3.6%(+1.77)#39 | 4.7%(+0.674)#10,809 |
| 40. | Salmon Brook | 5.2% | 3.6%(+1.65)#40 | 4.7%(+0.550)#11,103 |
| 41. | North Grosvenor Dale | 5.2% | 3.6%(+1.64)#41 | 4.7%(+0.541)#11,129 |
| 42. | Wethersfield | 5.2% | 3.6%(+1.58)#42 | 4.7%(+0.477)#11,287 |
| 43. | Lake Pocotopaug | 5.1% | 3.6%(+1.53)#43 | 4.7%(+0.424)#11,398 |
| 44. | Darien Downtown | 5.0% | 3.6%(+1.37)#44 | 4.7%(+0.265)#11,787 |
| 45. | Weatogue | 4.9% | 3.6%(+1.36)#45 | 4.7%(+0.261)#11,805 |
| 46. | Hazardville | 4.9% | 3.6%(+1.32)#46 | 4.7%(+0.220)#11,908 |
| 47. | Byram | 4.9% | 3.6%(+1.31)#47 | 4.7%(+0.213)#11,918 |
| 48. | Oxoboxo River | 4.7% | 3.6%(+1.14)#48 | 4.7%(+0.042)#12,356 |
| 49. | Northwest Harwinton | 4.7% | 3.6%(+1.14)#49 | 4.7%(+0.042)#12,358 |
| 50. | East Hartford | 4.7% | 3.6%(+1.14)#50 | 4.7%(+0.037)#12,371 |
| 51. | Woodmont Borough | 4.7% | 3.6%(+1.11)#51 | 4.7%(+0.012)#12,448 |
| 52. | Clinton | 4.6% | 3.6%(+1.01)#52 | 4.7%(-0.091)#12,742 |
| 53. | Litchfield Borough | 4.6% | 3.6%(+0.975)#53 | 4.7%(-0.126)#12,823 |
| 54. | Portland | 4.5% | 3.6%(+0.891)#54 | 4.7%(-0.211)#13,071 |
| 55. | Newington | 4.5% | 3.6%(+0.888)#55 | 4.7%(-0.213)#13,074 |
| 56. | Indian Field | 4.4% | 3.6%(+0.850)#56 | 4.7%(-0.252)#13,189 |
| 57. | Meriden | 4.3% | 3.6%(+0.757)#57 | 4.7%(-0.345)#13,440 |
| 58. | Hartford | 4.3% | 3.6%(+0.696)#58 | 4.7%(-0.405)#13,608 |
| 59. | Milford City Balance | 4.3% | 3.6%(+0.692)#59 | 4.7%(-0.409)#13,619 |
| 60. | Weston | 4.3% | 3.6%(+0.676)#60 | 4.7%(-0.425)#13,663 |
| 61. | Windsor Locks | 4.2% | 3.6%(+0.652)#61 | 4.7%(-0.449)#13,736 |
| 62. | Knollcrest | 4.2% | 3.6%(+0.627)#62 | 4.7%(-0.475)#13,804 |
| 63. | South Coventry | 4.2% | 3.6%(+0.612)#63 | 4.7%(-0.489)#13,851 |
| 64. | South Windham | 4.2% | 3.6%(+0.589)#64 | 4.7%(-0.512)#13,931 |
| 65. | Bridgewater | 4.2% | 3.6%(+0.583)#65 | 4.7%(-0.519)#13,971 |
| 66. | Orange | 4.1% | 3.6%(+0.542)#66 | 4.7%(-0.559)#14,101 |
| 67. | Middletown | 4.1% | 3.6%(+0.525)#67 | 4.7%(-0.576)#14,160 |
| 68. | Groton | 3.8% | 3.6%(+0.207)#68 | 4.7%(-0.895)#15,170 |
| 69. | Waterbury | 3.7% | 3.6%(+0.146)#69 | 4.7%(-0.955)#15,366 |
| 70. | Manchester | 3.7% | 3.6%(+0.082)#70 | 4.7%(-1.02)#15,586 |
| 71. | Norwich | 3.6% | 3.6%(+0.058)#71 | 4.7%(-1.04)#15,655 |
| 72. | Shelton | 3.6% | 3.6%(+0.039)#72 | 4.7%(-1.06)#15,720 |
| 73. | Oakville | 3.6% | 3.6%(+0.033)#73 | 4.7%(-1.07)#15,740 |
| 74. | Blue Hills | 3.6% | 3.6%(+0.009)#74 | 4.7%(-1.09)#15,819 |
| 75. | West Hartford | 3.6% | 3.6%(+0.007)#75 | 4.7%(-1.09)#15,826 |
| 76. | Deep River Center | 3.6% | 3.6%(+0.003)#76 | 4.7%(-1.10)#15,839 |
| 77. | New London | 3.5% | 3.6%(-0.064)#77 | 4.7%(-1.17)#16,068 |
| 78. | Long Hill | 3.5% | 3.6%(-0.085)#78 | 4.7%(-1.19)#16,133 |
| 79. | Bristol | 3.5% | 3.6%(-0.130)#79 | 4.7%(-1.23)#16,278 |
| 80. | Derby | 3.3% | 3.6%(-0.253)#80 | 4.7%(-1.35)#16,722 |
| 81. | Pawcatuck | 3.3% | 3.6%(-0.323)#81 | 4.7%(-1.42)#16,947 |
| 82. | East Haven | 3.3% | 3.6%(-0.324)#82 | 4.7%(-1.43)#16,950 |
| 83. | Kensington | 3.2% | 3.6%(-0.364)#83 | 4.7%(-1.47)#17,093 |
| 84. | Stafford Springs | 3.2% | 3.6%(-0.377)#84 | 4.7%(-1.48)#17,135 |
| 85. | Simsbury Center | 3.1% | 3.6%(-0.464)#85 | 4.7%(-1.57)#17,413 |
| 86. | Willimantic | 3.1% | 3.6%(-0.489)#86 | 4.7%(-1.59)#17,489 |
| 87. | Gales Ferry | 3.1% | 3.6%(-0.504)#87 | 4.7%(-1.61)#17,538 |
| 88. | Cornwall Bridge | 3.1% | 3.6%(-0.523)#88 | 4.7%(-1.62)#17,607 |
| 89. | New Haven | 3.0% | 3.6%(-0.543)#89 | 4.7%(-1.64)#17,685 |
| 90. | Wauregan | 3.0% | 3.6%(-0.554)#90 | 4.7%(-1.65)#17,708 |
| 91. | Broad Brook | 2.9% | 3.6%(-0.661)#91 | 4.7%(-1.76)#18,065 |
| 92. | Pemberwick | 2.8% | 3.6%(-0.734)#92 | 4.7%(-1.84)#18,305 |
| 93. | Terryville | 2.8% | 3.6%(-0.735)#93 | 4.7%(-1.84)#18,309 |
| 94. | Torrington | 2.8% | 3.6%(-0.744)#94 | 4.7%(-1.85)#18,337 |
| 95. | New Britain | 2.8% | 3.6%(-0.789)#95 | 4.7%(-1.89)#18,504 |
| 96. | Norwalk | 2.8% | 3.6%(-0.812)#96 | 4.7%(-1.91)#18,592 |
| 97. | Old Hill | 2.7% | 3.6%(-0.900)#97 | 4.7%(-2.00)#18,901 |
| 98. | Glastonbury Center | 2.7% | 3.6%(-0.903)#98 | 4.7%(-2.00)#18,913 |
| 99. | Stepney | 2.7% | 3.6%(-0.924)#99 | 4.7%(-2.03)#18,981 |
| 100. | Naugatuck Borough | 2.6% | 3.6%(-0.941)#100 | 4.7%(-2.04)#19,023 |
Common Questions
What are the Top 10 Cities with the Highest Percentage of Population Employed in Public Administration in Connecticut?
Top 10 Cities with the Highest Percentage of Population Employed in Public Administration in Connecticut are:
#1
28.6%
#2
20.7%
#3
14.8%
#4
12.4%
#5
11.2%
#6
9.6%
#7
9.2%
#8
8.7%
#9
8.0%
#10
7.6%
What city has the Highest Percentage of Population Employed in Public Administration in Connecticut?
Mashantucket has the Highest Percentage of Population Employed in Public Administration in Connecticut with 28.6%.
What is the Percentage of Population Employed in Public Administration in the State of Connecticut?
Percentage of Population Employed in Public Administration in Connecticut is 3.6%.
What is the Percentage of Population Employed in Public Administration in the United States?
Percentage of Population Employed in Public Administration in the United States is 4.7%.