Sherwood Manor, CT
Sherwood Manor Map
Sherwood Manor Overview
5,731
TOTAL POPULATION
2,939
MALE POPULATION
2,792
FEMALE POPULATION
105.27
MALES / 100 FEMALES
95.00
FEMALES / 100 MALES
40.5
MEDIAN AGE
3.1
AVG FAMILY SIZE
2.6
AVG HOUSEHOLD SIZE
$40,506
PER CAPITA INCOME
$103,622
AVG FAMILY INCOME
$98,980
AVG HOUSEHOLD INCOME
21.0%
WAGE / INCOME GAP [ % ]
79.0¢/ $1
WAGE / INCOME GAP [ $ ]
0.33
INEQUALITY / GINI INDEX
3,330
LABOR FORCE [ PEOPLE ]
69.6%
PERCENT IN LABOR FORCE
4.6%
UNEMPLOYMENT RATE
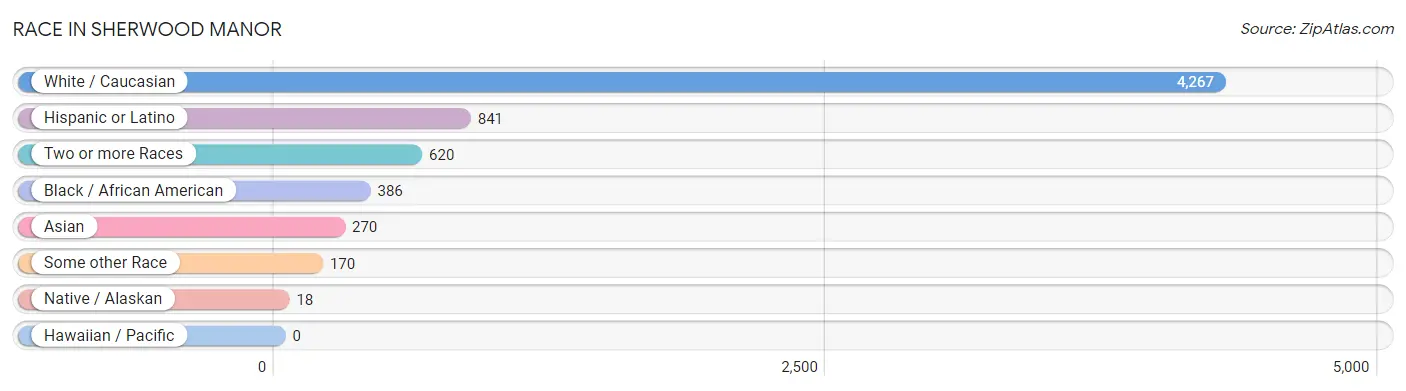
Race in Sherwood Manor
The most populous races in Sherwood Manor are White / Caucasian (4,267 | 74.5%), Hispanic or Latino (841 | 14.7%), and Two or more Races (620 | 10.8%).
| Race | # Population | % Population |
| Asian | 270 | 4.7% |
| Black / African American | 386 | 6.7% |
| Hawaiian / Pacific | 0 | 0.0% |
| Hispanic or Latino | 841 | 14.7% |
| Native / Alaskan | 18 | 0.3% |
| White / Caucasian | 4,267 | 74.5% |
| Two or more Races | 620 | 10.8% |
| Some other Race | 170 | 3.0% |
| Total | 5,731 | 100.0% |
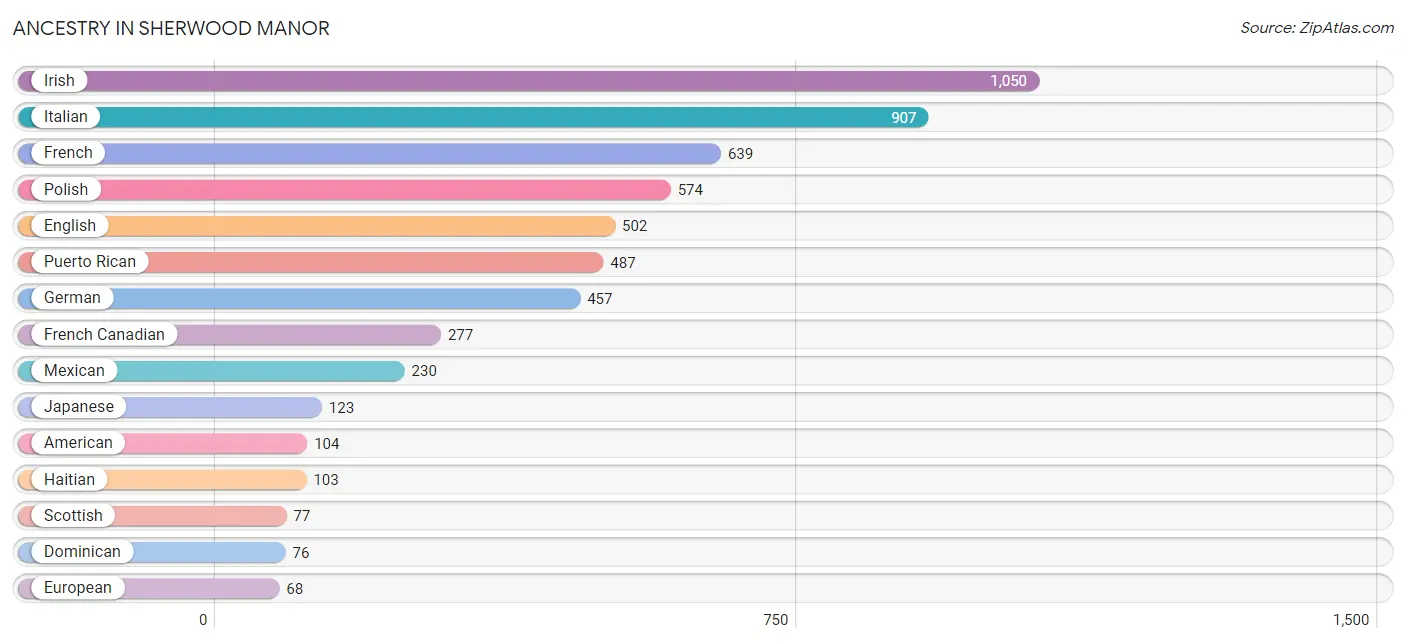
Ancestry in Sherwood Manor
The most populous ancestries reported in Sherwood Manor are Irish (1,050 | 18.3%), Italian (907 | 15.8%), French (639 | 11.2%), Polish (574 | 10.0%), and English (502 | 8.8%), together accounting for 64.1% of all Sherwood Manor residents.
| Ancestry | # Population | % Population |
| Albanian | 14 | 0.2% |
| American | 104 | 1.8% |
| Arab | 9 | 0.2% |
| Argentinean | 21 | 0.4% |
| Austrian | 21 | 0.4% |
| Bhutanese | 5 | 0.1% |
| British | 26 | 0.4% |
| Burmese | 2 | 0.0% |
| Canadian | 34 | 0.6% |
| Colombian | 1 | 0.0% |
| Czechoslovakian | 20 | 0.4% |
| Danish | 27 | 0.5% |
| Dominican | 76 | 1.3% |
| Dutch | 6 | 0.1% |
| Eastern European | 48 | 0.8% |
| Ecuadorian | 10 | 0.2% |
| Egyptian | 9 | 0.2% |
| English | 502 | 8.8% |
| European | 68 | 1.2% |
| French | 639 | 11.2% |
| French American Indian | 18 | 0.3% |
| French Canadian | 277 | 4.8% |
| German | 457 | 8.0% |
| Greek | 46 | 0.8% |
| Guyanese | 49 | 0.9% |
| Haitian | 103 | 1.8% |
| Indian (Asian) | 9 | 0.2% |
| Irish | 1,050 | 18.3% |
| Italian | 907 | 15.8% |
| Jamaican | 37 | 0.6% |
| Japanese | 123 | 2.1% |
| Korean | 13 | 0.2% |
| Lithuanian | 47 | 0.8% |
| Mexican | 230 | 4.0% |
| Norwegian | 29 | 0.5% |
| Pennsylvania German | 13 | 0.2% |
| Peruvian | 16 | 0.3% |
| Polish | 574 | 10.0% |
| Portuguese | 56 | 1.0% |
| Puerto Rican | 487 | 8.5% |
| Russian | 62 | 1.1% |
| Scotch-Irish | 9 | 0.2% |
| Scottish | 77 | 1.3% |
| Slovak | 6 | 0.1% |
| South American | 48 | 0.8% |
| Swedish | 38 | 0.7% |
| Swiss | 8 | 0.1% |
| Turkish | 10 | 0.2% |
| Ukrainian | 41 | 0.7% |
| Welsh | 56 | 1.0% | View All 50 Rows |
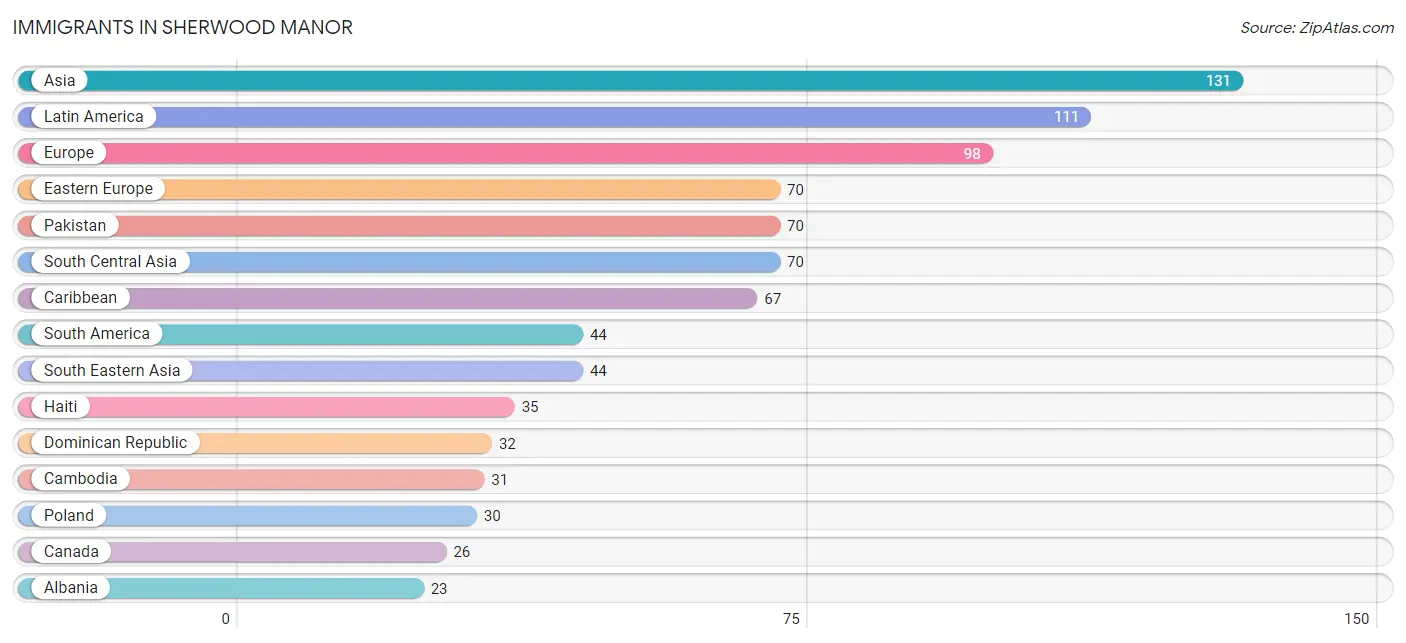
Immigrants in Sherwood Manor
The most numerous immigrant groups reported in Sherwood Manor came from Asia (131 | 2.3%), Latin America (111 | 1.9%), Europe (98 | 1.7%), Eastern Europe (70 | 1.2%), and Pakistan (70 | 1.2%), together accounting for 8.4% of all Sherwood Manor residents.
| Immigration Origin | # Population | % Population |
| Albania | 23 | 0.4% |
| Asia | 131 | 2.3% |
| Belarus | 7 | 0.1% |
| Cambodia | 31 | 0.5% |
| Canada | 26 | 0.4% |
| Caribbean | 67 | 1.2% |
| China | 4 | 0.1% |
| Colombia | 1 | 0.0% |
| Dominican Republic | 32 | 0.6% |
| Eastern Asia | 4 | 0.1% |
| Eastern Europe | 70 | 1.2% |
| Ecuador | 10 | 0.2% |
| Europe | 98 | 1.7% |
| Germany | 7 | 0.1% |
| Guyana | 17 | 0.3% |
| Haiti | 35 | 0.6% |
| Latin America | 111 | 1.9% |
| Northern Europe | 9 | 0.2% |
| Pakistan | 70 | 1.2% |
| Peru | 16 | 0.3% |
| Philippines | 13 | 0.2% |
| Poland | 30 | 0.5% |
| Portugal | 12 | 0.2% |
| South America | 44 | 0.8% |
| South Central Asia | 70 | 1.2% |
| South Eastern Asia | 44 | 0.8% |
| Southern Europe | 12 | 0.2% |
| Syria | 13 | 0.2% |
| Ukraine | 10 | 0.2% |
| Western Asia | 13 | 0.2% |
| Western Europe | 7 | 0.1% | View All 31 Rows |
Sex and Age in Sherwood Manor
Sex and Age in Sherwood Manor
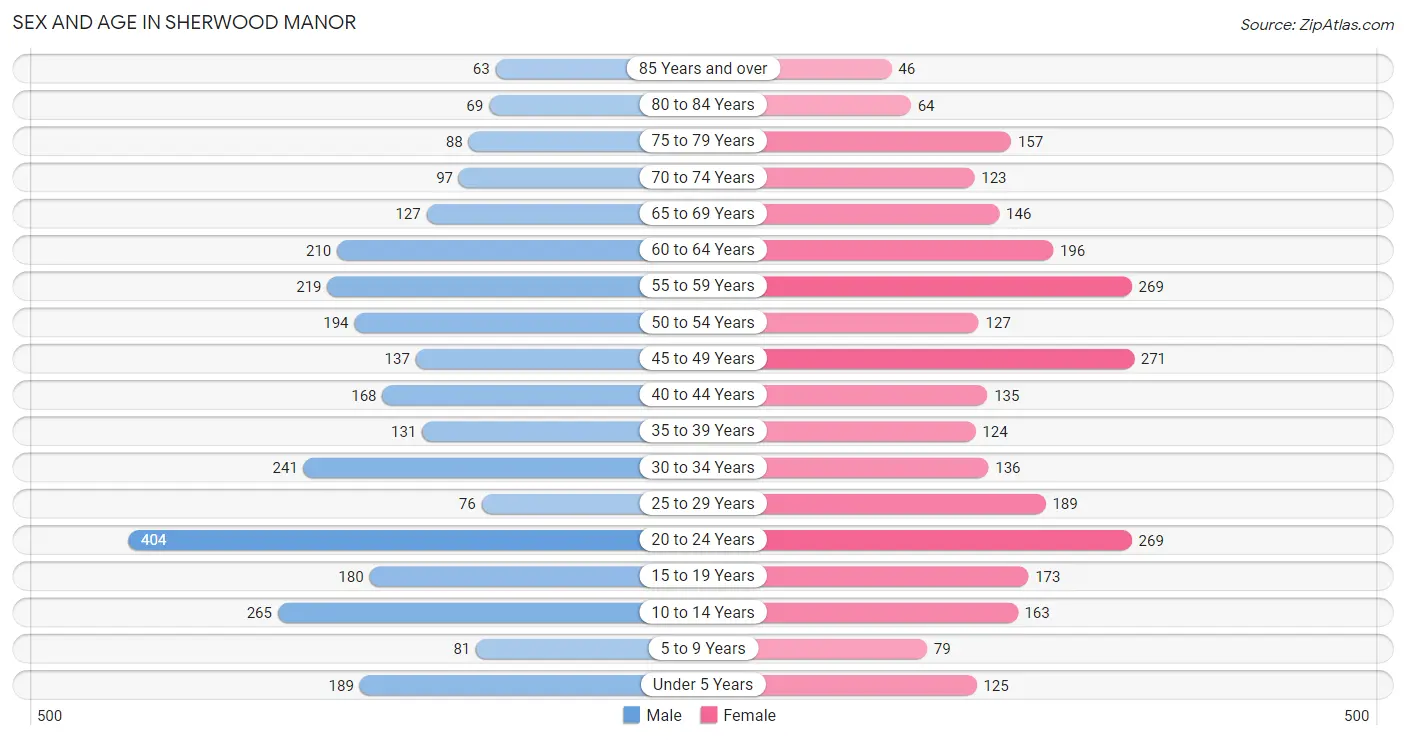
The most populous age groups in Sherwood Manor are 20 to 24 Years (404 | 13.8%) for men and 45 to 49 Years (271 | 9.7%) for women.
| Age Bracket | Male | Female |
| Under 5 Years | 189 (6.4%) | 125 (4.5%) |
| 5 to 9 Years | 81 (2.8%) | 79 (2.8%) |
| 10 to 14 Years | 265 (9.0%) | 163 (5.8%) |
| 15 to 19 Years | 180 (6.1%) | 173 (6.2%) |
| 20 to 24 Years | 404 (13.8%) | 269 (9.6%) |
| 25 to 29 Years | 76 (2.6%) | 189 (6.8%) |
| 30 to 34 Years | 241 (8.2%) | 136 (4.9%) |
| 35 to 39 Years | 131 (4.5%) | 124 (4.4%) |
| 40 to 44 Years | 168 (5.7%) | 135 (4.8%) |
| 45 to 49 Years | 137 (4.7%) | 271 (9.7%) |
| 50 to 54 Years | 194 (6.6%) | 127 (4.5%) |
| 55 to 59 Years | 219 (7.4%) | 269 (9.6%) |
| 60 to 64 Years | 210 (7.1%) | 196 (7.0%) |
| 65 to 69 Years | 127 (4.3%) | 146 (5.2%) |
| 70 to 74 Years | 97 (3.3%) | 123 (4.4%) |
| 75 to 79 Years | 88 (3.0%) | 157 (5.6%) |
| 80 to 84 Years | 69 (2.4%) | 64 (2.3%) |
| 85 Years and over | 63 (2.1%) | 46 (1.7%) |
| Total | 2,939 (100.0%) | 2,792 (100.0%) |
Families and Households in Sherwood Manor
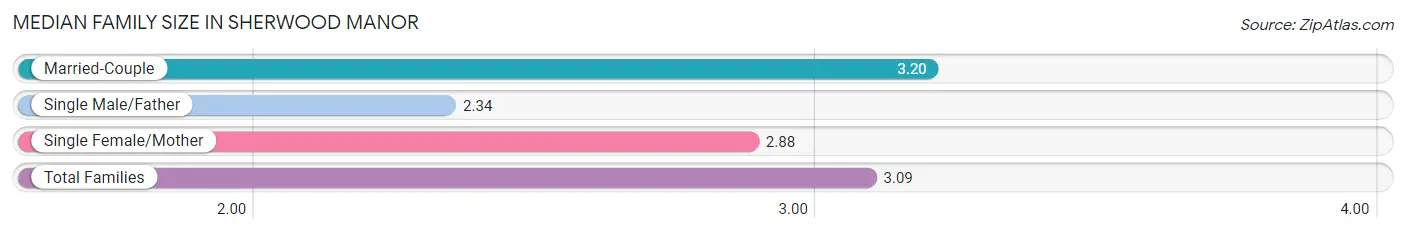
Median Family Size in Sherwood Manor
The median family size in Sherwood Manor is 3.09 persons per family, with married-couple families (1,093 | 77.0%) accounting for the largest median family size of 3.2 persons per family. On the other hand, single male/father families (76 | 5.4%) represent the smallest median family size with 2.34 persons per family.
| Family Type | # Families | Family Size |
| Married-Couple | 1,093 (77.0%) | 3.20 |
| Single Male/Father | 76 (5.4%) | 2.34 |
| Single Female/Mother | 250 (17.6%) | 2.88 |
| Total Families | 1,419 (100.0%) | 3.09 |
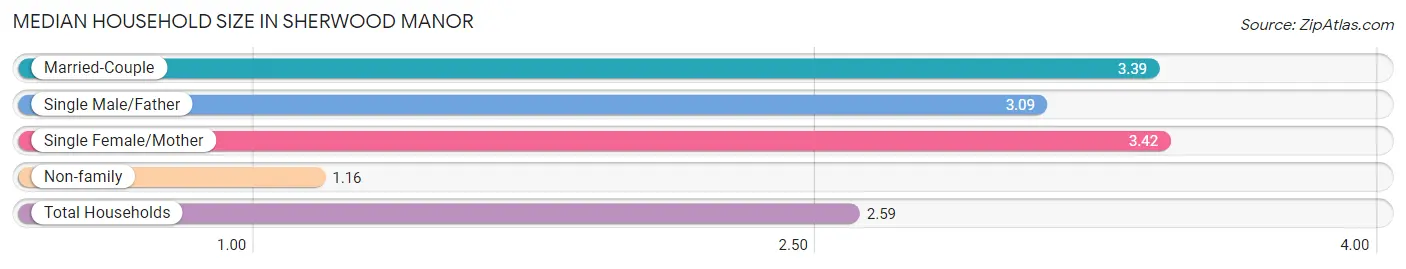
Median Household Size in Sherwood Manor
The median household size in Sherwood Manor is 2.59 persons per household, with single female/mother households (250 | 11.3%) accounting for the largest median household size of 3.42 persons per household. non-family households (789 | 35.7%) represent the smallest median household size with 1.16 persons per household.
| Household Type | # Households | Household Size |
| Married-Couple | 1,093 (49.5%) | 3.39 |
| Single Male/Father | 76 (3.4%) | 3.09 |
| Single Female/Mother | 250 (11.3%) | 3.42 |
| Non-family | 789 (35.7%) | 1.16 |
| Total Households | 2,208 (100.0%) | 2.59 |
Household Size by Marriage Status in Sherwood Manor
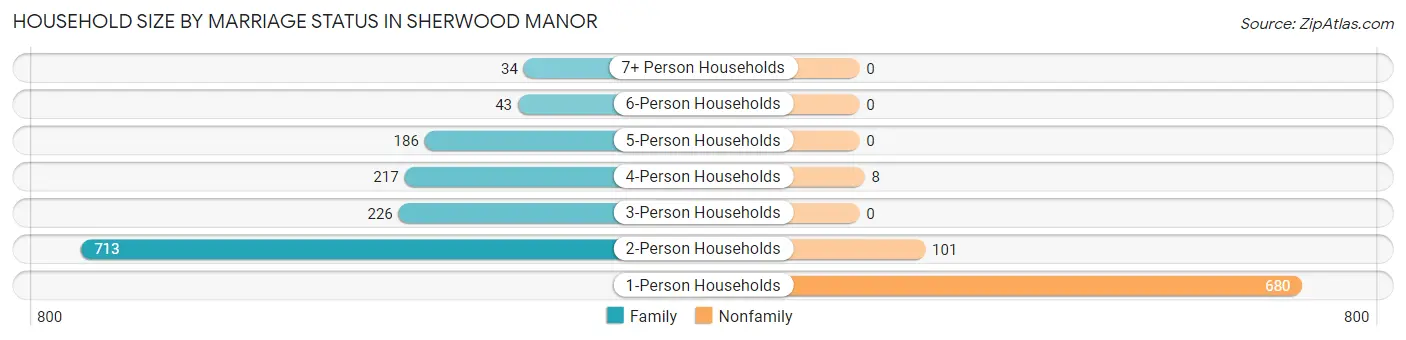
Out of a total of 2,208 households in Sherwood Manor, 1,419 (64.3%) are family households, while 789 (35.7%) are nonfamily households. The most numerous type of family households are 2-person households, comprising 713, and the most common type of nonfamily households are 1-person households, comprising 680.
| Household Size | Family Households | Nonfamily Households |
| 1-Person Households | - | 680 (30.8%) |
| 2-Person Households | 713 (32.3%) | 101 (4.6%) |
| 3-Person Households | 226 (10.2%) | 0 (0.0%) |
| 4-Person Households | 217 (9.8%) | 8 (0.4%) |
| 5-Person Households | 186 (8.4%) | 0 (0.0%) |
| 6-Person Households | 43 (1.9%) | 0 (0.0%) |
| 7+ Person Households | 34 (1.5%) | 0 (0.0%) |
| Total | 1,419 (64.3%) | 789 (35.7%) |
Female Fertility in Sherwood Manor
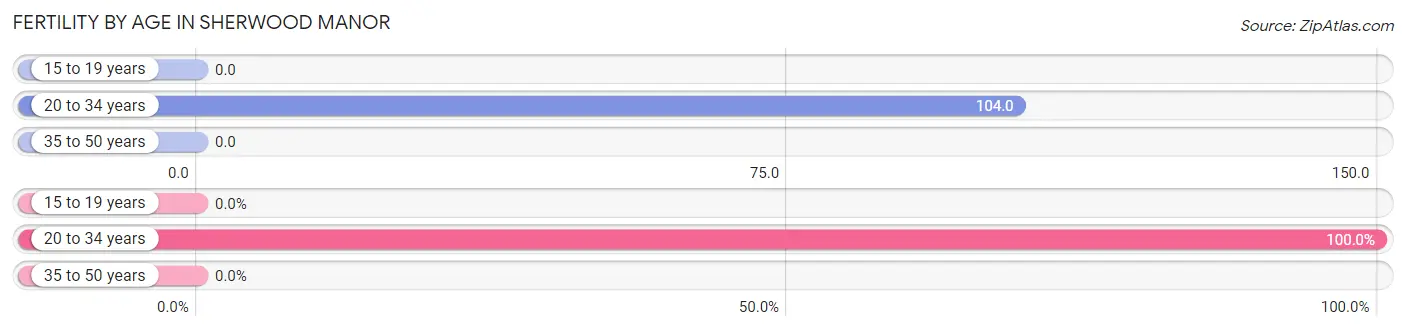
Fertility by Age in Sherwood Manor
Average fertility rate in Sherwood Manor is 47.0 births per 1,000 women. Women in the age bracket of 20 to 34 years have the highest fertility rate with 104.0 births per 1,000 women. Women in the age bracket of 20 to 34 years acount for 100.0% of all women with births.
| Age Bracket | Women with Births | Births / 1,000 Women |
| 15 to 19 years | 0 (0.0%) | 0.0 |
| 20 to 34 years | 62 (100.0%) | 104.0 |
| 35 to 50 years | 0 (0.0%) | 0.0 |
| Total | 62 (100.0%) | 47.0 |
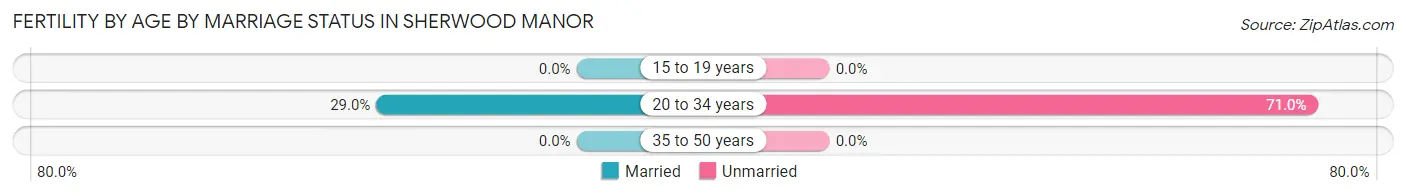
Fertility by Age by Marriage Status in Sherwood Manor
29.0% of women with births (62) in Sherwood Manor are married. The highest percentage of unmarried women with births falls into 20 to 34 years age bracket with 71.0% of them unmarried at the time of birth, while the lowest percentage of unmarried women with births belong to 20 to 34 years age bracket with 71.0% of them unmarried.
| Age Bracket | Married | Unmarried |
| 15 to 19 years | 0 (0.0%) | 0 (0.0%) |
| 20 to 34 years | 18 (29.0%) | 44 (71.0%) |
| 35 to 50 years | 0 (0.0%) | 0 (0.0%) |
| Total | 18 (29.0%) | 44 (71.0%) |
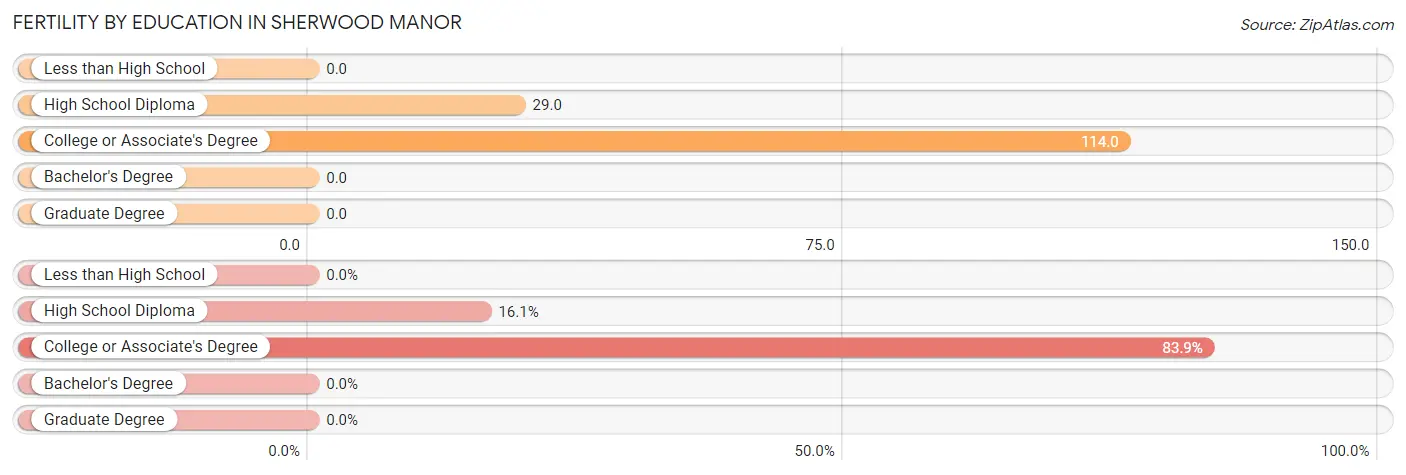
Fertility by Education in Sherwood Manor
| Educational Attainment | Women with Births | Births / 1,000 Women |
| Less than High School | 0 (0.0%) | 0.0 |
| High School Diploma | 10 (16.1%) | 29.0 |
| College or Associate's Degree | 52 (83.9%) | 114.0 |
| Bachelor's Degree | 0 (0.0%) | 0.0 |
| Graduate Degree | 0 (0.0%) | 0.0 |
| Total | 62 (100.0%) | 47.0 |
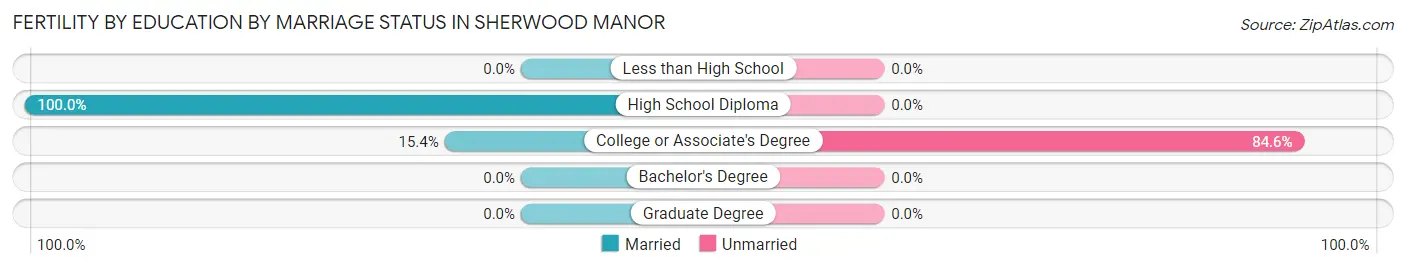
Fertility by Education by Marriage Status in Sherwood Manor
71.0% of women with births in Sherwood Manor are unmarried. Women with the educational attainment of high school diploma are most likely to be married with 100.0% of them married at childbirth, while women with the educational attainment of college or associate's degree are least likely to be married with 84.6% of them unmarried at childbirth.
| Educational Attainment | Married | Unmarried |
| Less than High School | 0 (0.0%) | 0 (0.0%) |
| High School Diploma | 10 (100.0%) | 0 (0.0%) |
| College or Associate's Degree | 8 (15.4%) | 44 (84.6%) |
| Bachelor's Degree | 0 (0.0%) | 0 (0.0%) |
| Graduate Degree | 0 (0.0%) | 0 (0.0%) |
| Total | 18 (29.0%) | 44 (71.0%) |
Income in Sherwood Manor
Income Overview in Sherwood Manor
Per Capita Income in Sherwood Manor is $40,506, while median incomes of families and households are $103,622 and $98,980 respectively.
| Characteristic | Number | Measure |
| Per Capita Income | 5,731 | $40,506 |
| Median Family Income | 1,419 | $103,622 |
| Mean Family Income | 1,419 | $111,760 |
| Median Household Income | 2,208 | $98,980 |
| Mean Household Income | 2,208 | $99,947 |
| Income Deficit | 1,419 | $0 |
| Wage / Income Gap (%) | 5,731 | 21.02% |
| Wage / Income Gap ($) | 5,731 | 78.98¢ per $1 |
| Gini / Inequality Index | 5,731 | 0.33 |
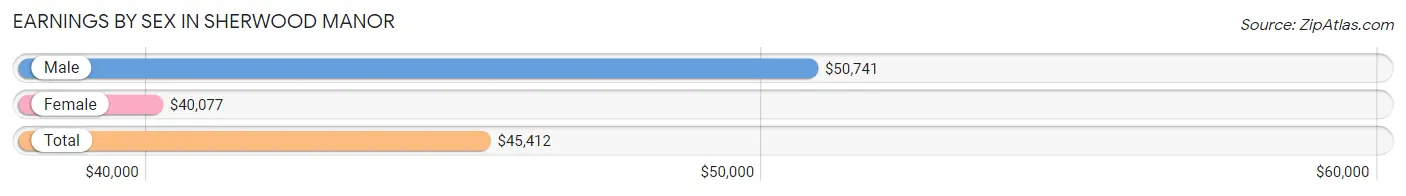
Earnings by Sex in Sherwood Manor
Average Earnings in Sherwood Manor are $45,412, $50,741 for men and $40,077 for women, a difference of 21.0%.
| Sex | Number | Average Earnings |
| Male | 1,776 (52.9%) | $50,741 |
| Female | 1,582 (47.1%) | $40,077 |
| Total | 3,358 (100.0%) | $45,412 |
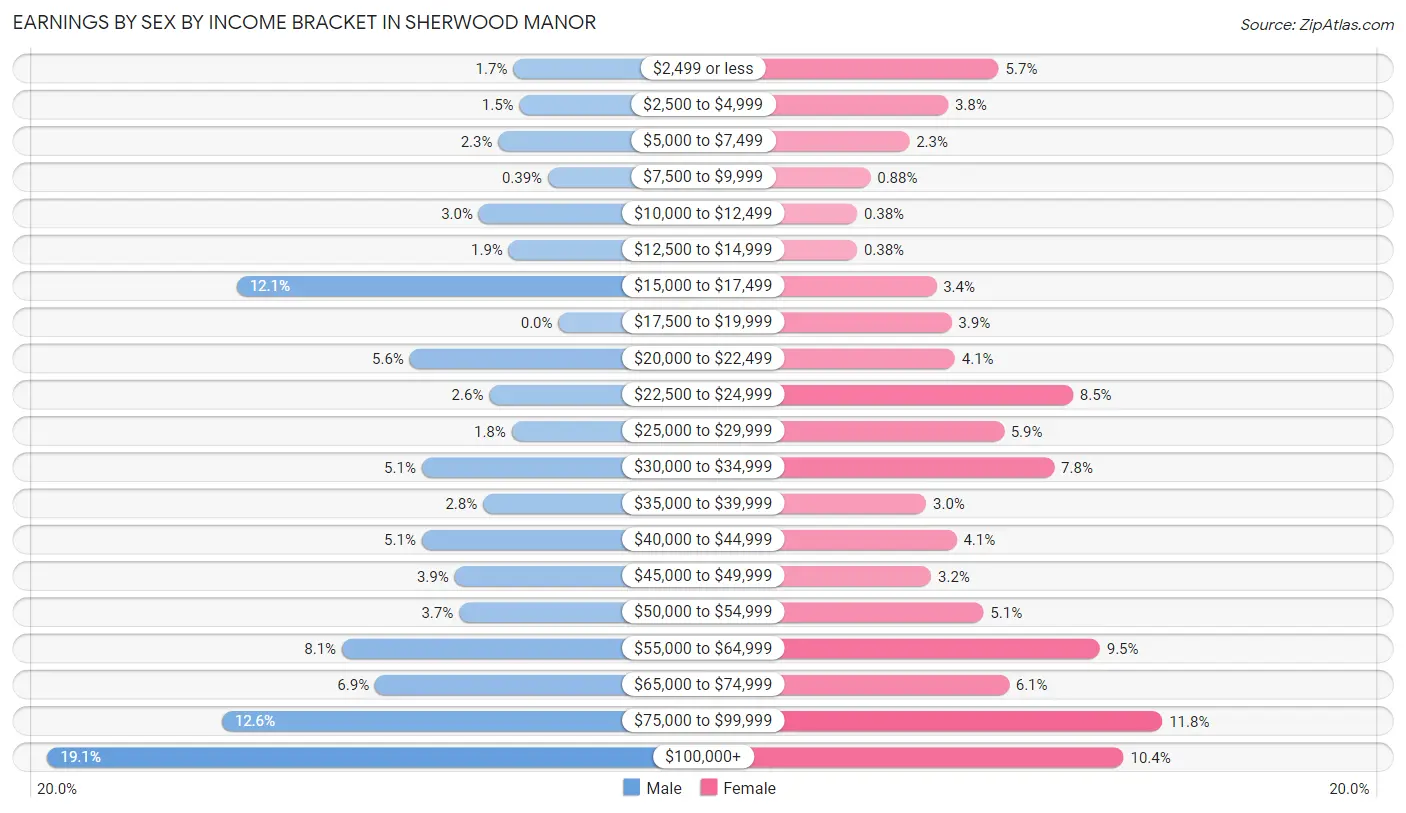
Earnings by Sex by Income Bracket in Sherwood Manor
The most common earnings brackets in Sherwood Manor are $100,000+ for men (340 | 19.1%) and $75,000 to $99,999 for women (187 | 11.8%).
| Income | Male | Female |
| $2,499 or less | 30 (1.7%) | 90 (5.7%) |
| $2,500 to $4,999 | 26 (1.5%) | 60 (3.8%) |
| $5,000 to $7,499 | 40 (2.2%) | 37 (2.3%) |
| $7,500 to $9,999 | 7 (0.4%) | 14 (0.9%) |
| $10,000 to $12,499 | 53 (3.0%) | 6 (0.4%) |
| $12,500 to $14,999 | 33 (1.9%) | 6 (0.4%) |
| $15,000 to $17,499 | 214 (12.0%) | 53 (3.4%) |
| $17,500 to $19,999 | 0 (0.0%) | 62 (3.9%) |
| $20,000 to $22,499 | 99 (5.6%) | 64 (4.1%) |
| $22,500 to $24,999 | 46 (2.6%) | 134 (8.5%) |
| $25,000 to $29,999 | 31 (1.8%) | 93 (5.9%) |
| $30,000 to $34,999 | 91 (5.1%) | 123 (7.8%) |
| $35,000 to $39,999 | 50 (2.8%) | 47 (3.0%) |
| $40,000 to $44,999 | 91 (5.1%) | 65 (4.1%) |
| $45,000 to $49,999 | 69 (3.9%) | 50 (3.2%) |
| $50,000 to $54,999 | 66 (3.7%) | 81 (5.1%) |
| $55,000 to $64,999 | 144 (8.1%) | 150 (9.5%) |
| $65,000 to $74,999 | 122 (6.9%) | 96 (6.1%) |
| $75,000 to $99,999 | 224 (12.6%) | 187 (11.8%) |
| $100,000+ | 340 (19.1%) | 164 (10.4%) |
| Total | 1,776 (100.0%) | 1,582 (100.0%) |
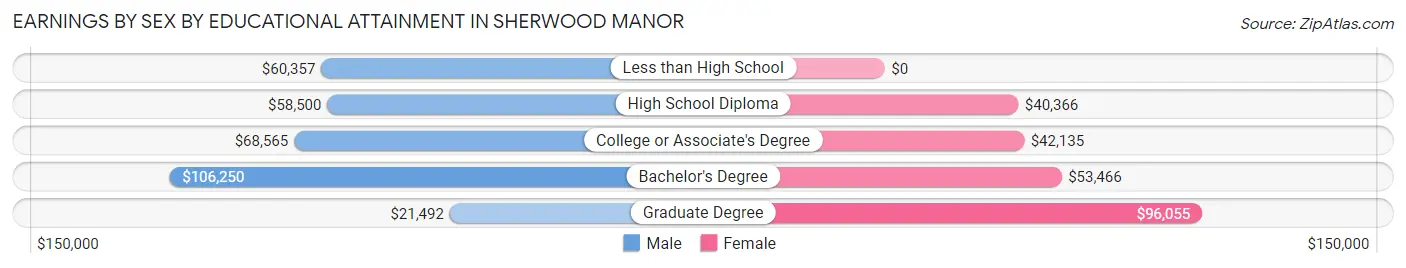
Earnings by Sex by Educational Attainment in Sherwood Manor
Average earnings in Sherwood Manor are $66,857 for men and $48,203 for women, a difference of 27.9%. Men with an educational attainment of bachelor's degree enjoy the highest average annual earnings of $106,250, while those with graduate degree education earn the least with $21,492. Women with an educational attainment of graduate degree earn the most with the average annual earnings of $96,055, while those with high school diploma education have the smallest earnings of $40,366.
| Educational Attainment | Male Income | Female Income |
| Less than High School | $60,357 | $0 |
| High School Diploma | $58,500 | $40,366 |
| College or Associate's Degree | $68,565 | $42,135 |
| Bachelor's Degree | $106,250 | $53,466 |
| Graduate Degree | $21,492 | $96,055 |
| Total | $66,857 | $48,203 |
Family Income in Sherwood Manor
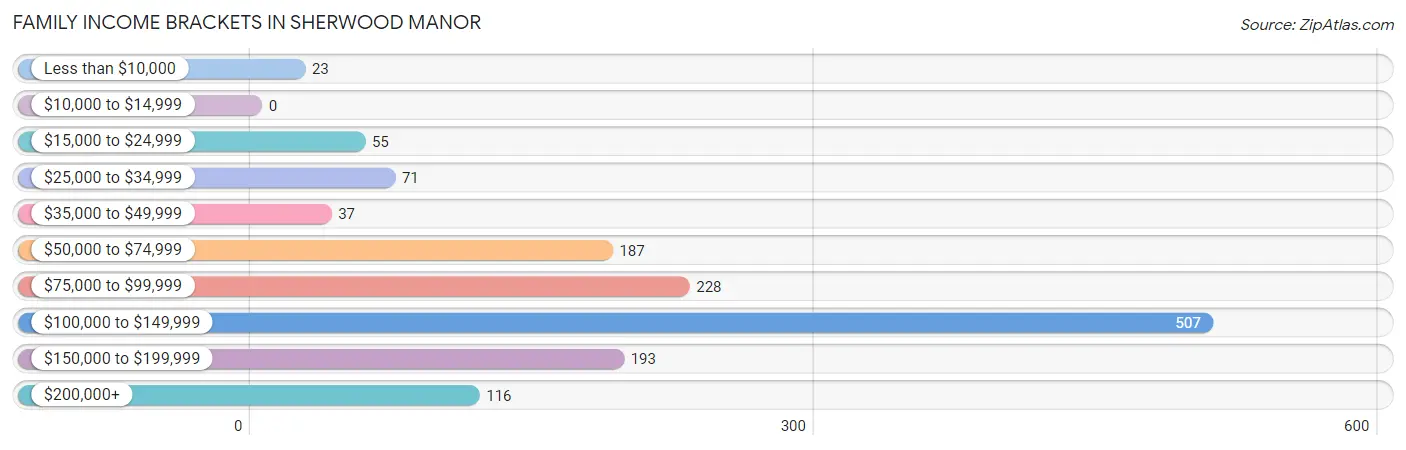
Family Income Brackets in Sherwood Manor
According to the Sherwood Manor family income data, there are 507 families falling into the $100,000 to $149,999 income range, which is the most common income bracket and makes up 35.7% of all families.
| Income Bracket | # Families | % Families |
| Less than $10,000 | 23 | 1.6% |
| $10,000 to $14,999 | 0 | 0.0% |
| $15,000 to $24,999 | 55 | 3.9% |
| $25,000 to $34,999 | 71 | 5.0% |
| $35,000 to $49,999 | 37 | 2.6% |
| $50,000 to $74,999 | 187 | 13.2% |
| $75,000 to $99,999 | 228 | 16.1% |
| $100,000 to $149,999 | 507 | 35.7% |
| $150,000 to $199,999 | 193 | 13.6% |
| $200,000+ | 116 | 8.2% |
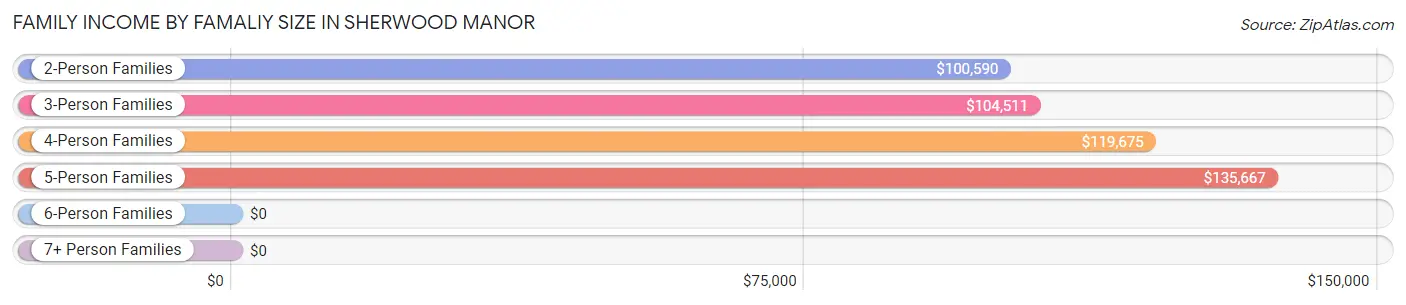
Family Income by Famaliy Size in Sherwood Manor
5-person families (90 | 6.3%) account for the highest median family income in Sherwood Manor with $135,667 per family, while 2-person families (786 | 55.4%) have the highest median income of $50,295 per family member.
| Income Bracket | # Families | Median Income |
| 2-Person Families | 786 (55.4%) | $100,590 |
| 3-Person Families | 241 (17.0%) | $104,511 |
| 4-Person Families | 225 (15.9%) | $119,675 |
| 5-Person Families | 90 (6.3%) | $135,667 |
| 6-Person Families | 47 (3.3%) | $0 |
| 7+ Person Families | 30 (2.1%) | $0 |
| Total | 1,419 (100.0%) | $103,622 |
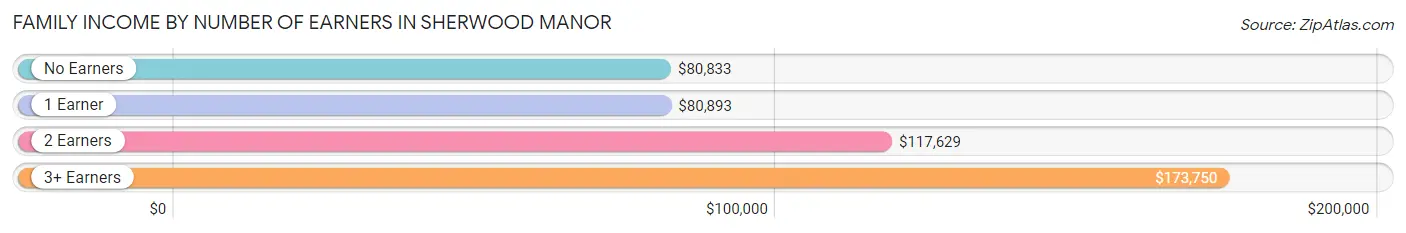
Family Income by Number of Earners in Sherwood Manor
The median family income in Sherwood Manor is $103,622, with families comprising 3+ earners (92) having the highest median family income of $173,750, while families with no earners (198) have the lowest median family income of $80,833, accounting for 6.5% and 14.0% of families, respectively.
| Number of Earners | # Families | Median Income |
| No Earners | 198 (14.0%) | $80,833 |
| 1 Earner | 383 (27.0%) | $80,893 |
| 2 Earners | 746 (52.6%) | $117,629 |
| 3+ Earners | 92 (6.5%) | $173,750 |
| Total | 1,419 (100.0%) | $103,622 |
Household Income in Sherwood Manor
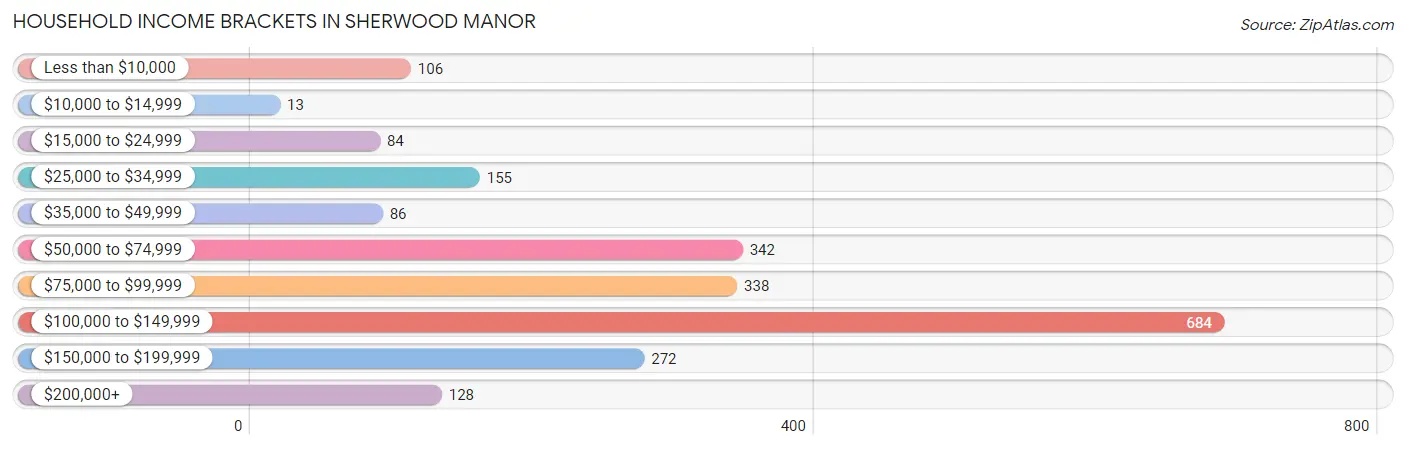
Household Income Brackets in Sherwood Manor
With 684 households falling in the category, the $100,000 to $149,999 income range is the most frequent in Sherwood Manor, accounting for 31.0% of all households. In contrast, only 13 households (0.6%) fall into the $10,000 to $14,999 income bracket, making it the least populous group.
| Income Bracket | # Households | % Households |
| Less than $10,000 | 106 | 4.8% |
| $10,000 to $14,999 | 13 | 0.6% |
| $15,000 to $24,999 | 84 | 3.8% |
| $25,000 to $34,999 | 155 | 7.0% |
| $35,000 to $49,999 | 86 | 3.9% |
| $50,000 to $74,999 | 342 | 15.5% |
| $75,000 to $99,999 | 338 | 15.3% |
| $100,000 to $149,999 | 684 | 31.0% |
| $150,000 to $199,999 | 272 | 12.3% |
| $200,000+ | 128 | 5.8% |
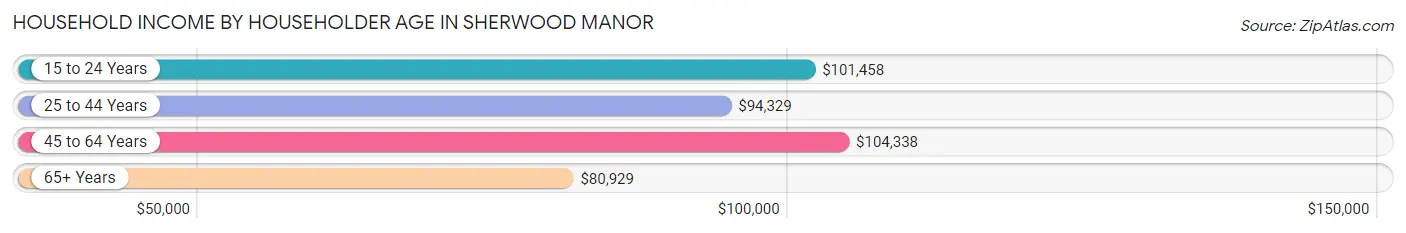
Household Income by Householder Age in Sherwood Manor
The median household income in Sherwood Manor is $98,980, with the highest median household income of $104,338 found in the 45 to 64 years age bracket for the primary householder. A total of 993 households (45.0%) fall into this category. Meanwhile, the 65+ years age bracket for the primary householder has the lowest median household income of $80,929, with 622 households (28.2%) in this group.
| Income Bracket | # Households | Median Income |
| 15 to 24 Years | 79 (3.6%) | $101,458 |
| 25 to 44 Years | 514 (23.3%) | $94,329 |
| 45 to 64 Years | 993 (45.0%) | $104,338 |
| 65+ Years | 622 (28.2%) | $80,929 |
| Total | 2,208 (100.0%) | $98,980 |
Poverty in Sherwood Manor
Income Below Poverty by Sex and Age in Sherwood Manor
With 5.9% poverty level for males and 8.9% for females among the residents of Sherwood Manor, 5 year old males and 6 to 11 year old females are the most vulnerable to poverty, with 18 males (75.0%) and 84 females (53.5%) in their respective age groups living below the poverty level.
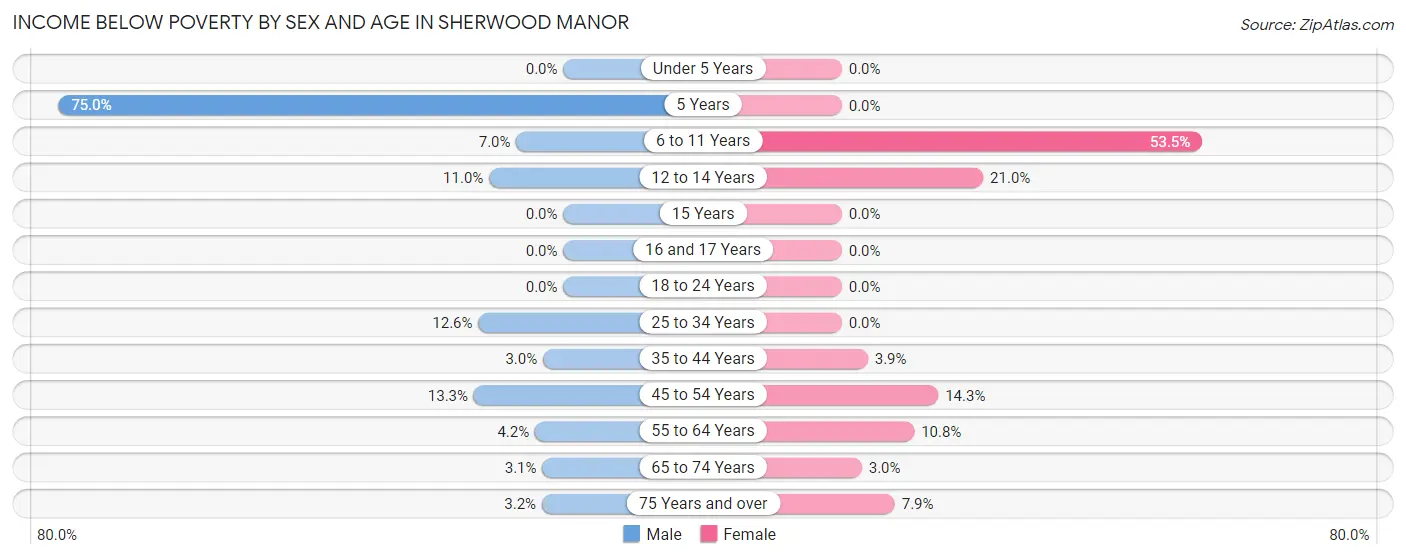
| Age Bracket | Male | Female |
| Under 5 Years | 0 (0.0%) | 0 (0.0%) |
| 5 Years | 18 (75.0%) | 0 (0.0%) |
| 6 to 11 Years | 6 (7.0%) | 84 (53.5%) |
| 12 to 14 Years | 26 (11.0%) | 17 (21.0%) |
| 15 Years | 0 (0.0%) | 0 (0.0%) |
| 16 and 17 Years | 0 (0.0%) | 0 (0.0%) |
| 18 to 24 Years | 0 (0.0%) | 0 (0.0%) |
| 25 to 34 Years | 40 (12.6%) | 0 (0.0%) |
| 35 to 44 Years | 9 (3.0%) | 10 (3.9%) |
| 45 to 54 Years | 44 (13.3%) | 57 (14.3%) |
| 55 to 64 Years | 18 (4.2%) | 50 (10.7%) |
| 65 to 74 Years | 7 (3.1%) | 8 (3.0%) |
| 75 Years and over | 7 (3.2%) | 21 (7.9%) |
| Total | 175 (5.9%) | 247 (8.9%) |
Income Above Poverty by Sex and Age in Sherwood Manor
According to the poverty statistics in Sherwood Manor, males aged under 5 years and females aged under 5 years are the age groups that are most secure financially, with 100.0% of males and 100.0% of females in these age groups living above the poverty line.
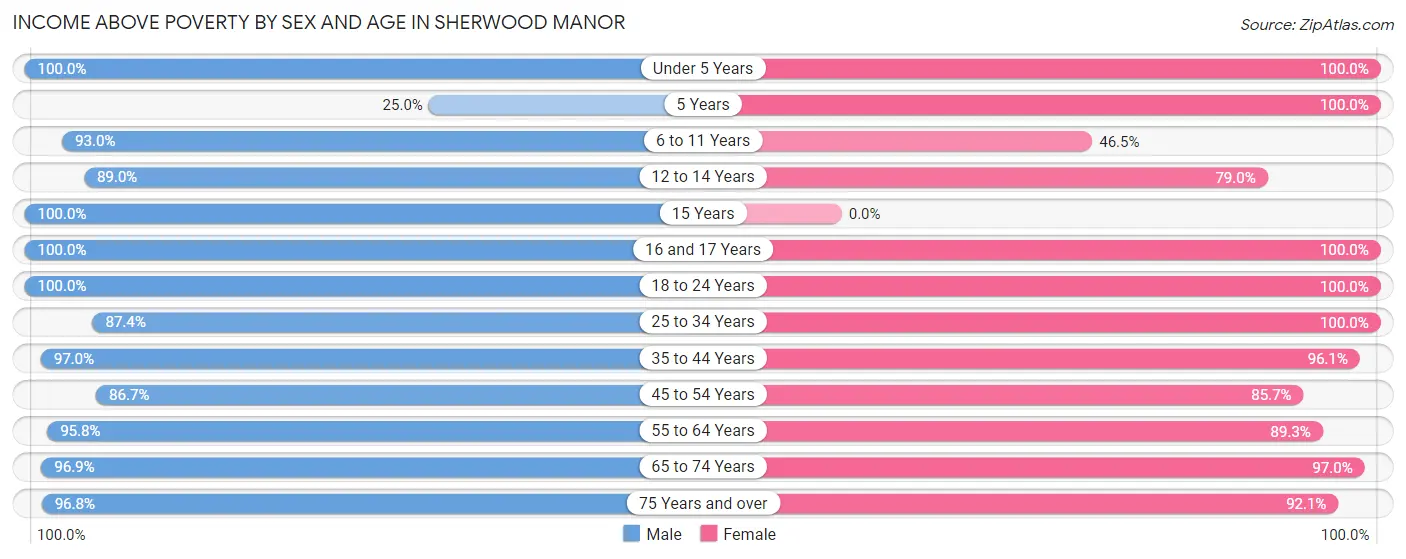
| Age Bracket | Male | Female |
| Under 5 Years | 189 (100.0%) | 119 (100.0%) |
| 5 Years | 6 (25.0%) | 4 (100.0%) |
| 6 to 11 Years | 80 (93.0%) | 73 (46.5%) |
| 12 to 14 Years | 210 (89.0%) | 64 (79.0%) |
| 15 Years | 45 (100.0%) | 0 (0.0%) |
| 16 and 17 Years | 100 (100.0%) | 120 (100.0%) |
| 18 to 24 Years | 439 (100.0%) | 322 (100.0%) |
| 25 to 34 Years | 277 (87.4%) | 325 (100.0%) |
| 35 to 44 Years | 290 (97.0%) | 249 (96.1%) |
| 45 to 54 Years | 287 (86.7%) | 341 (85.7%) |
| 55 to 64 Years | 411 (95.8%) | 415 (89.2%) |
| 65 to 74 Years | 217 (96.9%) | 261 (97.0%) |
| 75 Years and over | 213 (96.8%) | 246 (92.1%) |
| Total | 2,764 (94.1%) | 2,539 (91.1%) |
Income Below Poverty Among Married-Couple Families in Sherwood Manor
The poverty statistics for married-couple families in Sherwood Manor show that 4.7% or 51 of the total 1,093 families live below the poverty line. Families with 3 or 4 children have the highest poverty rate of 59.5%, comprising of 44 families. On the other hand, families with no children have the lowest poverty rate of 0.0%, which includes 0 families.
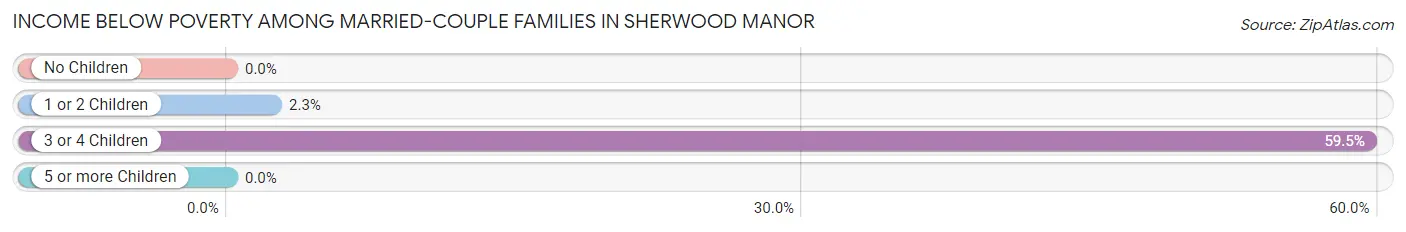
| Children | Above Poverty | Below Poverty |
| No Children | 684 (100.0%) | 0 (0.0%) |
| 1 or 2 Children | 298 (97.7%) | 7 (2.3%) |
| 3 or 4 Children | 30 (40.5%) | 44 (59.5%) |
| 5 or more Children | 30 (100.0%) | 0 (0.0%) |
| Total | 1,042 (95.3%) | 51 (4.7%) |
Income Below Poverty Among Single-Parent Households in Sherwood Manor
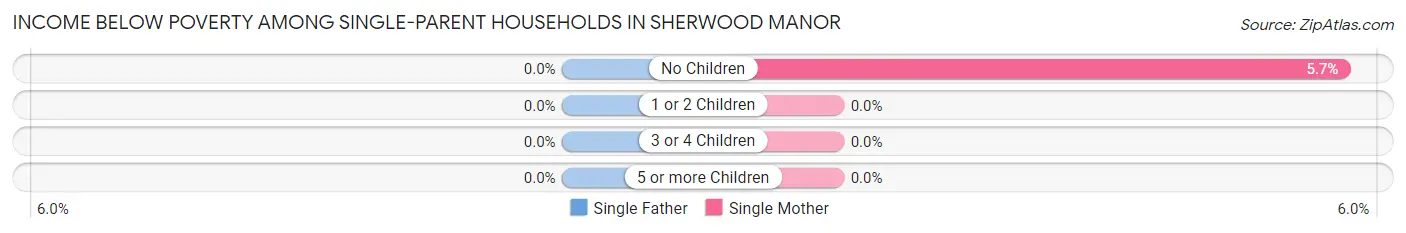
| Children | Single Father | Single Mother |
| No Children | 0 (0.0%) | 6 (5.7%) |
| 1 or 2 Children | 0 (0.0%) | 0 (0.0%) |
| 3 or 4 Children | 0 (0.0%) | 0 (0.0%) |
| 5 or more Children | 0 (0.0%) | 0 (0.0%) |
| Total | 0 (0.0%) | 6 (2.4%) |
Income Below Poverty Among Married-Couple vs Single-Parent Households in Sherwood Manor
The poverty data for Sherwood Manor shows that 51 of the married-couple family households (4.7%) and 6 of the single-parent households (1.8%) are living below the poverty level. Within the married-couple family households, those with 3 or 4 children have the highest poverty rate, with 44 households (59.5%) falling below the poverty line. Among the single-parent households, those with no children have the highest poverty rate, with 6 household (4.1%) living below poverty.
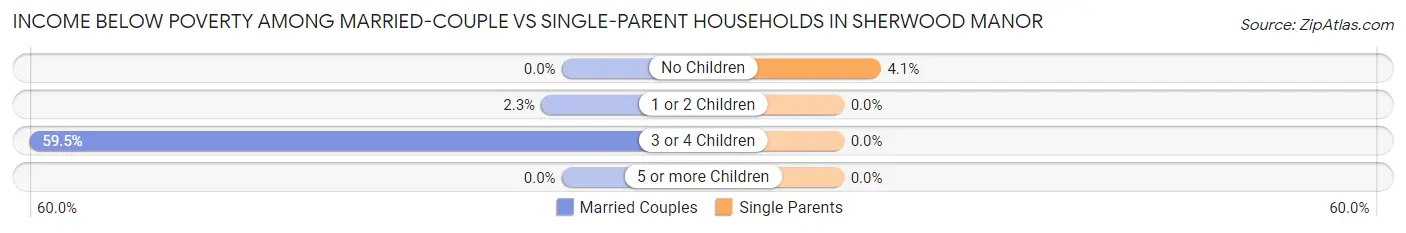
| Children | Married-Couple Families | Single-Parent Households |
| No Children | 0 (0.0%) | 6 (4.1%) |
| 1 or 2 Children | 7 (2.3%) | 0 (0.0%) |
| 3 or 4 Children | 44 (59.5%) | 0 (0.0%) |
| 5 or more Children | 0 (0.0%) | 0 (0.0%) |
| Total | 51 (4.7%) | 6 (1.8%) |
Employment Characteristics in Sherwood Manor
Employment by Class of Employer in Sherwood Manor
Among the 3,139 employed individuals in Sherwood Manor, private company employees (2,246 | 71.6%), not-for-profit organizations (289 | 9.2%), and self-employed (not incorporated) (183 | 5.8%) make up the most common classes of employment.
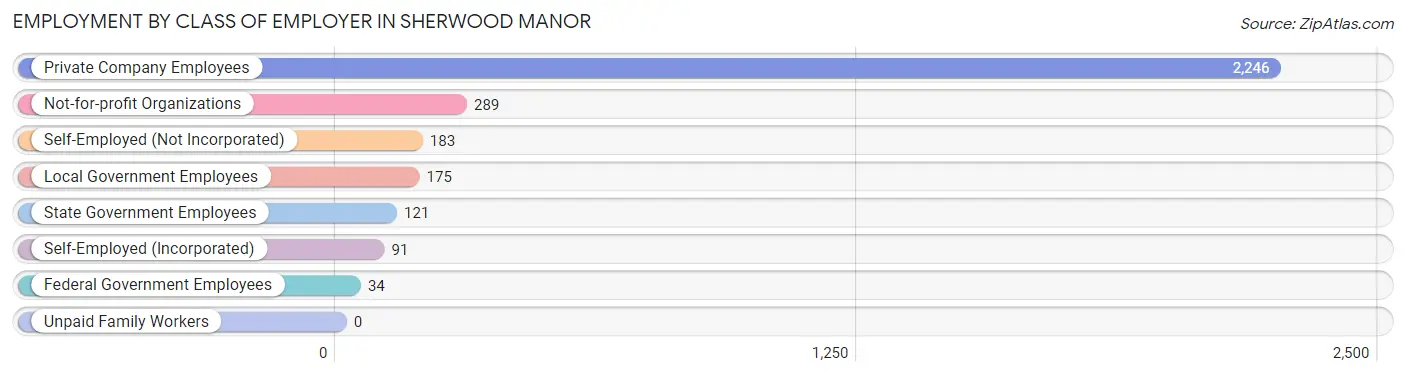
| Employer Class | # Employees | % Employees |
| Private Company Employees | 2,246 | 71.6% |
| Self-Employed (Incorporated) | 91 | 2.9% |
| Self-Employed (Not Incorporated) | 183 | 5.8% |
| Not-for-profit Organizations | 289 | 9.2% |
| Local Government Employees | 175 | 5.6% |
| State Government Employees | 121 | 3.8% |
| Federal Government Employees | 34 | 1.1% |
| Unpaid Family Workers | 0 | 0.0% |
| Total | 3,139 | 100.0% |
Employment Status by Age in Sherwood Manor
According to the labor force statistics for Sherwood Manor, out of the total population over 16 years of age (4,784), 69.6% or 3,330 individuals are in the labor force, with 4.6% or 153 of them unemployed. The age group with the highest labor force participation rate is 20 to 24 years, with 94.7% or 637 individuals in the labor force. Within the labor force, the 16 to 19 years age range has the highest percentage of unemployed individuals, with 15.7% or 19 of them being unemployed.
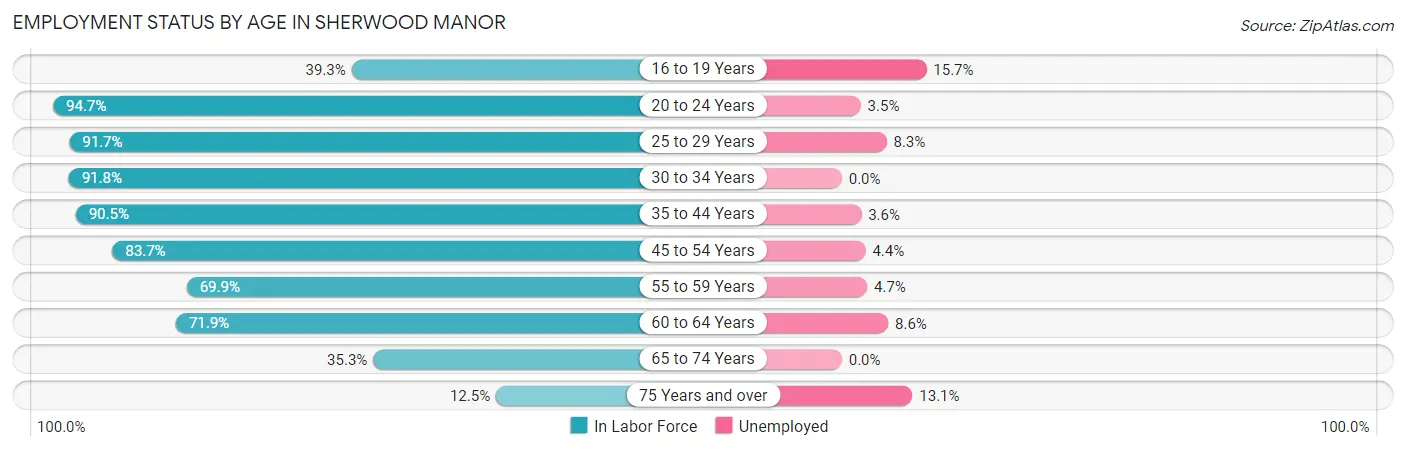
| Age Bracket | In Labor Force | Unemployed |
| 16 to 19 Years | 121 (39.3%) | 19 (15.7%) |
| 20 to 24 Years | 637 (94.7%) | 22 (3.5%) |
| 25 to 29 Years | 243 (91.7%) | 20 (8.3%) |
| 30 to 34 Years | 346 (91.8%) | 0 (0.0%) |
| 35 to 44 Years | 505 (90.5%) | 18 (3.6%) |
| 45 to 54 Years | 610 (83.7%) | 27 (4.4%) |
| 55 to 59 Years | 341 (69.9%) | 16 (4.7%) |
| 60 to 64 Years | 292 (71.9%) | 25 (8.6%) |
| 65 to 74 Years | 174 (35.3%) | 0 (0.0%) |
| 75 Years and over | 61 (12.5%) | 8 (13.1%) |
| Total | 3,330 (69.6%) | 153 (4.6%) |
Employment Status by Educational Attainment in Sherwood Manor
According to labor force statistics for Sherwood Manor, 82.8% of individuals (2,337) out of the total population between 25 and 64 years of age (2,823) are in the labor force, with 4.5% or 105 of them being unemployed. The group with the highest labor force participation rate are those with the educational attainment of bachelor's degree or higher, with 87.8% or 596 individuals in the labor force. Within the labor force, individuals with less than high school education have the highest percentage of unemployment, with 40.0% or 18 of them being unemployed.
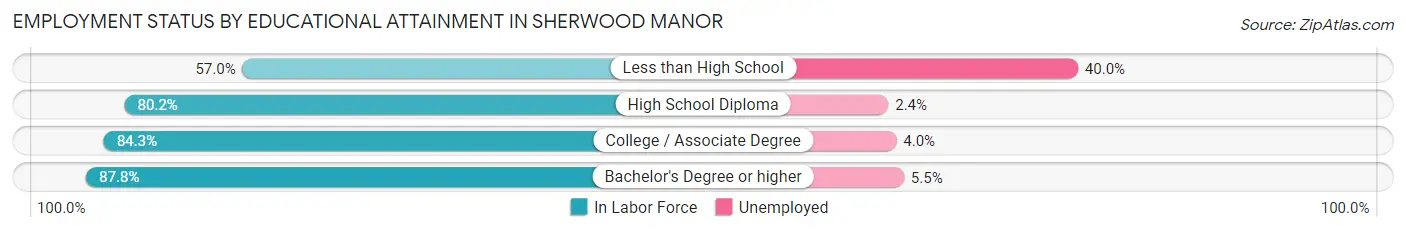
| Educational Attainment | In Labor Force | Unemployed |
| Less than High School | 45 (57.0%) | 32 (40.0%) |
| High School Diploma | 861 (80.2%) | 26 (2.4%) |
| College / Associate Degree | 835 (84.3%) | 40 (4.0%) |
| Bachelor's Degree or higher | 596 (87.8%) | 37 (5.5%) |
| Total | 2,337 (82.8%) | 127 (4.5%) |
Employment Occupations by Sex in Sherwood Manor
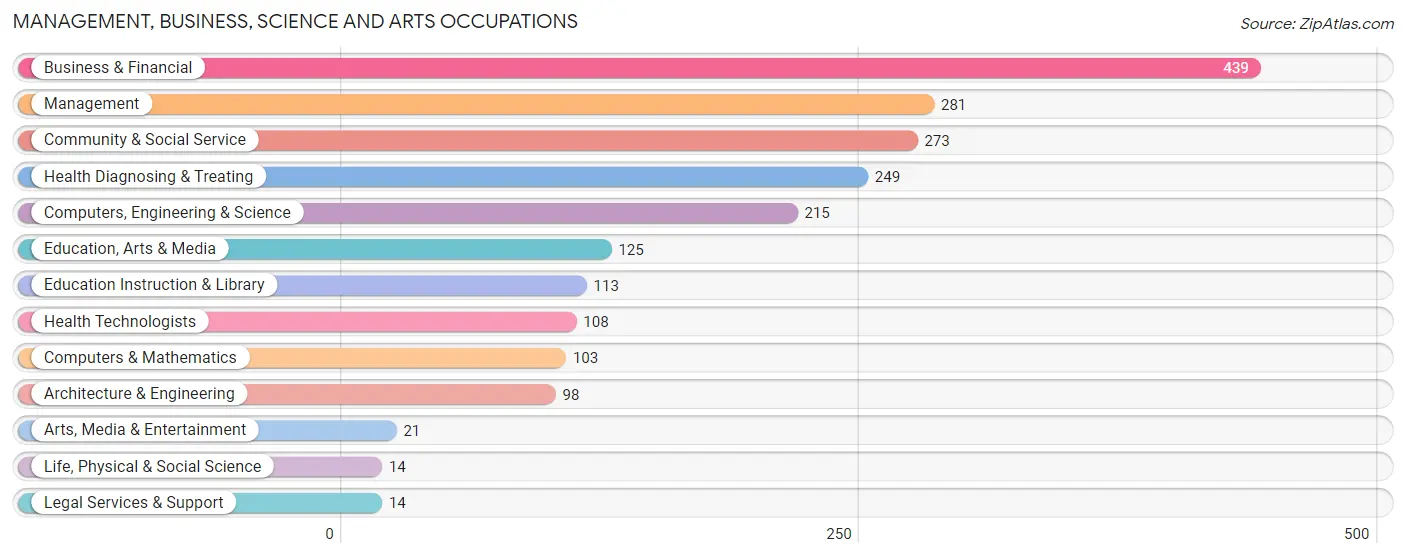
Management, Business, Science and Arts Occupations
The most common Management, Business, Science and Arts occupations in Sherwood Manor are Business & Financial (439 | 13.9%), Management (281 | 8.9%), Community & Social Service (273 | 8.6%), Health Diagnosing & Treating (249 | 7.9%), and Computers, Engineering & Science (215 | 6.8%).
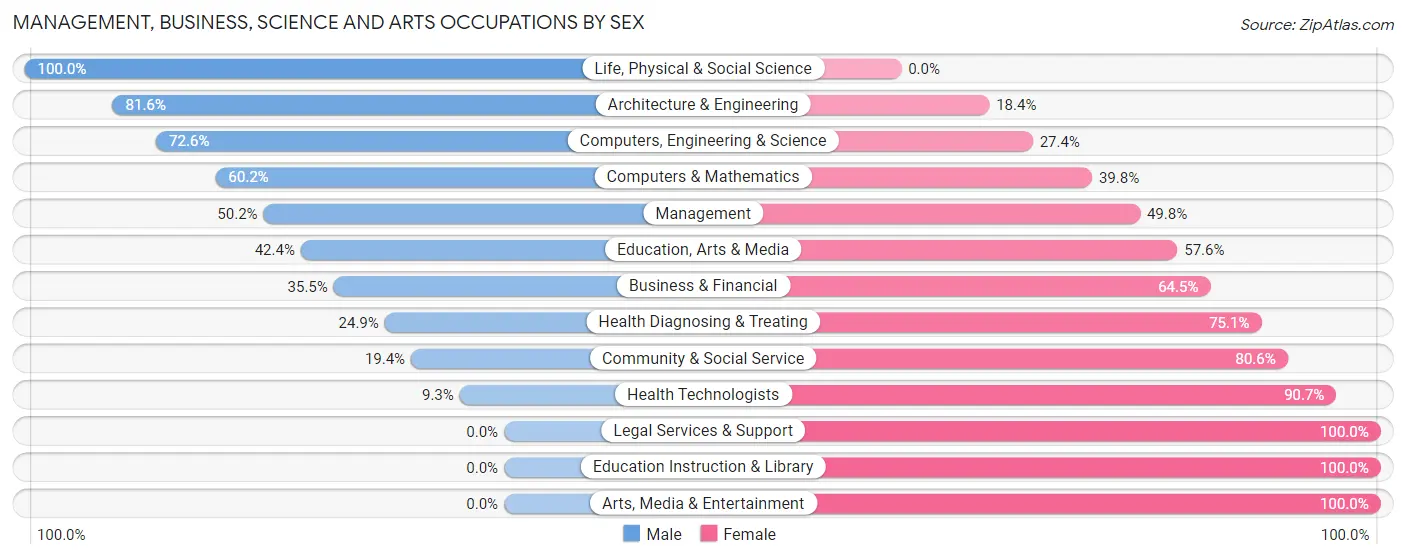
Management, Business, Science and Arts Occupations by Sex
Within the Management, Business, Science and Arts occupations in Sherwood Manor, the most male-oriented occupations are Life, Physical & Social Science (100.0%), Architecture & Engineering (81.6%), and Computers, Engineering & Science (72.6%), while the most female-oriented occupations are Legal Services & Support (100.0%), Education Instruction & Library (100.0%), and Arts, Media & Entertainment (100.0%).
| Occupation | Male | Female |
| Management | 141 (50.2%) | 140 (49.8%) |
| Business & Financial | 156 (35.5%) | 283 (64.5%) |
| Computers, Engineering & Science | 156 (72.6%) | 59 (27.4%) |
| Computers & Mathematics | 62 (60.2%) | 41 (39.8%) |
| Architecture & Engineering | 80 (81.6%) | 18 (18.4%) |
| Life, Physical & Social Science | 14 (100.0%) | 0 (0.0%) |
| Community & Social Service | 53 (19.4%) | 220 (80.6%) |
| Education, Arts & Media | 53 (42.4%) | 72 (57.6%) |
| Legal Services & Support | 0 (0.0%) | 14 (100.0%) |
| Education Instruction & Library | 0 (0.0%) | 113 (100.0%) |
| Arts, Media & Entertainment | 0 (0.0%) | 21 (100.0%) |
| Health Diagnosing & Treating | 62 (24.9%) | 187 (75.1%) |
| Health Technologists | 10 (9.3%) | 98 (90.7%) |
| Total (Category) | 568 (39.0%) | 889 (61.0%) |
| Total (Overall) | 1,648 (52.1%) | 1,515 (47.9%) |
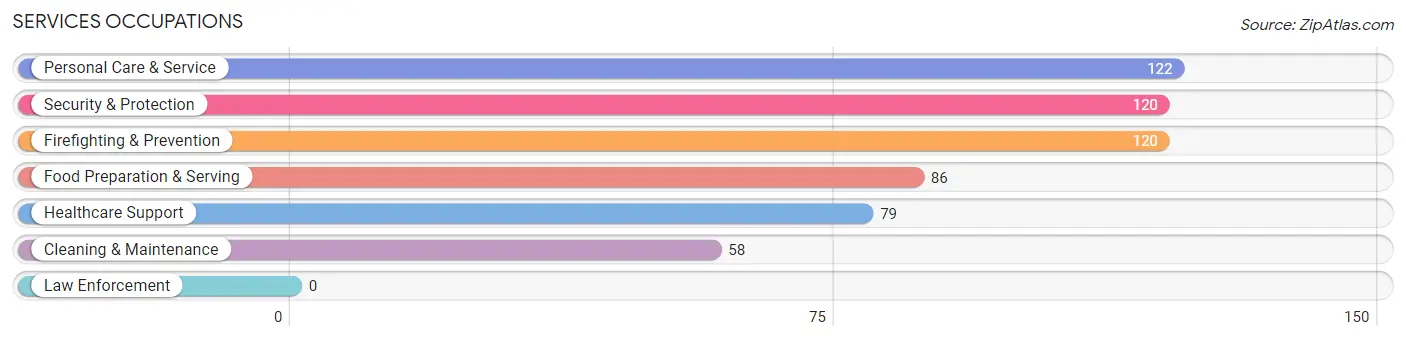
Services Occupations
The most common Services occupations in Sherwood Manor are Personal Care & Service (122 | 3.9%), Security & Protection (120 | 3.8%), Firefighting & Prevention (120 | 3.8%), Food Preparation & Serving (86 | 2.7%), and Healthcare Support (79 | 2.5%).
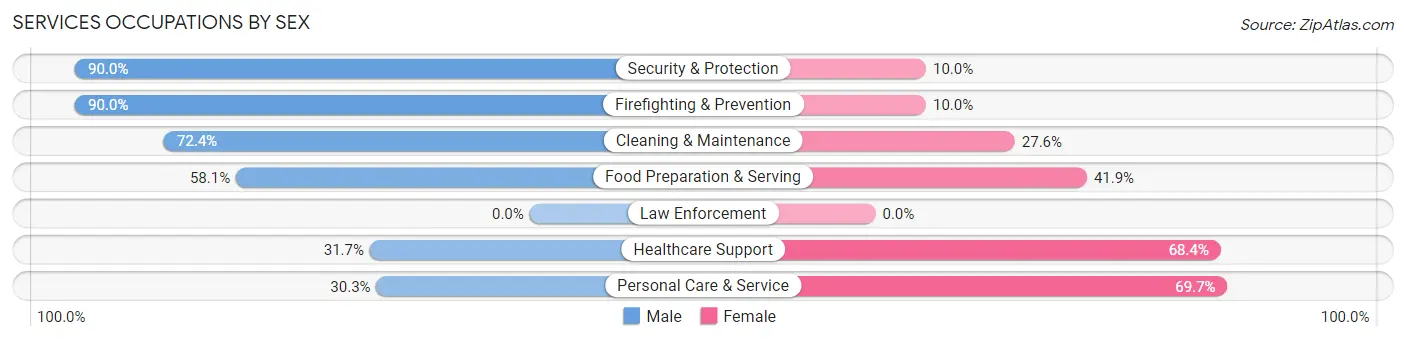
Services Occupations by Sex
Within the Services occupations in Sherwood Manor, the most male-oriented occupations are Security & Protection (90.0%), Firefighting & Prevention (90.0%), and Cleaning & Maintenance (72.4%), while the most female-oriented occupations are Personal Care & Service (69.7%), Healthcare Support (68.3%), and Food Preparation & Serving (41.9%).
| Occupation | Male | Female |
| Healthcare Support | 25 (31.7%) | 54 (68.3%) |
| Security & Protection | 108 (90.0%) | 12 (10.0%) |
| Firefighting & Prevention | 108 (90.0%) | 12 (10.0%) |
| Law Enforcement | 0 (0.0%) | 0 (0.0%) |
| Food Preparation & Serving | 50 (58.1%) | 36 (41.9%) |
| Cleaning & Maintenance | 42 (72.4%) | 16 (27.6%) |
| Personal Care & Service | 37 (30.3%) | 85 (69.7%) |
| Total (Category) | 262 (56.3%) | 203 (43.7%) |
| Total (Overall) | 1,648 (52.1%) | 1,515 (47.9%) |
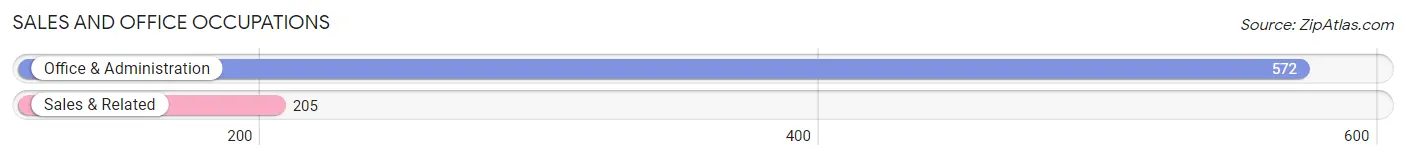
Sales and Office Occupations
The most common Sales and Office occupations in Sherwood Manor are Office & Administration (572 | 18.1%), and Sales & Related (205 | 6.5%).
Sales and Office Occupations by Sex
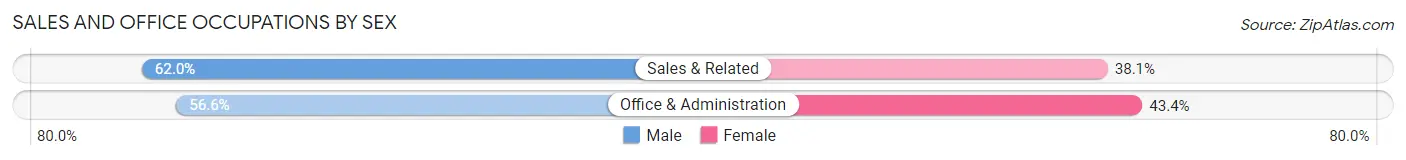
| Occupation | Male | Female |
| Sales & Related | 127 (62.0%) | 78 (38.1%) |
| Office & Administration | 324 (56.6%) | 248 (43.4%) |
| Total (Category) | 451 (58.0%) | 326 (42.0%) |
| Total (Overall) | 1,648 (52.1%) | 1,515 (47.9%) |
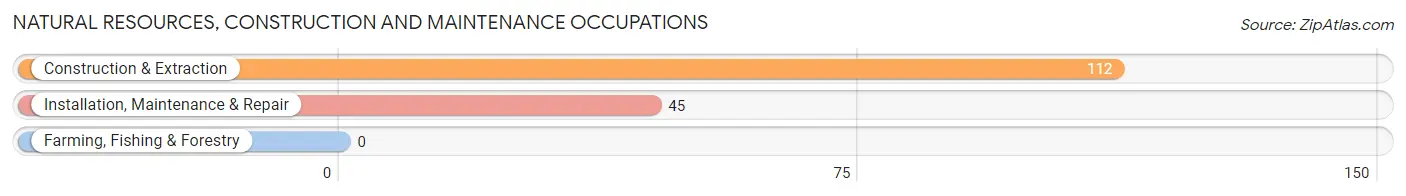
Natural Resources, Construction and Maintenance Occupations
The most common Natural Resources, Construction and Maintenance occupations in Sherwood Manor are Construction & Extraction (112 | 3.5%), and Installation, Maintenance & Repair (45 | 1.4%).
Natural Resources, Construction and Maintenance Occupations by Sex
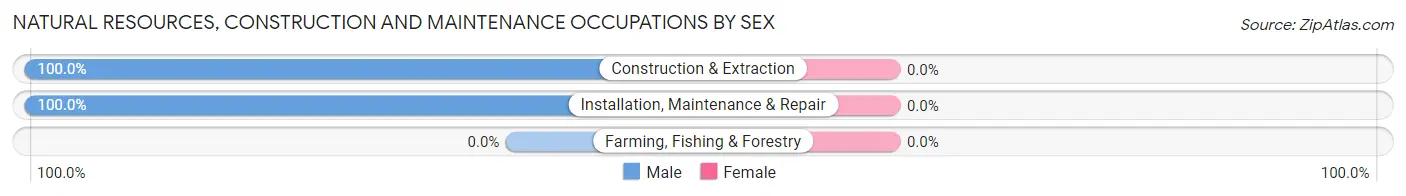
| Occupation | Male | Female |
| Farming, Fishing & Forestry | 0 (0.0%) | 0 (0.0%) |
| Construction & Extraction | 112 (100.0%) | 0 (0.0%) |
| Installation, Maintenance & Repair | 45 (100.0%) | 0 (0.0%) |
| Total (Category) | 157 (100.0%) | 0 (0.0%) |
| Total (Overall) | 1,648 (52.1%) | 1,515 (47.9%) |
Production, Transportation and Moving Occupations
The most common Production, Transportation and Moving occupations in Sherwood Manor are Material Moving (146 | 4.6%), Transportation (108 | 3.4%), and Production (53 | 1.7%).
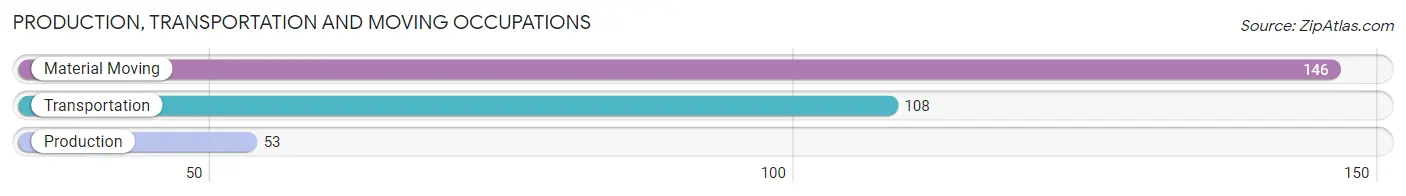
Production, Transportation and Moving Occupations by Sex
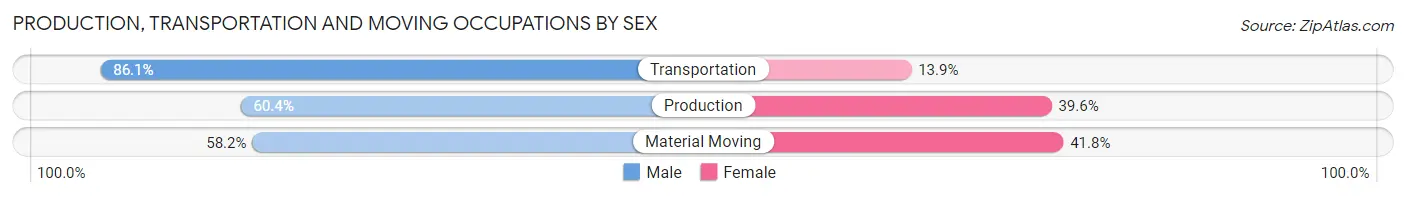
| Occupation | Male | Female |
| Production | 32 (60.4%) | 21 (39.6%) |
| Transportation | 93 (86.1%) | 15 (13.9%) |
| Material Moving | 85 (58.2%) | 61 (41.8%) |
| Total (Category) | 210 (68.4%) | 97 (31.6%) |
| Total (Overall) | 1,648 (52.1%) | 1,515 (47.9%) |
Employment Industries by Sex in Sherwood Manor
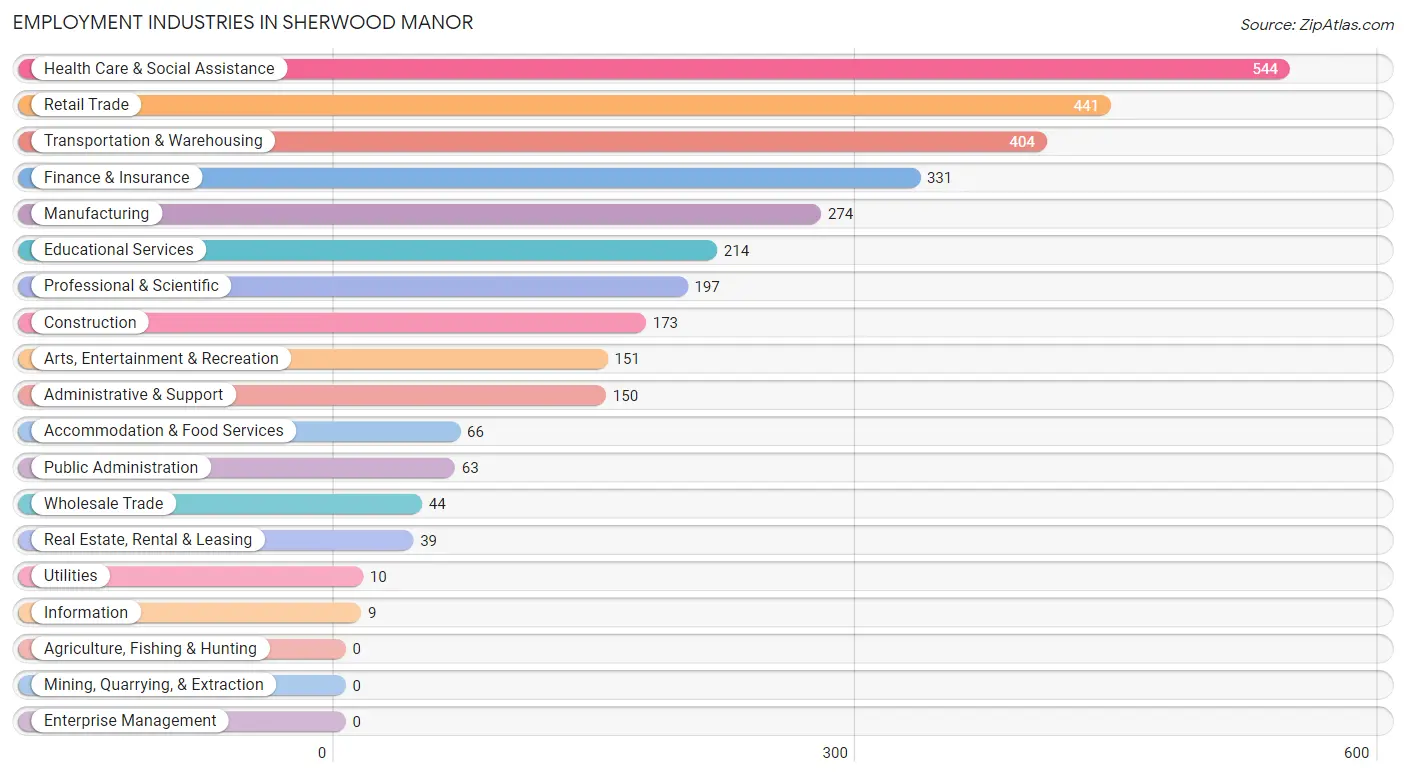
Employment Industries in Sherwood Manor
The major employment industries in Sherwood Manor include Health Care & Social Assistance (544 | 17.2%), Retail Trade (441 | 13.9%), Transportation & Warehousing (404 | 12.8%), Finance & Insurance (331 | 10.5%), and Manufacturing (274 | 8.7%).
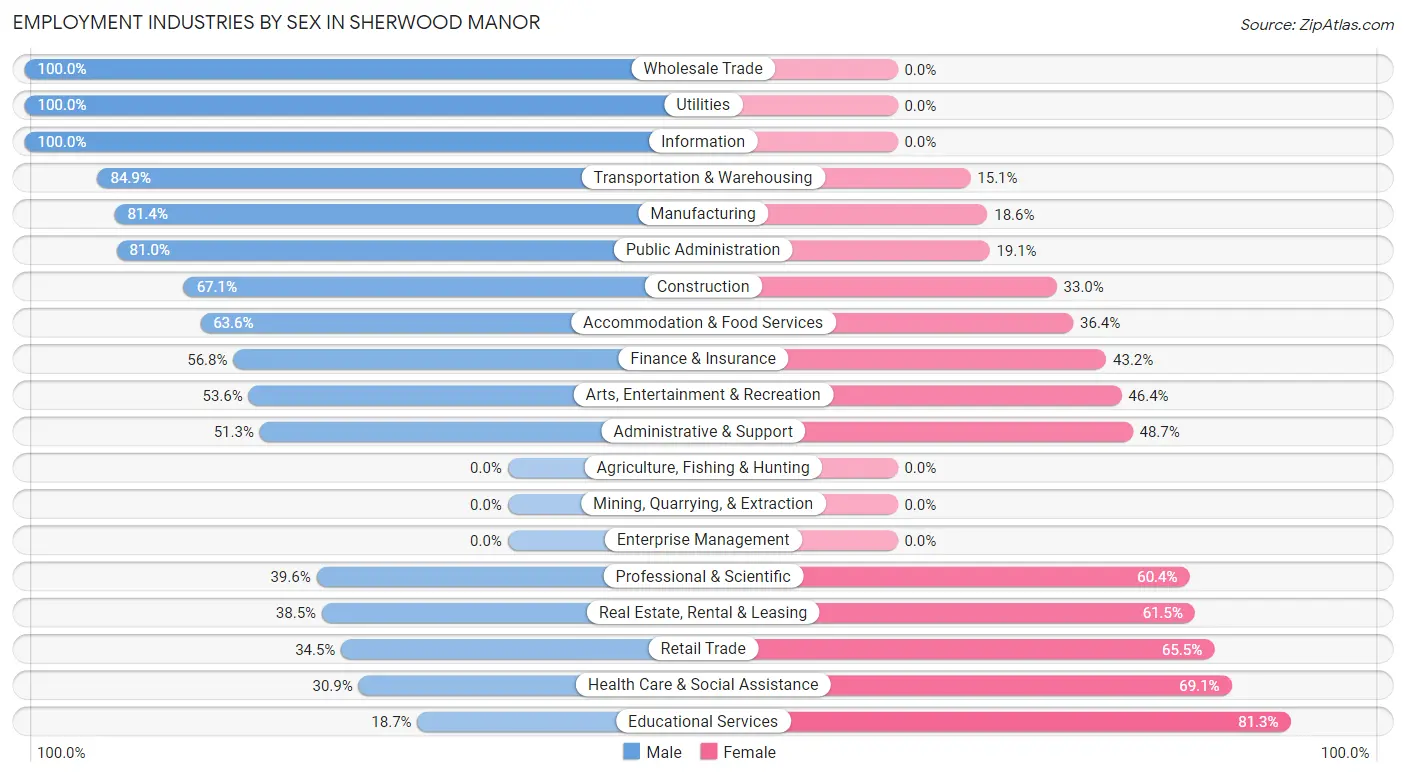
Employment Industries by Sex in Sherwood Manor
The Sherwood Manor industries that see more men than women are Wholesale Trade (100.0%), Utilities (100.0%), and Information (100.0%), whereas the industries that tend to have a higher number of women are Educational Services (81.3%), Health Care & Social Assistance (69.1%), and Retail Trade (65.5%).
| Industry | Male | Female |
| Agriculture, Fishing & Hunting | 0 (0.0%) | 0 (0.0%) |
| Mining, Quarrying, & Extraction | 0 (0.0%) | 0 (0.0%) |
| Construction | 116 (67.0%) | 57 (33.0%) |
| Manufacturing | 223 (81.4%) | 51 (18.6%) |
| Wholesale Trade | 44 (100.0%) | 0 (0.0%) |
| Retail Trade | 152 (34.5%) | 289 (65.5%) |
| Transportation & Warehousing | 343 (84.9%) | 61 (15.1%) |
| Utilities | 10 (100.0%) | 0 (0.0%) |
| Information | 9 (100.0%) | 0 (0.0%) |
| Finance & Insurance | 188 (56.8%) | 143 (43.2%) |
| Real Estate, Rental & Leasing | 15 (38.5%) | 24 (61.5%) |
| Professional & Scientific | 78 (39.6%) | 119 (60.4%) |
| Enterprise Management | 0 (0.0%) | 0 (0.0%) |
| Administrative & Support | 77 (51.3%) | 73 (48.7%) |
| Educational Services | 40 (18.7%) | 174 (81.3%) |
| Health Care & Social Assistance | 168 (30.9%) | 376 (69.1%) |
| Arts, Entertainment & Recreation | 81 (53.6%) | 70 (46.4%) |
| Accommodation & Food Services | 42 (63.6%) | 24 (36.4%) |
| Public Administration | 51 (80.9%) | 12 (19.1%) |
| Total | 1,648 (52.1%) | 1,515 (47.9%) |
Education in Sherwood Manor
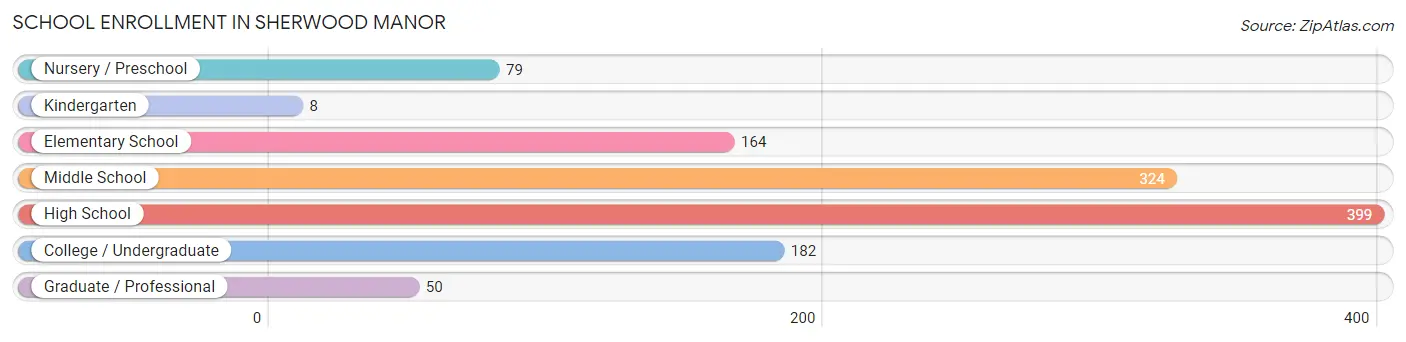
School Enrollment in Sherwood Manor
The most common levels of schooling among the 1,206 students in Sherwood Manor are high school (399 | 33.1%), middle school (324 | 26.9%), and college / undergraduate (182 | 15.1%).
| School Level | # Students | % Students |
| Nursery / Preschool | 79 | 6.6% |
| Kindergarten | 8 | 0.7% |
| Elementary School | 164 | 13.6% |
| Middle School | 324 | 26.9% |
| High School | 399 | 33.1% |
| College / Undergraduate | 182 | 15.1% |
| Graduate / Professional | 50 | 4.2% |
| Total | 1,206 | 100.0% |
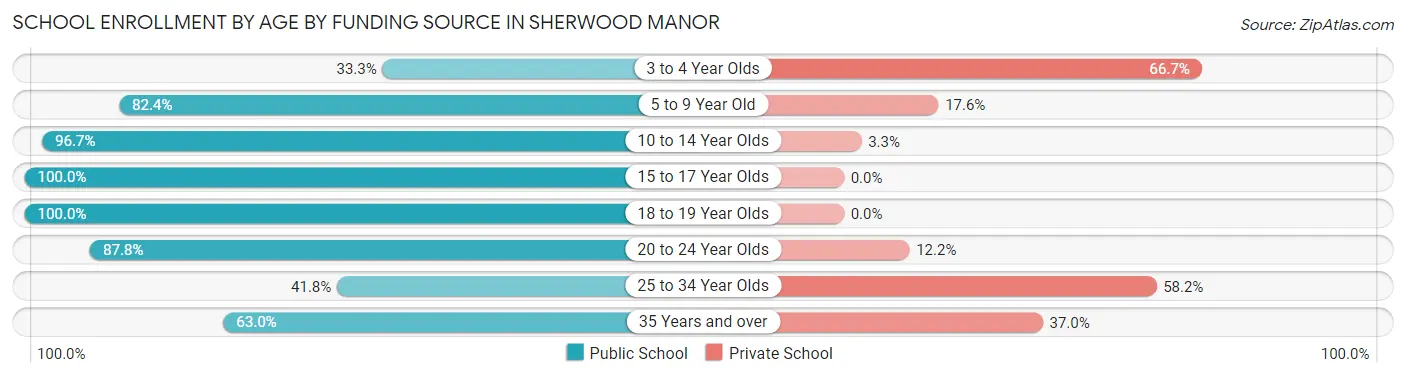
School Enrollment by Age by Funding Source in Sherwood Manor
Out of a total of 1,206 students who are enrolled in schools in Sherwood Manor, 150 (12.4%) attend a private institution, while the remaining 1,056 (87.6%) are enrolled in public schools. The age group of 3 to 4 year olds has the highest likelihood of being enrolled in private schools, with 46 (66.7% in the age bracket) enrolled. Conversely, the age group of 15 to 17 year olds has the lowest likelihood of being enrolled in a private school, with 254 (100.0% in the age bracket) attending a public institution.
| Age Bracket | Public School | Private School |
| 3 to 4 Year Olds | 23 (33.3%) | 46 (66.7%) |
| 5 to 9 Year Old | 117 (82.4%) | 25 (17.6%) |
| 10 to 14 Year Olds | 414 (96.7%) | 14 (3.3%) |
| 15 to 17 Year Olds | 254 (100.0%) | 0 (0.0%) |
| 18 to 19 Year Olds | 88 (100.0%) | 0 (0.0%) |
| 20 to 24 Year Olds | 115 (87.8%) | 16 (12.2%) |
| 25 to 34 Year Olds | 28 (41.8%) | 39 (58.2%) |
| 35 Years and over | 17 (63.0%) | 10 (37.0%) |
| Total | 1,056 (87.6%) | 150 (12.4%) |
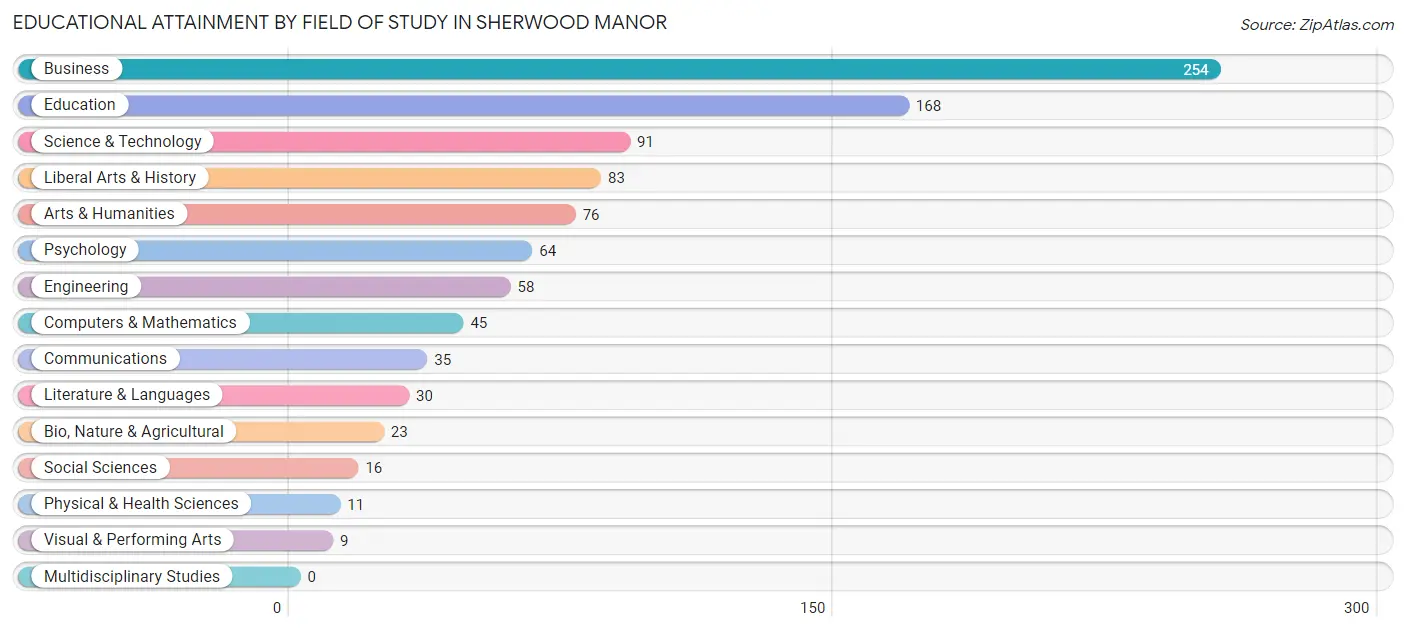
Educational Attainment by Field of Study in Sherwood Manor
Business (254 | 26.4%), education (168 | 17.4%), science & technology (91 | 9.5%), liberal arts & history (83 | 8.6%), and arts & humanities (76 | 7.9%) are the most common fields of study among 963 individuals in Sherwood Manor who have obtained a bachelor's degree or higher.
| Field of Study | # Graduates | % Graduates |
| Computers & Mathematics | 45 | 4.7% |
| Bio, Nature & Agricultural | 23 | 2.4% |
| Physical & Health Sciences | 11 | 1.1% |
| Psychology | 64 | 6.7% |
| Social Sciences | 16 | 1.7% |
| Engineering | 58 | 6.0% |
| Multidisciplinary Studies | 0 | 0.0% |
| Science & Technology | 91 | 9.5% |
| Business | 254 | 26.4% |
| Education | 168 | 17.4% |
| Literature & Languages | 30 | 3.1% |
| Liberal Arts & History | 83 | 8.6% |
| Visual & Performing Arts | 9 | 0.9% |
| Communications | 35 | 3.6% |
| Arts & Humanities | 76 | 7.9% |
| Total | 963 | 100.0% |
Transportation & Commute in Sherwood Manor
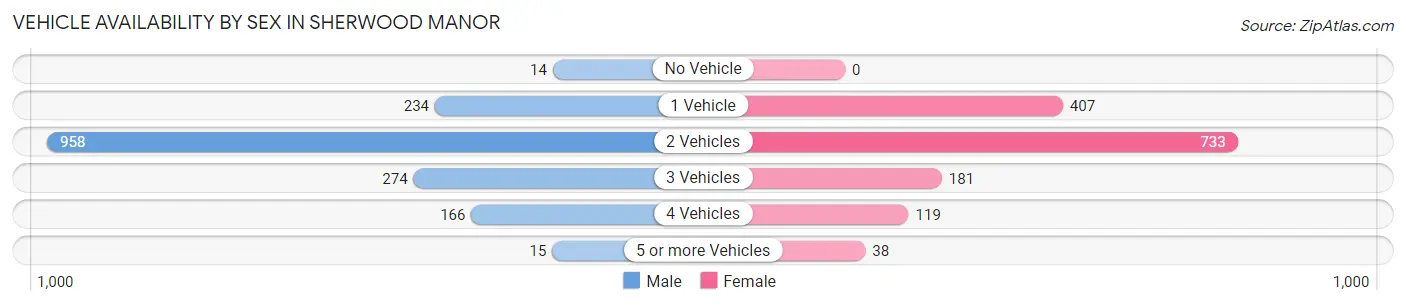
Vehicle Availability by Sex in Sherwood Manor
The most prevalent vehicle ownership categories in Sherwood Manor are males with 2 vehicles (958, accounting for 57.7%) and females with 2 vehicles (733, making up 64.8%).
| Vehicles Available | Male | Female |
| No Vehicle | 14 (0.8%) | 0 (0.0%) |
| 1 Vehicle | 234 (14.1%) | 407 (27.5%) |
| 2 Vehicles | 958 (57.7%) | 733 (49.6%) |
| 3 Vehicles | 274 (16.5%) | 181 (12.2%) |
| 4 Vehicles | 166 (10.0%) | 119 (8.1%) |
| 5 or more Vehicles | 15 (0.9%) | 38 (2.6%) |
| Total | 1,661 (100.0%) | 1,478 (100.0%) |
Commute Time in Sherwood Manor
The most frequently occuring commute durations in Sherwood Manor are 30 to 34 minutes (690 commuters, 24.4%), 20 to 24 minutes (501 commuters, 17.7%), and 10 to 14 minutes (383 commuters, 13.6%).
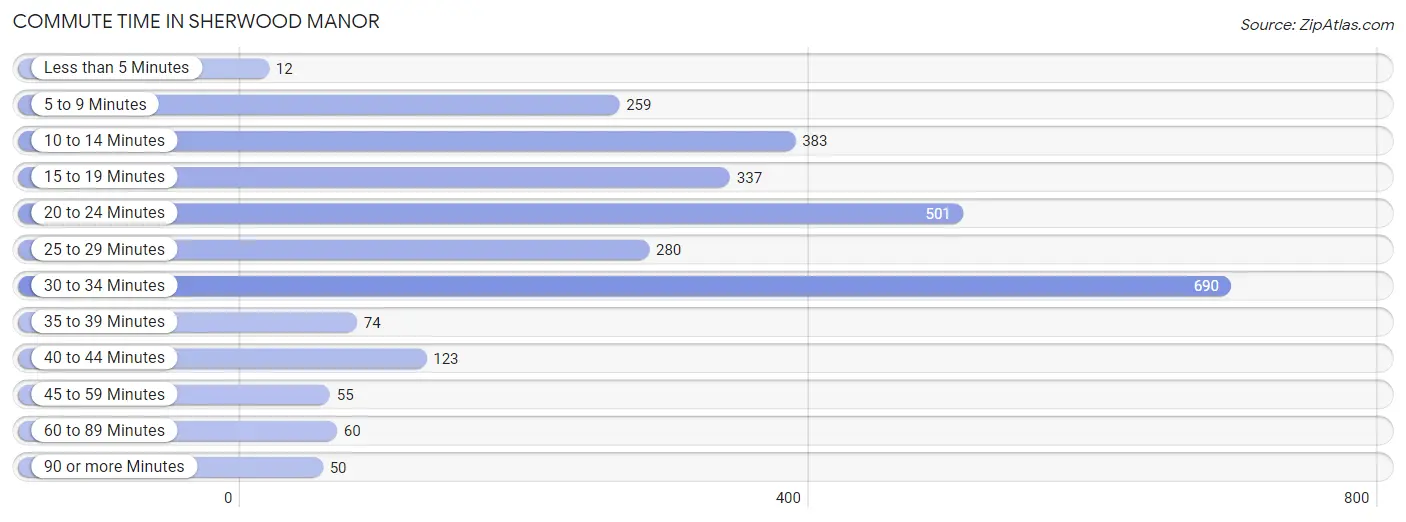
| Commute Time | # Commuters | % Commuters |
| Less than 5 Minutes | 12 | 0.4% |
| 5 to 9 Minutes | 259 | 9.2% |
| 10 to 14 Minutes | 383 | 13.6% |
| 15 to 19 Minutes | 337 | 11.9% |
| 20 to 24 Minutes | 501 | 17.7% |
| 25 to 29 Minutes | 280 | 9.9% |
| 30 to 34 Minutes | 690 | 24.4% |
| 35 to 39 Minutes | 74 | 2.6% |
| 40 to 44 Minutes | 123 | 4.4% |
| 45 to 59 Minutes | 55 | 1.9% |
| 60 to 89 Minutes | 60 | 2.1% |
| 90 or more Minutes | 50 | 1.8% |
Commute Time by Sex in Sherwood Manor
The most common commute times in Sherwood Manor are 30 to 34 minutes (523 commuters, 33.5%) for males and 20 to 24 minutes (248 commuters, 19.6%) for females.
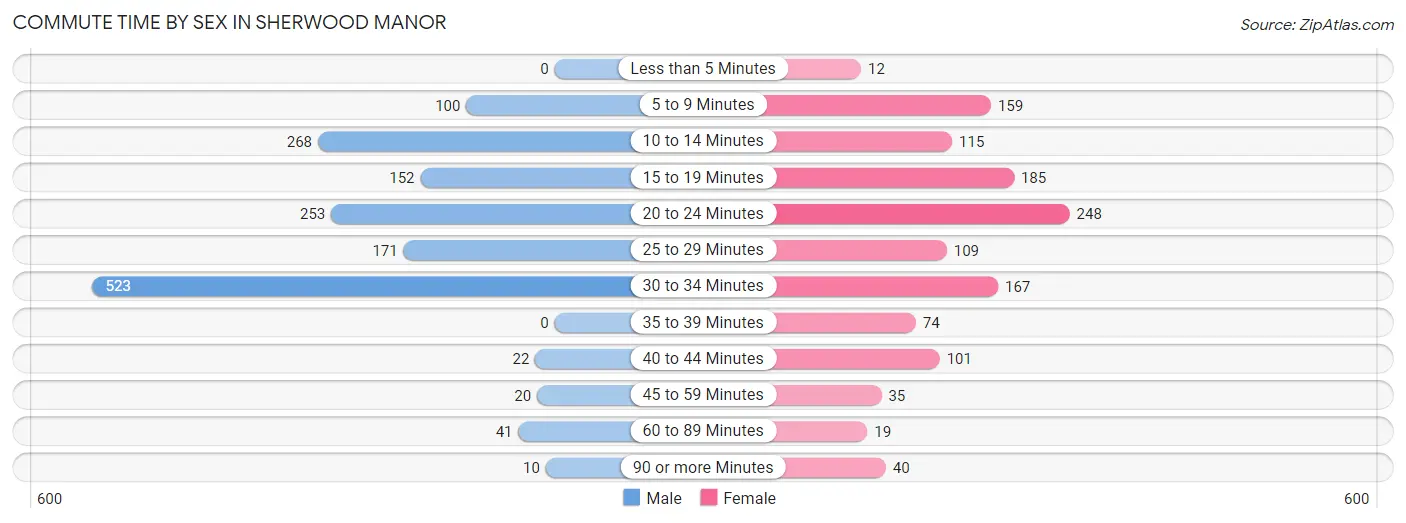
| Commute Time | Male | Female |
| Less than 5 Minutes | 0 (0.0%) | 12 (0.9%) |
| 5 to 9 Minutes | 100 (6.4%) | 159 (12.6%) |
| 10 to 14 Minutes | 268 (17.2%) | 115 (9.1%) |
| 15 to 19 Minutes | 152 (9.7%) | 185 (14.6%) |
| 20 to 24 Minutes | 253 (16.2%) | 248 (19.6%) |
| 25 to 29 Minutes | 171 (11.0%) | 109 (8.6%) |
| 30 to 34 Minutes | 523 (33.5%) | 167 (13.2%) |
| 35 to 39 Minutes | 0 (0.0%) | 74 (5.9%) |
| 40 to 44 Minutes | 22 (1.4%) | 101 (8.0%) |
| 45 to 59 Minutes | 20 (1.3%) | 35 (2.8%) |
| 60 to 89 Minutes | 41 (2.6%) | 19 (1.5%) |
| 90 or more Minutes | 10 (0.6%) | 40 (3.2%) |
Time of Departure to Work by Sex in Sherwood Manor
The most frequent times of departure to work in Sherwood Manor are 9:00 AM to 9:59 AM (268, 17.2%) for males and 7:00 AM to 7:29 AM (227, 18.0%) for females.
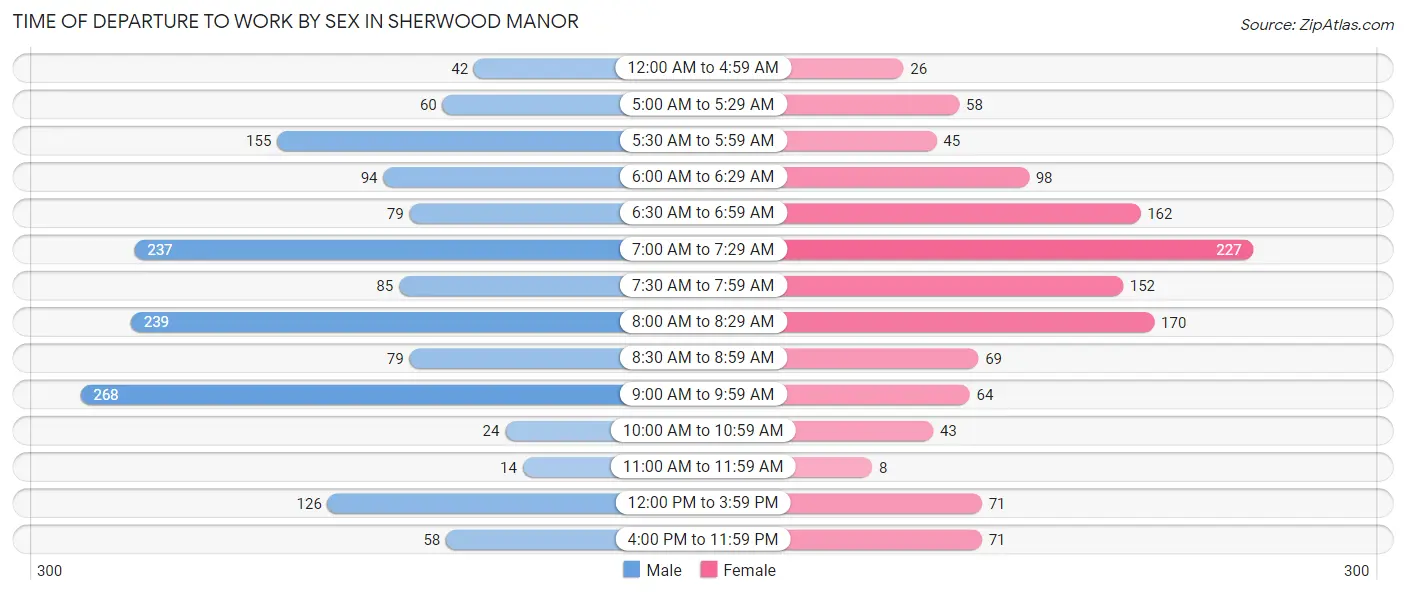
| Time of Departure | Male | Female |
| 12:00 AM to 4:59 AM | 42 (2.7%) | 26 (2.1%) |
| 5:00 AM to 5:29 AM | 60 (3.8%) | 58 (4.6%) |
| 5:30 AM to 5:59 AM | 155 (9.9%) | 45 (3.6%) |
| 6:00 AM to 6:29 AM | 94 (6.0%) | 98 (7.7%) |
| 6:30 AM to 6:59 AM | 79 (5.1%) | 162 (12.8%) |
| 7:00 AM to 7:29 AM | 237 (15.2%) | 227 (18.0%) |
| 7:30 AM to 7:59 AM | 85 (5.4%) | 152 (12.0%) |
| 8:00 AM to 8:29 AM | 239 (15.3%) | 170 (13.5%) |
| 8:30 AM to 8:59 AM | 79 (5.1%) | 69 (5.5%) |
| 9:00 AM to 9:59 AM | 268 (17.2%) | 64 (5.1%) |
| 10:00 AM to 10:59 AM | 24 (1.5%) | 43 (3.4%) |
| 11:00 AM to 11:59 AM | 14 (0.9%) | 8 (0.6%) |
| 12:00 PM to 3:59 PM | 126 (8.1%) | 71 (5.6%) |
| 4:00 PM to 11:59 PM | 58 (3.7%) | 71 (5.6%) |
| Total | 1,560 (100.0%) | 1,264 (100.0%) |
Housing Occupancy in Sherwood Manor
Occupancy by Ownership in Sherwood Manor
Of the total 2,208 dwellings in Sherwood Manor, owner-occupied units account for 1,777 (80.5%), while renter-occupied units make up 431 (19.5%).
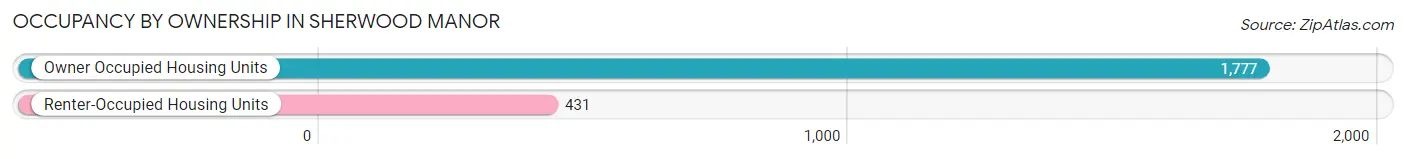
| Occupancy | # Housing Units | % Housing Units |
| Owner Occupied Housing Units | 1,777 | 80.5% |
| Renter-Occupied Housing Units | 431 | 19.5% |
| Total Occupied Housing Units | 2,208 | 100.0% |
Occupancy by Household Size in Sherwood Manor
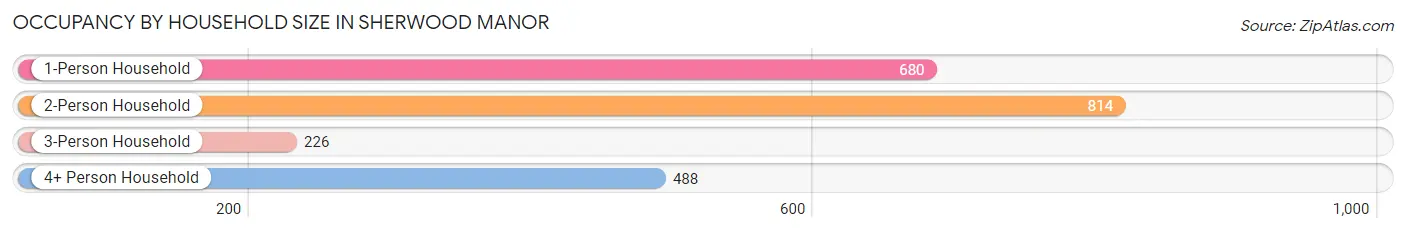
| Household Size | # Housing Units | % Housing Units |
| 1-Person Household | 680 | 30.8% |
| 2-Person Household | 814 | 36.9% |
| 3-Person Household | 226 | 10.2% |
| 4+ Person Household | 488 | 22.1% |
| Total Housing Units | 2,208 | 100.0% |
Occupancy by Ownership by Household Size in Sherwood Manor
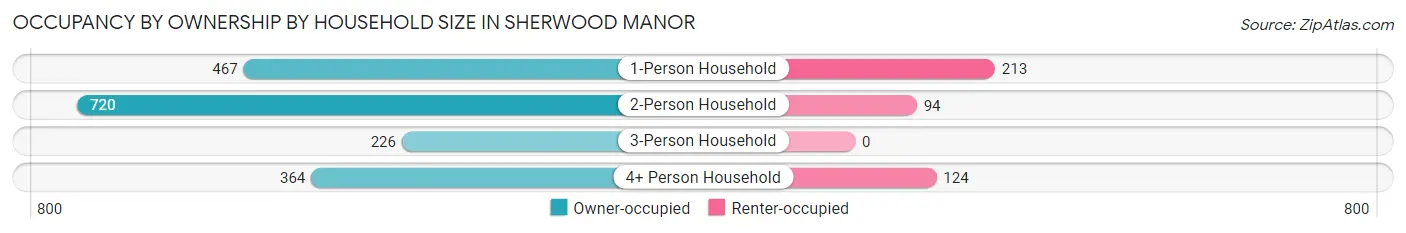
| Household Size | Owner-occupied | Renter-occupied |
| 1-Person Household | 467 (68.7%) | 213 (31.3%) |
| 2-Person Household | 720 (88.4%) | 94 (11.6%) |
| 3-Person Household | 226 (100.0%) | 0 (0.0%) |
| 4+ Person Household | 364 (74.6%) | 124 (25.4%) |
| Total Housing Units | 1,777 (80.5%) | 431 (19.5%) |
Occupancy by Educational Attainment in Sherwood Manor
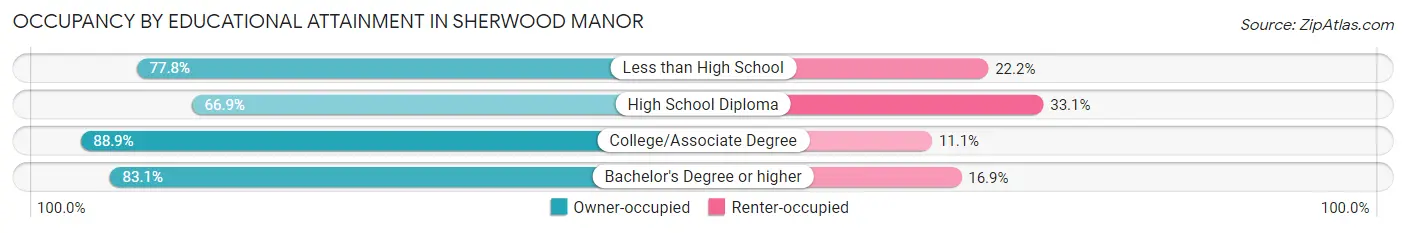
| Household Size | Owner-occupied | Renter-occupied |
| Less than High School | 28 (77.8%) | 8 (22.2%) |
| High School Diploma | 438 (66.9%) | 217 (33.1%) |
| College/Associate Degree | 764 (88.9%) | 95 (11.1%) |
| Bachelor's Degree or higher | 547 (83.1%) | 111 (16.9%) |
Occupancy by Age of Householder in Sherwood Manor
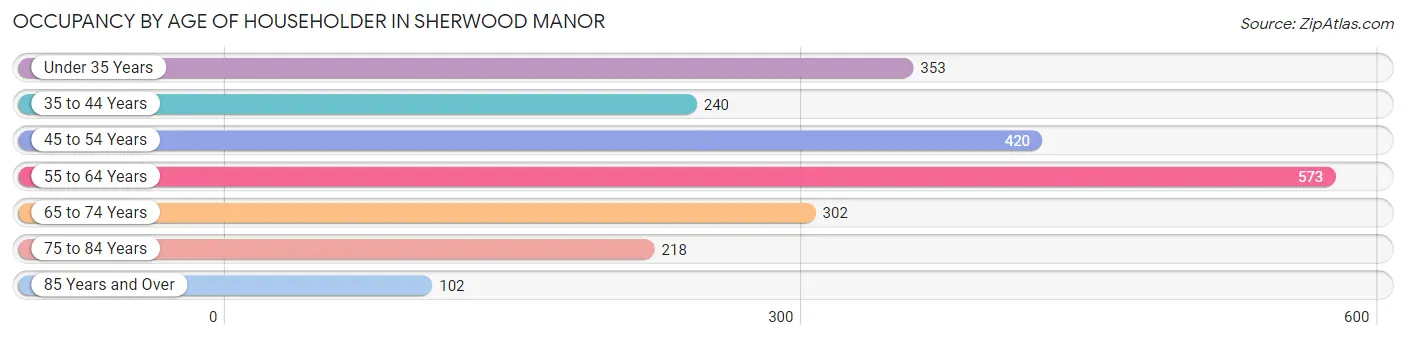
| Age Bracket | # Households | % Households |
| Under 35 Years | 353 | 16.0% |
| 35 to 44 Years | 240 | 10.9% |
| 45 to 54 Years | 420 | 19.0% |
| 55 to 64 Years | 573 | 26.0% |
| 65 to 74 Years | 302 | 13.7% |
| 75 to 84 Years | 218 | 9.9% |
| 85 Years and Over | 102 | 4.6% |
| Total | 2,208 | 100.0% |
Housing Finances in Sherwood Manor
Median Income by Occupancy in Sherwood Manor
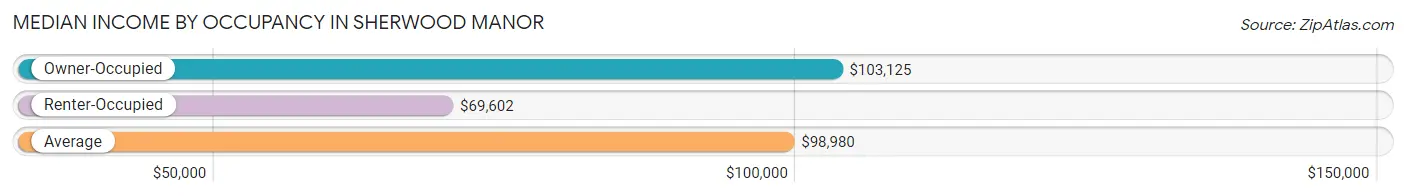
| Occupancy Type | # Households | Median Income |
| Owner-Occupied | 1,777 (80.5%) | $103,125 |
| Renter-Occupied | 431 (19.5%) | $69,602 |
| Average | 2,208 (100.0%) | $98,980 |
Occupancy by Householder Income Bracket in Sherwood Manor
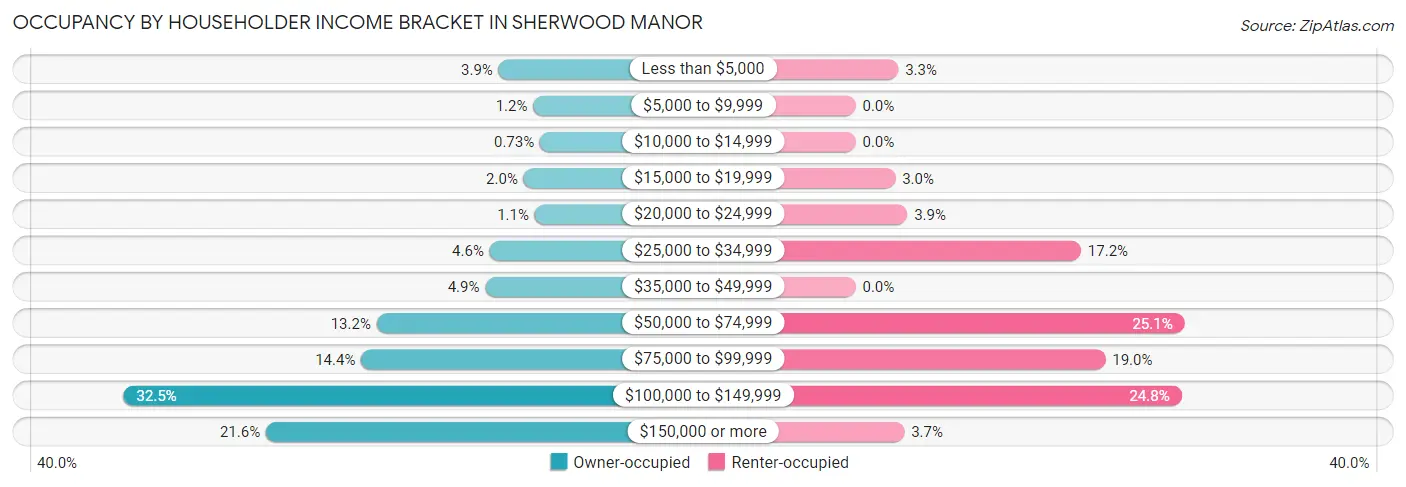
| Income Bracket | Owner-occupied | Renter-occupied |
| Less than $5,000 | 69 (3.9%) | 14 (3.3%) |
| $5,000 to $9,999 | 22 (1.2%) | 0 (0.0%) |
| $10,000 to $14,999 | 13 (0.7%) | 0 (0.0%) |
| $15,000 to $19,999 | 35 (2.0%) | 13 (3.0%) |
| $20,000 to $24,999 | 20 (1.1%) | 17 (3.9%) |
| $25,000 to $34,999 | 81 (4.6%) | 74 (17.2%) |
| $35,000 to $49,999 | 87 (4.9%) | 0 (0.0%) |
| $50,000 to $74,999 | 234 (13.2%) | 108 (25.1%) |
| $75,000 to $99,999 | 255 (14.3%) | 82 (19.0%) |
| $100,000 to $149,999 | 577 (32.5%) | 107 (24.8%) |
| $150,000 or more | 384 (21.6%) | 16 (3.7%) |
| Total | 1,777 (100.0%) | 431 (100.0%) |
Monthly Housing Cost Tiers in Sherwood Manor
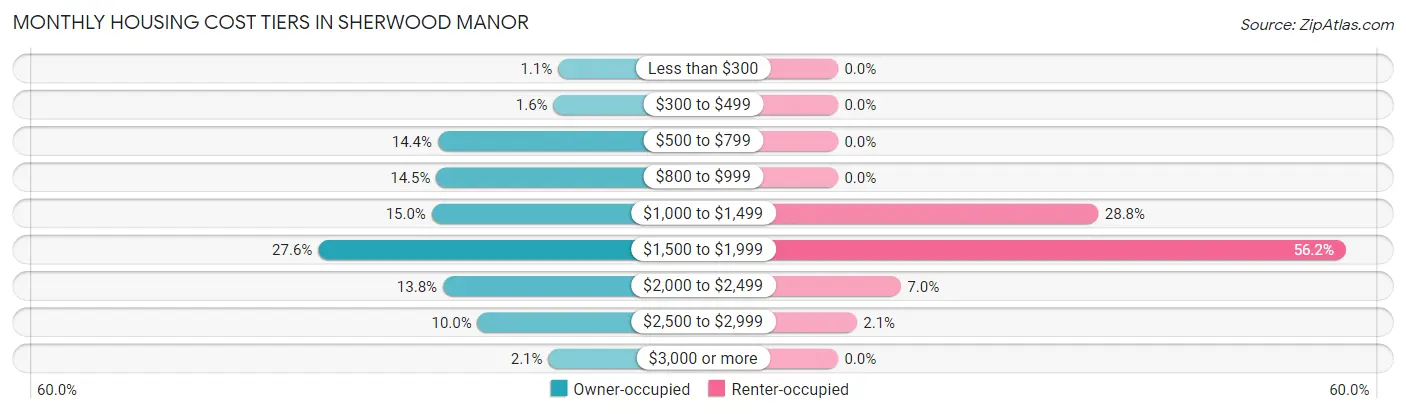
| Monthly Cost | Owner-occupied | Renter-occupied |
| Less than $300 | 19 (1.1%) | 0 (0.0%) |
| $300 to $499 | 28 (1.6%) | 0 (0.0%) |
| $500 to $799 | 255 (14.3%) | 0 (0.0%) |
| $800 to $999 | 258 (14.5%) | 0 (0.0%) |
| $1,000 to $1,499 | 267 (15.0%) | 124 (28.8%) |
| $1,500 to $1,999 | 490 (27.6%) | 242 (56.1%) |
| $2,000 to $2,499 | 245 (13.8%) | 30 (7.0%) |
| $2,500 to $2,999 | 177 (10.0%) | 9 (2.1%) |
| $3,000 or more | 38 (2.1%) | 0 (0.0%) |
| Total | 1,777 (100.0%) | 431 (100.0%) |
Physical Housing Characteristics in Sherwood Manor
Housing Structures in Sherwood Manor
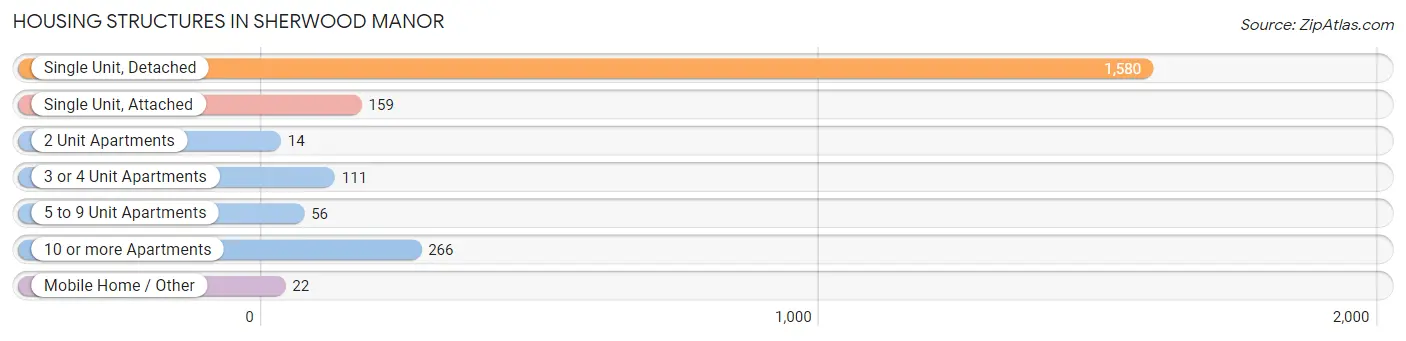
| Structure Type | # Housing Units | % Housing Units |
| Single Unit, Detached | 1,580 | 71.6% |
| Single Unit, Attached | 159 | 7.2% |
| 2 Unit Apartments | 14 | 0.6% |
| 3 or 4 Unit Apartments | 111 | 5.0% |
| 5 to 9 Unit Apartments | 56 | 2.5% |
| 10 or more Apartments | 266 | 12.0% |
| Mobile Home / Other | 22 | 1.0% |
| Total | 2,208 | 100.0% |
Housing Structures by Occupancy in Sherwood Manor
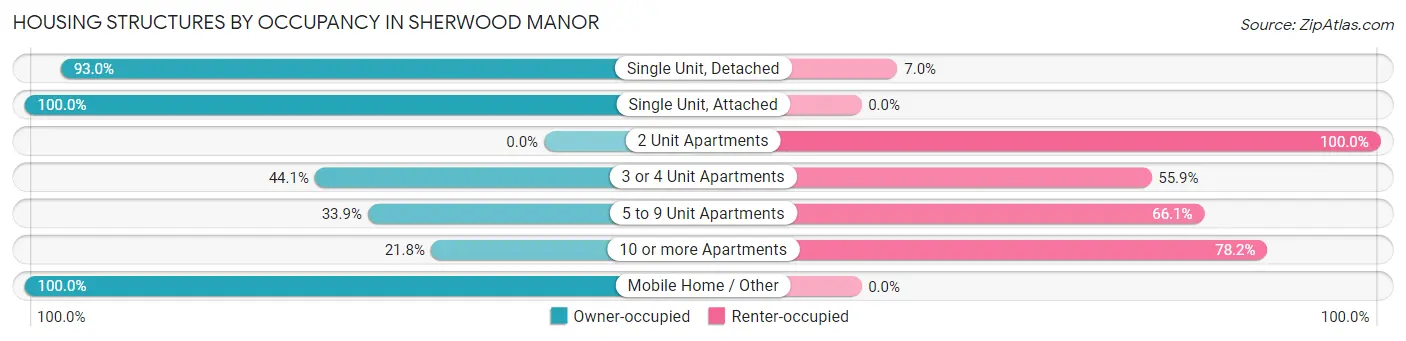
| Structure Type | Owner-occupied | Renter-occupied |
| Single Unit, Detached | 1,470 (93.0%) | 110 (7.0%) |
| Single Unit, Attached | 159 (100.0%) | 0 (0.0%) |
| 2 Unit Apartments | 0 (0.0%) | 14 (100.0%) |
| 3 or 4 Unit Apartments | 49 (44.1%) | 62 (55.9%) |
| 5 to 9 Unit Apartments | 19 (33.9%) | 37 (66.1%) |
| 10 or more Apartments | 58 (21.8%) | 208 (78.2%) |
| Mobile Home / Other | 22 (100.0%) | 0 (0.0%) |
| Total | 1,777 (80.5%) | 431 (19.5%) |
Housing Structures by Number of Rooms in Sherwood Manor
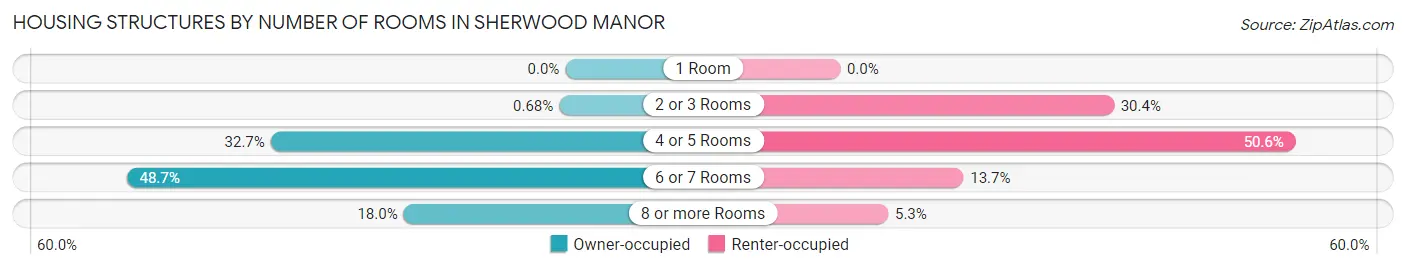
| Number of Rooms | Owner-occupied | Renter-occupied |
| 1 Room | 0 (0.0%) | 0 (0.0%) |
| 2 or 3 Rooms | 12 (0.7%) | 131 (30.4%) |
| 4 or 5 Rooms | 581 (32.7%) | 218 (50.6%) |
| 6 or 7 Rooms | 865 (48.7%) | 59 (13.7%) |
| 8 or more Rooms | 319 (17.9%) | 23 (5.3%) |
| Total | 1,777 (100.0%) | 431 (100.0%) |
Housing Structure by Heating Type in Sherwood Manor
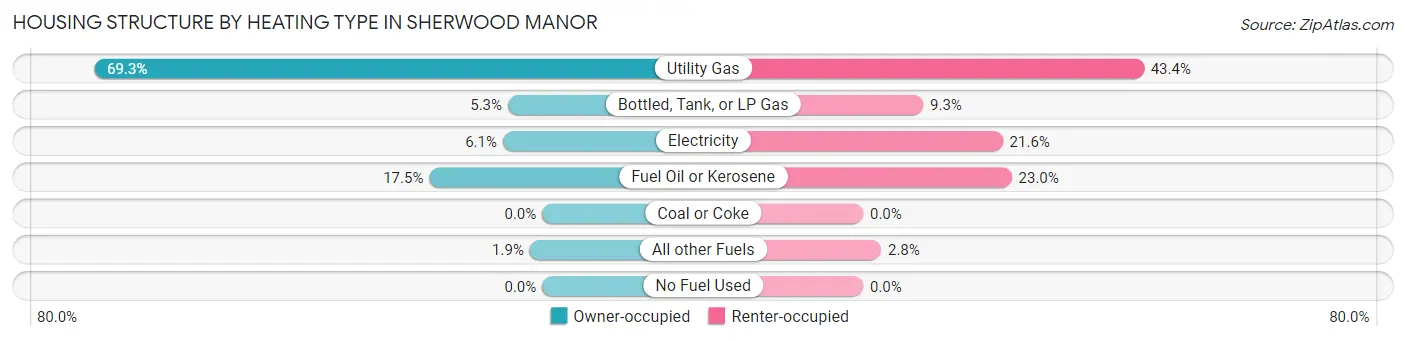
| Heating Type | Owner-occupied | Renter-occupied |
| Utility Gas | 1,231 (69.3%) | 187 (43.4%) |
| Bottled, Tank, or LP Gas | 94 (5.3%) | 40 (9.3%) |
| Electricity | 108 (6.1%) | 93 (21.6%) |
| Fuel Oil or Kerosene | 310 (17.4%) | 99 (23.0%) |
| Coal or Coke | 0 (0.0%) | 0 (0.0%) |
| All other Fuels | 34 (1.9%) | 12 (2.8%) |
| No Fuel Used | 0 (0.0%) | 0 (0.0%) |
| Total | 1,777 (100.0%) | 431 (100.0%) |
Household Vehicle Usage in Sherwood Manor
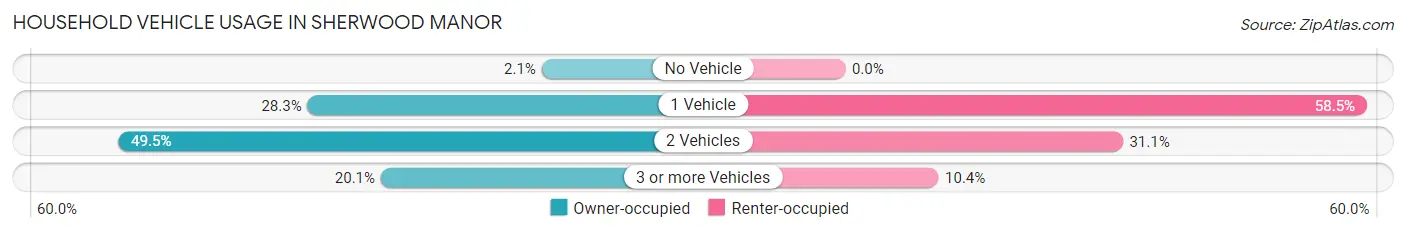
| Vehicles per Household | Owner-occupied | Renter-occupied |
| No Vehicle | 37 (2.1%) | 0 (0.0%) |
| 1 Vehicle | 503 (28.3%) | 252 (58.5%) |
| 2 Vehicles | 880 (49.5%) | 134 (31.1%) |
| 3 or more Vehicles | 357 (20.1%) | 45 (10.4%) |
| Total | 1,777 (100.0%) | 431 (100.0%) |
Real Estate & Mortgages in Sherwood Manor
Real Estate and Mortgage Overview in Sherwood Manor
| Characteristic | Without Mortgage | With Mortgage |
| Housing Units | 658 | 1,119 |
| Median Property Value | $229,700 | $230,300 |
| Median Household Income | $94,063 | $259 |
| Monthly Housing Costs | $820 | $38 |
| Real Estate Taxes | $4,915 | $0 |
Property Value by Mortgage Status in Sherwood Manor
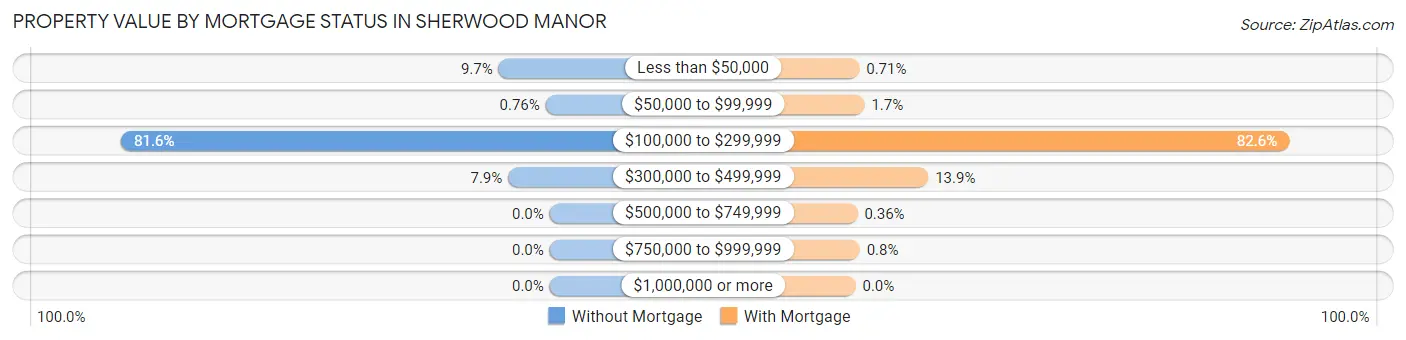
| Property Value | Without Mortgage | With Mortgage |
| Less than $50,000 | 64 (9.7%) | 8 (0.7%) |
| $50,000 to $99,999 | 5 (0.8%) | 19 (1.7%) |
| $100,000 to $299,999 | 537 (81.6%) | 924 (82.6%) |
| $300,000 to $499,999 | 52 (7.9%) | 155 (13.9%) |
| $500,000 to $749,999 | 0 (0.0%) | 4 (0.4%) |
| $750,000 to $999,999 | 0 (0.0%) | 9 (0.8%) |
| $1,000,000 or more | 0 (0.0%) | 0 (0.0%) |
| Total | 658 (100.0%) | 1,119 (100.0%) |
Household Income by Mortgage Status in Sherwood Manor
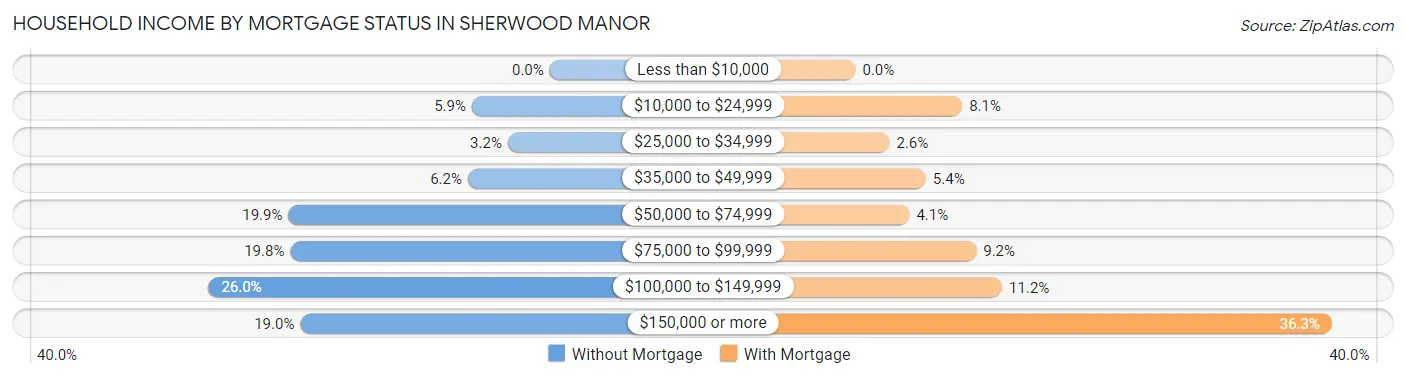
| Household Income | Without Mortgage | With Mortgage |
| Less than $10,000 | 0 (0.0%) | 0 (0.0%) |
| $10,000 to $24,999 | 39 (5.9%) | 91 (8.1%) |
| $25,000 to $34,999 | 21 (3.2%) | 29 (2.6%) |
| $35,000 to $49,999 | 41 (6.2%) | 60 (5.4%) |
| $50,000 to $74,999 | 131 (19.9%) | 46 (4.1%) |
| $75,000 to $99,999 | 130 (19.8%) | 103 (9.2%) |
| $100,000 to $149,999 | 171 (26.0%) | 125 (11.2%) |
| $150,000 or more | 125 (19.0%) | 406 (36.3%) |
| Total | 658 (100.0%) | 1,119 (100.0%) |
Property Value to Household Income Ratio in Sherwood Manor
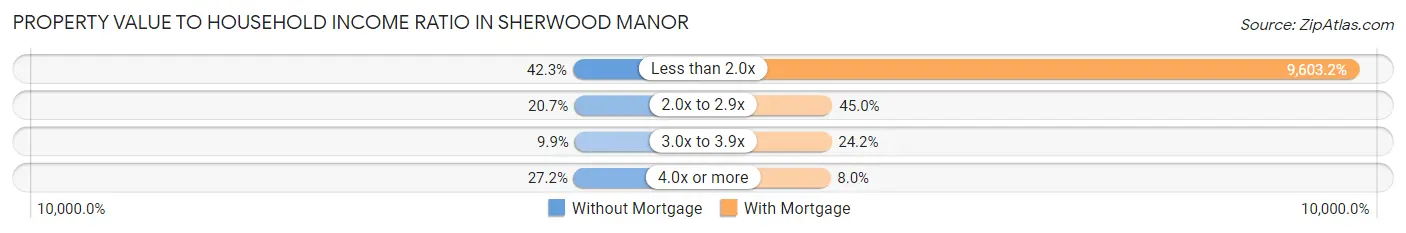
| Value-to-Income Ratio | Without Mortgage | With Mortgage |
| Less than 2.0x | 278 (42.2%) | 107,460 (9,603.2%) |
| 2.0x to 2.9x | 136 (20.7%) | 504 (45.0%) |
| 3.0x to 3.9x | 65 (9.9%) | 271 (24.2%) |
| 4.0x or more | 179 (27.2%) | 90 (8.0%) |
| Total | 658 (100.0%) | 1,119 (100.0%) |
Real Estate Taxes by Mortgage Status in Sherwood Manor
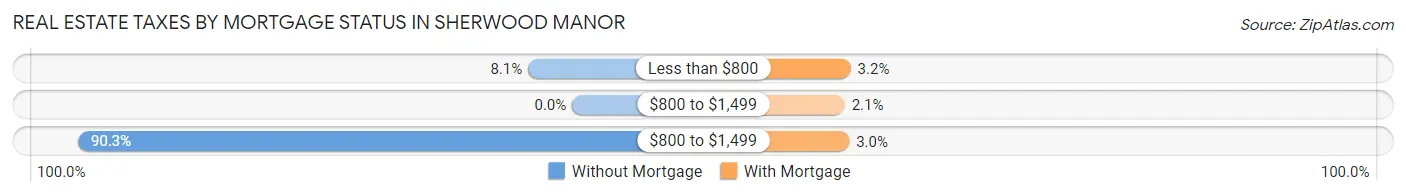
| Property Taxes | Without Mortgage | With Mortgage |
| Less than $800 | 53 (8.1%) | 36 (3.2%) |
| $800 to $1,499 | 0 (0.0%) | 24 (2.1%) |
| $800 to $1,499 | 594 (90.3%) | 33 (2.9%) |
| Total | 658 (100.0%) | 1,119 (100.0%) |
Health & Disability in Sherwood Manor
Health Insurance Coverage by Age in Sherwood Manor
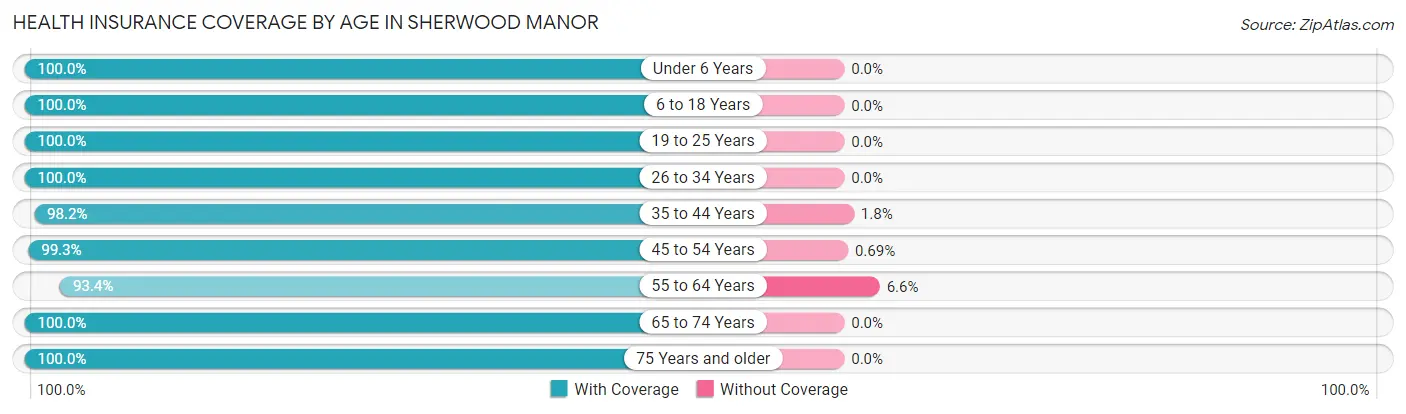
| Age Bracket | With Coverage | Without Coverage |
| Under 6 Years | 342 (100.0%) | 0 (0.0%) |
| 6 to 18 Years | 907 (100.0%) | 0 (0.0%) |
| 19 to 25 Years | 728 (100.0%) | 0 (0.0%) |
| 26 to 34 Years | 580 (100.0%) | 0 (0.0%) |
| 35 to 44 Years | 548 (98.2%) | 10 (1.8%) |
| 45 to 54 Years | 724 (99.3%) | 5 (0.7%) |
| 55 to 64 Years | 835 (93.4%) | 59 (6.6%) |
| 65 to 74 Years | 493 (100.0%) | 0 (0.0%) |
| 75 Years and older | 487 (100.0%) | 0 (0.0%) |
| Total | 5,644 (98.7%) | 74 (1.3%) |
Health Insurance Coverage by Citizenship Status in Sherwood Manor
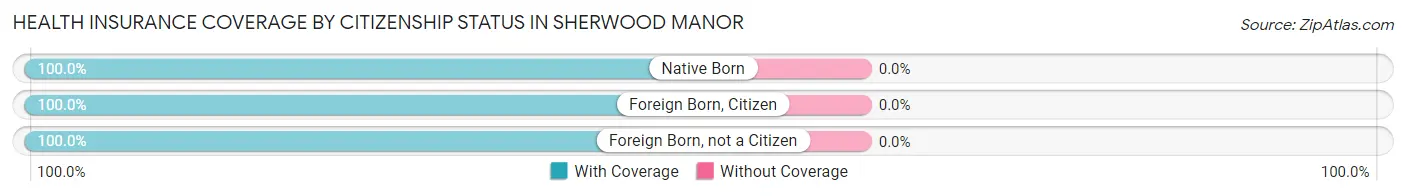
| Citizenship Status | With Coverage | Without Coverage |
| Native Born | 342 (100.0%) | 0 (0.0%) |
| Foreign Born, Citizen | 907 (100.0%) | 0 (0.0%) |
| Foreign Born, not a Citizen | 728 (100.0%) | 0 (0.0%) |
Health Insurance Coverage by Household Income in Sherwood Manor
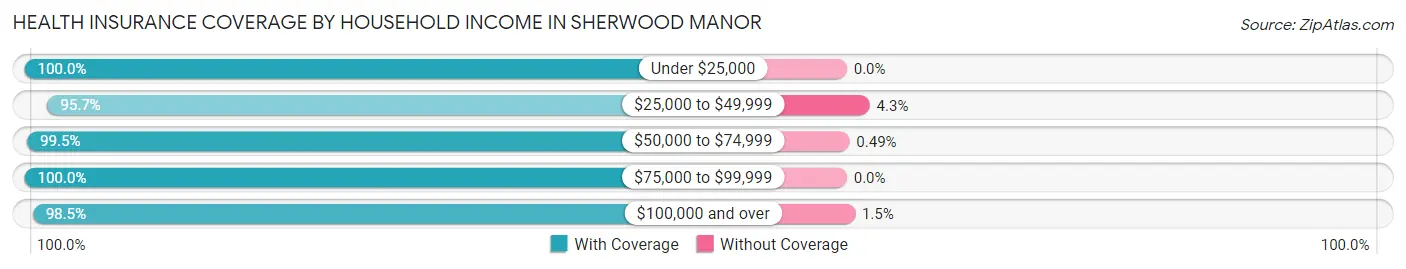
| Household Income | With Coverage | Without Coverage |
| Under $25,000 | 332 (100.0%) | 0 (0.0%) |
| $25,000 to $49,999 | 403 (95.7%) | 18 (4.3%) |
| $50,000 to $74,999 | 808 (99.5%) | 4 (0.5%) |
| $75,000 to $99,999 | 737 (100.0%) | 0 (0.0%) |
| $100,000 and over | 3,351 (98.5%) | 52 (1.5%) |
Public vs Private Health Insurance Coverage by Age in Sherwood Manor
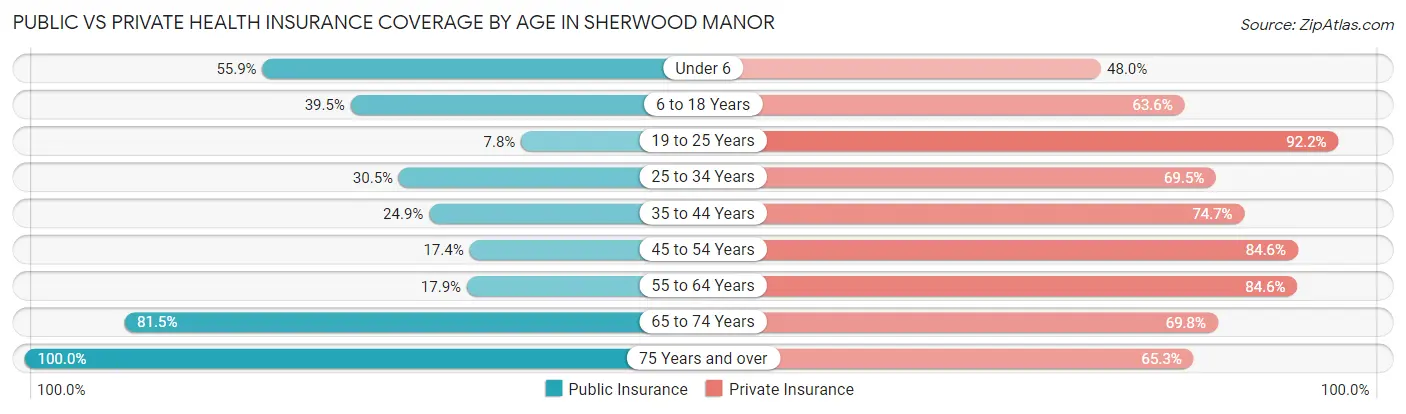
| Age Bracket | Public Insurance | Private Insurance |
| Under 6 | 191 (55.8%) | 164 (47.9%) |
| 6 to 18 Years | 358 (39.5%) | 577 (63.6%) |
| 19 to 25 Years | 57 (7.8%) | 671 (92.2%) |
| 25 to 34 Years | 177 (30.5%) | 403 (69.5%) |
| 35 to 44 Years | 139 (24.9%) | 417 (74.7%) |
| 45 to 54 Years | 127 (17.4%) | 617 (84.6%) |
| 55 to 64 Years | 160 (17.9%) | 756 (84.6%) |
| 65 to 74 Years | 402 (81.5%) | 344 (69.8%) |
| 75 Years and over | 487 (100.0%) | 318 (65.3%) |
| Total | 2,098 (36.7%) | 4,267 (74.6%) |
Disability Status by Sex by Age in Sherwood Manor
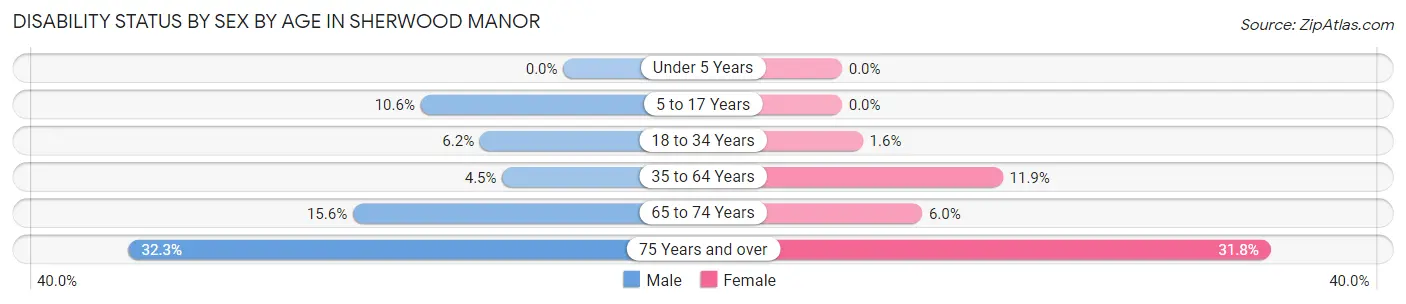
| Age Bracket | Male | Female |
| Under 5 Years | 0 (0.0%) | 0 (0.0%) |
| 5 to 17 Years | 52 (10.6%) | 0 (0.0%) |
| 18 to 34 Years | 46 (6.2%) | 10 (1.5%) |
| 35 to 64 Years | 48 (4.5%) | 134 (11.9%) |
| 65 to 74 Years | 35 (15.6%) | 16 (5.9%) |
| 75 Years and over | 71 (32.3%) | 85 (31.8%) |
Disability Class by Sex by Age in Sherwood Manor
Disability Class: Hearing Difficulty
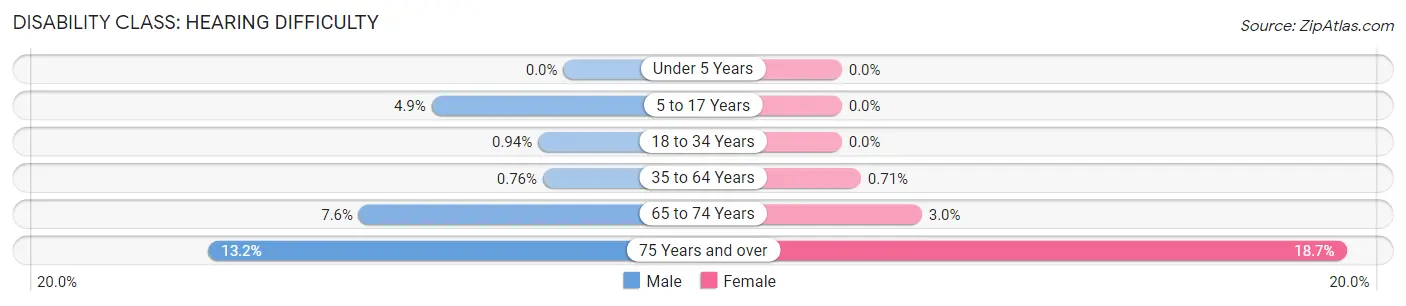
| Age Bracket | Male | Female |
| Under 5 Years | 0 (0.0%) | 0 (0.0%) |
| 5 to 17 Years | 24 (4.9%) | 0 (0.0%) |
| 18 to 34 Years | 7 (0.9%) | 0 (0.0%) |
| 35 to 64 Years | 8 (0.8%) | 8 (0.7%) |
| 65 to 74 Years | 17 (7.6%) | 8 (3.0%) |
| 75 Years and over | 29 (13.2%) | 50 (18.7%) |
Disability Class: Vision Difficulty
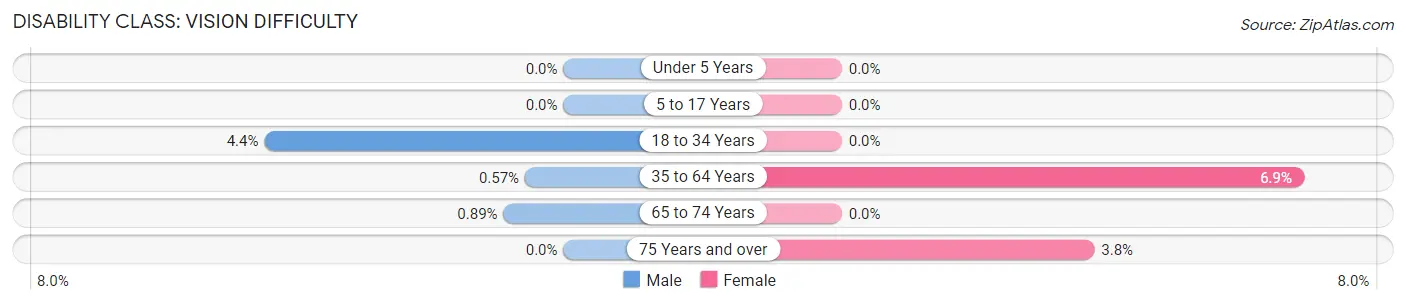
| Age Bracket | Male | Female |
| Under 5 Years | 0 (0.0%) | 0 (0.0%) |
| 5 to 17 Years | 0 (0.0%) | 0 (0.0%) |
| 18 to 34 Years | 33 (4.4%) | 0 (0.0%) |
| 35 to 64 Years | 6 (0.6%) | 77 (6.9%) |
| 65 to 74 Years | 2 (0.9%) | 0 (0.0%) |
| 75 Years and over | 0 (0.0%) | 10 (3.7%) |
Disability Class: Cognitive Difficulty
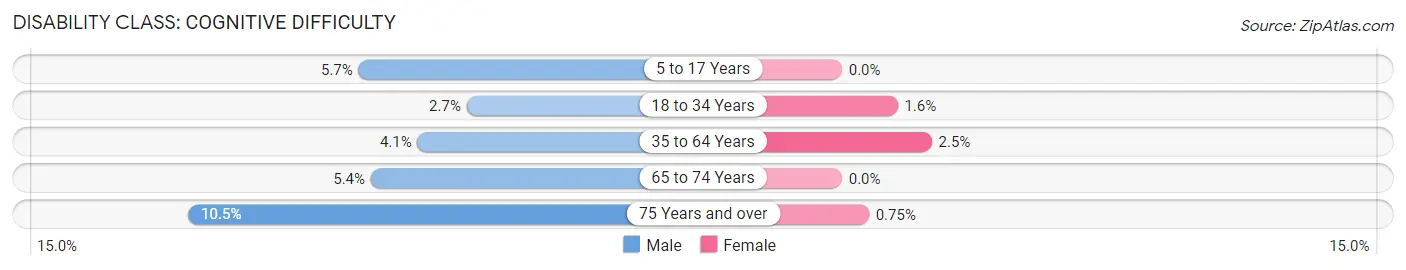
| Age Bracket | Male | Female |
| 5 to 17 Years | 28 (5.7%) | 0 (0.0%) |
| 18 to 34 Years | 20 (2.7%) | 10 (1.5%) |
| 35 to 64 Years | 43 (4.1%) | 28 (2.5%) |
| 65 to 74 Years | 12 (5.4%) | 0 (0.0%) |
| 75 Years and over | 23 (10.4%) | 2 (0.7%) |
Disability Class: Ambulatory Difficulty
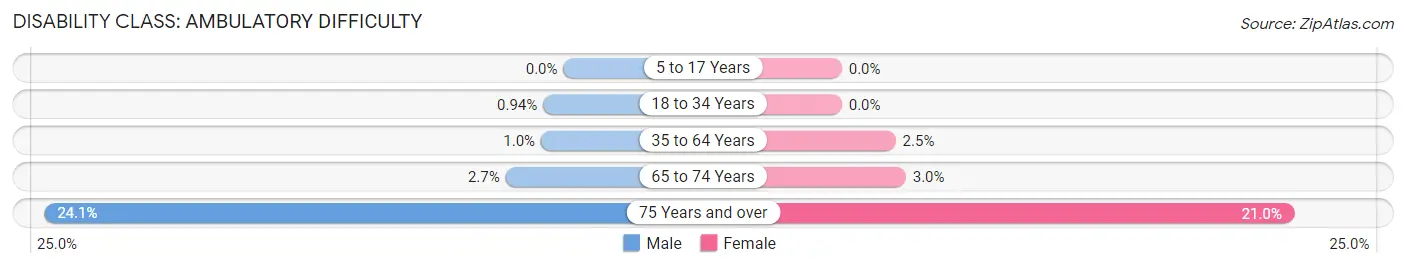
| Age Bracket | Male | Female |
| 5 to 17 Years | 0 (0.0%) | 0 (0.0%) |
| 18 to 34 Years | 7 (0.9%) | 0 (0.0%) |
| 35 to 64 Years | 11 (1.0%) | 28 (2.5%) |
| 65 to 74 Years | 6 (2.7%) | 8 (3.0%) |
| 75 Years and over | 53 (24.1%) | 56 (21.0%) |
Disability Class: Self-Care Difficulty
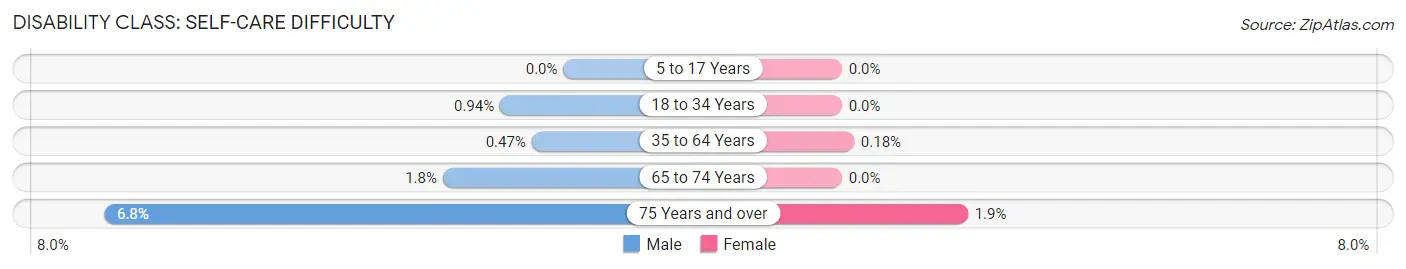
| Age Bracket | Male | Female |
| 5 to 17 Years | 0 (0.0%) | 0 (0.0%) |
| 18 to 34 Years | 7 (0.9%) | 0 (0.0%) |
| 35 to 64 Years | 5 (0.5%) | 2 (0.2%) |
| 65 to 74 Years | 4 (1.8%) | 0 (0.0%) |
| 75 Years and over | 15 (6.8%) | 5 (1.9%) |
Technology Access in Sherwood Manor
Computing Device Access in Sherwood Manor
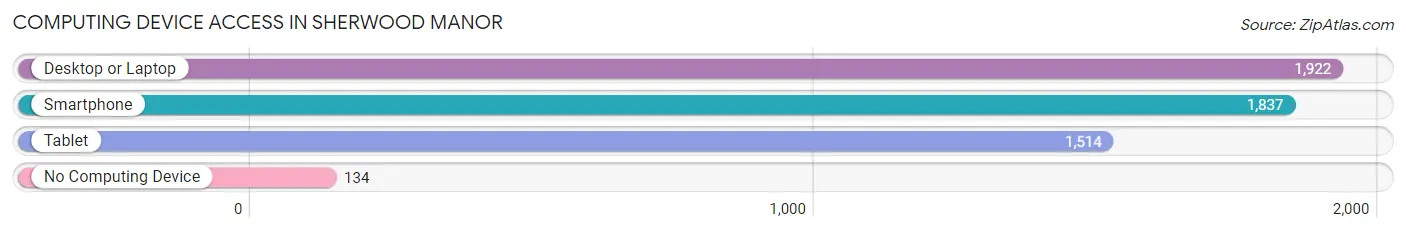
| Device Type | # Households | % Households |
| Desktop or Laptop | 1,922 | 87.1% |
| Smartphone | 1,837 | 83.2% |
| Tablet | 1,514 | 68.6% |
| No Computing Device | 134 | 6.1% |
| Total | 2,208 | 100.0% |
Internet Access in Sherwood Manor
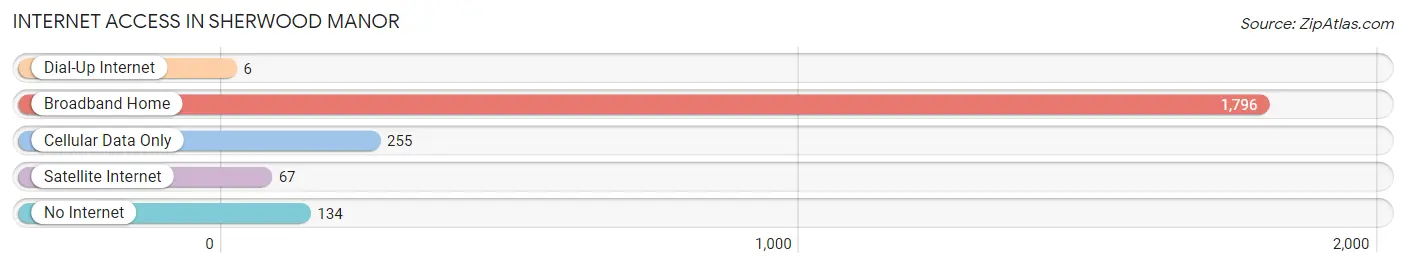
| Internet Type | # Households | % Households |
| Dial-Up Internet | 6 | 0.3% |
| Broadband Home | 1,796 | 81.3% |
| Cellular Data Only | 255 | 11.6% |
| Satellite Internet | 67 | 3.0% |
| No Internet | 134 | 6.1% |
| Total | 2,208 | 100.0% |
Sherwood Manor Summary
Sherwood Manor is a small town located in the state of Connecticut. It is situated in the southwestern corner of the state, near the border of New York. The town has a population of approximately 4,000 people and is part of the greater Hartford metropolitan area.
History
Sherwood Manor was first settled in the early 1700s by a group of English settlers. The town was originally known as “Sherwood” and was part of the town of Farmington. In 1786, the town was incorporated as its own separate entity and was renamed “Sherwood Manor”. The town was named after the Sherwood family, who were prominent landowners in the area.
The town was primarily an agricultural community for much of its history. In the late 1800s, the town began to experience a period of industrialization. Several factories were built in the area, including a paper mill, a cotton mill, and a woolen mill. These factories provided employment for many of the town’s residents.
In the early 1900s, the town began to experience a period of population growth. This was due in part to the influx of immigrants from Europe. Many of these immigrants were of Italian and Polish descent.
Geography
Sherwood Manor is located in the southwestern corner of Connecticut. It is situated in the foothills of the Berkshire Mountains. The town is bordered by the towns of Farmington, Avon, and Simsbury. The town is located approximately 20 miles from the city of Hartford.
The town has a total area of 4.2 square miles, all of which is land. The terrain of the town is mostly flat, with some rolling hills. The town is located in a temperate climate zone, with hot summers and cold winters.
Economy
The economy of Sherwood Manor is primarily based on the service industry. The town is home to several small businesses, including restaurants, retail stores, and professional services. The town is also home to a number of manufacturing companies, including a paper mill, a cotton mill, and a woolen mill.
The town is also home to a number of educational institutions, including a public elementary school, a middle school, and a high school. The town is also home to a branch of the University of Connecticut.
Demographics
As of the 2010 census, the population of Sherwood Manor was 4,000. The racial makeup of the town was 94.2% White, 2.2% African American, 0.7% Asian, 0.3% Native American, and 2.6% from other races. The median household income was $60,000, and the median family income was $68,000.
The town is home to a number of religious institutions, including Catholic, Protestant, and Jewish congregations. The town is also home to a number of cultural organizations, including a theater group, a historical society, and a library.
Conclusion
Sherwood Manor is a small town located in the southwestern corner of Connecticut. It has a population of approximately 4,000 people and is part of the greater Hartford metropolitan area. The town has a long history of agricultural and industrial activity, and is now primarily a service-based economy. The town is home to a number of educational institutions, religious institutions, and cultural organizations.
Common Questions
What is the Total Population of Sherwood Manor?
Total Population of Sherwood Manor is 5,731.
What is the Total Male Population of Sherwood Manor?
Total Male Population of Sherwood Manor is 2,939.
What is the Total Female Population of Sherwood Manor?
Total Female Population of Sherwood Manor is 2,792.
What is the Ratio of Males per 100 Females in Sherwood Manor?
There are 105.27 Males per 100 Females in Sherwood Manor.
What is the Ratio of Females per 100 Males in Sherwood Manor?
There are 95.00 Females per 100 Males in Sherwood Manor.
What is the Median Population Age in Sherwood Manor?
Median Population Age in Sherwood Manor is 40.5 Years.
What is the Average Family Size in Sherwood Manor
Average Family Size in Sherwood Manor is 3.1 People.
What is the Average Household Size in Sherwood Manor
Average Household Size in Sherwood Manor is 2.6 People.
What is Per Capita Income in Sherwood Manor?
Per Capita income in Sherwood Manor is $40,506.
What is the Median Family Income in Sherwood Manor?
Median Family Income in Sherwood Manor is $103,622.
What is the Median Household income in Sherwood Manor?
Median Household Income in Sherwood Manor is $98,980.
What is Income or Wage Gap in Sherwood Manor?
Income or Wage Gap in Sherwood Manor is 21.0%.
Women in Sherwood Manor earn 79.0 cents for every dollar earned by a man.
What is Inequality or Gini Index in Sherwood Manor?
Inequality or Gini Index in Sherwood Manor is 0.33.
How Large is the Labor Force in Sherwood Manor?
There are 3,330 People in the Labor Forcein in Sherwood Manor.
What is the Percentage of People in the Labor Force in Sherwood Manor?
69.6% of People are in the Labor Force in Sherwood Manor.
What is the Unemployment Rate in Sherwood Manor?
Unemployment Rate in Sherwood Manor is 4.6%.