Cities with the Highest Percentage of Population with a Degree in Communications in Connecticut
RELATED REPORTS & OPTIONS
Communications
Connecticut
Compare Cities
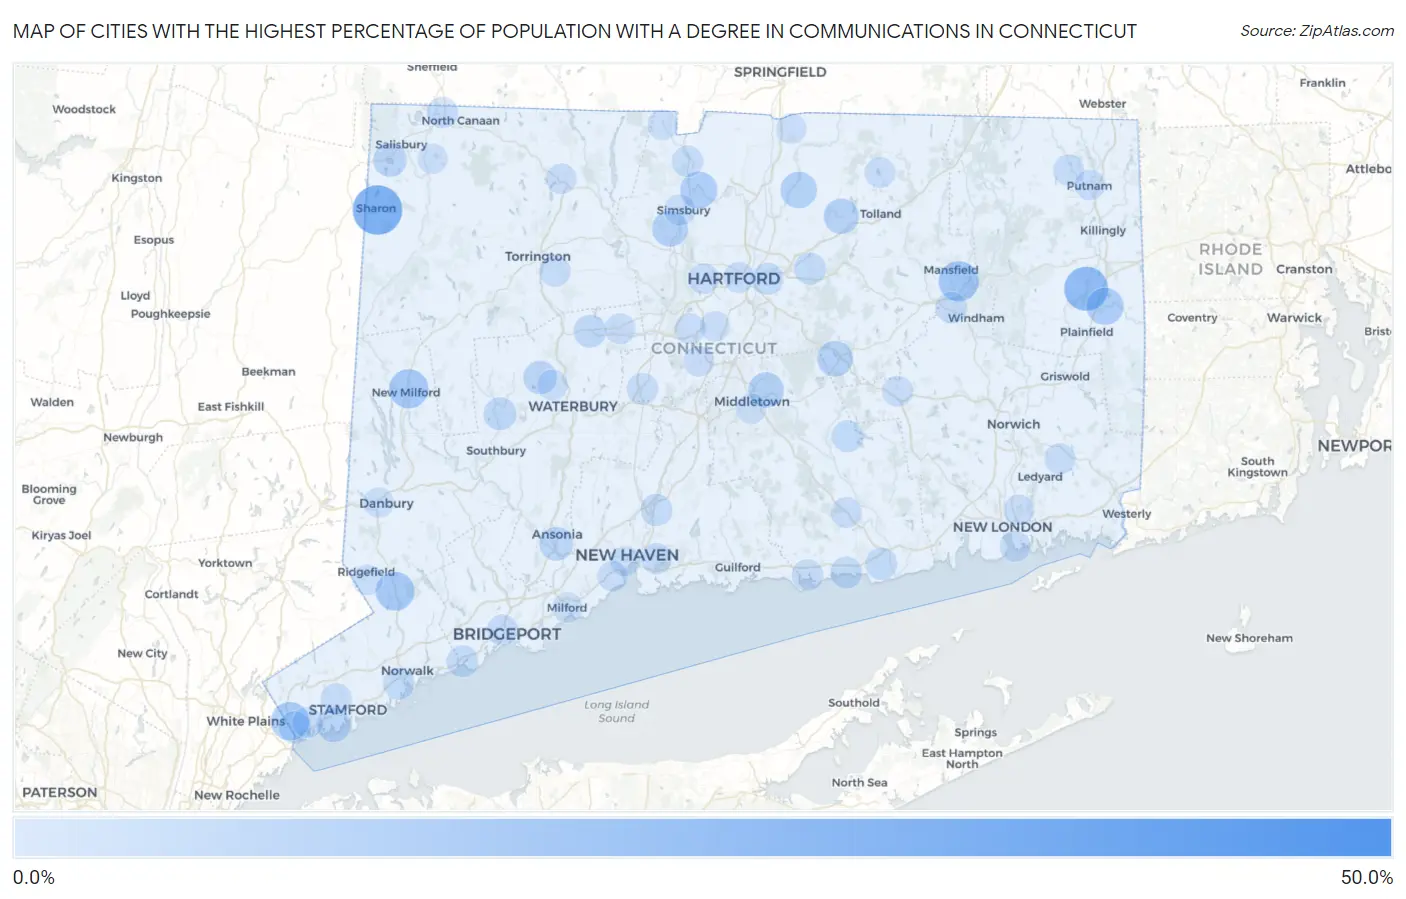
Map of Cities with the Highest Percentage of Population with a Degree in Communications in Connecticut
0.0%
50.0%
Cities with the Highest Percentage of Population with a Degree in Communications in Connecticut
| City | % Graduates | vs State | vs National | |
| 1. | Chimney Point | 48.9% | 3.9%(+45.0)#1 | 4.1%(+44.7)#94 |
| 2. | Brookfield Center | 34.0% | 3.9%(+30.1)#2 | 4.1%(+29.9)#171 |
| 3. | Sharon | 30.6% | 3.9%(+26.7)#3 | 4.1%(+26.4)#221 |
| 4. | Wauregan | 22.8% | 3.9%(+19.0)#4 | 4.1%(+18.7)#364 |
| 5. | West Mountain | 21.2% | 3.9%(+17.3)#5 | 4.1%(+17.1)#407 |
| 6. | Riverton | 17.6% | 3.9%(+13.7)#6 | 4.1%(+13.4)#564 |
| 7. | Mansfield Center | 17.3% | 3.9%(+13.5)#7 | 4.1%(+13.2)#577 |
| 8. | Mamanasco Lake | 16.7% | 3.9%(+12.9)#8 | 4.1%(+12.6)#599 |
| 9. | Lakes East | 16.4% | 3.9%(+12.5)#9 | 4.1%(+12.2)#644 |
| 10. | New Milford | 15.8% | 3.9%(+12.0)#10 | 4.1%(+11.7)#684 |
| 11. | Georgetown | 15.2% | 3.9%(+11.4)#11 | 4.1%(+11.1)#733 |
| 12. | Glenville | 14.9% | 3.9%(+11.1)#12 | 4.1%(+10.8)#761 |
| 13. | Bogus Hill | 14.1% | 3.9%(+10.3)#13 | 4.1%(+10.00)#856 |
| 14. | Moosup | 13.1% | 3.9%(+9.26)#14 | 4.1%(+8.98)#974 |
| 15. | Mill Plain | 13.0% | 3.9%(+9.16)#15 | 4.1%(+8.88)#979 |
| 16. | Tariffville | 12.8% | 3.9%(+8.94)#16 | 4.1%(+8.67)#1,013 |
| 17. | Broad Brook | 12.0% | 3.9%(+8.14)#17 | 4.1%(+7.86)#1,141 |
| 18. | Weatogue | 11.3% | 3.9%(+7.48)#18 | 4.1%(+7.20)#1,257 |
| 19. | Taylor Corners | 11.0% | 3.9%(+7.14)#19 | 4.1%(+6.86)#1,335 |
| 20. | Terramuggus | 10.9% | 3.9%(+7.05)#20 | 4.1%(+6.77)#1,351 |
| 21. | Portland | 10.7% | 3.9%(+6.81)#21 | 4.1%(+6.53)#1,414 |
| 22. | Rockville | 10.5% | 3.9%(+6.69)#22 | 4.1%(+6.41)#1,437 |
| 23. | Old Greenwich | 8.9% | 3.9%(+5.04)#23 | 4.1%(+4.77)#1,949 |
| 24. | Derby | 8.5% | 3.9%(+4.63)#24 | 4.1%(+4.35)#2,130 |
| 25. | Gaylordsville | 8.4% | 3.9%(+4.57)#25 | 4.1%(+4.29)#2,159 |
| 26. | West Cornwall | 8.3% | 3.9%(+4.47)#26 | 4.1%(+4.20)#2,214 |
| 27. | Lakeville | 8.3% | 3.9%(+4.42)#27 | 4.1%(+4.15)#2,226 |
| 28. | Staples | 8.2% | 3.9%(+4.37)#28 | 4.1%(+4.10)#2,249 |
| 29. | Watertown | 8.0% | 3.9%(+4.10)#29 | 4.1%(+3.82)#2,378 |
| 30. | Old Hill | 7.5% | 3.9%(+3.67)#30 | 4.1%(+3.40)#2,637 |
| 31. | Woodbury Center | 7.2% | 3.9%(+3.30)#31 | 4.1%(+3.03)#2,899 |
| 32. | Terryville | 7.1% | 3.9%(+3.21)#32 | 4.1%(+2.93)#2,978 |
| 33. | Route 7 Gateway | 7.0% | 3.9%(+3.13)#33 | 4.1%(+2.86)#3,045 |
| 34. | Candlewood Shores | 6.9% | 3.9%(+3.00)#34 | 4.1%(+2.72)#3,152 |
| 35. | Lakeside Woods | 6.8% | 3.9%(+2.97)#35 | 4.1%(+2.69)#3,178 |
| 36. | Pemberwick | 6.7% | 3.9%(+2.88)#36 | 4.1%(+2.61)#3,274 |
| 37. | Poplar Plains | 6.6% | 3.9%(+2.76)#37 | 4.1%(+2.48)#3,398 |
| 38. | Plattsville | 6.5% | 3.9%(+2.67)#38 | 4.1%(+2.39)#3,475 |
| 39. | Candlewood Isle | 6.4% | 3.9%(+2.52)#39 | 4.1%(+2.25)#3,616 |
| 40. | Tashua | 6.2% | 3.9%(+2.39)#40 | 4.1%(+2.11)#3,743 |
| 41. | Old Saybrook Center | 6.1% | 3.9%(+2.23)#41 | 4.1%(+1.95)#3,934 |
| 42. | North Haven | 6.0% | 3.9%(+2.19)#42 | 4.1%(+1.91)#3,993 |
| 43. | Manchester | 6.0% | 3.9%(+2.15)#43 | 4.1%(+1.88)#4,023 |
| 44. | South Wilton | 6.0% | 3.9%(+2.10)#44 | 4.1%(+1.82)#4,092 |
| 45. | Daniels Farm | 5.9% | 3.9%(+2.08)#45 | 4.1%(+1.80)#4,110 |
| 46. | East Hartford | 5.9% | 3.9%(+2.05)#46 | 4.1%(+1.78)#4,132 |
| 47. | Westbrook Center | 5.8% | 3.9%(+1.93)#47 | 4.1%(+1.65)#4,300 |
| 48. | Southport | 5.7% | 3.9%(+1.80)#48 | 4.1%(+1.52)#4,460 |
| 49. | Moodus | 5.6% | 3.9%(+1.78)#49 | 4.1%(+1.50)#4,491 |
| 50. | Norwalk | 5.5% | 3.9%(+1.64)#50 | 4.1%(+1.36)#4,705 |
| 51. | Plantsville | 5.3% | 3.9%(+1.43)#51 | 4.1%(+1.15)#4,994 |
| 52. | Canaan | 5.3% | 3.9%(+1.40)#52 | 4.1%(+1.13)#5,027 |
| 53. | Willimantic | 5.3% | 3.9%(+1.40)#53 | 4.1%(+1.12)#5,067 |
| 54. | Noroton | 5.2% | 3.9%(+1.33)#54 | 4.1%(+1.06)#5,155 |
| 55. | Greens Farms | 5.1% | 3.9%(+1.28)#55 | 4.1%(+1.00)#5,226 |
| 56. | Clinton | 5.1% | 3.9%(+1.25)#56 | 4.1%(+0.969)#5,286 |
| 57. | Salmon Brook | 5.1% | 3.9%(+1.22)#57 | 4.1%(+0.941)#5,337 |
| 58. | Simsbury Center | 4.9% | 3.9%(+1.07)#58 | 4.1%(+0.789)#5,601 |
| 59. | Northwest Harwinton | 4.9% | 3.9%(+1.04)#59 | 4.1%(+0.762)#5,649 |
| 60. | Darien Downtown | 4.9% | 3.9%(+1.03)#60 | 4.1%(+0.752)#5,670 |
| 61. | South Woodstock | 4.8% | 3.9%(+0.967)#61 | 4.1%(+0.691)#5,782 |
| 62. | Sandy Hook | 4.8% | 3.9%(+0.941)#62 | 4.1%(+0.665)#5,821 |
| 63. | Mashantucket | 4.8% | 3.9%(+0.903)#63 | 4.1%(+0.627)#5,909 |
| 64. | Bridgeport | 4.7% | 3.9%(+0.840)#64 | 4.1%(+0.564)#6,010 |
| 65. | East Haven | 4.7% | 3.9%(+0.834)#65 | 4.1%(+0.557)#6,025 |
| 66. | Stamford | 4.7% | 3.9%(+0.811)#66 | 4.1%(+0.534)#6,076 |
| 67. | New Canaan | 4.6% | 3.9%(+0.788)#67 | 4.1%(+0.512)#6,134 |
| 68. | Oronoque | 4.5% | 3.9%(+0.687)#68 | 4.1%(+0.410)#6,322 |
| 69. | Colchester | 4.5% | 3.9%(+0.681)#69 | 4.1%(+0.404)#6,361 |
| 70. | Hartford | 4.4% | 3.9%(+0.581)#70 | 4.1%(+0.304)#6,567 |
| 71. | Naugatuck Borough | 4.4% | 3.9%(+0.553)#71 | 4.1%(+0.277)#6,627 |
| 72. | Deep River Center | 4.4% | 3.9%(+0.535)#72 | 4.1%(+0.259)#6,663 |
| 73. | New Britain | 4.4% | 3.9%(+0.533)#73 | 4.1%(+0.256)#6,671 |
| 74. | Stratford Downtown | 4.4% | 3.9%(+0.518)#74 | 4.1%(+0.241)#6,706 |
| 75. | Bristol | 4.4% | 3.9%(+0.514)#75 | 4.1%(+0.238)#6,712 |
| 76. | Newtown Borough | 4.3% | 3.9%(+0.489)#76 | 4.1%(+0.213)#6,757 |
| 77. | Coleytown | 4.3% | 3.9%(+0.403)#77 | 4.1%(+0.127)#6,965 |
| 78. | Kensington | 4.3% | 3.9%(+0.398)#78 | 4.1%(+0.122)#6,977 |
| 79. | West Hartford | 4.2% | 3.9%(+0.337)#79 | 4.1%(+0.061)#7,118 |
| 80. | Oakville | 4.2% | 3.9%(+0.330)#80 | 4.1%(+0.053)#7,132 |
| 81. | Crystal Lake | 4.2% | 3.9%(+0.321)#81 | 4.1%(+0.044)#7,154 |
| 82. | Weston | 4.2% | 3.9%(+0.300)#82 | 4.1%(+0.024)#7,214 |
| 83. | Putnam | 4.1% | 3.9%(+0.290)#83 | 4.1%(+0.013)#7,242 |
| 84. | Groton | 4.1% | 3.9%(+0.249)#84 | 4.1%(-0.028)#7,328 |
| 85. | Conning Towers Nautilus Park | 4.1% | 3.9%(+0.201)#85 | 4.1%(-0.076)#7,443 |
| 86. | Winsted | 4.1% | 3.9%(+0.196)#86 | 4.1%(-0.081)#7,452 |
| 87. | Bridgewater | 3.9% | 3.9%(+0.038)#87 | 4.1%(-0.239)#7,791 |
| 88. | Greenwich | 3.9% | 3.9%(-0.007)#88 | 4.1%(-0.284)#7,905 |
| 89. | West Haven | 3.8% | 3.9%(-0.018)#89 | 4.1%(-0.295)#7,953 |
| 90. | Westport | 3.8% | 3.9%(-0.063)#90 | 4.1%(-0.340)#8,042 |
| 91. | Falls Village | 3.8% | 3.9%(-0.075)#91 | 4.1%(-0.351)#8,063 |
| 92. | Ridgefield | 3.7% | 3.9%(-0.146)#92 | 4.1%(-0.422)#8,211 |
| 93. | New Haven | 3.7% | 3.9%(-0.194)#93 | 4.1%(-0.471)#8,336 |
| 94. | Sherwood Manor | 3.6% | 3.9%(-0.224)#94 | 4.1%(-0.501)#8,405 |
| 95. | Danbury | 3.6% | 3.9%(-0.266)#95 | 4.1%(-0.542)#8,494 |
| 96. | Saugatuck | 3.6% | 3.9%(-0.269)#96 | 4.1%(-0.545)#8,498 |
| 97. | Newington | 3.6% | 3.9%(-0.285)#97 | 4.1%(-0.562)#8,531 |
| 98. | Middletown | 3.6% | 3.9%(-0.288)#98 | 4.1%(-0.565)#8,567 |
| 99. | North Granby | 3.5% | 3.9%(-0.336)#99 | 4.1%(-0.613)#8,666 |
| 100. | Milford City Balance | 3.5% | 3.9%(-0.404)#100 | 4.1%(-0.680)#8,844 |
Common Questions
What are the Top 10 Cities with the Highest Percentage of Population with a Degree in Communications in Connecticut?
Top 10 Cities with the Highest Percentage of Population with a Degree in Communications in Connecticut are:
#1
30.6%
#2
22.8%
#3
17.3%
#4
15.8%
#5
15.2%
#6
14.9%
#7
13.1%
#8
12.8%
#9
12.0%
#10
11.3%
What city has the Highest Percentage of Population with a Degree in Communications in Connecticut?
Sharon has the Highest Percentage of Population with a Degree in Communications in Connecticut with 30.6%.
What is the Percentage of Population with a Degree in Communications in the State of Connecticut?
Percentage of Population with a Degree in Communications in Connecticut is 3.9%.
What is the Percentage of Population with a Degree in Communications in the United States?
Percentage of Population with a Degree in Communications in the United States is 4.1%.