Cities with the Highest Percentage of Population Employed in Manufacturing in Connecticut
RELATED REPORTS & OPTIONS
Manufacturing
Connecticut
Compare Cities
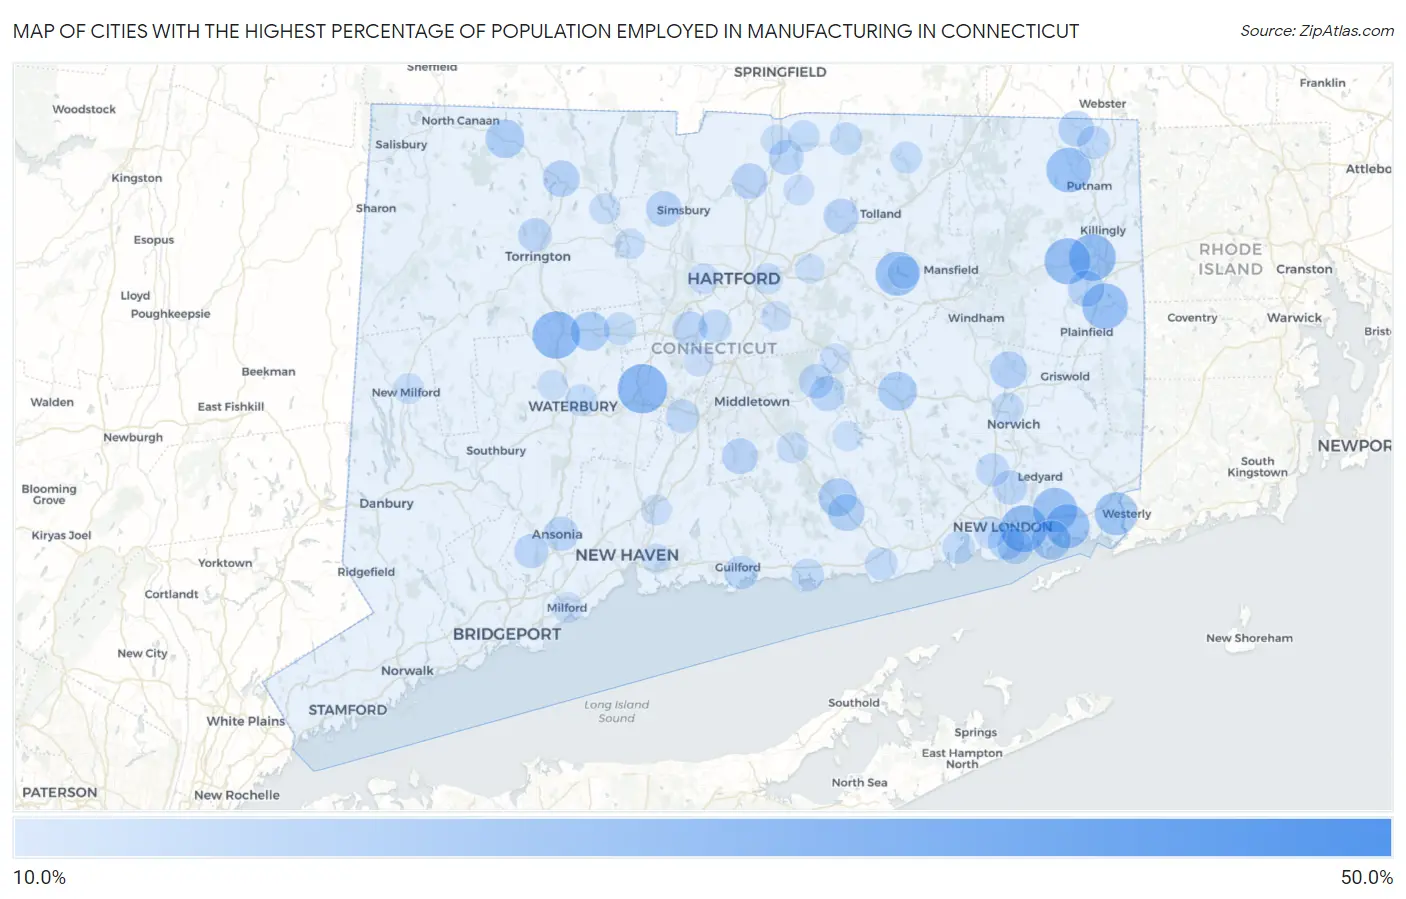
Map of Cities with the Highest Percentage of Population Employed in Manufacturing in Connecticut
0.0%
50.0%
Cities with the Highest Percentage of Population Employed in Manufacturing in Connecticut
| City | % Employed | vs State | vs National | |
| 1. | Dodgingtown | 50.0% | 10.6%(+39.4)#1 | 10.0%(+40.0)#382 |
| 2. | Plantsville | 29.2% | 10.6%(+18.6)#2 | 10.0%(+19.2)#2,233 |
| 3. | Cornwall | 28.6% | 10.6%(+17.9)#3 | 10.0%(+18.6)#2,403 |
| 4. | Thomaston | 27.3% | 10.6%(+16.7)#4 | 10.0%(+17.3)#2,760 |
| 5. | Long Hill | 26.6% | 10.6%(+16.0)#5 | 10.0%(+16.6)#2,961 |
| 6. | East Brooklyn | 26.5% | 10.6%(+15.8)#6 | 10.0%(+16.5)#2,994 |
| 7. | Quasset Lake | 26.2% | 10.6%(+15.6)#7 | 10.0%(+16.2)#3,076 |
| 8. | Brooklyn | 25.7% | 10.6%(+15.1)#8 | 10.0%(+15.7)#3,225 |
| 9. | Moosup | 25.5% | 10.6%(+14.8)#9 | 10.0%(+15.5)#3,306 |
| 10. | South Woodstock | 24.6% | 10.6%(+14.0)#10 | 10.0%(+14.6)#3,628 |
| 11. | Old Mystic | 24.1% | 10.6%(+13.4)#11 | 10.0%(+14.1)#3,825 |
| 12. | Mystic | 23.9% | 10.6%(+13.3)#12 | 10.0%(+13.9)#3,885 |
| 13. | Coventry Lake | 23.8% | 10.6%(+13.2)#13 | 10.0%(+13.8)#3,911 |
| 14. | Lakes West | 23.6% | 10.6%(+13.0)#14 | 10.0%(+13.6)#4,002 |
| 15. | Redding Center | 22.9% | 10.6%(+12.2)#15 | 10.0%(+12.9)#4,279 |
| 16. | Pawcatuck | 22.7% | 10.6%(+12.0)#16 | 10.0%(+12.7)#4,356 |
| 17. | Lake Bungee | 20.7% | 10.6%(+10.1)#17 | 10.0%(+10.8)#5,313 |
| 18. | Noank | 19.1% | 10.6%(+8.50)#18 | 10.0%(+9.14)#6,327 |
| 19. | Terryville | 18.8% | 10.6%(+8.19)#19 | 10.0%(+8.83)#6,541 |
| 20. | Gaylordsville | 18.8% | 10.6%(+8.18)#20 | 10.0%(+8.82)#6,557 |
| 21. | Colchester | 18.8% | 10.6%(+8.16)#21 | 10.0%(+8.80)#6,563 |
| 22. | Norfolk | 18.5% | 10.6%(+7.89)#22 | 10.0%(+8.53)#6,746 |
| 23. | Lordship | 17.9% | 10.6%(+7.30)#23 | 10.0%(+7.94)#7,156 |
| 24. | Chester Center | 17.9% | 10.6%(+7.24)#24 | 10.0%(+7.88)#7,194 |
| 25. | Fenwick Borough | 17.6% | 10.6%(+7.02)#25 | 10.0%(+7.66)#7,358 |
| 26. | Pleasant Valley | 17.6% | 10.6%(+6.97)#26 | 10.0%(+7.61)#7,384 |
| 27. | Dayville | 17.1% | 10.6%(+6.46)#27 | 10.0%(+7.10)#7,761 |
| 28. | Baltic | 16.9% | 10.6%(+6.31)#28 | 10.0%(+6.95)#7,848 |
| 29. | Deep River Center | 16.6% | 10.6%(+5.98)#29 | 10.0%(+6.62)#8,120 |
| 30. | Woodmont Borough | 16.6% | 10.6%(+5.97)#30 | 10.0%(+6.61)#8,131 |
| 31. | New London | 16.5% | 10.6%(+5.90)#31 | 10.0%(+6.54)#8,179 |
| 32. | Winsted | 16.4% | 10.6%(+5.74)#32 | 10.0%(+6.38)#8,304 |
| 33. | Wauregan | 16.3% | 10.6%(+5.71)#33 | 10.0%(+6.35)#8,325 |
| 34. | Oronoque | 16.2% | 10.6%(+5.54)#34 | 10.0%(+6.18)#8,465 |
| 35. | Quinebaug | 15.7% | 10.6%(+5.06)#35 | 10.0%(+5.70)#8,911 |
| 36. | Durham | 15.6% | 10.6%(+4.97)#36 | 10.0%(+5.61)#8,996 |
| 37. | Windsor Locks | 15.6% | 10.6%(+4.95)#37 | 10.0%(+5.59)#9,018 |
| 38. | Botsford | 15.6% | 10.6%(+4.93)#38 | 10.0%(+5.57)#9,033 |
| 39. | West Mountain | 15.6% | 10.6%(+4.93)#39 | 10.0%(+5.56)#9,044 |
| 40. | Groton | 15.5% | 10.6%(+4.86)#40 | 10.0%(+5.49)#9,108 |
| 41. | West Simsbury | 15.4% | 10.6%(+4.79)#41 | 10.0%(+5.43)#9,159 |
| 42. | Naugatuck Borough | 15.3% | 10.6%(+4.67)#42 | 10.0%(+5.31)#9,277 |
| 43. | Candlewood Knolls | 15.3% | 10.6%(+4.65)#43 | 10.0%(+5.29)#9,302 |
| 44. | Rockville | 15.0% | 10.6%(+4.39)#44 | 10.0%(+5.03)#9,531 |
| 45. | East Hampton | 14.7% | 10.6%(+4.10)#45 | 10.0%(+4.74)#9,822 |
| 46. | Lake Pocotopaug | 14.6% | 10.6%(+3.93)#46 | 10.0%(+4.56)#9,977 |
| 47. | New Britain | 14.5% | 10.6%(+3.86)#47 | 10.0%(+4.50)#10,037 |
| 48. | Southwood Acres | 14.5% | 10.6%(+3.84)#48 | 10.0%(+4.48)#10,071 |
| 49. | Bantam Borough | 14.5% | 10.6%(+3.82)#49 | 10.0%(+4.46)#10,093 |
| 50. | Ansonia | 14.2% | 10.6%(+3.58)#50 | 10.0%(+4.22)#10,343 |
| 51. | Gales Ferry | 14.2% | 10.6%(+3.54)#51 | 10.0%(+4.18)#10,393 |
| 52. | Shelton | 13.9% | 10.6%(+3.30)#52 | 10.0%(+3.94)#10,593 |
| 53. | Torrington | 13.7% | 10.6%(+3.12)#53 | 10.0%(+3.76)#10,768 |
| 54. | Meriden | 13.7% | 10.6%(+3.04)#54 | 10.0%(+3.68)#10,848 |
| 55. | Guilford Center | 13.6% | 10.6%(+2.94)#55 | 10.0%(+3.58)#10,984 |
| 56. | Sandy Hook | 13.4% | 10.6%(+2.82)#56 | 10.0%(+3.45)#11,130 |
| 57. | Oxoboxo River | 13.1% | 10.6%(+2.46)#57 | 10.0%(+3.10)#11,519 |
| 58. | Mechanicsville | 13.1% | 10.6%(+2.46)#58 | 10.0%(+3.10)#11,523 |
| 59. | North Grosvenor Dale | 13.1% | 10.6%(+2.44)#59 | 10.0%(+3.08)#11,546 |
| 60. | Newington | 13.0% | 10.6%(+2.36)#60 | 10.0%(+3.00)#11,634 |
| 61. | Trumbull Center | 12.9% | 10.6%(+2.28)#61 | 10.0%(+2.92)#11,698 |
| 62. | New Canaan | 12.8% | 10.6%(+2.21)#62 | 10.0%(+2.85)#11,771 |
| 63. | Bristol | 12.8% | 10.6%(+2.14)#63 | 10.0%(+2.78)#11,858 |
| 64. | Clinton | 12.7% | 10.6%(+2.03)#64 | 10.0%(+2.67)#11,977 |
| 65. | Somers | 12.6% | 10.6%(+1.93)#65 | 10.0%(+2.57)#12,079 |
| 66. | Niantic | 12.4% | 10.6%(+1.82)#66 | 10.0%(+2.45)#12,214 |
| 67. | Old Saybrook Center | 12.4% | 10.6%(+1.81)#67 | 10.0%(+2.45)#12,219 |
| 68. | South Coventry | 12.4% | 10.6%(+1.78)#68 | 10.0%(+2.42)#12,250 |
| 69. | Norwich | 12.4% | 10.6%(+1.75)#69 | 10.0%(+2.39)#12,285 |
| 70. | Waterford | 12.0% | 10.6%(+1.42)#70 | 10.0%(+2.05)#12,659 |
| 71. | Ridgebury | 12.0% | 10.6%(+1.34)#71 | 10.0%(+1.98)#12,762 |
| 72. | Candlewood Lake Club | 11.9% | 10.6%(+1.27)#72 | 10.0%(+1.91)#12,843 |
| 73. | Waterbury | 11.8% | 10.6%(+1.20)#73 | 10.0%(+1.84)#12,925 |
| 74. | Stafford Springs | 11.8% | 10.6%(+1.17)#74 | 10.0%(+1.81)#12,964 |
| 75. | Hazardville | 11.7% | 10.6%(+1.11)#75 | 10.0%(+1.74)#13,047 |
| 76. | Daniels Farm | 11.7% | 10.6%(+1.04)#76 | 10.0%(+1.68)#13,124 |
| 77. | Higganum | 11.3% | 10.6%(+0.636)#77 | 10.0%(+1.28)#13,614 |
| 78. | New Hartford Center | 11.2% | 10.6%(+0.538)#78 | 10.0%(+1.18)#13,724 |
| 79. | East Hartford | 11.1% | 10.6%(+0.465)#79 | 10.0%(+1.10)#13,847 |
| 80. | Newtown Borough | 11.1% | 10.6%(+0.460)#80 | 10.0%(+1.10)#13,855 |
| 81. | Milford City Balance | 10.9% | 10.6%(+0.285)#81 | 10.0%(+0.925)#14,063 |
| 82. | Tashua | 10.8% | 10.6%(+0.210)#82 | 10.0%(+0.849)#14,173 |
| 83. | West Hartford | 10.8% | 10.6%(+0.206)#83 | 10.0%(+0.846)#14,180 |
| 84. | New Milford | 10.8% | 10.6%(+0.146)#84 | 10.0%(+0.785)#14,268 |
| 85. | Broad Brook | 10.7% | 10.6%(+0.055)#85 | 10.0%(+0.694)#14,368 |
| 86. | Thompsonville | 10.7% | 10.6%(+0.047)#86 | 10.0%(+0.686)#14,383 |
| 87. | North Haven | 10.7% | 10.6%(+0.038)#87 | 10.0%(+0.677)#14,388 |
| 88. | Collinsville | 10.6% | 10.6%(-0.074)#88 | 10.0%(+0.565)#14,522 |
| 89. | Groton Long Point Borough | 10.5% | 10.6%(-0.084)#89 | 10.0%(+0.556)#14,535 |
| 90. | Northford | 10.5% | 10.6%(-0.099)#90 | 10.0%(+0.540)#14,545 |
| 91. | Terramuggus | 10.5% | 10.6%(-0.152)#91 | 10.0%(+0.487)#14,619 |
| 92. | Glastonbury Center | 10.5% | 10.6%(-0.156)#92 | 10.0%(+0.483)#14,626 |
| 93. | Oakville | 10.4% | 10.6%(-0.255)#93 | 10.0%(+0.384)#14,727 |
| 94. | Kensington | 10.4% | 10.6%(-0.265)#94 | 10.0%(+0.374)#14,739 |
| 95. | Danielson Borough | 10.3% | 10.6%(-0.320)#95 | 10.0%(+0.319)#14,813 |
| 96. | Moodus | 10.2% | 10.6%(-0.430)#96 | 10.0%(+0.209)#14,950 |
| 97. | Compo | 10.1% | 10.6%(-0.497)#97 | 10.0%(+0.142)#15,026 |
| 98. | East Haven | 10.1% | 10.6%(-0.561)#98 | 10.0%(+0.078)#15,131 |
| 99. | Candlewood Shores | 10.1% | 10.6%(-0.568)#99 | 10.0%(+0.072)#15,134 |
| 100. | Manchester | 10.0% | 10.6%(-0.612)#100 | 10.0%(+0.027)#15,171 |
Common Questions
What are the Top 10 Cities with the Highest Percentage of Population Employed in Manufacturing in Connecticut?
Top 10 Cities with the Highest Percentage of Population Employed in Manufacturing in Connecticut are:
#1
29.2%
#2
27.3%
#3
26.6%
#4
26.5%
#5
25.7%
#6
25.5%
#7
24.6%
#8
24.1%
#9
23.9%
#10
23.8%
What city has the Highest Percentage of Population Employed in Manufacturing in Connecticut?
Plantsville has the Highest Percentage of Population Employed in Manufacturing in Connecticut with 29.2%.
What is the Percentage of Population Employed in Manufacturing in the State of Connecticut?
Percentage of Population Employed in Manufacturing in Connecticut is 10.6%.
What is the Percentage of Population Employed in Manufacturing in the United States?
Percentage of Population Employed in Manufacturing in the United States is 10.0%.