Cities with the Highest Percentage of Families with Income Above $100,000 in Connecticut
RELATED REPORTS & OPTIONS
Family Income | $100k+
Connecticut
Compare Cities
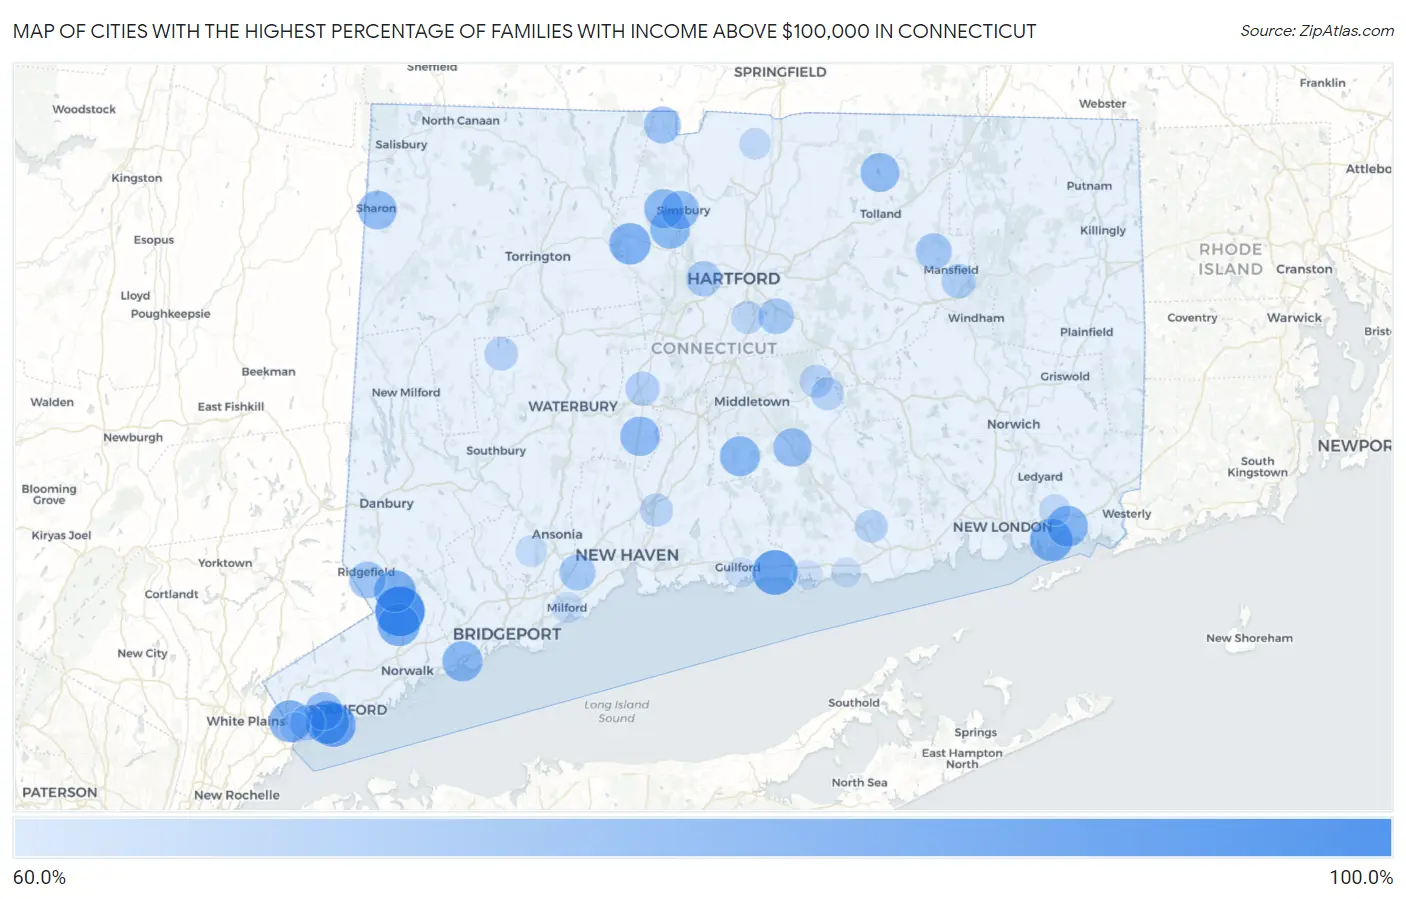
Map of Cities with the Highest Percentage of Families with Income Above $100,000 in Connecticut
0.0%
100.0%
Cities with the Highest Percentage of Families with Income Above $100,000 in Connecticut
| City | Families with Income > $100k | vs State | vs National | |
| 1. | Mamanasco Lake | 100.0% | 56.8%(+43.2)#1 | 46.1%(+53.9)#3 |
| 2. | Fenwick Borough | 100.0% | 56.8%(+43.2)#2 | 46.1%(+53.9)#8 |
| 3. | Cannondale | 100.0% | 56.8%(+43.2)#3 | 46.1%(+53.9)#21 |
| 4. | Brookfield Center | 100.0% | 56.8%(+43.2)#4 | 46.1%(+53.9)#100 |
| 5. | Hawleyville | 100.0% | 56.8%(+43.2)#5 | 46.1%(+53.9)#110 |
| 6. | Candlewood Lake Club | 100.0% | 56.8%(+43.2)#6 | 46.1%(+53.9)#115 |
| 7. | Weston | 99.9% | 56.8%(+43.1)#7 | 46.1%(+53.8)#421 |
| 8. | Indian Field | 96.3% | 56.8%(+39.5)#8 | 46.1%(+50.2)#441 |
| 9. | Candlewood Isle | 95.5% | 56.8%(+38.7)#9 | 46.1%(+49.4)#449 |
| 10. | Darien Downtown | 93.8% | 56.8%(+37.0)#10 | 46.1%(+47.7)#476 |
| 11. | Greens Farms | 93.2% | 56.8%(+36.4)#11 | 46.1%(+47.1)#488 |
| 12. | Westport | 92.9% | 56.8%(+36.1)#12 | 46.1%(+46.8)#494 |
| 13. | Botsford | 91.8% | 56.8%(+35.0)#13 | 46.1%(+45.7)#515 |
| 14. | Tokeneke | 91.2% | 56.8%(+34.4)#14 | 46.1%(+45.1)#536 |
| 15. | Madison Center | 91.1% | 56.8%(+34.3)#15 | 46.1%(+45.0)#538 |
| 16. | Lakes East | 90.8% | 56.8%(+34.0)#16 | 46.1%(+44.7)#550 |
| 17. | West Mountain | 90.1% | 56.8%(+33.3)#17 | 46.1%(+44.0)#579 |
| 18. | Redding Center | 89.7% | 56.8%(+32.9)#18 | 46.1%(+43.6)#601 |
| 19. | Cornwall | 89.5% | 56.8%(+32.7)#19 | 46.1%(+43.4)#609 |
| 20. | Old Greenwich | 89.4% | 56.8%(+32.6)#20 | 46.1%(+43.3)#612 |
| 21. | Mill Plain | 89.3% | 56.8%(+32.5)#21 | 46.1%(+43.2)#619 |
| 22. | Murray | 89.1% | 56.8%(+32.3)#22 | 46.1%(+43.0)#636 |
| 23. | Old Hill | 89.0% | 56.8%(+32.2)#23 | 46.1%(+42.9)#639 |
| 24. | Witches Woods | 88.9% | 56.8%(+32.1)#24 | 46.1%(+42.8)#642 |
| 25. | Noroton | 88.5% | 56.8%(+31.7)#25 | 46.1%(+42.4)#664 |
| 26. | Riverside | 88.1% | 56.8%(+31.3)#26 | 46.1%(+42.0)#687 |
| 27. | South Wilton | 87.1% | 56.8%(+30.3)#27 | 46.1%(+41.0)#740 |
| 28. | Noank | 86.3% | 56.8%(+29.5)#28 | 46.1%(+40.2)#795 |
| 29. | Wilton Center | 85.5% | 56.8%(+28.7)#29 | 46.1%(+39.4)#850 |
| 30. | Glenville | 85.2% | 56.8%(+28.4)#30 | 46.1%(+39.1)#878 |
| 31. | Coleytown | 85.1% | 56.8%(+28.3)#31 | 46.1%(+39.0)#889 |
| 32. | Georgetown | 85.0% | 56.8%(+28.2)#32 | 46.1%(+38.9)#896 |
| 33. | Knollcrest | 84.8% | 56.8%(+28.0)#33 | 46.1%(+38.7)#913 |
| 34. | Lakes West | 84.7% | 56.8%(+27.9)#34 | 46.1%(+38.6)#921 |
| 35. | Saugatuck | 84.6% | 56.8%(+27.8)#35 | 46.1%(+38.5)#931 |
| 36. | Collinsville | 84.1% | 56.8%(+27.3)#36 | 46.1%(+38.0)#964 |
| 37. | East | 83.5% | 56.8%(+26.7)#37 | 46.1%(+37.4)#1,015 |
| 38. | Mystic | 83.1% | 56.8%(+26.3)#38 | 46.1%(+37.0)#1,061 |
| 39. | Compo | 82.9% | 56.8%(+26.1)#39 | 46.1%(+36.8)#1,079 |
| 40. | Poplar Plains | 82.5% | 56.8%(+25.7)#40 | 46.1%(+36.4)#1,110 |
| 41. | Daniels Farm | 82.4% | 56.8%(+25.6)#41 | 46.1%(+36.3)#1,115 |
| 42. | Southport | 82.0% | 56.8%(+25.2)#42 | 46.1%(+35.9)#1,172 |
| 43. | Candlewood Shores | 81.5% | 56.8%(+24.7)#43 | 46.1%(+35.4)#1,227 |
| 44. | Stepney | 81.3% | 56.8%(+24.5)#44 | 46.1%(+35.2)#1,254 |
| 45. | Durham | 81.3% | 56.8%(+24.5)#45 | 46.1%(+35.2)#1,255 |
| 46. | Weatogue | 81.2% | 56.8%(+24.4)#46 | 46.1%(+35.1)#1,272 |
| 47. | Riverton | 81.2% | 56.8%(+24.4)#47 | 46.1%(+35.1)#1,276 |
| 48. | Cheshire Village | 80.5% | 56.8%(+23.7)#48 | 46.1%(+34.4)#1,329 |
| 49. | Staples | 80.4% | 56.8%(+23.6)#49 | 46.1%(+34.3)#1,340 |
| 50. | West Simsbury | 80.0% | 56.8%(+23.2)#50 | 46.1%(+33.9)#1,377 |
| 51. | Noroton Heights | 79.9% | 56.8%(+23.1)#51 | 46.1%(+33.8)#1,390 |
| 52. | Crystal Lake | 79.4% | 56.8%(+22.6)#52 | 46.1%(+33.3)#1,451 |
| 53. | Bridgewater | 79.4% | 56.8%(+22.6)#53 | 46.1%(+33.3)#1,458 |
| 54. | Sharon | 79.2% | 56.8%(+22.4)#54 | 46.1%(+33.1)#1,485 |
| 55. | Simsbury Center | 78.3% | 56.8%(+21.5)#55 | 46.1%(+32.2)#1,595 |
| 56. | Higganum | 78.3% | 56.8%(+21.5)#56 | 46.1%(+32.2)#1,597 |
| 57. | New Canaan | 78.0% | 56.8%(+21.2)#57 | 46.1%(+31.9)#1,637 |
| 58. | Cos Cob | 77.6% | 56.8%(+20.8)#58 | 46.1%(+31.5)#1,693 |
| 59. | Woodmont Borough | 77.5% | 56.8%(+20.7)#59 | 46.1%(+31.4)#1,702 |
| 60. | Plattsville | 76.6% | 56.8%(+19.8)#60 | 46.1%(+30.5)#1,832 |
| 61. | Sandy Hook | 76.2% | 56.8%(+19.4)#61 | 46.1%(+30.1)#1,890 |
| 62. | Newtown Borough | 76.1% | 56.8%(+19.3)#62 | 46.1%(+30.0)#1,913 |
| 63. | North Granby | 75.7% | 56.8%(+18.9)#63 | 46.1%(+29.6)#1,963 |
| 64. | Ridgefield | 75.4% | 56.8%(+18.6)#64 | 46.1%(+29.3)#2,003 |
| 65. | Tashua | 75.2% | 56.8%(+18.4)#65 | 46.1%(+29.1)#2,037 |
| 66. | Orange | 74.1% | 56.8%(+17.3)#66 | 46.1%(+28.0)#2,215 |
| 67. | Storrs | 74.0% | 56.8%(+17.2)#67 | 46.1%(+27.9)#2,229 |
| 68. | Glastonbury Center | 73.2% | 56.8%(+16.4)#68 | 46.1%(+27.1)#2,339 |
| 69. | Greenwich | 72.7% | 56.8%(+15.9)#69 | 46.1%(+26.6)#2,419 |
| 70. | Litchfield Borough | 72.7% | 56.8%(+15.9)#70 | 46.1%(+26.6)#2,428 |
| 71. | West Hartford | 72.5% | 56.8%(+15.7)#71 | 46.1%(+26.4)#2,464 |
| 72. | Stonington Borough | 72.5% | 56.8%(+15.7)#72 | 46.1%(+26.4)#2,471 |
| 73. | Trumbull Center | 72.2% | 56.8%(+15.4)#73 | 46.1%(+26.1)#2,512 |
| 74. | Gaylordsville | 71.8% | 56.8%(+15.0)#74 | 46.1%(+25.7)#2,593 |
| 75. | Mansfield Center | 71.1% | 56.8%(+14.3)#75 | 46.1%(+25.0)#2,710 |
| 76. | Plantsville | 70.6% | 56.8%(+13.8)#76 | 46.1%(+24.5)#2,785 |
| 77. | Rock Ridge | 70.6% | 56.8%(+13.8)#77 | 46.1%(+24.5)#2,795 |
| 78. | Bigelow Corners | 69.7% | 56.8%(+12.9)#78 | 46.1%(+23.6)#2,941 |
| 79. | Oronoque | 69.4% | 56.8%(+12.6)#79 | 46.1%(+23.3)#2,980 |
| 80. | Bethlehem Village | 69.3% | 56.8%(+12.5)#80 | 46.1%(+23.2)#2,998 |
| 81. | Groton Long Point Borough | 68.9% | 56.8%(+12.1)#81 | 46.1%(+22.8)#3,074 |
| 82. | North Haven | 68.6% | 56.8%(+11.8)#82 | 46.1%(+22.5)#3,116 |
| 83. | Lake Pocotopaug | 68.6% | 56.8%(+11.8)#83 | 46.1%(+22.5)#3,123 |
| 84. | Candlewood Orchards | 68.6% | 56.8%(+11.8)#84 | 46.1%(+22.5)#3,133 |
| 85. | Sail Harbor | 68.3% | 56.8%(+11.5)#85 | 46.1%(+22.2)#3,204 |
| 86. | East Hampton | 68.2% | 56.8%(+11.4)#86 | 46.1%(+22.1)#3,215 |
| 87. | Essex Village | 68.2% | 56.8%(+11.4)#87 | 46.1%(+22.1)#3,216 |
| 88. | Wethersfield | 67.9% | 56.8%(+11.1)#88 | 46.1%(+21.8)#3,264 |
| 89. | Lakeside Woods | 66.7% | 56.8%(+9.90)#89 | 46.1%(+20.6)#3,459 |
| 90. | Ridgebury | 66.5% | 56.8%(+9.70)#90 | 46.1%(+20.4)#3,536 |
| 91. | Suffield Depot | 65.8% | 56.8%(+9.00)#91 | 46.1%(+19.7)#3,668 |
| 92. | Old Mystic | 65.7% | 56.8%(+8.90)#92 | 46.1%(+19.6)#3,690 |
| 93. | Shelton | 65.5% | 56.8%(+8.70)#93 | 46.1%(+19.4)#3,731 |
| 94. | Milford City Balance | 64.8% | 56.8%(+8.00)#94 | 46.1%(+18.7)#3,873 |
| 95. | Route 7 Gateway | 64.4% | 56.8%(+7.60)#95 | 46.1%(+18.3)#3,968 |
| 96. | Pemberwick | 64.0% | 56.8%(+7.20)#96 | 46.1%(+17.9)#4,052 |
| 97. | Bogus Hill | 63.9% | 56.8%(+7.10)#97 | 46.1%(+17.8)#4,078 |
| 98. | Guilford Center | 63.4% | 56.8%(+6.60)#98 | 46.1%(+17.3)#4,170 |
| 99. | Clinton | 62.9% | 56.8%(+6.10)#99 | 46.1%(+16.8)#4,285 |
| 100. | Westbrook Center | 62.9% | 56.8%(+6.10)#100 | 46.1%(+16.8)#4,287 |
Common Questions
What are the Top 10 Cities with the Highest Percentage of Families with Income Above $100,000 in Connecticut?
Top 10 Cities with the Highest Percentage of Families with Income Above $100,000 in Connecticut are:
#1
100.0%
#2
91.1%
#3
89.4%
#4
88.1%
#5
86.3%
#6
85.5%
#7
85.2%
#8
85.0%
#9
84.1%
#10
83.1%
What city has the Highest Percentage of Families with Income Above $100,000 in Connecticut?
Cannondale has the Highest Percentage of Families with Income Above $100,000 in Connecticut with 100.0%.
What is the Percentage of Families with Income Above $100,000 in the State of Connecticut?
Percentage of Families with Income Above $100,000 in Connecticut is 56.8%.
What is the Percentage of Families with Income Above $100,000 in the United States?
Percentage of Families with Income Above $100,000 in the United States is 46.1%.