Cities with the Highest Percentage of State Government Employees in Connecticut
RELATED REPORTS & OPTIONS
State Government Employees
Connecticut
Compare Cities
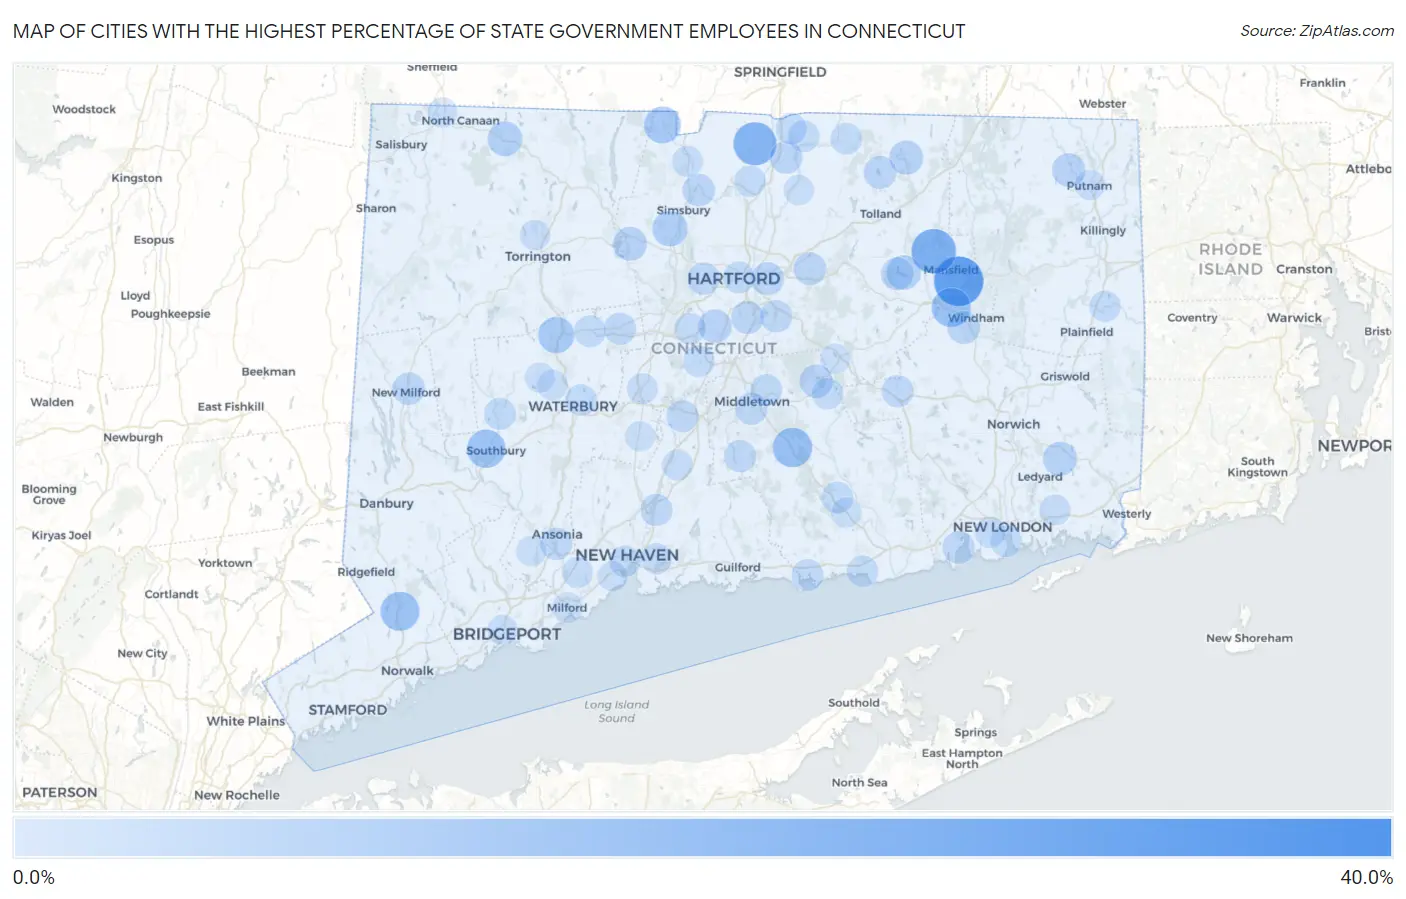
Map of Cities with the Highest Percentage of State Government Employees in Connecticut
0.0%
40.0%
Cities with the Highest Percentage of State Government Employees in Connecticut
| City | % State Government Employees | vs State | vs National | |
| 1. | Lake Chaffee | 34.3% | 4.0%(+30.4)#1 | 4.2%(+30.1)#308 |
| 2. | Mansfield Center | 28.3% | 4.0%(+24.4)#2 | 4.2%(+24.1)#511 |
| 3. | Sacred Heart University | 21.9% | 4.0%(+18.0)#3 | 4.2%(+17.7)#881 |
| 4. | Storrs | 21.5% | 4.0%(+17.6)#4 | 4.2%(+17.3)#926 |
| 5. | Suffield Depot | 19.6% | 4.0%(+15.6)#5 | 4.2%(+15.3)#1,116 |
| 6. | Quasset Lake | 18.6% | 4.0%(+14.7)#6 | 4.2%(+14.4)#1,229 |
| 7. | Fairfield University | 17.3% | 4.0%(+13.3)#7 | 4.2%(+13.0)#1,431 |
| 8. | Higganum | 14.7% | 4.0%(+10.7)#8 | 4.2%(+10.4)#2,004 |
| 9. | Willimantic | 14.2% | 4.0%(+10.3)#9 | 4.2%(+9.97)#2,168 |
| 10. | Cannondale | 13.9% | 4.0%(+9.95)#10 | 4.2%(+9.66)#2,267 |
| 11. | Pleasant Valley | 13.6% | 4.0%(+9.64)#11 | 4.2%(+9.36)#2,361 |
| 12. | Heritage Village | 13.3% | 4.0%(+9.36)#12 | 4.2%(+9.07)#2,466 |
| 13. | Taylor Corners | 11.6% | 4.0%(+7.68)#13 | 4.2%(+7.40)#3,151 |
| 14. | North Granby | 11.1% | 4.0%(+7.12)#14 | 4.2%(+6.83)#3,473 |
| 15. | Route 7 Gateway | 11.0% | 4.0%(+7.06)#15 | 4.2%(+6.77)#3,496 |
| 16. | Thomaston | 10.4% | 4.0%(+6.43)#16 | 4.2%(+6.15)#3,855 |
| 17. | Lake Bungee | 10.4% | 4.0%(+6.42)#17 | 4.2%(+6.13)#3,867 |
| 18. | Weatogue | 9.0% | 4.0%(+5.05)#18 | 4.2%(+4.77)#4,803 |
| 19. | Norfolk | 8.3% | 4.0%(+4.33)#19 | 4.2%(+4.04)#5,445 |
| 20. | South Coventry | 8.0% | 4.0%(+4.08)#20 | 4.2%(+3.80)#5,664 |
| 21. | Mashantucket | 7.5% | 4.0%(+3.54)#21 | 4.2%(+3.26)#6,263 |
| 22. | Stafford Springs | 7.3% | 4.0%(+3.34)#22 | 4.2%(+3.06)#6,476 |
| 23. | Collinsville | 7.3% | 4.0%(+3.34)#23 | 4.2%(+3.06)#6,477 |
| 24. | Stonington Borough | 7.0% | 4.0%(+3.06)#24 | 4.2%(+2.77)#6,808 |
| 25. | Newington | 6.7% | 4.0%(+2.73)#25 | 4.2%(+2.45)#7,201 |
| 26. | South Woodstock | 6.6% | 4.0%(+2.68)#26 | 4.2%(+2.40)#7,282 |
| 27. | Inglenook | 6.6% | 4.0%(+2.63)#27 | 4.2%(+2.35)#7,340 |
| 28. | Lake Pocotopaug | 6.6% | 4.0%(+2.62)#28 | 4.2%(+2.34)#7,348 |
| 29. | South Windham | 6.1% | 4.0%(+2.15)#29 | 4.2%(+1.86)#8,054 |
| 30. | East Hartford | 6.0% | 4.0%(+2.08)#30 | 4.2%(+1.80)#8,176 |
| 31. | Riverton | 5.9% | 4.0%(+1.96)#31 | 4.2%(+1.68)#8,380 |
| 32. | Crystal Lake | 5.9% | 4.0%(+1.91)#32 | 4.2%(+1.63)#8,465 |
| 33. | Coventry Lake | 5.9% | 4.0%(+1.90)#33 | 4.2%(+1.62)#8,477 |
| 34. | Wethersfield | 5.8% | 4.0%(+1.84)#34 | 4.2%(+1.55)#8,581 |
| 35. | Manchester | 5.8% | 4.0%(+1.84)#35 | 4.2%(+1.55)#8,582 |
| 36. | Oronoque | 5.8% | 4.0%(+1.82)#36 | 4.2%(+1.54)#8,607 |
| 37. | Dayville | 5.7% | 4.0%(+1.74)#37 | 4.2%(+1.45)#8,749 |
| 38. | Bridgewater | 5.6% | 4.0%(+1.60)#38 | 4.2%(+1.31)#9,011 |
| 39. | Tariffville | 5.5% | 4.0%(+1.56)#39 | 4.2%(+1.28)#9,090 |
| 40. | New Milford | 5.5% | 4.0%(+1.55)#40 | 4.2%(+1.26)#9,106 |
| 41. | Southwood Acres | 5.5% | 4.0%(+1.52)#41 | 4.2%(+1.23)#9,166 |
| 42. | West Hartford | 5.3% | 4.0%(+1.38)#42 | 4.2%(+1.10)#9,406 |
| 43. | Glastonbury Center | 5.3% | 4.0%(+1.31)#43 | 4.2%(+1.03)#9,542 |
| 44. | Niantic | 5.2% | 4.0%(+1.28)#44 | 4.2%(+0.995)#9,634 |
| 45. | Durham | 5.2% | 4.0%(+1.27)#45 | 4.2%(+0.987)#9,651 |
| 46. | Middletown | 5.2% | 4.0%(+1.24)#46 | 4.2%(+0.952)#9,719 |
| 47. | Bristol | 5.1% | 4.0%(+1.10)#47 | 4.2%(+0.815)#10,009 |
| 48. | Derby | 5.0% | 4.0%(+1.09)#48 | 4.2%(+0.805)#10,033 |
| 49. | Colchester | 4.9% | 4.0%(+0.952)#49 | 4.2%(+0.667)#10,321 |
| 50. | North Haven | 4.9% | 4.0%(+0.941)#50 | 4.2%(+0.657)#10,350 |
| 51. | Meriden | 4.9% | 4.0%(+0.940)#51 | 4.2%(+0.655)#10,352 |
| 52. | Woodbury Center | 4.7% | 4.0%(+0.715)#52 | 4.2%(+0.431)#10,841 |
| 53. | Terryville | 4.6% | 4.0%(+0.677)#53 | 4.2%(+0.392)#10,923 |
| 54. | Portland | 4.6% | 4.0%(+0.625)#54 | 4.2%(+0.341)#11,036 |
| 55. | Clinton | 4.6% | 4.0%(+0.619)#55 | 4.2%(+0.334)#11,050 |
| 56. | Chester Center | 4.4% | 4.0%(+0.481)#56 | 4.2%(+0.197)#11,387 |
| 57. | Hartford | 4.4% | 4.0%(+0.406)#57 | 4.2%(+0.122)#11,542 |
| 58. | East | 4.3% | 4.0%(+0.300)#58 | 4.2%(+0.015)#11,815 |
| 59. | Mill Plain | 4.2% | 4.0%(+0.274)#59 | 4.2%(-0.011)#11,874 |
| 60. | Waterbury | 4.2% | 4.0%(+0.255)#60 | 4.2%(-0.030)#11,927 |
| 61. | Quinnipiac University | 4.2% | 4.0%(+0.249)#61 | 4.2%(-0.036)#11,944 |
| 62. | Somers | 4.2% | 4.0%(+0.233)#62 | 4.2%(-0.051)#11,977 |
| 63. | New London | 4.2% | 4.0%(+0.218)#63 | 4.2%(-0.066)#12,014 |
| 64. | Kensington | 4.2% | 4.0%(+0.194)#64 | 4.2%(-0.091)#12,083 |
| 65. | Hazardville | 4.1% | 4.0%(+0.153)#65 | 4.2%(-0.131)#12,183 |
| 66. | New Britain | 4.1% | 4.0%(+0.101)#66 | 4.2%(-0.183)#12,346 |
| 67. | East Hampton | 4.0% | 4.0%(+0.059)#67 | 4.2%(-0.226)#12,443 |
| 68. | Saybrook Manor | 4.0% | 4.0%(+0.053)#68 | 4.2%(-0.232)#12,454 |
| 69. | Moosup | 3.9% | 4.0%(-0.019)#69 | 4.2%(-0.304)#12,660 |
| 70. | Windsor Locks | 3.9% | 4.0%(-0.079)#70 | 4.2%(-0.363)#12,812 |
| 71. | New Haven | 3.9% | 4.0%(-0.088)#71 | 4.2%(-0.372)#12,831 |
| 72. | Sherwood Manor | 3.9% | 4.0%(-0.103)#72 | 4.2%(-0.388)#12,874 |
| 73. | Woodmont Borough | 3.9% | 4.0%(-0.108)#73 | 4.2%(-0.392)#12,882 |
| 74. | Bigelow Corners | 3.6% | 4.0%(-0.348)#74 | 4.2%(-0.632)#13,628 |
| 75. | East Haven | 3.6% | 4.0%(-0.407)#75 | 4.2%(-0.691)#13,819 |
| 76. | Sandy Hook | 3.6% | 4.0%(-0.407)#76 | 4.2%(-0.691)#13,821 |
| 77. | Old Mystic | 3.5% | 4.0%(-0.431)#77 | 4.2%(-0.716)#13,896 |
| 78. | Orange | 3.5% | 4.0%(-0.440)#78 | 4.2%(-0.724)#13,917 |
| 79. | Naugatuck Borough | 3.5% | 4.0%(-0.441)#79 | 4.2%(-0.726)#13,918 |
| 80. | Plantsville | 3.5% | 4.0%(-0.470)#80 | 4.2%(-0.755)#14,023 |
| 81. | Salmon Brook | 3.4% | 4.0%(-0.541)#81 | 4.2%(-0.825)#14,242 |
| 82. | Waterford | 3.4% | 4.0%(-0.552)#82 | 4.2%(-0.836)#14,277 |
| 83. | Wallingford Center | 3.4% | 4.0%(-0.596)#83 | 4.2%(-0.881)#14,387 |
| 84. | Trumbull Center | 3.3% | 4.0%(-0.618)#84 | 4.2%(-0.903)#14,451 |
| 85. | Oakville | 3.3% | 4.0%(-0.692)#85 | 4.2%(-0.976)#14,674 |
| 86. | Torrington | 2.8% | 4.0%(-1.14)#86 | 4.2%(-1.43)#16,157 |
| 87. | Putnam | 2.8% | 4.0%(-1.15)#87 | 4.2%(-1.44)#16,192 |
| 88. | Bridgeport | 2.8% | 4.0%(-1.16)#88 | 4.2%(-1.45)#16,218 |
| 89. | Broad Brook | 2.8% | 4.0%(-1.18)#89 | 4.2%(-1.46)#16,264 |
| 90. | Litchfield Borough | 2.8% | 4.0%(-1.18)#90 | 4.2%(-1.46)#16,272 |
| 91. | Milford City Balance | 2.8% | 4.0%(-1.20)#91 | 4.2%(-1.48)#16,344 |
| 92. | Terramuggus | 2.7% | 4.0%(-1.24)#92 | 4.2%(-1.52)#16,502 |
| 93. | West Haven | 2.7% | 4.0%(-1.25)#93 | 4.2%(-1.53)#16,540 |
| 94. | Deep River Center | 2.7% | 4.0%(-1.27)#94 | 4.2%(-1.56)#16,622 |
| 95. | Stratford Downtown | 2.7% | 4.0%(-1.29)#95 | 4.2%(-1.58)#16,680 |
| 96. | Candlewood Orchards | 2.7% | 4.0%(-1.30)#96 | 4.2%(-1.58)#16,716 |
| 97. | Cheshire Village | 2.6% | 4.0%(-1.36)#97 | 4.2%(-1.65)#16,953 |
| 98. | Shelton | 2.6% | 4.0%(-1.37)#98 | 4.2%(-1.65)#16,958 |
| 99. | Watertown | 2.5% | 4.0%(-1.42)#99 | 4.2%(-1.71)#17,163 |
| 100. | Canaan | 2.5% | 4.0%(-1.45)#100 | 4.2%(-1.74)#17,262 |
Common Questions
What are the Top 10 Cities with the Highest Percentage of State Government Employees in Connecticut?
Top 10 Cities with the Highest Percentage of State Government Employees in Connecticut are:
#1
28.3%
#2
21.5%
#3
19.6%
#4
14.7%
#5
14.2%
#6
13.9%
#7
13.3%
#8
11.1%
#9
10.4%
#10
9.0%
What city has the Highest Percentage of State Government Employees in Connecticut?
Mansfield Center has the Highest Percentage of State Government Employees in Connecticut with 28.3%.
What is the Percentage of State Government Employees in the State of Connecticut?
Percentage of State Government Employees in Connecticut is 4.0%.
What is the Percentage of State Government Employees in the United States?
Percentage of State Government Employees in the United States is 4.2%.