Cities with the Highest Percentage of Population Employed in Arts, Entertainment & Recreation in Connecticut
RELATED REPORTS & OPTIONS
Arts, Entertainment & Recreation
Connecticut
Compare Cities
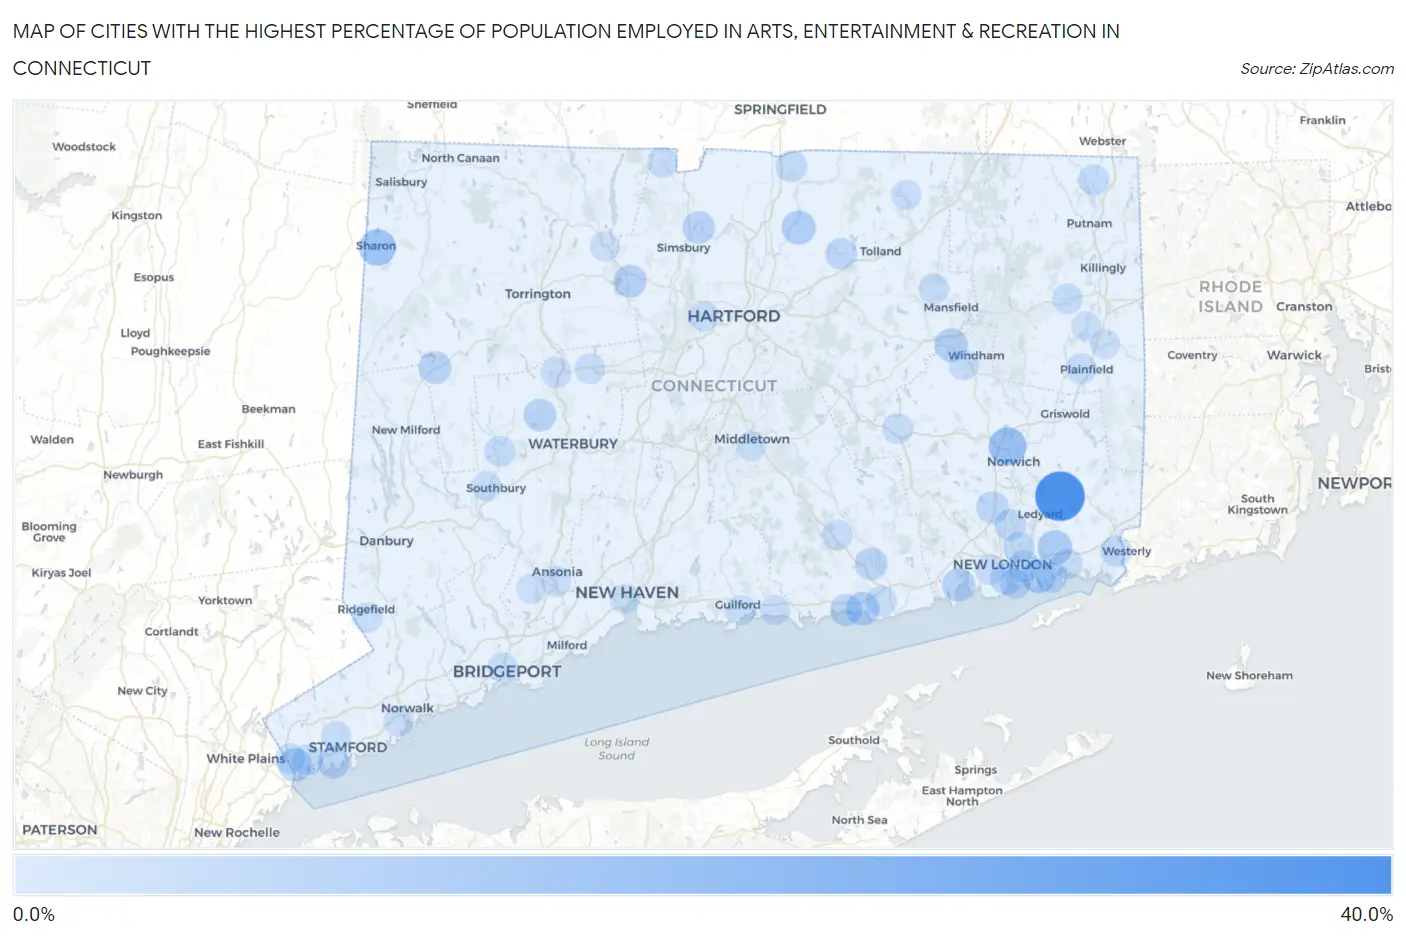
Map of Cities with the Highest Percentage of Population Employed in Arts, Entertainment & Recreation in Connecticut
0.0%
40.0%
Cities with the Highest Percentage of Population Employed in Arts, Entertainment & Recreation in Connecticut
| City | % Employed | vs State | vs National | |
| 1. | Mashantucket | 38.1% | 2.5%(+35.6)#1 | 2.1%(+36.0)#82 |
| 2. | Pleasant Valley | 24.8% | 2.5%(+22.3)#2 | 2.1%(+22.7)#185 |
| 3. | Botsford | 22.2% | 2.5%(+19.7)#3 | 2.1%(+20.1)#227 |
| 4. | West Cornwall | 19.4% | 2.5%(+17.0)#4 | 2.1%(+17.4)#281 |
| 5. | Fairfield University | 17.6% | 2.5%(+15.1)#5 | 2.1%(+15.5)#341 |
| 6. | Rock Ridge | 17.1% | 2.5%(+14.6)#6 | 2.1%(+15.0)#363 |
| 7. | Topstone | 16.9% | 2.5%(+14.4)#7 | 2.1%(+14.8)#373 |
| 8. | Norwich | 15.8% | 2.5%(+13.3)#8 | 2.1%(+13.7)#422 |
| 9. | Sharon | 14.1% | 2.5%(+11.6)#9 | 2.1%(+12.0)#519 |
| 10. | Sacred Heart University | 12.5% | 2.5%(+9.99)#10 | 2.1%(+10.4)#635 |
| 11. | Hawleyville | 11.8% | 2.5%(+9.37)#11 | 2.1%(+9.76)#686 |
| 12. | Old Mystic | 10.6% | 2.5%(+8.11)#12 | 2.1%(+8.50)#818 |
| 13. | Jewett City Borough | 10.0% | 2.5%(+7.54)#13 | 2.1%(+7.94)#901 |
| 14. | Quinnipiac University | 9.2% | 2.5%(+6.73)#14 | 2.1%(+7.12)#1,039 |
| 15. | Broad Brook | 9.1% | 2.5%(+6.63)#15 | 2.1%(+7.02)#1,050 |
| 16. | Poquonock Bridge | 9.1% | 2.5%(+6.58)#16 | 2.1%(+6.97)#1,064 |
| 17. | Pemberwick | 8.6% | 2.5%(+6.13)#17 | 2.1%(+6.52)#1,157 |
| 18. | Saybrook Manor | 8.4% | 2.5%(+5.95)#18 | 2.1%(+6.34)#1,198 |
| 19. | Lakes West | 8.4% | 2.5%(+5.90)#19 | 2.1%(+6.30)#1,204 |
| 20. | Willimantic | 8.1% | 2.5%(+5.65)#20 | 2.1%(+6.04)#1,264 |
| 21. | Niantic | 7.8% | 2.5%(+5.33)#21 | 2.1%(+5.72)#1,353 |
| 22. | Oronoque | 7.4% | 2.5%(+4.96)#22 | 2.1%(+5.35)#1,475 |
| 23. | Collinsville | 7.4% | 2.5%(+4.96)#23 | 2.1%(+5.35)#1,476 |
| 24. | Watertown | 6.8% | 2.5%(+4.33)#24 | 2.1%(+4.72)#1,650 |
| 25. | New Preston | 6.8% | 2.5%(+4.30)#25 | 2.1%(+4.69)#1,665 |
| 26. | Tariffville | 6.7% | 2.5%(+4.26)#26 | 2.1%(+4.65)#1,677 |
| 27. | South Wilton | 6.5% | 2.5%(+4.06)#27 | 2.1%(+4.45)#1,751 |
| 28. | Essex Village | 6.5% | 2.5%(+4.01)#28 | 2.1%(+4.40)#1,781 |
| 29. | Oxoboxo River | 6.5% | 2.5%(+3.98)#29 | 2.1%(+4.37)#1,789 |
| 30. | Plattsville | 6.3% | 2.5%(+3.86)#30 | 2.1%(+4.25)#1,845 |
| 31. | Westport | 6.2% | 2.5%(+3.73)#31 | 2.1%(+4.12)#1,898 |
| 32. | Old Greenwich | 6.0% | 2.5%(+3.55)#32 | 2.1%(+3.94)#1,968 |
| 33. | Westbrook Center | 6.0% | 2.5%(+3.52)#33 | 2.1%(+3.91)#1,984 |
| 34. | Long Hill | 5.9% | 2.5%(+3.41)#34 | 2.1%(+3.80)#2,036 |
| 35. | Bantam Borough | 5.8% | 2.5%(+3.31)#35 | 2.1%(+3.70)#2,106 |
| 36. | Compo | 5.7% | 2.5%(+3.26)#36 | 2.1%(+3.65)#2,127 |
| 37. | New London | 5.6% | 2.5%(+3.13)#37 | 2.1%(+3.53)#2,199 |
| 38. | Brookfield Center | 5.6% | 2.5%(+3.08)#38 | 2.1%(+3.47)#2,239 |
| 39. | Stonington Borough | 5.5% | 2.5%(+3.01)#39 | 2.1%(+3.41)#2,271 |
| 40. | Lakeside Woods | 5.5% | 2.5%(+2.99)#40 | 2.1%(+3.39)#2,282 |
| 41. | Gales Ferry | 5.1% | 2.5%(+2.66)#41 | 2.1%(+3.05)#2,495 |
| 42. | Rockville | 5.0% | 2.5%(+2.51)#42 | 2.1%(+2.90)#2,621 |
| 43. | Pawcatuck | 4.8% | 2.5%(+2.36)#43 | 2.1%(+2.75)#2,728 |
| 44. | Sherwood Manor | 4.8% | 2.5%(+2.30)#44 | 2.1%(+2.69)#2,772 |
| 45. | Poplar Plains | 4.7% | 2.5%(+2.24)#45 | 2.1%(+2.63)#2,824 |
| 46. | Noank | 4.4% | 2.5%(+1.97)#46 | 2.1%(+2.36)#3,095 |
| 47. | Mechanicsville | 4.4% | 2.5%(+1.97)#47 | 2.1%(+2.36)#3,098 |
| 48. | Woodmont Borough | 4.4% | 2.5%(+1.91)#48 | 2.1%(+2.30)#3,169 |
| 49. | Conning Towers Nautilus Park | 4.3% | 2.5%(+1.82)#49 | 2.1%(+2.21)#3,272 |
| 50. | Cornwall | 4.3% | 2.5%(+1.81)#50 | 2.1%(+2.20)#3,290 |
| 51. | Groton | 4.1% | 2.5%(+1.58)#51 | 2.1%(+1.97)#3,568 |
| 52. | Lakes East | 3.9% | 2.5%(+1.47)#52 | 2.1%(+1.87)#3,697 |
| 53. | Woodbury Center | 3.9% | 2.5%(+1.46)#53 | 2.1%(+1.86)#3,712 |
| 54. | Brooklyn | 3.9% | 2.5%(+1.43)#54 | 2.1%(+1.83)#3,750 |
| 55. | Stratford Downtown | 3.9% | 2.5%(+1.39)#55 | 2.1%(+1.78)#3,803 |
| 56. | Greenwich | 3.8% | 2.5%(+1.37)#56 | 2.1%(+1.77)#3,822 |
| 57. | North Grosvenor Dale | 3.8% | 2.5%(+1.36)#57 | 2.1%(+1.75)#3,854 |
| 58. | Lake Bungee | 3.7% | 2.5%(+1.27)#58 | 2.1%(+1.66)#3,987 |
| 59. | Coleytown | 3.7% | 2.5%(+1.25)#59 | 2.1%(+1.64)#4,020 |
| 60. | Plainfield Village | 3.7% | 2.5%(+1.23)#60 | 2.1%(+1.62)#4,043 |
| 61. | Gaylordsville | 3.6% | 2.5%(+1.11)#61 | 2.1%(+1.50)#4,246 |
| 62. | Greens Farms | 3.6% | 2.5%(+1.10)#62 | 2.1%(+1.49)#4,264 |
| 63. | Thomaston | 3.5% | 2.5%(+1.03)#63 | 2.1%(+1.42)#4,387 |
| 64. | Colchester | 3.5% | 2.5%(+1.02)#64 | 2.1%(+1.42)#4,389 |
| 65. | Glenville | 3.4% | 2.5%(+0.933)#65 | 2.1%(+1.33)#4,578 |
| 66. | Mystic | 3.4% | 2.5%(+0.930)#66 | 2.1%(+1.32)#4,585 |
| 67. | Chester Center | 3.4% | 2.5%(+0.913)#67 | 2.1%(+1.31)#4,617 |
| 68. | Terryville | 3.4% | 2.5%(+0.878)#68 | 2.1%(+1.27)#4,682 |
| 69. | Old Saybrook Center | 3.3% | 2.5%(+0.849)#69 | 2.1%(+1.24)#4,738 |
| 70. | Ridgebury | 3.3% | 2.5%(+0.827)#70 | 2.1%(+1.22)#4,779 |
| 71. | Northford | 3.3% | 2.5%(+0.818)#71 | 2.1%(+1.21)#4,794 |
| 72. | Trumbull Center | 3.3% | 2.5%(+0.802)#72 | 2.1%(+1.19)#4,831 |
| 73. | North Granby | 3.2% | 2.5%(+0.769)#73 | 2.1%(+1.16)#4,883 |
| 74. | Storrs | 3.1% | 2.5%(+0.670)#74 | 2.1%(+1.06)#5,074 |
| 75. | Noroton | 3.1% | 2.5%(+0.653)#75 | 2.1%(+1.05)#5,110 |
| 76. | Saugatuck | 3.1% | 2.5%(+0.622)#76 | 2.1%(+1.02)#5,185 |
| 77. | Candlewood Orchards | 3.0% | 2.5%(+0.515)#77 | 2.1%(+0.907)#5,412 |
| 78. | Waterford | 2.9% | 2.5%(+0.457)#78 | 2.1%(+0.849)#5,551 |
| 79. | Madison Center | 2.9% | 2.5%(+0.452)#79 | 2.1%(+0.844)#5,564 |
| 80. | Norwalk | 2.9% | 2.5%(+0.444)#80 | 2.1%(+0.837)#5,577 |
| 81. | Tokeneke | 2.9% | 2.5%(+0.399)#81 | 2.1%(+0.792)#5,694 |
| 82. | Redding Center | 2.9% | 2.5%(+0.382)#82 | 2.1%(+0.775)#5,751 |
| 83. | Ridgefield | 2.9% | 2.5%(+0.378)#83 | 2.1%(+0.771)#5,766 |
| 84. | Bridgeport | 2.8% | 2.5%(+0.341)#84 | 2.1%(+0.734)#5,869 |
| 85. | West Hartford | 2.8% | 2.5%(+0.306)#85 | 2.1%(+0.699)#5,949 |
| 86. | Derby | 2.7% | 2.5%(+0.243)#86 | 2.1%(+0.635)#6,133 |
| 87. | South Windham | 2.6% | 2.5%(+0.152)#87 | 2.1%(+0.545)#6,411 |
| 88. | Old Hill | 2.6% | 2.5%(+0.140)#88 | 2.1%(+0.533)#6,441 |
| 89. | Heritage Village | 2.6% | 2.5%(+0.116)#89 | 2.1%(+0.509)#6,502 |
| 90. | Stamford | 2.5% | 2.5%(+0.048)#90 | 2.1%(+0.441)#6,746 |
| 91. | Guilford Center | 2.5% | 2.5%(+0.025)#91 | 2.1%(+0.417)#6,818 |
| 92. | Noroton Heights | 2.5% | 2.5%(+0.017)#92 | 2.1%(+0.410)#6,849 |
| 93. | Stafford Springs | 2.4% | 2.5%(-0.038)#93 | 2.1%(+0.354)#7,044 |
| 94. | New Hartford Center | 2.4% | 2.5%(-0.070)#94 | 2.1%(+0.323)#7,142 |
| 95. | Middletown | 2.3% | 2.5%(-0.148)#95 | 2.1%(+0.245)#7,392 |
| 96. | New Haven | 2.3% | 2.5%(-0.161)#96 | 2.1%(+0.231)#7,441 |
| 97. | New Canaan | 2.3% | 2.5%(-0.163)#97 | 2.1%(+0.229)#7,452 |
| 98. | Wauregan | 2.2% | 2.5%(-0.235)#98 | 2.1%(+0.157)#7,717 |
| 99. | Shelton | 2.1% | 2.5%(-0.335)#99 | 2.1%(+0.058)#8,103 |
| 100. | Moosup | 2.1% | 2.5%(-0.368)#100 | 2.1%(+0.025)#8,263 |
Common Questions
What are the Top 10 Cities with the Highest Percentage of Population Employed in Arts, Entertainment & Recreation in Connecticut?
Top 10 Cities with the Highest Percentage of Population Employed in Arts, Entertainment & Recreation in Connecticut are:
#1
38.1%
#2
15.8%
#3
14.1%
#4
10.6%
#5
9.1%
#6
9.1%
#7
8.6%
#8
8.4%
#9
8.1%
#10
7.8%
What city has the Highest Percentage of Population Employed in Arts, Entertainment & Recreation in Connecticut?
Mashantucket has the Highest Percentage of Population Employed in Arts, Entertainment & Recreation in Connecticut with 38.1%.
What is the Percentage of Population Employed in Arts, Entertainment & Recreation in the State of Connecticut?
Percentage of Population Employed in Arts, Entertainment & Recreation in Connecticut is 2.5%.
What is the Percentage of Population Employed in Arts, Entertainment & Recreation in the United States?
Percentage of Population Employed in Arts, Entertainment & Recreation in the United States is 2.1%.