Cities with the Highest Percentage of Population Employed in Personal Care and Service in Connecticut
RELATED REPORTS & OPTIONS
Personal Care and Service
Connecticut
Compare Cities
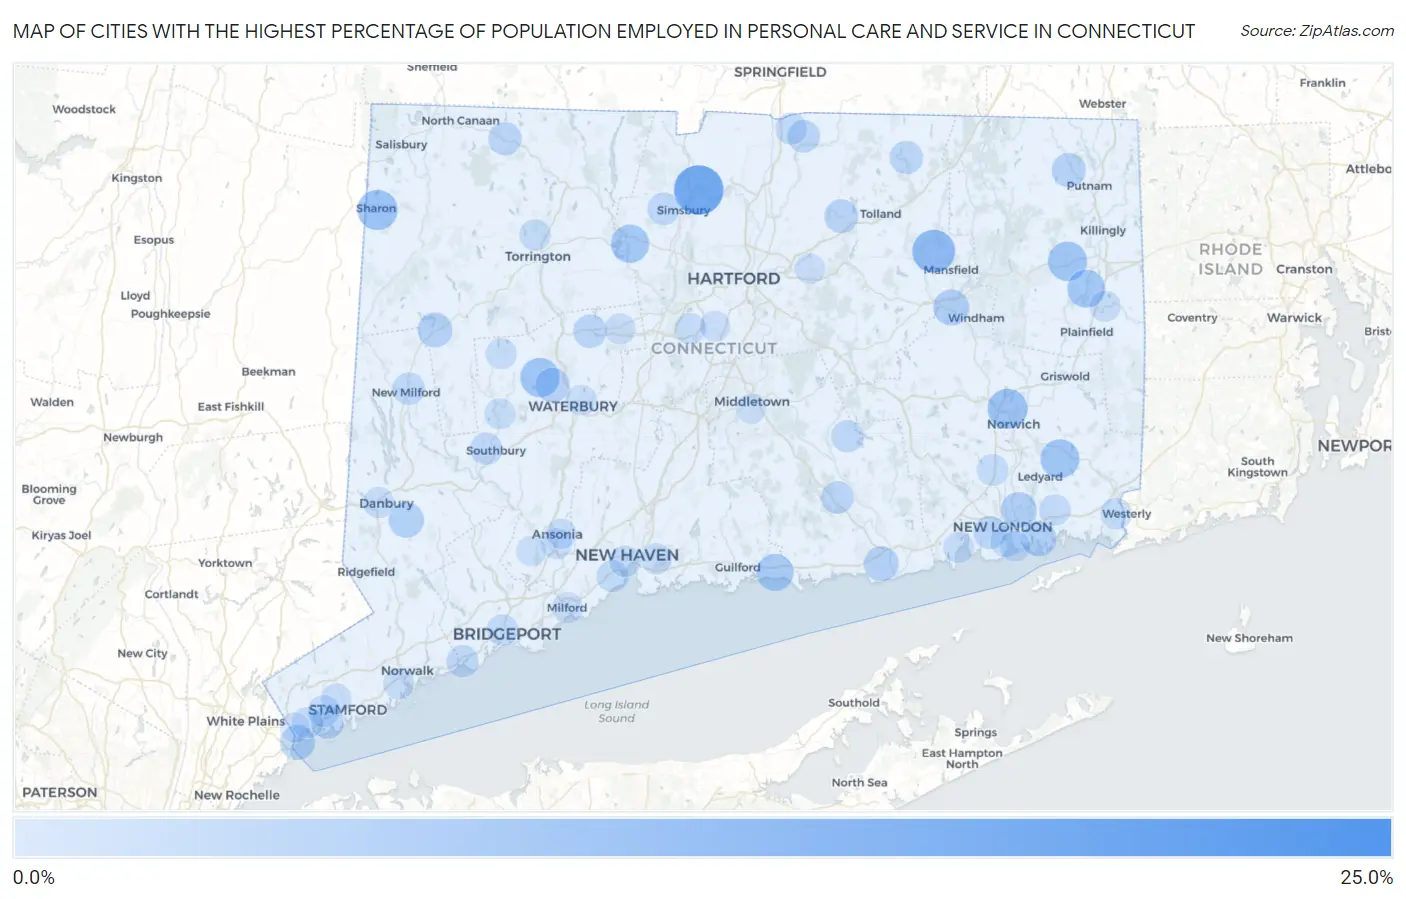
Map of Cities with the Highest Percentage of Population Employed in Personal Care and Service in Connecticut
0.0%
25.0%
Cities with the Highest Percentage of Population Employed in Personal Care and Service in Connecticut
| City | % Employed | vs State | vs National | |
| 1. | Pleasant Valley | 24.8% | 3.0%(+21.8)#1 | 2.6%(+22.2)#163 |
| 2. | Candlewood Isle | 23.7% | 3.0%(+20.7)#2 | 2.6%(+21.1)#176 |
| 3. | Fairfield University | 23.1% | 3.0%(+20.0)#3 | 2.6%(+20.5)#189 |
| 4. | Botsford | 22.2% | 3.0%(+19.2)#4 | 2.6%(+19.6)#210 |
| 5. | Rock Ridge | 20.3% | 3.0%(+17.3)#5 | 2.6%(+17.7)#247 |
| 6. | Tariffville | 18.3% | 3.0%(+15.3)#6 | 2.6%(+15.7)#294 |
| 7. | Quinnipiac University | 18.2% | 3.0%(+15.2)#7 | 2.6%(+15.6)#299 |
| 8. | Sacred Heart University | 17.2% | 3.0%(+14.2)#8 | 2.6%(+14.6)#329 |
| 9. | Topstone | 16.9% | 3.0%(+13.9)#9 | 2.6%(+14.4)#338 |
| 10. | Storrs | 12.8% | 3.0%(+9.83)#10 | 2.6%(+10.3)#571 |
| 11. | Bigelow Corners | 12.0% | 3.0%(+8.96)#11 | 2.6%(+9.41)#667 |
| 12. | Hawleyville | 11.8% | 3.0%(+8.83)#12 | 2.6%(+9.28)#681 |
| 13. | Sharon | 10.6% | 3.0%(+7.54)#13 | 2.6%(+7.99)#843 |
| 14. | Norwich | 10.4% | 3.0%(+7.39)#14 | 2.6%(+7.84)#859 |
| 15. | Watertown | 9.9% | 3.0%(+6.88)#15 | 2.6%(+7.33)#948 |
| 16. | Brooklyn | 9.8% | 3.0%(+6.76)#16 | 2.6%(+7.21)#969 |
| 17. | Mashantucket | 9.5% | 3.0%(+6.51)#17 | 2.6%(+6.96)#1,022 |
| 18. | Collinsville | 8.9% | 3.0%(+5.93)#18 | 2.6%(+6.38)#1,162 |
| 19. | West Mountain | 8.9% | 3.0%(+5.88)#19 | 2.6%(+6.33)#1,174 |
| 20. | Wauregan | 8.7% | 3.0%(+5.68)#20 | 2.6%(+6.13)#1,228 |
| 21. | Cornwall | 8.6% | 3.0%(+5.56)#21 | 2.6%(+6.01)#1,275 |
| 22. | Jewett City Borough | 8.2% | 3.0%(+5.21)#22 | 2.6%(+5.66)#1,366 |
| 23. | Stonington Borough | 8.1% | 3.0%(+5.10)#23 | 2.6%(+5.55)#1,398 |
| 24. | Madison Center | 8.0% | 3.0%(+5.04)#24 | 2.6%(+5.49)#1,416 |
| 25. | South Wilton | 7.2% | 3.0%(+4.22)#25 | 2.6%(+4.67)#1,719 |
| 26. | Willimantic | 7.2% | 3.0%(+4.14)#26 | 2.6%(+4.59)#1,749 |
| 27. | Conning Towers Nautilus Park | 7.0% | 3.0%(+4.00)#27 | 2.6%(+4.45)#1,826 |
| 28. | Bethel | 6.7% | 3.0%(+3.73)#28 | 2.6%(+4.17)#1,971 |
| 29. | Lake Chaffee | 6.7% | 3.0%(+3.70)#29 | 2.6%(+4.15)#1,983 |
| 30. | Poquonock Bridge | 6.7% | 3.0%(+3.70)#30 | 2.6%(+4.15)#1,984 |
| 31. | Byram | 6.4% | 3.0%(+3.38)#31 | 2.6%(+3.83)#2,177 |
| 32. | New Preston | 6.4% | 3.0%(+3.35)#32 | 2.6%(+3.80)#2,190 |
| 33. | Old Saybrook Center | 6.4% | 3.0%(+3.35)#33 | 2.6%(+3.80)#2,193 |
| 34. | Oakville | 5.9% | 3.0%(+2.91)#34 | 2.6%(+3.36)#2,523 |
| 35. | Indian Field | 5.9% | 3.0%(+2.90)#35 | 2.6%(+3.35)#2,532 |
| 36. | Bantam Borough | 5.8% | 3.0%(+2.77)#36 | 2.6%(+3.22)#2,660 |
| 37. | South Woodstock | 5.7% | 3.0%(+2.71)#37 | 2.6%(+3.16)#2,705 |
| 38. | Rockville | 5.5% | 3.0%(+2.49)#38 | 2.6%(+2.94)#2,920 |
| 39. | Mechanicsville | 5.4% | 3.0%(+2.42)#39 | 2.6%(+2.87)#2,979 |
| 40. | Terryville | 5.2% | 3.0%(+2.22)#40 | 2.6%(+2.67)#3,180 |
| 41. | Norfolk | 5.1% | 3.0%(+2.12)#41 | 2.6%(+2.57)#3,287 |
| 42. | Greens Farms | 5.0% | 3.0%(+2.03)#42 | 2.6%(+2.48)#3,387 |
| 43. | Stafford Springs | 5.0% | 3.0%(+2.03)#43 | 2.6%(+2.48)#3,393 |
| 44. | Waterford | 5.0% | 3.0%(+1.96)#44 | 2.6%(+2.41)#3,512 |
| 45. | Ball Pond | 4.8% | 3.0%(+1.83)#45 | 2.6%(+2.28)#3,671 |
| 46. | Sandy Hook | 4.8% | 3.0%(+1.74)#46 | 2.6%(+2.19)#3,788 |
| 47. | Riverside | 4.7% | 3.0%(+1.70)#47 | 2.6%(+2.15)#3,833 |
| 48. | Chester Center | 4.7% | 3.0%(+1.66)#48 | 2.6%(+2.11)#3,890 |
| 49. | Hazardville | 4.6% | 3.0%(+1.61)#49 | 2.6%(+2.06)#3,963 |
| 50. | Lakes West | 4.5% | 3.0%(+1.46)#50 | 2.6%(+1.91)#4,212 |
| 51. | New Milford | 4.4% | 3.0%(+1.42)#51 | 2.6%(+1.87)#4,279 |
| 52. | West Simsbury | 4.4% | 3.0%(+1.39)#52 | 2.6%(+1.84)#4,323 |
| 53. | Moodus | 4.4% | 3.0%(+1.39)#53 | 2.6%(+1.84)#4,325 |
| 54. | Heritage Village | 4.3% | 3.0%(+1.28)#54 | 2.6%(+1.73)#4,496 |
| 55. | Southport | 4.2% | 3.0%(+1.23)#55 | 2.6%(+1.67)#4,588 |
| 56. | Cos Cob | 4.1% | 3.0%(+1.08)#56 | 2.6%(+1.53)#4,870 |
| 57. | West Haven | 4.1% | 3.0%(+1.05)#57 | 2.6%(+1.50)#4,932 |
| 58. | New London | 4.0% | 3.0%(+1.01)#58 | 2.6%(+1.46)#5,001 |
| 59. | Riverton | 3.9% | 3.0%(+0.936)#59 | 2.6%(+1.38)#5,162 |
| 60. | Compo | 3.9% | 3.0%(+0.855)#60 | 2.6%(+1.30)#5,344 |
| 61. | Sherwood Manor | 3.9% | 3.0%(+0.845)#61 | 2.6%(+1.29)#5,363 |
| 62. | Lake Bungee | 3.7% | 3.0%(+0.735)#62 | 2.6%(+1.18)#5,649 |
| 63. | Stratford Downtown | 3.7% | 3.0%(+0.732)#63 | 2.6%(+1.18)#5,656 |
| 64. | Oxoboxo River | 3.7% | 3.0%(+0.715)#64 | 2.6%(+1.16)#5,691 |
| 65. | Pawcatuck | 3.7% | 3.0%(+0.679)#65 | 2.6%(+1.13)#5,797 |
| 66. | Trumbull Center | 3.6% | 3.0%(+0.620)#66 | 2.6%(+1.07)#5,955 |
| 67. | Murray | 3.6% | 3.0%(+0.619)#67 | 2.6%(+1.07)#5,958 |
| 68. | New Haven | 3.6% | 3.0%(+0.582)#68 | 2.6%(+1.03)#6,073 |
| 69. | Tokeneke | 3.6% | 3.0%(+0.582)#69 | 2.6%(+1.03)#6,074 |
| 70. | Torrington | 3.6% | 3.0%(+0.576)#70 | 2.6%(+1.03)#6,086 |
| 71. | Bridgeport | 3.5% | 3.0%(+0.538)#71 | 2.6%(+0.987)#6,206 |
| 72. | Old Mystic | 3.5% | 3.0%(+0.496)#72 | 2.6%(+0.945)#6,330 |
| 73. | New Britain | 3.5% | 3.0%(+0.444)#73 | 2.6%(+0.893)#6,480 |
| 74. | Norwalk | 3.4% | 3.0%(+0.436)#74 | 2.6%(+0.885)#6,514 |
| 75. | Greenwich | 3.4% | 3.0%(+0.344)#75 | 2.6%(+0.793)#6,815 |
| 76. | Moosup | 3.3% | 3.0%(+0.325)#76 | 2.6%(+0.775)#6,869 |
| 77. | East Haven | 3.3% | 3.0%(+0.324)#77 | 2.6%(+0.773)#6,873 |
| 78. | Danbury | 3.3% | 3.0%(+0.283)#78 | 2.6%(+0.732)#7,015 |
| 79. | Poplar Plains | 3.3% | 3.0%(+0.274)#79 | 2.6%(+0.723)#7,036 |
| 80. | Staples | 3.3% | 3.0%(+0.262)#80 | 2.6%(+0.712)#7,076 |
| 81. | Derby | 3.3% | 3.0%(+0.256)#81 | 2.6%(+0.705)#7,101 |
| 82. | Bristol | 3.3% | 3.0%(+0.244)#82 | 2.6%(+0.694)#7,141 |
| 83. | Milford City Balance | 3.2% | 3.0%(+0.223)#83 | 2.6%(+0.672)#7,213 |
| 84. | Bethlehem Village | 3.2% | 3.0%(+0.198)#84 | 2.6%(+0.647)#7,296 |
| 85. | Woodbury Center | 3.2% | 3.0%(+0.170)#85 | 2.6%(+0.619)#7,388 |
| 86. | Plattsville | 3.2% | 3.0%(+0.154)#86 | 2.6%(+0.604)#7,445 |
| 87. | Niantic | 3.2% | 3.0%(+0.146)#87 | 2.6%(+0.595)#7,471 |
| 88. | Oronoque | 3.1% | 3.0%(+0.093)#88 | 2.6%(+0.542)#7,669 |
| 89. | Saugatuck | 3.1% | 3.0%(+0.086)#89 | 2.6%(+0.535)#7,703 |
| 90. | Northford | 2.9% | 3.0%(-0.092)#90 | 2.6%(+0.358)#8,406 |
| 91. | Waterbury | 2.9% | 3.0%(-0.116)#91 | 2.6%(+0.333)#8,511 |
| 92. | Groton | 2.9% | 3.0%(-0.136)#92 | 2.6%(+0.314)#8,594 |
| 93. | Newington | 2.9% | 3.0%(-0.139)#93 | 2.6%(+0.310)#8,616 |
| 94. | Ansonia | 2.9% | 3.0%(-0.151)#94 | 2.6%(+0.299)#8,663 |
| 95. | Stamford | 2.8% | 3.0%(-0.204)#95 | 2.6%(+0.245)#8,898 |
| 96. | Stepney | 2.8% | 3.0%(-0.256)#96 | 2.6%(+0.194)#9,127 |
| 97. | Manchester | 2.7% | 3.0%(-0.274)#97 | 2.6%(+0.175)#9,216 |
| 98. | Pemberwick | 2.6% | 3.0%(-0.431)#98 | 2.6%(+0.018)#9,931 |
| 99. | Middletown | 2.6% | 3.0%(-0.457)#99 | 2.6%(-0.008)#10,075 |
| 100. | Shelton | 2.5% | 3.0%(-0.464)#100 | 2.6%(-0.015)#10,108 |
Common Questions
What are the Top 10 Cities with the Highest Percentage of Population Employed in Personal Care and Service in Connecticut?
Top 10 Cities with the Highest Percentage of Population Employed in Personal Care and Service in Connecticut are:
#1
18.3%
#2
12.8%
#3
10.6%
#4
10.4%
#5
9.9%
#6
9.8%
#7
9.5%
#8
8.9%
#9
8.7%
#10
8.0%
What city has the Highest Percentage of Population Employed in Personal Care and Service in Connecticut?
Tariffville has the Highest Percentage of Population Employed in Personal Care and Service in Connecticut with 18.3%.
What is the Percentage of Population Employed in Personal Care and Service in the State of Connecticut?
Percentage of Population Employed in Personal Care and Service in Connecticut is 3.0%.
What is the Percentage of Population Employed in Personal Care and Service in the United States?
Percentage of Population Employed in Personal Care and Service in the United States is 2.6%.