Cities with the Lowest Child Poverty Level Among Boys Under the Age of 16 in Connecticut
RELATED REPORTS & OPTIONS
Lowest Poverty | Boys 0-16
Connecticut
Compare Cities
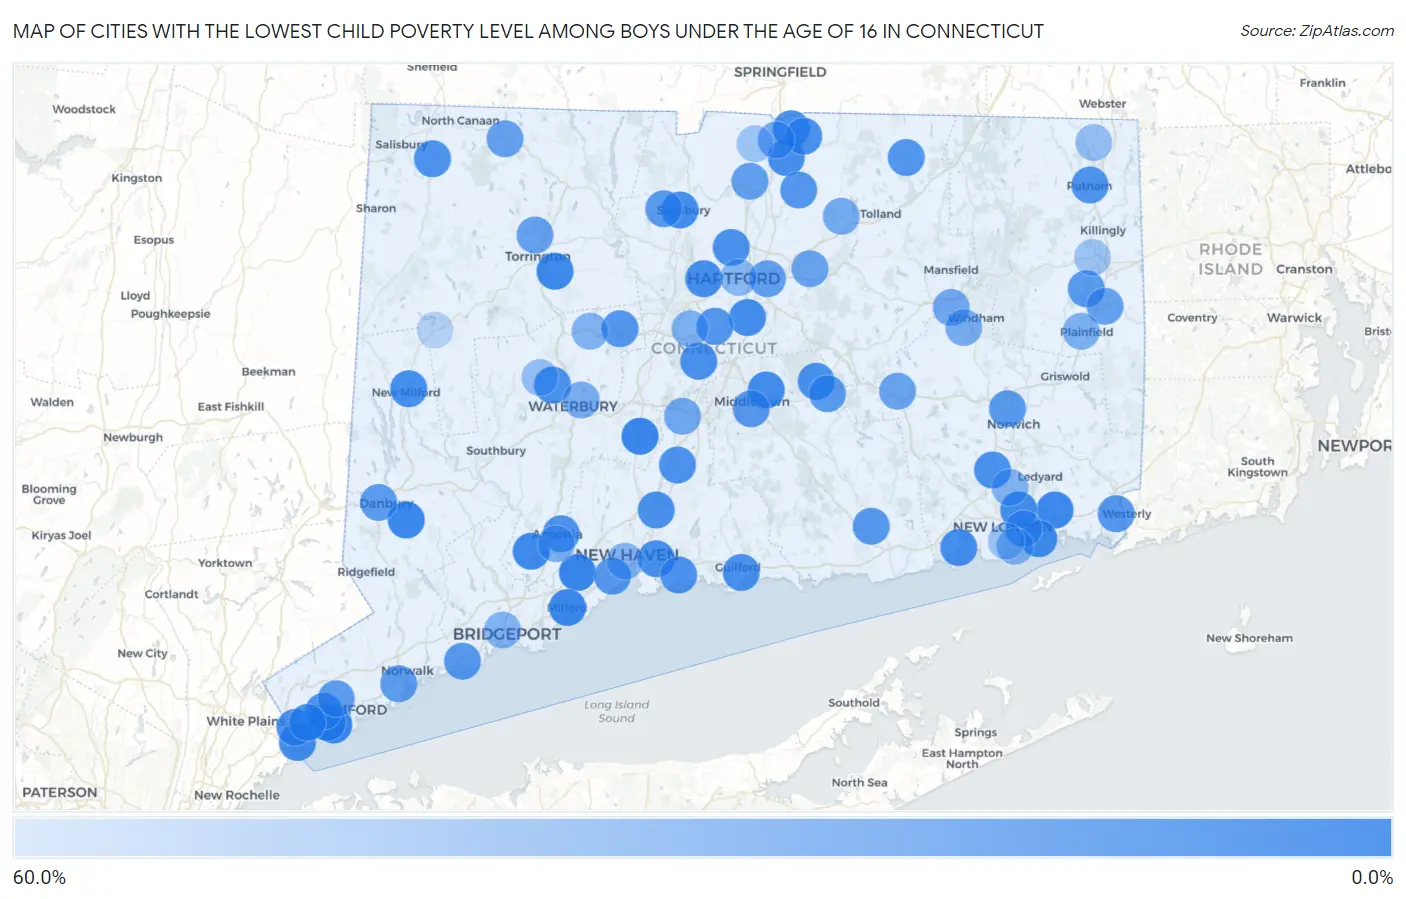
Map of Cities with the Lowest Child Poverty Level Among Boys Under the Age of 16 in Connecticut
60.0%
0.0%
Cities with the Lowest Child Poverty Level Among Boys Under the Age of 16 in Connecticut
| City | Child Poverty (Boys) | vs State | vs National | |
| 1. | Orange | 0.57% | 13.8%(-13.2)#1 | 16.9%(-16.3)#47 |
| 2. | Old Greenwich | 0.72% | 13.8%(-13.1)#2 | 16.9%(-16.2)#87 |
| 3. | Cheshire Village | 0.98% | 13.8%(-12.8)#3 | 16.9%(-15.9)#164 |
| 4. | Bethel | 1.9% | 13.8%(-11.9)#4 | 16.9%(-15.0)#594 |
| 5. | Old Mystic | 2.1% | 13.8%(-11.7)#5 | 16.9%(-14.8)#686 |
| 6. | Ball Pond | 2.2% | 13.8%(-11.6)#6 | 16.9%(-14.7)#734 |
| 7. | Northford | 2.4% | 13.8%(-11.4)#7 | 16.9%(-14.5)#895 |
| 8. | Jewett City Borough | 2.8% | 13.8%(-11.0)#8 | 16.9%(-14.1)#1,108 |
| 9. | Milford City Balance | 2.8% | 13.8%(-11.0)#9 | 16.9%(-14.1)#1,123 |
| 10. | Riverside | 2.9% | 13.8%(-10.9)#10 | 16.9%(-14.0)#1,175 |
| 11. | Northwest Harwinton | 3.2% | 13.8%(-10.6)#11 | 16.9%(-13.7)#1,386 |
| 12. | Daniels Farm | 3.3% | 13.8%(-10.5)#12 | 16.9%(-13.6)#1,432 |
| 13. | Shelton | 3.5% | 13.8%(-10.4)#13 | 16.9%(-13.5)#1,523 |
| 14. | Trumbull Center | 3.9% | 13.8%(-9.95)#14 | 16.9%(-13.0)#1,747 |
| 15. | Poquonock Bridge | 3.9% | 13.8%(-9.93)#15 | 16.9%(-13.0)#1,757 |
| 16. | Litchfield Borough | 4.4% | 13.8%(-9.40)#16 | 16.9%(-12.5)#2,062 |
| 17. | Byram | 5.0% | 13.8%(-8.81)#17 | 16.9%(-11.9)#2,381 |
| 18. | Portland | 5.3% | 13.8%(-8.47)#18 | 16.9%(-11.6)#2,611 |
| 19. | Conning Towers Nautilus Park | 5.4% | 13.8%(-8.43)#19 | 16.9%(-11.5)#2,641 |
| 20. | Wethersfield | 6.0% | 13.8%(-7.82)#20 | 16.9%(-10.9)#2,993 |
| 21. | New Milford | 6.1% | 13.8%(-7.75)#21 | 16.9%(-10.9)#3,033 |
| 22. | Niantic | 6.1% | 13.8%(-7.70)#22 | 16.9%(-10.8)#3,071 |
| 23. | Southwood Acres | 6.9% | 13.8%(-6.86)#23 | 16.9%(-9.96)#3,576 |
| 24. | Compo | 7.0% | 13.8%(-6.85)#24 | 16.9%(-9.94)#3,587 |
| 25. | Naugatuck Borough | 7.0% | 13.8%(-6.77)#25 | 16.9%(-9.87)#3,624 |
| 26. | Simsbury Center | 7.1% | 13.8%(-6.71)#26 | 16.9%(-9.81)#3,660 |
| 27. | West Hartford | 7.7% | 13.8%(-6.11)#27 | 16.9%(-9.21)#4,031 |
| 28. | Kensington | 8.1% | 13.8%(-5.68)#28 | 16.9%(-8.78)#4,246 |
| 29. | Pemberwick | 8.1% | 13.8%(-5.67)#29 | 16.9%(-8.77)#4,250 |
| 30. | Noroton | 8.4% | 13.8%(-5.45)#30 | 16.9%(-8.55)#4,409 |
| 31. | Blue Hills | 8.4% | 13.8%(-5.40)#31 | 16.9%(-8.50)#4,434 |
| 32. | East Haven | 8.4% | 13.8%(-5.39)#32 | 16.9%(-8.48)#4,443 |
| 33. | Sherwood Manor | 8.6% | 13.8%(-5.19)#33 | 16.9%(-8.28)#4,557 |
| 34. | Cos Cob | 8.7% | 13.8%(-5.15)#34 | 16.9%(-8.25)#4,577 |
| 35. | Oxoboxo River | 8.9% | 13.8%(-4.92)#35 | 16.9%(-8.01)#4,710 |
| 36. | North Haven | 9.1% | 13.8%(-4.70)#36 | 16.9%(-7.80)#4,853 |
| 37. | Hazardville | 9.2% | 13.8%(-4.61)#37 | 16.9%(-7.71)#4,899 |
| 38. | Guilford Center | 9.2% | 13.8%(-4.59)#38 | 16.9%(-7.68)#4,916 |
| 39. | Oakville | 9.4% | 13.8%(-4.44)#39 | 16.9%(-7.54)#4,996 |
| 40. | Tashua | 9.4% | 13.8%(-4.43)#40 | 16.9%(-7.53)#5,000 |
| 41. | Greenwich | 9.6% | 13.8%(-4.16)#41 | 16.9%(-7.25)#5,140 |
| 42. | Lake Pocotopaug | 9.7% | 13.8%(-4.15)#42 | 16.9%(-7.24)#5,145 |
| 43. | Branford Center | 10.5% | 13.8%(-3.28)#43 | 16.9%(-6.38)#5,608 |
| 44. | Falls Village | 10.5% | 13.8%(-3.28)#44 | 16.9%(-6.38)#5,624 |
| 45. | Ansonia | 10.5% | 13.8%(-3.28)#45 | 16.9%(-6.37)#5,634 |
| 46. | Wallingford Center | 10.6% | 13.8%(-3.20)#46 | 16.9%(-6.29)#5,667 |
| 47. | Putnam | 11.0% | 13.8%(-2.84)#47 | 16.9%(-5.94)#5,847 |
| 48. | Sandy Hook | 11.0% | 13.8%(-2.82)#48 | 16.9%(-5.92)#5,853 |
| 49. | Staples | 12.1% | 13.8%(-1.67)#49 | 16.9%(-4.77)#6,443 |
| 50. | Noroton Heights | 12.1% | 13.8%(-1.67)#50 | 16.9%(-4.76)#6,445 |
| 51. | Stafford Springs | 12.7% | 13.8%(-1.07)#51 | 16.9%(-4.17)#6,737 |
| 52. | Newington | 12.9% | 13.8%(-0.872)#52 | 16.9%(-3.97)#6,838 |
| 53. | Bristol | 13.5% | 13.8%(-0.334)#53 | 16.9%(-3.43)#7,116 |
| 54. | Pawcatuck | 13.7% | 13.8%(-0.100)#54 | 16.9%(-3.20)#7,233 |
| 55. | West Haven | 13.7% | 13.8%(-0.085)#55 | 16.9%(-3.18)#7,238 |
| 56. | Broad Brook | 14.1% | 13.8%(+0.314)#56 | 16.9%(-2.78)#7,436 |
| 57. | Stepney | 14.2% | 13.8%(+0.430)#57 | 16.9%(-2.67)#7,467 |
| 58. | Middletown | 14.5% | 13.8%(+0.697)#58 | 16.9%(-2.40)#7,623 |
| 59. | Southport | 14.8% | 13.8%(+1.01)#59 | 16.9%(-2.09)#7,771 |
| 60. | Essex Village | 15.6% | 13.8%(+1.80)#60 | 16.9%(-1.30)#8,127 |
| 61. | Norwich | 15.7% | 13.8%(+1.87)#61 | 16.9%(-1.22)#8,161 |
| 62. | Danielson Borough | 15.7% | 13.8%(+1.92)#62 | 16.9%(-1.17)#8,187 |
| 63. | East Hampton | 15.9% | 13.8%(+2.13)#63 | 16.9%(-0.970)#8,288 |
| 64. | West Simsbury | 16.0% | 13.8%(+2.23)#64 | 16.9%(-0.866)#8,343 |
| 65. | Wauregan | 16.4% | 13.8%(+2.58)#65 | 16.9%(-0.520)#8,509 |
| 66. | West Mountain | 17.2% | 13.8%(+3.38)#66 | 16.9%(+0.284)#8,854 |
| 67. | Danbury | 17.3% | 13.8%(+3.44)#67 | 16.9%(+0.349)#8,889 |
| 68. | Stamford | 18.0% | 13.8%(+4.17)#68 | 16.9%(+1.08)#9,210 |
| 69. | Norwalk | 18.1% | 13.8%(+4.26)#69 | 16.9%(+1.17)#9,239 |
| 70. | Long Hill | 19.2% | 13.8%(+5.39)#70 | 16.9%(+2.30)#9,737 |
| 71. | Windsor Locks | 20.2% | 13.8%(+6.40)#71 | 16.9%(+3.30)#10,179 |
| 72. | East Hartford | 20.3% | 13.8%(+6.47)#72 | 16.9%(+3.37)#10,204 |
| 73. | Lordship | 20.8% | 13.8%(+7.04)#73 | 16.9%(+3.95)#10,418 |
| 74. | Norfolk | 21.9% | 13.8%(+8.07)#74 | 16.9%(+4.97)#10,762 |
| 75. | Torrington | 22.2% | 13.8%(+8.38)#75 | 16.9%(+5.28)#10,857 |
| 76. | Moosup | 22.3% | 13.8%(+8.48)#76 | 16.9%(+5.39)#10,928 |
| 77. | Colchester | 23.1% | 13.8%(+9.25)#77 | 16.9%(+6.15)#11,159 |
| 78. | Manchester | 23.2% | 13.8%(+9.35)#78 | 16.9%(+6.25)#11,211 |
| 79. | Cornwall Bridge | 23.5% | 13.8%(+9.72)#79 | 16.9%(+6.63)#11,336 |
| 80. | Thompsonville | 26.5% | 13.8%(+12.7)#80 | 16.9%(+9.58)#12,343 |
| 81. | Willimantic | 26.5% | 13.8%(+12.7)#81 | 16.9%(+9.58)#12,344 |
| 82. | Meriden | 26.5% | 13.8%(+12.7)#82 | 16.9%(+9.64)#12,361 |
| 83. | Rockville | 28.5% | 13.8%(+14.7)#83 | 16.9%(+11.6)#12,961 |
| 84. | South Windham | 29.9% | 13.8%(+16.1)#84 | 16.9%(+13.0)#13,317 |
| 85. | Waterbury | 30.3% | 13.8%(+16.5)#85 | 16.9%(+13.4)#13,422 |
| 86. | New Britain | 32.6% | 13.8%(+18.8)#86 | 16.9%(+15.7)#14,032 |
| 87. | Derby | 32.9% | 13.8%(+19.1)#87 | 16.9%(+16.0)#14,094 |
| 88. | Plainfield Village | 33.1% | 13.8%(+19.3)#88 | 16.9%(+16.2)#14,133 |
| 89. | Terryville | 34.4% | 13.8%(+20.6)#89 | 16.9%(+17.5)#14,494 |
| 90. | Bridgeport | 35.0% | 13.8%(+21.2)#90 | 16.9%(+18.1)#14,647 |
| 91. | Groton | 35.4% | 13.8%(+21.6)#91 | 16.9%(+18.5)#14,736 |
| 92. | Gales Ferry | 35.9% | 13.8%(+22.1)#92 | 16.9%(+19.0)#14,846 |
| 93. | New Haven | 36.1% | 13.8%(+22.3)#93 | 16.9%(+19.2)#14,895 |
| 94. | Hartford | 38.4% | 13.8%(+24.6)#94 | 16.9%(+21.5)#15,331 |
| 95. | Watertown | 43.6% | 13.8%(+29.8)#95 | 16.9%(+26.7)#16,181 |
| 96. | North Grosvenor Dale | 44.6% | 13.8%(+30.8)#96 | 16.9%(+27.7)#16,316 |
| 97. | New London | 46.0% | 13.8%(+32.2)#97 | 16.9%(+29.1)#16,507 |
| 98. | Suffield Depot | 47.6% | 13.8%(+33.8)#98 | 16.9%(+30.7)#16,699 |
| 99. | East Brooklyn | 48.4% | 13.8%(+34.6)#99 | 16.9%(+31.5)#16,805 |
| 100. | New Preston | 58.8% | 13.8%(+45.0)#100 | 16.9%(+41.9)#17,834 |
1
2Common Questions
What are the Top 10 Cities with the Lowest Child Poverty Level Among Boys Under the Age of 16 in Connecticut?
Top 10 Cities with the Lowest Child Poverty Level Among Boys Under the Age of 16 in Connecticut are:
#1
0.57%
#2
0.72%
#3
0.98%
#4
1.9%
#5
2.1%
#6
2.8%
#7
2.9%
#8
3.2%
#9
3.5%
#10
3.9%
What city has the Lowest Child Poverty Level Among Boys Under the Age of 16 in Connecticut?
Orange has the Lowest Child Poverty Level Among Boys Under the Age of 16 in Connecticut with 0.57%.
What is the Poverty Level Among Boys Under the Age of 16 in the State of Connecticut?
Poverty Level Among Boys Under the Age of 16 in Connecticut is 13.8%.
What is the Poverty Level Among Boys Under the Age of 16 in the United States?
Poverty Level Among Boys Under the Age of 16 in the United States is 16.9%.