Putnam, CT
Putnam Map
Putnam Overview
7,207
TOTAL POPULATION
3,269
MALE POPULATION
3,938
FEMALE POPULATION
83.01
MALES / 100 FEMALES
120.46
FEMALES / 100 MALES
37.7
MEDIAN AGE
3.0
AVG FAMILY SIZE
2.2
AVG HOUSEHOLD SIZE
$31,597
PER CAPITA INCOME
$80,880
AVG FAMILY INCOME
$60,539
AVG HOUSEHOLD INCOME
2.2%
WAGE / INCOME GAP [ % ]
97.8¢/ $1
WAGE / INCOME GAP [ $ ]
0.43
INEQUALITY / GINI INDEX
3,869
LABOR FORCE [ PEOPLE ]
66.2%
PERCENT IN LABOR FORCE
5.4%
UNEMPLOYMENT RATE
Putnam Zip Codes
Putnam Area Codes
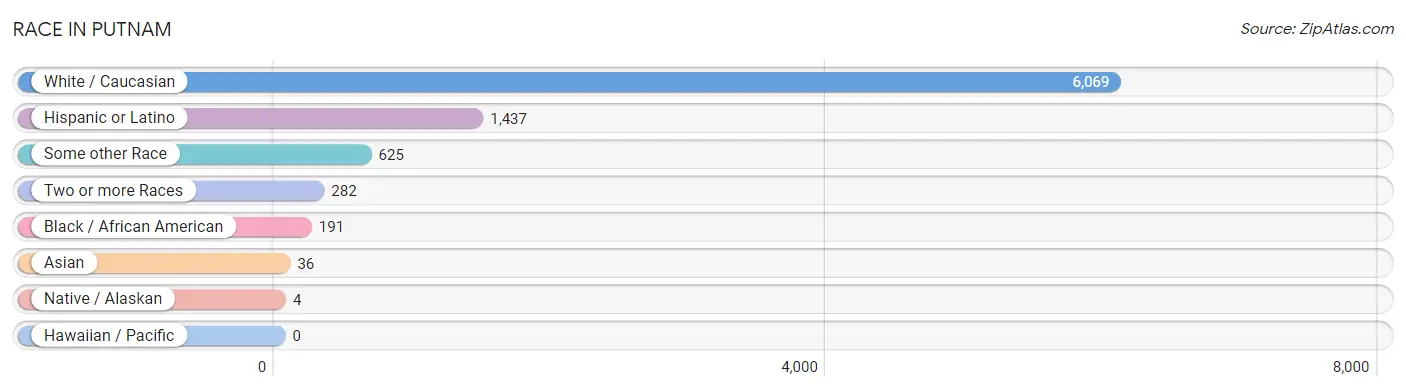
Race in Putnam
The most populous races in Putnam are White / Caucasian (6,069 | 84.2%), Hispanic or Latino (1,437 | 19.9%), and Some other Race (625 | 8.7%).
| Race | # Population | % Population |
| Asian | 36 | 0.5% |
| Black / African American | 191 | 2.6% |
| Hawaiian / Pacific | 0 | 0.0% |
| Hispanic or Latino | 1,437 | 19.9% |
| Native / Alaskan | 4 | 0.1% |
| White / Caucasian | 6,069 | 84.2% |
| Two or more Races | 282 | 3.9% |
| Some other Race | 625 | 8.7% |
| Total | 7,207 | 100.0% |
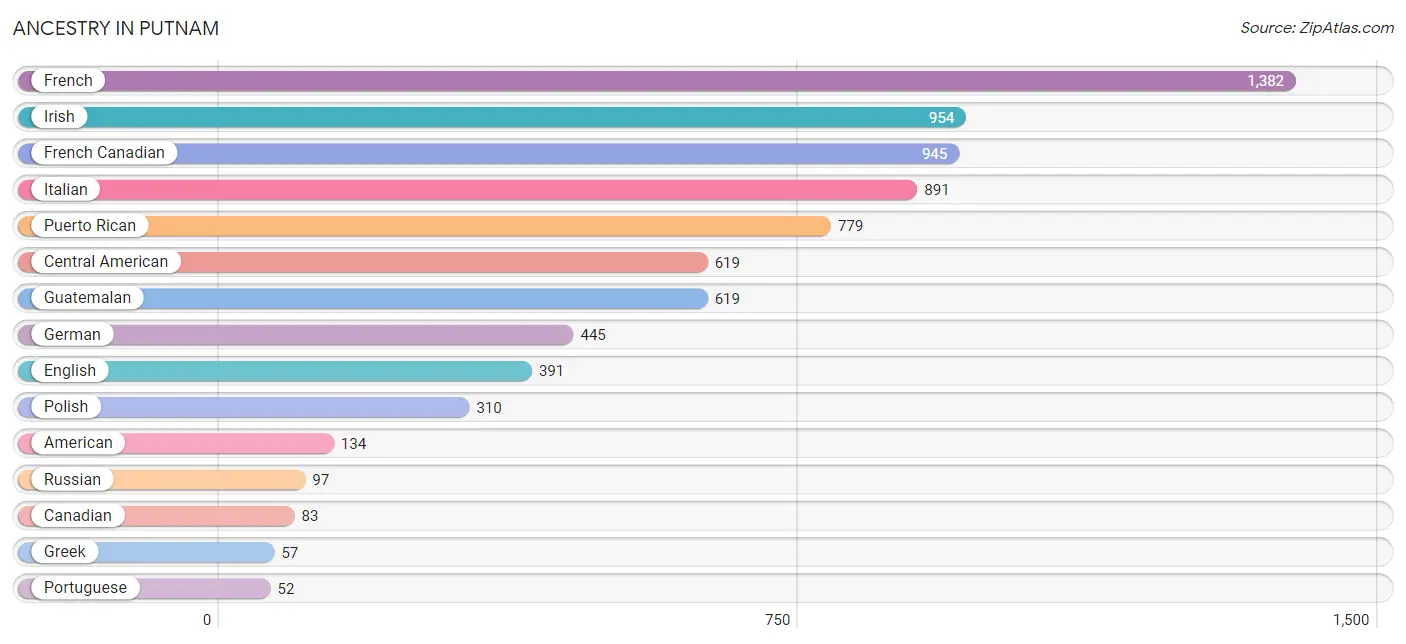
Ancestry in Putnam
The most populous ancestries reported in Putnam are French (1,382 | 19.2%), Irish (954 | 13.2%), French Canadian (945 | 13.1%), Italian (891 | 12.4%), and Puerto Rican (779 | 10.8%), together accounting for 68.7% of all Putnam residents.
| Ancestry | # Population | % Population |
| American | 134 | 1.9% |
| Austrian | 9 | 0.1% |
| Blackfeet | 44 | 0.6% |
| British | 14 | 0.2% |
| Canadian | 83 | 1.1% |
| Central American | 619 | 8.6% |
| Choctaw | 4 | 0.1% |
| Danish | 22 | 0.3% |
| Dutch | 8 | 0.1% |
| English | 391 | 5.4% |
| European | 4 | 0.1% |
| Finnish | 22 | 0.3% |
| French | 1,382 | 19.2% |
| French Canadian | 945 | 13.1% |
| German | 445 | 6.2% |
| Greek | 57 | 0.8% |
| Guatemalan | 619 | 8.6% |
| Haitian | 8 | 0.1% |
| Irish | 954 | 13.2% |
| Italian | 891 | 12.4% |
| Jamaican | 36 | 0.5% |
| Lithuanian | 28 | 0.4% |
| Mexican | 21 | 0.3% |
| Mexican American Indian | 12 | 0.2% |
| Norwegian | 46 | 0.6% |
| Peruvian | 18 | 0.3% |
| Polish | 310 | 4.3% |
| Portuguese | 52 | 0.7% |
| Puerto Rican | 779 | 10.8% |
| Russian | 97 | 1.3% |
| Scotch-Irish | 44 | 0.6% |
| Scottish | 21 | 0.3% |
| Sierra Leonean | 14 | 0.2% |
| Slavic | 8 | 0.1% |
| South American | 18 | 0.3% |
| Subsaharan African | 14 | 0.2% |
| Swedish | 46 | 0.6% |
| Swiss | 3 | 0.0% |
| Ukrainian | 7 | 0.1% | View All 39 Rows |
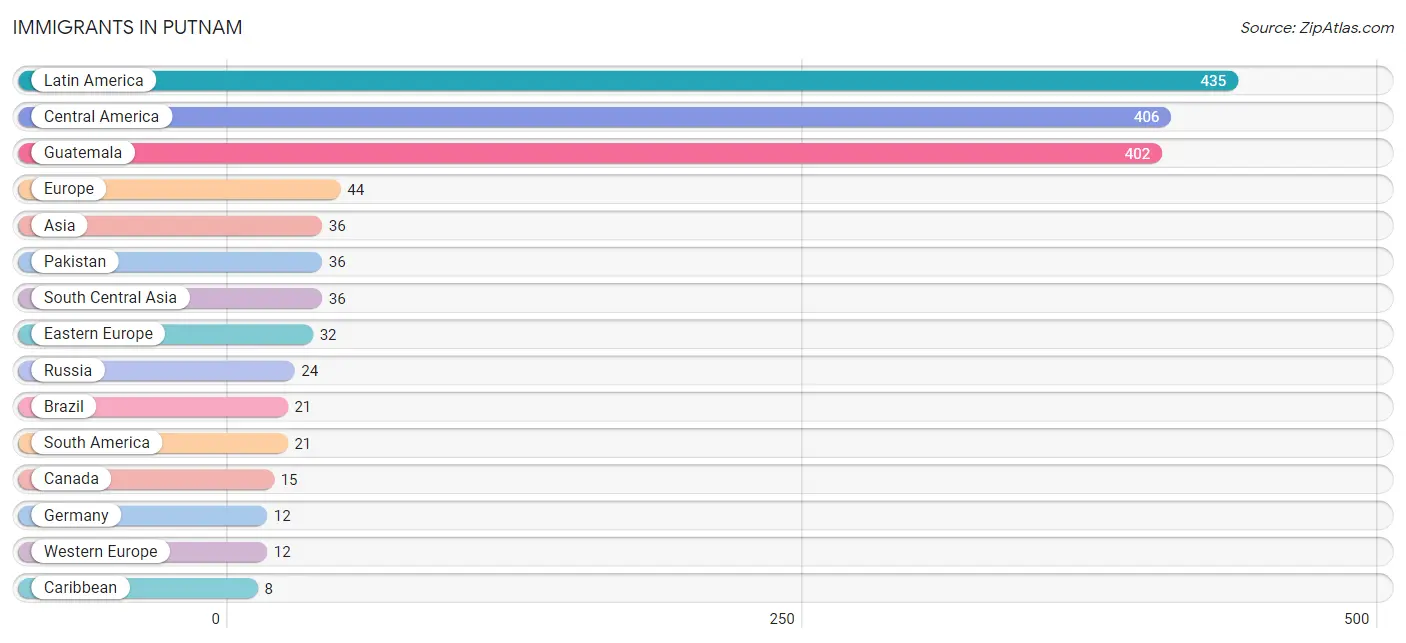
Immigrants in Putnam
The most numerous immigrant groups reported in Putnam came from Latin America (435 | 6.0%), Central America (406 | 5.6%), Guatemala (402 | 5.6%), Europe (44 | 0.6%), and Asia (36 | 0.5%), together accounting for 18.4% of all Putnam residents.
| Immigration Origin | # Population | % Population |
| Asia | 36 | 0.5% |
| Brazil | 21 | 0.3% |
| Canada | 15 | 0.2% |
| Caribbean | 8 | 0.1% |
| Central America | 406 | 5.6% |
| Eastern Europe | 32 | 0.4% |
| Europe | 44 | 0.6% |
| Germany | 12 | 0.2% |
| Guatemala | 402 | 5.6% |
| Haiti | 8 | 0.1% |
| Latin America | 435 | 6.0% |
| Mexico | 4 | 0.1% |
| Pakistan | 36 | 0.5% |
| Russia | 24 | 0.3% |
| South America | 21 | 0.3% |
| South Central Asia | 36 | 0.5% |
| Ukraine | 8 | 0.1% |
| Western Europe | 12 | 0.2% | View All 18 Rows |
Sex and Age in Putnam
Sex and Age in Putnam
The most populous age groups in Putnam are 50 to 54 Years (389 | 11.9%) for men and 5 to 9 Years (429 | 10.9%) for women.
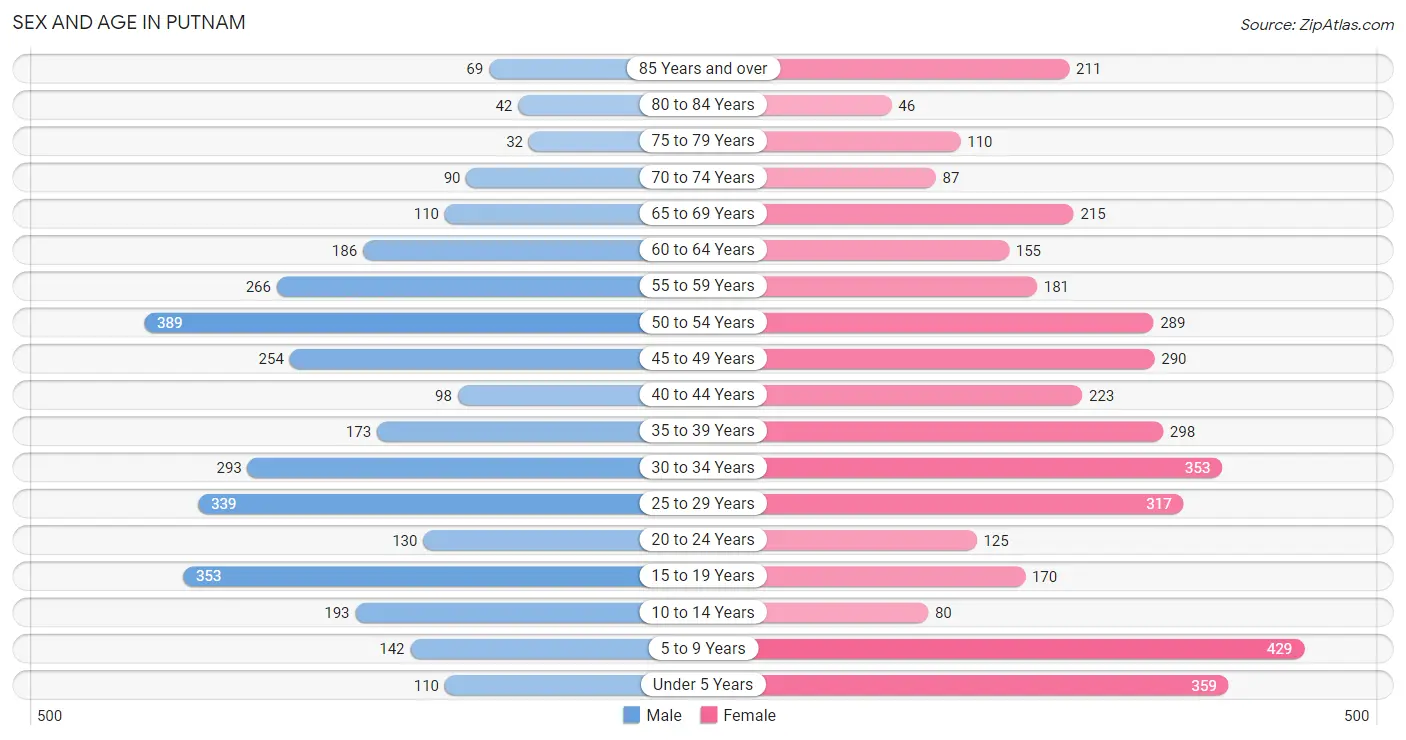
| Age Bracket | Male | Female |
| Under 5 Years | 110 (3.4%) | 359 (9.1%) |
| 5 to 9 Years | 142 (4.3%) | 429 (10.9%) |
| 10 to 14 Years | 193 (5.9%) | 80 (2.0%) |
| 15 to 19 Years | 353 (10.8%) | 170 (4.3%) |
| 20 to 24 Years | 130 (4.0%) | 125 (3.2%) |
| 25 to 29 Years | 339 (10.4%) | 317 (8.1%) |
| 30 to 34 Years | 293 (9.0%) | 353 (9.0%) |
| 35 to 39 Years | 173 (5.3%) | 298 (7.6%) |
| 40 to 44 Years | 98 (3.0%) | 223 (5.7%) |
| 45 to 49 Years | 254 (7.8%) | 290 (7.4%) |
| 50 to 54 Years | 389 (11.9%) | 289 (7.3%) |
| 55 to 59 Years | 266 (8.1%) | 181 (4.6%) |
| 60 to 64 Years | 186 (5.7%) | 155 (3.9%) |
| 65 to 69 Years | 110 (3.4%) | 215 (5.5%) |
| 70 to 74 Years | 90 (2.8%) | 87 (2.2%) |
| 75 to 79 Years | 32 (1.0%) | 110 (2.8%) |
| 80 to 84 Years | 42 (1.3%) | 46 (1.2%) |
| 85 Years and over | 69 (2.1%) | 211 (5.4%) |
| Total | 3,269 (100.0%) | 3,938 (100.0%) |
Families and Households in Putnam
Median Family Size in Putnam
The median family size in Putnam is 3.00 persons per family, with married-couple families (992 | 58.1%) accounting for the largest median family size of 3.2 persons per family. On the other hand, single male/father families (272 | 15.9%) represent the smallest median family size with 2.49 persons per family.
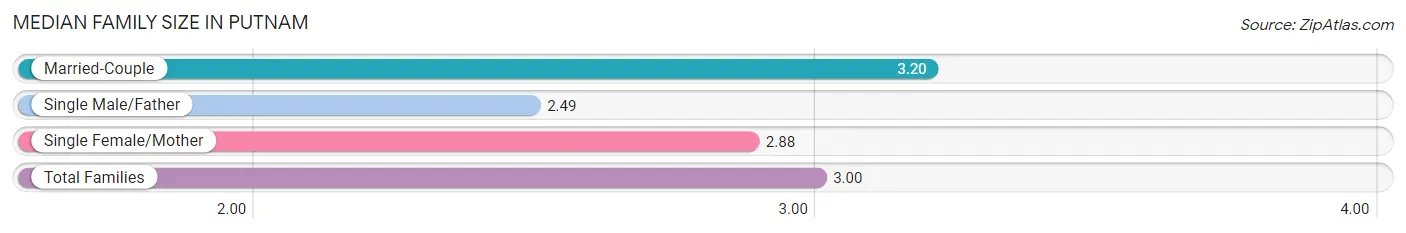
| Family Type | # Families | Family Size |
| Married-Couple | 992 (58.1%) | 3.20 |
| Single Male/Father | 272 (15.9%) | 2.49 |
| Single Female/Mother | 443 (26.0%) | 2.88 |
| Total Families | 1,707 (100.0%) | 3.00 |
Median Household Size in Putnam
The median household size in Putnam is 2.23 persons per household, with married-couple households (992 | 31.2%) accounting for the largest median household size of 3.21 persons per household. non-family households (1,476 | 46.4%) represent the smallest median household size with 1.21 persons per household.
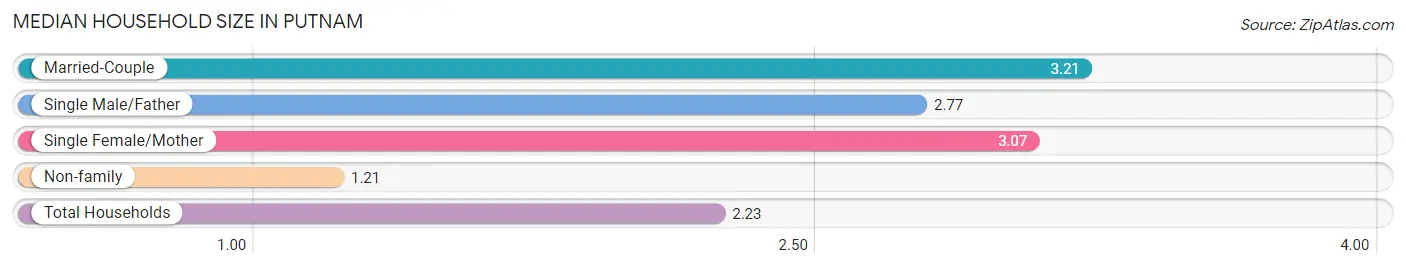
| Household Type | # Households | Household Size |
| Married-Couple | 992 (31.2%) | 3.21 |
| Single Male/Father | 272 (8.6%) | 2.77 |
| Single Female/Mother | 443 (13.9%) | 3.07 |
| Non-family | 1,476 (46.4%) | 1.21 |
| Total Households | 3,183 (100.0%) | 2.23 |
Household Size by Marriage Status in Putnam
Out of a total of 3,183 households in Putnam, 1,707 (53.6%) are family households, while 1,476 (46.4%) are nonfamily households. The most numerous type of family households are 3-person households, comprising 638, and the most common type of nonfamily households are 1-person households, comprising 1,186.
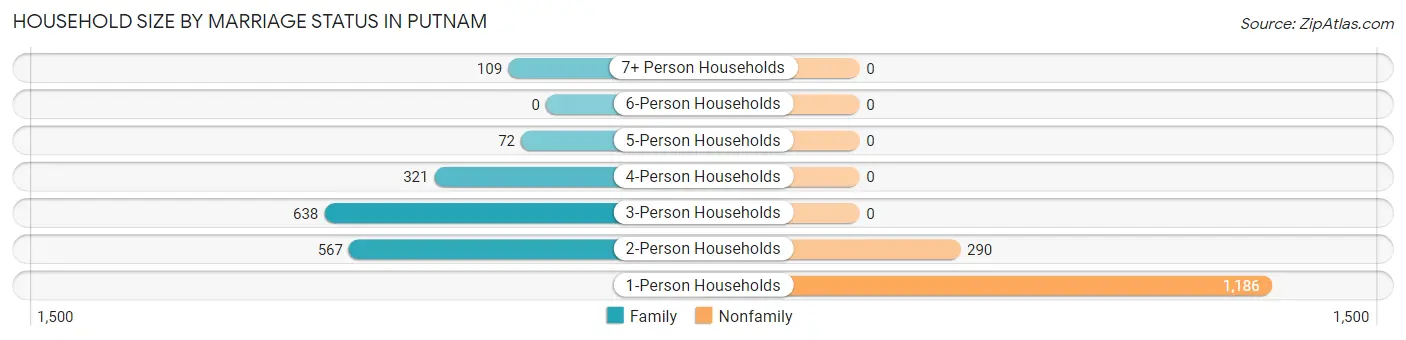
| Household Size | Family Households | Nonfamily Households |
| 1-Person Households | - | 1,186 (37.3%) |
| 2-Person Households | 567 (17.8%) | 290 (9.1%) |
| 3-Person Households | 638 (20.0%) | 0 (0.0%) |
| 4-Person Households | 321 (10.1%) | 0 (0.0%) |
| 5-Person Households | 72 (2.3%) | 0 (0.0%) |
| 6-Person Households | 0 (0.0%) | 0 (0.0%) |
| 7+ Person Households | 109 (3.4%) | 0 (0.0%) |
| Total | 1,707 (53.6%) | 1,476 (46.4%) |
Female Fertility in Putnam
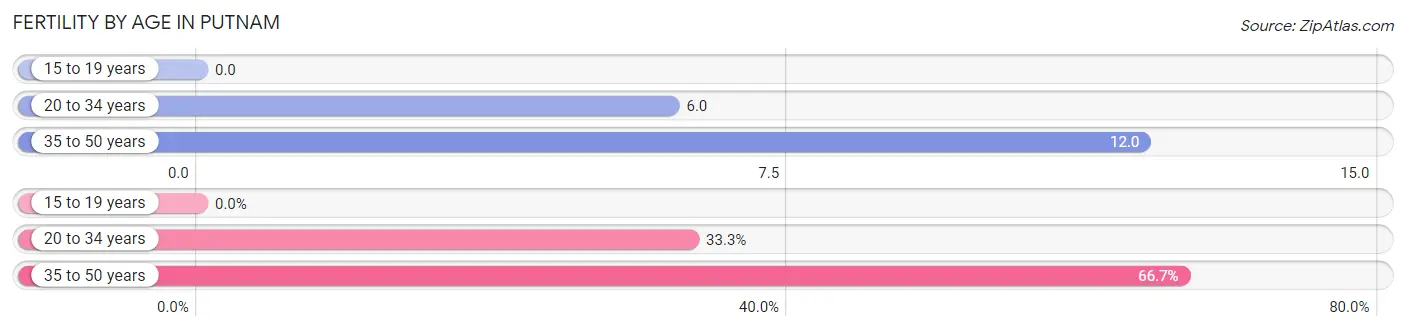
Fertility by Age in Putnam
Average fertility rate in Putnam is 8.0 births per 1,000 women. Women in the age bracket of 35 to 50 years have the highest fertility rate with 12.0 births per 1,000 women. Women in the age bracket of 35 to 50 years acount for 66.7% of all women with births.
| Age Bracket | Women with Births | Births / 1,000 Women |
| 15 to 19 years | 0 (0.0%) | 0.0 |
| 20 to 34 years | 5 (33.3%) | 6.0 |
| 35 to 50 years | 10 (66.7%) | 12.0 |
| Total | 15 (100.0%) | 8.0 |
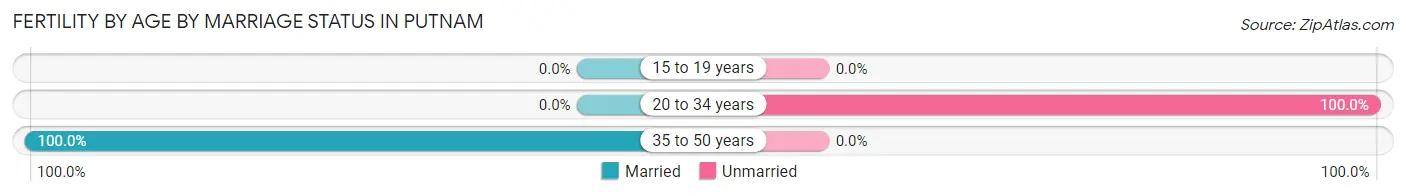
Fertility by Age by Marriage Status in Putnam
66.7% of women with births (15) in Putnam are married. The highest percentage of unmarried women with births falls into 20 to 34 years age bracket with 100.0% of them unmarried at the time of birth, while the lowest percentage of unmarried women with births belong to 35 to 50 years age bracket with 0.0% of them unmarried.
| Age Bracket | Married | Unmarried |
| 15 to 19 years | 0 (0.0%) | 0 (0.0%) |
| 20 to 34 years | 0 (0.0%) | 5 (100.0%) |
| 35 to 50 years | 10 (100.0%) | 0 (0.0%) |
| Total | 10 (66.7%) | 5 (33.3%) |
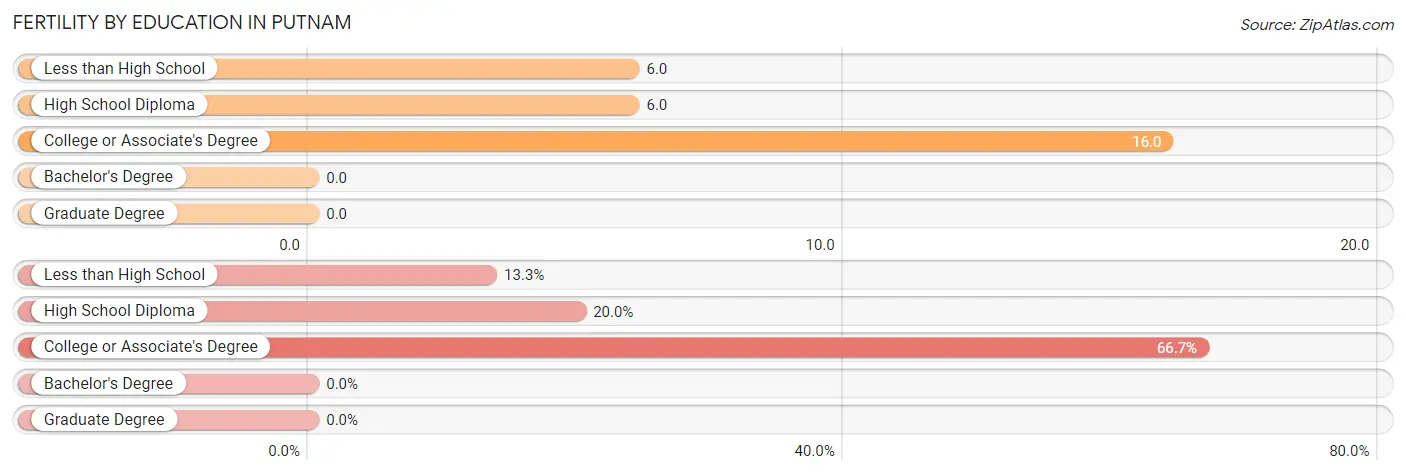
Fertility by Education in Putnam
| Educational Attainment | Women with Births | Births / 1,000 Women |
| Less than High School | 2 (13.3%) | 6.0 |
| High School Diploma | 3 (20.0%) | 6.0 |
| College or Associate's Degree | 10 (66.7%) | 16.0 |
| Bachelor's Degree | 0 (0.0%) | 0.0 |
| Graduate Degree | 0 (0.0%) | 0.0 |
| Total | 15 (100.0%) | 8.0 |
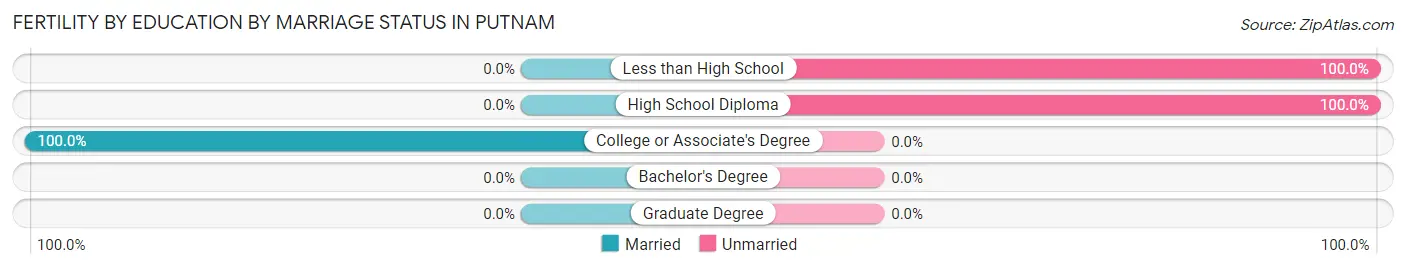
Fertility by Education by Marriage Status in Putnam
33.3% of women with births in Putnam are unmarried. Women with the educational attainment of college or associate's degree are most likely to be married with 100.0% of them married at childbirth, while women with the educational attainment of less than high school are least likely to be married with 100.0% of them unmarried at childbirth.
| Educational Attainment | Married | Unmarried |
| Less than High School | 0 (0.0%) | 2 (100.0%) |
| High School Diploma | 0 (0.0%) | 3 (100.0%) |
| College or Associate's Degree | 10 (100.0%) | 0 (0.0%) |
| Bachelor's Degree | 0 (0.0%) | 0 (0.0%) |
| Graduate Degree | 0 (0.0%) | 0 (0.0%) |
| Total | 10 (66.7%) | 5 (33.3%) |
Income in Putnam
Income Overview in Putnam
Per Capita Income in Putnam is $31,597, while median incomes of families and households are $80,880 and $60,539 respectively.
| Characteristic | Number | Measure |
| Per Capita Income | 7,207 | $31,597 |
| Median Family Income | 1,707 | $80,880 |
| Mean Family Income | 1,707 | $92,622 |
| Median Household Income | 3,183 | $60,539 |
| Mean Household Income | 3,183 | $71,479 |
| Income Deficit | 1,707 | $0 |
| Wage / Income Gap (%) | 7,207 | 2.21% |
| Wage / Income Gap ($) | 7,207 | 97.80¢ per $1 |
| Gini / Inequality Index | 7,207 | 0.43 |
Earnings by Sex in Putnam
Average Earnings in Putnam are $39,444, $39,118 for men and $40,000 for women, a difference of 2.2%.
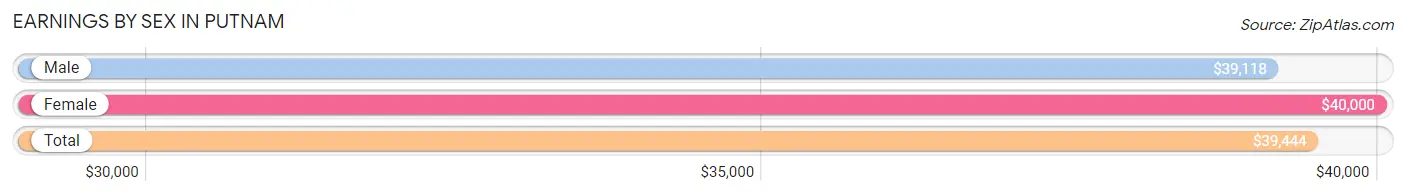
| Sex | Number | Average Earnings |
| Male | 2,154 (53.2%) | $39,118 |
| Female | 1,894 (46.8%) | $40,000 |
| Total | 4,048 (100.0%) | $39,444 |
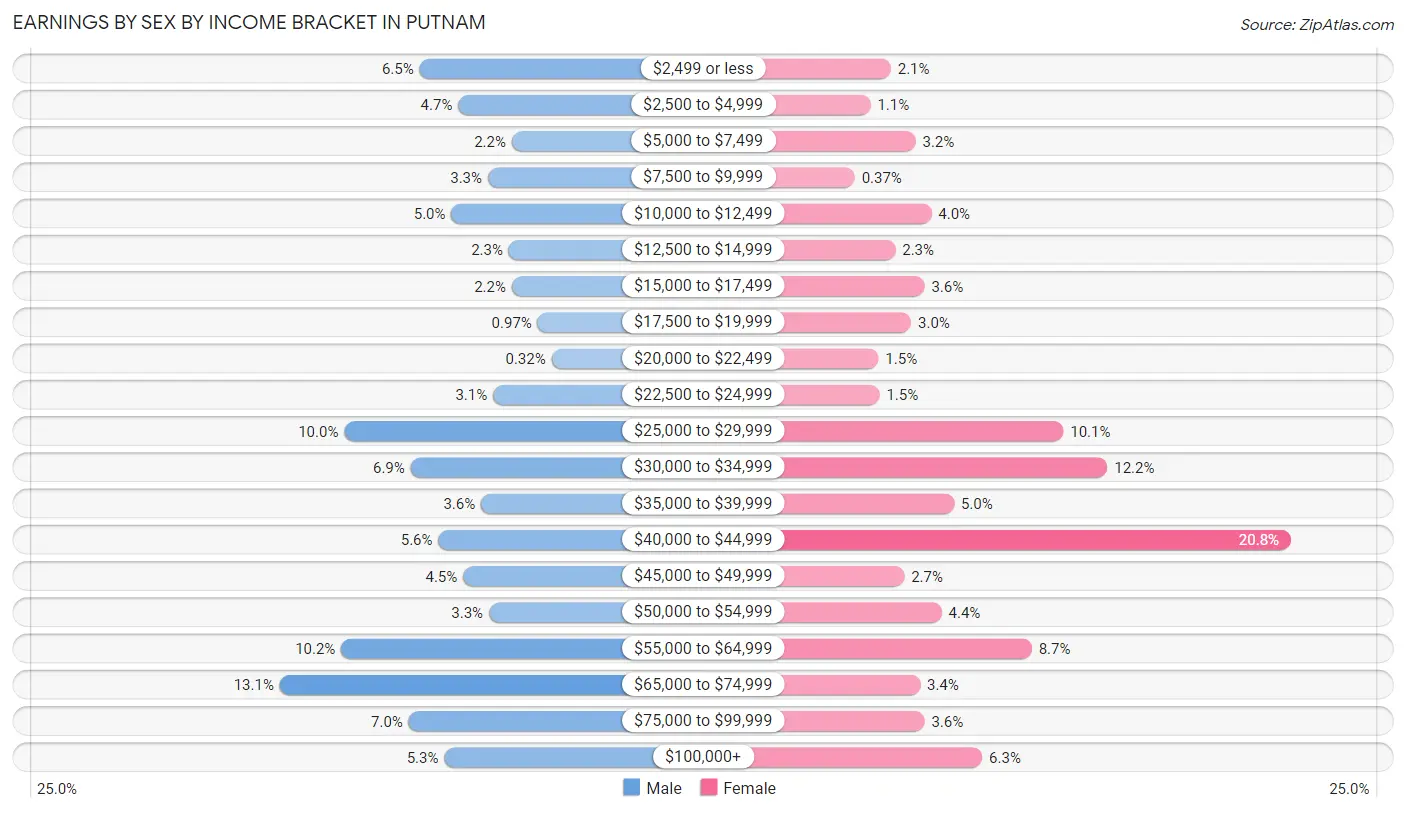
Earnings by Sex by Income Bracket in Putnam
The most common earnings brackets in Putnam are $65,000 to $74,999 for men (281 | 13.1%) and $40,000 to $44,999 for women (394 | 20.8%).
| Income | Male | Female |
| $2,499 or less | 140 (6.5%) | 39 (2.1%) |
| $2,500 to $4,999 | 101 (4.7%) | 21 (1.1%) |
| $5,000 to $7,499 | 47 (2.2%) | 61 (3.2%) |
| $7,500 to $9,999 | 71 (3.3%) | 7 (0.4%) |
| $10,000 to $12,499 | 108 (5.0%) | 75 (4.0%) |
| $12,500 to $14,999 | 50 (2.3%) | 43 (2.3%) |
| $15,000 to $17,499 | 47 (2.2%) | 69 (3.6%) |
| $17,500 to $19,999 | 21 (1.0%) | 57 (3.0%) |
| $20,000 to $22,499 | 7 (0.3%) | 28 (1.5%) |
| $22,500 to $24,999 | 66 (3.1%) | 29 (1.5%) |
| $25,000 to $29,999 | 216 (10.0%) | 192 (10.1%) |
| $30,000 to $34,999 | 149 (6.9%) | 231 (12.2%) |
| $35,000 to $39,999 | 78 (3.6%) | 95 (5.0%) |
| $40,000 to $44,999 | 121 (5.6%) | 394 (20.8%) |
| $45,000 to $49,999 | 96 (4.5%) | 51 (2.7%) |
| $50,000 to $54,999 | 70 (3.3%) | 84 (4.4%) |
| $55,000 to $64,999 | 219 (10.2%) | 164 (8.7%) |
| $65,000 to $74,999 | 281 (13.1%) | 65 (3.4%) |
| $75,000 to $99,999 | 151 (7.0%) | 69 (3.6%) |
| $100,000+ | 115 (5.3%) | 120 (6.3%) |
| Total | 2,154 (100.0%) | 1,894 (100.0%) |
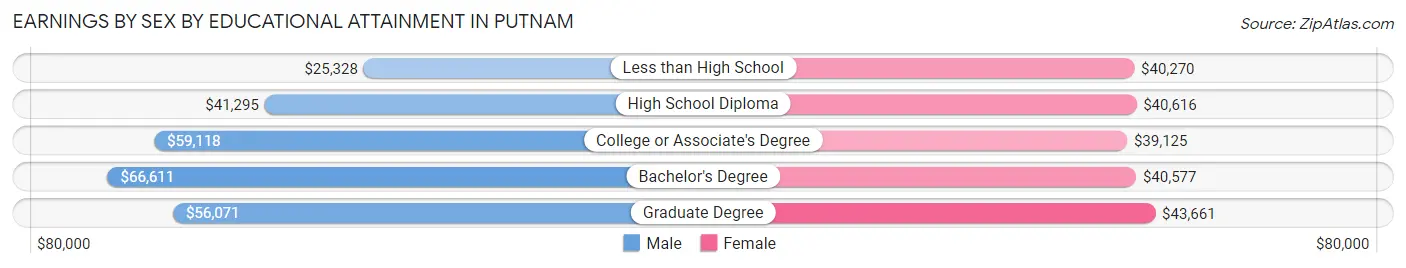
Earnings by Sex by Educational Attainment in Putnam
Average earnings in Putnam are $45,304 for men and $40,405 for women, a difference of 10.8%. Men with an educational attainment of bachelor's degree enjoy the highest average annual earnings of $66,611, while those with less than high school education earn the least with $25,328. Women with an educational attainment of graduate degree earn the most with the average annual earnings of $43,661, while those with college or associate's degree education have the smallest earnings of $39,125.
| Educational Attainment | Male Income | Female Income |
| Less than High School | $25,328 | $40,270 |
| High School Diploma | $41,295 | $40,616 |
| College or Associate's Degree | $59,118 | $39,125 |
| Bachelor's Degree | $66,611 | $40,577 |
| Graduate Degree | $56,071 | $43,661 |
| Total | $45,304 | $40,405 |
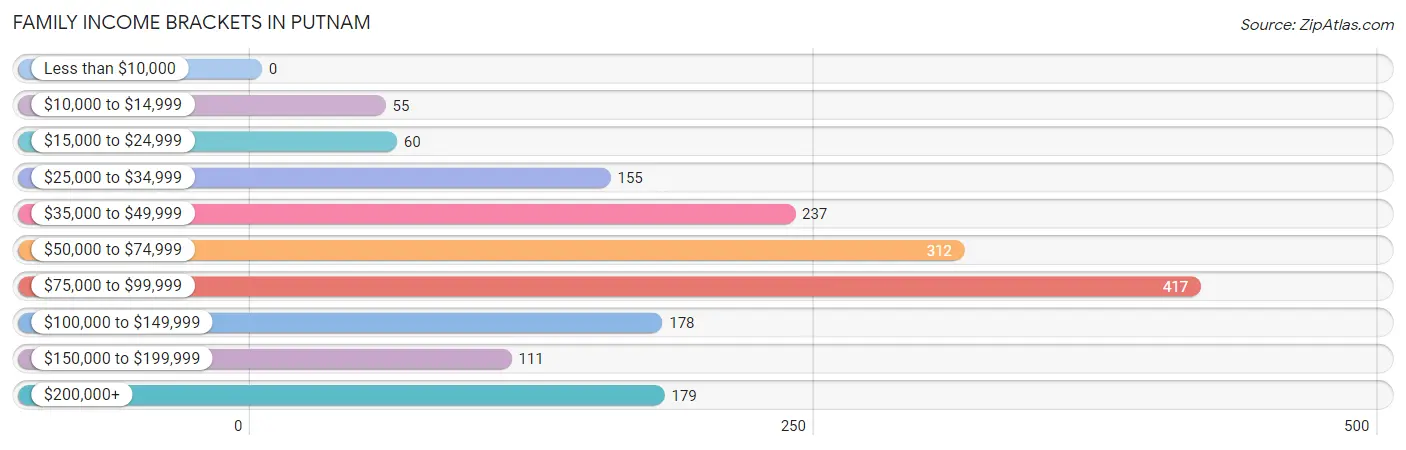
Family Income in Putnam
Family Income Brackets in Putnam
According to the Putnam family income data, there are 417 families falling into the $75,000 to $99,999 income range, which is the most common income bracket and makes up 24.4% of all families.
| Income Bracket | # Families | % Families |
| Less than $10,000 | 0 | 0.0% |
| $10,000 to $14,999 | 55 | 3.2% |
| $15,000 to $24,999 | 60 | 3.5% |
| $25,000 to $34,999 | 155 | 9.1% |
| $35,000 to $49,999 | 237 | 13.9% |
| $50,000 to $74,999 | 312 | 18.3% |
| $75,000 to $99,999 | 417 | 24.4% |
| $100,000 to $149,999 | 178 | 10.4% |
| $150,000 to $199,999 | 111 | 6.5% |
| $200,000+ | 179 | 10.5% |
Family Income by Famaliy Size in Putnam
5-person families (30 | 1.8%) account for the highest median family income in Putnam with $226,000 per family, while 5-person families (30 | 1.8%) have the highest median income of $45,200 per family member.
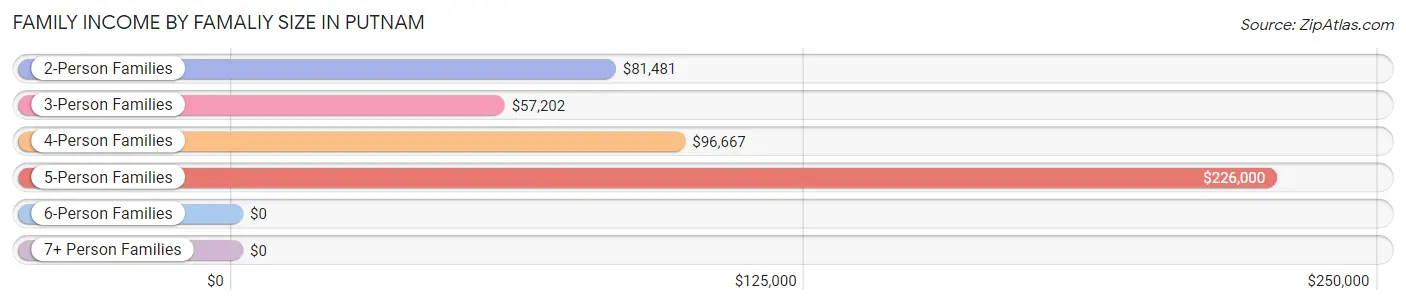
| Income Bracket | # Families | Median Income |
| 2-Person Families | 610 (35.7%) | $81,481 |
| 3-Person Families | 706 (41.4%) | $57,202 |
| 4-Person Families | 252 (14.8%) | $96,667 |
| 5-Person Families | 30 (1.8%) | $226,000 |
| 6-Person Families | 0 (0.0%) | $0 |
| 7+ Person Families | 109 (6.4%) | $0 |
| Total | 1,707 (100.0%) | $80,880 |
Family Income by Number of Earners in Putnam
The median family income in Putnam is $80,880, with families comprising 3+ earners (325) having the highest median family income of $138,750, while families with no earners (145) have the lowest median family income of $34,426, accounting for 19.0% and 8.5% of families, respectively.
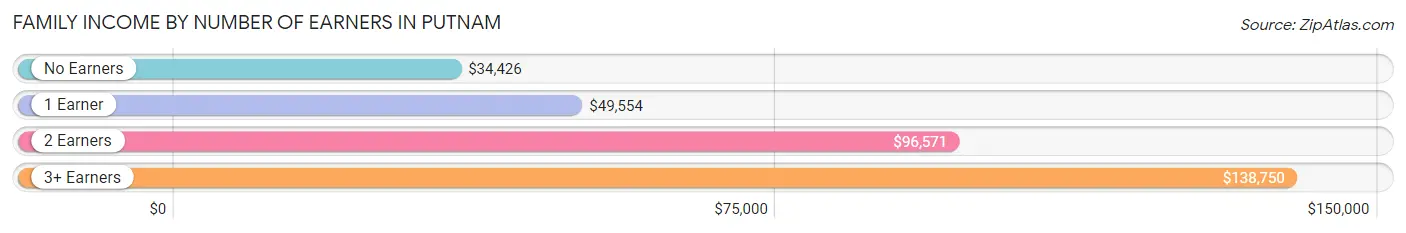
| Number of Earners | # Families | Median Income |
| No Earners | 145 (8.5%) | $34,426 |
| 1 Earner | 690 (40.4%) | $49,554 |
| 2 Earners | 547 (32.0%) | $96,571 |
| 3+ Earners | 325 (19.0%) | $138,750 |
| Total | 1,707 (100.0%) | $80,880 |
Household Income in Putnam
Household Income Brackets in Putnam
With 614 households falling in the category, the $50,000 to $74,999 income range is the most frequent in Putnam, accounting for 19.3% of all households. In contrast, only 86 households (2.7%) fall into the $10,000 to $14,999 income bracket, making it the least populous group.
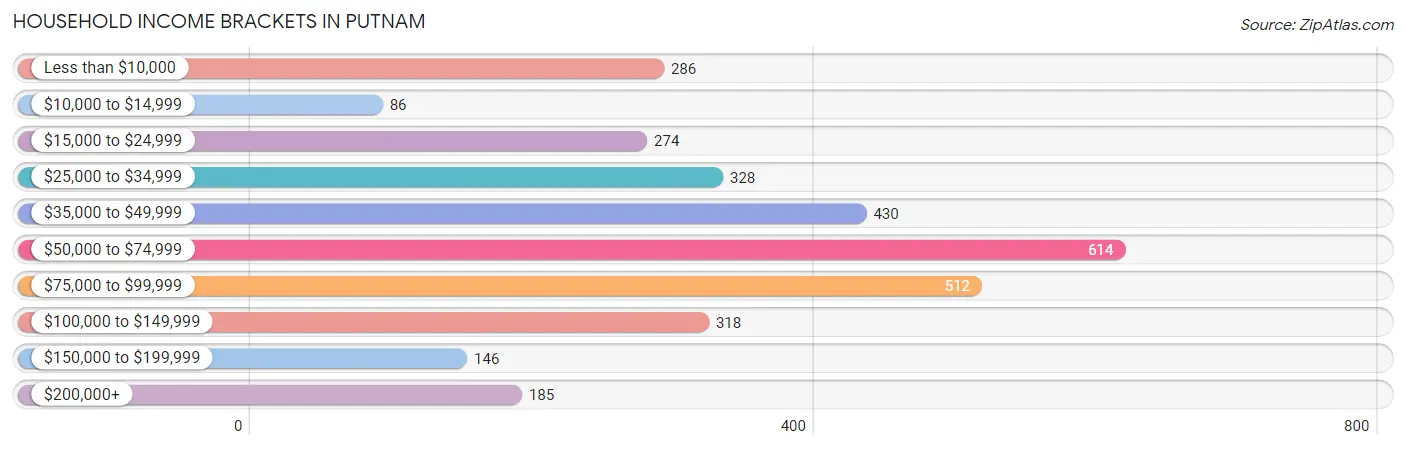
| Income Bracket | # Households | % Households |
| Less than $10,000 | 286 | 9.0% |
| $10,000 to $14,999 | 86 | 2.7% |
| $15,000 to $24,999 | 274 | 8.6% |
| $25,000 to $34,999 | 328 | 10.3% |
| $35,000 to $49,999 | 430 | 13.5% |
| $50,000 to $74,999 | 614 | 19.3% |
| $75,000 to $99,999 | 512 | 16.1% |
| $100,000 to $149,999 | 318 | 10.0% |
| $150,000 to $199,999 | 146 | 4.6% |
| $200,000+ | 185 | 5.8% |
Household Income by Householder Age in Putnam
The median household income in Putnam is $60,539, with the highest median household income of $89,191 found in the 45 to 64 years age bracket for the primary householder. A total of 1,265 households (39.7%) fall into this category. Meanwhile, the 15 to 24 years age bracket for the primary householder has the lowest median household income of $0, with 27 households (0.9%) in this group.
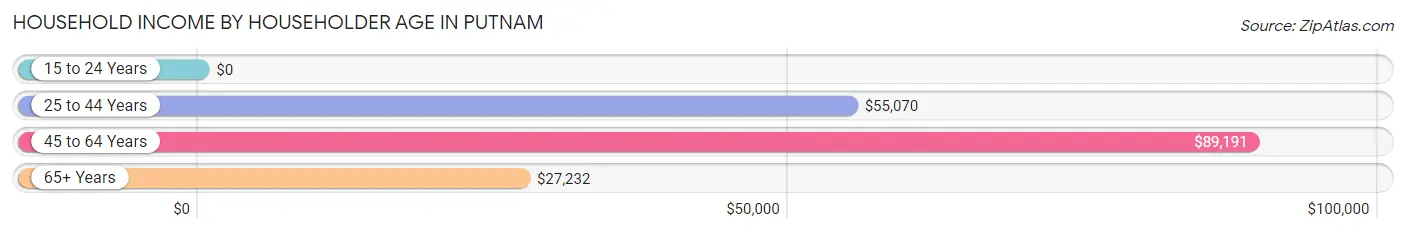
| Income Bracket | # Households | Median Income |
| 15 to 24 Years | 27 (0.9%) | $0 |
| 25 to 44 Years | 1,132 (35.6%) | $55,070 |
| 45 to 64 Years | 1,265 (39.7%) | $89,191 |
| 65+ Years | 759 (23.8%) | $27,232 |
| Total | 3,183 (100.0%) | $60,539 |
Poverty in Putnam
Income Below Poverty by Sex and Age in Putnam
With 8.1% poverty level for males and 12.8% for females among the residents of Putnam, under 5 year old males and 65 to 74 year old females are the most vulnerable to poverty, with 38 males (34.9%) and 126 females (41.7%) in their respective age groups living below the poverty level.
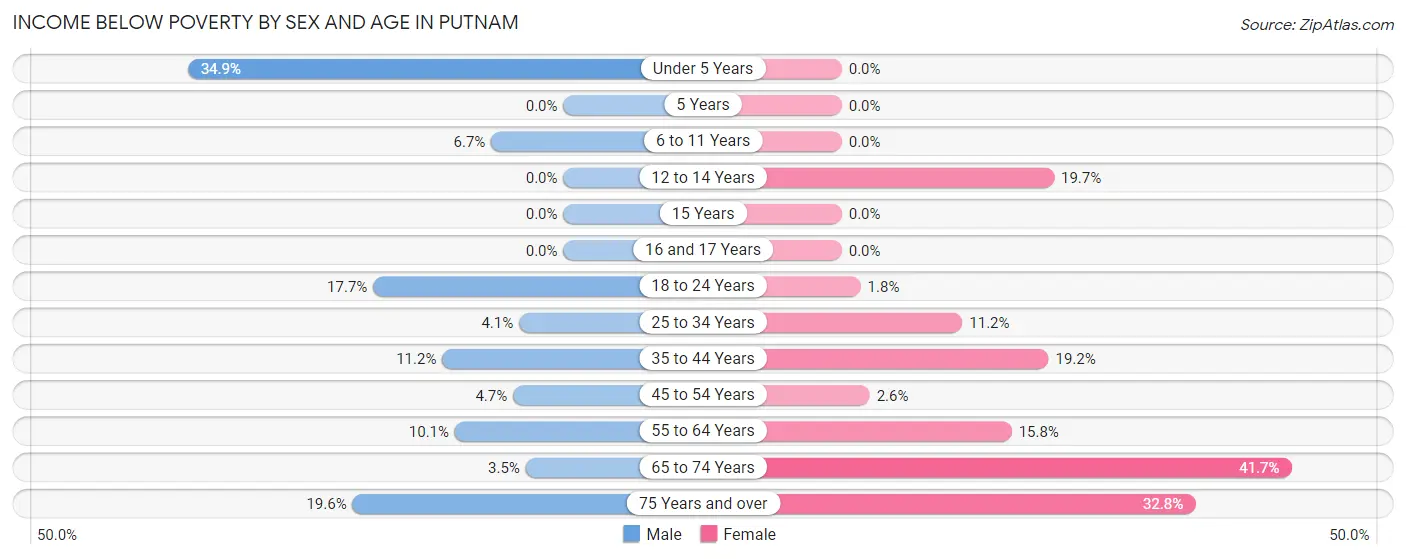
| Age Bracket | Male | Female |
| Under 5 Years | 38 (34.9%) | 0 (0.0%) |
| 5 Years | 0 (0.0%) | 0 (0.0%) |
| 6 to 11 Years | 13 (6.7%) | 0 (0.0%) |
| 12 to 14 Years | 0 (0.0%) | 13 (19.7%) |
| 15 Years | 0 (0.0%) | 0 (0.0%) |
| 16 and 17 Years | 0 (0.0%) | 0 (0.0%) |
| 18 to 24 Years | 45 (17.6%) | 4 (1.8%) |
| 25 to 34 Years | 26 (4.1%) | 75 (11.2%) |
| 35 to 44 Years | 30 (11.2%) | 100 (19.2%) |
| 45 to 54 Years | 30 (4.7%) | 15 (2.6%) |
| 55 to 64 Years | 45 (10.1%) | 53 (15.8%) |
| 65 to 74 Years | 7 (3.5%) | 126 (41.7%) |
| 75 Years and over | 27 (19.6%) | 119 (32.8%) |
| Total | 261 (8.1%) | 505 (12.8%) |
Income Above Poverty by Sex and Age in Putnam
According to the poverty statistics in Putnam, males aged 12 to 14 years and females aged under 5 years are the age groups that are most secure financially, with 100.0% of males and 100.0% of females in these age groups living above the poverty line.
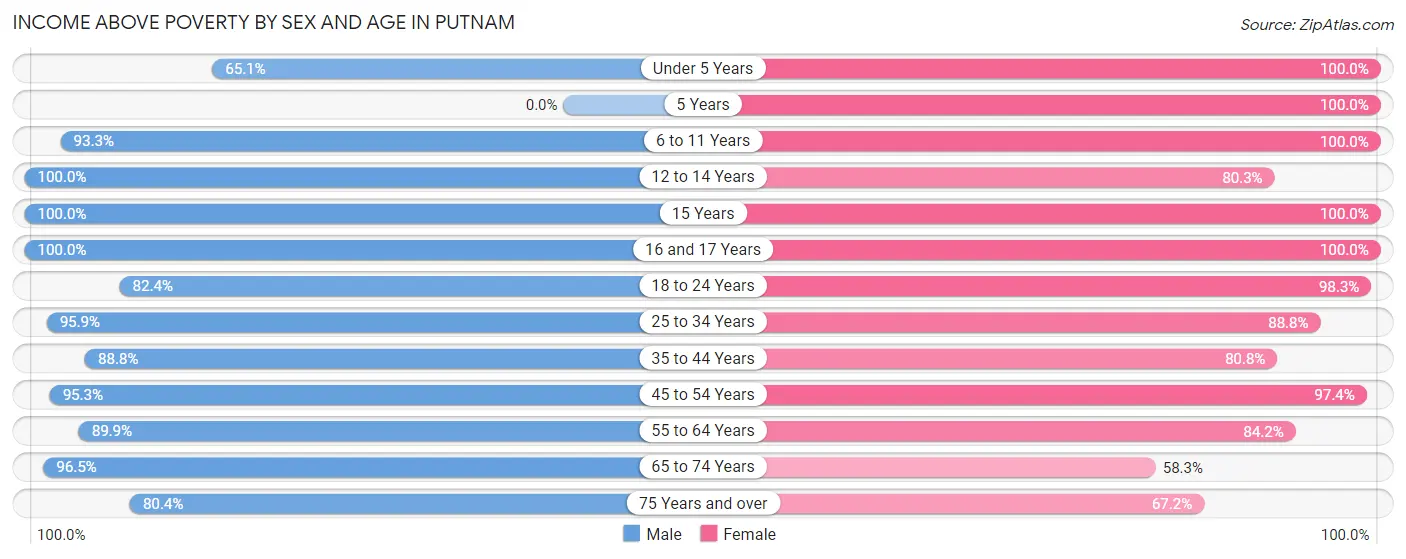
| Age Bracket | Male | Female |
| Under 5 Years | 71 (65.1%) | 359 (100.0%) |
| 5 Years | 0 (0.0%) | 76 (100.0%) |
| 6 to 11 Years | 181 (93.3%) | 367 (100.0%) |
| 12 to 14 Years | 141 (100.0%) | 53 (80.3%) |
| 15 Years | 21 (100.0%) | 28 (100.0%) |
| 16 and 17 Years | 165 (100.0%) | 38 (100.0%) |
| 18 to 24 Years | 210 (82.4%) | 225 (98.3%) |
| 25 to 34 Years | 606 (95.9%) | 595 (88.8%) |
| 35 to 44 Years | 237 (88.8%) | 421 (80.8%) |
| 45 to 54 Years | 612 (95.3%) | 564 (97.4%) |
| 55 to 64 Years | 402 (89.9%) | 283 (84.2%) |
| 65 to 74 Years | 193 (96.5%) | 176 (58.3%) |
| 75 Years and over | 111 (80.4%) | 244 (67.2%) |
| Total | 2,950 (91.9%) | 3,429 (87.2%) |
Income Below Poverty Among Married-Couple Families in Putnam
The poverty statistics for married-couple families in Putnam show that 5.0% or 50 of the total 992 families live below the poverty line. Families with no children have the highest poverty rate of 6.3%, comprising of 32 families. On the other hand, families with 3 or 4 children have the lowest poverty rate of 0.0%, which includes 0 families.
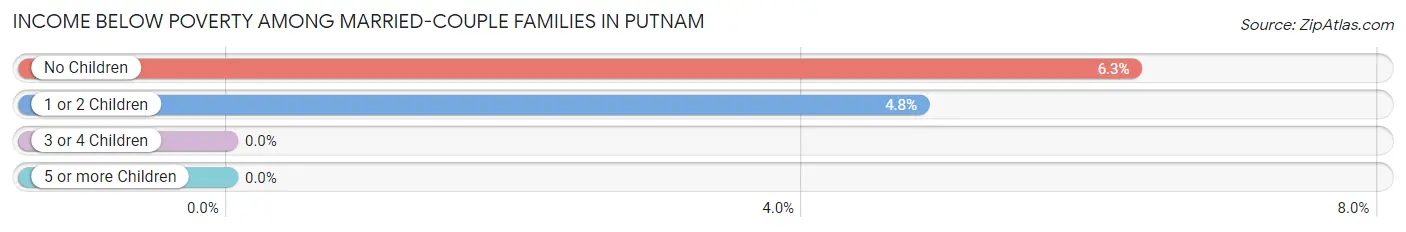
| Children | Above Poverty | Below Poverty |
| No Children | 477 (93.7%) | 32 (6.3%) |
| 1 or 2 Children | 356 (95.2%) | 18 (4.8%) |
| 3 or 4 Children | 109 (100.0%) | 0 (0.0%) |
| 5 or more Children | 0 (0.0%) | 0 (0.0%) |
| Total | 942 (95.0%) | 50 (5.0%) |
Income Below Poverty Among Single-Parent Households in Putnam
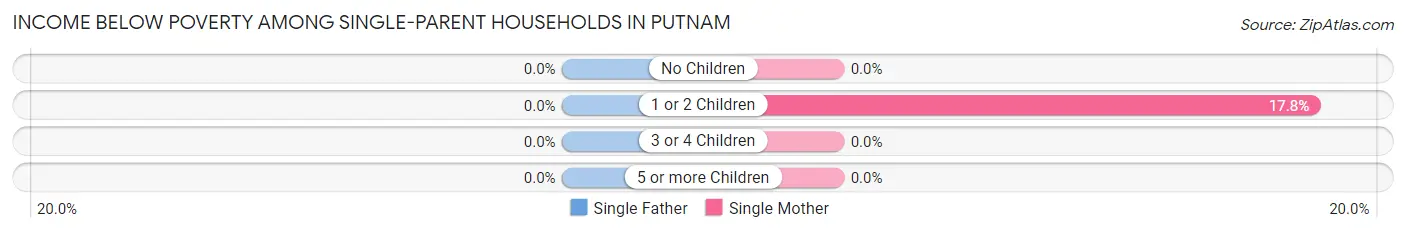
| Children | Single Father | Single Mother |
| No Children | 0 (0.0%) | 0 (0.0%) |
| 1 or 2 Children | 0 (0.0%) | 48 (17.8%) |
| 3 or 4 Children | 0 (0.0%) | 0 (0.0%) |
| 5 or more Children | 0 (0.0%) | 0 (0.0%) |
| Total | 0 (0.0%) | 48 (10.8%) |
Income Below Poverty Among Married-Couple vs Single-Parent Households in Putnam
The poverty data for Putnam shows that 50 of the married-couple family households (5.0%) and 48 of the single-parent households (6.7%) are living below the poverty level. Within the married-couple family households, those with no children have the highest poverty rate, with 32 households (6.3%) falling below the poverty line. Among the single-parent households, those with 1 or 2 children have the highest poverty rate, with 48 household (12.5%) living below poverty.
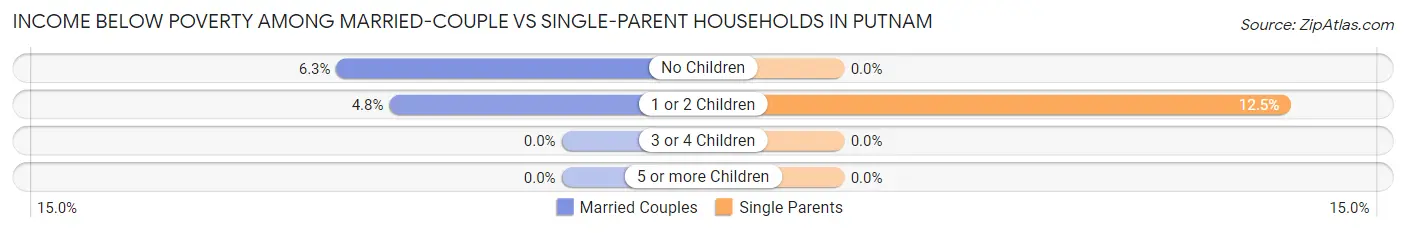
| Children | Married-Couple Families | Single-Parent Households |
| No Children | 32 (6.3%) | 0 (0.0%) |
| 1 or 2 Children | 18 (4.8%) | 48 (12.5%) |
| 3 or 4 Children | 0 (0.0%) | 0 (0.0%) |
| 5 or more Children | 0 (0.0%) | 0 (0.0%) |
| Total | 50 (5.0%) | 48 (6.7%) |
Employment Characteristics in Putnam
Employment by Class of Employer in Putnam
Among the 3,496 employed individuals in Putnam, private company employees (2,549 | 72.9%), not-for-profit organizations (407 | 11.6%), and local government employees (172 | 4.9%) make up the most common classes of employment.
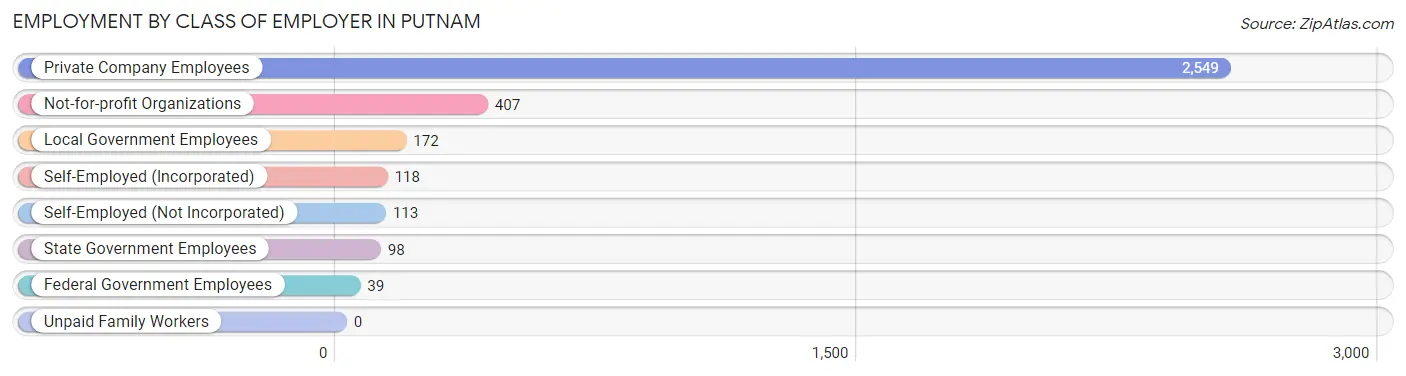
| Employer Class | # Employees | % Employees |
| Private Company Employees | 2,549 | 72.9% |
| Self-Employed (Incorporated) | 118 | 3.4% |
| Self-Employed (Not Incorporated) | 113 | 3.2% |
| Not-for-profit Organizations | 407 | 11.6% |
| Local Government Employees | 172 | 4.9% |
| State Government Employees | 98 | 2.8% |
| Federal Government Employees | 39 | 1.1% |
| Unpaid Family Workers | 0 | 0.0% |
| Total | 3,496 | 100.0% |
Employment Status by Age in Putnam
According to the labor force statistics for Putnam, out of the total population over 16 years of age (5,845), 66.2% or 3,869 individuals are in the labor force, with 5.4% or 209 of them unemployed. The age group with the highest labor force participation rate is 25 to 29 years, with 91.9% or 603 individuals in the labor force. Within the labor force, the 20 to 24 years age range has the highest percentage of unemployed individuals, with 10.8% or 19 of them being unemployed.
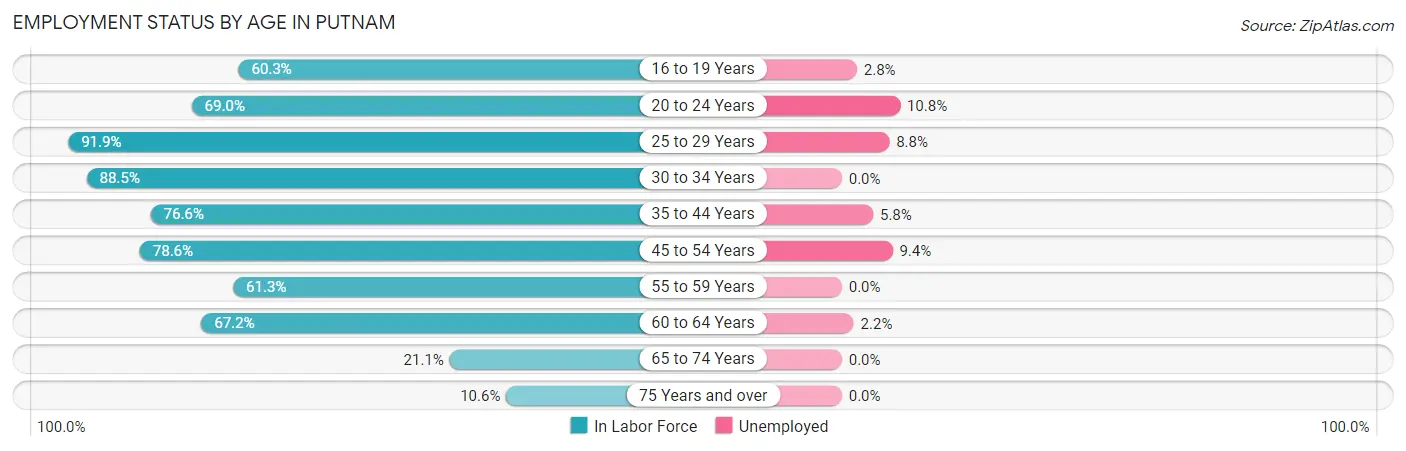
| Age Bracket | In Labor Force | Unemployed |
| 16 to 19 Years | 286 (60.3%) | 8 (2.8%) |
| 20 to 24 Years | 176 (69.0%) | 19 (10.8%) |
| 25 to 29 Years | 603 (91.9%) | 53 (8.8%) |
| 30 to 34 Years | 572 (88.5%) | 0 (0.0%) |
| 35 to 44 Years | 607 (76.6%) | 35 (5.8%) |
| 45 to 54 Years | 960 (78.6%) | 90 (9.4%) |
| 55 to 59 Years | 274 (61.3%) | 0 (0.0%) |
| 60 to 64 Years | 229 (67.2%) | 5 (2.2%) |
| 65 to 74 Years | 106 (21.1%) | 0 (0.0%) |
| 75 Years and over | 54 (10.6%) | 0 (0.0%) |
| Total | 3,869 (66.2%) | 209 (5.4%) |
Employment Status by Educational Attainment in Putnam
According to labor force statistics for Putnam, 79.1% of individuals (3,246) out of the total population between 25 and 64 years of age (4,104) are in the labor force, with 5.6% or 182 of them being unemployed. The group with the highest labor force participation rate are those with the educational attainment of college / associate degree, with 88.0% or 1,237 individuals in the labor force. Within the labor force, individuals with less than high school education have the highest percentage of unemployment, with 15.8% or 80 of them being unemployed.
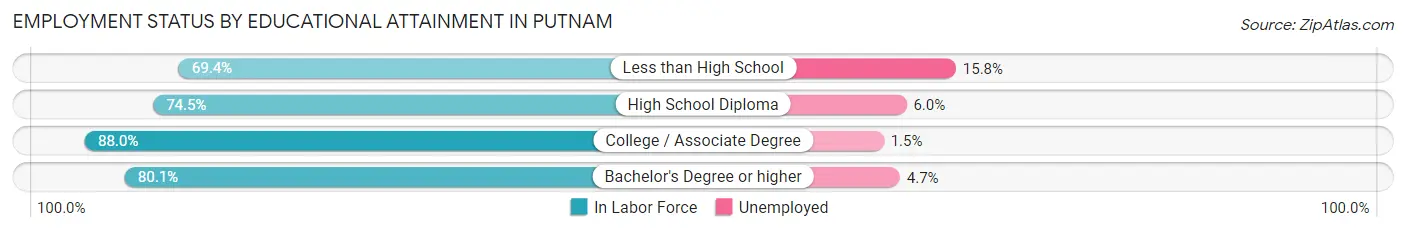
| Educational Attainment | In Labor Force | Unemployed |
| Less than High School | 506 (69.4%) | 115 (15.8%) |
| High School Diploma | 992 (74.5%) | 80 (6.0%) |
| College / Associate Degree | 1,237 (88.0%) | 21 (1.5%) |
| Bachelor's Degree or higher | 511 (80.1%) | 30 (4.7%) |
| Total | 3,246 (79.1%) | 230 (5.6%) |
Employment Occupations by Sex in Putnam
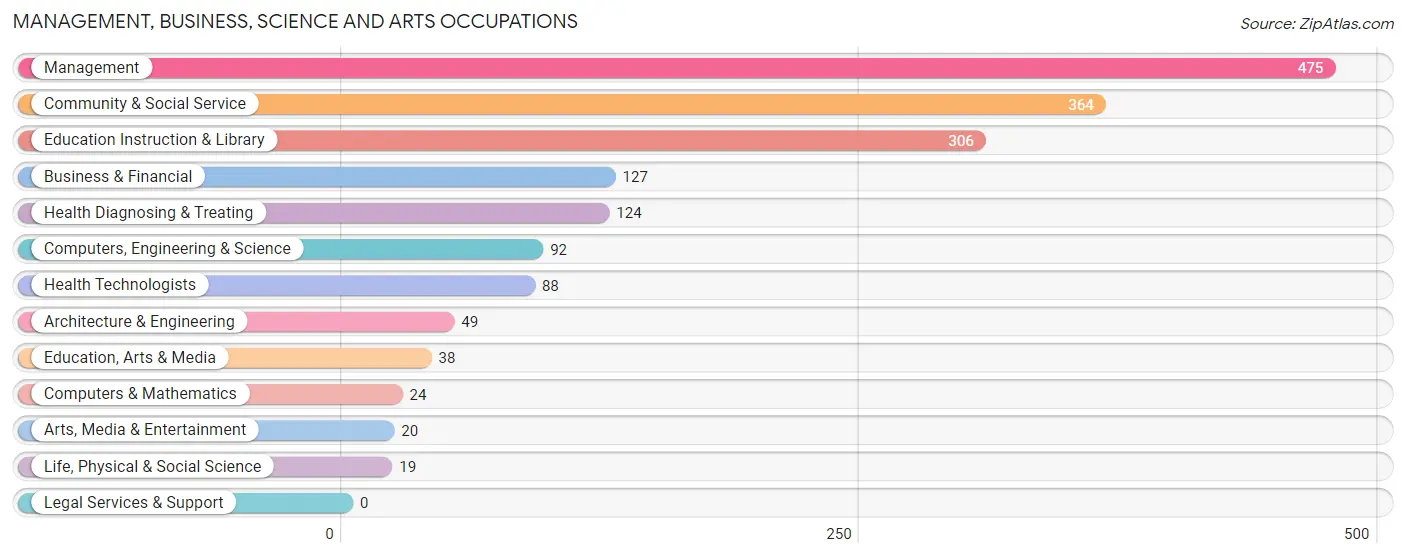
Management, Business, Science and Arts Occupations
The most common Management, Business, Science and Arts occupations in Putnam are Management (475 | 13.0%), Community & Social Service (364 | 10.0%), Education Instruction & Library (306 | 8.4%), Business & Financial (127 | 3.5%), and Health Diagnosing & Treating (124 | 3.4%).
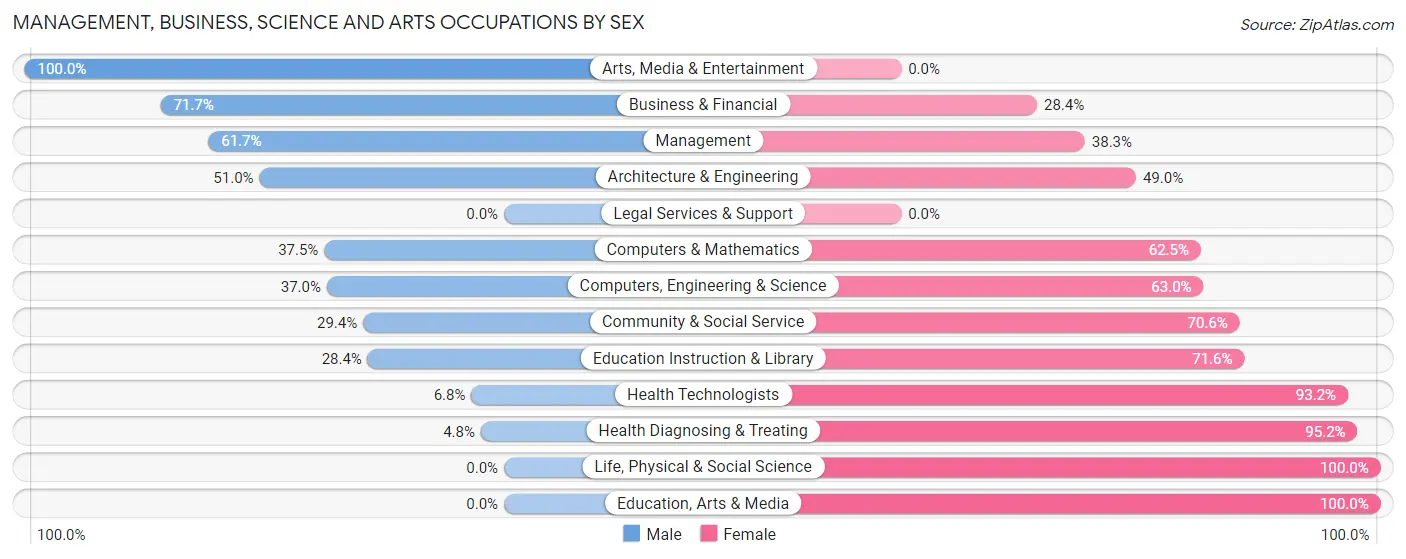
Management, Business, Science and Arts Occupations by Sex
Within the Management, Business, Science and Arts occupations in Putnam, the most male-oriented occupations are Arts, Media & Entertainment (100.0%), Business & Financial (71.7%), and Management (61.7%), while the most female-oriented occupations are Life, Physical & Social Science (100.0%), Education, Arts & Media (100.0%), and Health Diagnosing & Treating (95.2%).
| Occupation | Male | Female |
| Management | 293 (61.7%) | 182 (38.3%) |
| Business & Financial | 91 (71.7%) | 36 (28.3%) |
| Computers, Engineering & Science | 34 (37.0%) | 58 (63.0%) |
| Computers & Mathematics | 9 (37.5%) | 15 (62.5%) |
| Architecture & Engineering | 25 (51.0%) | 24 (49.0%) |
| Life, Physical & Social Science | 0 (0.0%) | 19 (100.0%) |
| Community & Social Service | 107 (29.4%) | 257 (70.6%) |
| Education, Arts & Media | 0 (0.0%) | 38 (100.0%) |
| Legal Services & Support | 0 (0.0%) | 0 (0.0%) |
| Education Instruction & Library | 87 (28.4%) | 219 (71.6%) |
| Arts, Media & Entertainment | 20 (100.0%) | 0 (0.0%) |
| Health Diagnosing & Treating | 6 (4.8%) | 118 (95.2%) |
| Health Technologists | 6 (6.8%) | 82 (93.2%) |
| Total (Category) | 531 (44.9%) | 651 (55.1%) |
| Total (Overall) | 1,890 (51.7%) | 1,768 (48.3%) |
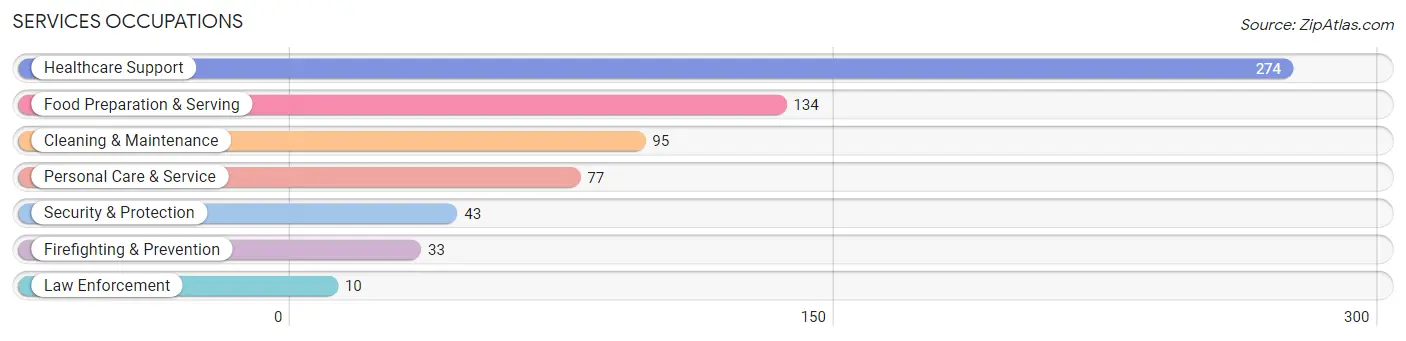
Services Occupations
The most common Services occupations in Putnam are Healthcare Support (274 | 7.5%), Food Preparation & Serving (134 | 3.7%), Cleaning & Maintenance (95 | 2.6%), Personal Care & Service (77 | 2.1%), and Security & Protection (43 | 1.2%).
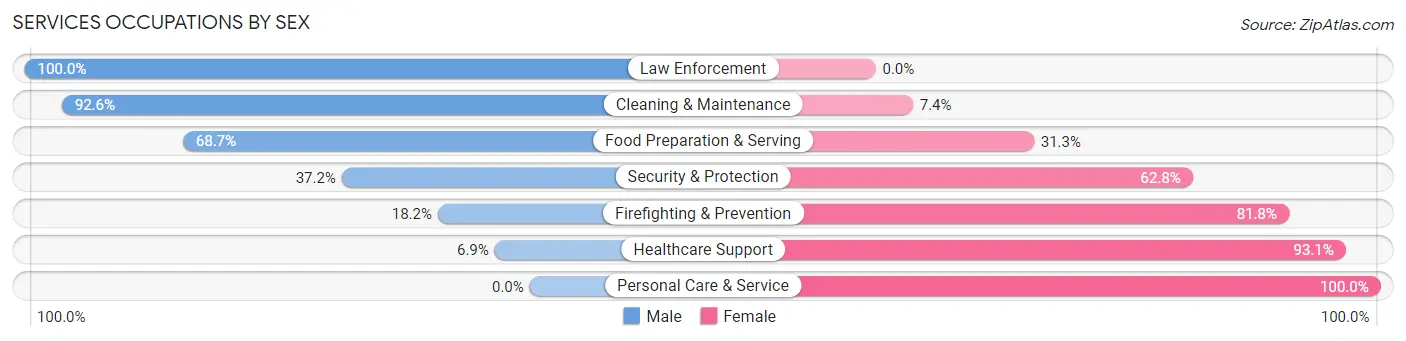
Services Occupations by Sex
Within the Services occupations in Putnam, the most male-oriented occupations are Law Enforcement (100.0%), Cleaning & Maintenance (92.6%), and Food Preparation & Serving (68.7%), while the most female-oriented occupations are Personal Care & Service (100.0%), Healthcare Support (93.1%), and Firefighting & Prevention (81.8%).
| Occupation | Male | Female |
| Healthcare Support | 19 (6.9%) | 255 (93.1%) |
| Security & Protection | 16 (37.2%) | 27 (62.8%) |
| Firefighting & Prevention | 6 (18.2%) | 27 (81.8%) |
| Law Enforcement | 10 (100.0%) | 0 (0.0%) |
| Food Preparation & Serving | 92 (68.7%) | 42 (31.3%) |
| Cleaning & Maintenance | 88 (92.6%) | 7 (7.4%) |
| Personal Care & Service | 0 (0.0%) | 77 (100.0%) |
| Total (Category) | 215 (34.5%) | 408 (65.5%) |
| Total (Overall) | 1,890 (51.7%) | 1,768 (48.3%) |
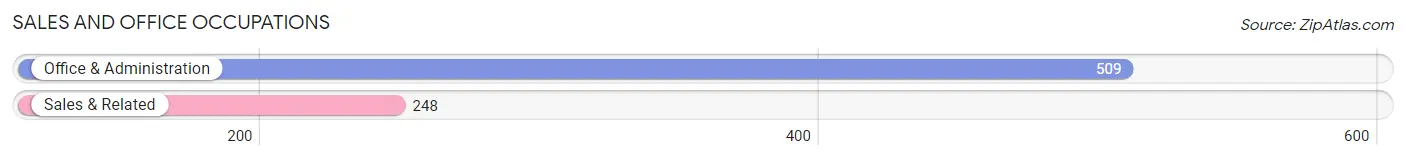
Sales and Office Occupations
The most common Sales and Office occupations in Putnam are Office & Administration (509 | 13.9%), and Sales & Related (248 | 6.8%).
Sales and Office Occupations by Sex
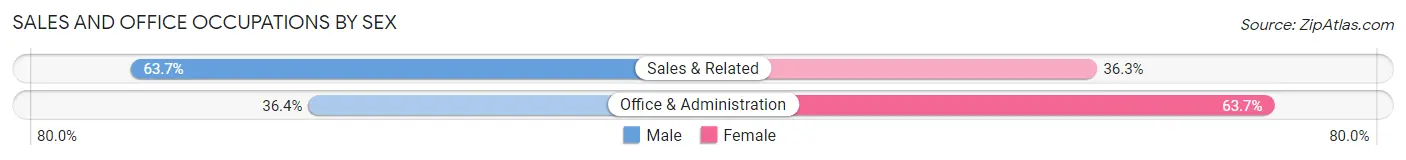
| Occupation | Male | Female |
| Sales & Related | 158 (63.7%) | 90 (36.3%) |
| Office & Administration | 185 (36.3%) | 324 (63.6%) |
| Total (Category) | 343 (45.3%) | 414 (54.7%) |
| Total (Overall) | 1,890 (51.7%) | 1,768 (48.3%) |
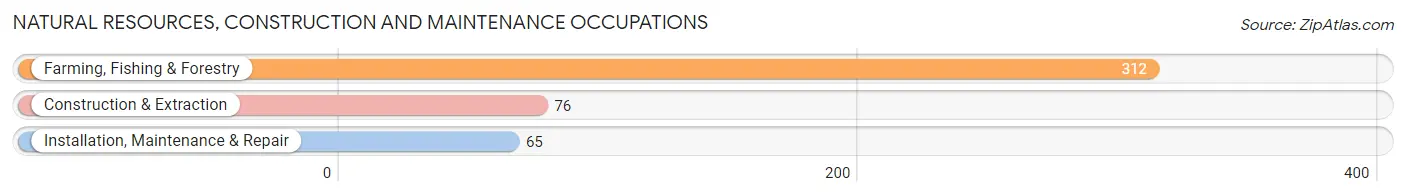
Natural Resources, Construction and Maintenance Occupations
The most common Natural Resources, Construction and Maintenance occupations in Putnam are Farming, Fishing & Forestry (312 | 8.5%), Construction & Extraction (76 | 2.1%), and Installation, Maintenance & Repair (65 | 1.8%).
Natural Resources, Construction and Maintenance Occupations by Sex
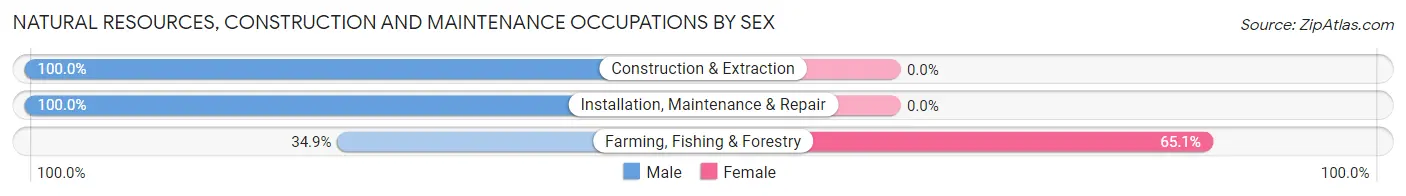
| Occupation | Male | Female |
| Farming, Fishing & Forestry | 109 (34.9%) | 203 (65.1%) |
| Construction & Extraction | 76 (100.0%) | 0 (0.0%) |
| Installation, Maintenance & Repair | 65 (100.0%) | 0 (0.0%) |
| Total (Category) | 250 (55.2%) | 203 (44.8%) |
| Total (Overall) | 1,890 (51.7%) | 1,768 (48.3%) |
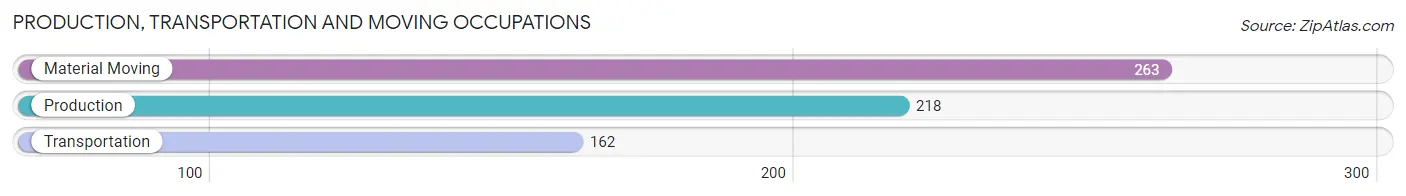
Production, Transportation and Moving Occupations
The most common Production, Transportation and Moving occupations in Putnam are Material Moving (263 | 7.2%), Production (218 | 6.0%), and Transportation (162 | 4.4%).
Production, Transportation and Moving Occupations by Sex
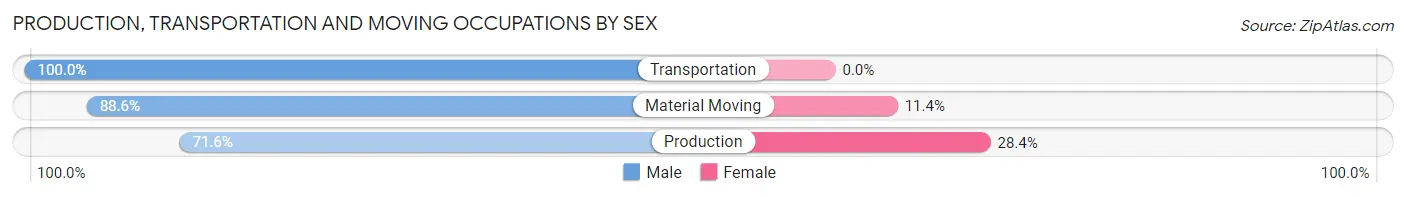
| Occupation | Male | Female |
| Production | 156 (71.6%) | 62 (28.4%) |
| Transportation | 162 (100.0%) | 0 (0.0%) |
| Material Moving | 233 (88.6%) | 30 (11.4%) |
| Total (Category) | 551 (85.7%) | 92 (14.3%) |
| Total (Overall) | 1,890 (51.7%) | 1,768 (48.3%) |
Employment Industries by Sex in Putnam
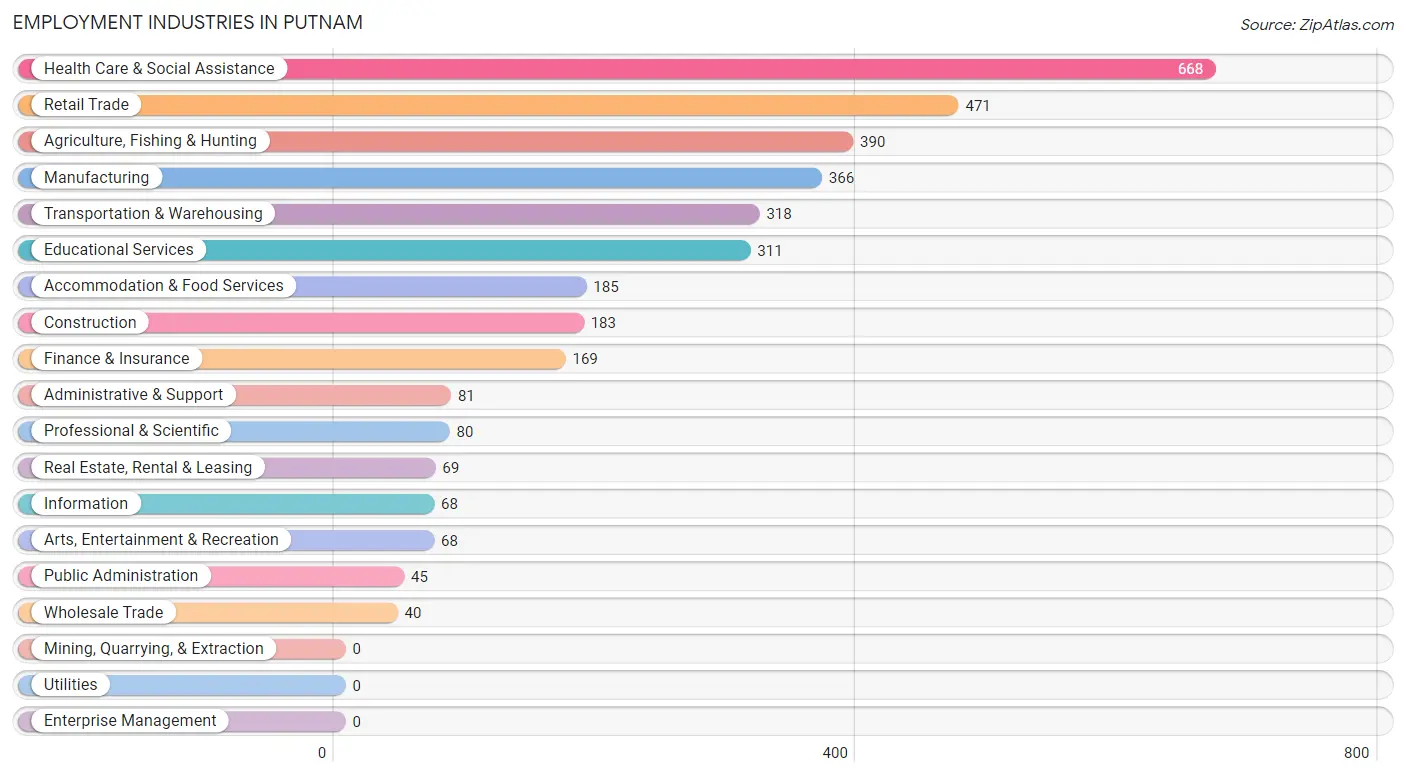
Employment Industries in Putnam
The major employment industries in Putnam include Health Care & Social Assistance (668 | 18.3%), Retail Trade (471 | 12.9%), Agriculture, Fishing & Hunting (390 | 10.7%), Manufacturing (366 | 10.0%), and Transportation & Warehousing (318 | 8.7%).
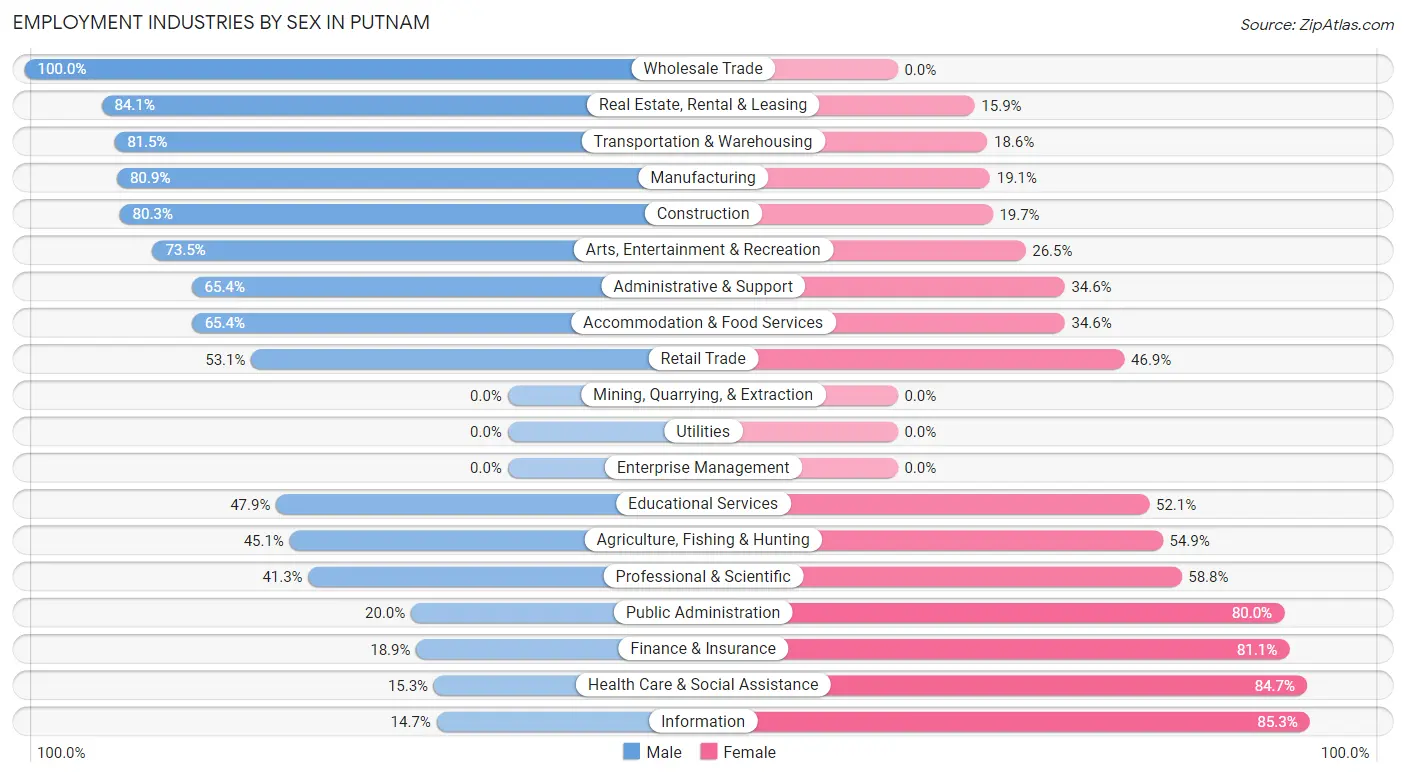
Employment Industries by Sex in Putnam
The Putnam industries that see more men than women are Wholesale Trade (100.0%), Real Estate, Rental & Leasing (84.1%), and Transportation & Warehousing (81.5%), whereas the industries that tend to have a higher number of women are Information (85.3%), Health Care & Social Assistance (84.7%), and Finance & Insurance (81.1%).
| Industry | Male | Female |
| Agriculture, Fishing & Hunting | 176 (45.1%) | 214 (54.9%) |
| Mining, Quarrying, & Extraction | 0 (0.0%) | 0 (0.0%) |
| Construction | 147 (80.3%) | 36 (19.7%) |
| Manufacturing | 296 (80.9%) | 70 (19.1%) |
| Wholesale Trade | 40 (100.0%) | 0 (0.0%) |
| Retail Trade | 250 (53.1%) | 221 (46.9%) |
| Transportation & Warehousing | 259 (81.5%) | 59 (18.5%) |
| Utilities | 0 (0.0%) | 0 (0.0%) |
| Information | 10 (14.7%) | 58 (85.3%) |
| Finance & Insurance | 32 (18.9%) | 137 (81.1%) |
| Real Estate, Rental & Leasing | 58 (84.1%) | 11 (15.9%) |
| Professional & Scientific | 33 (41.2%) | 47 (58.8%) |
| Enterprise Management | 0 (0.0%) | 0 (0.0%) |
| Administrative & Support | 53 (65.4%) | 28 (34.6%) |
| Educational Services | 149 (47.9%) | 162 (52.1%) |
| Health Care & Social Assistance | 102 (15.3%) | 566 (84.7%) |
| Arts, Entertainment & Recreation | 50 (73.5%) | 18 (26.5%) |
| Accommodation & Food Services | 121 (65.4%) | 64 (34.6%) |
| Public Administration | 9 (20.0%) | 36 (80.0%) |
| Total | 1,890 (51.7%) | 1,768 (48.3%) |
Education in Putnam
School Enrollment in Putnam
The most common levels of schooling among the 1,387 students in Putnam are elementary school (495 | 35.7%), high school (312 | 22.5%), and middle school (253 | 18.2%).
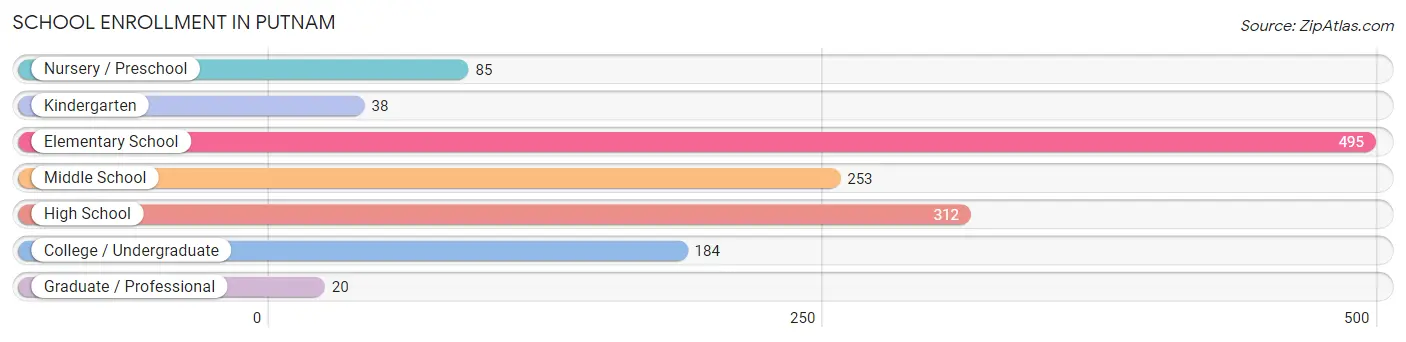
| School Level | # Students | % Students |
| Nursery / Preschool | 85 | 6.1% |
| Kindergarten | 38 | 2.7% |
| Elementary School | 495 | 35.7% |
| Middle School | 253 | 18.2% |
| High School | 312 | 22.5% |
| College / Undergraduate | 184 | 13.3% |
| Graduate / Professional | 20 | 1.4% |
| Total | 1,387 | 100.0% |
School Enrollment by Age by Funding Source in Putnam
Out of a total of 1,387 students who are enrolled in schools in Putnam, 160 (11.5%) attend a private institution, while the remaining 1,227 (88.5%) are enrolled in public schools. The age group of 18 to 19 year olds has the highest likelihood of being enrolled in private schools, with 24 (24.5% in the age bracket) enrolled. Conversely, the age group of 3 to 4 year olds has the lowest likelihood of being enrolled in a private school, with 85 (100.0% in the age bracket) attending a public institution.
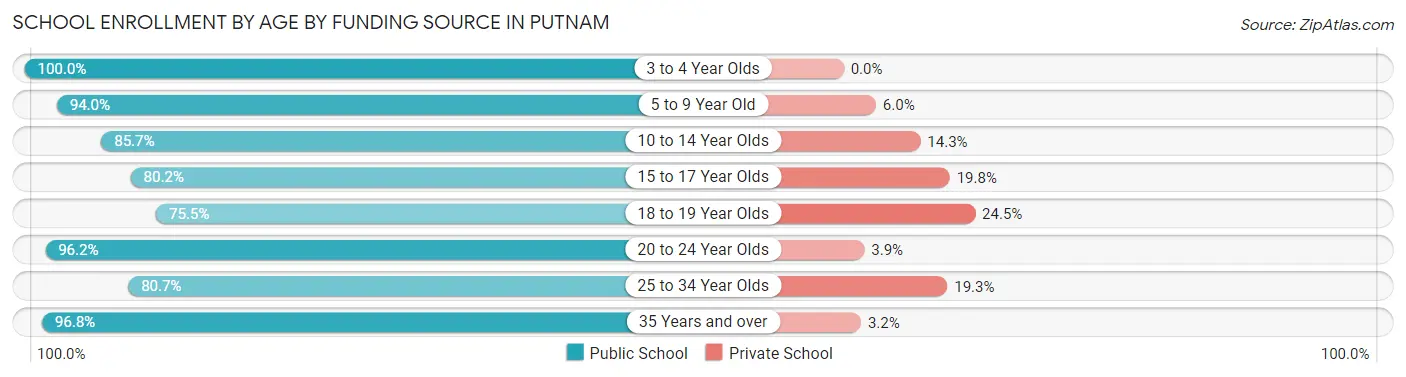
| Age Bracket | Public School | Private School |
| 3 to 4 Year Olds | 85 (100.0%) | 0 (0.0%) |
| 5 to 9 Year Old | 501 (94.0%) | 32 (6.0%) |
| 10 to 14 Year Olds | 234 (85.7%) | 39 (14.3%) |
| 15 to 17 Year Olds | 203 (80.2%) | 50 (19.8%) |
| 18 to 19 Year Olds | 74 (75.5%) | 24 (24.5%) |
| 20 to 24 Year Olds | 25 (96.2%) | 1 (3.8%) |
| 25 to 34 Year Olds | 46 (80.7%) | 11 (19.3%) |
| 35 Years and over | 60 (96.8%) | 2 (3.2%) |
| Total | 1,227 (88.5%) | 160 (11.5%) |
Educational Attainment by Field of Study in Putnam
Business (192 | 21.5%), bio, nature & agricultural (104 | 11.7%), education (95 | 10.6%), social sciences (84 | 9.4%), and liberal arts & history (82 | 9.2%) are the most common fields of study among 892 individuals in Putnam who have obtained a bachelor's degree or higher.
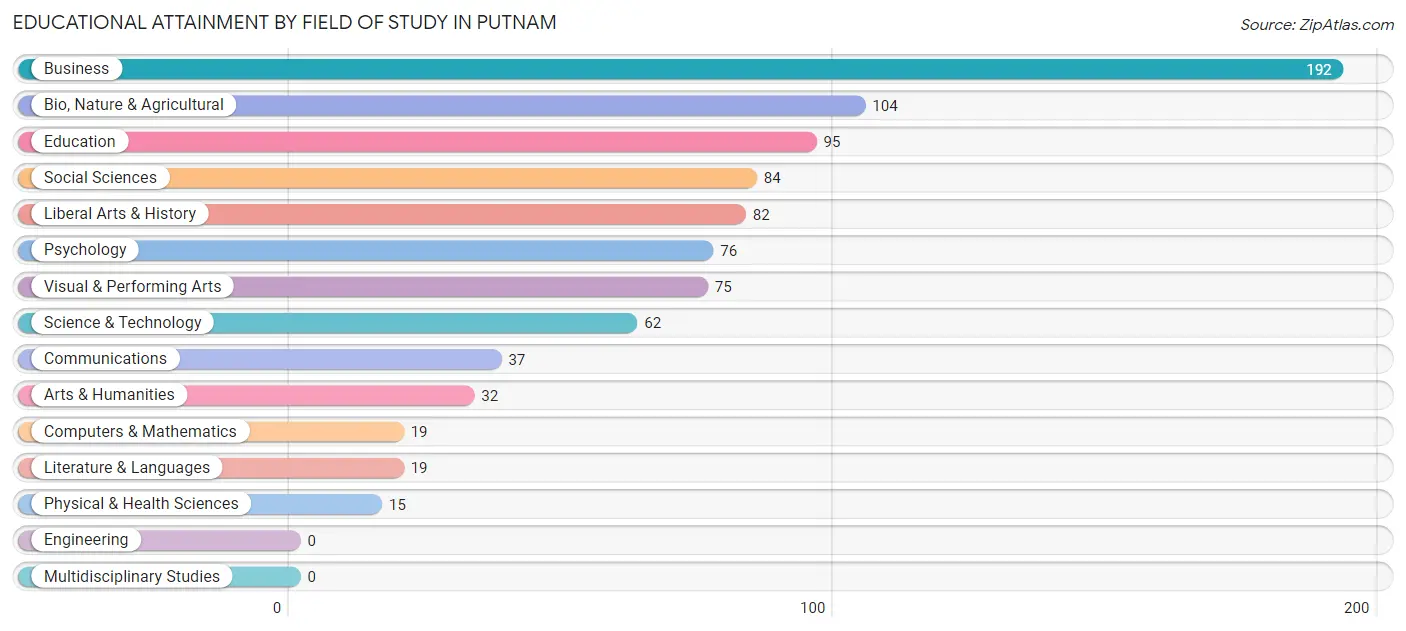
| Field of Study | # Graduates | % Graduates |
| Computers & Mathematics | 19 | 2.1% |
| Bio, Nature & Agricultural | 104 | 11.7% |
| Physical & Health Sciences | 15 | 1.7% |
| Psychology | 76 | 8.5% |
| Social Sciences | 84 | 9.4% |
| Engineering | 0 | 0.0% |
| Multidisciplinary Studies | 0 | 0.0% |
| Science & Technology | 62 | 7.0% |
| Business | 192 | 21.5% |
| Education | 95 | 10.6% |
| Literature & Languages | 19 | 2.1% |
| Liberal Arts & History | 82 | 9.2% |
| Visual & Performing Arts | 75 | 8.4% |
| Communications | 37 | 4.2% |
| Arts & Humanities | 32 | 3.6% |
| Total | 892 | 100.0% |
Transportation & Commute in Putnam
Vehicle Availability by Sex in Putnam
The most prevalent vehicle ownership categories in Putnam are males with 2 vehicles (758, accounting for 42.2%) and females with 2 vehicles (693, making up 44.7%).
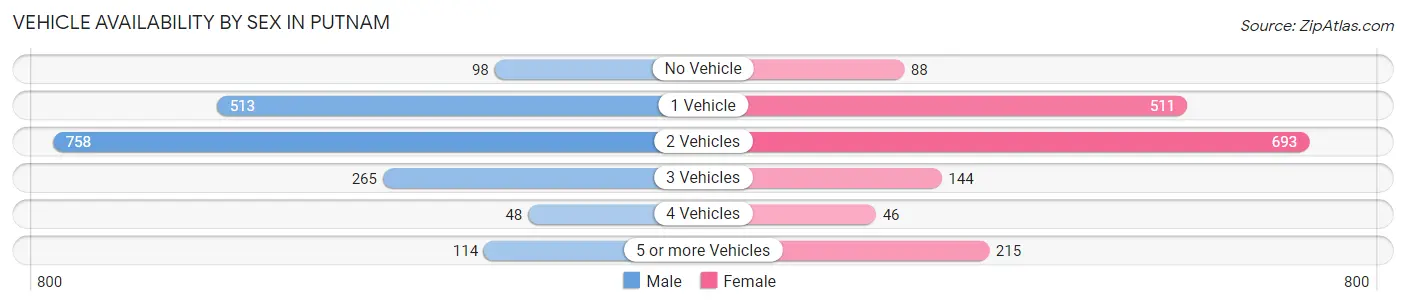
| Vehicles Available | Male | Female |
| No Vehicle | 98 (5.5%) | 88 (5.2%) |
| 1 Vehicle | 513 (28.6%) | 511 (30.1%) |
| 2 Vehicles | 758 (42.2%) | 693 (40.8%) |
| 3 Vehicles | 265 (14.8%) | 144 (8.5%) |
| 4 Vehicles | 48 (2.7%) | 46 (2.7%) |
| 5 or more Vehicles | 114 (6.4%) | 215 (12.7%) |
| Total | 1,796 (100.0%) | 1,697 (100.0%) |
Commute Time in Putnam
The most frequently occuring commute durations in Putnam are 10 to 14 minutes (874 commuters, 26.6%), 5 to 9 minutes (530 commuters, 16.2%), and 20 to 24 minutes (399 commuters, 12.2%).
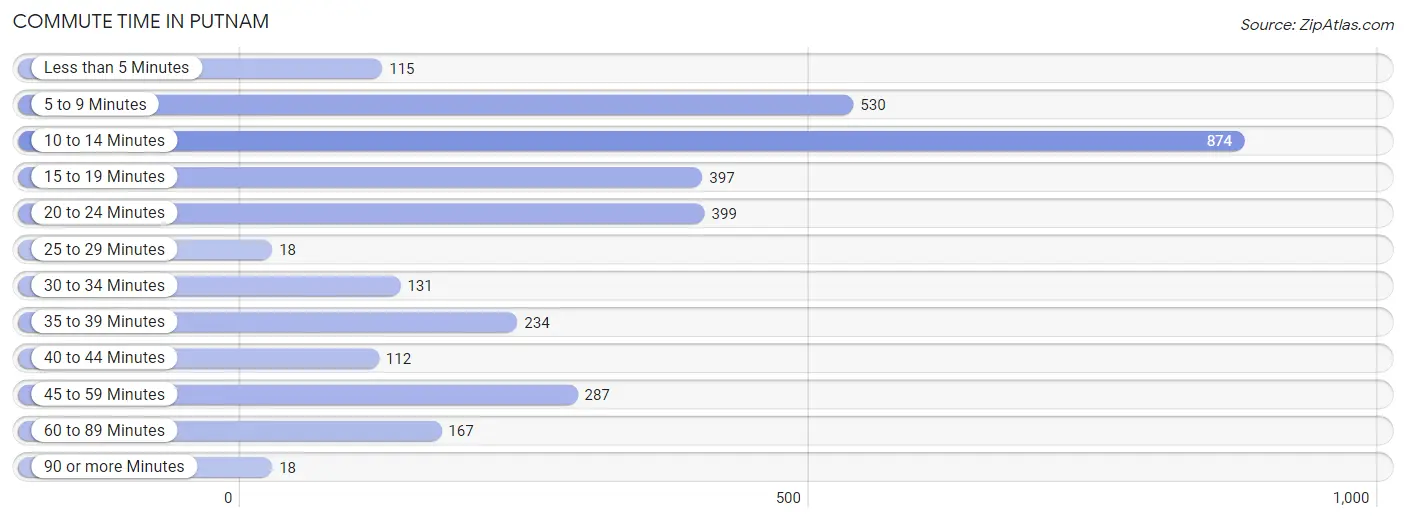
| Commute Time | # Commuters | % Commuters |
| Less than 5 Minutes | 115 | 3.5% |
| 5 to 9 Minutes | 530 | 16.2% |
| 10 to 14 Minutes | 874 | 26.6% |
| 15 to 19 Minutes | 397 | 12.1% |
| 20 to 24 Minutes | 399 | 12.2% |
| 25 to 29 Minutes | 18 | 0.5% |
| 30 to 34 Minutes | 131 | 4.0% |
| 35 to 39 Minutes | 234 | 7.1% |
| 40 to 44 Minutes | 112 | 3.4% |
| 45 to 59 Minutes | 287 | 8.7% |
| 60 to 89 Minutes | 167 | 5.1% |
| 90 or more Minutes | 18 | 0.5% |
Commute Time by Sex in Putnam
The most common commute times in Putnam are 10 to 14 minutes (558 commuters, 33.7%) for males and 5 to 9 minutes (381 commuters, 23.4%) for females.
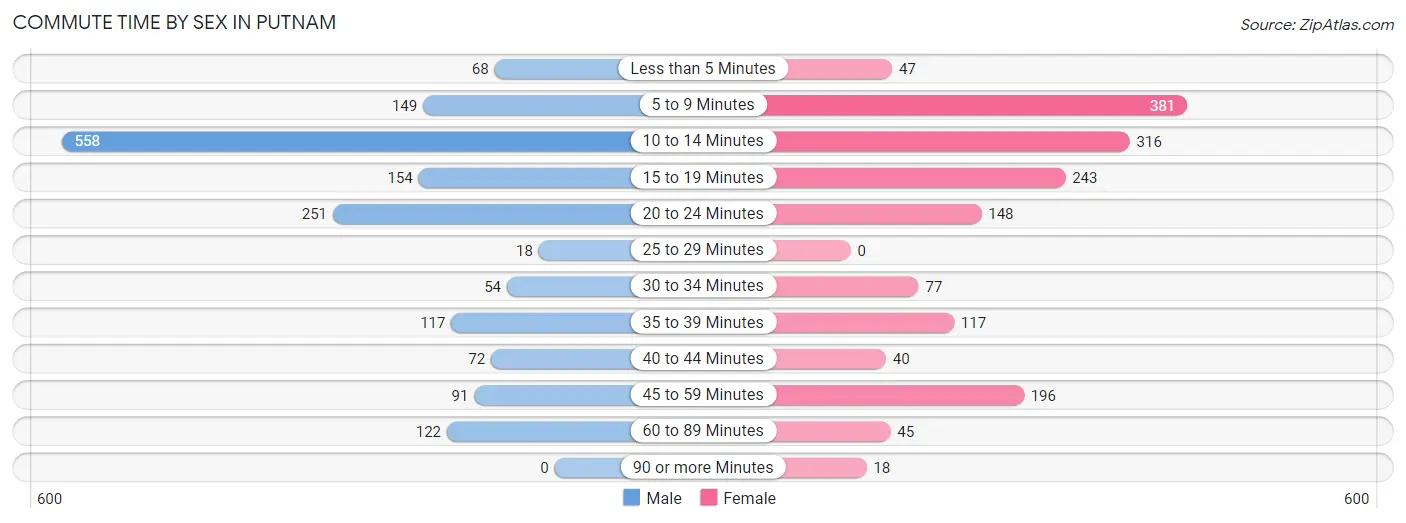
| Commute Time | Male | Female |
| Less than 5 Minutes | 68 (4.1%) | 47 (2.9%) |
| 5 to 9 Minutes | 149 (9.0%) | 381 (23.4%) |
| 10 to 14 Minutes | 558 (33.7%) | 316 (19.4%) |
| 15 to 19 Minutes | 154 (9.3%) | 243 (14.9%) |
| 20 to 24 Minutes | 251 (15.2%) | 148 (9.1%) |
| 25 to 29 Minutes | 18 (1.1%) | 0 (0.0%) |
| 30 to 34 Minutes | 54 (3.3%) | 77 (4.7%) |
| 35 to 39 Minutes | 117 (7.1%) | 117 (7.2%) |
| 40 to 44 Minutes | 72 (4.3%) | 40 (2.5%) |
| 45 to 59 Minutes | 91 (5.5%) | 196 (12.0%) |
| 60 to 89 Minutes | 122 (7.4%) | 45 (2.8%) |
| 90 or more Minutes | 0 (0.0%) | 18 (1.1%) |
Time of Departure to Work by Sex in Putnam
The most frequent times of departure to work in Putnam are 7:30 AM to 7:59 AM (295, 17.8%) for males and 4:00 PM to 11:59 PM (326, 20.0%) for females.
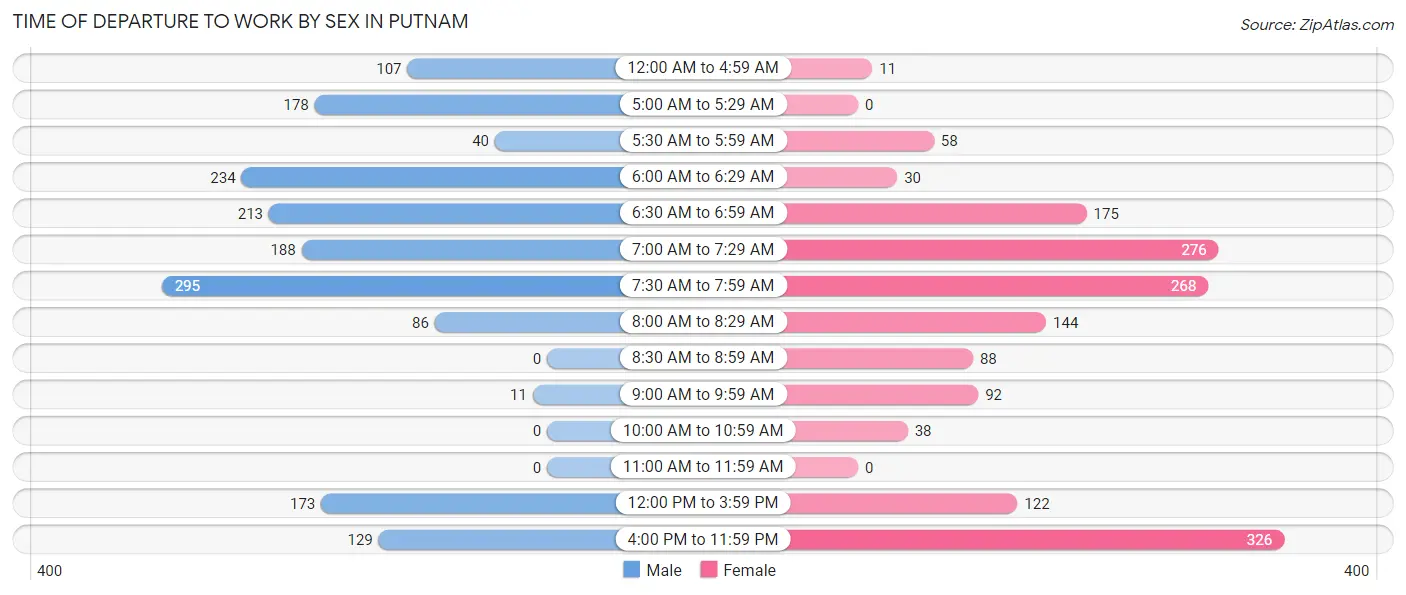
| Time of Departure | Male | Female |
| 12:00 AM to 4:59 AM | 107 (6.5%) | 11 (0.7%) |
| 5:00 AM to 5:29 AM | 178 (10.8%) | 0 (0.0%) |
| 5:30 AM to 5:59 AM | 40 (2.4%) | 58 (3.6%) |
| 6:00 AM to 6:29 AM | 234 (14.1%) | 30 (1.8%) |
| 6:30 AM to 6:59 AM | 213 (12.9%) | 175 (10.7%) |
| 7:00 AM to 7:29 AM | 188 (11.4%) | 276 (17.0%) |
| 7:30 AM to 7:59 AM | 295 (17.8%) | 268 (16.5%) |
| 8:00 AM to 8:29 AM | 86 (5.2%) | 144 (8.8%) |
| 8:30 AM to 8:59 AM | 0 (0.0%) | 88 (5.4%) |
| 9:00 AM to 9:59 AM | 11 (0.7%) | 92 (5.7%) |
| 10:00 AM to 10:59 AM | 0 (0.0%) | 38 (2.3%) |
| 11:00 AM to 11:59 AM | 0 (0.0%) | 0 (0.0%) |
| 12:00 PM to 3:59 PM | 173 (10.5%) | 122 (7.5%) |
| 4:00 PM to 11:59 PM | 129 (7.8%) | 326 (20.0%) |
| Total | 1,654 (100.0%) | 1,628 (100.0%) |
Housing Occupancy in Putnam
Occupancy by Ownership in Putnam
Of the total 3,183 dwellings in Putnam, owner-occupied units account for 1,475 (46.3%), while renter-occupied units make up 1,708 (53.7%).
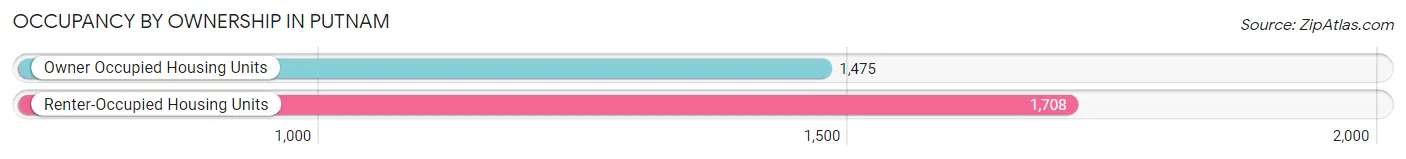
| Occupancy | # Housing Units | % Housing Units |
| Owner Occupied Housing Units | 1,475 | 46.3% |
| Renter-Occupied Housing Units | 1,708 | 53.7% |
| Total Occupied Housing Units | 3,183 | 100.0% |
Occupancy by Household Size in Putnam
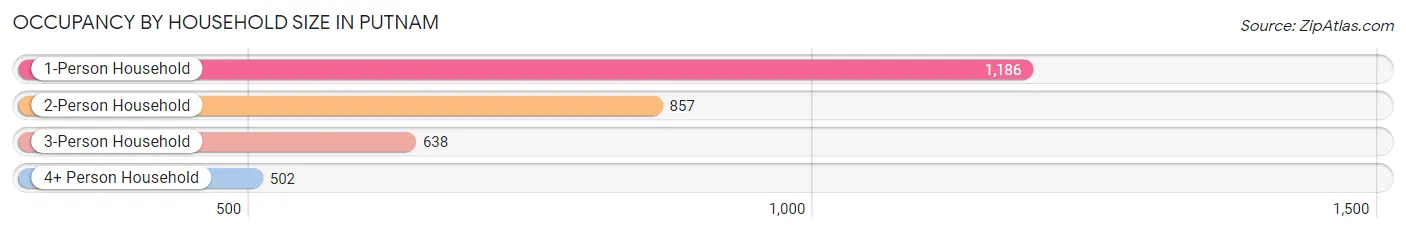
| Household Size | # Housing Units | % Housing Units |
| 1-Person Household | 1,186 | 37.3% |
| 2-Person Household | 857 | 26.9% |
| 3-Person Household | 638 | 20.0% |
| 4+ Person Household | 502 | 15.8% |
| Total Housing Units | 3,183 | 100.0% |
Occupancy by Ownership by Household Size in Putnam
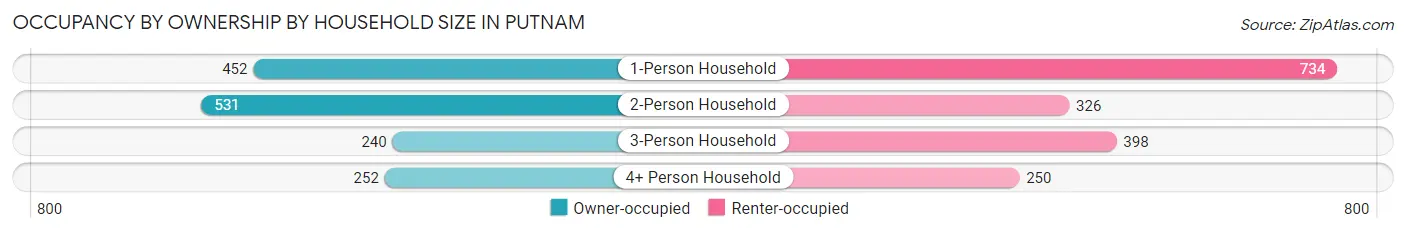
| Household Size | Owner-occupied | Renter-occupied |
| 1-Person Household | 452 (38.1%) | 734 (61.9%) |
| 2-Person Household | 531 (62.0%) | 326 (38.0%) |
| 3-Person Household | 240 (37.6%) | 398 (62.4%) |
| 4+ Person Household | 252 (50.2%) | 250 (49.8%) |
| Total Housing Units | 1,475 (46.3%) | 1,708 (53.7%) |
Occupancy by Educational Attainment in Putnam
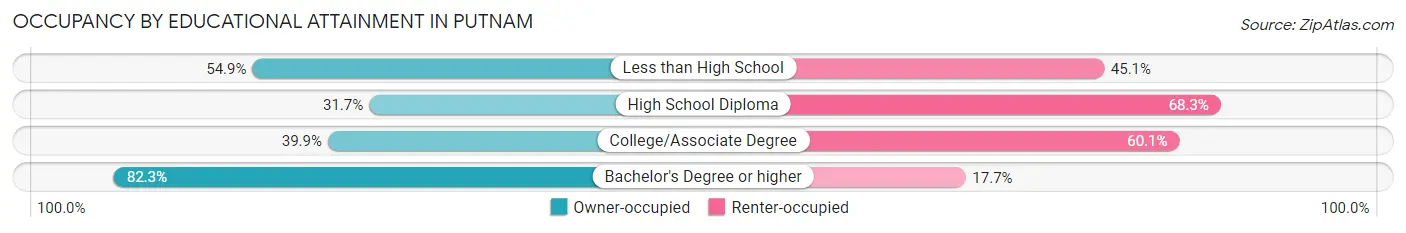
| Household Size | Owner-occupied | Renter-occupied |
| Less than High School | 299 (54.9%) | 246 (45.1%) |
| High School Diploma | 375 (31.7%) | 808 (68.3%) |
| College/Associate Degree | 373 (39.9%) | 562 (60.1%) |
| Bachelor's Degree or higher | 428 (82.3%) | 92 (17.7%) |
Occupancy by Age of Householder in Putnam
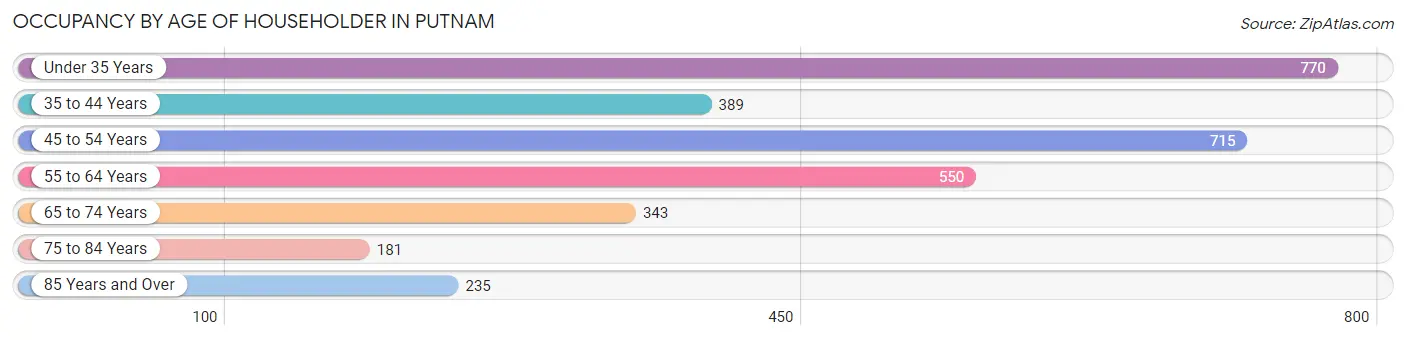
| Age Bracket | # Households | % Households |
| Under 35 Years | 770 | 24.2% |
| 35 to 44 Years | 389 | 12.2% |
| 45 to 54 Years | 715 | 22.5% |
| 55 to 64 Years | 550 | 17.3% |
| 65 to 74 Years | 343 | 10.8% |
| 75 to 84 Years | 181 | 5.7% |
| 85 Years and Over | 235 | 7.4% |
| Total | 3,183 | 100.0% |
Housing Finances in Putnam
Median Income by Occupancy in Putnam
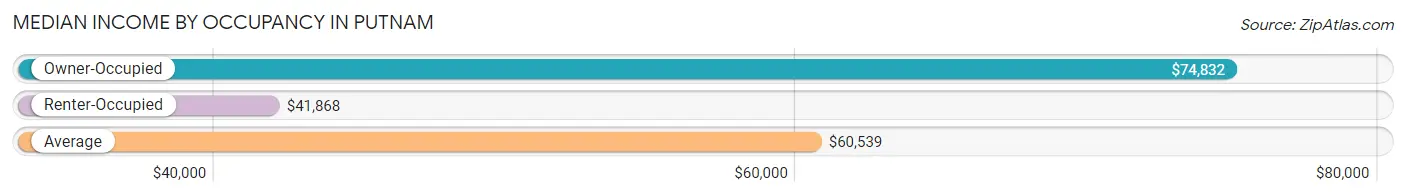
| Occupancy Type | # Households | Median Income |
| Owner-Occupied | 1,475 (46.3%) | $74,832 |
| Renter-Occupied | 1,708 (53.7%) | $41,868 |
| Average | 3,183 (100.0%) | $60,539 |
Occupancy by Householder Income Bracket in Putnam
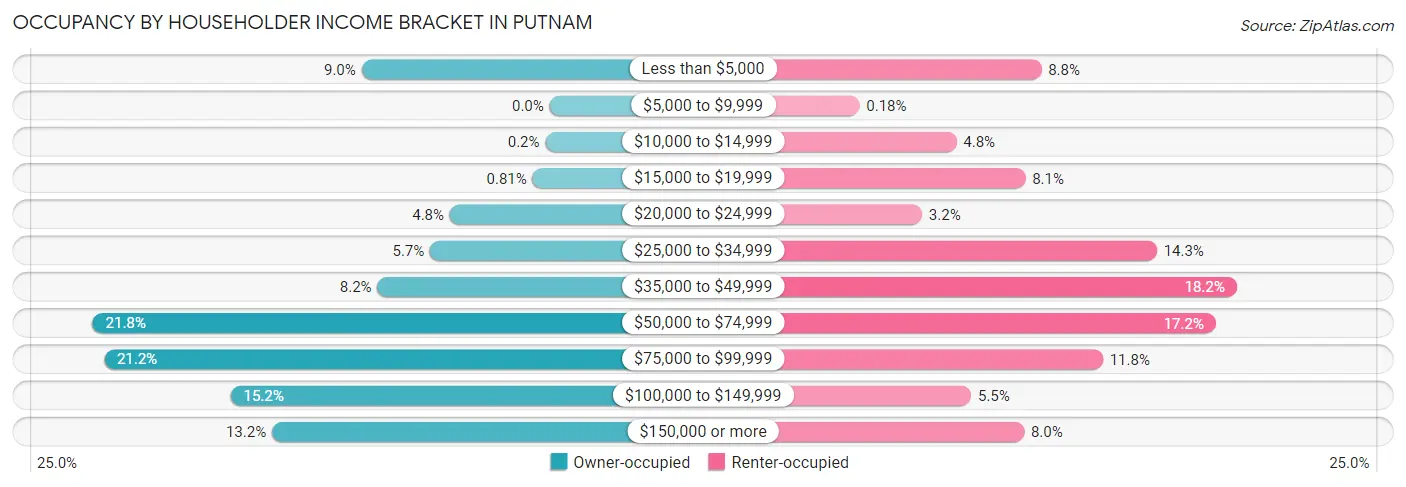
| Income Bracket | Owner-occupied | Renter-occupied |
| Less than $5,000 | 132 (8.9%) | 151 (8.8%) |
| $5,000 to $9,999 | 0 (0.0%) | 3 (0.2%) |
| $10,000 to $14,999 | 3 (0.2%) | 82 (4.8%) |
| $15,000 to $19,999 | 12 (0.8%) | 138 (8.1%) |
| $20,000 to $24,999 | 70 (4.8%) | 54 (3.2%) |
| $25,000 to $34,999 | 84 (5.7%) | 245 (14.3%) |
| $35,000 to $49,999 | 121 (8.2%) | 310 (18.1%) |
| $50,000 to $74,999 | 321 (21.8%) | 293 (17.2%) |
| $75,000 to $99,999 | 313 (21.2%) | 201 (11.8%) |
| $100,000 to $149,999 | 224 (15.2%) | 94 (5.5%) |
| $150,000 or more | 195 (13.2%) | 137 (8.0%) |
| Total | 1,475 (100.0%) | 1,708 (100.0%) |
Monthly Housing Cost Tiers in Putnam
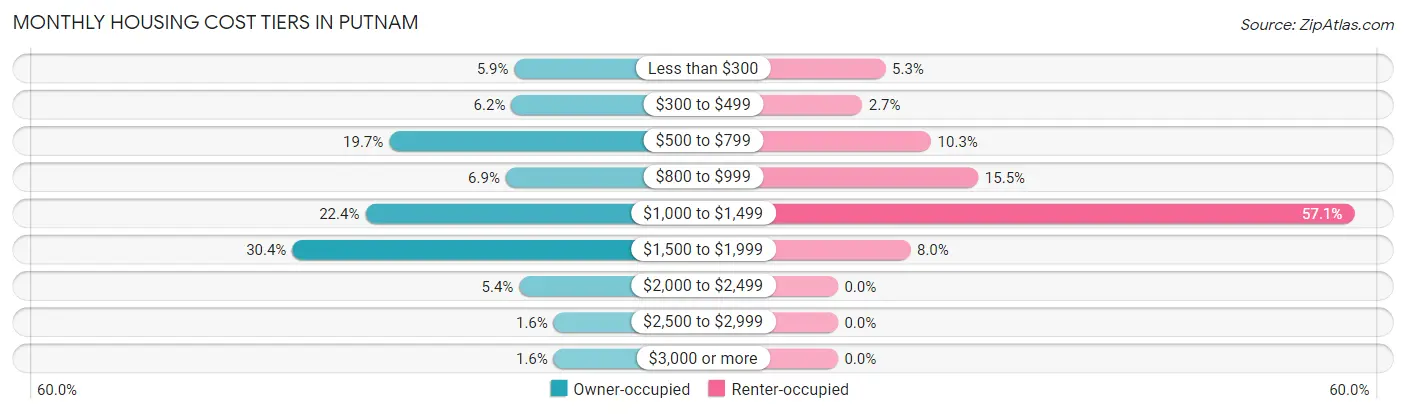
| Monthly Cost | Owner-occupied | Renter-occupied |
| Less than $300 | 87 (5.9%) | 90 (5.3%) |
| $300 to $499 | 92 (6.2%) | 46 (2.7%) |
| $500 to $799 | 291 (19.7%) | 176 (10.3%) |
| $800 to $999 | 101 (6.9%) | 265 (15.5%) |
| $1,000 to $1,499 | 330 (22.4%) | 975 (57.1%) |
| $1,500 to $1,999 | 449 (30.4%) | 137 (8.0%) |
| $2,000 to $2,499 | 79 (5.4%) | 0 (0.0%) |
| $2,500 to $2,999 | 23 (1.6%) | 0 (0.0%) |
| $3,000 or more | 23 (1.6%) | 0 (0.0%) |
| Total | 1,475 (100.0%) | 1,708 (100.0%) |
Physical Housing Characteristics in Putnam
Housing Structures in Putnam
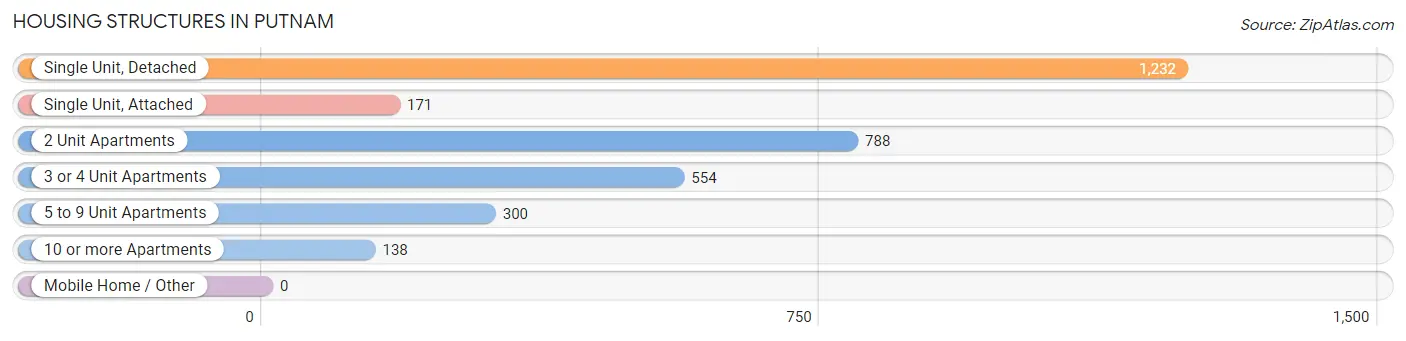
| Structure Type | # Housing Units | % Housing Units |
| Single Unit, Detached | 1,232 | 38.7% |
| Single Unit, Attached | 171 | 5.4% |
| 2 Unit Apartments | 788 | 24.8% |
| 3 or 4 Unit Apartments | 554 | 17.4% |
| 5 to 9 Unit Apartments | 300 | 9.4% |
| 10 or more Apartments | 138 | 4.3% |
| Mobile Home / Other | 0 | 0.0% |
| Total | 3,183 | 100.0% |
Housing Structures by Occupancy in Putnam
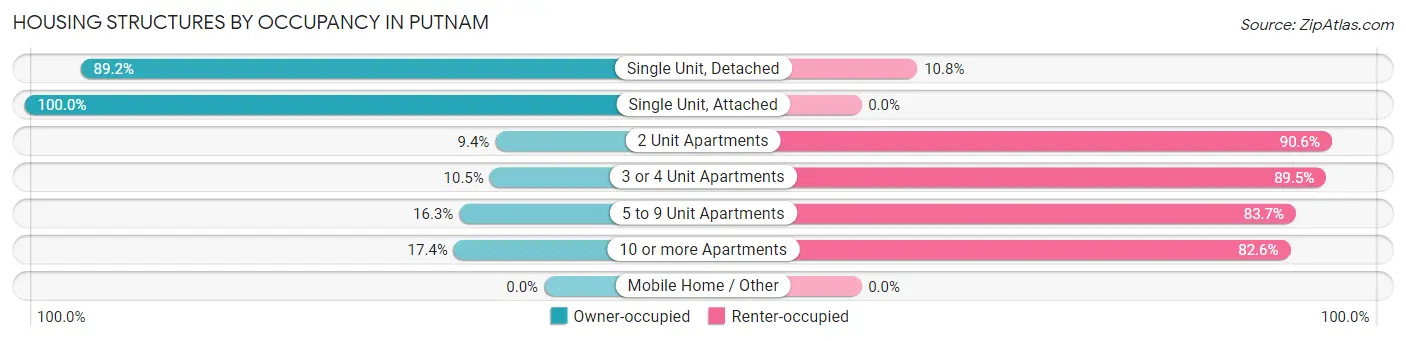
| Structure Type | Owner-occupied | Renter-occupied |
| Single Unit, Detached | 1,099 (89.2%) | 133 (10.8%) |
| Single Unit, Attached | 171 (100.0%) | 0 (0.0%) |
| 2 Unit Apartments | 74 (9.4%) | 714 (90.6%) |
| 3 or 4 Unit Apartments | 58 (10.5%) | 496 (89.5%) |
| 5 to 9 Unit Apartments | 49 (16.3%) | 251 (83.7%) |
| 10 or more Apartments | 24 (17.4%) | 114 (82.6%) |
| Mobile Home / Other | 0 (0.0%) | 0 (0.0%) |
| Total | 1,475 (46.3%) | 1,708 (53.7%) |
Housing Structures by Number of Rooms in Putnam
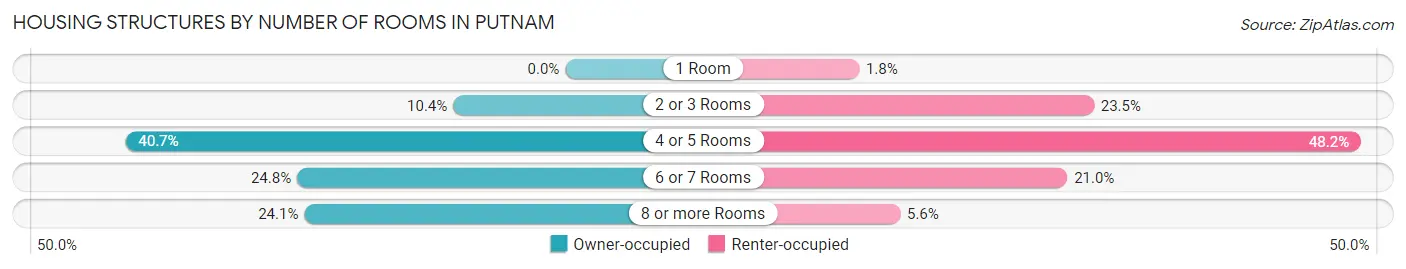
| Number of Rooms | Owner-occupied | Renter-occupied |
| 1 Room | 0 (0.0%) | 30 (1.8%) |
| 2 or 3 Rooms | 153 (10.4%) | 401 (23.5%) |
| 4 or 5 Rooms | 600 (40.7%) | 823 (48.2%) |
| 6 or 7 Rooms | 366 (24.8%) | 359 (21.0%) |
| 8 or more Rooms | 356 (24.1%) | 95 (5.6%) |
| Total | 1,475 (100.0%) | 1,708 (100.0%) |
Housing Structure by Heating Type in Putnam
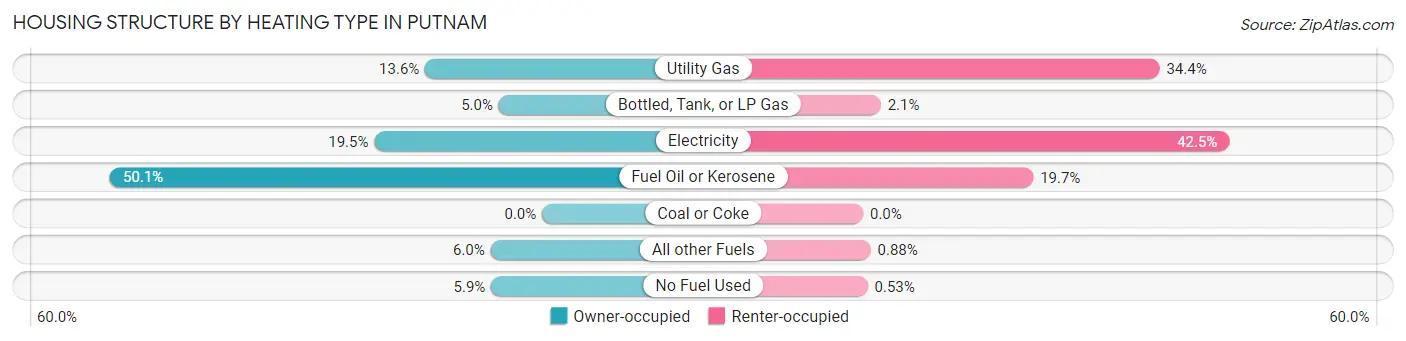
| Heating Type | Owner-occupied | Renter-occupied |
| Utility Gas | 200 (13.6%) | 587 (34.4%) |
| Bottled, Tank, or LP Gas | 74 (5.0%) | 35 (2.1%) |
| Electricity | 287 (19.5%) | 725 (42.4%) |
| Fuel Oil or Kerosene | 739 (50.1%) | 337 (19.7%) |
| Coal or Coke | 0 (0.0%) | 0 (0.0%) |
| All other Fuels | 88 (6.0%) | 15 (0.9%) |
| No Fuel Used | 87 (5.9%) | 9 (0.5%) |
| Total | 1,475 (100.0%) | 1,708 (100.0%) |
Household Vehicle Usage in Putnam
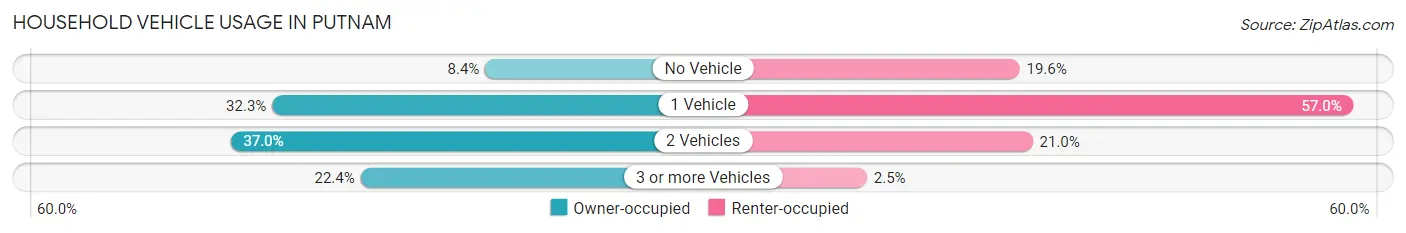
| Vehicles per Household | Owner-occupied | Renter-occupied |
| No Vehicle | 124 (8.4%) | 334 (19.6%) |
| 1 Vehicle | 476 (32.3%) | 973 (57.0%) |
| 2 Vehicles | 545 (36.9%) | 359 (21.0%) |
| 3 or more Vehicles | 330 (22.4%) | 42 (2.5%) |
| Total | 1,475 (100.0%) | 1,708 (100.0%) |
Real Estate & Mortgages in Putnam
Real Estate and Mortgage Overview in Putnam
| Characteristic | Without Mortgage | With Mortgage |
| Housing Units | 618 | 857 |
| Median Property Value | $246,400 | $204,200 |
| Median Household Income | $63,400 | $141 |
| Monthly Housing Costs | $749 | $23 |
| Real Estate Taxes | $3,477 | $17 |
Property Value by Mortgage Status in Putnam
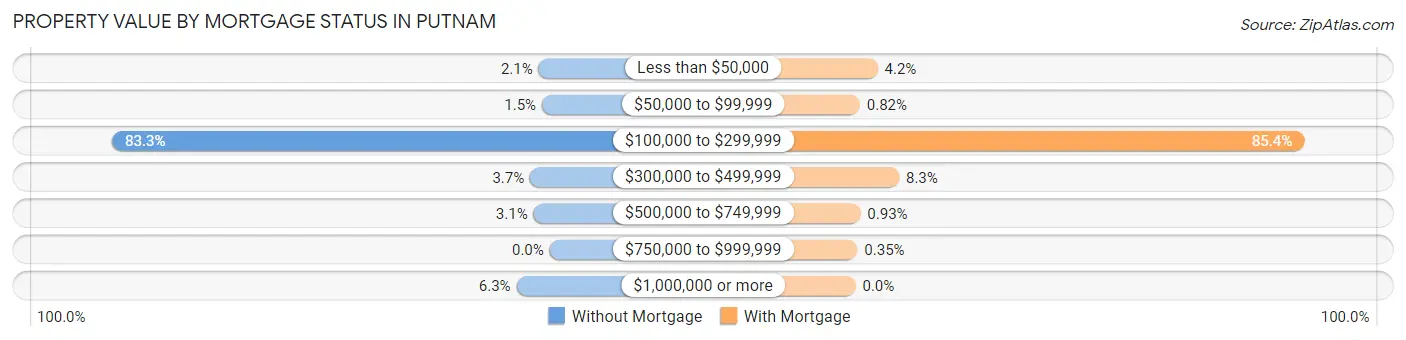
| Property Value | Without Mortgage | With Mortgage |
| Less than $50,000 | 13 (2.1%) | 36 (4.2%) |
| $50,000 to $99,999 | 9 (1.5%) | 7 (0.8%) |
| $100,000 to $299,999 | 515 (83.3%) | 732 (85.4%) |
| $300,000 to $499,999 | 23 (3.7%) | 71 (8.3%) |
| $500,000 to $749,999 | 19 (3.1%) | 8 (0.9%) |
| $750,000 to $999,999 | 0 (0.0%) | 3 (0.4%) |
| $1,000,000 or more | 39 (6.3%) | 0 (0.0%) |
| Total | 618 (100.0%) | 857 (100.0%) |
Household Income by Mortgage Status in Putnam
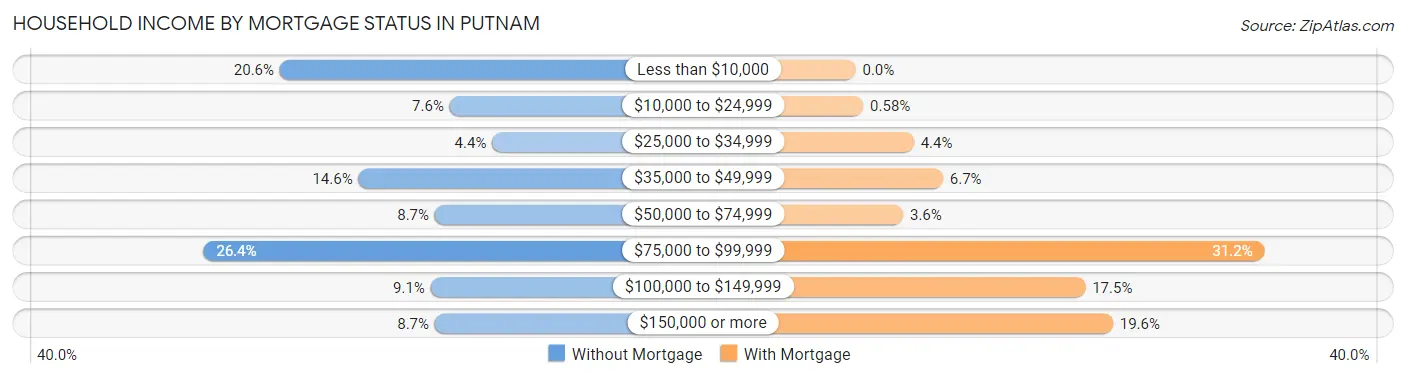
| Household Income | Without Mortgage | With Mortgage |
| Less than $10,000 | 127 (20.5%) | 0 (0.0%) |
| $10,000 to $24,999 | 47 (7.6%) | 5 (0.6%) |
| $25,000 to $34,999 | 27 (4.4%) | 38 (4.4%) |
| $35,000 to $49,999 | 90 (14.6%) | 57 (6.7%) |
| $50,000 to $74,999 | 54 (8.7%) | 31 (3.6%) |
| $75,000 to $99,999 | 163 (26.4%) | 267 (31.2%) |
| $100,000 to $149,999 | 56 (9.1%) | 150 (17.5%) |
| $150,000 or more | 54 (8.7%) | 168 (19.6%) |
| Total | 618 (100.0%) | 857 (100.0%) |
Property Value to Household Income Ratio in Putnam
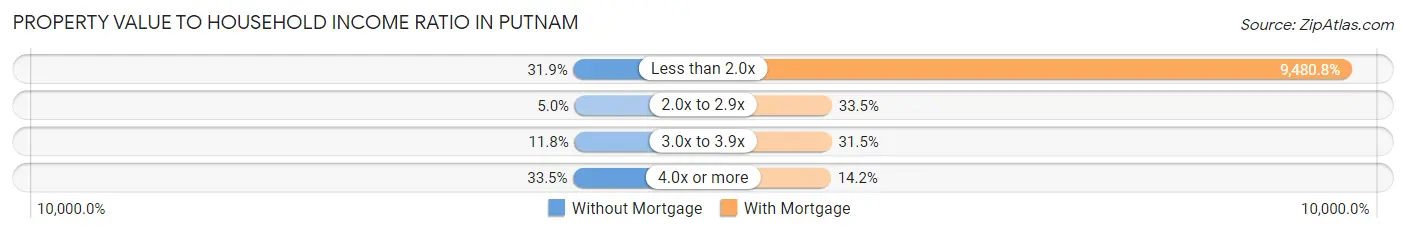
| Value-to-Income Ratio | Without Mortgage | With Mortgage |
| Less than 2.0x | 197 (31.9%) | 81,250 (9,480.8%) |
| 2.0x to 2.9x | 31 (5.0%) | 287 (33.5%) |
| 3.0x to 3.9x | 73 (11.8%) | 270 (31.5%) |
| 4.0x or more | 207 (33.5%) | 122 (14.2%) |
| Total | 618 (100.0%) | 857 (100.0%) |
Real Estate Taxes by Mortgage Status in Putnam
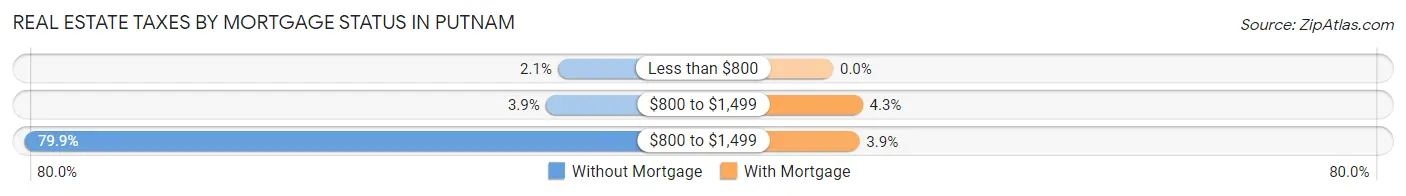
| Property Taxes | Without Mortgage | With Mortgage |
| Less than $800 | 13 (2.1%) | 0 (0.0%) |
| $800 to $1,499 | 24 (3.9%) | 37 (4.3%) |
| $800 to $1,499 | 494 (79.9%) | 33 (3.8%) |
| Total | 618 (100.0%) | 857 (100.0%) |
Health & Disability in Putnam
Health Insurance Coverage by Age in Putnam
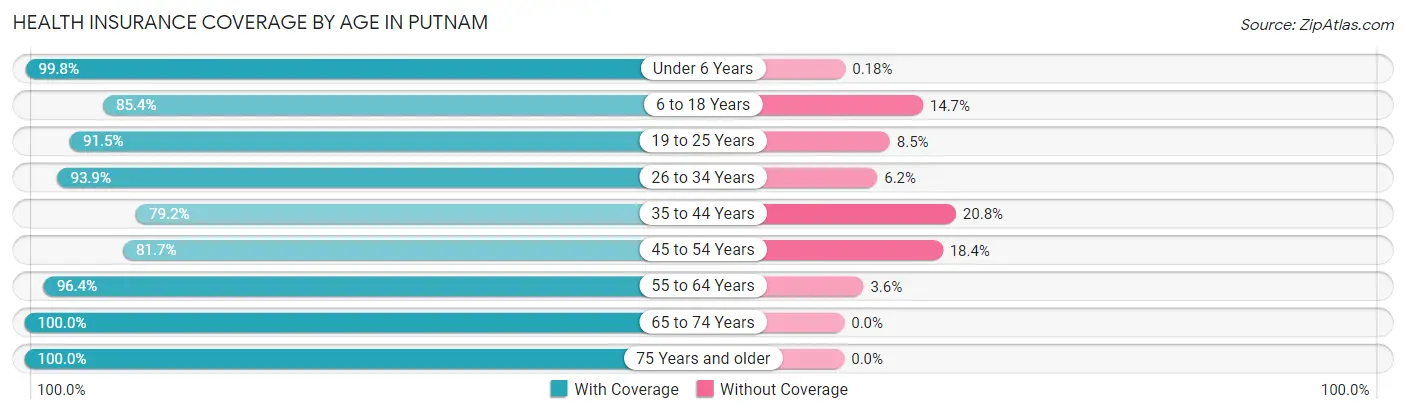
| Age Bracket | With Coverage | Without Coverage |
| Under 6 Years | 544 (99.8%) | 1 (0.2%) |
| 6 to 18 Years | 950 (85.4%) | 163 (14.6%) |
| 19 to 25 Years | 485 (91.5%) | 45 (8.5%) |
| 26 to 34 Years | 1,130 (93.9%) | 74 (6.1%) |
| 35 to 44 Years | 624 (79.2%) | 164 (20.8%) |
| 45 to 54 Years | 997 (81.7%) | 224 (18.3%) |
| 55 to 64 Years | 755 (96.4%) | 28 (3.6%) |
| 65 to 74 Years | 502 (100.0%) | 0 (0.0%) |
| 75 Years and older | 501 (100.0%) | 0 (0.0%) |
| Total | 6,488 (90.3%) | 699 (9.7%) |
Health Insurance Coverage by Citizenship Status in Putnam
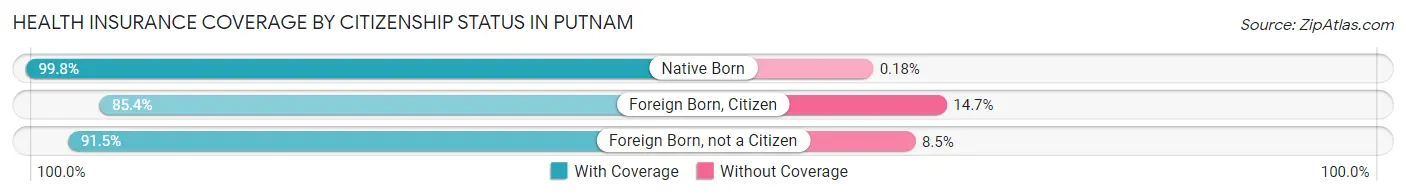
| Citizenship Status | With Coverage | Without Coverage |
| Native Born | 544 (99.8%) | 1 (0.2%) |
| Foreign Born, Citizen | 950 (85.4%) | 163 (14.6%) |
| Foreign Born, not a Citizen | 485 (91.5%) | 45 (8.5%) |
Health Insurance Coverage by Household Income in Putnam
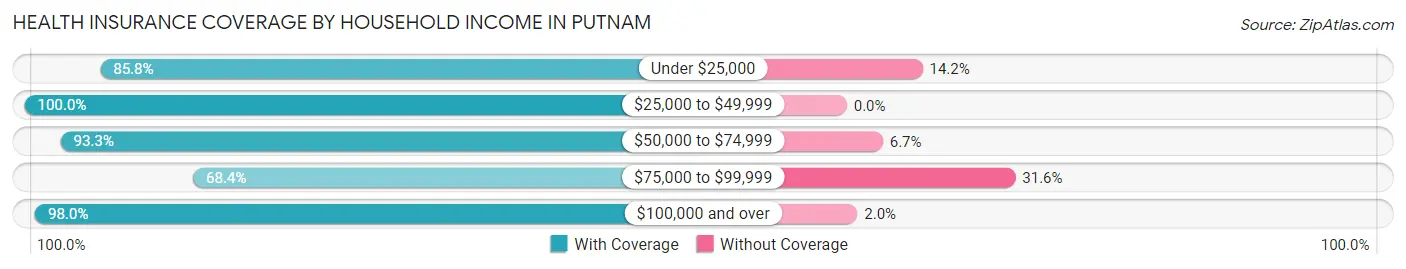
| Household Income | With Coverage | Without Coverage |
| Under $25,000 | 659 (85.8%) | 109 (14.2%) |
| $25,000 to $49,999 | 1,609 (100.0%) | 0 (0.0%) |
| $50,000 to $74,999 | 1,231 (93.3%) | 89 (6.7%) |
| $75,000 to $99,999 | 1,001 (68.4%) | 462 (31.6%) |
| $100,000 and over | 1,893 (98.0%) | 38 (2.0%) |
Public vs Private Health Insurance Coverage by Age in Putnam
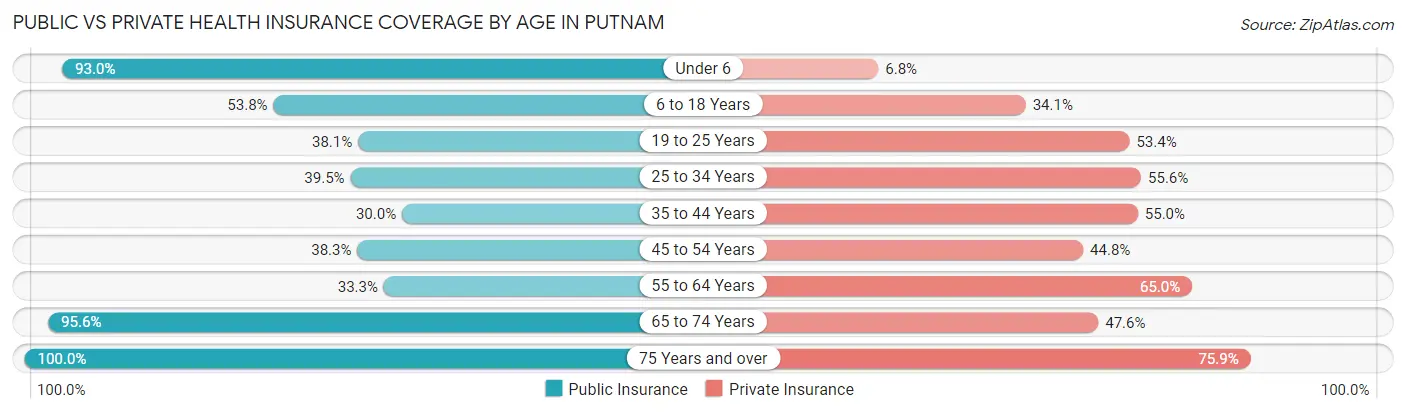
| Age Bracket | Public Insurance | Private Insurance |
| Under 6 | 507 (93.0%) | 37 (6.8%) |
| 6 to 18 Years | 599 (53.8%) | 380 (34.1%) |
| 19 to 25 Years | 202 (38.1%) | 283 (53.4%) |
| 25 to 34 Years | 476 (39.5%) | 669 (55.6%) |
| 35 to 44 Years | 236 (29.9%) | 433 (54.9%) |
| 45 to 54 Years | 467 (38.3%) | 547 (44.8%) |
| 55 to 64 Years | 261 (33.3%) | 509 (65.0%) |
| 65 to 74 Years | 480 (95.6%) | 239 (47.6%) |
| 75 Years and over | 501 (100.0%) | 380 (75.8%) |
| Total | 3,729 (51.9%) | 3,477 (48.4%) |
Disability Status by Sex by Age in Putnam
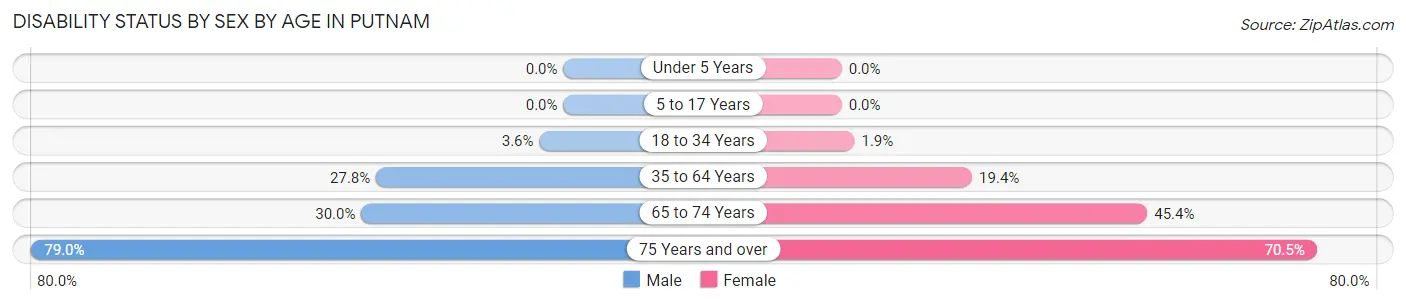
| Age Bracket | Male | Female |
| Under 5 Years | 0 (0.0%) | 0 (0.0%) |
| 5 to 17 Years | 0 (0.0%) | 0 (0.0%) |
| 18 to 34 Years | 33 (3.6%) | 17 (1.9%) |
| 35 to 64 Years | 377 (27.8%) | 278 (19.4%) |
| 65 to 74 Years | 60 (30.0%) | 137 (45.4%) |
| 75 Years and over | 109 (79.0%) | 256 (70.5%) |
Disability Class by Sex by Age in Putnam
Disability Class: Hearing Difficulty
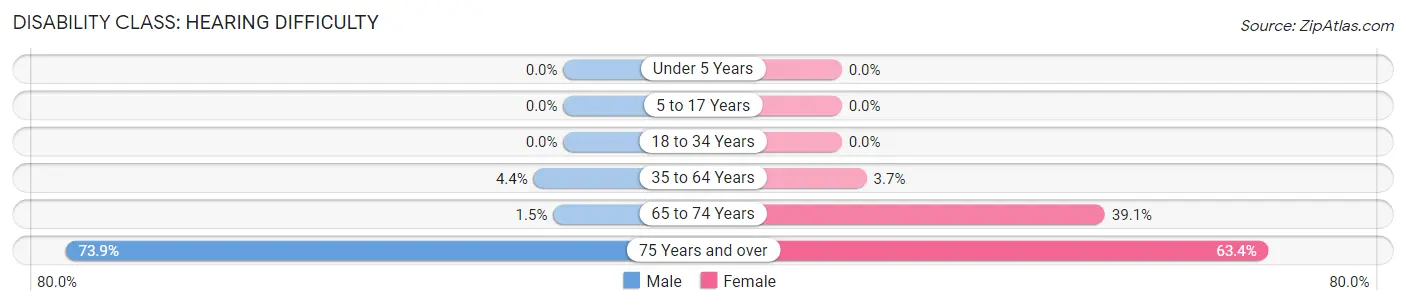
| Age Bracket | Male | Female |
| Under 5 Years | 0 (0.0%) | 0 (0.0%) |
| 5 to 17 Years | 0 (0.0%) | 0 (0.0%) |
| 18 to 34 Years | 0 (0.0%) | 0 (0.0%) |
| 35 to 64 Years | 60 (4.4%) | 53 (3.7%) |
| 65 to 74 Years | 3 (1.5%) | 118 (39.1%) |
| 75 Years and over | 102 (73.9%) | 230 (63.4%) |
Disability Class: Vision Difficulty
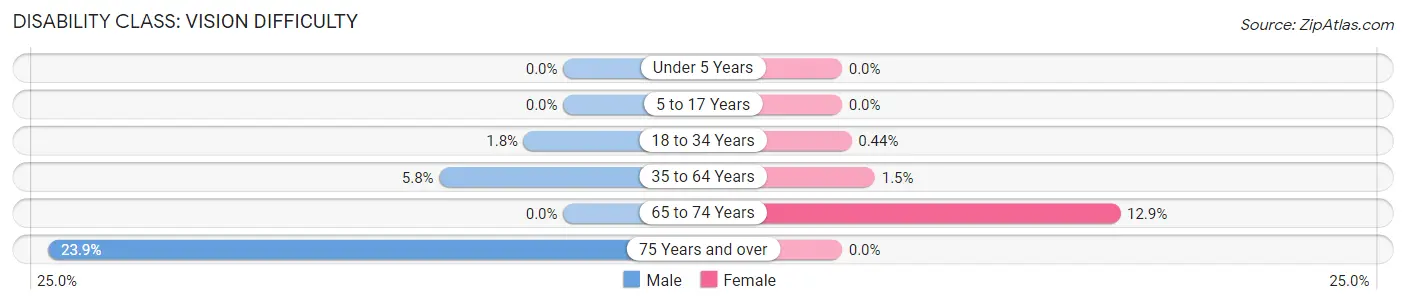
| Age Bracket | Male | Female |
| Under 5 Years | 0 (0.0%) | 0 (0.0%) |
| 5 to 17 Years | 0 (0.0%) | 0 (0.0%) |
| 18 to 34 Years | 17 (1.8%) | 4 (0.4%) |
| 35 to 64 Years | 78 (5.8%) | 22 (1.5%) |
| 65 to 74 Years | 0 (0.0%) | 39 (12.9%) |
| 75 Years and over | 33 (23.9%) | 0 (0.0%) |
Disability Class: Cognitive Difficulty
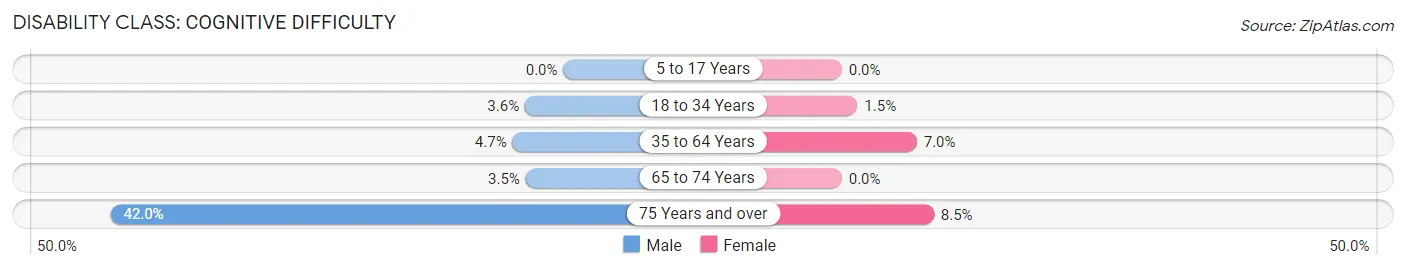
| Age Bracket | Male | Female |
| 5 to 17 Years | 0 (0.0%) | 0 (0.0%) |
| 18 to 34 Years | 33 (3.6%) | 13 (1.5%) |
| 35 to 64 Years | 64 (4.7%) | 100 (7.0%) |
| 65 to 74 Years | 7 (3.5%) | 0 (0.0%) |
| 75 Years and over | 58 (42.0%) | 31 (8.5%) |
Disability Class: Ambulatory Difficulty
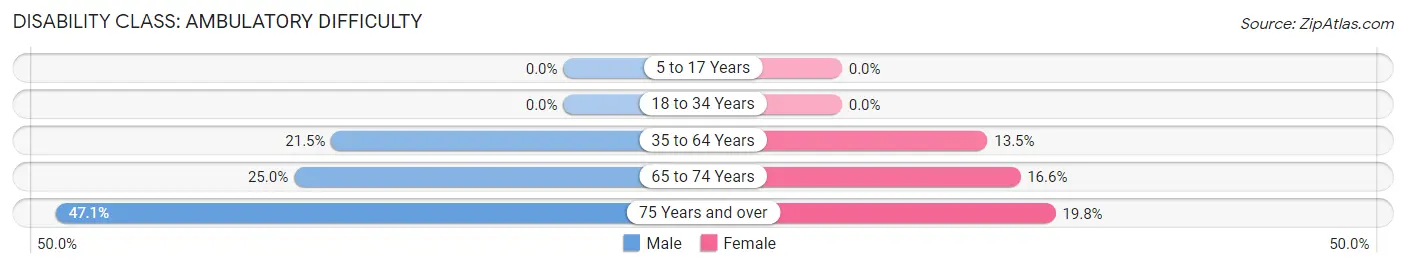
| Age Bracket | Male | Female |
| 5 to 17 Years | 0 (0.0%) | 0 (0.0%) |
| 18 to 34 Years | 0 (0.0%) | 0 (0.0%) |
| 35 to 64 Years | 292 (21.5%) | 194 (13.5%) |
| 65 to 74 Years | 50 (25.0%) | 50 (16.6%) |
| 75 Years and over | 65 (47.1%) | 72 (19.8%) |
Disability Class: Self-Care Difficulty
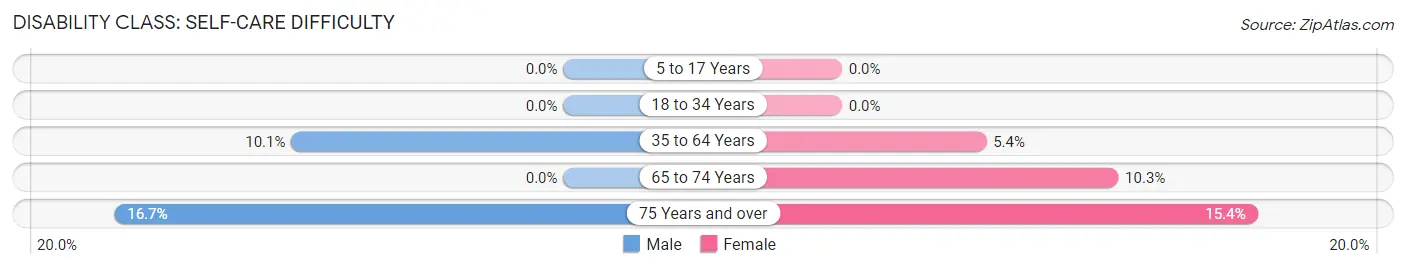
| Age Bracket | Male | Female |
| 5 to 17 Years | 0 (0.0%) | 0 (0.0%) |
| 18 to 34 Years | 0 (0.0%) | 0 (0.0%) |
| 35 to 64 Years | 137 (10.1%) | 77 (5.4%) |
| 65 to 74 Years | 0 (0.0%) | 31 (10.3%) |
| 75 Years and over | 23 (16.7%) | 56 (15.4%) |
Technology Access in Putnam
Computing Device Access in Putnam
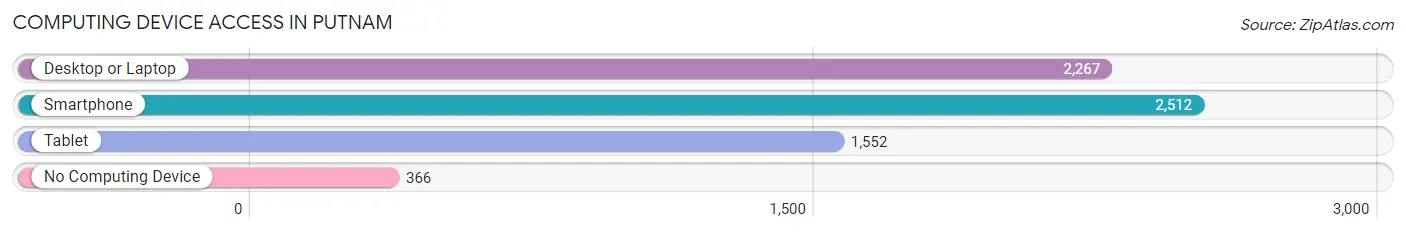
| Device Type | # Households | % Households |
| Desktop or Laptop | 2,267 | 71.2% |
| Smartphone | 2,512 | 78.9% |
| Tablet | 1,552 | 48.8% |
| No Computing Device | 366 | 11.5% |
| Total | 3,183 | 100.0% |
Internet Access in Putnam
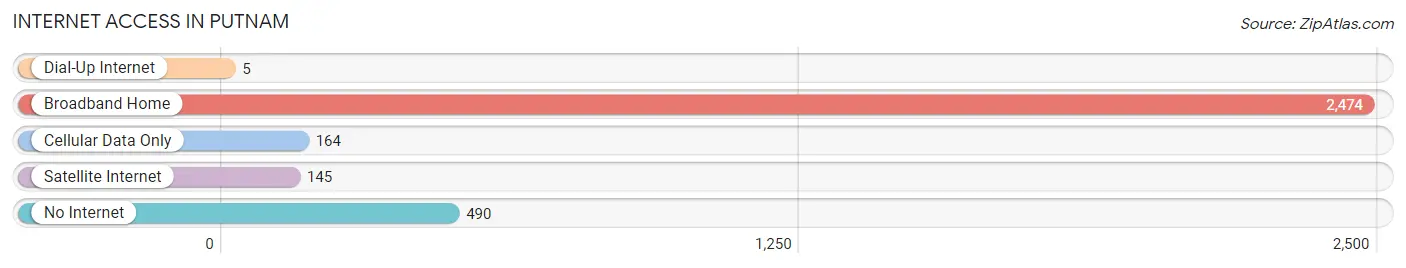
| Internet Type | # Households | % Households |
| Dial-Up Internet | 5 | 0.2% |
| Broadband Home | 2,474 | 77.7% |
| Cellular Data Only | 164 | 5.1% |
| Satellite Internet | 145 | 4.6% |
| No Internet | 490 | 15.4% |
| Total | 3,183 | 100.0% |
Putnam Summary
Putnam, Connecticut is a small town located in Windham County in the northeastern part of the state. It is situated on the Quinebaug River, which is a tributary of the Thames River. The town was originally part of the town of Killingly, but was incorporated as its own town in 1855. Putnam is known for its historic downtown area, which is listed on the National Register of Historic Places.
Geography
Putnam is located in the northeastern part of Connecticut, in Windham County. It is bordered by the towns of Killingly to the north, Thompson to the east, Woodstock to the south, and Pomfret to the west. The town covers an area of 11.7 square miles, with a population of 9,584 as of the 2010 census. The town is situated on the Quinebaug River, which is a tributary of the Thames River. The town is located in the Eastern New England Upland region, with elevations ranging from 200 to 500 feet above sea level.
Economy
Putnam is a small town with a population of just over 9,000 people. The town’s economy is largely based on tourism, with many visitors coming to the area to enjoy the town’s historic downtown area. The town is also home to several small businesses, including restaurants, retail stores, and professional services. The town is also home to several manufacturing companies, including Putnam Plastics Corporation, which produces plastic products for the medical and industrial markets.
Demographics
As of the 2010 census, the population of Putnam was 9,584. The racial makeup of the town was 94.2% White, 1.3% African American, 0.4% Native American, 1.2% Asian, 0.1% Pacific Islander, 1.2% from other races, and 1.6% from two or more races. Hispanic or Latino of any race were 3.3% of the population. The median household income in Putnam was $50,945, and the median family income was $60,917.
Putnam is a small town with a rich history and a vibrant economy. The town is home to a diverse population, with a variety of businesses and attractions. Putnam is a great place to live, work, and visit, and is sure to provide a unique and enjoyable experience for all who visit.
Common Questions
What is the Total Population of Putnam?
Total Population of Putnam is 7,207.
What is the Total Male Population of Putnam?
Total Male Population of Putnam is 3,269.
What is the Total Female Population of Putnam?
Total Female Population of Putnam is 3,938.
What is the Ratio of Males per 100 Females in Putnam?
There are 83.01 Males per 100 Females in Putnam.
What is the Ratio of Females per 100 Males in Putnam?
There are 120.46 Females per 100 Males in Putnam.
What is the Median Population Age in Putnam?
Median Population Age in Putnam is 37.7 Years.
What is the Average Family Size in Putnam
Average Family Size in Putnam is 3.0 People.
What is the Average Household Size in Putnam
Average Household Size in Putnam is 2.2 People.
What is Per Capita Income in Putnam?
Per Capita income in Putnam is $31,597.
What is the Median Family Income in Putnam?
Median Family Income in Putnam is $80,880.
What is the Median Household income in Putnam?
Median Household Income in Putnam is $60,539.
What is Income or Wage Gap in Putnam?
Income or Wage Gap in Putnam is 2.2%.
Women in Putnam earn 97.8 cents for every dollar earned by a man.
What is Inequality or Gini Index in Putnam?
Inequality or Gini Index in Putnam is 0.43.
How Large is the Labor Force in Putnam?
There are 3,869 People in the Labor Forcein in Putnam.
What is the Percentage of People in the Labor Force in Putnam?
66.2% of People are in the Labor Force in Putnam.
What is the Unemployment Rate in Putnam?
Unemployment Rate in Putnam is 5.4%.