Oak Level, VA
Oak Level Map
Oak Level Overview
453
TOTAL POPULATION
155
MALE POPULATION
298
FEMALE POPULATION
52.01
MALES / 100 FEMALES
192.26
FEMALES / 100 MALES
55.1
MEDIAN AGE
2.9
AVG FAMILY SIZE
1.8
AVG HOUSEHOLD SIZE
$20,335
PER CAPITA INCOME
$32,523
AVG HOUSEHOLD INCOME
27.3%
WAGE / INCOME GAP [ % ]
72.7¢/ $1
WAGE / INCOME GAP [ $ ]
$6,058
FAMILY INCOME DEFICIT
0.40
INEQUALITY / GINI INDEX
179
LABOR FORCE [ PEOPLE ]
47.2%
PERCENT IN LABOR FORCE
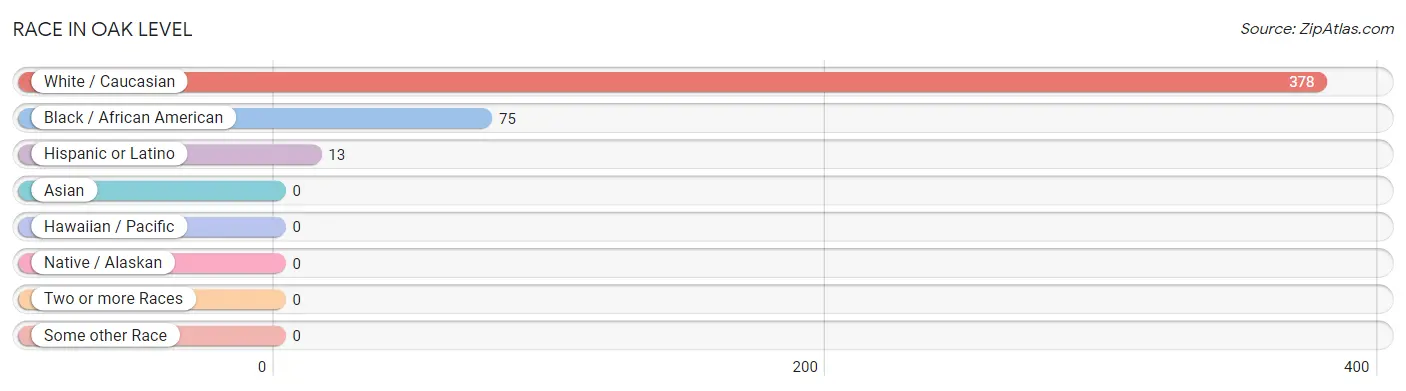
Race in Oak Level
The most populous races in Oak Level are White / Caucasian (378 | 83.4%), Black / African American (75 | 16.6%), and Hispanic or Latino (13 | 2.9%).
| Race | # Population | % Population |
| Asian | 0 | 0.0% |
| Black / African American | 75 | 16.6% |
| Hawaiian / Pacific | 0 | 0.0% |
| Hispanic or Latino | 13 | 2.9% |
| Native / Alaskan | 0 | 0.0% |
| White / Caucasian | 378 | 83.4% |
| Two or more Races | 0 | 0.0% |
| Some other Race | 0 | 0.0% |
| Total | 453 | 100.0% |
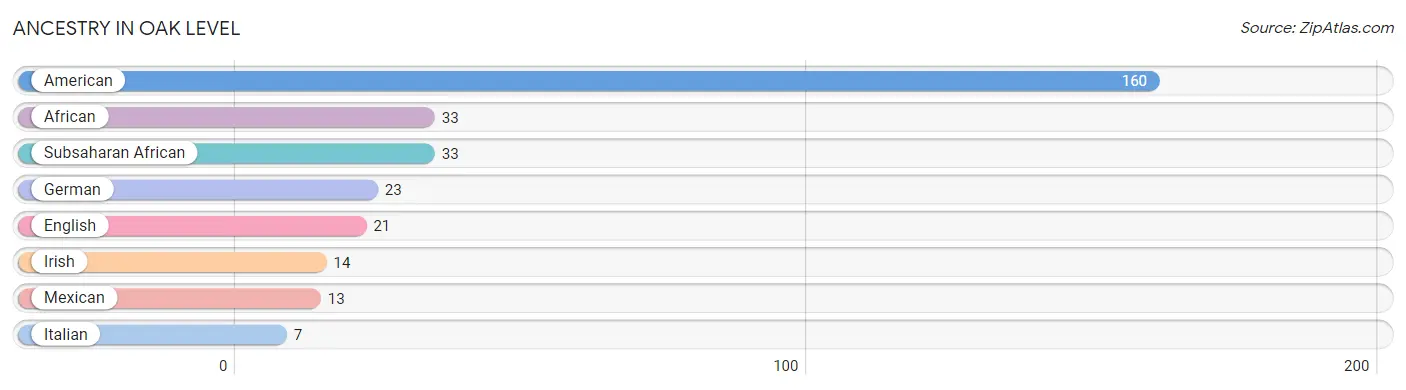
Ancestry in Oak Level
The most populous ancestries reported in Oak Level are American (160 | 35.3%), African (33 | 7.3%), Subsaharan African (33 | 7.3%), German (23 | 5.1%), and English (21 | 4.6%), together accounting for 59.6% of all Oak Level residents.
| Ancestry | # Population | % Population |
| African | 33 | 7.3% |
| American | 160 | 35.3% |
| English | 21 | 4.6% |
| German | 23 | 5.1% |
| Irish | 14 | 3.1% |
| Italian | 7 | 1.5% |
| Mexican | 13 | 2.9% |
| Subsaharan African | 33 | 7.3% | View All 8 Rows |
Immigrants in Oak Level

| Immigration Origin | # Population | % Population | View All 0 Rows |
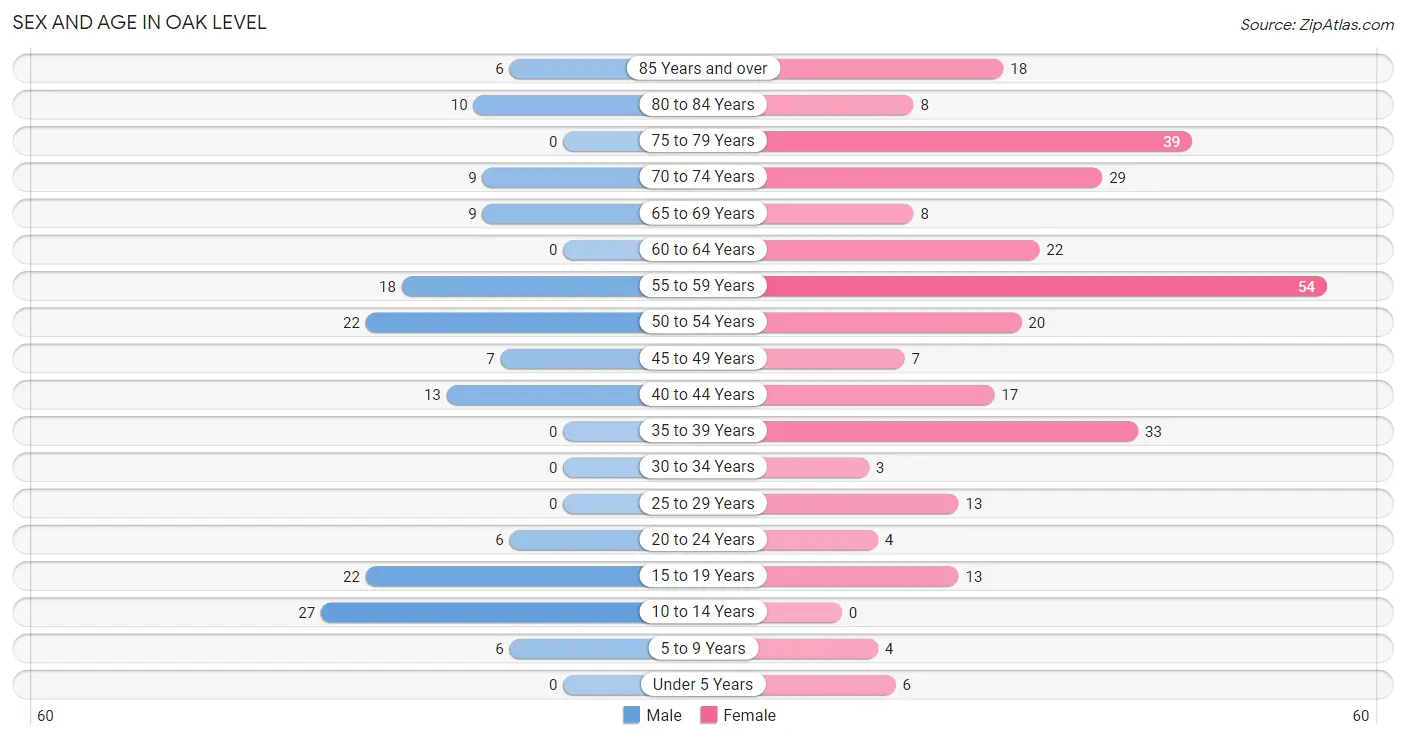
Sex and Age in Oak Level
Sex and Age in Oak Level
The most populous age groups in Oak Level are 10 to 14 Years (27 | 17.4%) for men and 55 to 59 Years (54 | 18.1%) for women.
| Age Bracket | Male | Female |
| Under 5 Years | 0 (0.0%) | 6 (2.0%) |
| 5 to 9 Years | 6 (3.9%) | 4 (1.3%) |
| 10 to 14 Years | 27 (17.4%) | 0 (0.0%) |
| 15 to 19 Years | 22 (14.2%) | 13 (4.4%) |
| 20 to 24 Years | 6 (3.9%) | 4 (1.3%) |
| 25 to 29 Years | 0 (0.0%) | 13 (4.4%) |
| 30 to 34 Years | 0 (0.0%) | 3 (1.0%) |
| 35 to 39 Years | 0 (0.0%) | 33 (11.1%) |
| 40 to 44 Years | 13 (8.4%) | 17 (5.7%) |
| 45 to 49 Years | 7 (4.5%) | 7 (2.4%) |
| 50 to 54 Years | 22 (14.2%) | 20 (6.7%) |
| 55 to 59 Years | 18 (11.6%) | 54 (18.1%) |
| 60 to 64 Years | 0 (0.0%) | 22 (7.4%) |
| 65 to 69 Years | 9 (5.8%) | 8 (2.7%) |
| 70 to 74 Years | 9 (5.8%) | 29 (9.7%) |
| 75 to 79 Years | 0 (0.0%) | 39 (13.1%) |
| 80 to 84 Years | 10 (6.5%) | 8 (2.7%) |
| 85 Years and over | 6 (3.9%) | 18 (6.0%) |
| Total | 155 (100.0%) | 298 (100.0%) |
Families and Households in Oak Level
Median Family Size in Oak Level
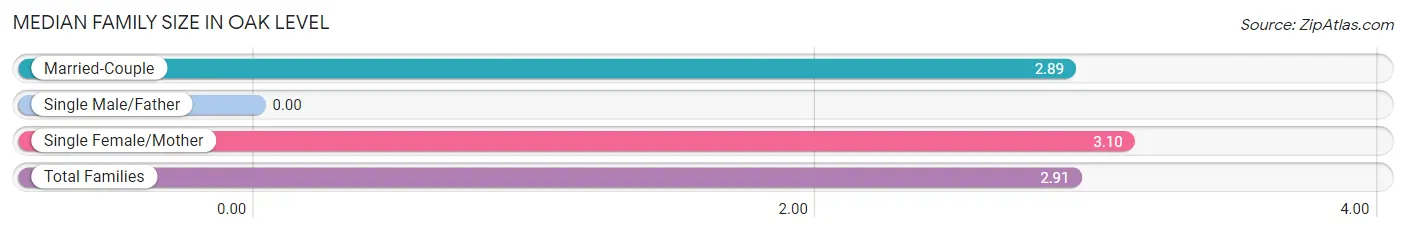
| Family Type | # Families | Family Size |
| Married-Couple | 90 (90.0%) | 2.89 |
| Single Male/Father | 0 (0.0%) | - |
| Single Female/Mother | 10 (10.0%) | 3.10 |
| Total Families | 100 (100.0%) | 2.91 |
Median Household Size in Oak Level
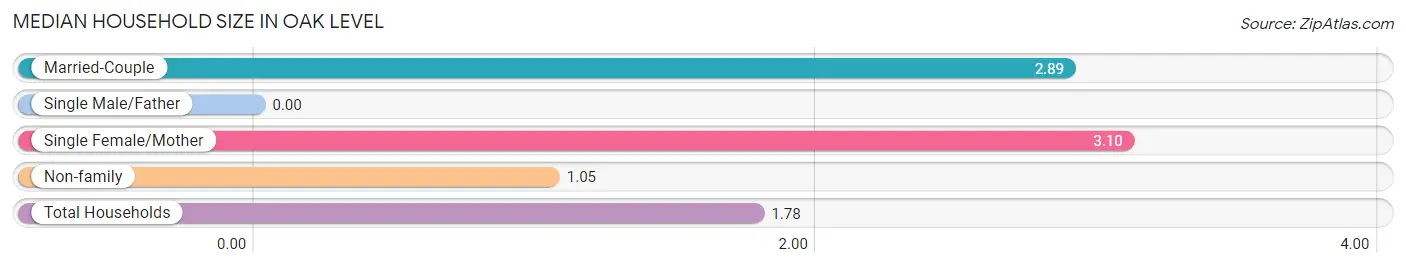
| Household Type | # Households | Household Size |
| Married-Couple | 90 (35.3%) | 2.89 |
| Single Male/Father | 0 (0.0%) | - |
| Single Female/Mother | 10 (3.9%) | 3.10 |
| Non-family | 155 (60.8%) | 1.05 |
| Total Households | 255 (100.0%) | 1.78 |
Household Size by Marriage Status in Oak Level
Out of a total of 255 households in Oak Level, 100 (39.2%) are family households, while 155 (60.8%) are nonfamily households. The most numerous type of family households are 2-person households, comprising 57, and the most common type of nonfamily households are 1-person households, comprising 147.
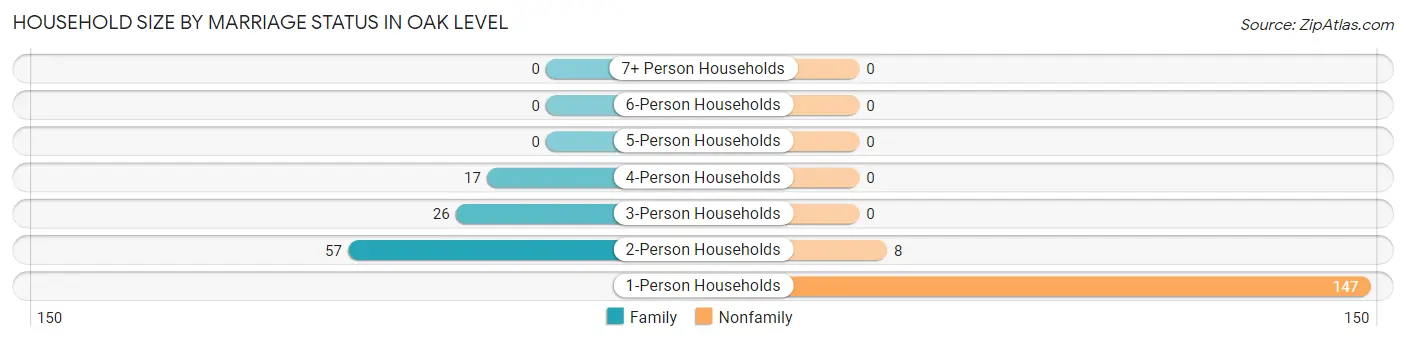
| Household Size | Family Households | Nonfamily Households |
| 1-Person Households | - | 147 (57.7%) |
| 2-Person Households | 57 (22.4%) | 8 (3.1%) |
| 3-Person Households | 26 (10.2%) | 0 (0.0%) |
| 4-Person Households | 17 (6.7%) | 0 (0.0%) |
| 5-Person Households | 0 (0.0%) | 0 (0.0%) |
| 6-Person Households | 0 (0.0%) | 0 (0.0%) |
| 7+ Person Households | 0 (0.0%) | 0 (0.0%) |
| Total | 100 (39.2%) | 155 (60.8%) |
Female Fertility in Oak Level
Fertility by Age in Oak Level
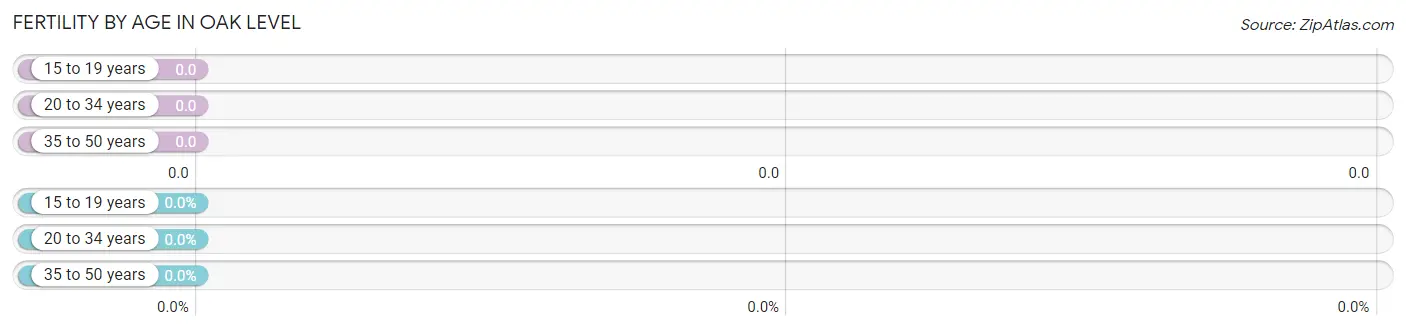
| Age Bracket | Women with Births | Births / 1,000 Women |
| 15 to 19 years | 0 (0.0%) | 0.0 |
| 20 to 34 years | 0 (0.0%) | 0.0 |
| 35 to 50 years | 0 (0.0%) | 0.0 |
| Total | 0 (0.0%) | 0.0 |
Fertility by Age by Marriage Status in Oak Level
| Age Bracket | Married | Unmarried |
| 15 to 19 years | 0 (0.0%) | 0 (0.0%) |
| 20 to 34 years | 0 (0.0%) | 0 (0.0%) |
| 35 to 50 years | 0 (0.0%) | 0 (0.0%) |
| Total | 0 (0.0%) | 0 (0.0%) |
Fertility by Education in Oak Level
| Educational Attainment | Women with Births | Births / 1,000 Women |
| Less than High School | 0 (0.0%) | 0.0 |
| High School Diploma | 0 (0.0%) | 0.0 |
| College or Associate's Degree | 0 (0.0%) | 0.0 |
| Bachelor's Degree | 0 (0.0%) | 0.0 |
| Graduate Degree | 0 (0.0%) | 0.0 |
| Total | 0 (0.0%) | 0.0 |
Fertility by Education by Marriage Status in Oak Level
| Educational Attainment | Married | Unmarried |
| Less than High School | 0 (0.0%) | 0 (0.0%) |
| High School Diploma | 0 (0.0%) | 0 (0.0%) |
| College or Associate's Degree | 0 (0.0%) | 0 (0.0%) |
| Bachelor's Degree | 0 (0.0%) | 0 (0.0%) |
| Graduate Degree | 0 (0.0%) | 0 (0.0%) |
| Total | 0 (0.0%) | 0 (0.0%) |
Income in Oak Level
Income Overview in Oak Level
| Characteristic | Number | Measure |
| Per Capita Income | 453 | $20,335 |
| Median Family Income | 100 | $0 |
| Mean Family Income | 100 | $53,315 |
| Median Household Income | 255 | $32,523 |
| Mean Household Income | 255 | $35,704 |
| Income Deficit | 100 | $6,058 |
| Wage / Income Gap (%) | 453 | 27.27% |
| Wage / Income Gap ($) | 453 | 72.73¢ per $1 |
| Gini / Inequality Index | 453 | 0.40 |
Earnings by Sex in Oak Level
Average Earnings in Oak Level are $27,344, $34,375 for men and $25,000 for women, a difference of 27.3%.
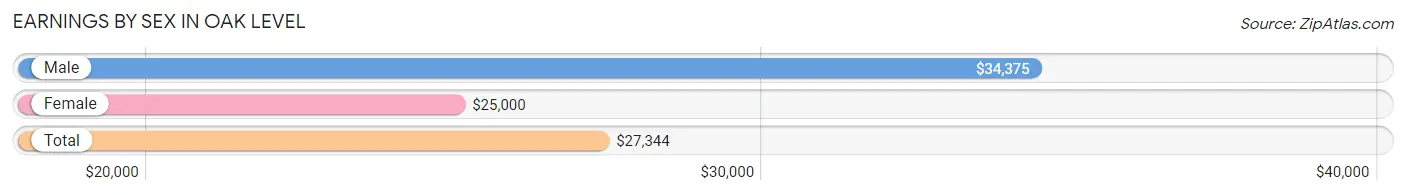
| Sex | Number | Average Earnings |
| Male | 61 (34.1%) | $34,375 |
| Female | 118 (65.9%) | $25,000 |
| Total | 179 (100.0%) | $27,344 |
Earnings by Sex by Income Bracket in Oak Level
The most common earnings brackets in Oak Level are $17,500 to $19,999 for men (14 | 23.0%) and $30,000 to $34,999 for women (43 | 36.4%).
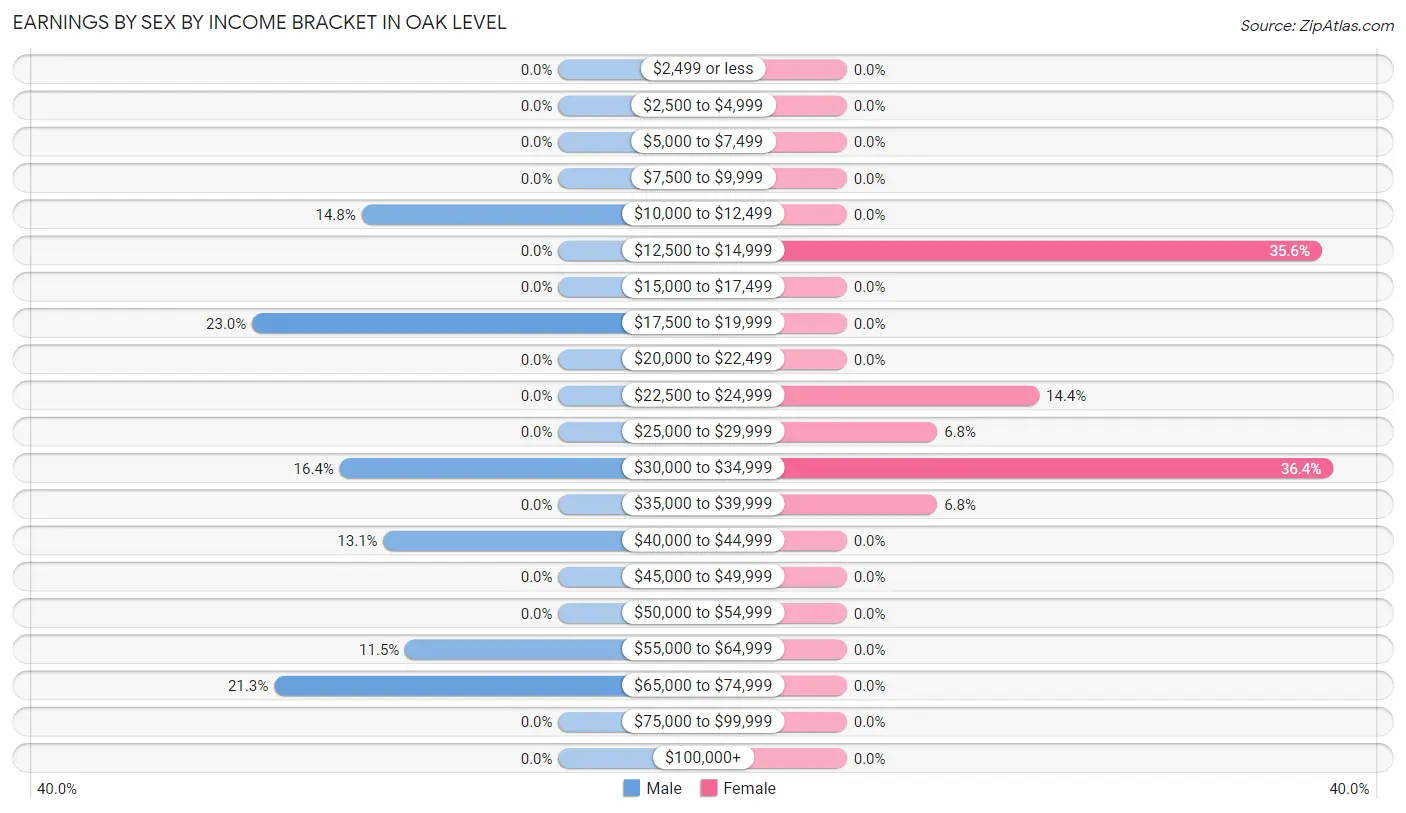
| Income | Male | Female |
| $2,499 or less | 0 (0.0%) | 0 (0.0%) |
| $2,500 to $4,999 | 0 (0.0%) | 0 (0.0%) |
| $5,000 to $7,499 | 0 (0.0%) | 0 (0.0%) |
| $7,500 to $9,999 | 0 (0.0%) | 0 (0.0%) |
| $10,000 to $12,499 | 9 (14.7%) | 0 (0.0%) |
| $12,500 to $14,999 | 0 (0.0%) | 42 (35.6%) |
| $15,000 to $17,499 | 0 (0.0%) | 0 (0.0%) |
| $17,500 to $19,999 | 14 (23.0%) | 0 (0.0%) |
| $20,000 to $22,499 | 0 (0.0%) | 0 (0.0%) |
| $22,500 to $24,999 | 0 (0.0%) | 17 (14.4%) |
| $25,000 to $29,999 | 0 (0.0%) | 8 (6.8%) |
| $30,000 to $34,999 | 10 (16.4%) | 43 (36.4%) |
| $35,000 to $39,999 | 0 (0.0%) | 8 (6.8%) |
| $40,000 to $44,999 | 8 (13.1%) | 0 (0.0%) |
| $45,000 to $49,999 | 0 (0.0%) | 0 (0.0%) |
| $50,000 to $54,999 | 0 (0.0%) | 0 (0.0%) |
| $55,000 to $64,999 | 7 (11.5%) | 0 (0.0%) |
| $65,000 to $74,999 | 13 (21.3%) | 0 (0.0%) |
| $75,000 to $99,999 | 0 (0.0%) | 0 (0.0%) |
| $100,000+ | 0 (0.0%) | 0 (0.0%) |
| Total | 61 (100.0%) | 118 (100.0%) |
Earnings by Sex by Educational Attainment in Oak Level
| Educational Attainment | Male Income | Female Income |
| Less than High School | - | - |
| High School Diploma | - | - |
| College or Associate's Degree | - | - |
| Bachelor's Degree | - | - |
| Graduate Degree | - | - |
| Total | $34,375 | $25,000 |
Family Income in Oak Level
Family Income Brackets in Oak Level
According to the Oak Level family income data, there are 39 families falling into the $15,000 to $24,999 income range, which is the most common income bracket and makes up 39.0% of all families.
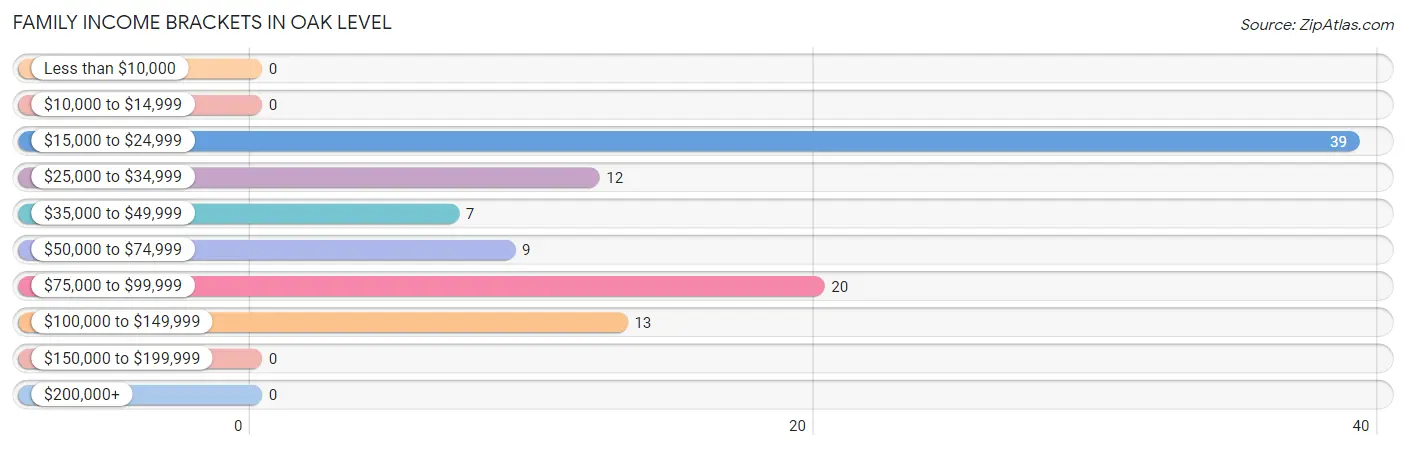
| Income Bracket | # Families | % Families |
| Less than $10,000 | 0 | 0.0% |
| $10,000 to $14,999 | 0 | 0.0% |
| $15,000 to $24,999 | 39 | 39.0% |
| $25,000 to $34,999 | 12 | 12.0% |
| $35,000 to $49,999 | 7 | 7.0% |
| $50,000 to $74,999 | 9 | 9.0% |
| $75,000 to $99,999 | 20 | 20.0% |
| $100,000 to $149,999 | 13 | 13.0% |
| $150,000 to $199,999 | 0 | 0.0% |
| $200,000+ | 0 | 0.0% |
Family Income by Famaliy Size in Oak Level
2-person families (57 | 57.0%) account for the highest median family income in Oak Level with $45,179 per family, while 2-person families (57 | 57.0%) have the highest median income of $22,590 per family member.
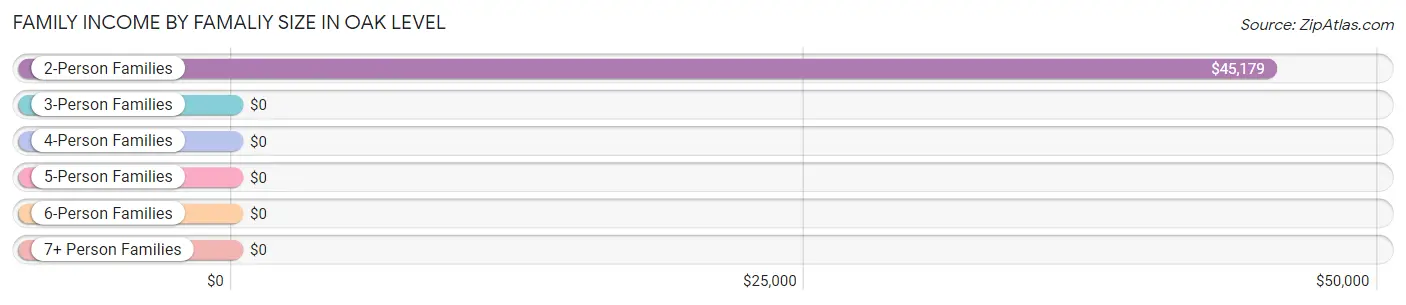
| Income Bracket | # Families | Median Income |
| 2-Person Families | 57 (57.0%) | $45,179 |
| 3-Person Families | 26 (26.0%) | $0 |
| 4-Person Families | 17 (17.0%) | $0 |
| 5-Person Families | 0 (0.0%) | $0 |
| 6-Person Families | 0 (0.0%) | $0 |
| 7+ Person Families | 0 (0.0%) | $0 |
| Total | 100 (100.0%) | $0 |
Family Income by Number of Earners in Oak Level
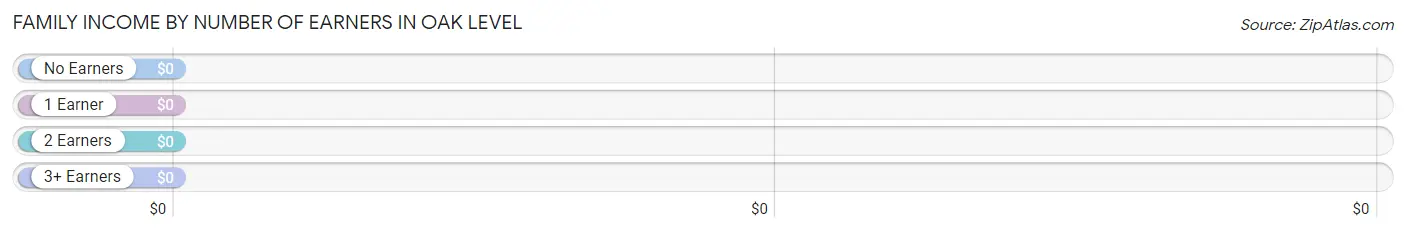
| Number of Earners | # Families | Median Income |
| No Earners | 45 (45.0%) | $0 |
| 1 Earner | 35 (35.0%) | $0 |
| 2 Earners | 20 (20.0%) | $0 |
| 3+ Earners | 0 (0.0%) | $0 |
| Total | 100 (100.0%) | $0 |
Household Income in Oak Level
Household Income Brackets in Oak Level
With 75 households falling in the category, the $10,000 to $14,999 income range is the most frequent in Oak Level, accounting for 29.4% of all households.
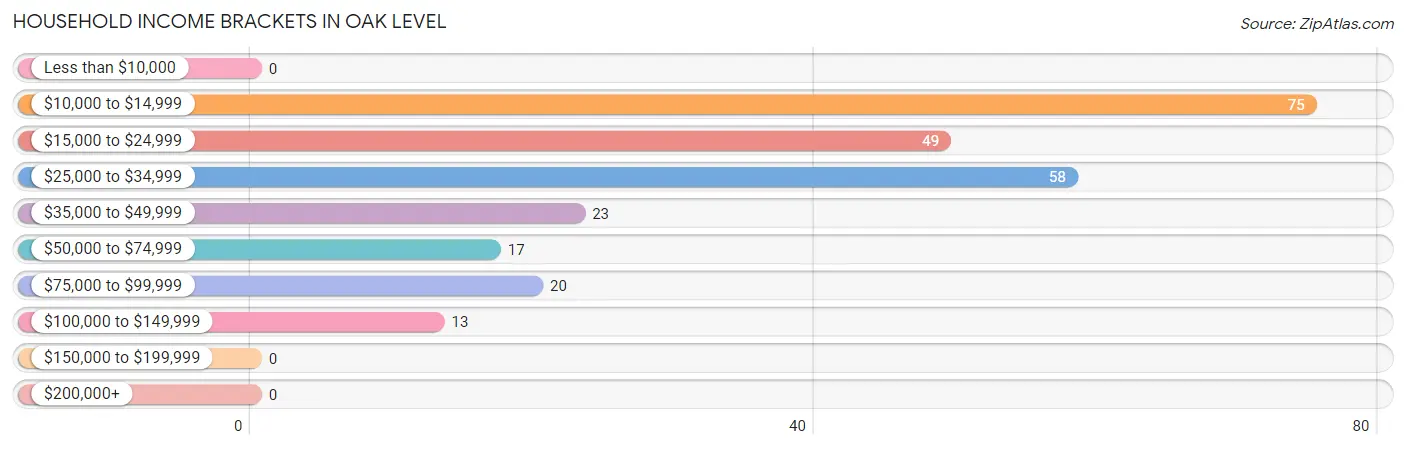
| Income Bracket | # Households | % Households |
| Less than $10,000 | 0 | 0.0% |
| $10,000 to $14,999 | 75 | 29.4% |
| $15,000 to $24,999 | 49 | 19.2% |
| $25,000 to $34,999 | 58 | 22.7% |
| $35,000 to $49,999 | 23 | 9.0% |
| $50,000 to $74,999 | 17 | 6.7% |
| $75,000 to $99,999 | 20 | 7.8% |
| $100,000 to $149,999 | 13 | 5.1% |
| $150,000 to $199,999 | 0 | 0.0% |
| $200,000+ | 0 | 0.0% |
Household Income by Householder Age in Oak Level
The median household income in Oak Level is $32,523, with the highest median household income of $18,654 found in the 45 to 64 years age bracket for the primary householder. A total of 110 households (43.1%) fall into this category. Meanwhile, the 15 to 24 years age bracket for the primary householder has the lowest median household income of $0, with 4 households (1.6%) in this group.
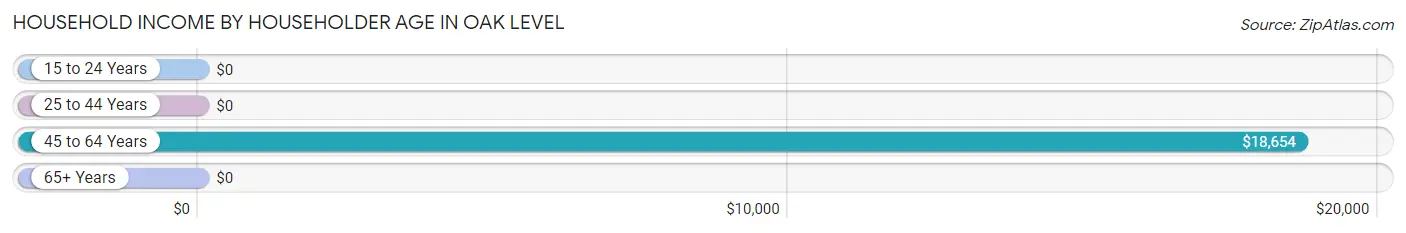
| Income Bracket | # Households | Median Income |
| 15 to 24 Years | 4 (1.6%) | $0 |
| 25 to 44 Years | 49 (19.2%) | $0 |
| 45 to 64 Years | 110 (43.1%) | $18,654 |
| 65+ Years | 92 (36.1%) | $0 |
| Total | 255 (100.0%) | $32,523 |
Poverty in Oak Level
Income Below Poverty by Sex and Age in Oak Level
With 22.6% poverty level for males and 39.6% for females among the residents of Oak Level, 5 year old males and under 5 year old females are the most vulnerable to poverty, with 6 males (100.0%) and 6 females (100.0%) in their respective age groups living below the poverty level.
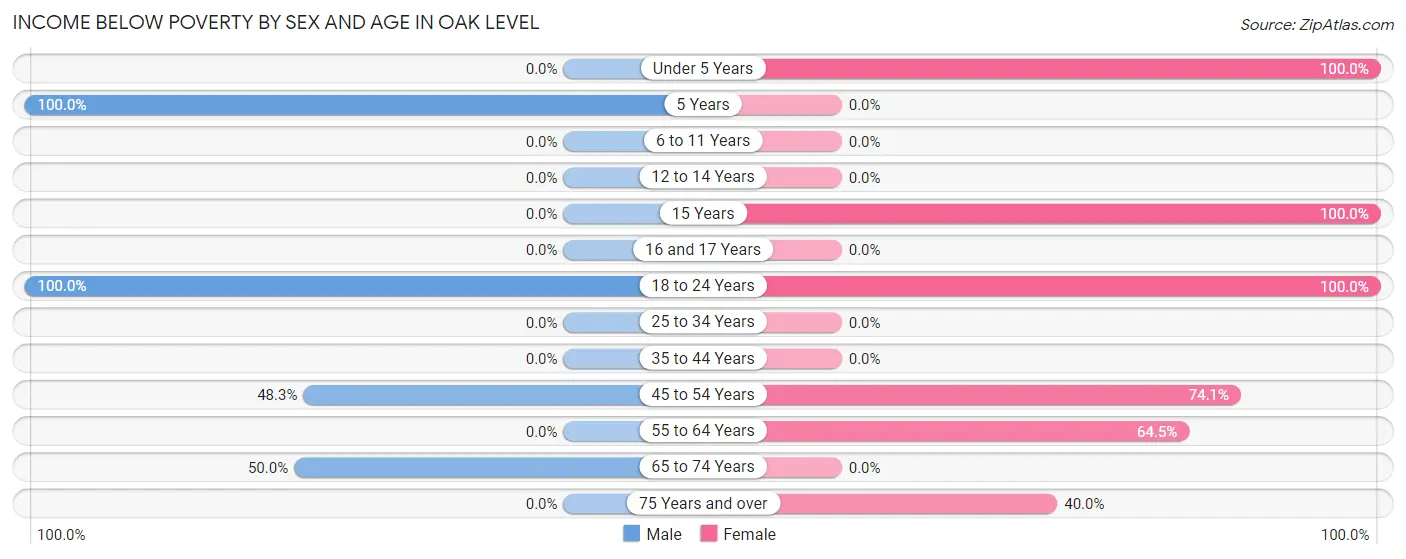
| Age Bracket | Male | Female |
| Under 5 Years | 0 (0.0%) | 6 (100.0%) |
| 5 Years | 6 (100.0%) | 0 (0.0%) |
| 6 to 11 Years | 0 (0.0%) | 0 (0.0%) |
| 12 to 14 Years | 0 (0.0%) | 0 (0.0%) |
| 15 Years | 0 (0.0%) | 13 (100.0%) |
| 16 and 17 Years | 0 (0.0%) | 0 (0.0%) |
| 18 to 24 Years | 6 (100.0%) | 4 (100.0%) |
| 25 to 34 Years | 0 (0.0%) | 0 (0.0%) |
| 35 to 44 Years | 0 (0.0%) | 0 (0.0%) |
| 45 to 54 Years | 14 (48.3%) | 20 (74.1%) |
| 55 to 64 Years | 0 (0.0%) | 49 (64.5%) |
| 65 to 74 Years | 9 (50.0%) | 0 (0.0%) |
| 75 Years and over | 0 (0.0%) | 26 (40.0%) |
| Total | 35 (22.6%) | 118 (39.6%) |
Income Above Poverty by Sex and Age in Oak Level
According to the poverty statistics in Oak Level, males aged 12 to 14 years and females aged 6 to 11 years are the age groups that are most secure financially, with 100.0% of males and 100.0% of females in these age groups living above the poverty line.
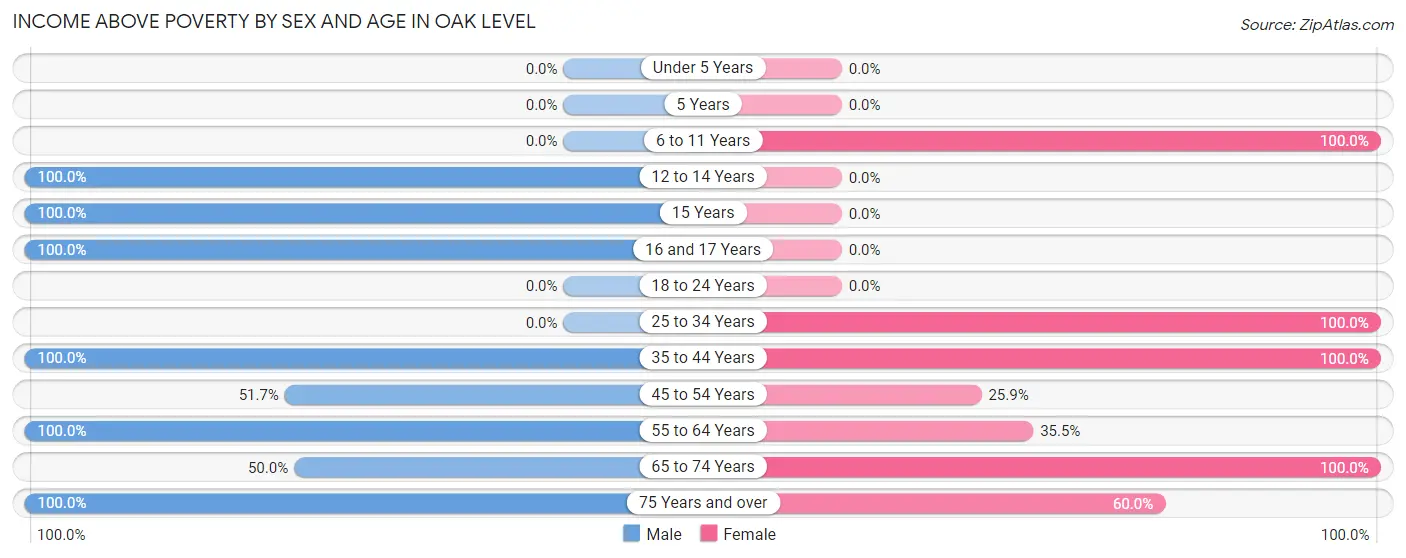
| Age Bracket | Male | Female |
| Under 5 Years | 0 (0.0%) | 0 (0.0%) |
| 5 Years | 0 (0.0%) | 0 (0.0%) |
| 6 to 11 Years | 0 (0.0%) | 4 (100.0%) |
| 12 to 14 Years | 27 (100.0%) | 0 (0.0%) |
| 15 Years | 18 (100.0%) | 0 (0.0%) |
| 16 and 17 Years | 4 (100.0%) | 0 (0.0%) |
| 18 to 24 Years | 0 (0.0%) | 0 (0.0%) |
| 25 to 34 Years | 0 (0.0%) | 16 (100.0%) |
| 35 to 44 Years | 13 (100.0%) | 50 (100.0%) |
| 45 to 54 Years | 15 (51.7%) | 7 (25.9%) |
| 55 to 64 Years | 18 (100.0%) | 27 (35.5%) |
| 65 to 74 Years | 9 (50.0%) | 37 (100.0%) |
| 75 Years and over | 16 (100.0%) | 39 (60.0%) |
| Total | 120 (77.4%) | 180 (60.4%) |
Income Below Poverty Among Married-Couple Families in Oak Level
The poverty statistics for married-couple families in Oak Level show that 26.7% or 24 of the total 90 families live below the poverty line. Families with 1 or 2 children have the highest poverty rate of 42.5%, comprising of 17 families. On the other hand, families with no children have the lowest poverty rate of 14.0%, which includes 7 families.
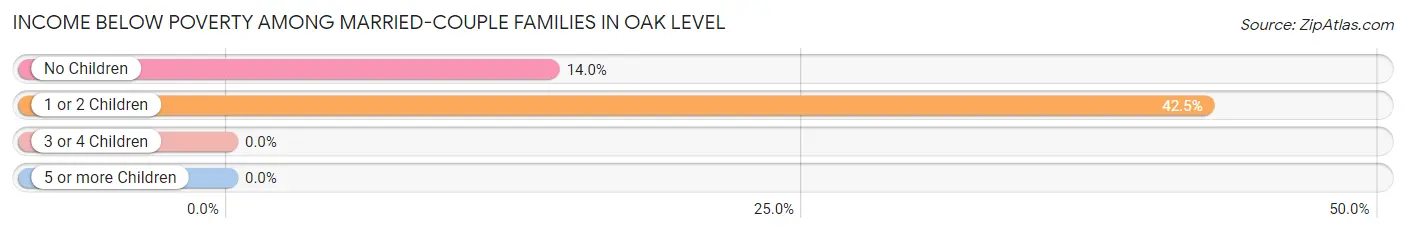
| Children | Above Poverty | Below Poverty |
| No Children | 43 (86.0%) | 7 (14.0%) |
| 1 or 2 Children | 23 (57.5%) | 17 (42.5%) |
| 3 or 4 Children | 0 (0.0%) | 0 (0.0%) |
| 5 or more Children | 0 (0.0%) | 0 (0.0%) |
| Total | 66 (73.3%) | 24 (26.7%) |
Income Below Poverty Among Single-Parent Households in Oak Level
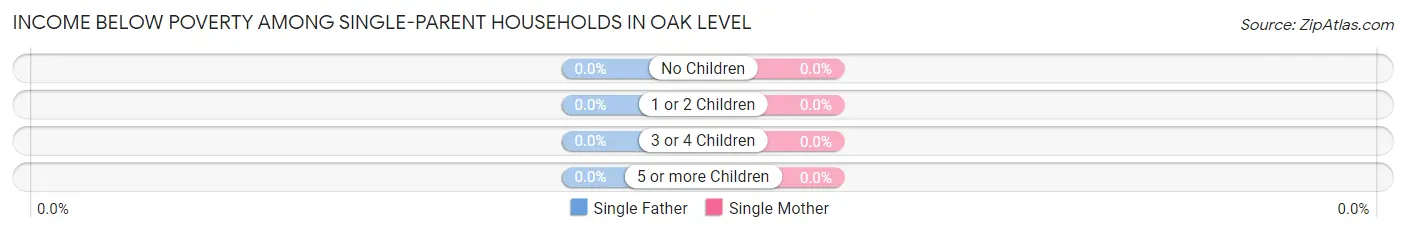
| Children | Single Father | Single Mother |
| No Children | 0 (0.0%) | 0 (0.0%) |
| 1 or 2 Children | 0 (0.0%) | 0 (0.0%) |
| 3 or 4 Children | 0 (0.0%) | 0 (0.0%) |
| 5 or more Children | 0 (0.0%) | 0 (0.0%) |
| Total | 0 (0.0%) | 0 (0.0%) |
Income Below Poverty Among Married-Couple vs Single-Parent Households in Oak Level
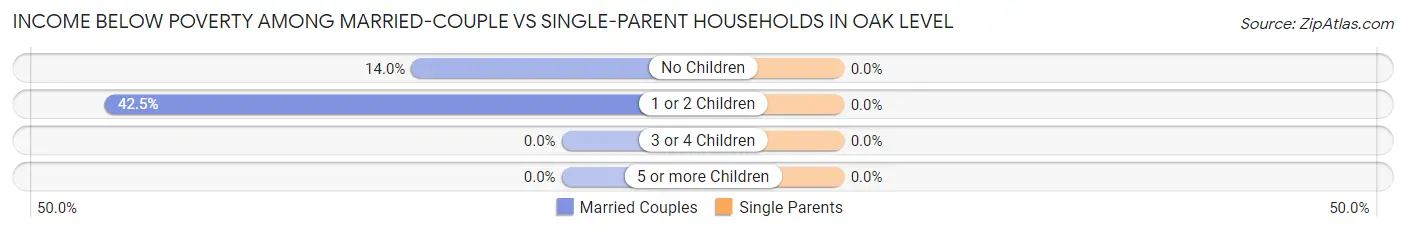
| Children | Married-Couple Families | Single-Parent Households |
| No Children | 7 (14.0%) | 0 (0.0%) |
| 1 or 2 Children | 17 (42.5%) | 0 (0.0%) |
| 3 or 4 Children | 0 (0.0%) | 0 (0.0%) |
| 5 or more Children | 0 (0.0%) | 0 (0.0%) |
| Total | 24 (26.7%) | 0 (0.0%) |
Employment Characteristics in Oak Level
Employment by Class of Employer in Oak Level
Among the 179 employed individuals in Oak Level, private company employees (116 | 64.8%), federal government employees (22 | 12.3%), and local government employees (17 | 9.5%) make up the most common classes of employment.
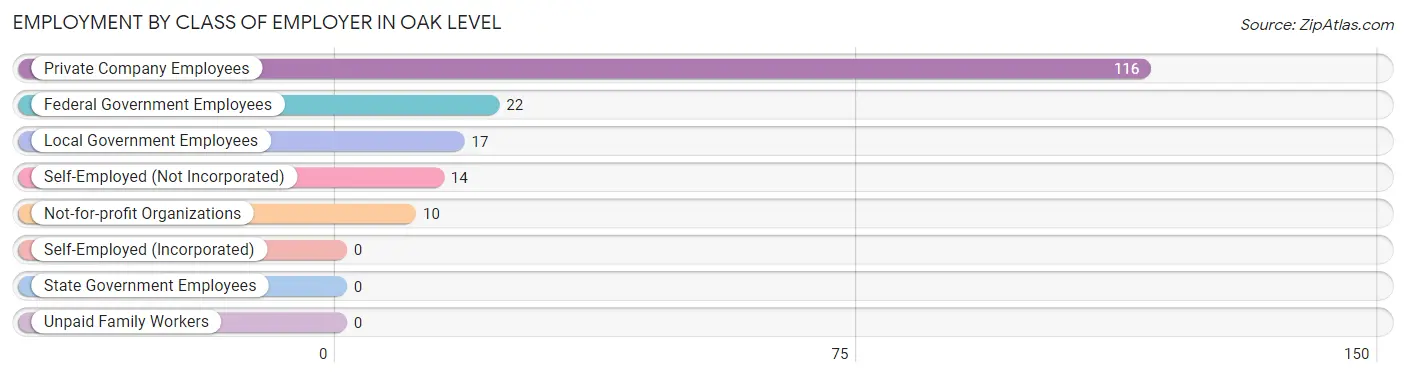
| Employer Class | # Employees | % Employees |
| Private Company Employees | 116 | 64.8% |
| Self-Employed (Incorporated) | 0 | 0.0% |
| Self-Employed (Not Incorporated) | 14 | 7.8% |
| Not-for-profit Organizations | 10 | 5.6% |
| Local Government Employees | 17 | 9.5% |
| State Government Employees | 0 | 0.0% |
| Federal Government Employees | 22 | 12.3% |
| Unpaid Family Workers | 0 | 0.0% |
| Total | 179 | 100.0% |
Employment Status by Age in Oak Level
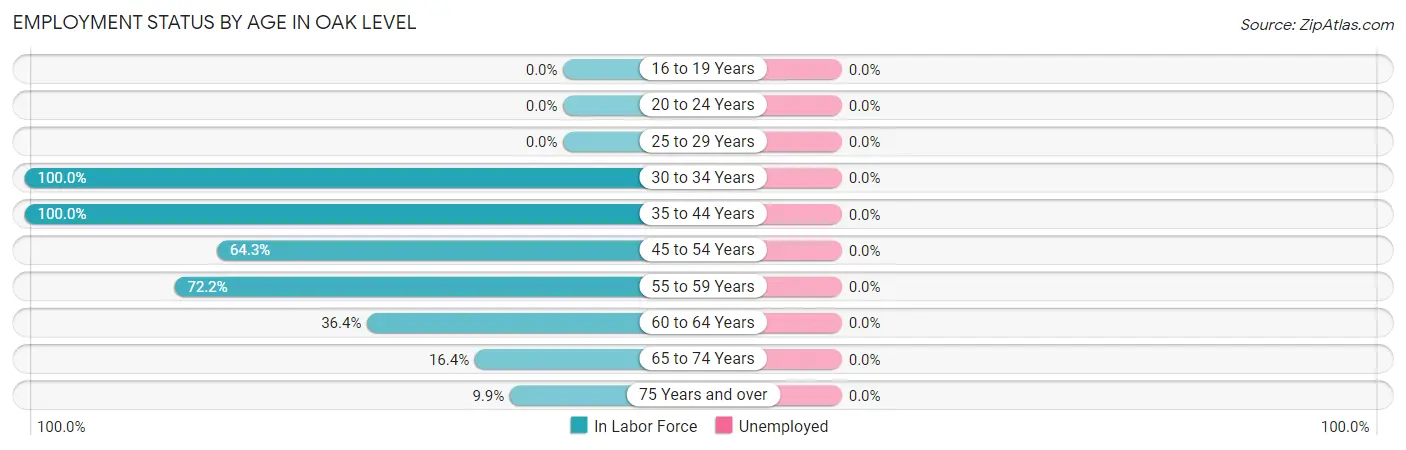
| Age Bracket | In Labor Force | Unemployed |
| 16 to 19 Years | 0 (0.0%) | 0 (0.0%) |
| 20 to 24 Years | 0 (0.0%) | 0 (0.0%) |
| 25 to 29 Years | 0 (0.0%) | 0 (0.0%) |
| 30 to 34 Years | 3 (100.0%) | 0 (0.0%) |
| 35 to 44 Years | 63 (100.0%) | 0 (0.0%) |
| 45 to 54 Years | 36 (64.3%) | 0 (0.0%) |
| 55 to 59 Years | 52 (72.2%) | 0 (0.0%) |
| 60 to 64 Years | 8 (36.4%) | 0 (0.0%) |
| 65 to 74 Years | 9 (16.4%) | 0 (0.0%) |
| 75 Years and over | 8 (9.9%) | 0 (0.0%) |
| Total | 179 (47.2%) | 0 (0.0%) |
Employment Status by Educational Attainment in Oak Level
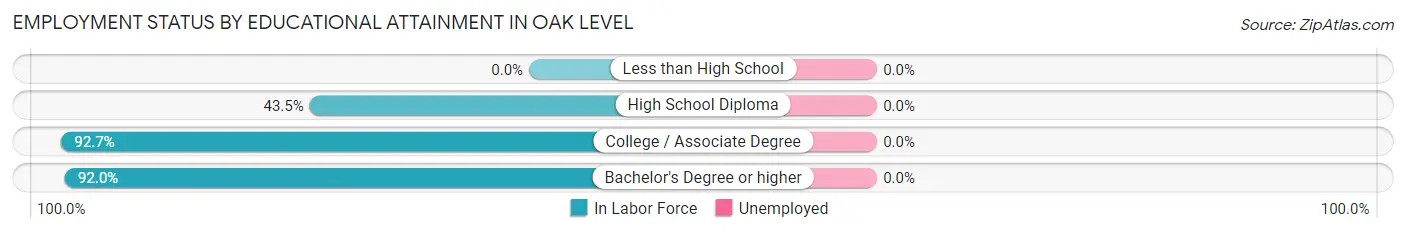
| Educational Attainment | In Labor Force | Unemployed |
| Less than High School | 0 (0.0%) | 0 (0.0%) |
| High School Diploma | 27 (43.5%) | 0 (0.0%) |
| College / Associate Degree | 89 (92.7%) | 0 (0.0%) |
| Bachelor's Degree or higher | 46 (92.0%) | 0 (0.0%) |
| Total | 162 (70.7%) | 0 (0.0%) |
Employment Occupations by Sex in Oak Level
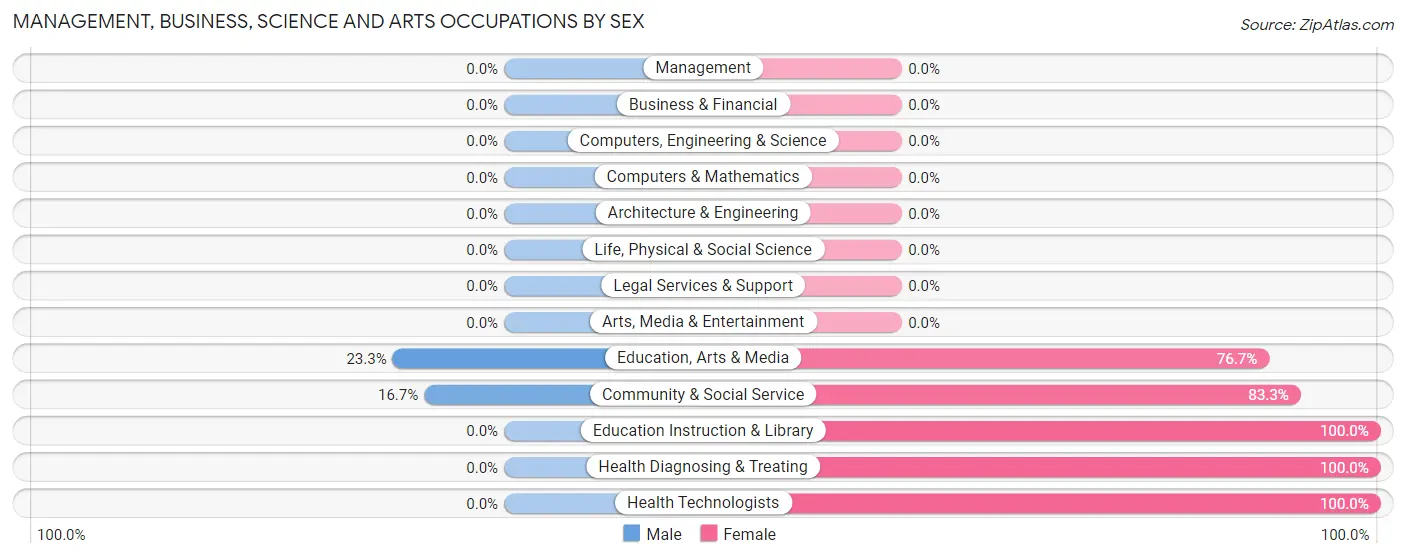
Management, Business, Science and Arts Occupations
The most common Management, Business, Science and Arts occupations in Oak Level are Community & Social Service (60 | 33.5%), Education, Arts & Media (43 | 24.0%), Health Diagnosing & Treating (42 | 23.5%), Health Technologists (42 | 23.5%), and Education Instruction & Library (17 | 9.5%).
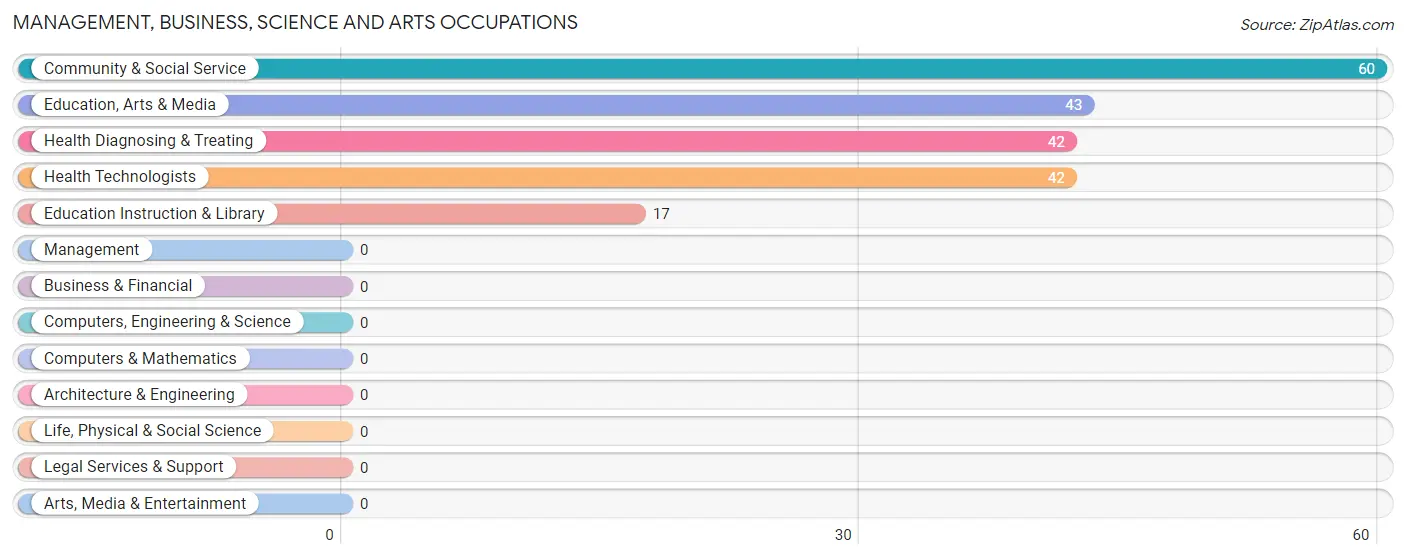
Management, Business, Science and Arts Occupations by Sex
Within the Management, Business, Science and Arts occupations in Oak Level, the most male-oriented occupations are Education, Arts & Media (23.3%), and Community & Social Service (16.7%), while the most female-oriented occupations are Education Instruction & Library (100.0%), Health Diagnosing & Treating (100.0%), and Health Technologists (100.0%).
| Occupation | Male | Female |
| Management | 0 (0.0%) | 0 (0.0%) |
| Business & Financial | 0 (0.0%) | 0 (0.0%) |
| Computers, Engineering & Science | 0 (0.0%) | 0 (0.0%) |
| Computers & Mathematics | 0 (0.0%) | 0 (0.0%) |
| Architecture & Engineering | 0 (0.0%) | 0 (0.0%) |
| Life, Physical & Social Science | 0 (0.0%) | 0 (0.0%) |
| Community & Social Service | 10 (16.7%) | 50 (83.3%) |
| Education, Arts & Media | 10 (23.3%) | 33 (76.7%) |
| Legal Services & Support | 0 (0.0%) | 0 (0.0%) |
| Education Instruction & Library | 0 (0.0%) | 17 (100.0%) |
| Arts, Media & Entertainment | 0 (0.0%) | 0 (0.0%) |
| Health Diagnosing & Treating | 0 (0.0%) | 42 (100.0%) |
| Health Technologists | 0 (0.0%) | 42 (100.0%) |
| Total (Category) | 10 (9.8%) | 92 (90.2%) |
| Total (Overall) | 61 (34.1%) | 118 (65.9%) |
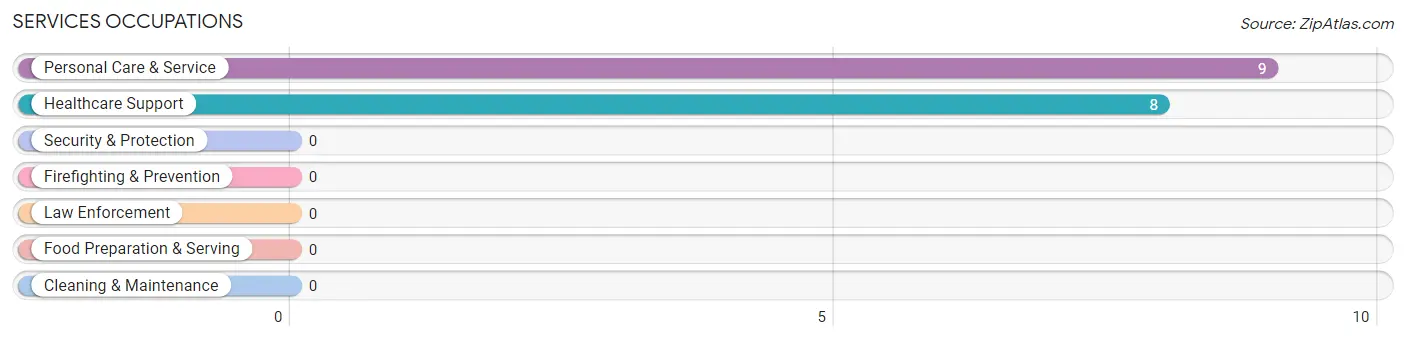
Services Occupations
The most common Services occupations in Oak Level are Personal Care & Service (9 | 5.0%), and Healthcare Support (8 | 4.5%).
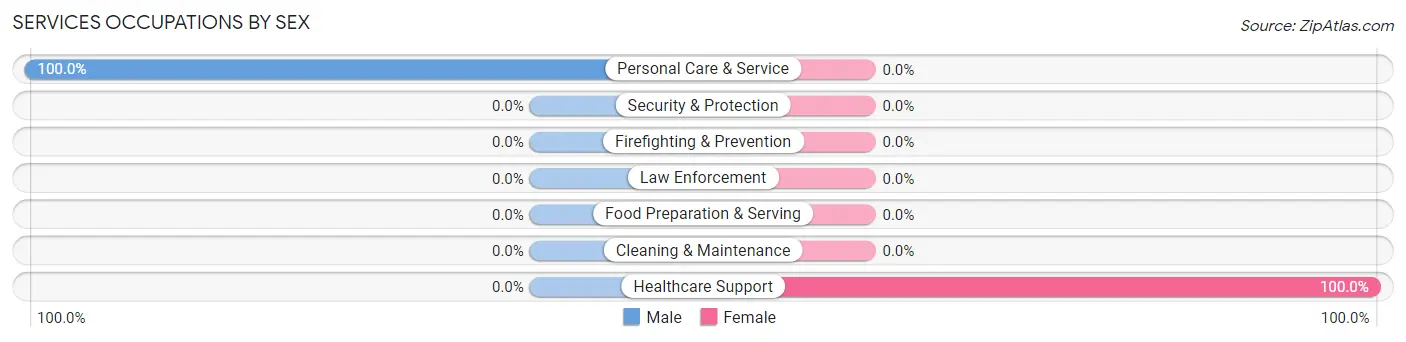
Services Occupations by Sex
| Occupation | Male | Female |
| Healthcare Support | 0 (0.0%) | 8 (100.0%) |
| Security & Protection | 0 (0.0%) | 0 (0.0%) |
| Firefighting & Prevention | 0 (0.0%) | 0 (0.0%) |
| Law Enforcement | 0 (0.0%) | 0 (0.0%) |
| Food Preparation & Serving | 0 (0.0%) | 0 (0.0%) |
| Cleaning & Maintenance | 0 (0.0%) | 0 (0.0%) |
| Personal Care & Service | 9 (100.0%) | 0 (0.0%) |
| Total (Category) | 9 (52.9%) | 8 (47.1%) |
| Total (Overall) | 61 (34.1%) | 118 (65.9%) |
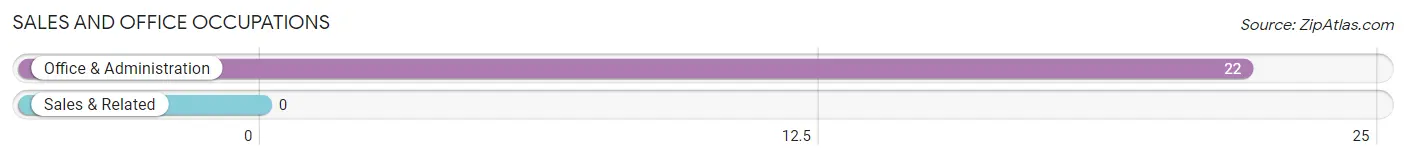
Sales and Office Occupations
The most common Sales and Office occupations in Oak Level are , and Office & Administration (22 | 12.3%).
Sales and Office Occupations by Sex
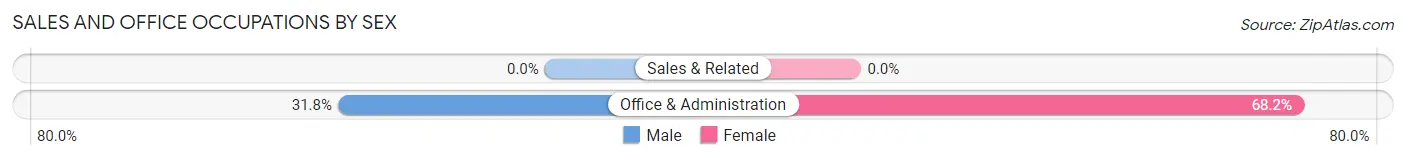
| Occupation | Male | Female |
| Sales & Related | 0 (0.0%) | 0 (0.0%) |
| Office & Administration | 7 (31.8%) | 15 (68.2%) |
| Total (Category) | 7 (31.8%) | 15 (68.2%) |
| Total (Overall) | 61 (34.1%) | 118 (65.9%) |
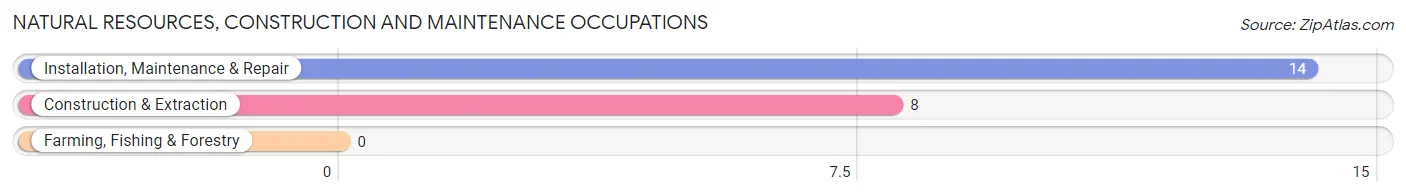
Natural Resources, Construction and Maintenance Occupations
The most common Natural Resources, Construction and Maintenance occupations in Oak Level are Installation, Maintenance & Repair (14 | 7.8%), and Construction & Extraction (8 | 4.5%).
Natural Resources, Construction and Maintenance Occupations by Sex
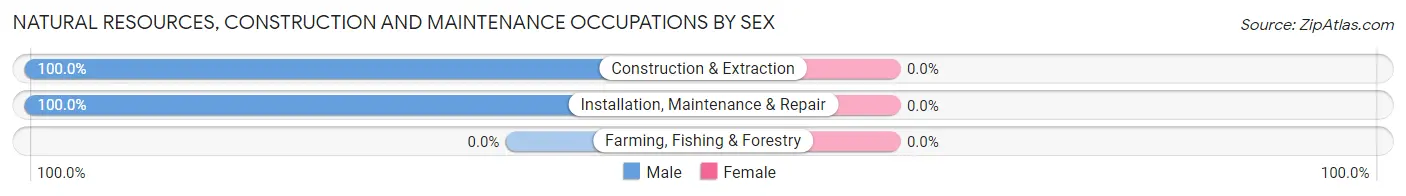
| Occupation | Male | Female |
| Farming, Fishing & Forestry | 0 (0.0%) | 0 (0.0%) |
| Construction & Extraction | 8 (100.0%) | 0 (0.0%) |
| Installation, Maintenance & Repair | 14 (100.0%) | 0 (0.0%) |
| Total (Category) | 22 (100.0%) | 0 (0.0%) |
| Total (Overall) | 61 (34.1%) | 118 (65.9%) |
Production, Transportation and Moving Occupations
The most common Production, Transportation and Moving occupations in Oak Level are Production (13 | 7.3%), and Material Moving (3 | 1.7%).
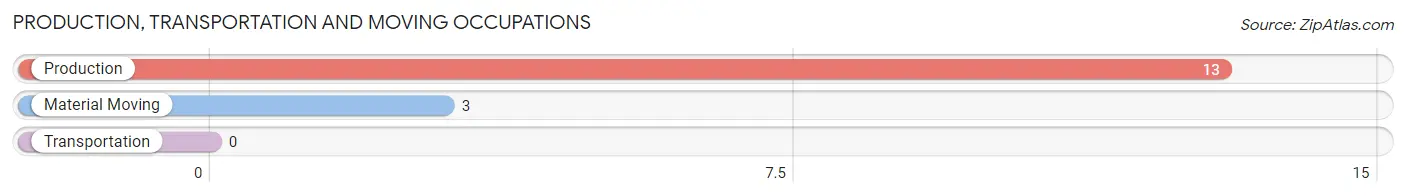
Production, Transportation and Moving Occupations by Sex
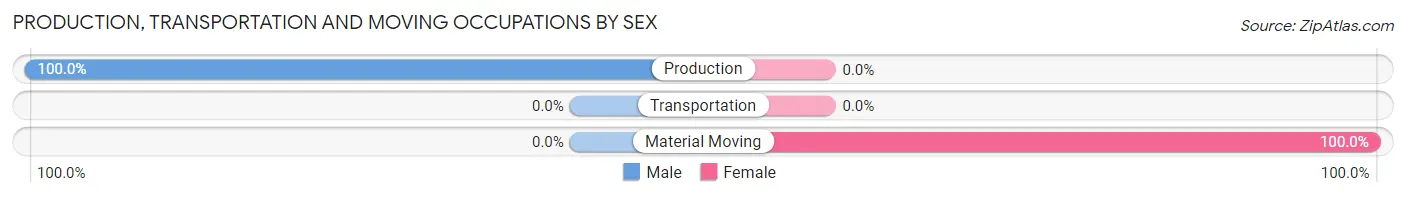
| Occupation | Male | Female |
| Production | 13 (100.0%) | 0 (0.0%) |
| Transportation | 0 (0.0%) | 0 (0.0%) |
| Material Moving | 0 (0.0%) | 3 (100.0%) |
| Total (Category) | 13 (81.2%) | 3 (18.8%) |
| Total (Overall) | 61 (34.1%) | 118 (65.9%) |
Employment Industries by Sex in Oak Level
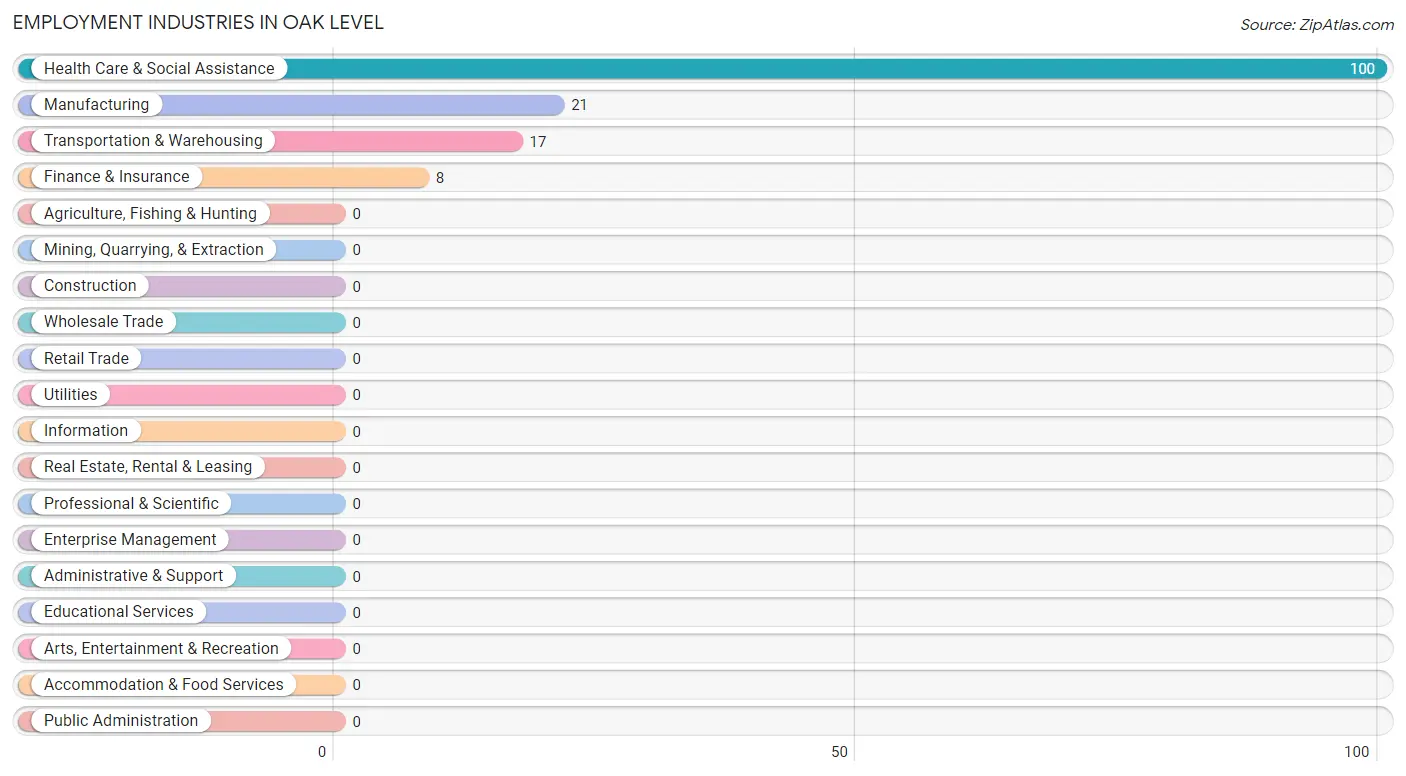
Employment Industries in Oak Level
The major employment industries in Oak Level include Health Care & Social Assistance (100 | 55.9%), Manufacturing (21 | 11.7%), Transportation & Warehousing (17 | 9.5%), and Finance & Insurance (8 | 4.5%).
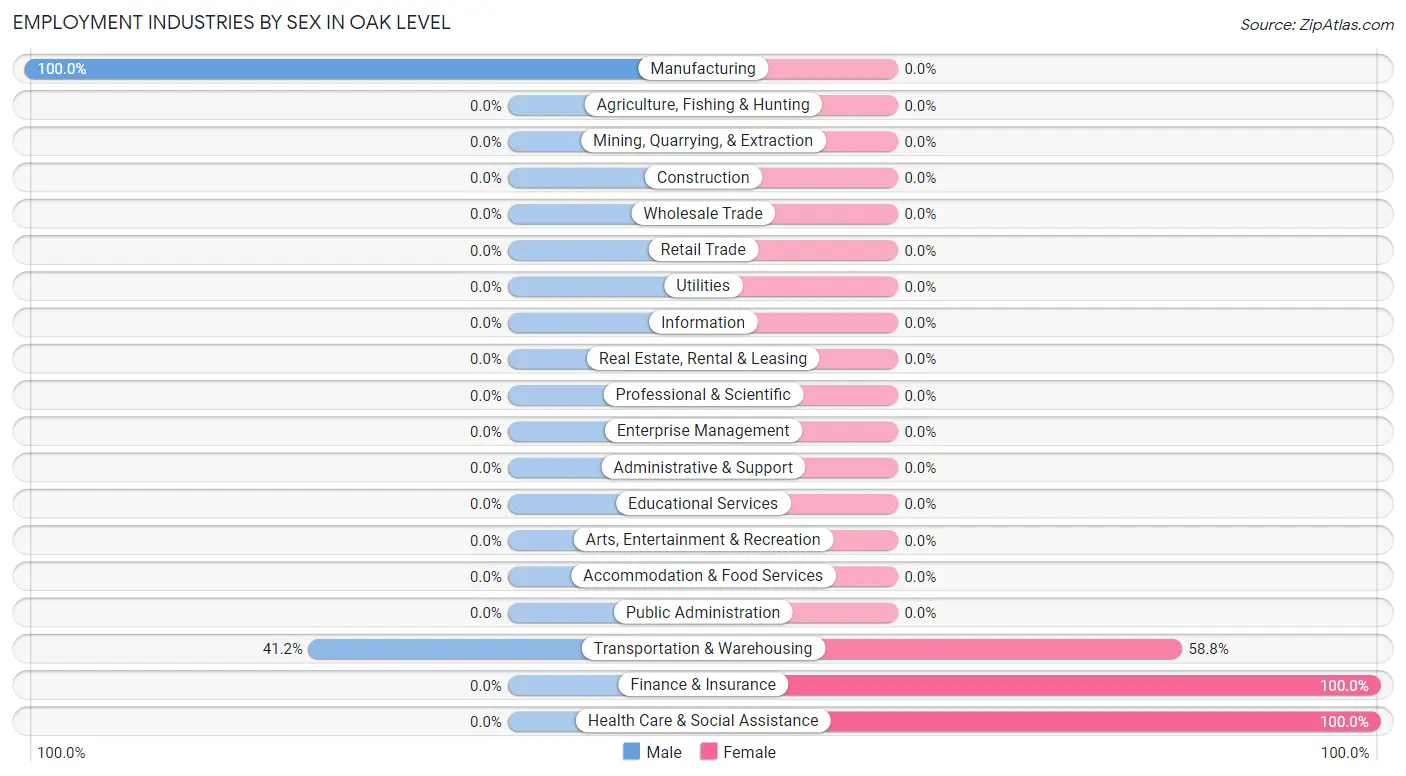
Employment Industries by Sex in Oak Level
The Oak Level industries that see more men than women are Manufacturing (100.0%), and Transportation & Warehousing (41.2%), whereas the industries that tend to have a higher number of women are Finance & Insurance (100.0%), Health Care & Social Assistance (100.0%), and Transportation & Warehousing (58.8%).
| Industry | Male | Female |
| Agriculture, Fishing & Hunting | 0 (0.0%) | 0 (0.0%) |
| Mining, Quarrying, & Extraction | 0 (0.0%) | 0 (0.0%) |
| Construction | 0 (0.0%) | 0 (0.0%) |
| Manufacturing | 21 (100.0%) | 0 (0.0%) |
| Wholesale Trade | 0 (0.0%) | 0 (0.0%) |
| Retail Trade | 0 (0.0%) | 0 (0.0%) |
| Transportation & Warehousing | 7 (41.2%) | 10 (58.8%) |
| Utilities | 0 (0.0%) | 0 (0.0%) |
| Information | 0 (0.0%) | 0 (0.0%) |
| Finance & Insurance | 0 (0.0%) | 8 (100.0%) |
| Real Estate, Rental & Leasing | 0 (0.0%) | 0 (0.0%) |
| Professional & Scientific | 0 (0.0%) | 0 (0.0%) |
| Enterprise Management | 0 (0.0%) | 0 (0.0%) |
| Administrative & Support | 0 (0.0%) | 0 (0.0%) |
| Educational Services | 0 (0.0%) | 0 (0.0%) |
| Health Care & Social Assistance | 0 (0.0%) | 100 (100.0%) |
| Arts, Entertainment & Recreation | 0 (0.0%) | 0 (0.0%) |
| Accommodation & Food Services | 0 (0.0%) | 0 (0.0%) |
| Public Administration | 0 (0.0%) | 0 (0.0%) |
| Total | 61 (34.1%) | 118 (65.9%) |
Education in Oak Level
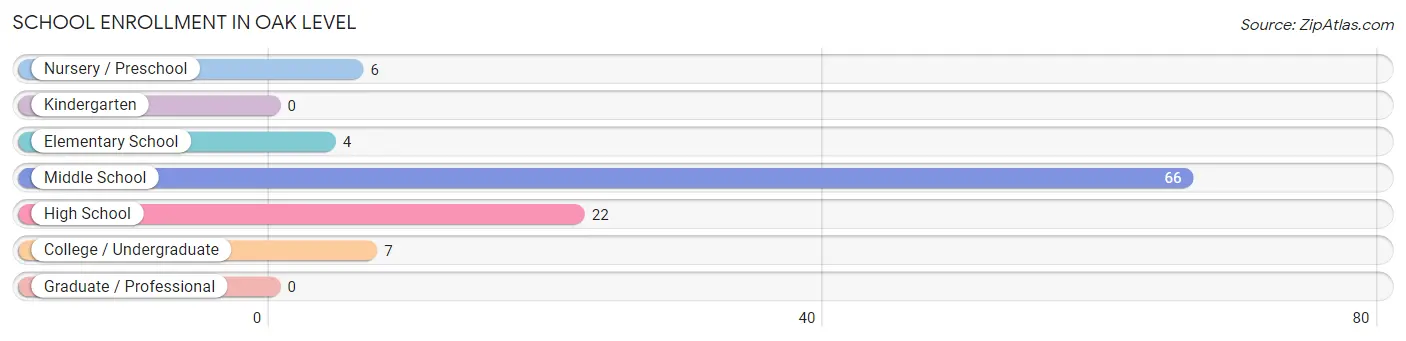
School Enrollment in Oak Level
The most common levels of schooling among the 105 students in Oak Level are middle school (66 | 62.9%), high school (22 | 20.9%), and college / undergraduate (7 | 6.7%).
| School Level | # Students | % Students |
| Nursery / Preschool | 6 | 5.7% |
| Kindergarten | 0 | 0.0% |
| Elementary School | 4 | 3.8% |
| Middle School | 66 | 62.9% |
| High School | 22 | 20.9% |
| College / Undergraduate | 7 | 6.7% |
| Graduate / Professional | 0 | 0.0% |
| Total | 105 | 100.0% |
School Enrollment by Age by Funding Source in Oak Level
Out of a total of 105 students who are enrolled in schools in Oak Level, 13 (12.4%) attend a private institution, while the remaining 92 (87.6%) are enrolled in public schools. The age group of 15 to 17 year olds has the highest likelihood of being enrolled in private schools, with 13 (37.1% in the age bracket) enrolled. Conversely, the age group of 5 to 9 year old has the lowest likelihood of being enrolled in a private school, with 10 (100.0% in the age bracket) attending a public institution.
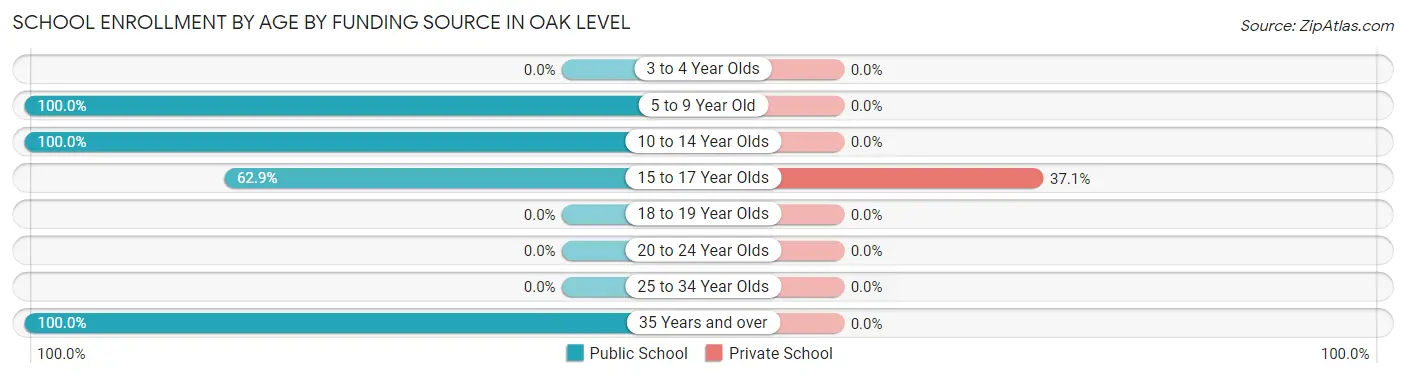
| Age Bracket | Public School | Private School |
| 3 to 4 Year Olds | 0 (0.0%) | 0 (0.0%) |
| 5 to 9 Year Old | 10 (100.0%) | 0 (0.0%) |
| 10 to 14 Year Olds | 27 (100.0%) | 0 (0.0%) |
| 15 to 17 Year Olds | 22 (62.9%) | 13 (37.1%) |
| 18 to 19 Year Olds | 0 (0.0%) | 0 (0.0%) |
| 20 to 24 Year Olds | 0 (0.0%) | 0 (0.0%) |
| 25 to 34 Year Olds | 0 (0.0%) | 0 (0.0%) |
| 35 Years and over | 33 (100.0%) | 0 (0.0%) |
| Total | 92 (87.6%) | 13 (12.4%) |
Educational Attainment by Field of Study in Oak Level
Education (46 | 69.7%), liberal arts & history (10 | 15.1%), business (7 | 10.6%), and literature & languages (3 | 4.5%) are the most common fields of study among 66 individuals in Oak Level who have obtained a bachelor's degree or higher.
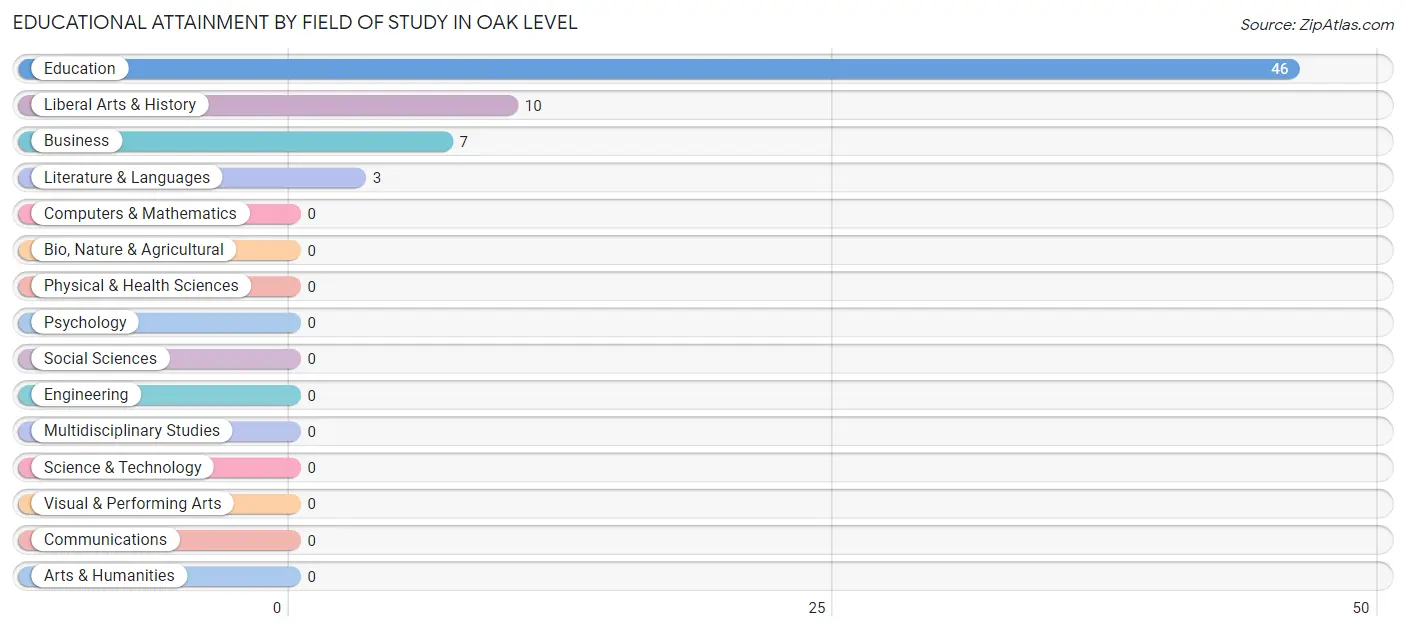
| Field of Study | # Graduates | % Graduates |
| Computers & Mathematics | 0 | 0.0% |
| Bio, Nature & Agricultural | 0 | 0.0% |
| Physical & Health Sciences | 0 | 0.0% |
| Psychology | 0 | 0.0% |
| Social Sciences | 0 | 0.0% |
| Engineering | 0 | 0.0% |
| Multidisciplinary Studies | 0 | 0.0% |
| Science & Technology | 0 | 0.0% |
| Business | 7 | 10.6% |
| Education | 46 | 69.7% |
| Literature & Languages | 3 | 4.5% |
| Liberal Arts & History | 10 | 15.1% |
| Visual & Performing Arts | 0 | 0.0% |
| Communications | 0 | 0.0% |
| Arts & Humanities | 0 | 0.0% |
| Total | 66 | 100.0% |
Transportation & Commute in Oak Level
Vehicle Availability by Sex in Oak Level
The most prevalent vehicle ownership categories in Oak Level are males with 3 vehicles (41, accounting for 67.2%) and females with 3 vehicles (24, making up 34.7%).
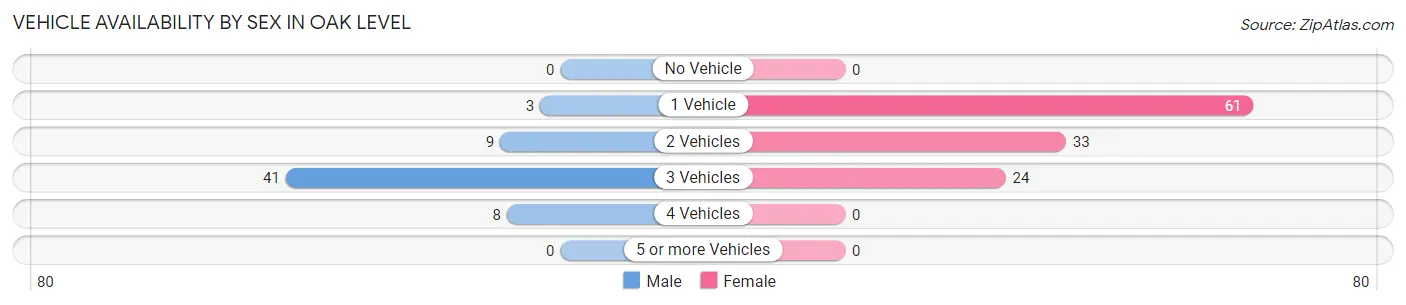
| Vehicles Available | Male | Female |
| No Vehicle | 0 (0.0%) | 0 (0.0%) |
| 1 Vehicle | 3 (4.9%) | 61 (51.7%) |
| 2 Vehicles | 9 (14.7%) | 33 (28.0%) |
| 3 Vehicles | 41 (67.2%) | 24 (20.3%) |
| 4 Vehicles | 8 (13.1%) | 0 (0.0%) |
| 5 or more Vehicles | 0 (0.0%) | 0 (0.0%) |
| Total | 61 (100.0%) | 118 (100.0%) |
Commute Time in Oak Level
The most frequently occuring commute durations in Oak Level are 20 to 24 minutes (74 commuters, 41.3%), 25 to 29 minutes (42 commuters, 23.5%), and 10 to 14 minutes (28 commuters, 15.6%).
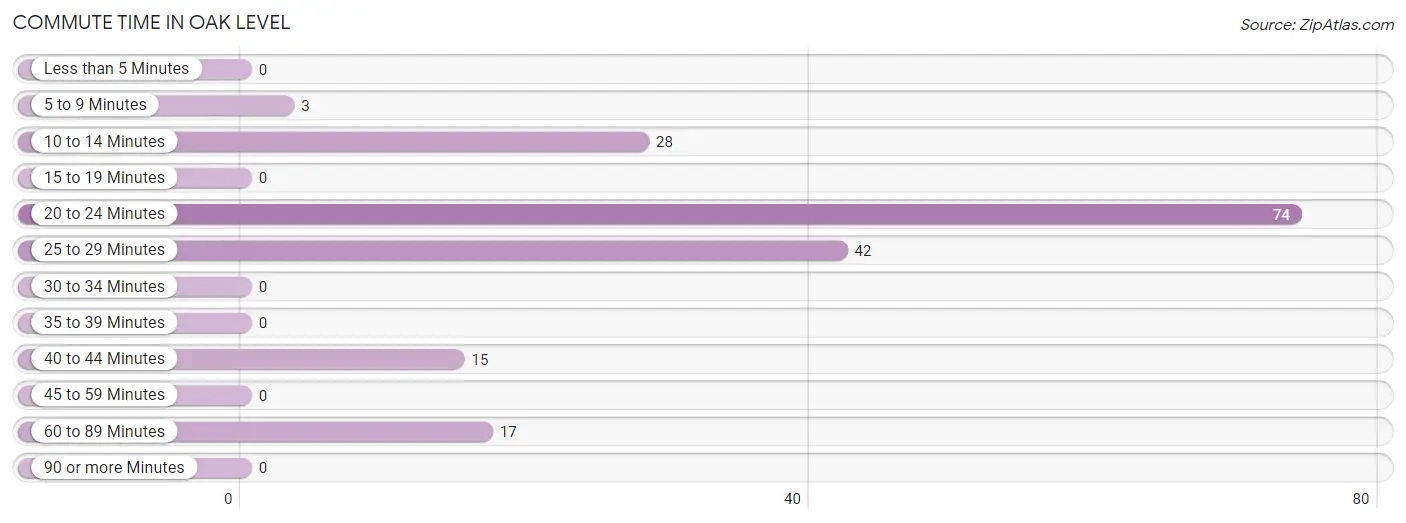
| Commute Time | # Commuters | % Commuters |
| Less than 5 Minutes | 0 | 0.0% |
| 5 to 9 Minutes | 3 | 1.7% |
| 10 to 14 Minutes | 28 | 15.6% |
| 15 to 19 Minutes | 0 | 0.0% |
| 20 to 24 Minutes | 74 | 41.3% |
| 25 to 29 Minutes | 42 | 23.5% |
| 30 to 34 Minutes | 0 | 0.0% |
| 35 to 39 Minutes | 0 | 0.0% |
| 40 to 44 Minutes | 15 | 8.4% |
| 45 to 59 Minutes | 0 | 0.0% |
| 60 to 89 Minutes | 17 | 9.5% |
| 90 or more Minutes | 0 | 0.0% |
Commute Time by Sex in Oak Level
The most common commute times in Oak Level are 10 to 14 minutes (21 commuters, 34.4%) for males and 20 to 24 minutes (58 commuters, 49.1%) for females.
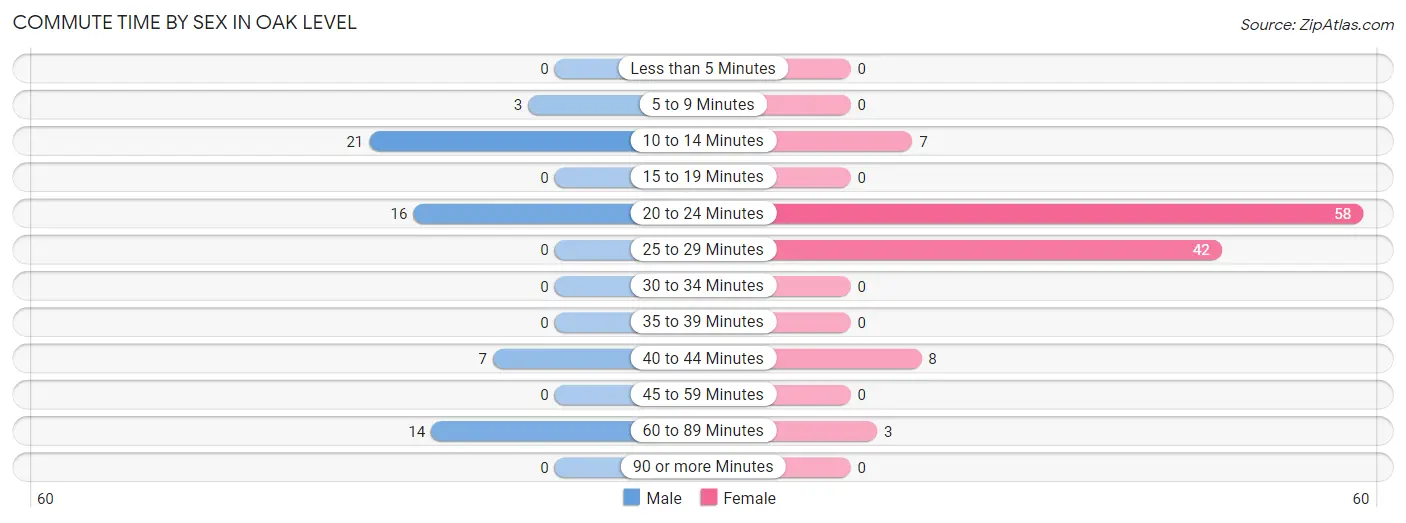
| Commute Time | Male | Female |
| Less than 5 Minutes | 0 (0.0%) | 0 (0.0%) |
| 5 to 9 Minutes | 3 (4.9%) | 0 (0.0%) |
| 10 to 14 Minutes | 21 (34.4%) | 7 (5.9%) |
| 15 to 19 Minutes | 0 (0.0%) | 0 (0.0%) |
| 20 to 24 Minutes | 16 (26.2%) | 58 (49.1%) |
| 25 to 29 Minutes | 0 (0.0%) | 42 (35.6%) |
| 30 to 34 Minutes | 0 (0.0%) | 0 (0.0%) |
| 35 to 39 Minutes | 0 (0.0%) | 0 (0.0%) |
| 40 to 44 Minutes | 7 (11.5%) | 8 (6.8%) |
| 45 to 59 Minutes | 0 (0.0%) | 0 (0.0%) |
| 60 to 89 Minutes | 14 (23.0%) | 3 (2.5%) |
| 90 or more Minutes | 0 (0.0%) | 0 (0.0%) |
Time of Departure to Work by Sex in Oak Level
The most frequent times of departure to work in Oak Level are 6:30 AM to 6:59 AM (28, 45.9%) for males and 6:30 AM to 6:59 AM (42, 35.6%) for females.
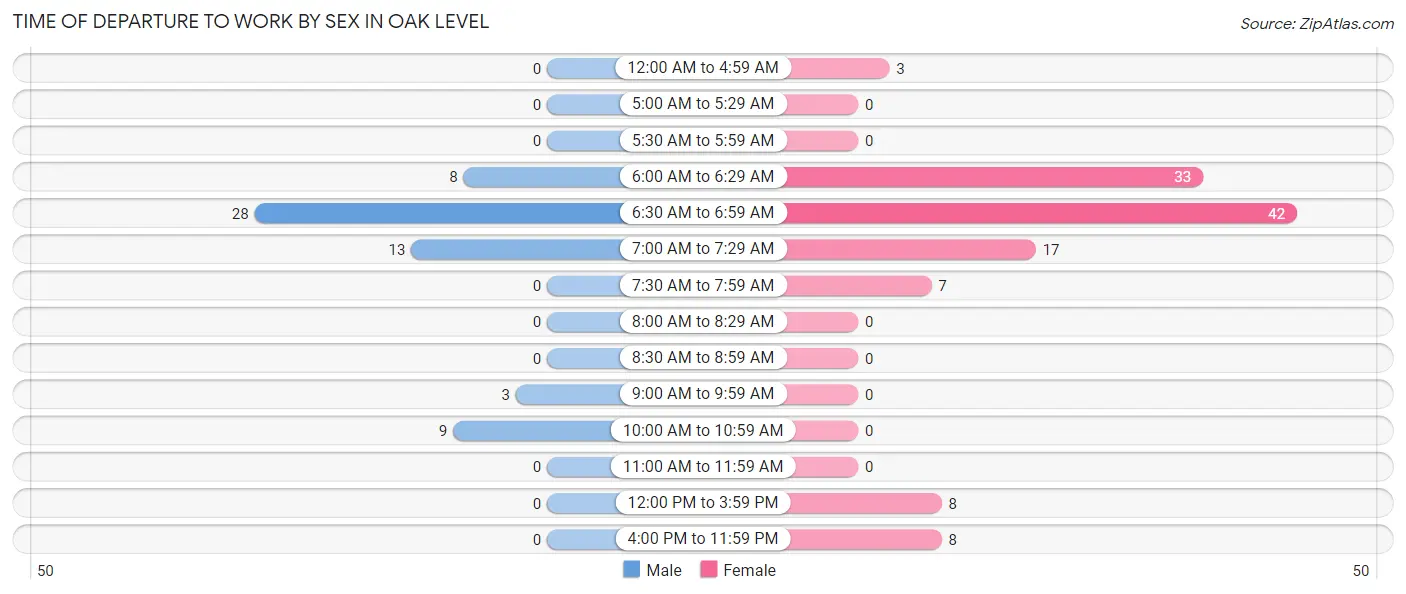
| Time of Departure | Male | Female |
| 12:00 AM to 4:59 AM | 0 (0.0%) | 3 (2.5%) |
| 5:00 AM to 5:29 AM | 0 (0.0%) | 0 (0.0%) |
| 5:30 AM to 5:59 AM | 0 (0.0%) | 0 (0.0%) |
| 6:00 AM to 6:29 AM | 8 (13.1%) | 33 (28.0%) |
| 6:30 AM to 6:59 AM | 28 (45.9%) | 42 (35.6%) |
| 7:00 AM to 7:29 AM | 13 (21.3%) | 17 (14.4%) |
| 7:30 AM to 7:59 AM | 0 (0.0%) | 7 (5.9%) |
| 8:00 AM to 8:29 AM | 0 (0.0%) | 0 (0.0%) |
| 8:30 AM to 8:59 AM | 0 (0.0%) | 0 (0.0%) |
| 9:00 AM to 9:59 AM | 3 (4.9%) | 0 (0.0%) |
| 10:00 AM to 10:59 AM | 9 (14.7%) | 0 (0.0%) |
| 11:00 AM to 11:59 AM | 0 (0.0%) | 0 (0.0%) |
| 12:00 PM to 3:59 PM | 0 (0.0%) | 8 (6.8%) |
| 4:00 PM to 11:59 PM | 0 (0.0%) | 8 (6.8%) |
| Total | 61 (100.0%) | 118 (100.0%) |
Housing Occupancy in Oak Level
Occupancy by Ownership in Oak Level
Of the total 255 dwellings in Oak Level, owner-occupied units account for 219 (85.9%), while renter-occupied units make up 36 (14.1%).
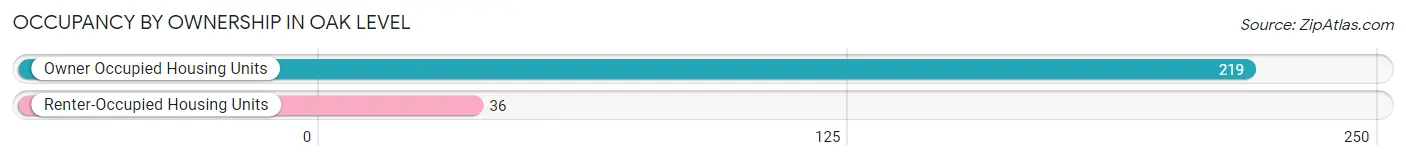
| Occupancy | # Housing Units | % Housing Units |
| Owner Occupied Housing Units | 219 | 85.9% |
| Renter-Occupied Housing Units | 36 | 14.1% |
| Total Occupied Housing Units | 255 | 100.0% |
Occupancy by Household Size in Oak Level
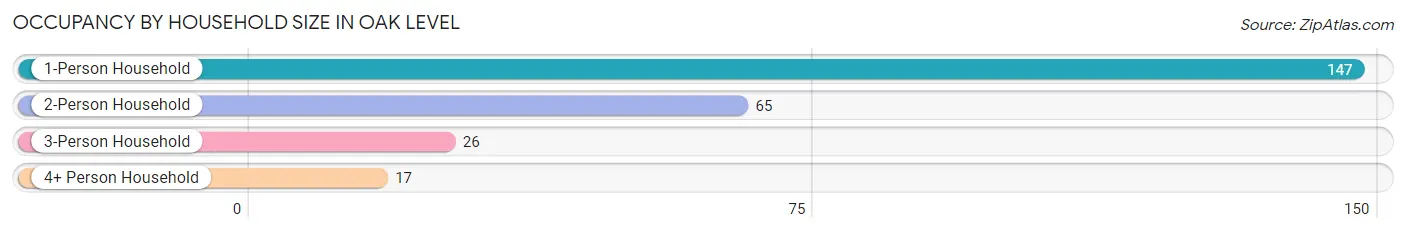
| Household Size | # Housing Units | % Housing Units |
| 1-Person Household | 147 | 57.7% |
| 2-Person Household | 65 | 25.5% |
| 3-Person Household | 26 | 10.2% |
| 4+ Person Household | 17 | 6.7% |
| Total Housing Units | 255 | 100.0% |
Occupancy by Ownership by Household Size in Oak Level
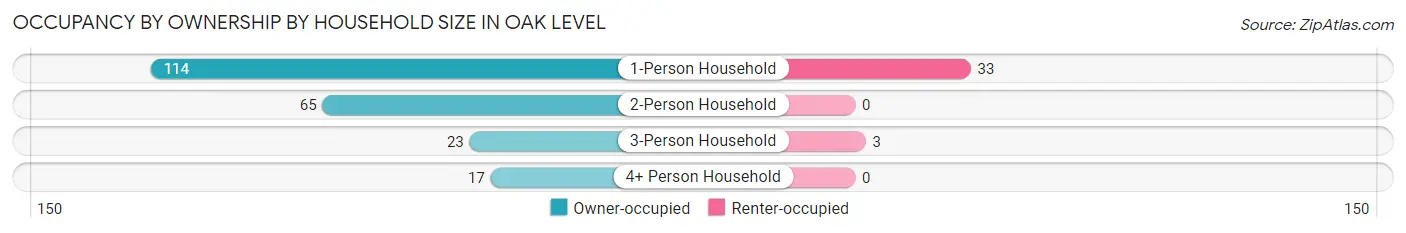
| Household Size | Owner-occupied | Renter-occupied |
| 1-Person Household | 114 (77.5%) | 33 (22.5%) |
| 2-Person Household | 65 (100.0%) | 0 (0.0%) |
| 3-Person Household | 23 (88.5%) | 3 (11.5%) |
| 4+ Person Household | 17 (100.0%) | 0 (0.0%) |
| Total Housing Units | 219 (85.9%) | 36 (14.1%) |
Occupancy by Educational Attainment in Oak Level
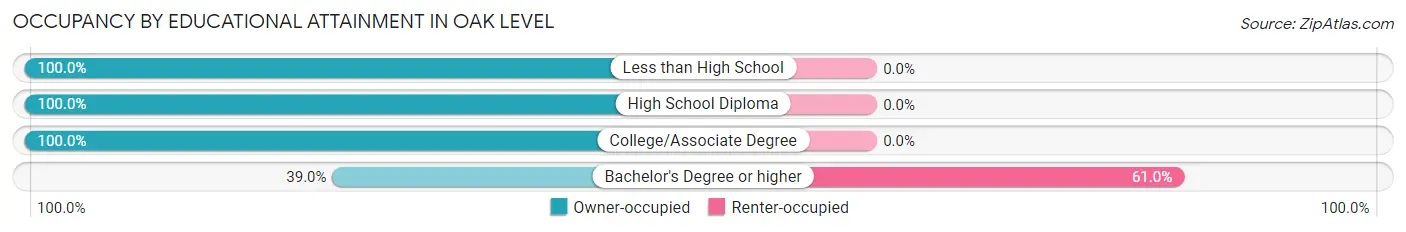
| Household Size | Owner-occupied | Renter-occupied |
| Less than High School | 45 (100.0%) | 0 (0.0%) |
| High School Diploma | 61 (100.0%) | 0 (0.0%) |
| College/Associate Degree | 90 (100.0%) | 0 (0.0%) |
| Bachelor's Degree or higher | 23 (39.0%) | 36 (61.0%) |
Occupancy by Age of Householder in Oak Level
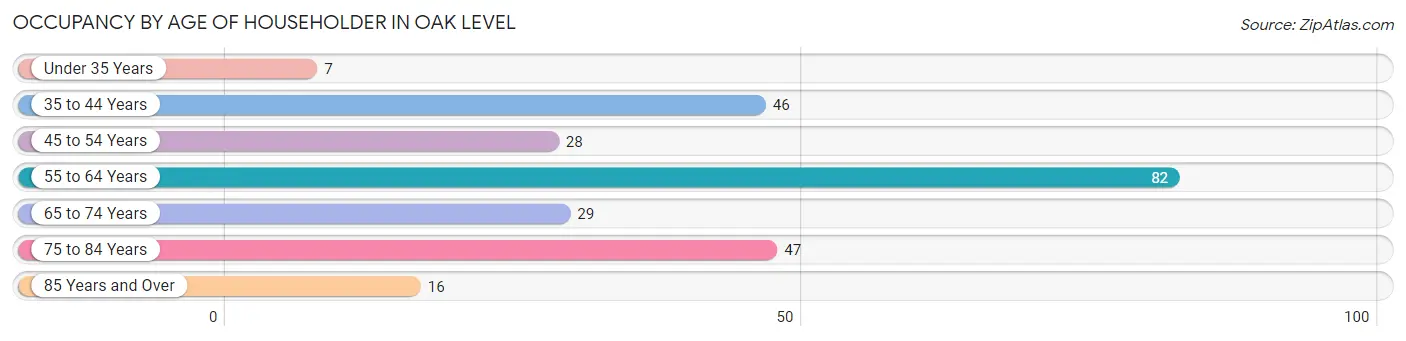
| Age Bracket | # Households | % Households |
| Under 35 Years | 7 | 2.8% |
| 35 to 44 Years | 46 | 18.0% |
| 45 to 54 Years | 28 | 11.0% |
| 55 to 64 Years | 82 | 32.2% |
| 65 to 74 Years | 29 | 11.4% |
| 75 to 84 Years | 47 | 18.4% |
| 85 Years and Over | 16 | 6.3% |
| Total | 255 | 100.0% |
Housing Finances in Oak Level
Median Income by Occupancy in Oak Level
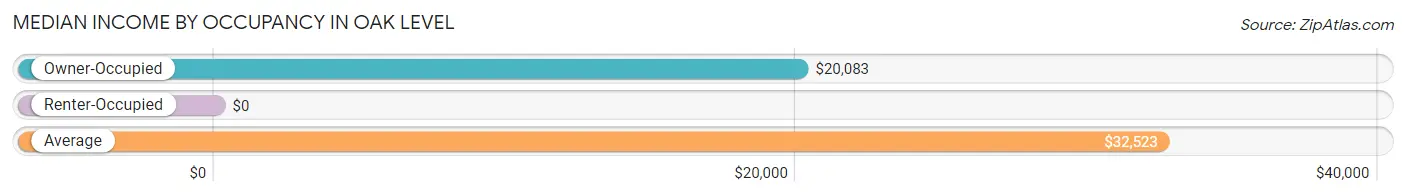
| Occupancy Type | # Households | Median Income |
| Owner-Occupied | 219 (85.9%) | $20,083 |
| Renter-Occupied | 36 (14.1%) | $0 |
| Average | 255 (100.0%) | $32,523 |
Occupancy by Householder Income Bracket in Oak Level
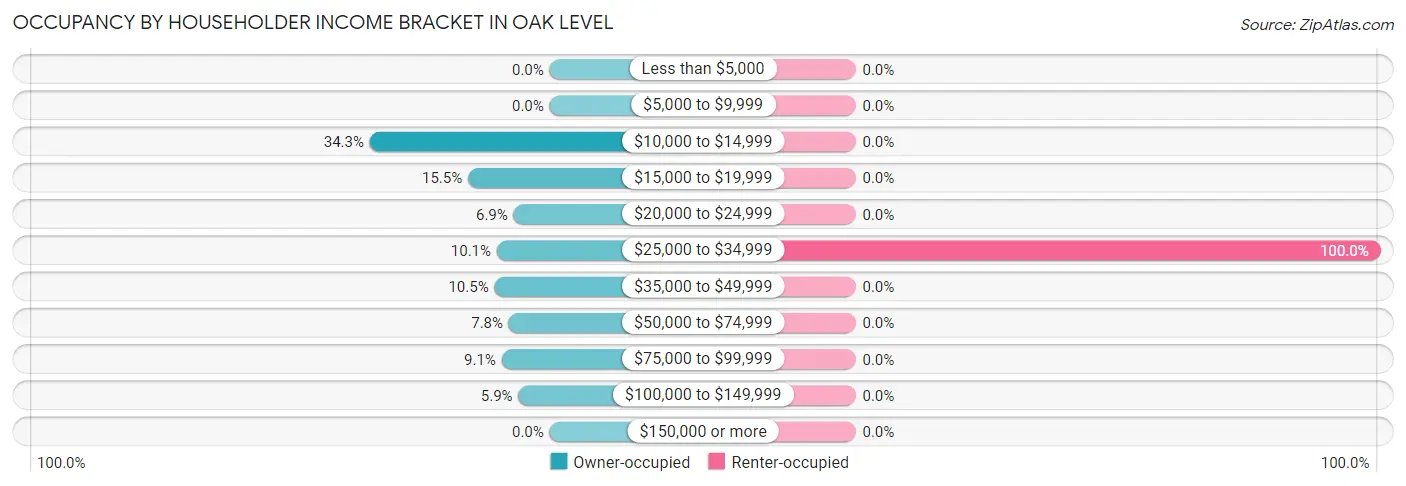
| Income Bracket | Owner-occupied | Renter-occupied |
| Less than $5,000 | 0 (0.0%) | 0 (0.0%) |
| $5,000 to $9,999 | 0 (0.0%) | 0 (0.0%) |
| $10,000 to $14,999 | 75 (34.3%) | 0 (0.0%) |
| $15,000 to $19,999 | 34 (15.5%) | 0 (0.0%) |
| $20,000 to $24,999 | 15 (6.9%) | 0 (0.0%) |
| $25,000 to $34,999 | 22 (10.1%) | 36 (100.0%) |
| $35,000 to $49,999 | 23 (10.5%) | 0 (0.0%) |
| $50,000 to $74,999 | 17 (7.8%) | 0 (0.0%) |
| $75,000 to $99,999 | 20 (9.1%) | 0 (0.0%) |
| $100,000 to $149,999 | 13 (5.9%) | 0 (0.0%) |
| $150,000 or more | 0 (0.0%) | 0 (0.0%) |
| Total | 219 (100.0%) | 36 (100.0%) |
Monthly Housing Cost Tiers in Oak Level
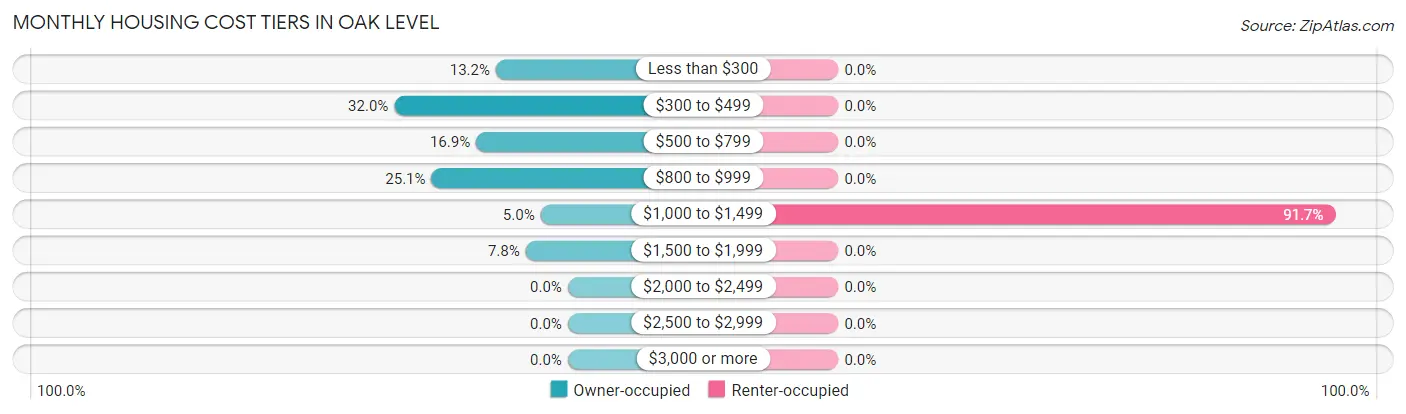
| Monthly Cost | Owner-occupied | Renter-occupied |
| Less than $300 | 29 (13.2%) | 0 (0.0%) |
| $300 to $499 | 70 (32.0%) | 0 (0.0%) |
| $500 to $799 | 37 (16.9%) | 0 (0.0%) |
| $800 to $999 | 55 (25.1%) | 0 (0.0%) |
| $1,000 to $1,499 | 11 (5.0%) | 33 (91.7%) |
| $1,500 to $1,999 | 17 (7.8%) | 0 (0.0%) |
| $2,000 to $2,499 | 0 (0.0%) | 0 (0.0%) |
| $2,500 to $2,999 | 0 (0.0%) | 0 (0.0%) |
| $3,000 or more | 0 (0.0%) | 0 (0.0%) |
| Total | 219 (100.0%) | 36 (100.0%) |
Physical Housing Characteristics in Oak Level
Housing Structures in Oak Level
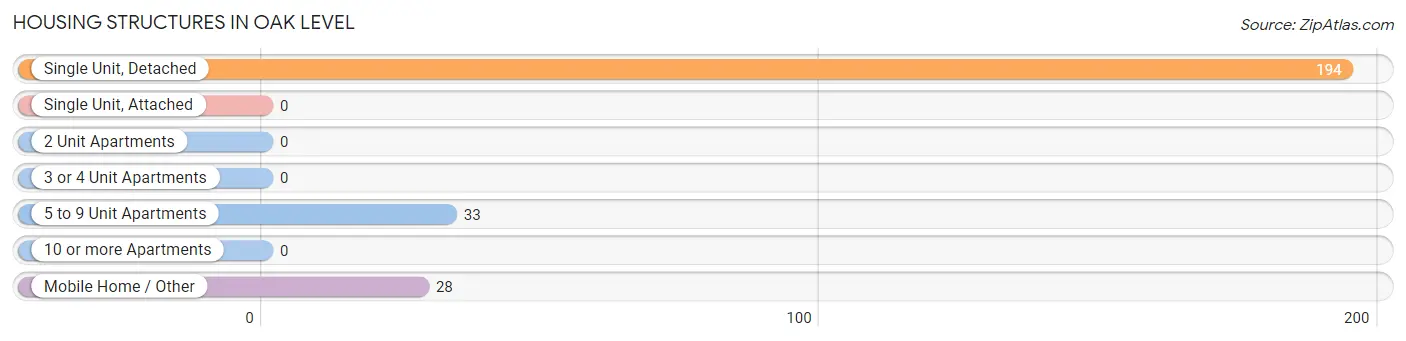
| Structure Type | # Housing Units | % Housing Units |
| Single Unit, Detached | 194 | 76.1% |
| Single Unit, Attached | 0 | 0.0% |
| 2 Unit Apartments | 0 | 0.0% |
| 3 or 4 Unit Apartments | 0 | 0.0% |
| 5 to 9 Unit Apartments | 33 | 12.9% |
| 10 or more Apartments | 0 | 0.0% |
| Mobile Home / Other | 28 | 11.0% |
| Total | 255 | 100.0% |
Housing Structures by Occupancy in Oak Level
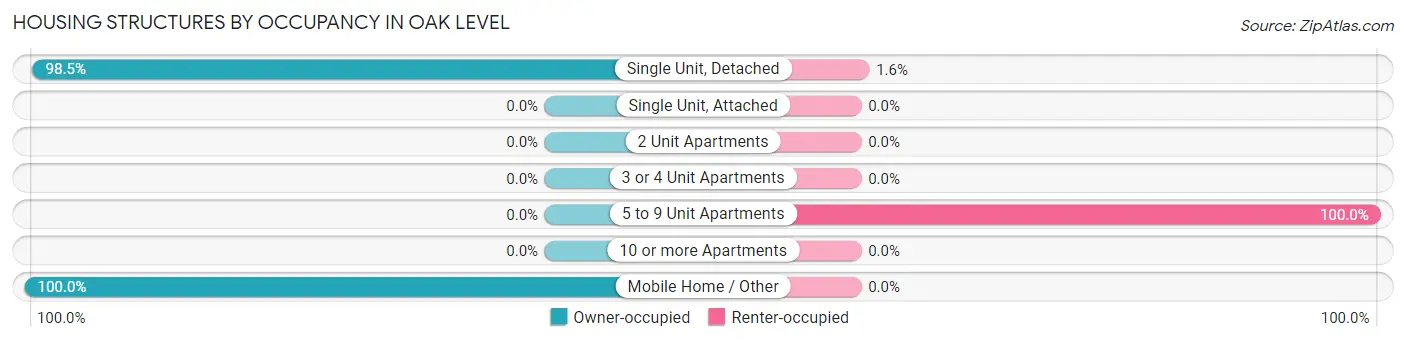
| Structure Type | Owner-occupied | Renter-occupied |
| Single Unit, Detached | 191 (98.5%) | 3 (1.5%) |
| Single Unit, Attached | 0 (0.0%) | 0 (0.0%) |
| 2 Unit Apartments | 0 (0.0%) | 0 (0.0%) |
| 3 or 4 Unit Apartments | 0 (0.0%) | 0 (0.0%) |
| 5 to 9 Unit Apartments | 0 (0.0%) | 33 (100.0%) |
| 10 or more Apartments | 0 (0.0%) | 0 (0.0%) |
| Mobile Home / Other | 28 (100.0%) | 0 (0.0%) |
| Total | 219 (85.9%) | 36 (14.1%) |
Housing Structures by Number of Rooms in Oak Level
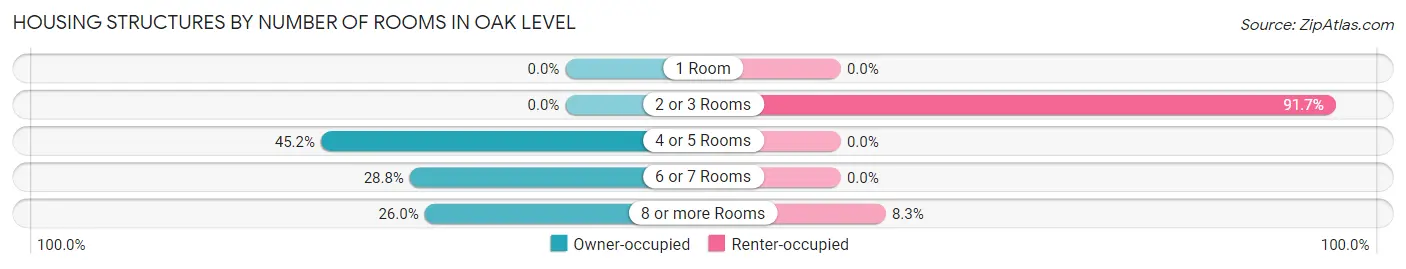
| Number of Rooms | Owner-occupied | Renter-occupied |
| 1 Room | 0 (0.0%) | 0 (0.0%) |
| 2 or 3 Rooms | 0 (0.0%) | 33 (91.7%) |
| 4 or 5 Rooms | 99 (45.2%) | 0 (0.0%) |
| 6 or 7 Rooms | 63 (28.8%) | 0 (0.0%) |
| 8 or more Rooms | 57 (26.0%) | 3 (8.3%) |
| Total | 219 (100.0%) | 36 (100.0%) |
Housing Structure by Heating Type in Oak Level
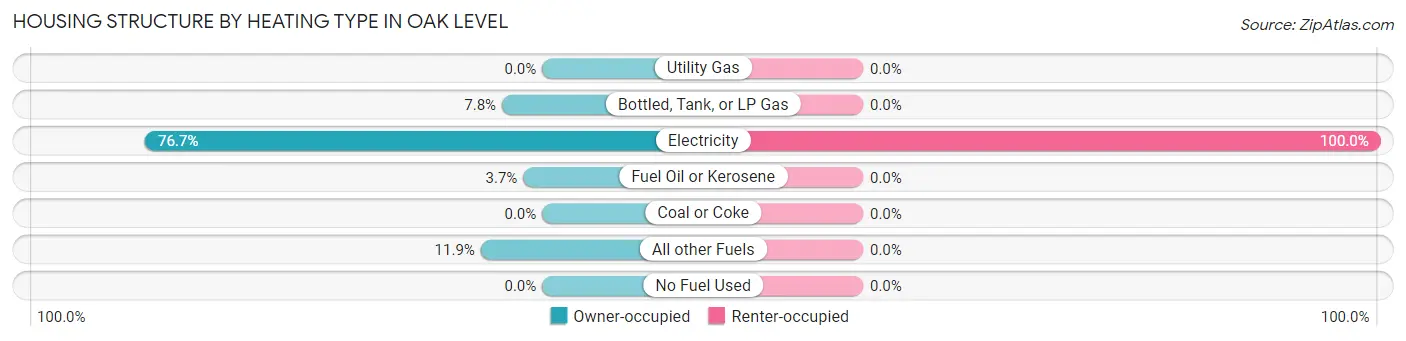
| Heating Type | Owner-occupied | Renter-occupied |
| Utility Gas | 0 (0.0%) | 0 (0.0%) |
| Bottled, Tank, or LP Gas | 17 (7.8%) | 0 (0.0%) |
| Electricity | 168 (76.7%) | 36 (100.0%) |
| Fuel Oil or Kerosene | 8 (3.6%) | 0 (0.0%) |
| Coal or Coke | 0 (0.0%) | 0 (0.0%) |
| All other Fuels | 26 (11.9%) | 0 (0.0%) |
| No Fuel Used | 0 (0.0%) | 0 (0.0%) |
| Total | 219 (100.0%) | 36 (100.0%) |
Household Vehicle Usage in Oak Level
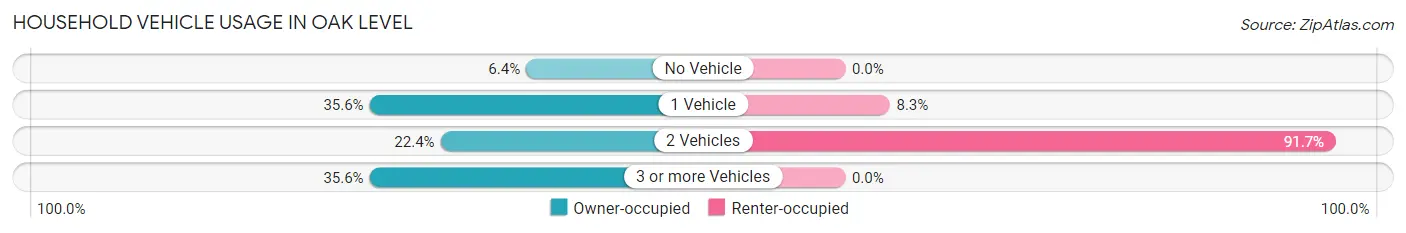
| Vehicles per Household | Owner-occupied | Renter-occupied |
| No Vehicle | 14 (6.4%) | 0 (0.0%) |
| 1 Vehicle | 78 (35.6%) | 3 (8.3%) |
| 2 Vehicles | 49 (22.4%) | 33 (91.7%) |
| 3 or more Vehicles | 78 (35.6%) | 0 (0.0%) |
| Total | 219 (100.0%) | 36 (100.0%) |
Real Estate & Mortgages in Oak Level
Real Estate and Mortgage Overview in Oak Level
| Characteristic | Without Mortgage | With Mortgage |
| Housing Units | 115 | 104 |
| Median Property Value | $133,200 | $0 |
| Median Household Income | $33,355 | $0 |
| Monthly Housing Costs | $325 | $0 |
| Real Estate Taxes | $810 | $0 |
Property Value by Mortgage Status in Oak Level
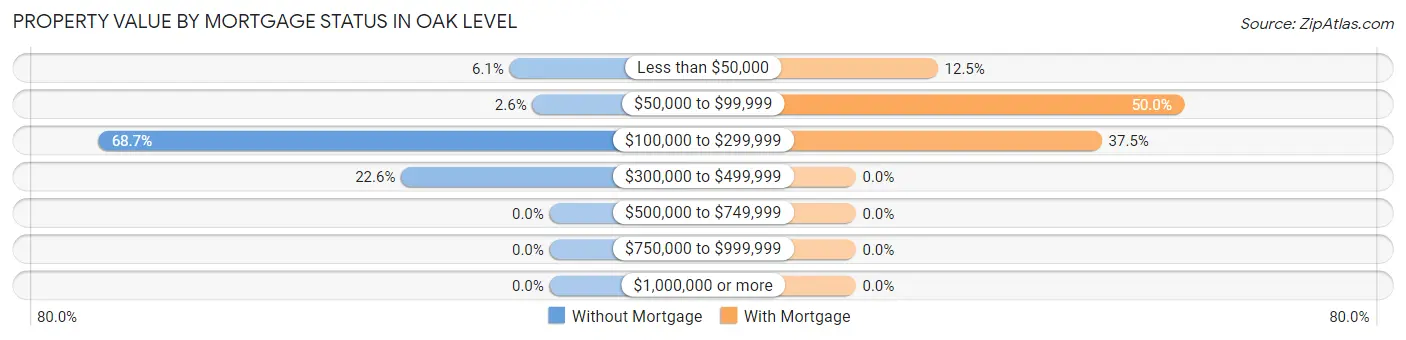
| Property Value | Without Mortgage | With Mortgage |
| Less than $50,000 | 7 (6.1%) | 13 (12.5%) |
| $50,000 to $99,999 | 3 (2.6%) | 52 (50.0%) |
| $100,000 to $299,999 | 79 (68.7%) | 39 (37.5%) |
| $300,000 to $499,999 | 26 (22.6%) | 0 (0.0%) |
| $500,000 to $749,999 | 0 (0.0%) | 0 (0.0%) |
| $750,000 to $999,999 | 0 (0.0%) | 0 (0.0%) |
| $1,000,000 or more | 0 (0.0%) | 0 (0.0%) |
| Total | 115 (100.0%) | 104 (100.0%) |
Household Income by Mortgage Status in Oak Level
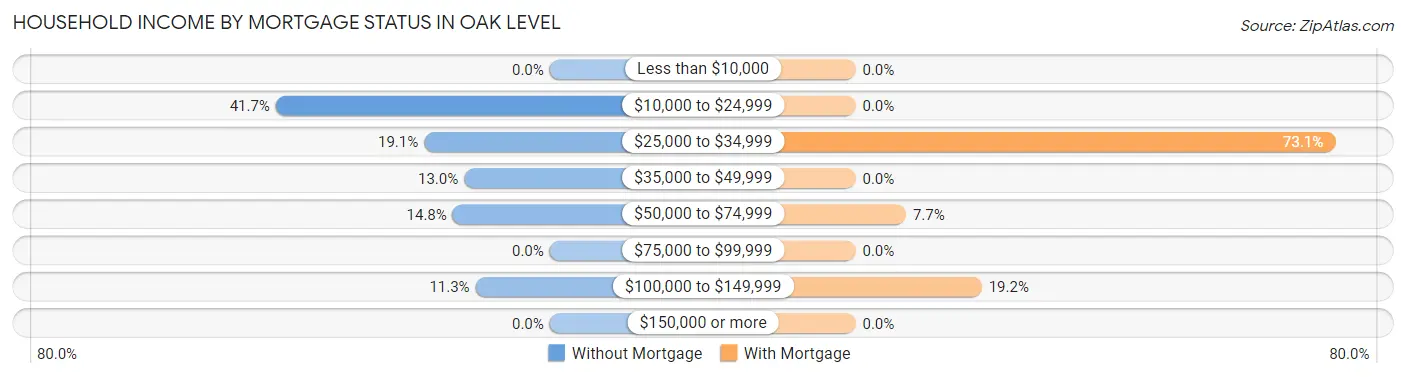
| Household Income | Without Mortgage | With Mortgage |
| Less than $10,000 | 0 (0.0%) | 0 (0.0%) |
| $10,000 to $24,999 | 48 (41.7%) | 0 (0.0%) |
| $25,000 to $34,999 | 22 (19.1%) | 76 (73.1%) |
| $35,000 to $49,999 | 15 (13.0%) | 0 (0.0%) |
| $50,000 to $74,999 | 17 (14.8%) | 8 (7.7%) |
| $75,000 to $99,999 | 0 (0.0%) | 0 (0.0%) |
| $100,000 to $149,999 | 13 (11.3%) | 20 (19.2%) |
| $150,000 or more | 0 (0.0%) | 0 (0.0%) |
| Total | 115 (100.0%) | 104 (100.0%) |
Property Value to Household Income Ratio in Oak Level
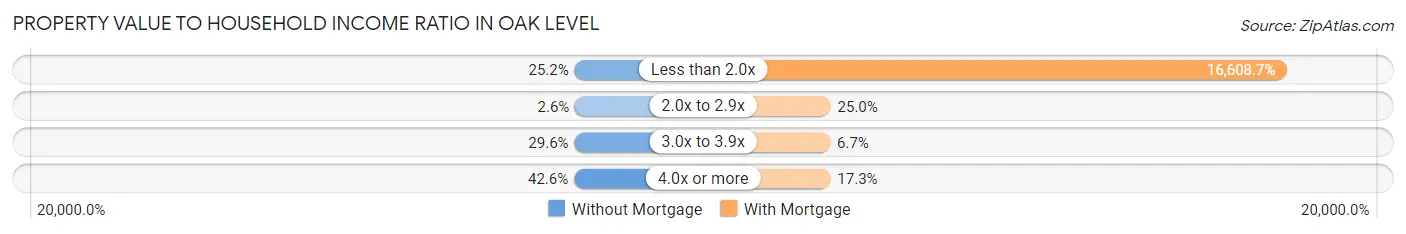
| Value-to-Income Ratio | Without Mortgage | With Mortgage |
| Less than 2.0x | 29 (25.2%) | 17,273 (16,608.7%) |
| 2.0x to 2.9x | 3 (2.6%) | 26 (25.0%) |
| 3.0x to 3.9x | 34 (29.6%) | 7 (6.7%) |
| 4.0x or more | 49 (42.6%) | 18 (17.3%) |
| Total | 115 (100.0%) | 104 (100.0%) |
Real Estate Taxes by Mortgage Status in Oak Level
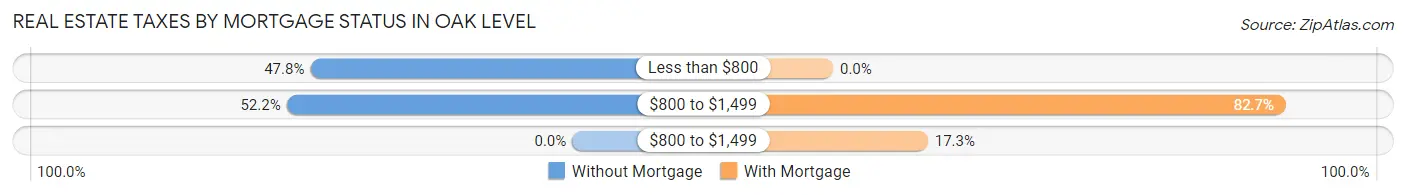
| Property Taxes | Without Mortgage | With Mortgage |
| Less than $800 | 55 (47.8%) | 0 (0.0%) |
| $800 to $1,499 | 60 (52.2%) | 86 (82.7%) |
| $800 to $1,499 | 0 (0.0%) | 18 (17.3%) |
| Total | 115 (100.0%) | 104 (100.0%) |
Health & Disability in Oak Level
Health Insurance Coverage by Age in Oak Level
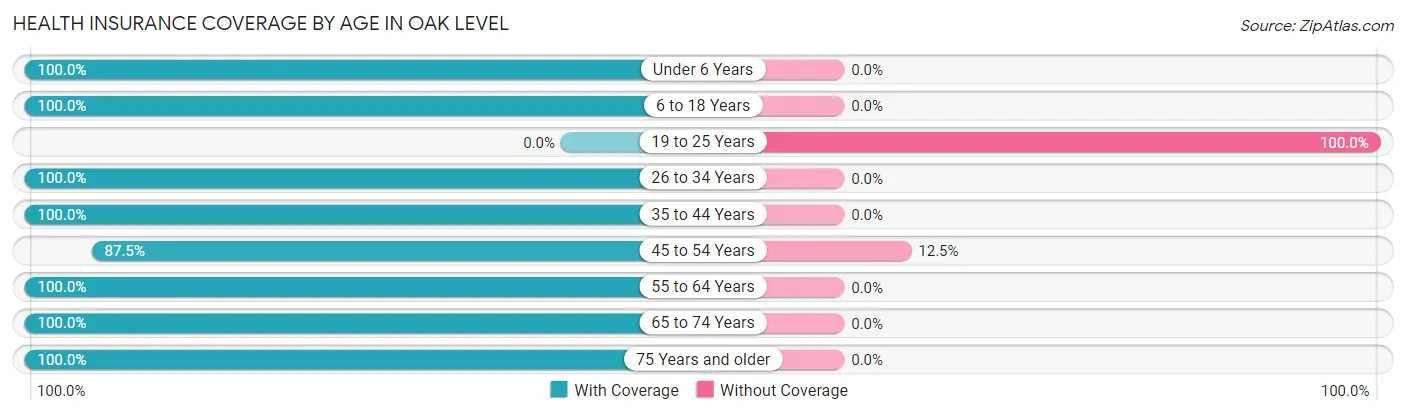
| Age Bracket | With Coverage | Without Coverage |
| Under 6 Years | 12 (100.0%) | 0 (0.0%) |
| 6 to 18 Years | 66 (100.0%) | 0 (0.0%) |
| 19 to 25 Years | 0 (0.0%) | 10 (100.0%) |
| 26 to 34 Years | 16 (100.0%) | 0 (0.0%) |
| 35 to 44 Years | 63 (100.0%) | 0 (0.0%) |
| 45 to 54 Years | 49 (87.5%) | 7 (12.5%) |
| 55 to 64 Years | 94 (100.0%) | 0 (0.0%) |
| 65 to 74 Years | 55 (100.0%) | 0 (0.0%) |
| 75 Years and older | 81 (100.0%) | 0 (0.0%) |
| Total | 436 (96.3%) | 17 (3.7%) |
Health Insurance Coverage by Citizenship Status in Oak Level
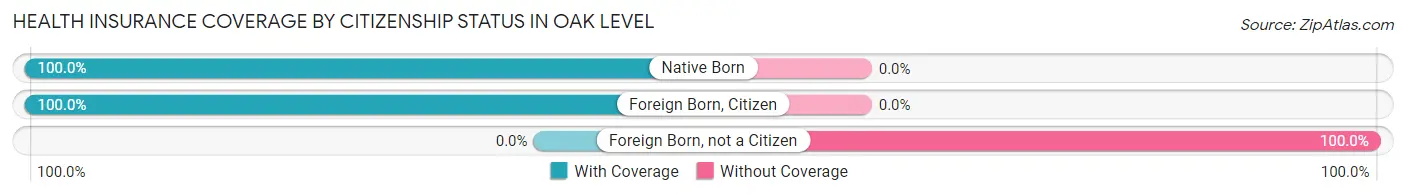
| Citizenship Status | With Coverage | Without Coverage |
| Native Born | 12 (100.0%) | 0 (0.0%) |
| Foreign Born, Citizen | 66 (100.0%) | 0 (0.0%) |
| Foreign Born, not a Citizen | 0 (0.0%) | 10 (100.0%) |
Health Insurance Coverage by Household Income in Oak Level
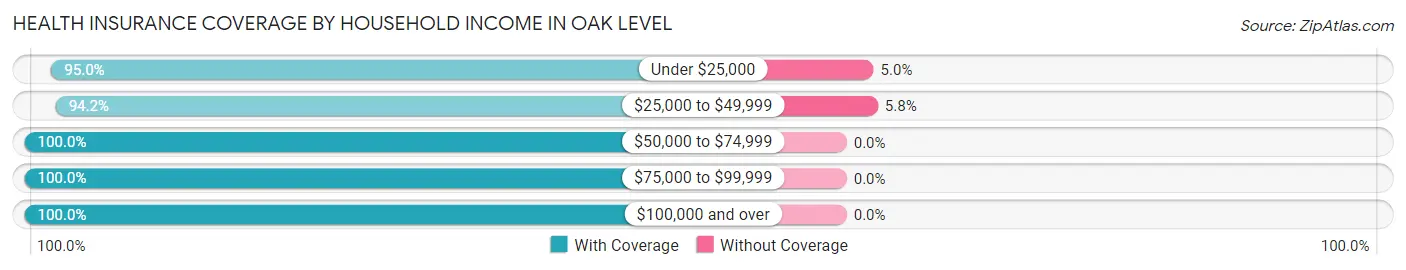
| Household Income | With Coverage | Without Coverage |
| Under $25,000 | 189 (95.0%) | 10 (5.0%) |
| $25,000 to $49,999 | 113 (94.2%) | 7 (5.8%) |
| $50,000 to $74,999 | 26 (100.0%) | 0 (0.0%) |
| $75,000 to $99,999 | 85 (100.0%) | 0 (0.0%) |
| $100,000 and over | 23 (100.0%) | 0 (0.0%) |
Public vs Private Health Insurance Coverage by Age in Oak Level
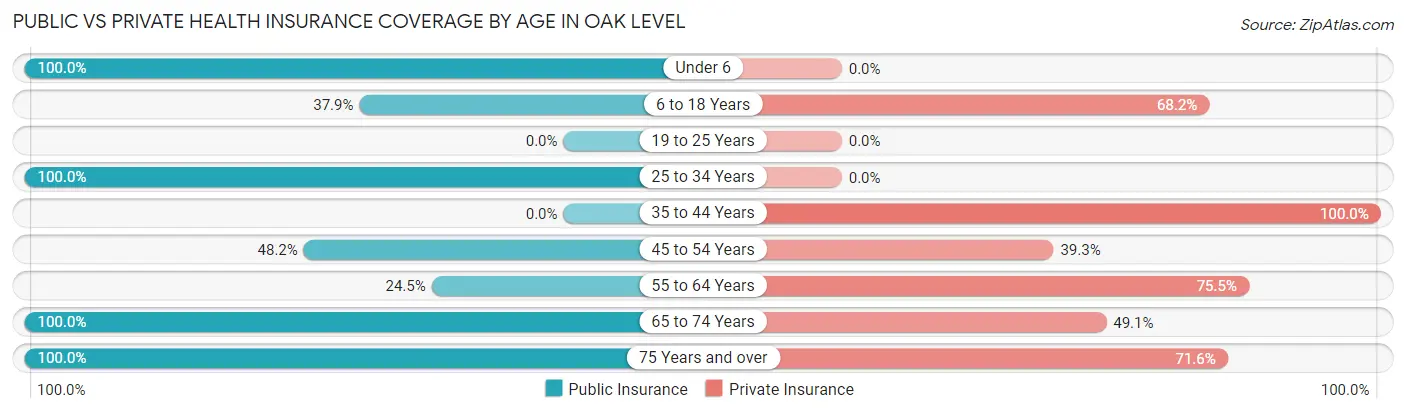
| Age Bracket | Public Insurance | Private Insurance |
| Under 6 | 12 (100.0%) | 0 (0.0%) |
| 6 to 18 Years | 25 (37.9%) | 45 (68.2%) |
| 19 to 25 Years | 0 (0.0%) | 0 (0.0%) |
| 25 to 34 Years | 16 (100.0%) | 0 (0.0%) |
| 35 to 44 Years | 0 (0.0%) | 63 (100.0%) |
| 45 to 54 Years | 27 (48.2%) | 22 (39.3%) |
| 55 to 64 Years | 23 (24.5%) | 71 (75.5%) |
| 65 to 74 Years | 55 (100.0%) | 27 (49.1%) |
| 75 Years and over | 81 (100.0%) | 58 (71.6%) |
| Total | 239 (52.8%) | 286 (63.1%) |
Disability Status by Sex by Age in Oak Level
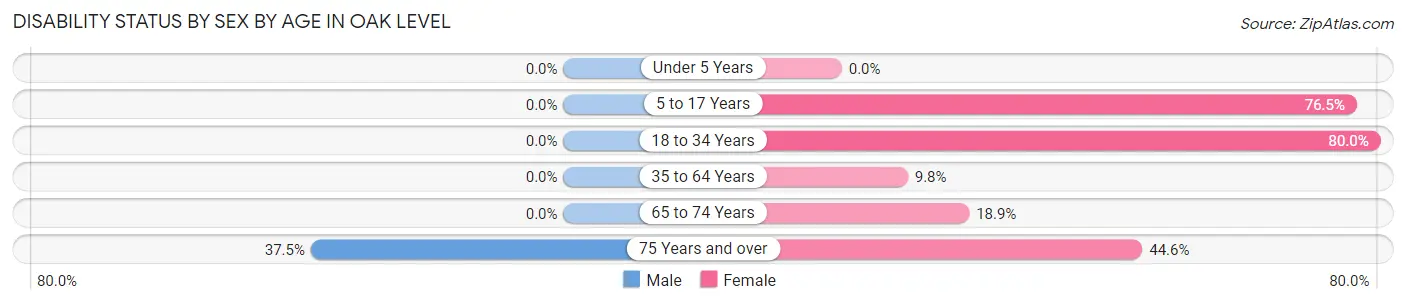
| Age Bracket | Male | Female |
| Under 5 Years | 0 (0.0%) | 0 (0.0%) |
| 5 to 17 Years | 0 (0.0%) | 13 (76.5%) |
| 18 to 34 Years | 0 (0.0%) | 16 (80.0%) |
| 35 to 64 Years | 0 (0.0%) | 15 (9.8%) |
| 65 to 74 Years | 0 (0.0%) | 7 (18.9%) |
| 75 Years and over | 6 (37.5%) | 29 (44.6%) |
Disability Class by Sex by Age in Oak Level
Disability Class: Hearing Difficulty
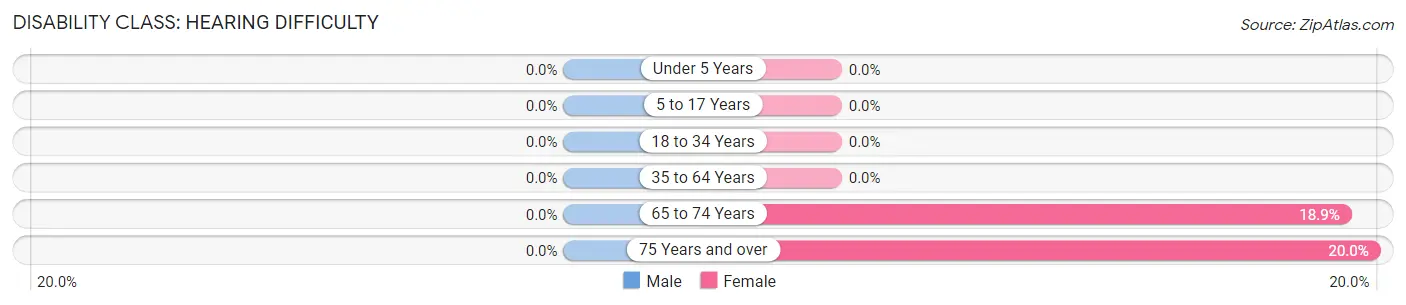
| Age Bracket | Male | Female |
| Under 5 Years | 0 (0.0%) | 0 (0.0%) |
| 5 to 17 Years | 0 (0.0%) | 0 (0.0%) |
| 18 to 34 Years | 0 (0.0%) | 0 (0.0%) |
| 35 to 64 Years | 0 (0.0%) | 0 (0.0%) |
| 65 to 74 Years | 0 (0.0%) | 7 (18.9%) |
| 75 Years and over | 0 (0.0%) | 13 (20.0%) |
Disability Class: Vision Difficulty
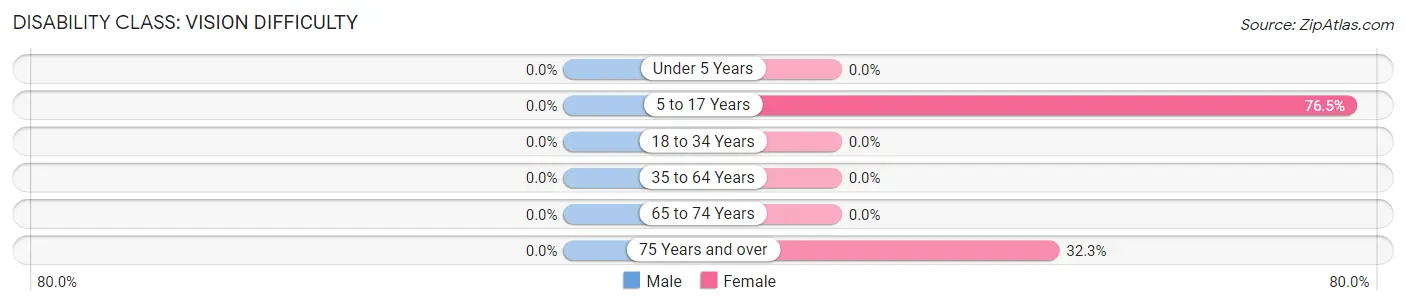
| Age Bracket | Male | Female |
| Under 5 Years | 0 (0.0%) | 0 (0.0%) |
| 5 to 17 Years | 0 (0.0%) | 13 (76.5%) |
| 18 to 34 Years | 0 (0.0%) | 0 (0.0%) |
| 35 to 64 Years | 0 (0.0%) | 0 (0.0%) |
| 65 to 74 Years | 0 (0.0%) | 0 (0.0%) |
| 75 Years and over | 0 (0.0%) | 21 (32.3%) |
Disability Class: Cognitive Difficulty
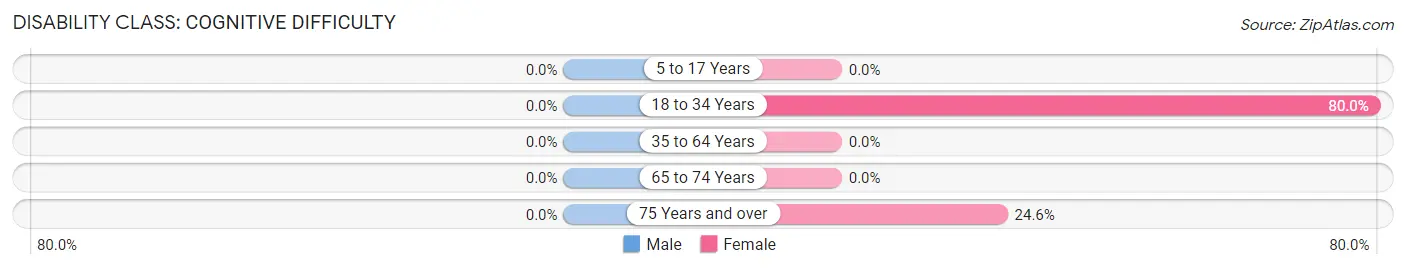
| Age Bracket | Male | Female |
| 5 to 17 Years | 0 (0.0%) | 0 (0.0%) |
| 18 to 34 Years | 0 (0.0%) | 16 (80.0%) |
| 35 to 64 Years | 0 (0.0%) | 0 (0.0%) |
| 65 to 74 Years | 0 (0.0%) | 0 (0.0%) |
| 75 Years and over | 0 (0.0%) | 16 (24.6%) |
Disability Class: Ambulatory Difficulty
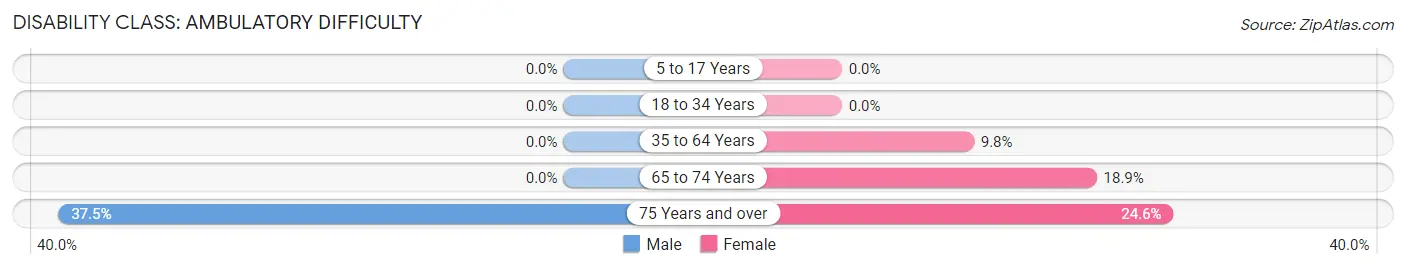
| Age Bracket | Male | Female |
| 5 to 17 Years | 0 (0.0%) | 0 (0.0%) |
| 18 to 34 Years | 0 (0.0%) | 0 (0.0%) |
| 35 to 64 Years | 0 (0.0%) | 15 (9.8%) |
| 65 to 74 Years | 0 (0.0%) | 7 (18.9%) |
| 75 Years and over | 6 (37.5%) | 16 (24.6%) |
Disability Class: Self-Care Difficulty
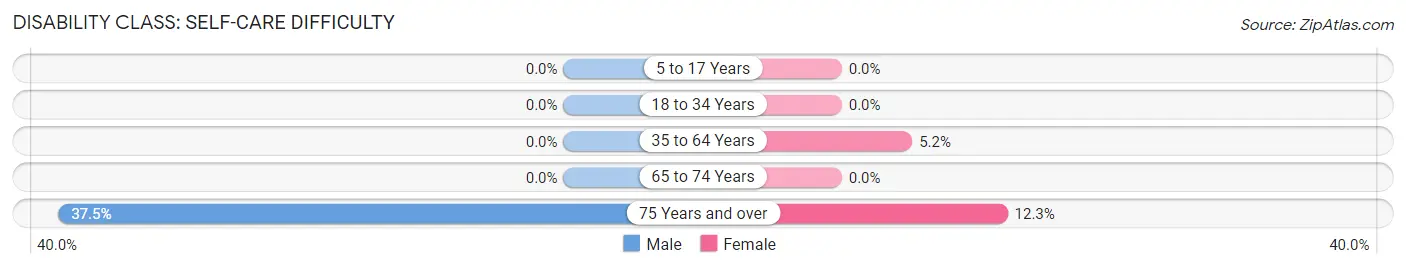
| Age Bracket | Male | Female |
| 5 to 17 Years | 0 (0.0%) | 0 (0.0%) |
| 18 to 34 Years | 0 (0.0%) | 0 (0.0%) |
| 35 to 64 Years | 0 (0.0%) | 8 (5.2%) |
| 65 to 74 Years | 0 (0.0%) | 0 (0.0%) |
| 75 Years and over | 6 (37.5%) | 8 (12.3%) |
Technology Access in Oak Level
Computing Device Access in Oak Level
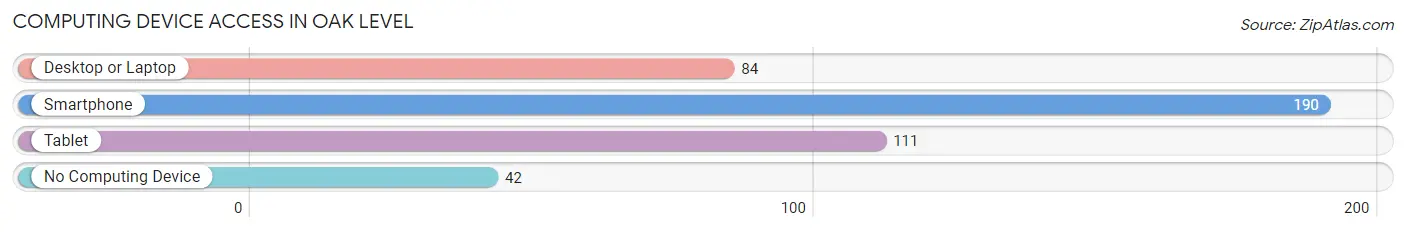
| Device Type | # Households | % Households |
| Desktop or Laptop | 84 | 32.9% |
| Smartphone | 190 | 74.5% |
| Tablet | 111 | 43.5% |
| No Computing Device | 42 | 16.5% |
| Total | 255 | 100.0% |
Internet Access in Oak Level
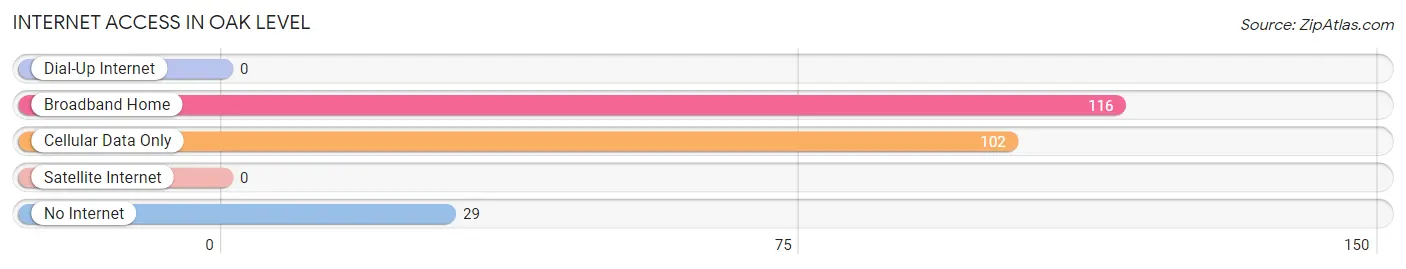
| Internet Type | # Households | % Households |
| Dial-Up Internet | 0 | 0.0% |
| Broadband Home | 116 | 45.5% |
| Cellular Data Only | 102 | 40.0% |
| Satellite Internet | 0 | 0.0% |
| No Internet | 29 | 11.4% |
| Total | 255 | 100.0% |
Oak Level Summary
Level, Virginia is a small town located in the Blue Ridge Mountains of Virginia. It is situated in the northern part of the state, about an hour and a half from Washington, D.C. The town has a population of just over 1,000 people and is known for its rural charm and scenic beauty.
History
The area that is now Oak Level was first settled in the late 1700s by a group of German immigrants. The town was originally known as “Oak Level” due to the abundance of oak trees in the area. The town was officially incorporated in 1891 and has remained a small, rural community ever since.
Geography
Oak Level is located in the northern part of Virginia, in the Blue Ridge Mountains. The town is situated at an elevation of 1,400 feet and is surrounded by rolling hills and lush forests. The town is located near the Shenandoah National Park, which provides a variety of outdoor activities for visitors.
Economy
The economy of Oak Level is largely based on agriculture and tourism. The town is home to several farms, which produce a variety of crops, including corn, soybeans, and hay. The town also has several small businesses, including a general store, a gas station, and a few restaurants. Tourism is also an important part of the local economy, as the town is a popular destination for hikers, campers, and other outdoor enthusiasts.
Demographics
As of the 2010 census, the population of Oak Level was 1,072. The racial makeup of the town was 95.3% White, 1.2% African American, 0.3% Native American, 0.2% Asian, and 2.9% from other races. The median household income was $41,250, and the median age was 43.
Conclusion
Oak Level, Virginia is a small, rural town located in the Blue Ridge Mountains of Virginia. The town has a population of just over 1,000 people and is known for its rural charm and scenic beauty. The economy of Oak Level is largely based on agriculture and tourism, and the town is a popular destination for hikers, campers, and other outdoor enthusiasts. The town has a diverse population, with a median household income of $41,250 and a median age of 43.
Common Questions
What is the Total Population of Oak Level?
Total Population of Oak Level is 453.
What is the Total Male Population of Oak Level?
Total Male Population of Oak Level is 155.
What is the Total Female Population of Oak Level?
Total Female Population of Oak Level is 298.
What is the Ratio of Males per 100 Females in Oak Level?
There are 52.01 Males per 100 Females in Oak Level.
What is the Ratio of Females per 100 Males in Oak Level?
There are 192.26 Females per 100 Males in Oak Level.
What is the Median Population Age in Oak Level?
Median Population Age in Oak Level is 55.1 Years.
What is the Average Family Size in Oak Level
Average Family Size in Oak Level is 2.9 People.
What is the Average Household Size in Oak Level
Average Household Size in Oak Level is 1.8 People.
What is Per Capita Income in Oak Level?
Per Capita income in Oak Level is $20,335.
What is the Median Household income in Oak Level?
Median Household Income in Oak Level is $32,523.
What is Income or Wage Gap in Oak Level?
Income or Wage Gap in Oak Level is 27.3%.
Women in Oak Level earn 72.7 cents for every dollar earned by a man.
What is Family Income Deficit in Oak Level?
Family Income Deficit in Oak Level is $6,058.
Families that are below poverty line in Oak Level earn $6,058 less on average than the poverty threshold level.
What is Inequality or Gini Index in Oak Level?
Inequality or Gini Index in Oak Level is 0.40.
How Large is the Labor Force in Oak Level?
There are 179 People in the Labor Forcein in Oak Level.
What is the Percentage of People in the Labor Force in Oak Level?
47.2% of People are in the Labor Force in Oak Level.