Lebanon, VA
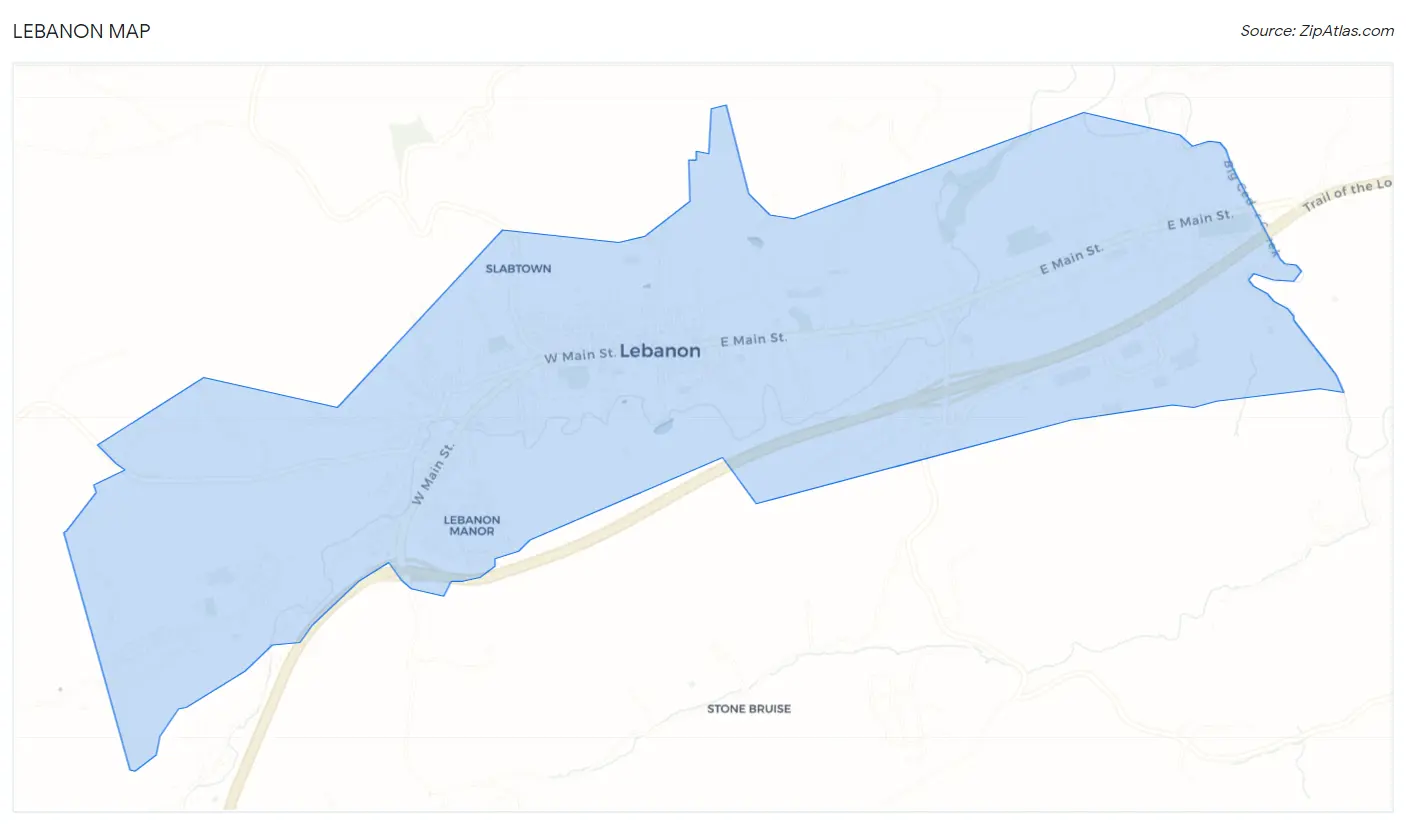
Lebanon Map
Lebanon Overview
3,139
TOTAL POPULATION
1,194
MALE POPULATION
1,945
FEMALE POPULATION
61.39
MALES / 100 FEMALES
162.90
FEMALES / 100 MALES
44.7
MEDIAN AGE
2.9
AVG FAMILY SIZE
2.4
AVG HOUSEHOLD SIZE
$26,395
PER CAPITA INCOME
$62,727
AVG FAMILY INCOME
$50,287
AVG HOUSEHOLD INCOME
24.2%
WAGE / INCOME GAP [ % ]
75.8¢/ $1
WAGE / INCOME GAP [ $ ]
0.37
INEQUALITY / GINI INDEX
1,208
LABOR FORCE [ PEOPLE ]
44.6%
PERCENT IN LABOR FORCE
Lebanon Zip Codes
Lebanon Area Codes
Race in Lebanon
The most populous races in Lebanon are White / Caucasian (3,034 | 96.7%), Black / African American (83 | 2.6%), and Two or more Races (12 | 0.4%).
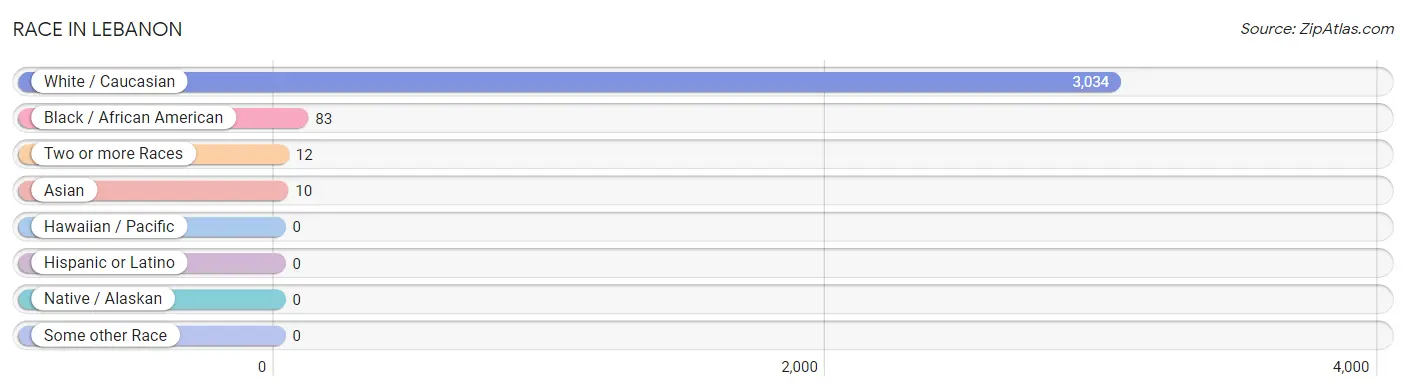
| Race | # Population | % Population |
| Asian | 10 | 0.3% |
| Black / African American | 83 | 2.6% |
| Hawaiian / Pacific | 0 | 0.0% |
| Hispanic or Latino | 0 | 0.0% |
| Native / Alaskan | 0 | 0.0% |
| White / Caucasian | 3,034 | 96.7% |
| Two or more Races | 12 | 0.4% |
| Some other Race | 0 | 0.0% |
| Total | 3,139 | 100.0% |
Ancestry in Lebanon
The most populous ancestries reported in Lebanon are American (1,287 | 41.0%), English (460 | 14.6%), Irish (166 | 5.3%), German (122 | 3.9%), and British (17 | 0.5%), together accounting for 65.4% of all Lebanon residents.
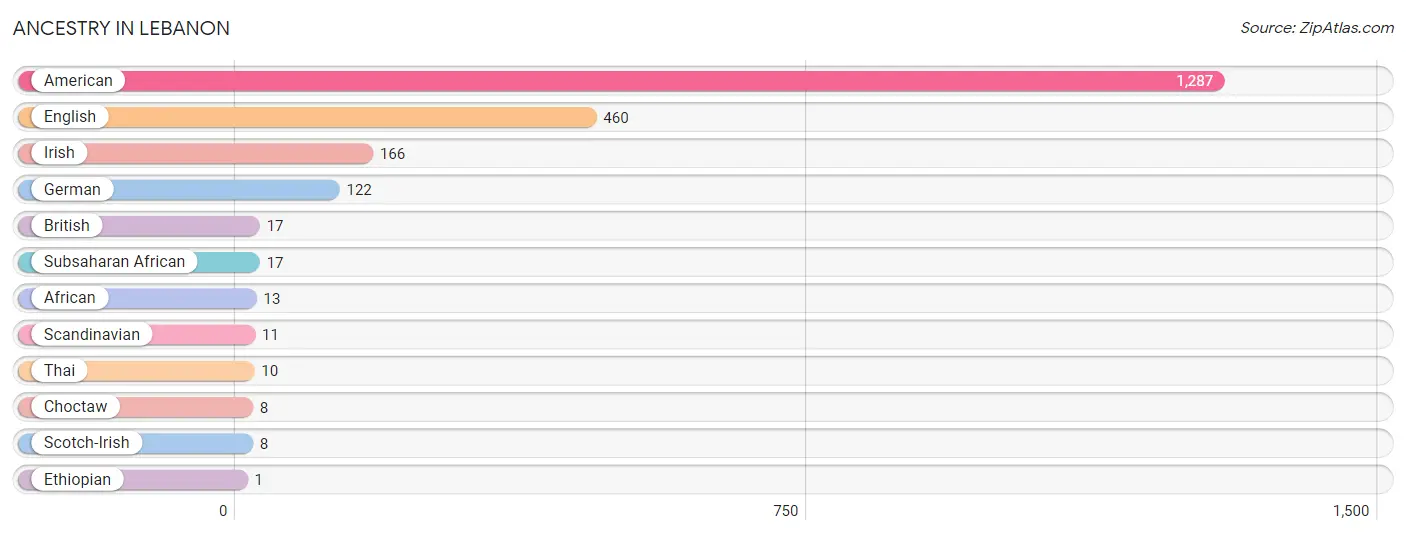
| Ancestry | # Population | % Population |
| African | 13 | 0.4% |
| American | 1,287 | 41.0% |
| British | 17 | 0.5% |
| Choctaw | 8 | 0.3% |
| English | 460 | 14.6% |
| Ethiopian | 1 | 0.0% |
| German | 122 | 3.9% |
| Irish | 166 | 5.3% |
| Scandinavian | 11 | 0.4% |
| Scotch-Irish | 8 | 0.3% |
| Subsaharan African | 17 | 0.5% |
| Thai | 10 | 0.3% | View All 12 Rows |
Immigrants in Lebanon
The most numerous immigrant groups reported in Lebanon came from Asia (10 | 0.3%), India (10 | 0.3%), South Central Asia (10 | 0.3%), Africa (3 | 0.1%), and Congo (3 | 0.1%), together accounting for 1.2% of all Lebanon residents.
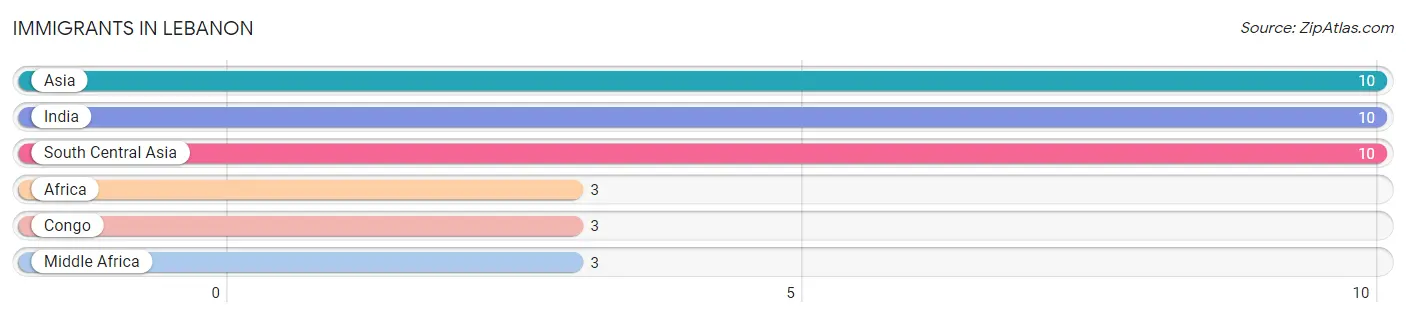
| Immigration Origin | # Population | % Population |
| Africa | 3 | 0.1% |
| Asia | 10 | 0.3% |
| Congo | 3 | 0.1% |
| India | 10 | 0.3% |
| Middle Africa | 3 | 0.1% |
| South Central Asia | 10 | 0.3% | View All 6 Rows |
Sex and Age in Lebanon
Sex and Age in Lebanon
The most populous age groups in Lebanon are 15 to 19 Years (146 | 12.2%) for men and 40 to 44 Years (243 | 12.5%) for women.
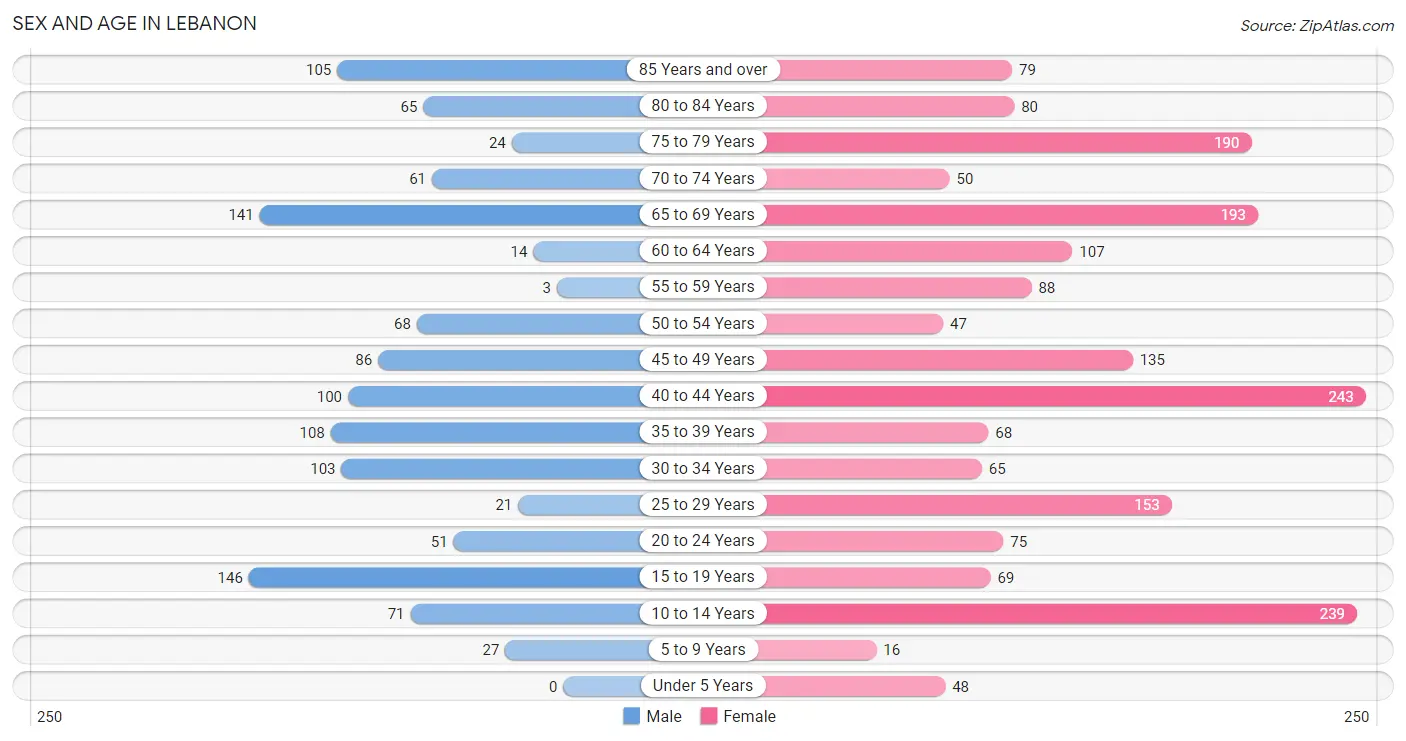
| Age Bracket | Male | Female |
| Under 5 Years | 0 (0.0%) | 48 (2.5%) |
| 5 to 9 Years | 27 (2.3%) | 16 (0.8%) |
| 10 to 14 Years | 71 (5.9%) | 239 (12.3%) |
| 15 to 19 Years | 146 (12.2%) | 69 (3.5%) |
| 20 to 24 Years | 51 (4.3%) | 75 (3.9%) |
| 25 to 29 Years | 21 (1.8%) | 153 (7.9%) |
| 30 to 34 Years | 103 (8.6%) | 65 (3.3%) |
| 35 to 39 Years | 108 (9.0%) | 68 (3.5%) |
| 40 to 44 Years | 100 (8.4%) | 243 (12.5%) |
| 45 to 49 Years | 86 (7.2%) | 135 (6.9%) |
| 50 to 54 Years | 68 (5.7%) | 47 (2.4%) |
| 55 to 59 Years | 3 (0.3%) | 88 (4.5%) |
| 60 to 64 Years | 14 (1.2%) | 107 (5.5%) |
| 65 to 69 Years | 141 (11.8%) | 193 (9.9%) |
| 70 to 74 Years | 61 (5.1%) | 50 (2.6%) |
| 75 to 79 Years | 24 (2.0%) | 190 (9.8%) |
| 80 to 84 Years | 65 (5.4%) | 80 (4.1%) |
| 85 Years and over | 105 (8.8%) | 79 (4.1%) |
| Total | 1,194 (100.0%) | 1,945 (100.0%) |
Families and Households in Lebanon
Median Family Size in Lebanon
The median family size in Lebanon is 2.87 persons per family, with single male/father families (105 | 13.6%) accounting for the largest median family size of 4.18 persons per family. On the other hand, married-couple families (351 | 45.5%) represent the smallest median family size with 2.66 persons per family.
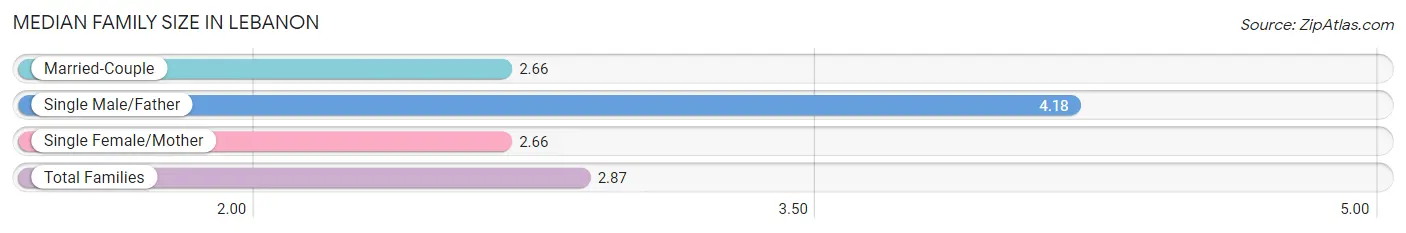
| Family Type | # Families | Family Size |
| Married-Couple | 351 (45.5%) | 2.66 |
| Single Male/Father | 105 (13.6%) | 4.18 |
| Single Female/Mother | 316 (40.9%) | 2.66 |
| Total Families | 772 (100.0%) | 2.87 |
Median Household Size in Lebanon
The median household size in Lebanon is 2.35 persons per household, with single male/father households (105 | 8.2%) accounting for the largest median household size of 4.93 persons per household. non-family households (504 | 39.5%) represent the smallest median household size with 1.29 persons per household.
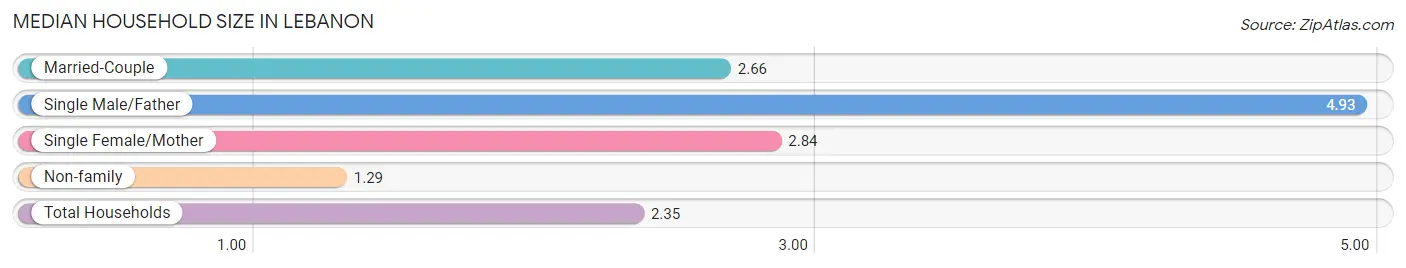
| Household Type | # Households | Household Size |
| Married-Couple | 351 (27.5%) | 2.66 |
| Single Male/Father | 105 (8.2%) | 4.93 |
| Single Female/Mother | 316 (24.8%) | 2.84 |
| Non-family | 504 (39.5%) | 1.29 |
| Total Households | 1,276 (100.0%) | 2.35 |
Household Size by Marriage Status in Lebanon
Out of a total of 1,276 households in Lebanon, 772 (60.5%) are family households, while 504 (39.5%) are nonfamily households. The most numerous type of family households are 2-person households, comprising 480, and the most common type of nonfamily households are 1-person households, comprising 415.
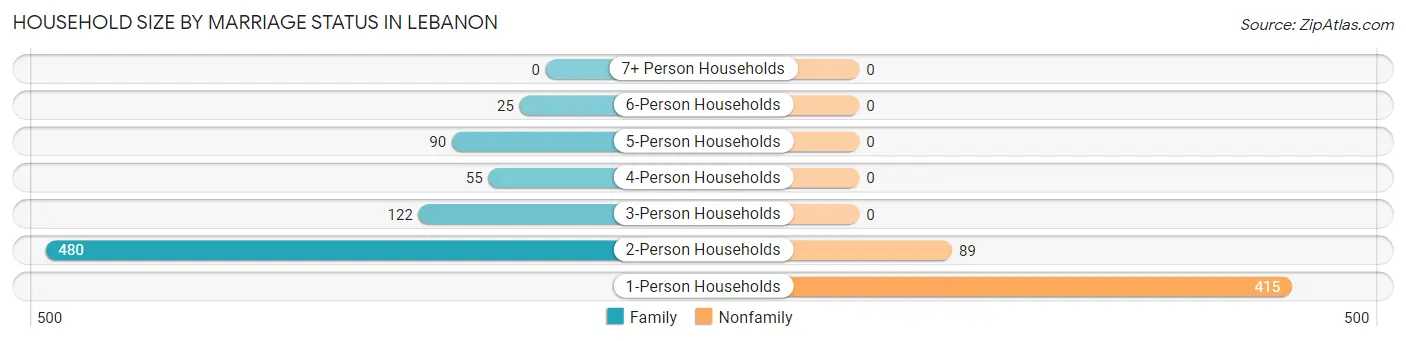
| Household Size | Family Households | Nonfamily Households |
| 1-Person Households | - | 415 (32.5%) |
| 2-Person Households | 480 (37.6%) | 89 (7.0%) |
| 3-Person Households | 122 (9.6%) | 0 (0.0%) |
| 4-Person Households | 55 (4.3%) | 0 (0.0%) |
| 5-Person Households | 90 (7.0%) | 0 (0.0%) |
| 6-Person Households | 25 (2.0%) | 0 (0.0%) |
| 7+ Person Households | 0 (0.0%) | 0 (0.0%) |
| Total | 772 (60.5%) | 504 (39.5%) |
Female Fertility in Lebanon
Fertility by Age in Lebanon
Average fertility rate in Lebanon is 16.0 births per 1,000 women. Women in the age bracket of 20 to 34 years have the highest fertility rate with 44.0 births per 1,000 women. Women in the age bracket of 20 to 34 years acount for 100.0% of all women with births.
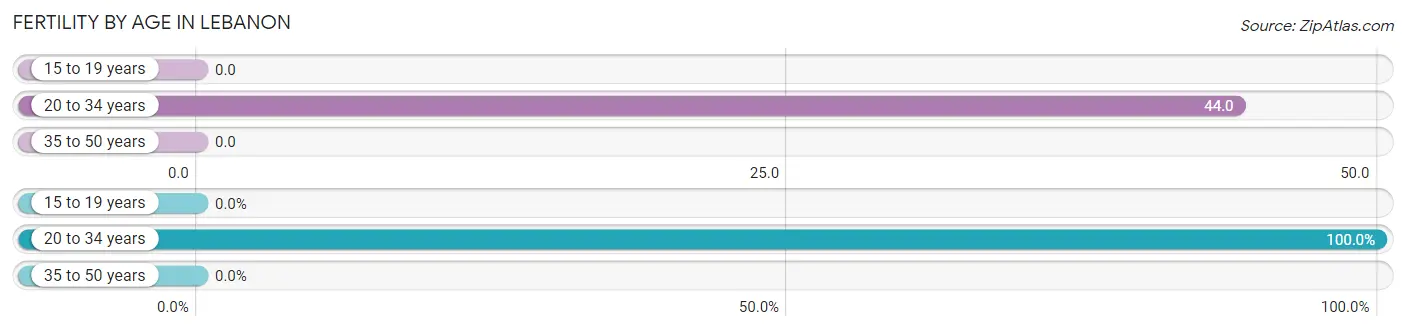
| Age Bracket | Women with Births | Births / 1,000 Women |
| 15 to 19 years | 0 (0.0%) | 0.0 |
| 20 to 34 years | 13 (100.0%) | 44.0 |
| 35 to 50 years | 0 (0.0%) | 0.0 |
| Total | 13 (100.0%) | 16.0 |
Fertility by Age by Marriage Status in Lebanon
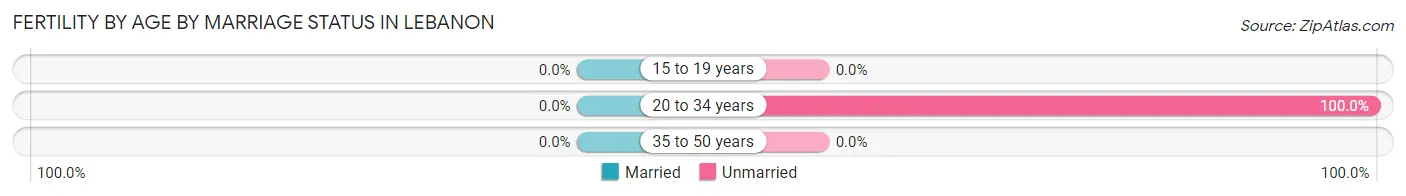
| Age Bracket | Married | Unmarried |
| 15 to 19 years | 0 (0.0%) | 0 (0.0%) |
| 20 to 34 years | 0 (0.0%) | 13 (100.0%) |
| 35 to 50 years | 0 (0.0%) | 0 (0.0%) |
| Total | 0 (0.0%) | 13 (100.0%) |
Fertility by Education in Lebanon
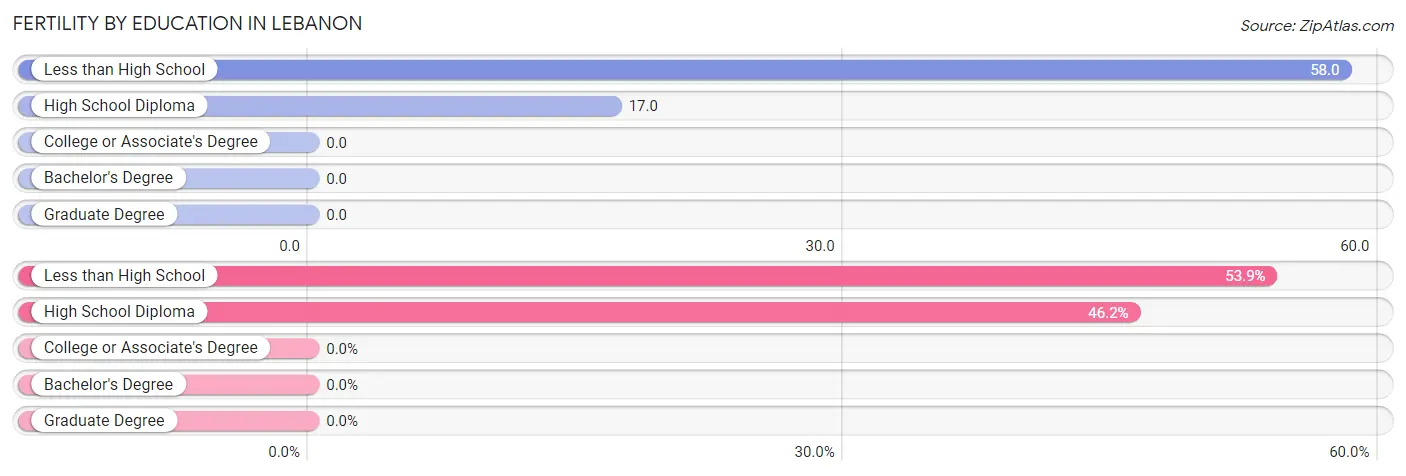
| Educational Attainment | Women with Births | Births / 1,000 Women |
| Less than High School | 7 (53.8%) | 58.0 |
| High School Diploma | 6 (46.2%) | 17.0 |
| College or Associate's Degree | 0 (0.0%) | 0.0 |
| Bachelor's Degree | 0 (0.0%) | 0.0 |
| Graduate Degree | 0 (0.0%) | 0.0 |
| Total | 13 (100.0%) | 16.0 |
Fertility by Education by Marriage Status in Lebanon
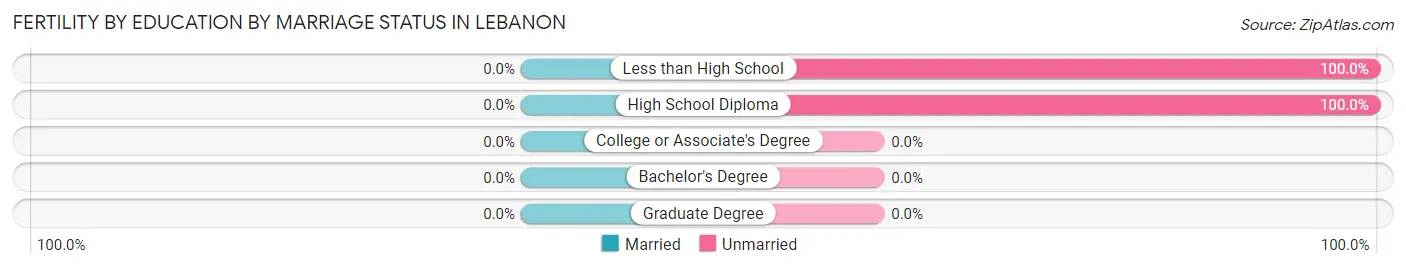
| Educational Attainment | Married | Unmarried |
| Less than High School | 0 (0.0%) | 7 (100.0%) |
| High School Diploma | 0 (0.0%) | 6 (100.0%) |
| College or Associate's Degree | 0 (0.0%) | 0 (0.0%) |
| Bachelor's Degree | 0 (0.0%) | 0 (0.0%) |
| Graduate Degree | 0 (0.0%) | 0 (0.0%) |
| Total | 0 (0.0%) | 13 (100.0%) |
Income in Lebanon
Income Overview in Lebanon
Per Capita Income in Lebanon is $26,395, while median incomes of families and households are $62,727 and $50,287 respectively.
| Characteristic | Number | Measure |
| Per Capita Income | 3,139 | $26,395 |
| Median Family Income | 772 | $62,727 |
| Mean Family Income | 772 | $71,909 |
| Median Household Income | 1,276 | $50,287 |
| Mean Household Income | 1,276 | $60,257 |
| Income Deficit | 772 | $0 |
| Wage / Income Gap (%) | 3,139 | 24.18% |
| Wage / Income Gap ($) | 3,139 | 75.82¢ per $1 |
| Gini / Inequality Index | 3,139 | 0.37 |
Earnings by Sex in Lebanon
Average Earnings in Lebanon are $24,914, $29,788 for men and $22,586 for women, a difference of 24.2%.
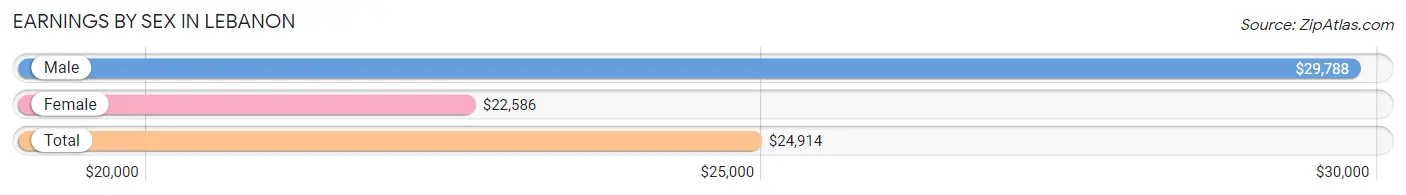
| Sex | Number | Average Earnings |
| Male | 442 (35.0%) | $29,788 |
| Female | 820 (65.0%) | $22,586 |
| Total | 1,262 (100.0%) | $24,914 |
Earnings by Sex by Income Bracket in Lebanon
The most common earnings brackets in Lebanon are $10,000 to $12,499 for men (73 | 16.5%) and $12,500 to $14,999 for women (176 | 21.5%).
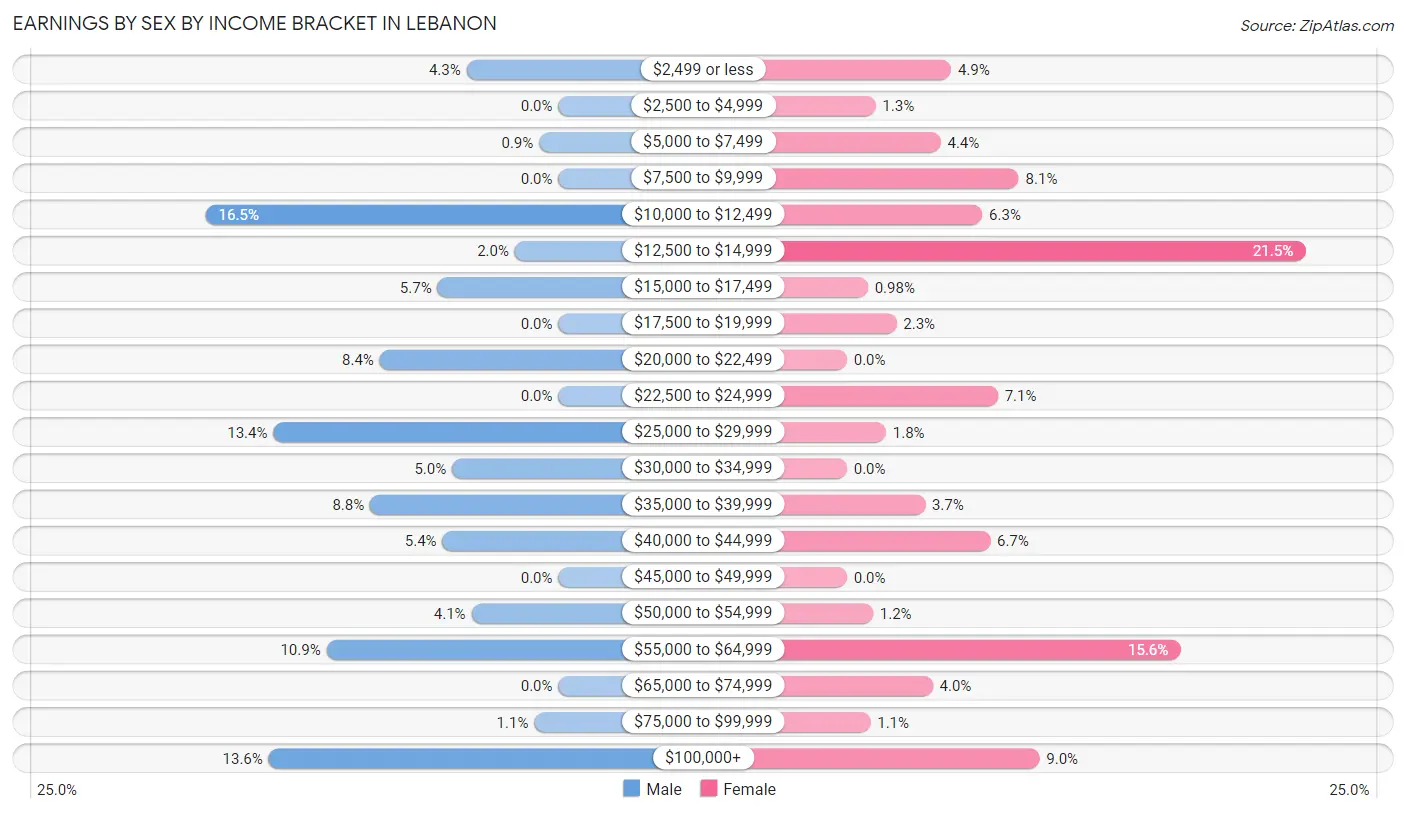
| Income | Male | Female |
| $2,499 or less | 19 (4.3%) | 40 (4.9%) |
| $2,500 to $4,999 | 0 (0.0%) | 11 (1.3%) |
| $5,000 to $7,499 | 4 (0.9%) | 36 (4.4%) |
| $7,500 to $9,999 | 0 (0.0%) | 66 (8.1%) |
| $10,000 to $12,499 | 73 (16.5%) | 52 (6.3%) |
| $12,500 to $14,999 | 9 (2.0%) | 176 (21.5%) |
| $15,000 to $17,499 | 25 (5.7%) | 8 (1.0%) |
| $17,500 to $19,999 | 0 (0.0%) | 19 (2.3%) |
| $20,000 to $22,499 | 37 (8.4%) | 0 (0.0%) |
| $22,500 to $24,999 | 0 (0.0%) | 58 (7.1%) |
| $25,000 to $29,999 | 59 (13.4%) | 15 (1.8%) |
| $30,000 to $34,999 | 22 (5.0%) | 0 (0.0%) |
| $35,000 to $39,999 | 39 (8.8%) | 30 (3.7%) |
| $40,000 to $44,999 | 24 (5.4%) | 55 (6.7%) |
| $45,000 to $49,999 | 0 (0.0%) | 0 (0.0%) |
| $50,000 to $54,999 | 18 (4.1%) | 10 (1.2%) |
| $55,000 to $64,999 | 48 (10.9%) | 128 (15.6%) |
| $65,000 to $74,999 | 0 (0.0%) | 33 (4.0%) |
| $75,000 to $99,999 | 5 (1.1%) | 9 (1.1%) |
| $100,000+ | 60 (13.6%) | 74 (9.0%) |
| Total | 442 (100.0%) | 820 (100.0%) |
Earnings by Sex by Educational Attainment in Lebanon
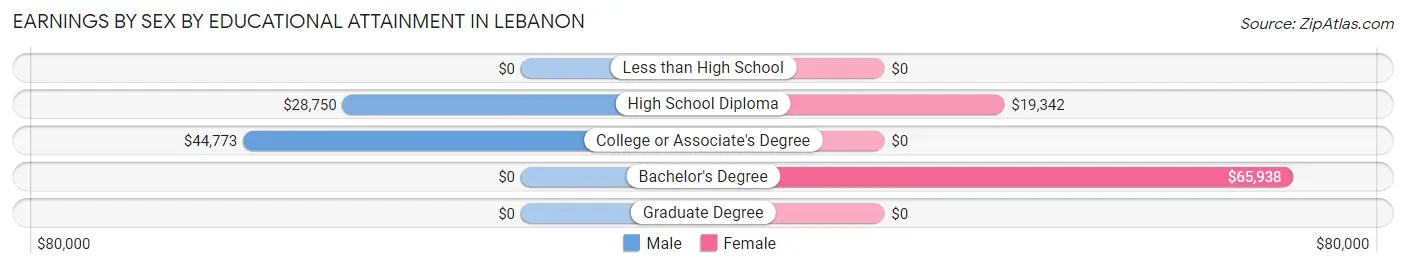
| Educational Attainment | Male Income | Female Income |
| Less than High School | - | - |
| High School Diploma | $28,750 | $19,342 |
| College or Associate's Degree | $44,773 | $0 |
| Bachelor's Degree | - | - |
| Graduate Degree | - | - |
| Total | $33,239 | $0 |
Family Income in Lebanon
Family Income Brackets in Lebanon
According to the Lebanon family income data, there are 182 families falling into the $50,000 to $74,999 income range, which is the most common income bracket and makes up 23.6% of all families.
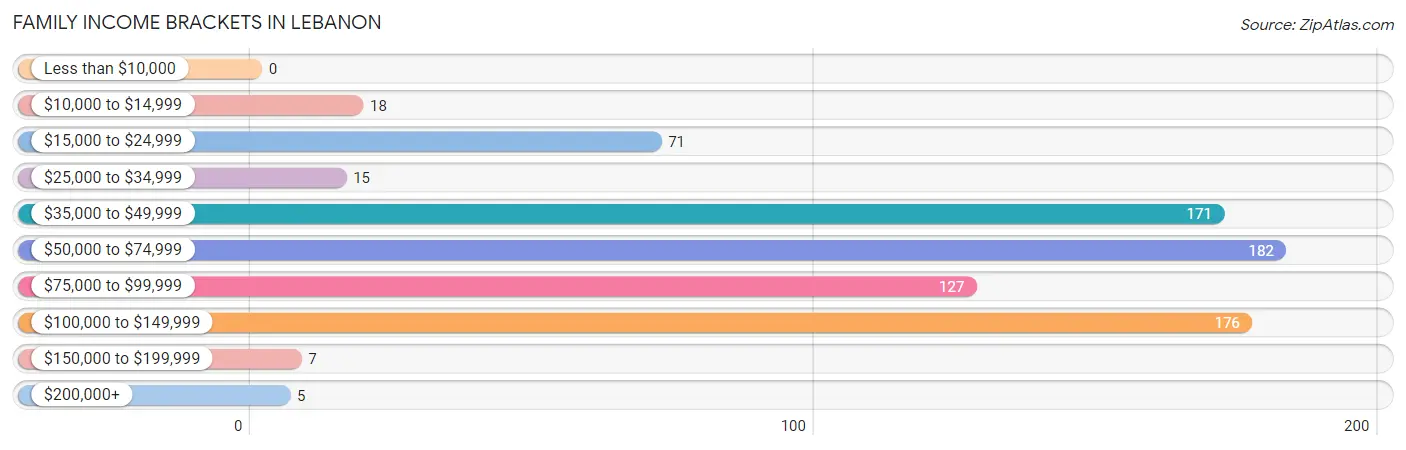
| Income Bracket | # Families | % Families |
| Less than $10,000 | 0 | 0.0% |
| $10,000 to $14,999 | 18 | 2.3% |
| $15,000 to $24,999 | 71 | 9.2% |
| $25,000 to $34,999 | 15 | 1.9% |
| $35,000 to $49,999 | 171 | 22.2% |
| $50,000 to $74,999 | 182 | 23.6% |
| $75,000 to $99,999 | 127 | 16.5% |
| $100,000 to $149,999 | 176 | 22.8% |
| $150,000 to $199,999 | 7 | 0.9% |
| $200,000+ | 5 | 0.6% |
Family Income by Famaliy Size in Lebanon
2-person families (488 | 63.2%) account for the highest median family income in Lebanon with $66,667 per family, while 2-person families (488 | 63.2%) have the highest median income of $33,334 per family member.
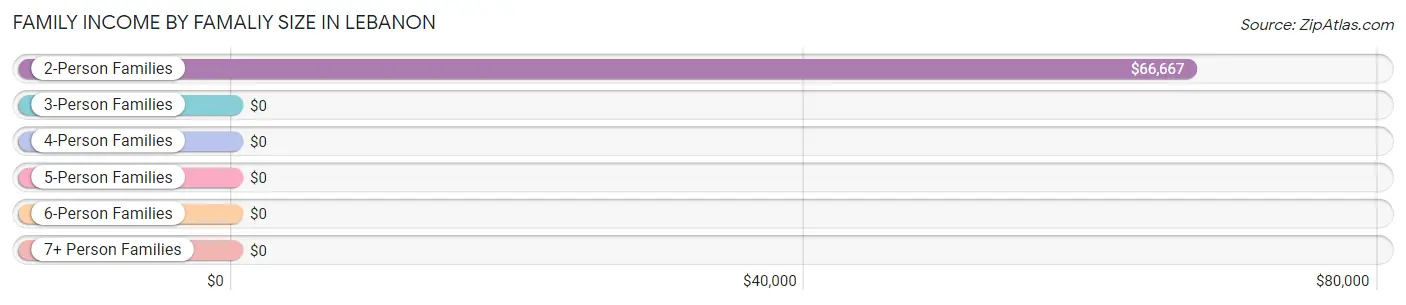
| Income Bracket | # Families | Median Income |
| 2-Person Families | 488 (63.2%) | $66,667 |
| 3-Person Families | 139 (18.0%) | $0 |
| 4-Person Families | 91 (11.8%) | $0 |
| 5-Person Families | 54 (7.0%) | $0 |
| 6-Person Families | 0 (0.0%) | $0 |
| 7+ Person Families | 0 (0.0%) | $0 |
| Total | 772 (100.0%) | $62,727 |
Family Income by Number of Earners in Lebanon
| Number of Earners | # Families | Median Income |
| No Earners | 174 (22.5%) | $76,611 |
| 1 Earner | 372 (48.2%) | $55,595 |
| 2 Earners | 215 (27.9%) | $85,045 |
| 3+ Earners | 11 (1.4%) | $0 |
| Total | 772 (100.0%) | $62,727 |
Household Income in Lebanon
Household Income Brackets in Lebanon
With 262 households falling in the category, the $50,000 to $74,999 income range is the most frequent in Lebanon, accounting for 20.5% of all households. In contrast, only 5 households (0.4%) fall into the $200,000+ income bracket, making it the least populous group.
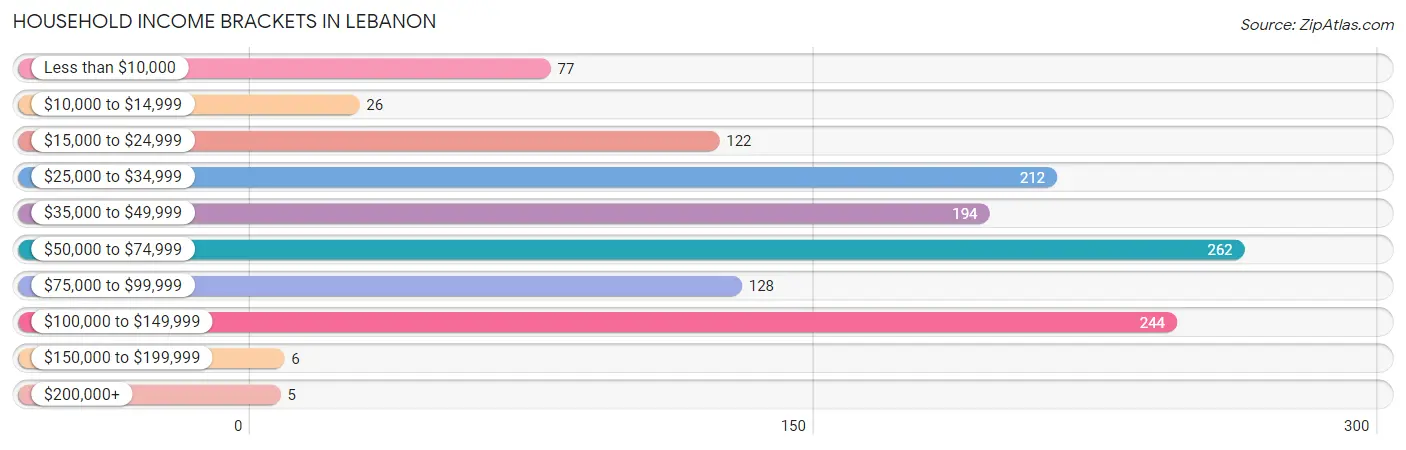
| Income Bracket | # Households | % Households |
| Less than $10,000 | 77 | 6.0% |
| $10,000 to $14,999 | 26 | 2.0% |
| $15,000 to $24,999 | 122 | 9.6% |
| $25,000 to $34,999 | 212 | 16.6% |
| $35,000 to $49,999 | 194 | 15.2% |
| $50,000 to $74,999 | 262 | 20.5% |
| $75,000 to $99,999 | 128 | 10.0% |
| $100,000 to $149,999 | 244 | 19.1% |
| $150,000 to $199,999 | 6 | 0.5% |
| $200,000+ | 5 | 0.4% |
Household Income by Householder Age in Lebanon
The median household income in Lebanon is $50,287, with the highest median household income of $56,845 found in the 45 to 64 years age bracket for the primary householder. A total of 204 households (16.0%) fall into this category. Meanwhile, the 15 to 24 years age bracket for the primary householder has the lowest median household income of $0, with 58 households (4.5%) in this group.
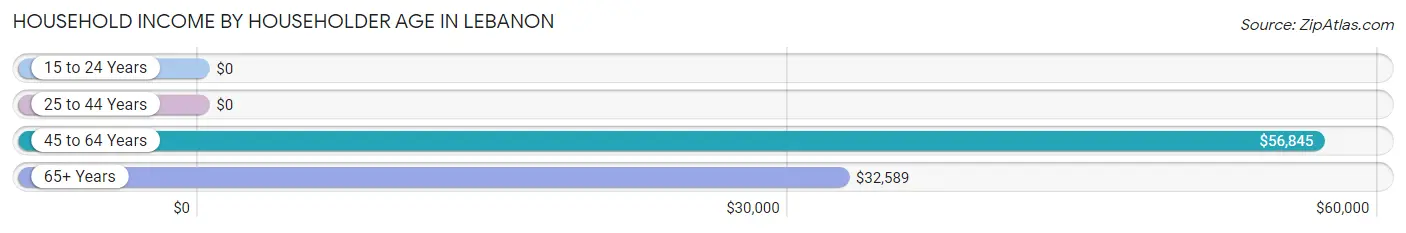
| Income Bracket | # Households | Median Income |
| 15 to 24 Years | 58 (4.5%) | $0 |
| 25 to 44 Years | 376 (29.5%) | $0 |
| 45 to 64 Years | 204 (16.0%) | $56,845 |
| 65+ Years | 638 (50.0%) | $32,589 |
| Total | 1,276 (100.0%) | $50,287 |
Poverty in Lebanon
Income Below Poverty by Sex and Age in Lebanon
With 16.3% poverty level for males and 16.8% for females among the residents of Lebanon, 6 to 11 year old males and 18 to 24 year old females are the most vulnerable to poverty, with 27 males (47.4%) and 68 females (100.0%) in their respective age groups living below the poverty level.
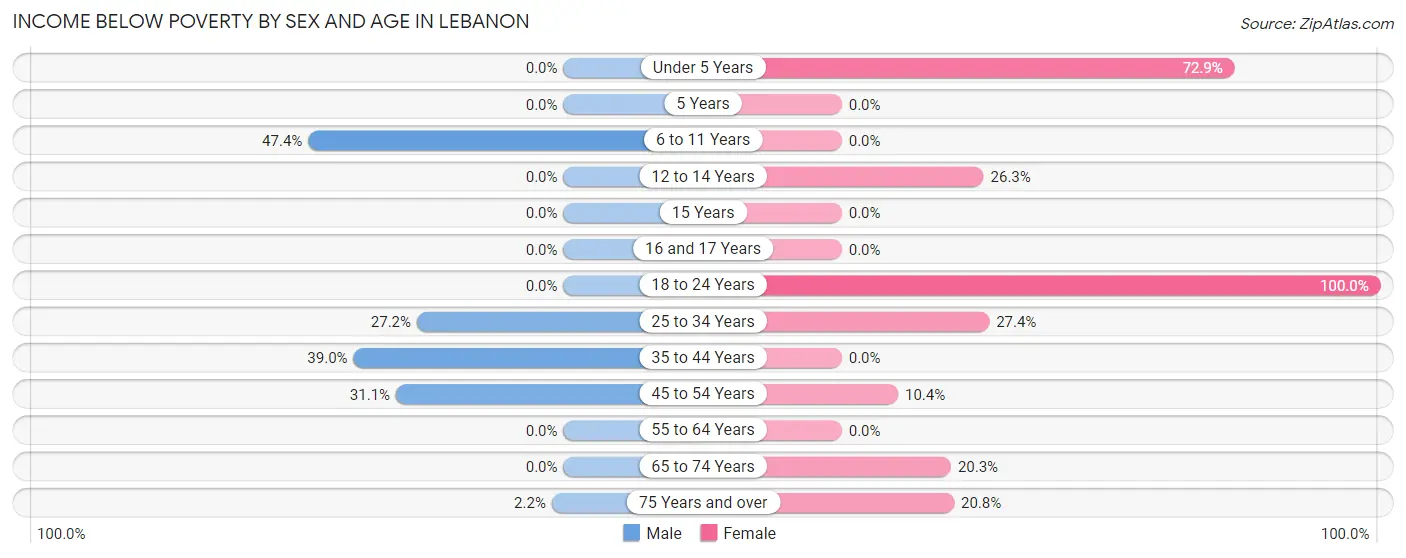
| Age Bracket | Male | Female |
| Under 5 Years | 0 (0.0%) | 35 (72.9%) |
| 5 Years | 0 (0.0%) | 0 (0.0%) |
| 6 to 11 Years | 27 (47.4%) | 0 (0.0%) |
| 12 to 14 Years | 0 (0.0%) | 20 (26.3%) |
| 15 Years | 0 (0.0%) | 0 (0.0%) |
| 16 and 17 Years | 0 (0.0%) | 0 (0.0%) |
| 18 to 24 Years | 0 (0.0%) | 68 (100.0%) |
| 25 to 34 Years | 31 (27.2%) | 58 (27.4%) |
| 35 to 44 Years | 76 (39.0%) | 0 (0.0%) |
| 45 to 54 Years | 46 (31.1%) | 19 (10.4%) |
| 55 to 64 Years | 0 (0.0%) | 0 (0.0%) |
| 65 to 74 Years | 0 (0.0%) | 47 (20.3%) |
| 75 Years and over | 4 (2.2%) | 70 (20.8%) |
| Total | 184 (16.3%) | 317 (16.8%) |
Income Above Poverty by Sex and Age in Lebanon
According to the poverty statistics in Lebanon, males aged 12 to 14 years and females aged 6 to 11 years are the age groups that are most secure financially, with 100.0% of males and 100.0% of females in these age groups living above the poverty line.
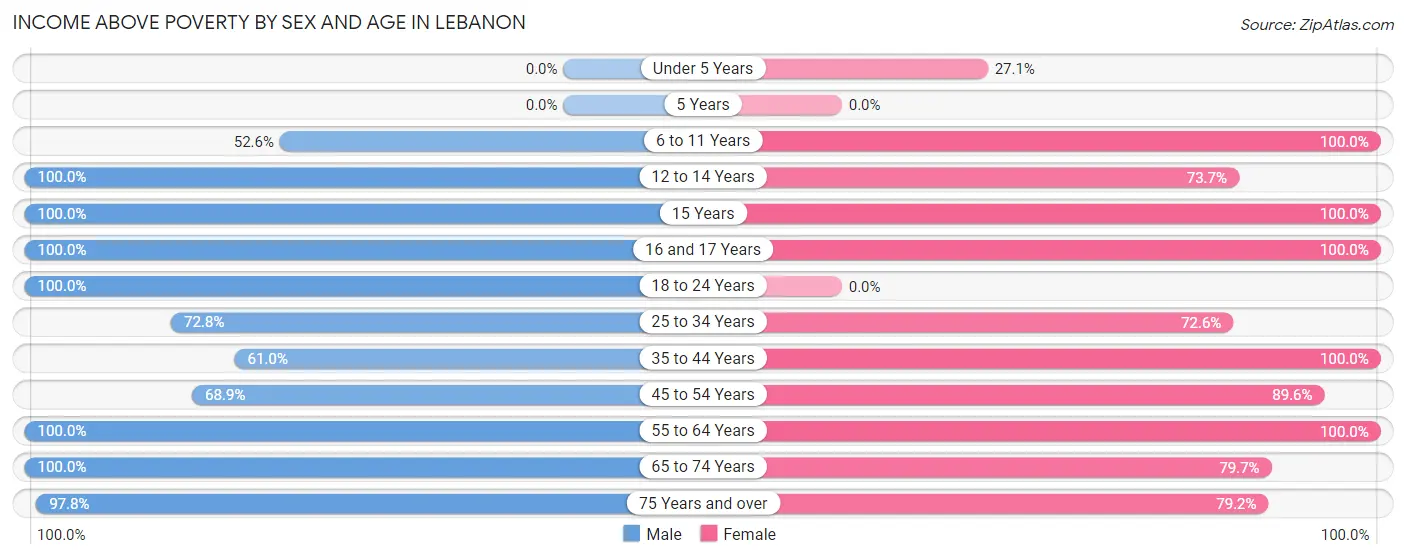
| Age Bracket | Male | Female |
| Under 5 Years | 0 (0.0%) | 13 (27.1%) |
| 5 Years | 0 (0.0%) | 0 (0.0%) |
| 6 to 11 Years | 30 (52.6%) | 166 (100.0%) |
| 12 to 14 Years | 41 (100.0%) | 56 (73.7%) |
| 15 Years | 24 (100.0%) | 6 (100.0%) |
| 16 and 17 Years | 31 (100.0%) | 56 (100.0%) |
| 18 to 24 Years | 138 (100.0%) | 0 (0.0%) |
| 25 to 34 Years | 83 (72.8%) | 154 (72.6%) |
| 35 to 44 Years | 119 (61.0%) | 311 (100.0%) |
| 45 to 54 Years | 102 (68.9%) | 163 (89.6%) |
| 55 to 64 Years | 10 (100.0%) | 195 (100.0%) |
| 65 to 74 Years | 186 (100.0%) | 185 (79.7%) |
| 75 Years and over | 181 (97.8%) | 266 (79.2%) |
| Total | 945 (83.7%) | 1,571 (83.2%) |
Income Below Poverty Among Married-Couple Families in Lebanon
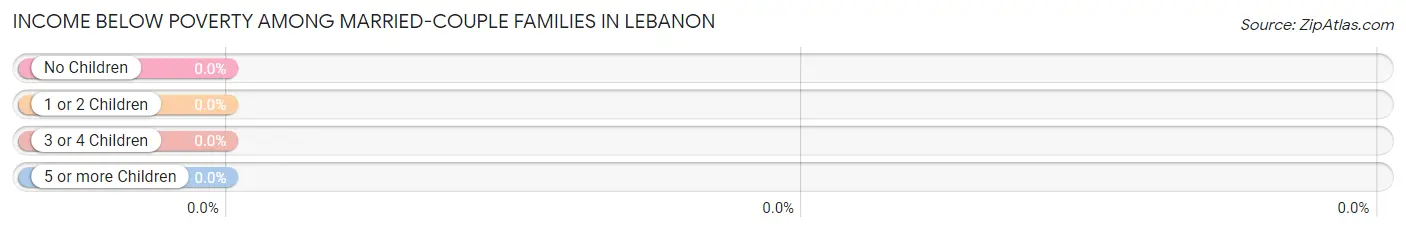
| Children | Above Poverty | Below Poverty |
| No Children | 248 (100.0%) | 0 (0.0%) |
| 1 or 2 Children | 74 (100.0%) | 0 (0.0%) |
| 3 or 4 Children | 29 (100.0%) | 0 (0.0%) |
| 5 or more Children | 0 (0.0%) | 0 (0.0%) |
| Total | 351 (100.0%) | 0 (0.0%) |
Income Below Poverty Among Single-Parent Households in Lebanon
According to the poverty data in Lebanon, 23.8% or 25 single-father households and 5.7% or 18 single-mother households are living below the poverty line. Among single-father households, those with 3 or 4 children have the highest poverty rate, with 25 households (100.0%) experiencing poverty. Likewise, among single-mother households, those with no children have the highest poverty rate, with 18 households (13.3%) falling below the poverty line.
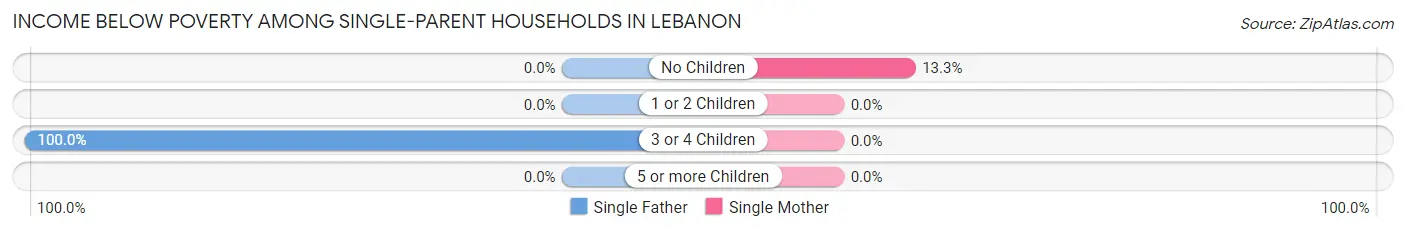
| Children | Single Father | Single Mother |
| No Children | 0 (0.0%) | 18 (13.3%) |
| 1 or 2 Children | 0 (0.0%) | 0 (0.0%) |
| 3 or 4 Children | 25 (100.0%) | 0 (0.0%) |
| 5 or more Children | 0 (0.0%) | 0 (0.0%) |
| Total | 25 (23.8%) | 18 (5.7%) |
Income Below Poverty Among Married-Couple vs Single-Parent Households in Lebanon
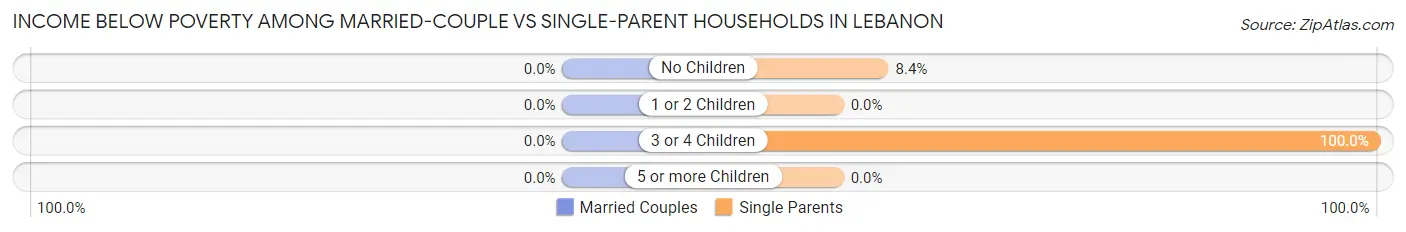
| Children | Married-Couple Families | Single-Parent Households |
| No Children | 0 (0.0%) | 18 (8.4%) |
| 1 or 2 Children | 0 (0.0%) | 0 (0.0%) |
| 3 or 4 Children | 0 (0.0%) | 25 (100.0%) |
| 5 or more Children | 0 (0.0%) | 0 (0.0%) |
| Total | 0 (0.0%) | 43 (10.2%) |
Employment Characteristics in Lebanon
Employment by Class of Employer in Lebanon
Among the 1,202 employed individuals in Lebanon, private company employees (633 | 52.7%), not-for-profit organizations (187 | 15.6%), and state government employees (137 | 11.4%) make up the most common classes of employment.
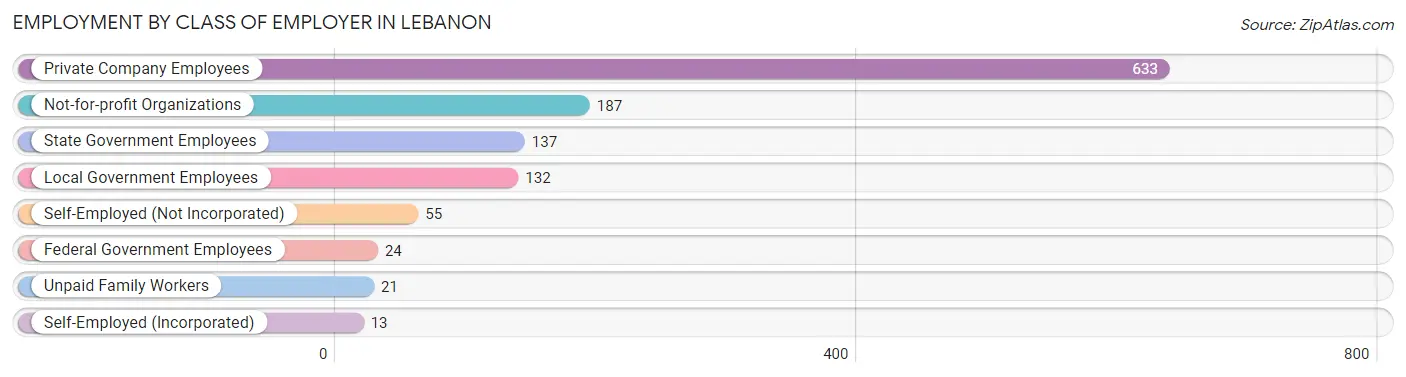
| Employer Class | # Employees | % Employees |
| Private Company Employees | 633 | 52.7% |
| Self-Employed (Incorporated) | 13 | 1.1% |
| Self-Employed (Not Incorporated) | 55 | 4.6% |
| Not-for-profit Organizations | 187 | 15.6% |
| Local Government Employees | 132 | 11.0% |
| State Government Employees | 137 | 11.4% |
| Federal Government Employees | 24 | 2.0% |
| Unpaid Family Workers | 21 | 1.8% |
| Total | 1,202 | 100.0% |
Employment Status by Age in Lebanon
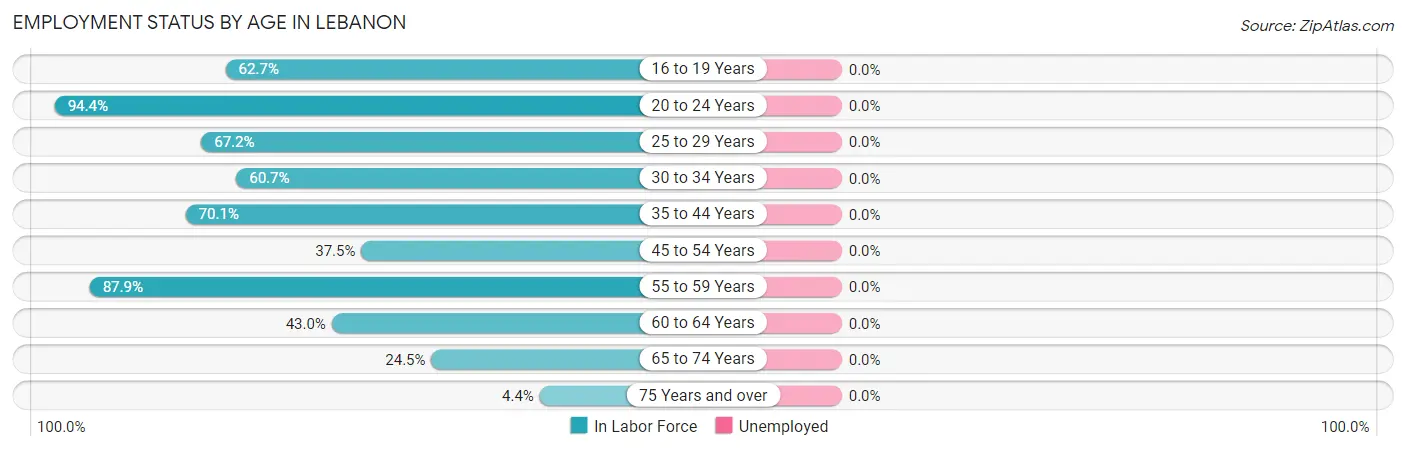
| Age Bracket | In Labor Force | Unemployed |
| 16 to 19 Years | 116 (62.7%) | 0 (0.0%) |
| 20 to 24 Years | 119 (94.4%) | 0 (0.0%) |
| 25 to 29 Years | 117 (67.2%) | 0 (0.0%) |
| 30 to 34 Years | 102 (60.7%) | 0 (0.0%) |
| 35 to 44 Years | 364 (70.1%) | 0 (0.0%) |
| 45 to 54 Years | 126 (37.5%) | 0 (0.0%) |
| 55 to 59 Years | 80 (87.9%) | 0 (0.0%) |
| 60 to 64 Years | 52 (43.0%) | 0 (0.0%) |
| 65 to 74 Years | 109 (24.5%) | 0 (0.0%) |
| 75 Years and over | 24 (4.4%) | 0 (0.0%) |
| Total | 1,208 (44.6%) | 0 (0.0%) |
Employment Status by Educational Attainment in Lebanon
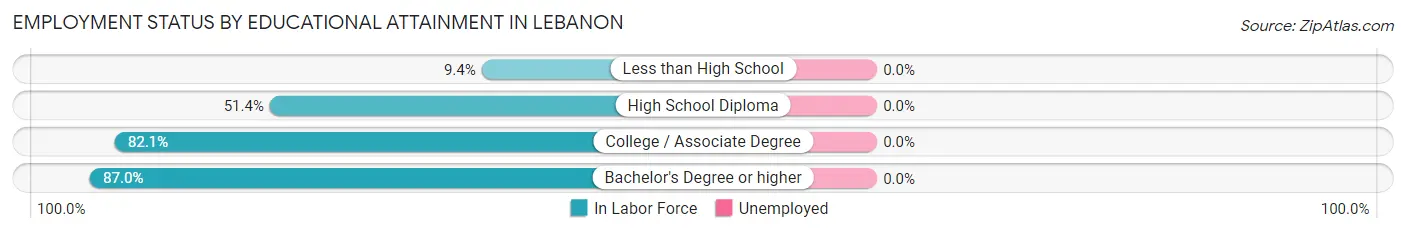
| Educational Attainment | In Labor Force | Unemployed |
| Less than High School | 13 (9.4%) | 0 (0.0%) |
| High School Diploma | 373 (51.4%) | 0 (0.0%) |
| College / Associate Degree | 321 (82.1%) | 0 (0.0%) |
| Bachelor's Degree or higher | 134 (87.0%) | 0 (0.0%) |
| Total | 841 (59.7%) | 0 (0.0%) |
Employment Occupations by Sex in Lebanon
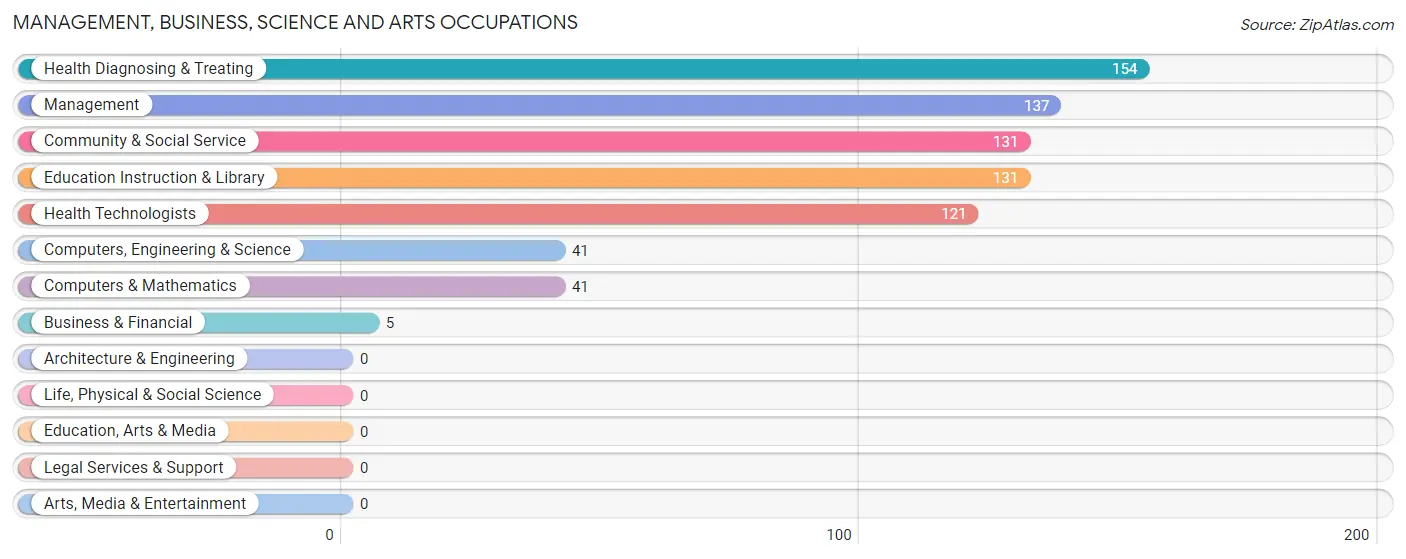
Management, Business, Science and Arts Occupations
The most common Management, Business, Science and Arts occupations in Lebanon are Health Diagnosing & Treating (154 | 12.7%), Management (137 | 11.3%), Community & Social Service (131 | 10.8%), Education Instruction & Library (131 | 10.8%), and Health Technologists (121 | 10.0%).
Management, Business, Science and Arts Occupations by Sex
Within the Management, Business, Science and Arts occupations in Lebanon, the most male-oriented occupations are Business & Financial (100.0%), Community & Social Service (48.1%), and Education Instruction & Library (48.1%), while the most female-oriented occupations are Computers, Engineering & Science (100.0%), Computers & Mathematics (100.0%), and Health Diagnosing & Treating (100.0%).
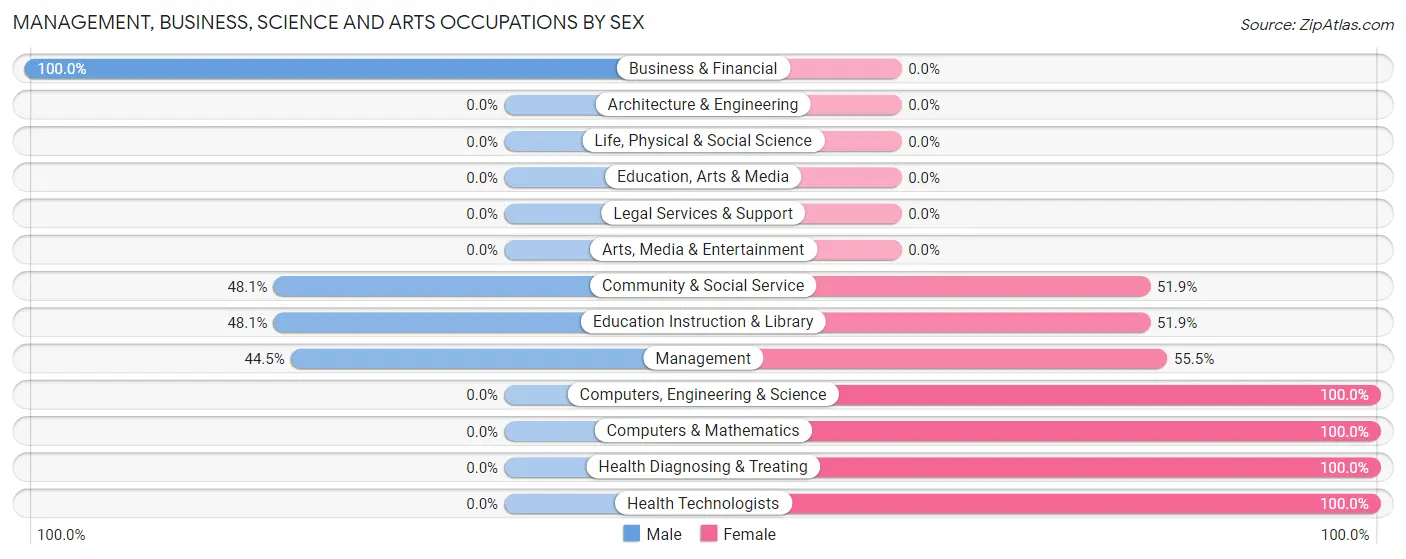
| Occupation | Male | Female |
| Management | 61 (44.5%) | 76 (55.5%) |
| Business & Financial | 5 (100.0%) | 0 (0.0%) |
| Computers, Engineering & Science | 0 (0.0%) | 41 (100.0%) |
| Computers & Mathematics | 0 (0.0%) | 41 (100.0%) |
| Architecture & Engineering | 0 (0.0%) | 0 (0.0%) |
| Life, Physical & Social Science | 0 (0.0%) | 0 (0.0%) |
| Community & Social Service | 63 (48.1%) | 68 (51.9%) |
| Education, Arts & Media | 0 (0.0%) | 0 (0.0%) |
| Legal Services & Support | 0 (0.0%) | 0 (0.0%) |
| Education Instruction & Library | 63 (48.1%) | 68 (51.9%) |
| Arts, Media & Entertainment | 0 (0.0%) | 0 (0.0%) |
| Health Diagnosing & Treating | 0 (0.0%) | 154 (100.0%) |
| Health Technologists | 0 (0.0%) | 121 (100.0%) |
| Total (Category) | 129 (27.6%) | 339 (72.4%) |
| Total (Overall) | 417 (34.5%) | 792 (65.5%) |
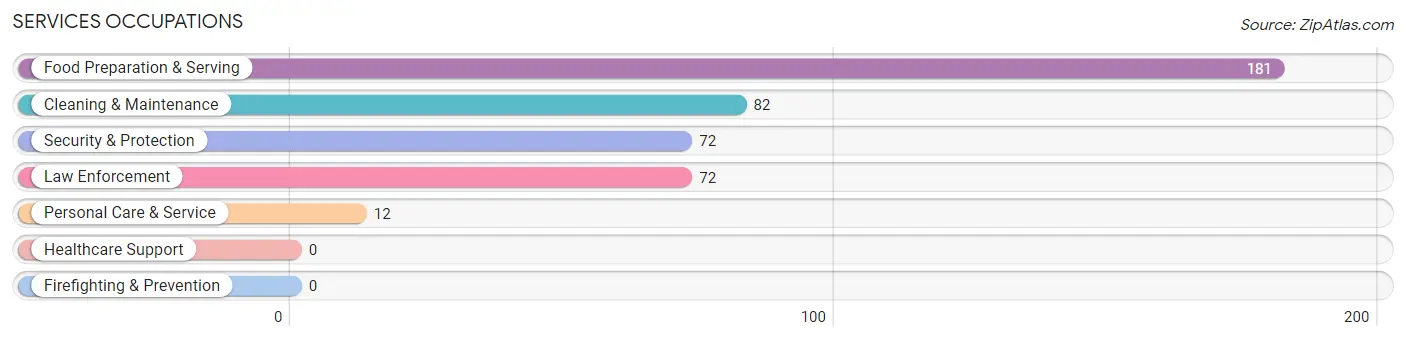
Services Occupations
The most common Services occupations in Lebanon are Food Preparation & Serving (181 | 15.0%), Cleaning & Maintenance (82 | 6.8%), Security & Protection (72 | 6.0%), Law Enforcement (72 | 6.0%), and Personal Care & Service (12 | 1.0%).
Services Occupations by Sex
Within the Services occupations in Lebanon, the most male-oriented occupations are Personal Care & Service (100.0%), Security & Protection (70.8%), and Law Enforcement (70.8%), while the most female-oriented occupations are Food Preparation & Serving (100.0%), Cleaning & Maintenance (32.9%), and Security & Protection (29.2%).
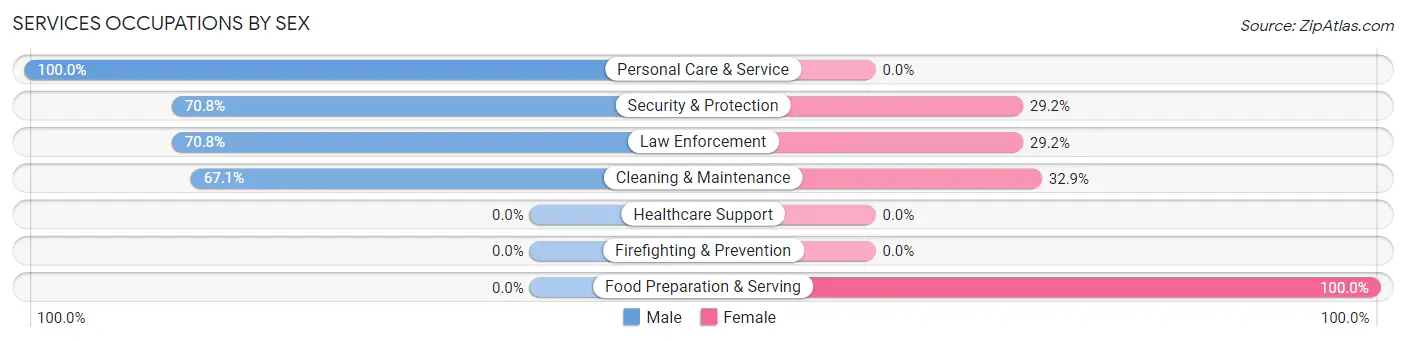
| Occupation | Male | Female |
| Healthcare Support | 0 (0.0%) | 0 (0.0%) |
| Security & Protection | 51 (70.8%) | 21 (29.2%) |
| Firefighting & Prevention | 0 (0.0%) | 0 (0.0%) |
| Law Enforcement | 51 (70.8%) | 21 (29.2%) |
| Food Preparation & Serving | 0 (0.0%) | 181 (100.0%) |
| Cleaning & Maintenance | 55 (67.1%) | 27 (32.9%) |
| Personal Care & Service | 12 (100.0%) | 0 (0.0%) |
| Total (Category) | 118 (34.0%) | 229 (66.0%) |
| Total (Overall) | 417 (34.5%) | 792 (65.5%) |
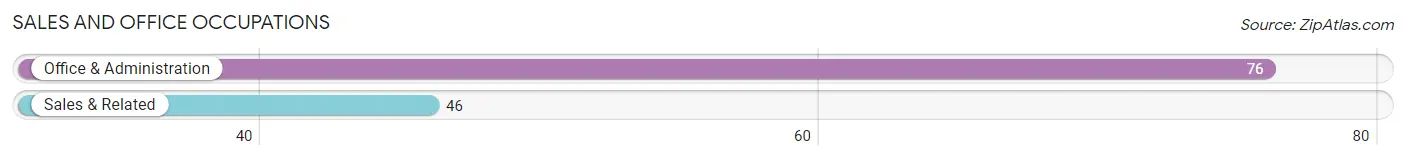
Sales and Office Occupations
The most common Sales and Office occupations in Lebanon are Office & Administration (76 | 6.3%), and Sales & Related (46 | 3.8%).
Sales and Office Occupations by Sex
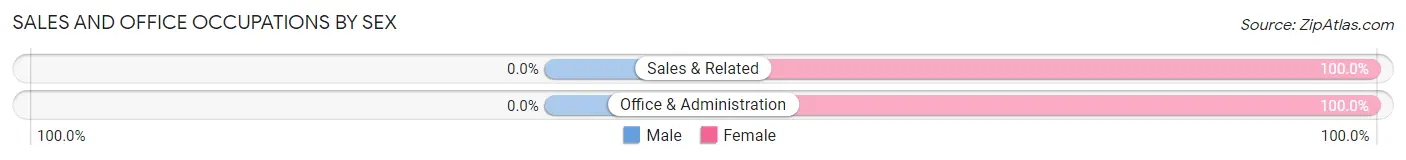
| Occupation | Male | Female |
| Sales & Related | 0 (0.0%) | 46 (100.0%) |
| Office & Administration | 0 (0.0%) | 76 (100.0%) |
| Total (Category) | 0 (0.0%) | 122 (100.0%) |
| Total (Overall) | 417 (34.5%) | 792 (65.5%) |
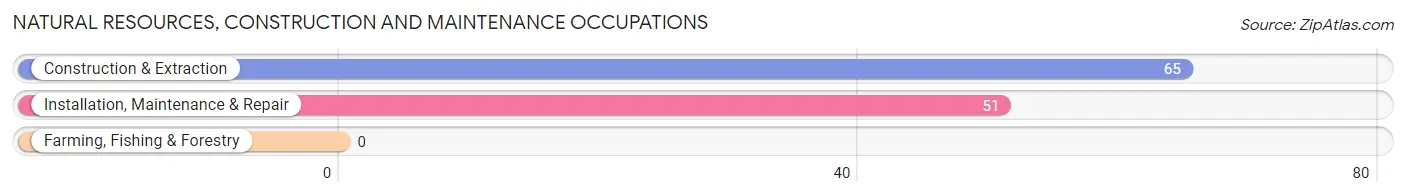
Natural Resources, Construction and Maintenance Occupations
The most common Natural Resources, Construction and Maintenance occupations in Lebanon are Construction & Extraction (65 | 5.4%), and Installation, Maintenance & Repair (51 | 4.2%).
Natural Resources, Construction and Maintenance Occupations by Sex
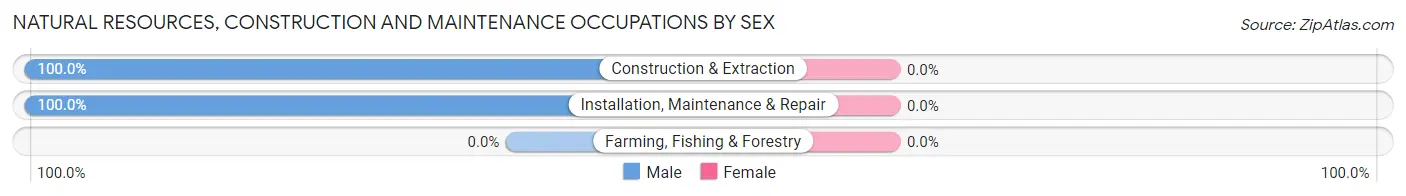
| Occupation | Male | Female |
| Farming, Fishing & Forestry | 0 (0.0%) | 0 (0.0%) |
| Construction & Extraction | 65 (100.0%) | 0 (0.0%) |
| Installation, Maintenance & Repair | 51 (100.0%) | 0 (0.0%) |
| Total (Category) | 116 (100.0%) | 0 (0.0%) |
| Total (Overall) | 417 (34.5%) | 792 (65.5%) |
Production, Transportation and Moving Occupations
The most common Production, Transportation and Moving occupations in Lebanon are Transportation (96 | 7.9%), Production (42 | 3.5%), and Material Moving (18 | 1.5%).
Production, Transportation and Moving Occupations by Sex
| Occupation | Male | Female |
| Production | 0 (0.0%) | 42 (100.0%) |
| Transportation | 36 (37.5%) | 60 (62.5%) |
| Material Moving | 18 (100.0%) | 0 (0.0%) |
| Total (Category) | 54 (34.6%) | 102 (65.4%) |
| Total (Overall) | 417 (34.5%) | 792 (65.5%) |
Employment Industries by Sex in Lebanon
Employment Industries in Lebanon
The major employment industries in Lebanon include Health Care & Social Assistance (262 | 21.7%), Accommodation & Food Services (237 | 19.6%), Educational Services (204 | 16.9%), Retail Trade (106 | 8.8%), and Manufacturing (82 | 6.8%).
Employment Industries by Sex in Lebanon
The Lebanon industries that see more men than women are Mining, Quarrying, & Extraction (100.0%), Construction (100.0%), and Transportation & Warehousing (100.0%), whereas the industries that tend to have a higher number of women are Health Care & Social Assistance (93.1%), Accommodation & Food Services (92.0%), and Professional & Scientific (80.4%).
| Industry | Male | Female |
| Agriculture, Fishing & Hunting | 0 (0.0%) | 0 (0.0%) |
| Mining, Quarrying, & Extraction | 51 (100.0%) | 0 (0.0%) |
| Construction | 22 (100.0%) | 0 (0.0%) |
| Manufacturing | 23 (28.1%) | 59 (72.0%) |
| Wholesale Trade | 0 (0.0%) | 0 (0.0%) |
| Retail Trade | 51 (48.1%) | 55 (51.9%) |
| Transportation & Warehousing | 28 (100.0%) | 0 (0.0%) |
| Utilities | 0 (0.0%) | 0 (0.0%) |
| Information | 13 (23.2%) | 43 (76.8%) |
| Finance & Insurance | 0 (0.0%) | 0 (0.0%) |
| Real Estate, Rental & Leasing | 0 (0.0%) | 0 (0.0%) |
| Professional & Scientific | 11 (19.6%) | 45 (80.4%) |
| Enterprise Management | 0 (0.0%) | 0 (0.0%) |
| Administrative & Support | 42 (100.0%) | 0 (0.0%) |
| Educational Services | 76 (37.2%) | 128 (62.7%) |
| Health Care & Social Assistance | 18 (6.9%) | 244 (93.1%) |
| Arts, Entertainment & Recreation | 0 (0.0%) | 0 (0.0%) |
| Accommodation & Food Services | 19 (8.0%) | 218 (92.0%) |
| Public Administration | 51 (100.0%) | 0 (0.0%) |
| Total | 417 (34.5%) | 792 (65.5%) |
Education in Lebanon
School Enrollment in Lebanon
The most common levels of schooling among the 448 students in Lebanon are middle school (275 | 61.4%), high school (104 | 23.2%), and elementary school (58 | 13.0%).
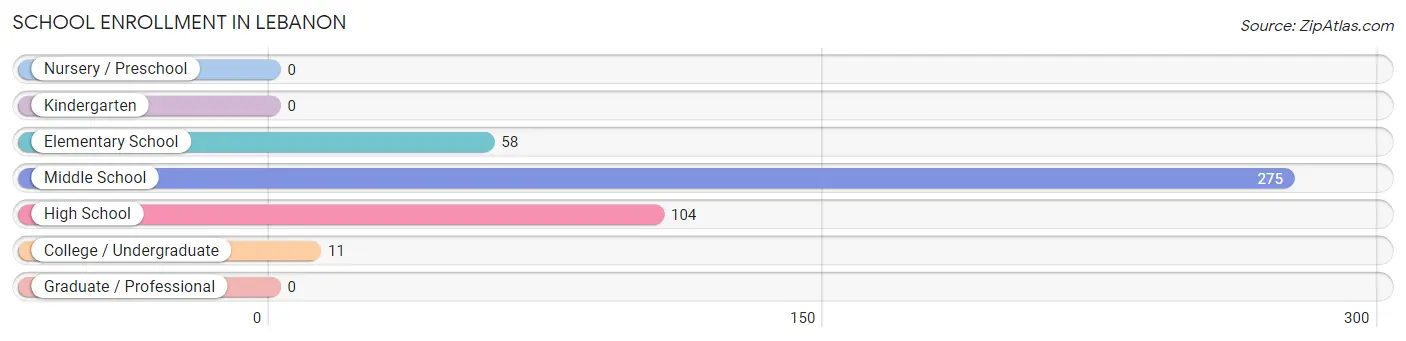
| School Level | # Students | % Students |
| Nursery / Preschool | 0 | 0.0% |
| Kindergarten | 0 | 0.0% |
| Elementary School | 58 | 13.0% |
| Middle School | 275 | 61.4% |
| High School | 104 | 23.2% |
| College / Undergraduate | 11 | 2.5% |
| Graduate / Professional | 0 | 0.0% |
| Total | 448 | 100.0% |
School Enrollment by Age by Funding Source in Lebanon
Out of a total of 448 students who are enrolled in schools in Lebanon, 157 (35.0%) attend a private institution, while the remaining 291 (65.0%) are enrolled in public schools. The age group of 15 to 17 year olds has the highest likelihood of being enrolled in private schools, with 44 (50.6% in the age bracket) enrolled. Conversely, the age group of 18 to 19 year olds has the lowest likelihood of being enrolled in a private school, with 17 (100.0% in the age bracket) attending a public institution.
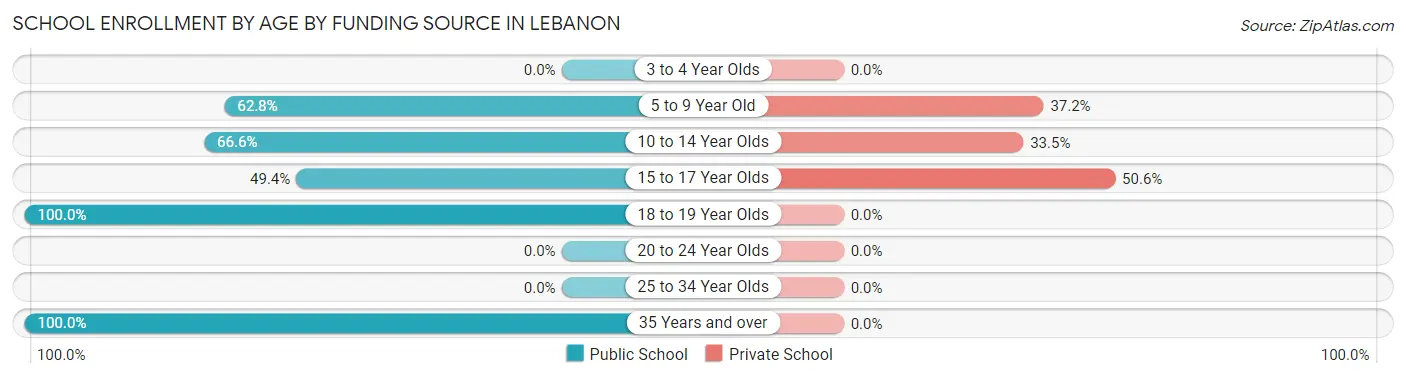
| Age Bracket | Public School | Private School |
| 3 to 4 Year Olds | 0 (0.0%) | 0 (0.0%) |
| 5 to 9 Year Old | 27 (62.8%) | 16 (37.2%) |
| 10 to 14 Year Olds | 193 (66.5%) | 97 (33.5%) |
| 15 to 17 Year Olds | 43 (49.4%) | 44 (50.6%) |
| 18 to 19 Year Olds | 17 (100.0%) | 0 (0.0%) |
| 20 to 24 Year Olds | 0 (0.0%) | 0 (0.0%) |
| 25 to 34 Year Olds | 0 (0.0%) | 0 (0.0%) |
| 35 Years and over | 11 (100.0%) | 0 (0.0%) |
| Total | 291 (65.0%) | 157 (35.0%) |
Educational Attainment by Field of Study in Lebanon
Science & technology (92 | 31.9%), education (82 | 28.5%), computers & mathematics (26 | 9.0%), business (24 | 8.3%), and liberal arts & history (15 | 5.2%) are the most common fields of study among 288 individuals in Lebanon who have obtained a bachelor's degree or higher.
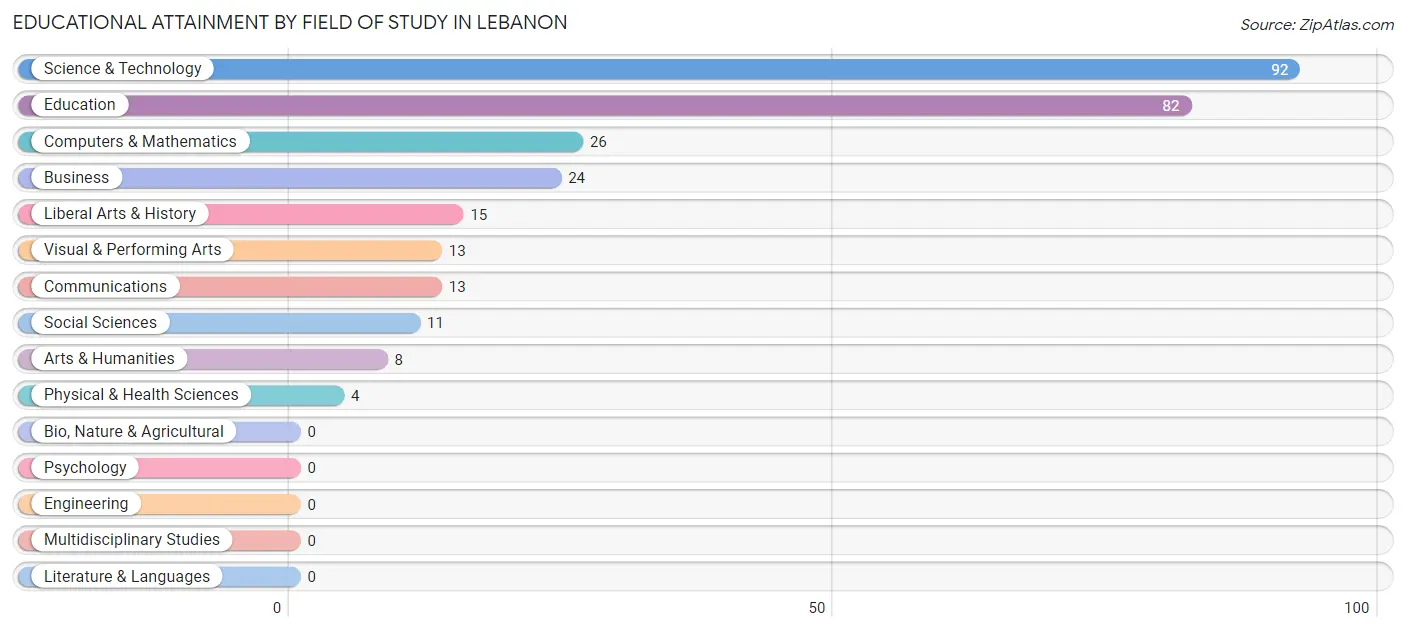
| Field of Study | # Graduates | % Graduates |
| Computers & Mathematics | 26 | 9.0% |
| Bio, Nature & Agricultural | 0 | 0.0% |
| Physical & Health Sciences | 4 | 1.4% |
| Psychology | 0 | 0.0% |
| Social Sciences | 11 | 3.8% |
| Engineering | 0 | 0.0% |
| Multidisciplinary Studies | 0 | 0.0% |
| Science & Technology | 92 | 31.9% |
| Business | 24 | 8.3% |
| Education | 82 | 28.5% |
| Literature & Languages | 0 | 0.0% |
| Liberal Arts & History | 15 | 5.2% |
| Visual & Performing Arts | 13 | 4.5% |
| Communications | 13 | 4.5% |
| Arts & Humanities | 8 | 2.8% |
| Total | 288 | 100.0% |
Transportation & Commute in Lebanon
Vehicle Availability by Sex in Lebanon
The most prevalent vehicle ownership categories in Lebanon are males with 2 vehicles (275, accounting for 65.9%) and females with 2 vehicles (436, making up 35.0%).
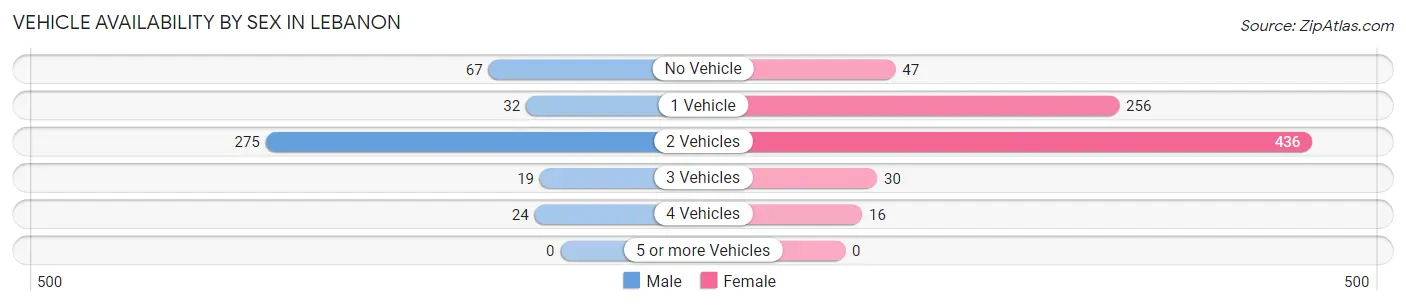
| Vehicles Available | Male | Female |
| No Vehicle | 67 (16.1%) | 47 (6.0%) |
| 1 Vehicle | 32 (7.7%) | 256 (32.6%) |
| 2 Vehicles | 275 (65.9%) | 436 (55.5%) |
| 3 Vehicles | 19 (4.6%) | 30 (3.8%) |
| 4 Vehicles | 24 (5.8%) | 16 (2.0%) |
| 5 or more Vehicles | 0 (0.0%) | 0 (0.0%) |
| Total | 417 (100.0%) | 785 (100.0%) |
Commute Time in Lebanon
The most frequently occuring commute durations in Lebanon are 5 to 9 minutes (423 commuters, 39.2%), 30 to 34 minutes (172 commuters, 15.9%), and 60 to 89 minutes (129 commuters, 11.9%).
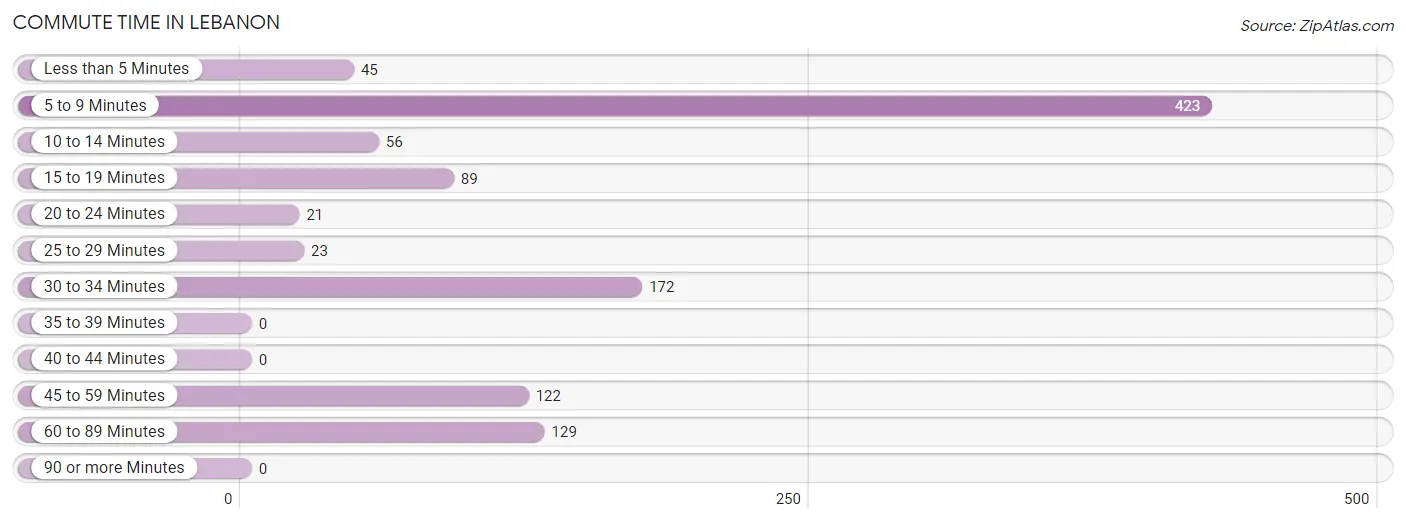
| Commute Time | # Commuters | % Commuters |
| Less than 5 Minutes | 45 | 4.2% |
| 5 to 9 Minutes | 423 | 39.2% |
| 10 to 14 Minutes | 56 | 5.2% |
| 15 to 19 Minutes | 89 | 8.2% |
| 20 to 24 Minutes | 21 | 1.9% |
| 25 to 29 Minutes | 23 | 2.1% |
| 30 to 34 Minutes | 172 | 15.9% |
| 35 to 39 Minutes | 0 | 0.0% |
| 40 to 44 Minutes | 0 | 0.0% |
| 45 to 59 Minutes | 122 | 11.3% |
| 60 to 89 Minutes | 129 | 11.9% |
| 90 or more Minutes | 0 | 0.0% |
Commute Time by Sex in Lebanon
The most common commute times in Lebanon are 5 to 9 minutes (103 commuters, 25.7%) for males and 5 to 9 minutes (320 commuters, 47.1%) for females.
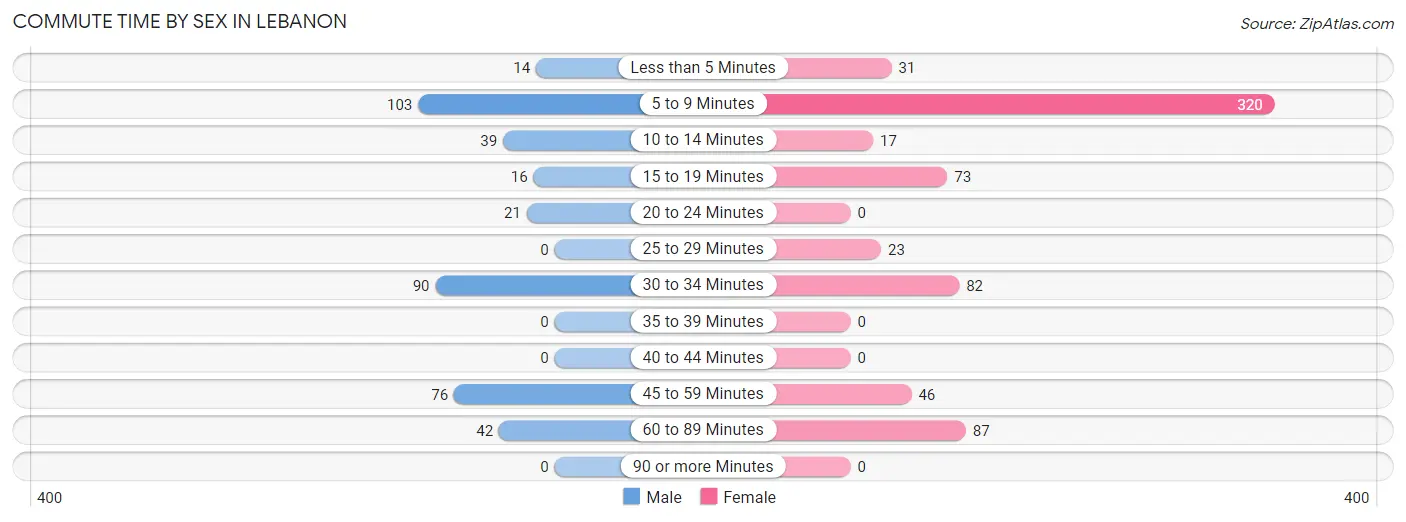
| Commute Time | Male | Female |
| Less than 5 Minutes | 14 (3.5%) | 31 (4.6%) |
| 5 to 9 Minutes | 103 (25.7%) | 320 (47.1%) |
| 10 to 14 Minutes | 39 (9.7%) | 17 (2.5%) |
| 15 to 19 Minutes | 16 (4.0%) | 73 (10.7%) |
| 20 to 24 Minutes | 21 (5.2%) | 0 (0.0%) |
| 25 to 29 Minutes | 0 (0.0%) | 23 (3.4%) |
| 30 to 34 Minutes | 90 (22.4%) | 82 (12.1%) |
| 35 to 39 Minutes | 0 (0.0%) | 0 (0.0%) |
| 40 to 44 Minutes | 0 (0.0%) | 0 (0.0%) |
| 45 to 59 Minutes | 76 (19.0%) | 46 (6.8%) |
| 60 to 89 Minutes | 42 (10.5%) | 87 (12.8%) |
| 90 or more Minutes | 0 (0.0%) | 0 (0.0%) |
Time of Departure to Work by Sex in Lebanon
The most frequent times of departure to work in Lebanon are 7:30 AM to 7:59 AM (131, 32.7%) for males and 7:30 AM to 7:59 AM (233, 34.3%) for females.
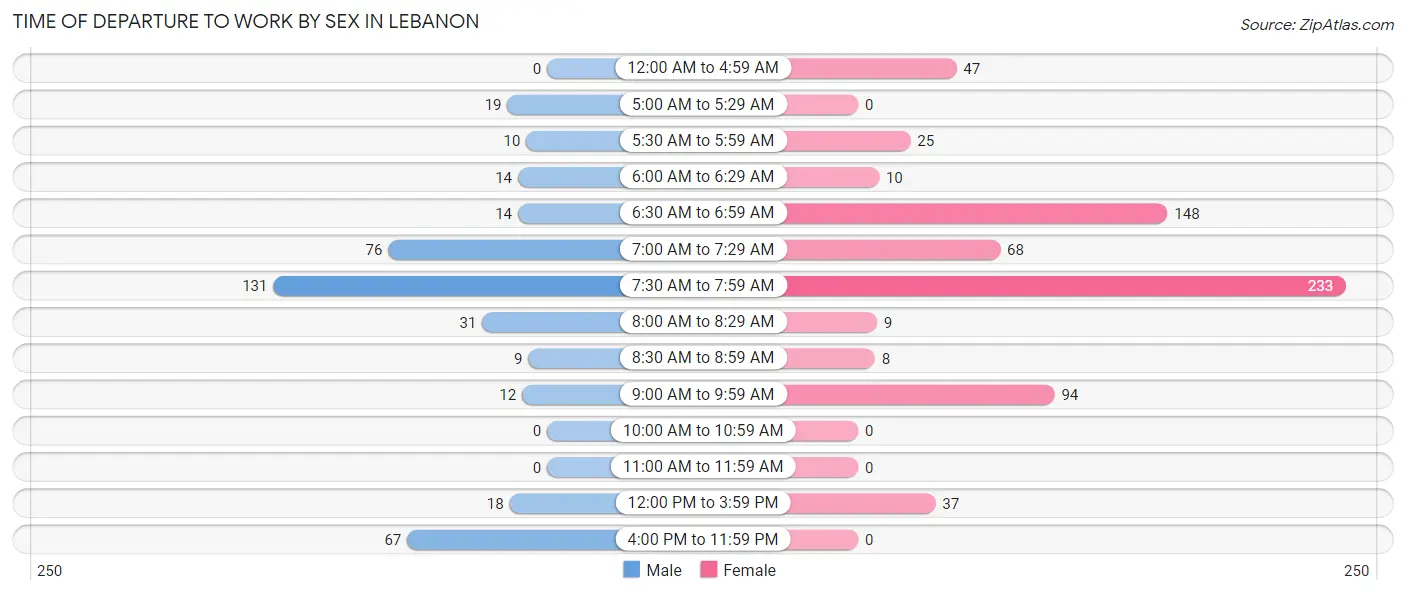
| Time of Departure | Male | Female |
| 12:00 AM to 4:59 AM | 0 (0.0%) | 47 (6.9%) |
| 5:00 AM to 5:29 AM | 19 (4.7%) | 0 (0.0%) |
| 5:30 AM to 5:59 AM | 10 (2.5%) | 25 (3.7%) |
| 6:00 AM to 6:29 AM | 14 (3.5%) | 10 (1.5%) |
| 6:30 AM to 6:59 AM | 14 (3.5%) | 148 (21.8%) |
| 7:00 AM to 7:29 AM | 76 (19.0%) | 68 (10.0%) |
| 7:30 AM to 7:59 AM | 131 (32.7%) | 233 (34.3%) |
| 8:00 AM to 8:29 AM | 31 (7.7%) | 9 (1.3%) |
| 8:30 AM to 8:59 AM | 9 (2.2%) | 8 (1.2%) |
| 9:00 AM to 9:59 AM | 12 (3.0%) | 94 (13.8%) |
| 10:00 AM to 10:59 AM | 0 (0.0%) | 0 (0.0%) |
| 11:00 AM to 11:59 AM | 0 (0.0%) | 0 (0.0%) |
| 12:00 PM to 3:59 PM | 18 (4.5%) | 37 (5.4%) |
| 4:00 PM to 11:59 PM | 67 (16.7%) | 0 (0.0%) |
| Total | 401 (100.0%) | 679 (100.0%) |
Housing Occupancy in Lebanon
Occupancy by Ownership in Lebanon
Of the total 1,276 dwellings in Lebanon, owner-occupied units account for 845 (66.2%), while renter-occupied units make up 431 (33.8%).
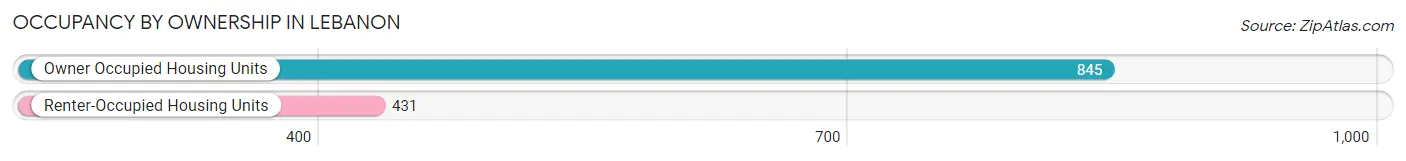
| Occupancy | # Housing Units | % Housing Units |
| Owner Occupied Housing Units | 845 | 66.2% |
| Renter-Occupied Housing Units | 431 | 33.8% |
| Total Occupied Housing Units | 1,276 | 100.0% |
Occupancy by Household Size in Lebanon
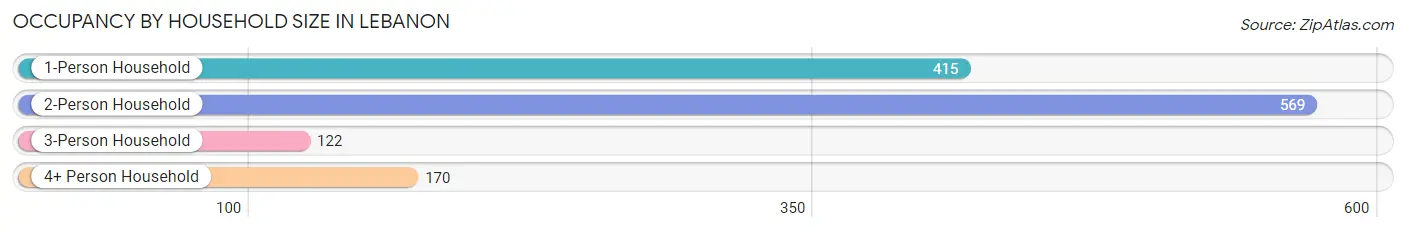
| Household Size | # Housing Units | % Housing Units |
| 1-Person Household | 415 | 32.5% |
| 2-Person Household | 569 | 44.6% |
| 3-Person Household | 122 | 9.6% |
| 4+ Person Household | 170 | 13.3% |
| Total Housing Units | 1,276 | 100.0% |
Occupancy by Ownership by Household Size in Lebanon
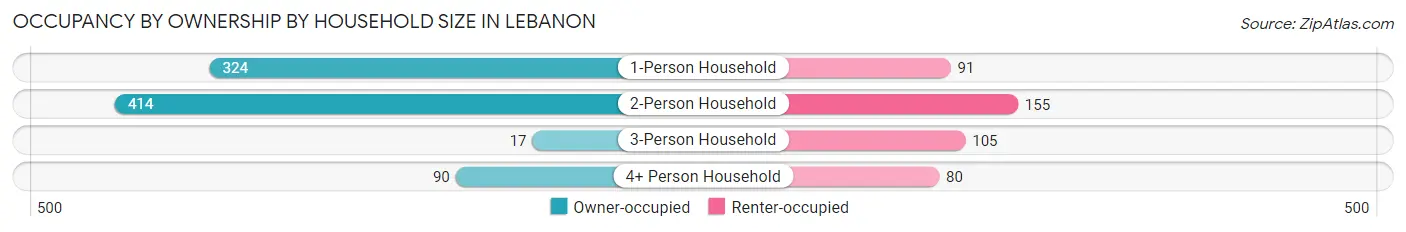
| Household Size | Owner-occupied | Renter-occupied |
| 1-Person Household | 324 (78.1%) | 91 (21.9%) |
| 2-Person Household | 414 (72.8%) | 155 (27.2%) |
| 3-Person Household | 17 (13.9%) | 105 (86.1%) |
| 4+ Person Household | 90 (52.9%) | 80 (47.1%) |
| Total Housing Units | 845 (66.2%) | 431 (33.8%) |
Occupancy by Educational Attainment in Lebanon
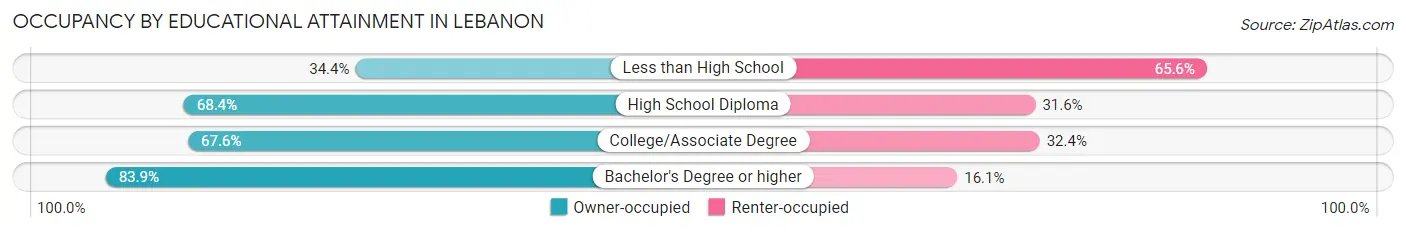
| Household Size | Owner-occupied | Renter-occupied |
| Less than High School | 62 (34.4%) | 118 (65.6%) |
| High School Diploma | 390 (68.4%) | 180 (31.6%) |
| College/Associate Degree | 200 (67.6%) | 96 (32.4%) |
| Bachelor's Degree or higher | 193 (83.9%) | 37 (16.1%) |
Occupancy by Age of Householder in Lebanon
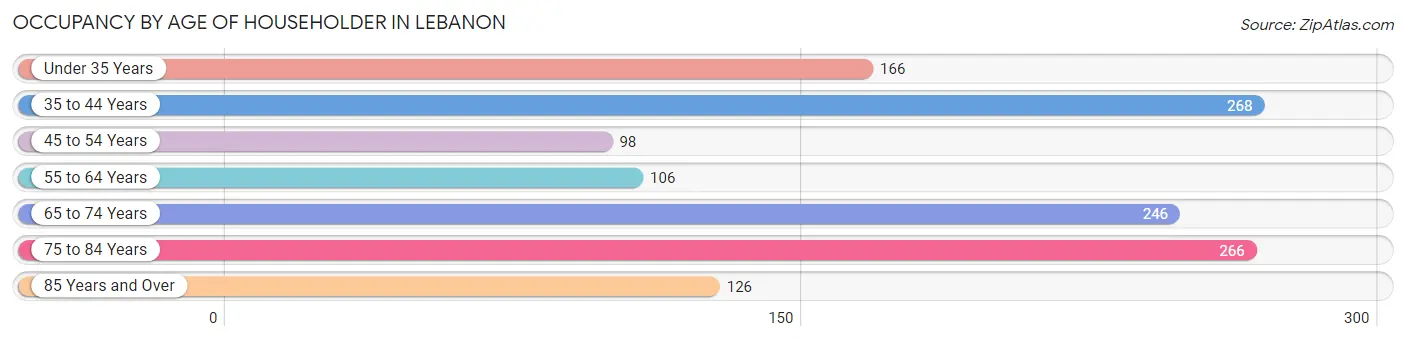
| Age Bracket | # Households | % Households |
| Under 35 Years | 166 | 13.0% |
| 35 to 44 Years | 268 | 21.0% |
| 45 to 54 Years | 98 | 7.7% |
| 55 to 64 Years | 106 | 8.3% |
| 65 to 74 Years | 246 | 19.3% |
| 75 to 84 Years | 266 | 20.8% |
| 85 Years and Over | 126 | 9.9% |
| Total | 1,276 | 100.0% |
Housing Finances in Lebanon
Median Income by Occupancy in Lebanon
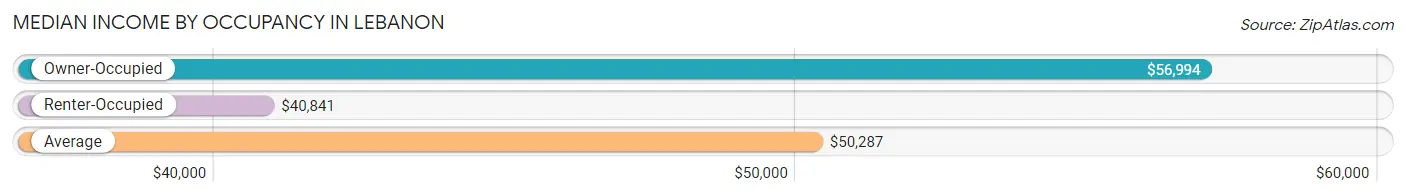
| Occupancy Type | # Households | Median Income |
| Owner-Occupied | 845 (66.2%) | $56,994 |
| Renter-Occupied | 431 (33.8%) | $40,841 |
| Average | 1,276 (100.0%) | $50,287 |
Occupancy by Householder Income Bracket in Lebanon
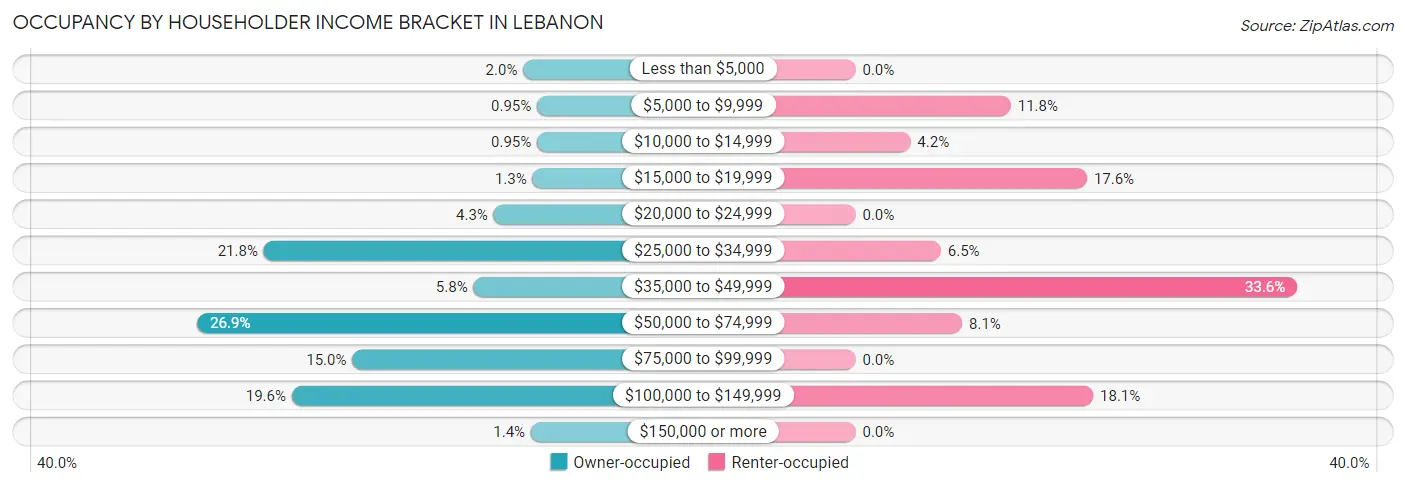
| Income Bracket | Owner-occupied | Renter-occupied |
| Less than $5,000 | 17 (2.0%) | 0 (0.0%) |
| $5,000 to $9,999 | 8 (0.9%) | 51 (11.8%) |
| $10,000 to $14,999 | 8 (0.9%) | 18 (4.2%) |
| $15,000 to $19,999 | 11 (1.3%) | 76 (17.6%) |
| $20,000 to $24,999 | 36 (4.3%) | 0 (0.0%) |
| $25,000 to $34,999 | 184 (21.8%) | 28 (6.5%) |
| $35,000 to $49,999 | 49 (5.8%) | 145 (33.6%) |
| $50,000 to $74,999 | 227 (26.9%) | 35 (8.1%) |
| $75,000 to $99,999 | 127 (15.0%) | 0 (0.0%) |
| $100,000 to $149,999 | 166 (19.6%) | 78 (18.1%) |
| $150,000 or more | 12 (1.4%) | 0 (0.0%) |
| Total | 845 (100.0%) | 431 (100.0%) |
Monthly Housing Cost Tiers in Lebanon
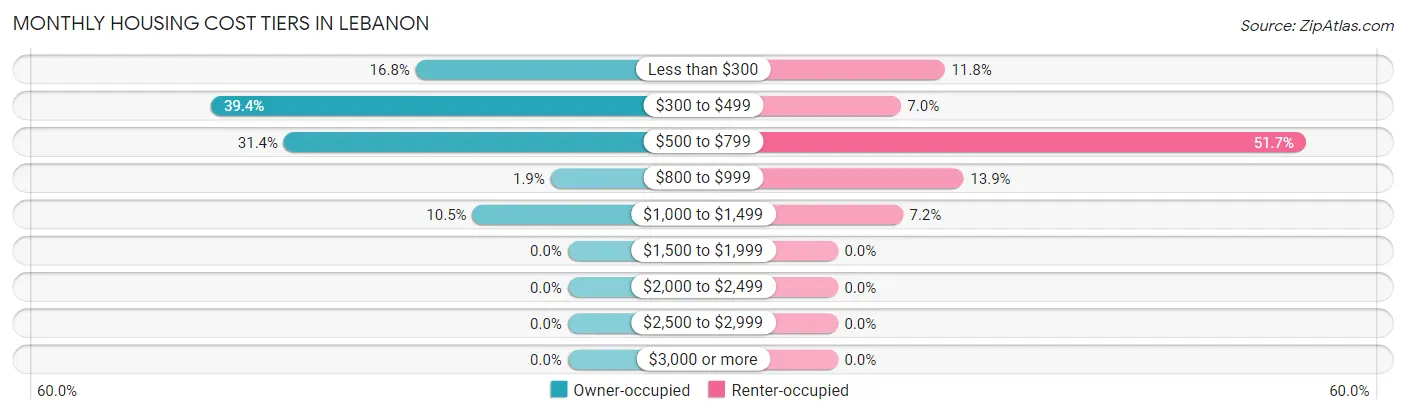
| Monthly Cost | Owner-occupied | Renter-occupied |
| Less than $300 | 142 (16.8%) | 51 (11.8%) |
| $300 to $499 | 333 (39.4%) | 30 (7.0%) |
| $500 to $799 | 265 (31.4%) | 223 (51.7%) |
| $800 to $999 | 16 (1.9%) | 60 (13.9%) |
| $1,000 to $1,499 | 89 (10.5%) | 31 (7.2%) |
| $1,500 to $1,999 | 0 (0.0%) | 0 (0.0%) |
| $2,000 to $2,499 | 0 (0.0%) | 0 (0.0%) |
| $2,500 to $2,999 | 0 (0.0%) | 0 (0.0%) |
| $3,000 or more | 0 (0.0%) | 0 (0.0%) |
| Total | 845 (100.0%) | 431 (100.0%) |
Physical Housing Characteristics in Lebanon
Housing Structures in Lebanon
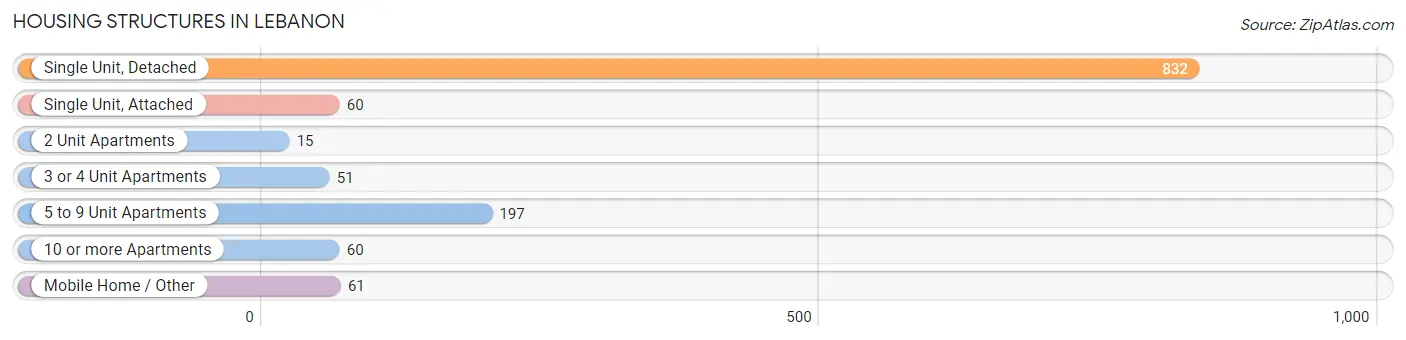
| Structure Type | # Housing Units | % Housing Units |
| Single Unit, Detached | 832 | 65.2% |
| Single Unit, Attached | 60 | 4.7% |
| 2 Unit Apartments | 15 | 1.2% |
| 3 or 4 Unit Apartments | 51 | 4.0% |
| 5 to 9 Unit Apartments | 197 | 15.4% |
| 10 or more Apartments | 60 | 4.7% |
| Mobile Home / Other | 61 | 4.8% |
| Total | 1,276 | 100.0% |
Housing Structures by Occupancy in Lebanon
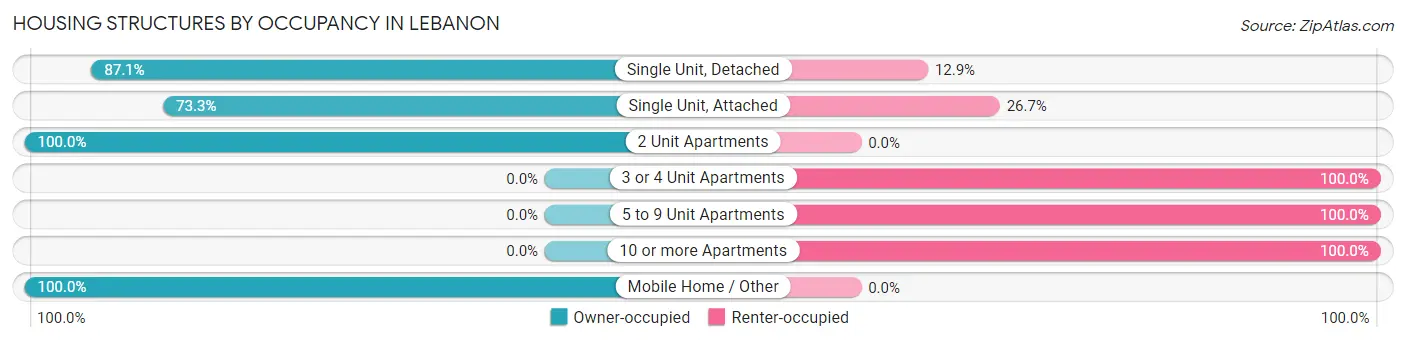
| Structure Type | Owner-occupied | Renter-occupied |
| Single Unit, Detached | 725 (87.1%) | 107 (12.9%) |
| Single Unit, Attached | 44 (73.3%) | 16 (26.7%) |
| 2 Unit Apartments | 15 (100.0%) | 0 (0.0%) |
| 3 or 4 Unit Apartments | 0 (0.0%) | 51 (100.0%) |
| 5 to 9 Unit Apartments | 0 (0.0%) | 197 (100.0%) |
| 10 or more Apartments | 0 (0.0%) | 60 (100.0%) |
| Mobile Home / Other | 61 (100.0%) | 0 (0.0%) |
| Total | 845 (66.2%) | 431 (33.8%) |
Housing Structures by Number of Rooms in Lebanon
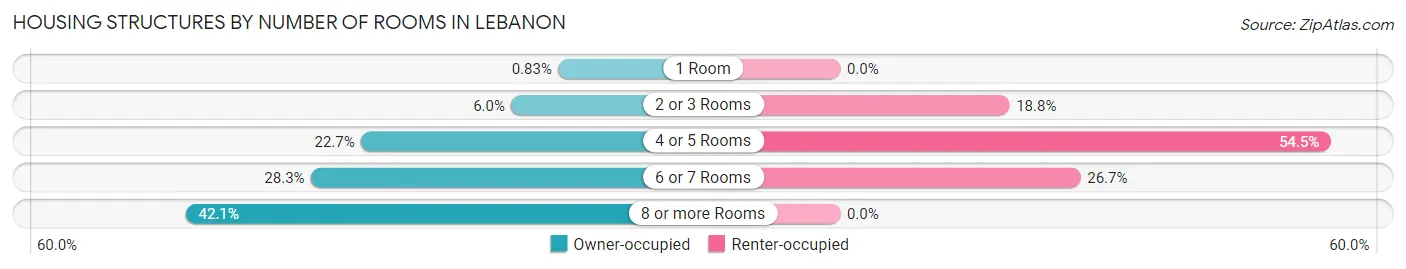
| Number of Rooms | Owner-occupied | Renter-occupied |
| 1 Room | 7 (0.8%) | 0 (0.0%) |
| 2 or 3 Rooms | 51 (6.0%) | 81 (18.8%) |
| 4 or 5 Rooms | 192 (22.7%) | 235 (54.5%) |
| 6 or 7 Rooms | 239 (28.3%) | 115 (26.7%) |
| 8 or more Rooms | 356 (42.1%) | 0 (0.0%) |
| Total | 845 (100.0%) | 431 (100.0%) |
Housing Structure by Heating Type in Lebanon
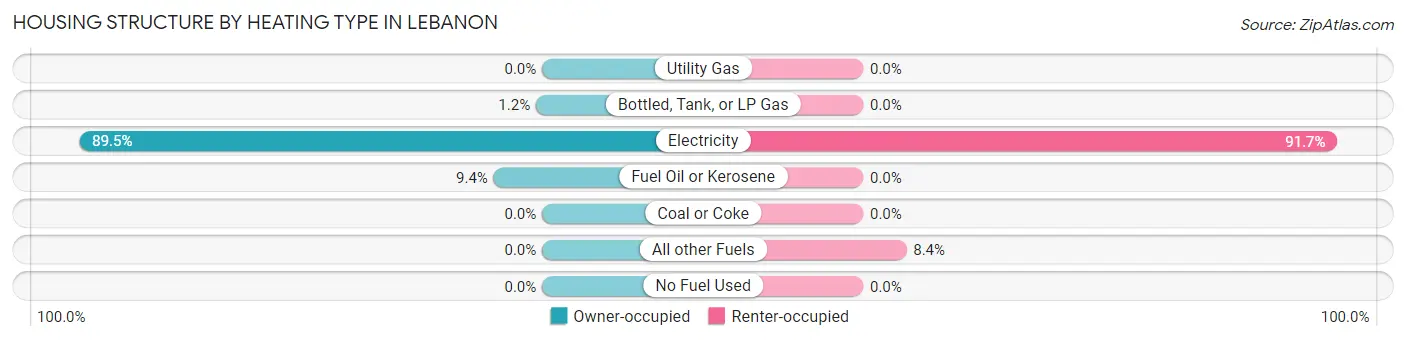
| Heating Type | Owner-occupied | Renter-occupied |
| Utility Gas | 0 (0.0%) | 0 (0.0%) |
| Bottled, Tank, or LP Gas | 10 (1.2%) | 0 (0.0%) |
| Electricity | 756 (89.5%) | 395 (91.6%) |
| Fuel Oil or Kerosene | 79 (9.3%) | 0 (0.0%) |
| Coal or Coke | 0 (0.0%) | 0 (0.0%) |
| All other Fuels | 0 (0.0%) | 36 (8.4%) |
| No Fuel Used | 0 (0.0%) | 0 (0.0%) |
| Total | 845 (100.0%) | 431 (100.0%) |
Household Vehicle Usage in Lebanon
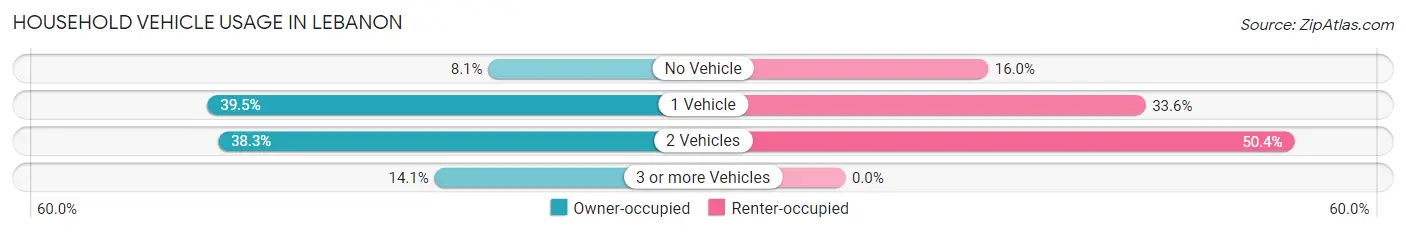
| Vehicles per Household | Owner-occupied | Renter-occupied |
| No Vehicle | 68 (8.1%) | 69 (16.0%) |
| 1 Vehicle | 334 (39.5%) | 145 (33.6%) |
| 2 Vehicles | 324 (38.3%) | 217 (50.3%) |
| 3 or more Vehicles | 119 (14.1%) | 0 (0.0%) |
| Total | 845 (100.0%) | 431 (100.0%) |
Real Estate & Mortgages in Lebanon
Real Estate and Mortgage Overview in Lebanon
| Characteristic | Without Mortgage | With Mortgage |
| Housing Units | 529 | 316 |
| Median Property Value | $157,000 | $98,900 |
| Median Household Income | $50,471 | $5 |
| Monthly Housing Costs | $370 | $0 |
| Real Estate Taxes | $827 | $52 |
Property Value by Mortgage Status in Lebanon
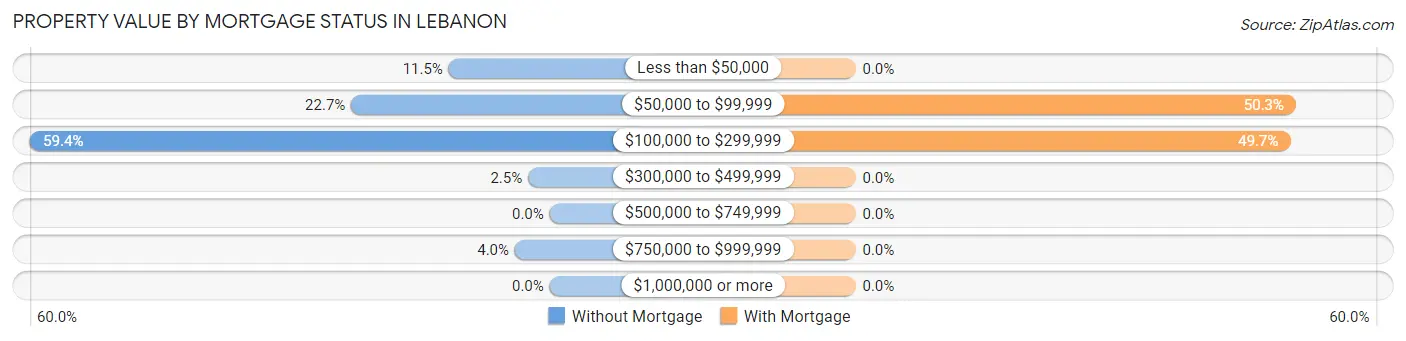
| Property Value | Without Mortgage | With Mortgage |
| Less than $50,000 | 61 (11.5%) | 0 (0.0%) |
| $50,000 to $99,999 | 120 (22.7%) | 159 (50.3%) |
| $100,000 to $299,999 | 314 (59.4%) | 157 (49.7%) |
| $300,000 to $499,999 | 13 (2.5%) | 0 (0.0%) |
| $500,000 to $749,999 | 0 (0.0%) | 0 (0.0%) |
| $750,000 to $999,999 | 21 (4.0%) | 0 (0.0%) |
| $1,000,000 or more | 0 (0.0%) | 0 (0.0%) |
| Total | 529 (100.0%) | 316 (100.0%) |
Household Income by Mortgage Status in Lebanon
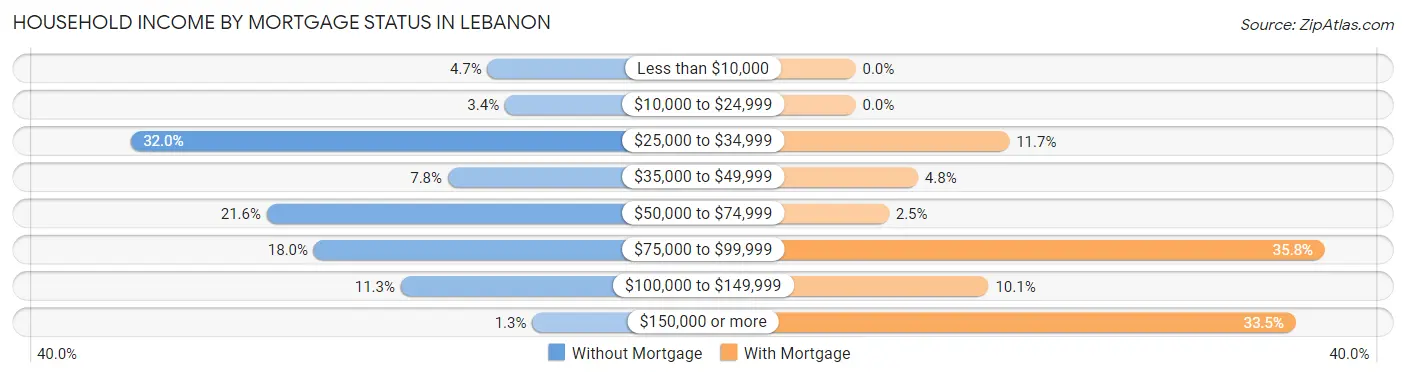
| Household Income | Without Mortgage | With Mortgage |
| Less than $10,000 | 25 (4.7%) | 0 (0.0%) |
| $10,000 to $24,999 | 18 (3.4%) | 0 (0.0%) |
| $25,000 to $34,999 | 169 (32.0%) | 37 (11.7%) |
| $35,000 to $49,999 | 41 (7.7%) | 15 (4.8%) |
| $50,000 to $74,999 | 114 (21.5%) | 8 (2.5%) |
| $75,000 to $99,999 | 95 (18.0%) | 113 (35.8%) |
| $100,000 to $149,999 | 60 (11.3%) | 32 (10.1%) |
| $150,000 or more | 7 (1.3%) | 106 (33.5%) |
| Total | 529 (100.0%) | 316 (100.0%) |
Property Value to Household Income Ratio in Lebanon
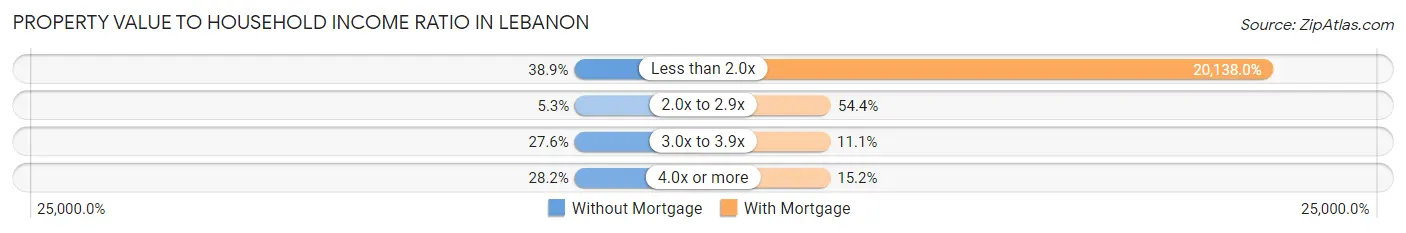
| Value-to-Income Ratio | Without Mortgage | With Mortgage |
| Less than 2.0x | 206 (38.9%) | 63,636 (20,138.0%) |
| 2.0x to 2.9x | 28 (5.3%) | 172 (54.4%) |
| 3.0x to 3.9x | 146 (27.6%) | 35 (11.1%) |
| 4.0x or more | 149 (28.2%) | 48 (15.2%) |
| Total | 529 (100.0%) | 316 (100.0%) |
Real Estate Taxes by Mortgage Status in Lebanon
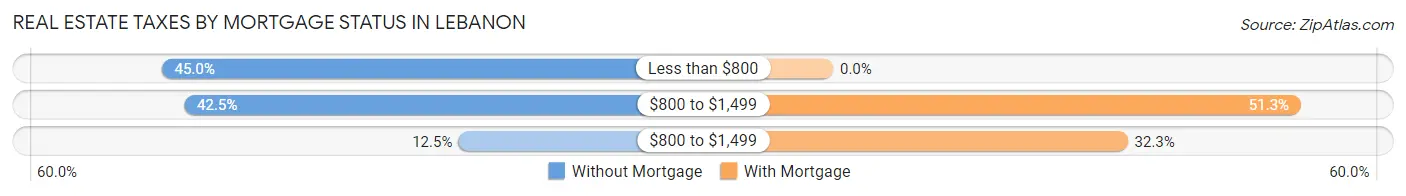
| Property Taxes | Without Mortgage | With Mortgage |
| Less than $800 | 238 (45.0%) | 0 (0.0%) |
| $800 to $1,499 | 225 (42.5%) | 162 (51.3%) |
| $800 to $1,499 | 66 (12.5%) | 102 (32.3%) |
| Total | 529 (100.0%) | 316 (100.0%) |
Health & Disability in Lebanon
Health Insurance Coverage by Age in Lebanon
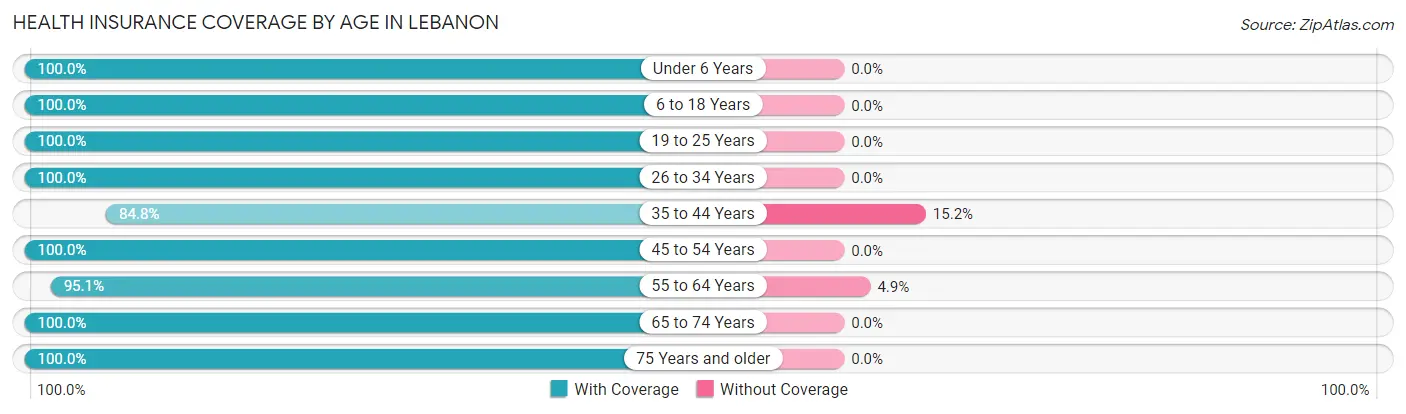
| Age Bracket | With Coverage | Without Coverage |
| Under 6 Years | 48 (100.0%) | 0 (0.0%) |
| 6 to 18 Years | 484 (100.0%) | 0 (0.0%) |
| 19 to 25 Years | 203 (100.0%) | 0 (0.0%) |
| 26 to 34 Years | 312 (100.0%) | 0 (0.0%) |
| 35 to 44 Years | 429 (84.8%) | 77 (15.2%) |
| 45 to 54 Years | 330 (100.0%) | 0 (0.0%) |
| 55 to 64 Years | 195 (95.1%) | 10 (4.9%) |
| 65 to 74 Years | 418 (100.0%) | 0 (0.0%) |
| 75 Years and older | 521 (100.0%) | 0 (0.0%) |
| Total | 2,940 (97.1%) | 87 (2.9%) |
Health Insurance Coverage by Citizenship Status in Lebanon
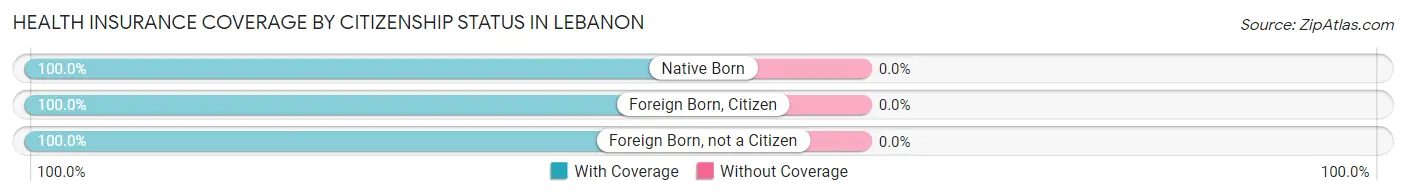
| Citizenship Status | With Coverage | Without Coverage |
| Native Born | 48 (100.0%) | 0 (0.0%) |
| Foreign Born, Citizen | 484 (100.0%) | 0 (0.0%) |
| Foreign Born, not a Citizen | 203 (100.0%) | 0 (0.0%) |
Health Insurance Coverage by Household Income in Lebanon
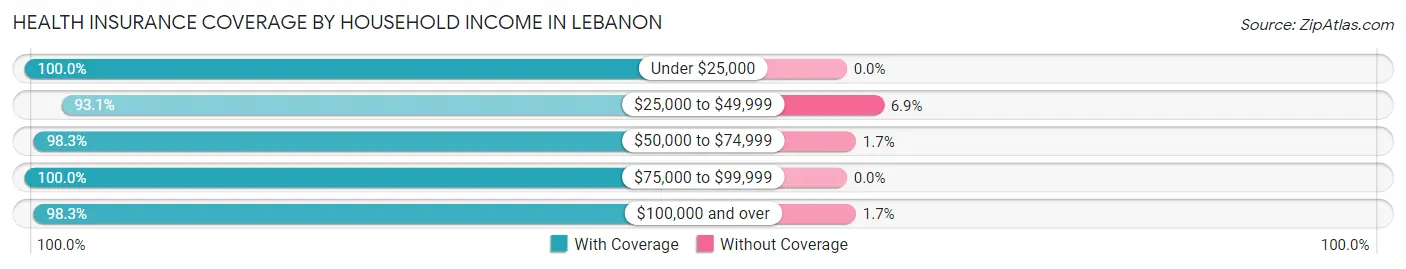
| Household Income | With Coverage | Without Coverage |
| Under $25,000 | 479 (100.0%) | 0 (0.0%) |
| $25,000 to $49,999 | 875 (93.1%) | 65 (6.9%) |
| $50,000 to $74,999 | 574 (98.3%) | 10 (1.7%) |
| $75,000 to $99,999 | 290 (100.0%) | 0 (0.0%) |
| $100,000 and over | 694 (98.3%) | 12 (1.7%) |
Public vs Private Health Insurance Coverage by Age in Lebanon
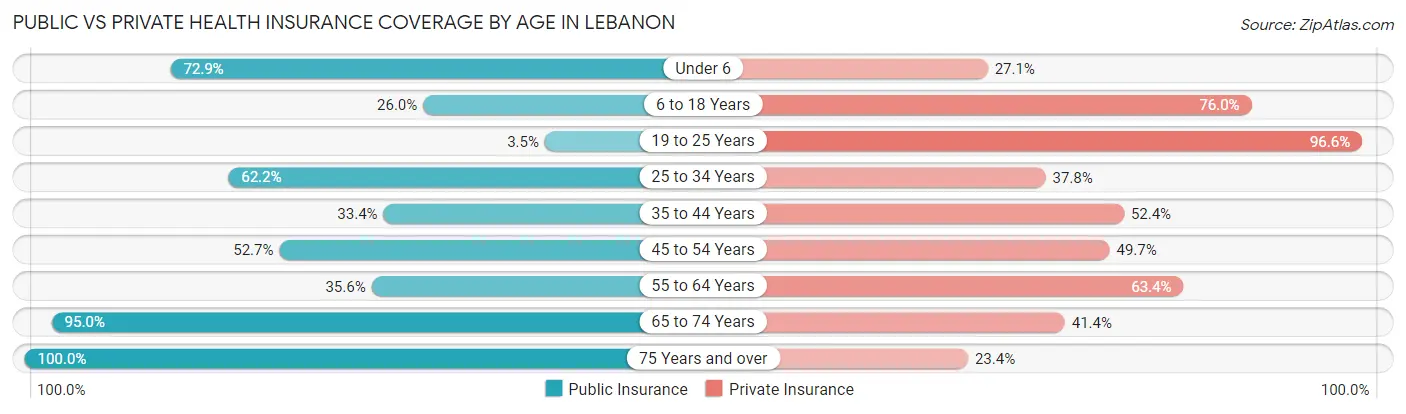
| Age Bracket | Public Insurance | Private Insurance |
| Under 6 | 35 (72.9%) | 13 (27.1%) |
| 6 to 18 Years | 126 (26.0%) | 368 (76.0%) |
| 19 to 25 Years | 7 (3.5%) | 196 (96.6%) |
| 25 to 34 Years | 194 (62.2%) | 118 (37.8%) |
| 35 to 44 Years | 169 (33.4%) | 265 (52.4%) |
| 45 to 54 Years | 174 (52.7%) | 164 (49.7%) |
| 55 to 64 Years | 73 (35.6%) | 130 (63.4%) |
| 65 to 74 Years | 397 (95.0%) | 173 (41.4%) |
| 75 Years and over | 521 (100.0%) | 122 (23.4%) |
| Total | 1,696 (56.0%) | 1,549 (51.2%) |
Disability Status by Sex by Age in Lebanon
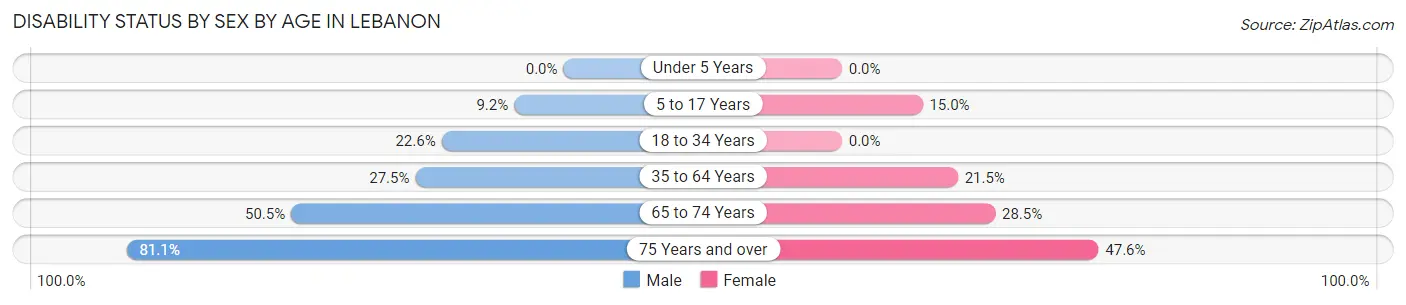
| Age Bracket | Male | Female |
| Under 5 Years | 0 (0.0%) | 0 (0.0%) |
| 5 to 17 Years | 14 (9.1%) | 47 (15.0%) |
| 18 to 34 Years | 57 (22.6%) | 0 (0.0%) |
| 35 to 64 Years | 97 (27.5%) | 148 (21.5%) |
| 65 to 74 Years | 94 (50.5%) | 66 (28.4%) |
| 75 Years and over | 150 (81.1%) | 160 (47.6%) |
Disability Class by Sex by Age in Lebanon
Disability Class: Hearing Difficulty
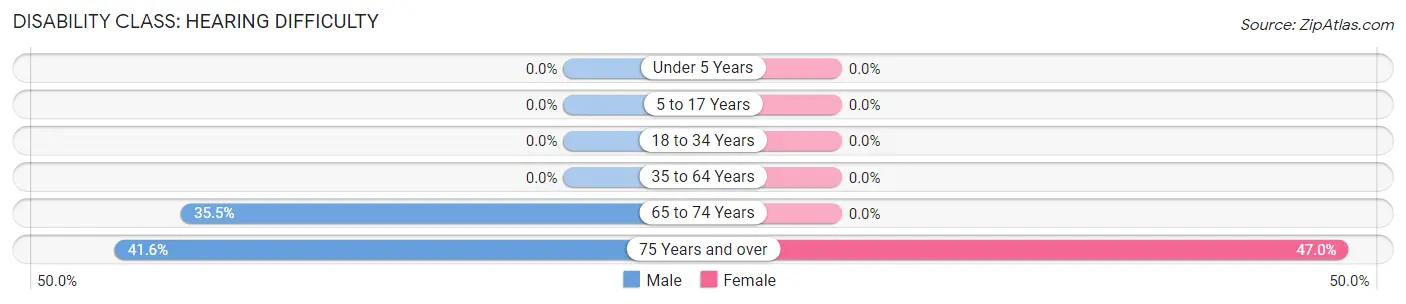
| Age Bracket | Male | Female |
| Under 5 Years | 0 (0.0%) | 0 (0.0%) |
| 5 to 17 Years | 0 (0.0%) | 0 (0.0%) |
| 18 to 34 Years | 0 (0.0%) | 0 (0.0%) |
| 35 to 64 Years | 0 (0.0%) | 0 (0.0%) |
| 65 to 74 Years | 66 (35.5%) | 0 (0.0%) |
| 75 Years and over | 77 (41.6%) | 158 (47.0%) |
Disability Class: Vision Difficulty
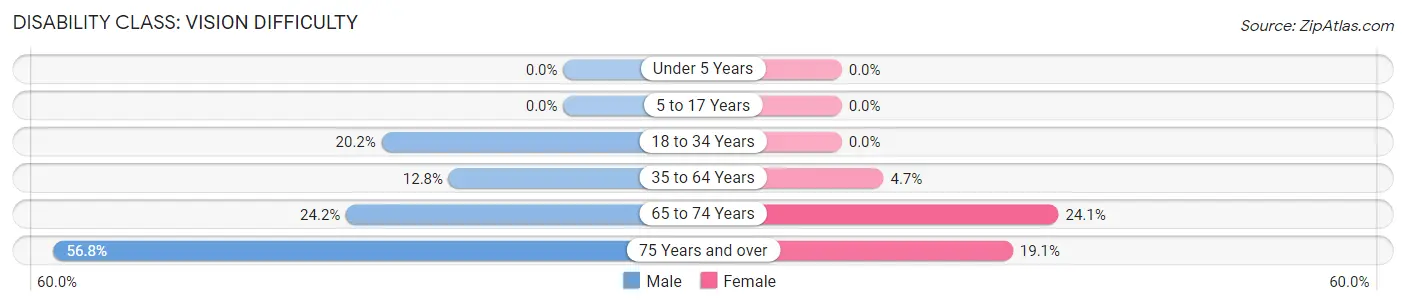
| Age Bracket | Male | Female |
| Under 5 Years | 0 (0.0%) | 0 (0.0%) |
| 5 to 17 Years | 0 (0.0%) | 0 (0.0%) |
| 18 to 34 Years | 51 (20.2%) | 0 (0.0%) |
| 35 to 64 Years | 45 (12.8%) | 32 (4.6%) |
| 65 to 74 Years | 45 (24.2%) | 56 (24.1%) |
| 75 Years and over | 105 (56.8%) | 64 (19.1%) |
Disability Class: Cognitive Difficulty
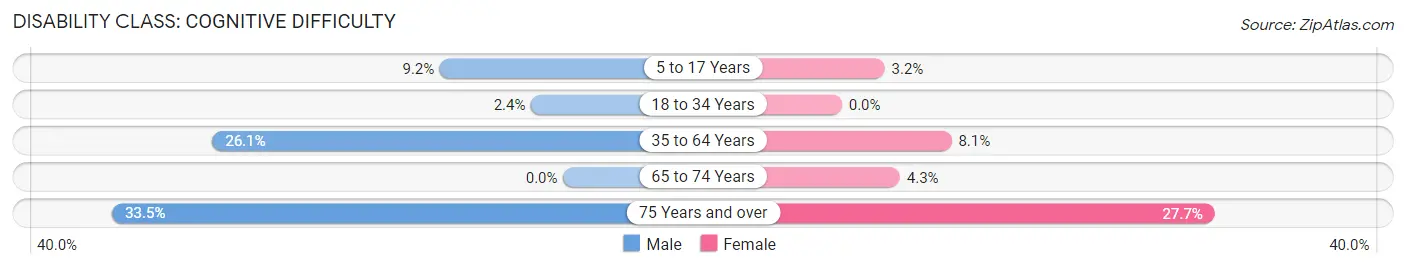
| Age Bracket | Male | Female |
| 5 to 17 Years | 14 (9.1%) | 10 (3.2%) |
| 18 to 34 Years | 6 (2.4%) | 0 (0.0%) |
| 35 to 64 Years | 92 (26.1%) | 56 (8.1%) |
| 65 to 74 Years | 0 (0.0%) | 10 (4.3%) |
| 75 Years and over | 62 (33.5%) | 93 (27.7%) |
Disability Class: Ambulatory Difficulty
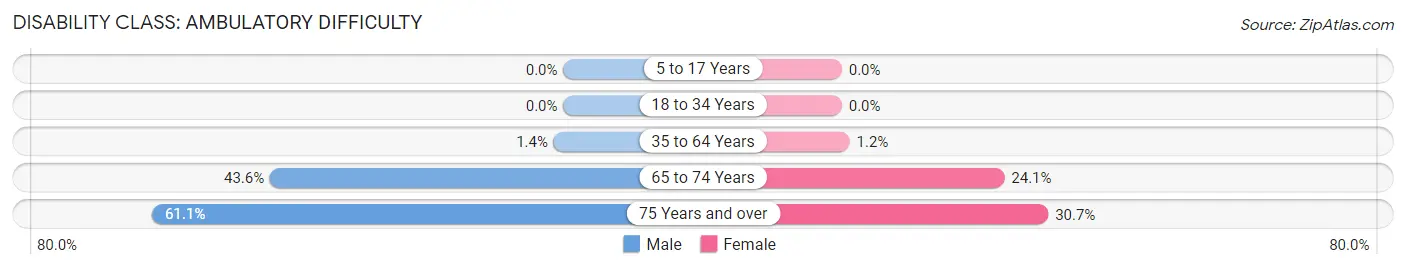
| Age Bracket | Male | Female |
| 5 to 17 Years | 0 (0.0%) | 0 (0.0%) |
| 18 to 34 Years | 0 (0.0%) | 0 (0.0%) |
| 35 to 64 Years | 5 (1.4%) | 8 (1.2%) |
| 65 to 74 Years | 81 (43.5%) | 56 (24.1%) |
| 75 Years and over | 113 (61.1%) | 103 (30.6%) |
Disability Class: Self-Care Difficulty
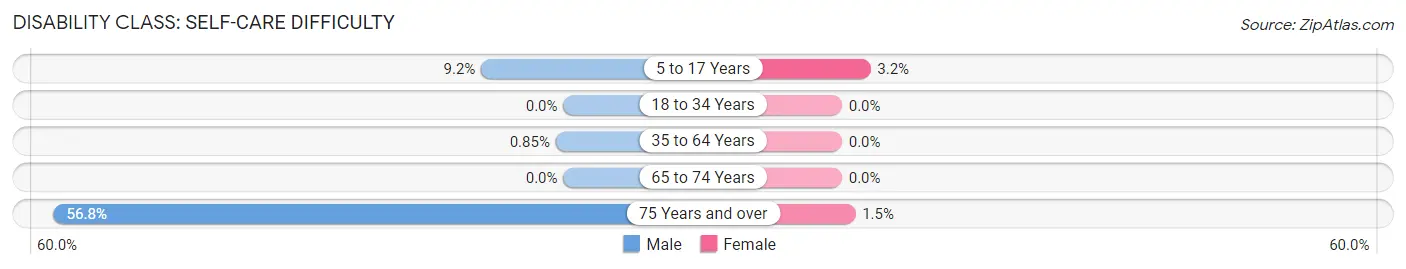
| Age Bracket | Male | Female |
| 5 to 17 Years | 14 (9.1%) | 10 (3.2%) |
| 18 to 34 Years | 0 (0.0%) | 0 (0.0%) |
| 35 to 64 Years | 3 (0.9%) | 0 (0.0%) |
| 65 to 74 Years | 0 (0.0%) | 0 (0.0%) |
| 75 Years and over | 105 (56.8%) | 5 (1.5%) |
Technology Access in Lebanon
Computing Device Access in Lebanon
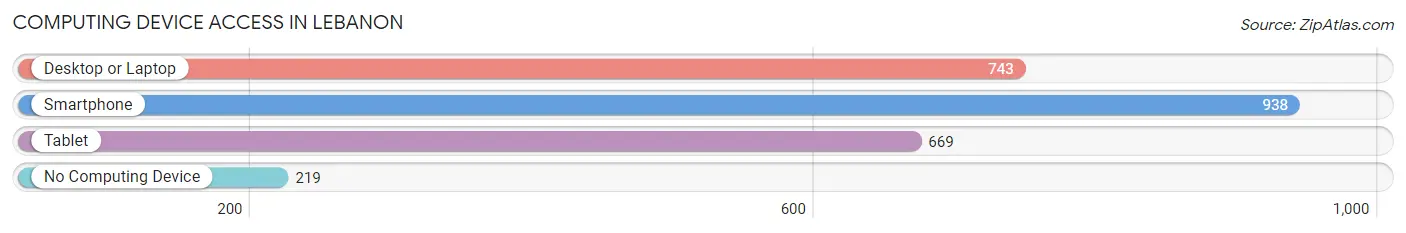
| Device Type | # Households | % Households |
| Desktop or Laptop | 743 | 58.2% |
| Smartphone | 938 | 73.5% |
| Tablet | 669 | 52.4% |
| No Computing Device | 219 | 17.2% |
| Total | 1,276 | 100.0% |
Internet Access in Lebanon
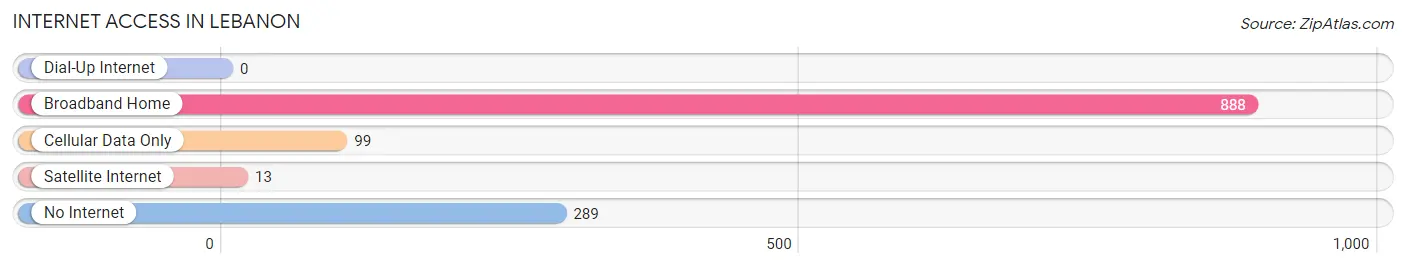
| Internet Type | # Households | % Households |
| Dial-Up Internet | 0 | 0.0% |
| Broadband Home | 888 | 69.6% |
| Cellular Data Only | 99 | 7.8% |
| Satellite Internet | 13 | 1.0% |
| No Internet | 289 | 22.7% |
| Total | 1,276 | 100.0% |
Lebanon Summary
Lebanon, Virginia is a small town located in Russell County, Virginia. It is situated in the Appalachian Mountains and is part of the Appalachian Regional Commission. The town has a population of approximately 1,500 people and is located in the heart of the Appalachian Mountains.
History
Lebanon was first settled in 1790 by a group of settlers from North Carolina. The town was named after the biblical city of Lebanon, which was located in present-day Lebanon. The town was incorporated in 1820 and was the first town in Russell County. The town was a major stop on the Great Road, which was a major route for settlers heading west.
The town was a major center for the production of tobacco and other agricultural products. The town was also a major stop on the Norfolk and Western Railroad. The railroad brought many new settlers to the area and helped to spur economic growth.
The town was also home to a number of Civil War battles. The Battle of Lebanon was fought in 1862 and resulted in a Confederate victory. The town was also the site of the Battle of Clinch Mountain in 1864, which resulted in a Union victory.
Geography
Lebanon is located in the Appalachian Mountains in Russell County, Virginia. The town is situated at an elevation of 1,400 feet and is surrounded by the Clinch Mountain Range. The town is located near the Clinch River and is approximately 30 miles from the city of Bristol, Virginia.
The town is located in a temperate climate and experiences four distinct seasons. Summers are typically hot and humid, while winters are cold and snowy. The town receives an average of 40 inches of precipitation per year.
Economy
Lebanon’s economy is largely based on agriculture and tourism. The town is home to a number of farms that produce tobacco, corn, hay, and other crops. The town is also home to a number of small businesses, including restaurants, shops, and other services.
The town is also home to a number of tourist attractions, including the Clinch Mountain Wildlife Management Area, the Russell County Historical Society, and the Russell County Museum. The town is also home to a number of festivals and events, including the Clinch Mountain Music Festival and the Russell County Fair.
Demographics
As of the 2010 census, the population of Lebanon was 1,500. The town is predominantly white, with approximately 95% of the population being white. The town also has a small African American population, with approximately 4% of the population being African American. The town also has a small Hispanic population, with approximately 1% of the population being Hispanic.
The median household income in Lebanon is approximately $30,000, which is lower than the national average. The town also has a higher poverty rate than the national average, with approximately 20% of the population living below the poverty line.
Conclusion
Lebanon, Virginia is a small town located in Russell County, Virginia. The town has a population of approximately 1,500 people and is located in the heart of the Appalachian Mountains. The town has a long history and is home to a number of tourist attractions and festivals. The town’s economy is largely based on agriculture and tourism, and the town has a higher poverty rate than the national average.
Common Questions
What is the Total Population of Lebanon?
Total Population of Lebanon is 3,139.
What is the Total Male Population of Lebanon?
Total Male Population of Lebanon is 1,194.
What is the Total Female Population of Lebanon?
Total Female Population of Lebanon is 1,945.
What is the Ratio of Males per 100 Females in Lebanon?
There are 61.39 Males per 100 Females in Lebanon.
What is the Ratio of Females per 100 Males in Lebanon?
There are 162.90 Females per 100 Males in Lebanon.
What is the Median Population Age in Lebanon?
Median Population Age in Lebanon is 44.7 Years.
What is the Average Family Size in Lebanon
Average Family Size in Lebanon is 2.9 People.
What is the Average Household Size in Lebanon
Average Household Size in Lebanon is 2.4 People.
What is Per Capita Income in Lebanon?
Per Capita income in Lebanon is $26,395.
What is the Median Family Income in Lebanon?
Median Family Income in Lebanon is $62,727.
What is the Median Household income in Lebanon?
Median Household Income in Lebanon is $50,287.
What is Income or Wage Gap in Lebanon?
Income or Wage Gap in Lebanon is 24.2%.
Women in Lebanon earn 75.8 cents for every dollar earned by a man.
What is Inequality or Gini Index in Lebanon?
Inequality or Gini Index in Lebanon is 0.37.
How Large is the Labor Force in Lebanon?
There are 1,208 People in the Labor Forcein in Lebanon.
What is the Percentage of People in the Labor Force in Lebanon?
44.6% of People are in the Labor Force in Lebanon.