Tellico Village, TN
Tellico Village Map
Tellico Village Overview
6,224
TOTAL POPULATION
3,235
MALE POPULATION
2,989
FEMALE POPULATION
108.23
MALES / 100 FEMALES
92.40
FEMALES / 100 MALES
71.4
MEDIAN AGE
2.2
AVG FAMILY SIZE
1.9
AVG HOUSEHOLD SIZE
$64,527
PER CAPITA INCOME
$107,349
AVG FAMILY INCOME
$95,038
AVG HOUSEHOLD INCOME
49.1%
WAGE / INCOME GAP [ % ]
50.9¢/ $1
WAGE / INCOME GAP [ $ ]
0.40
INEQUALITY / GINI INDEX
1,013
LABOR FORCE [ PEOPLE ]
16.7%
PERCENT IN LABOR FORCE
2.0%
UNEMPLOYMENT RATE
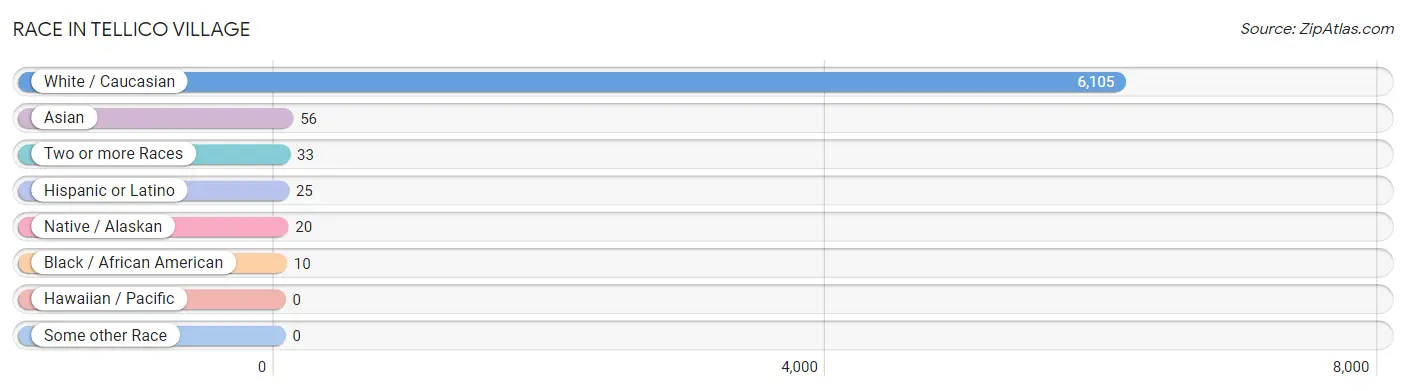
Race in Tellico Village
The most populous races in Tellico Village are White / Caucasian (6,105 | 98.1%), Asian (56 | 0.9%), and Two or more Races (33 | 0.5%).
| Race | # Population | % Population |
| Asian | 56 | 0.9% |
| Black / African American | 10 | 0.2% |
| Hawaiian / Pacific | 0 | 0.0% |
| Hispanic or Latino | 25 | 0.4% |
| Native / Alaskan | 20 | 0.3% |
| White / Caucasian | 6,105 | 98.1% |
| Two or more Races | 33 | 0.5% |
| Some other Race | 0 | 0.0% |
| Total | 6,224 | 100.0% |
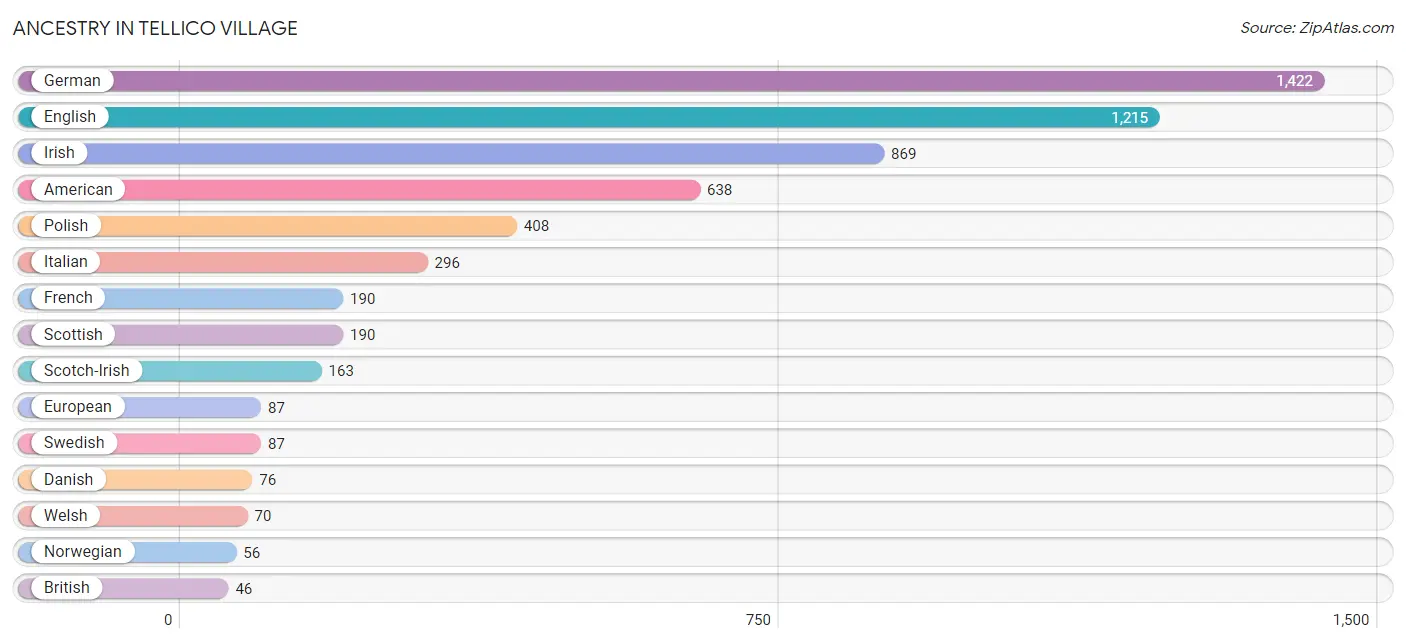
Ancestry in Tellico Village
The most populous ancestries reported in Tellico Village are German (1,422 | 22.9%), English (1,215 | 19.5%), Irish (869 | 14.0%), American (638 | 10.2%), and Polish (408 | 6.6%), together accounting for 73.1% of all Tellico Village residents.
| Ancestry | # Population | % Population |
| American | 638 | 10.2% |
| Arab | 28 | 0.4% |
| Austrian | 20 | 0.3% |
| Belgian | 22 | 0.4% |
| British | 46 | 0.7% |
| Burmese | 29 | 0.5% |
| Chickasaw | 11 | 0.2% |
| Cuban | 25 | 0.4% |
| Czech | 11 | 0.2% |
| Czechoslovakian | 38 | 0.6% |
| Danish | 76 | 1.2% |
| Dutch | 45 | 0.7% |
| English | 1,215 | 19.5% |
| European | 87 | 1.4% |
| Finnish | 15 | 0.2% |
| French | 190 | 3.0% |
| French Canadian | 28 | 0.4% |
| German | 1,422 | 22.9% |
| Greek | 25 | 0.4% |
| Hungarian | 26 | 0.4% |
| Indian (Asian) | 27 | 0.4% |
| Irish | 869 | 14.0% |
| Italian | 296 | 4.8% |
| Lebanese | 28 | 0.4% |
| Lithuanian | 16 | 0.3% |
| Macedonian | 13 | 0.2% |
| Navajo | 20 | 0.3% |
| Norwegian | 56 | 0.9% |
| Polish | 408 | 6.6% |
| Portuguese | 10 | 0.2% |
| Russian | 17 | 0.3% |
| Scandinavian | 32 | 0.5% |
| Scotch-Irish | 163 | 2.6% |
| Scottish | 190 | 3.0% |
| Slavic | 25 | 0.4% |
| Slovak | 6 | 0.1% |
| Swedish | 87 | 1.4% |
| Swiss | 22 | 0.4% |
| Ukrainian | 36 | 0.6% |
| Welsh | 70 | 1.1% | View All 40 Rows |
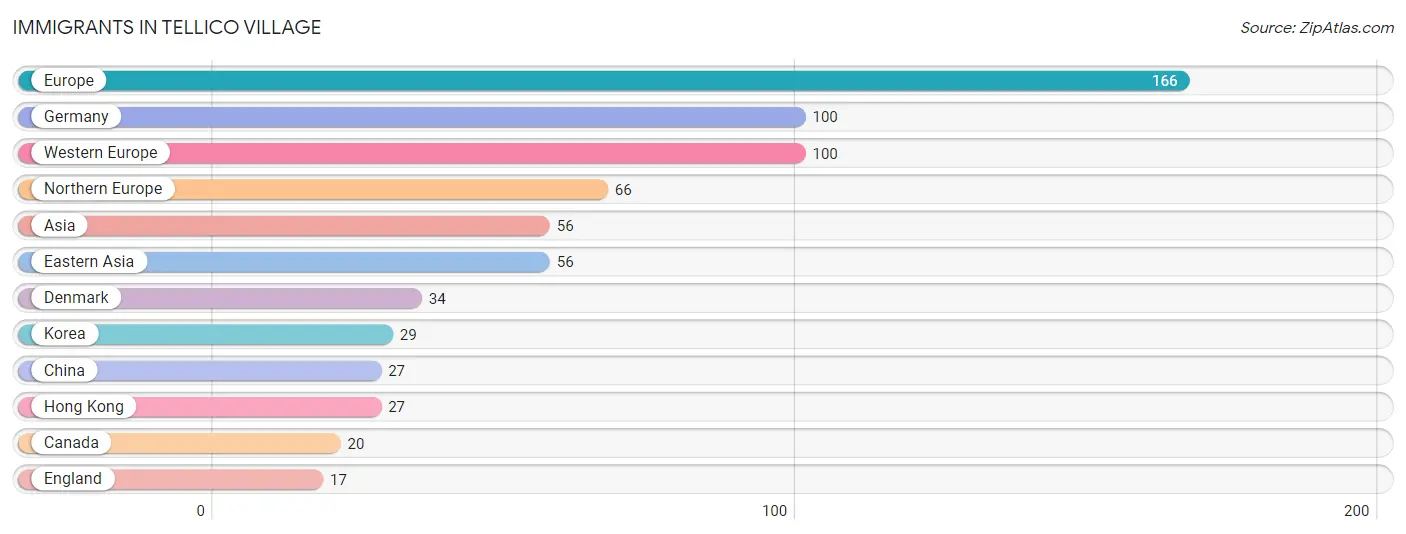
Immigrants in Tellico Village
The most numerous immigrant groups reported in Tellico Village came from Europe (166 | 2.7%), Germany (100 | 1.6%), Western Europe (100 | 1.6%), Northern Europe (66 | 1.1%), and Asia (56 | 0.9%), together accounting for 7.9% of all Tellico Village residents.
| Immigration Origin | # Population | % Population |
| Asia | 56 | 0.9% |
| Canada | 20 | 0.3% |
| China | 27 | 0.4% |
| Denmark | 34 | 0.5% |
| Eastern Asia | 56 | 0.9% |
| England | 17 | 0.3% |
| Europe | 166 | 2.7% |
| Germany | 100 | 1.6% |
| Hong Kong | 27 | 0.4% |
| Korea | 29 | 0.5% |
| Northern Europe | 66 | 1.1% |
| Western Europe | 100 | 1.6% | View All 12 Rows |
Sex and Age in Tellico Village
Sex and Age in Tellico Village
The most populous age groups in Tellico Village are 75 to 79 Years (626 | 19.4%) for men and 70 to 74 Years (688 | 23.0%) for women.
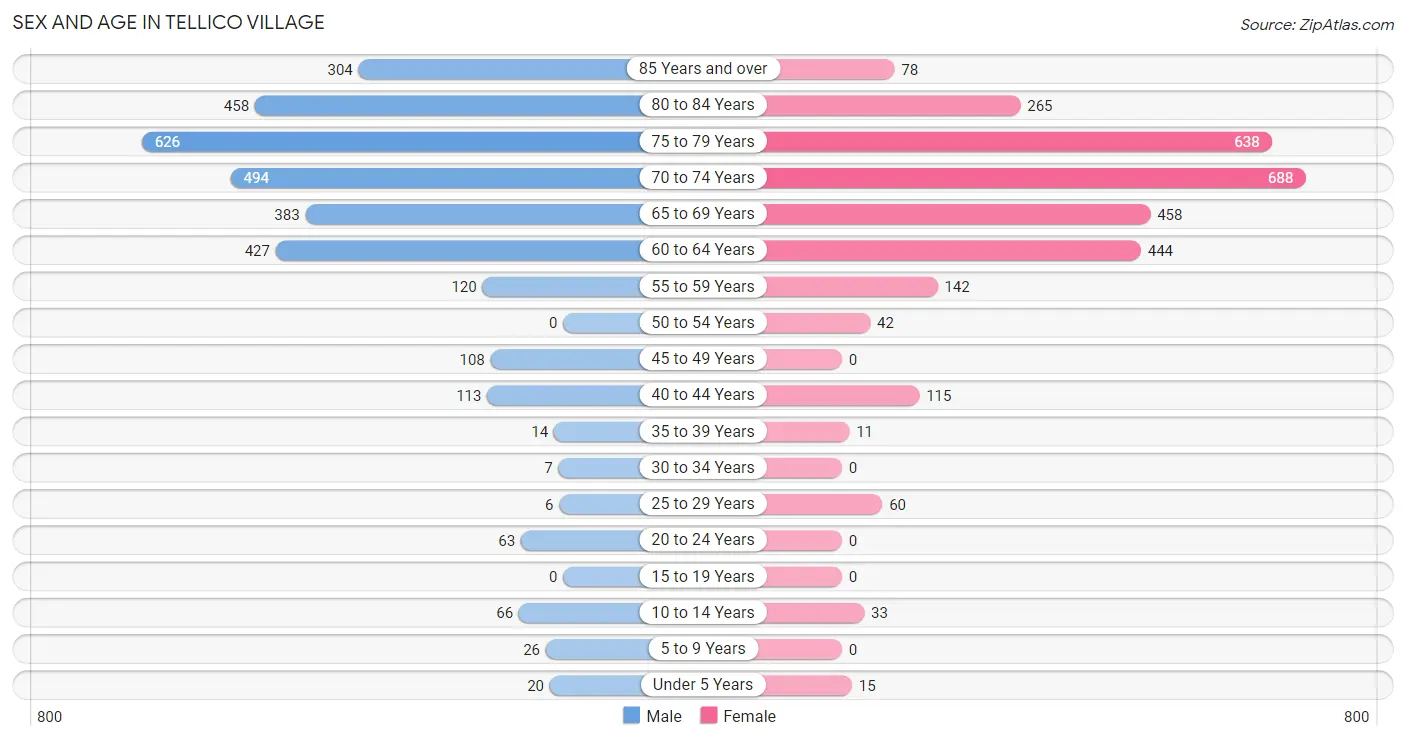
| Age Bracket | Male | Female |
| Under 5 Years | 20 (0.6%) | 15 (0.5%) |
| 5 to 9 Years | 26 (0.8%) | 0 (0.0%) |
| 10 to 14 Years | 66 (2.0%) | 33 (1.1%) |
| 15 to 19 Years | 0 (0.0%) | 0 (0.0%) |
| 20 to 24 Years | 63 (1.9%) | 0 (0.0%) |
| 25 to 29 Years | 6 (0.2%) | 60 (2.0%) |
| 30 to 34 Years | 7 (0.2%) | 0 (0.0%) |
| 35 to 39 Years | 14 (0.4%) | 11 (0.4%) |
| 40 to 44 Years | 113 (3.5%) | 115 (3.8%) |
| 45 to 49 Years | 108 (3.3%) | 0 (0.0%) |
| 50 to 54 Years | 0 (0.0%) | 42 (1.4%) |
| 55 to 59 Years | 120 (3.7%) | 142 (4.8%) |
| 60 to 64 Years | 427 (13.2%) | 444 (14.8%) |
| 65 to 69 Years | 383 (11.8%) | 458 (15.3%) |
| 70 to 74 Years | 494 (15.3%) | 688 (23.0%) |
| 75 to 79 Years | 626 (19.4%) | 638 (21.3%) |
| 80 to 84 Years | 458 (14.2%) | 265 (8.9%) |
| 85 Years and over | 304 (9.4%) | 78 (2.6%) |
| Total | 3,235 (100.0%) | 2,989 (100.0%) |
Families and Households in Tellico Village
Median Family Size in Tellico Village
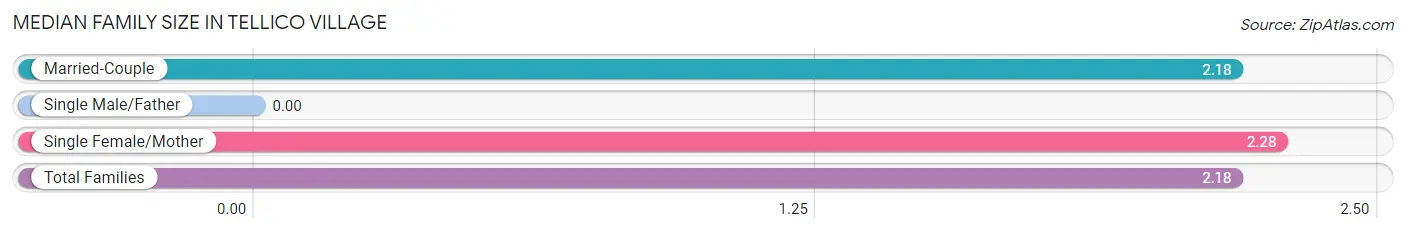
| Family Type | # Families | Family Size |
| Married-Couple | 2,356 (97.3%) | 2.18 |
| Single Male/Father | 0 (0.0%) | - |
| Single Female/Mother | 65 (2.7%) | 2.28 |
| Total Families | 2,421 (100.0%) | 2.18 |
Median Household Size in Tellico Village
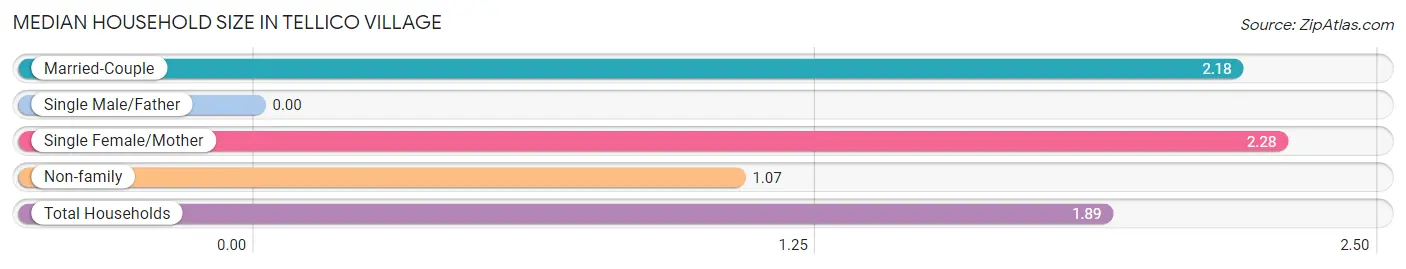
| Household Type | # Households | Household Size |
| Married-Couple | 2,356 (71.7%) | 2.18 |
| Single Male/Father | 0 (0.0%) | - |
| Single Female/Mother | 65 (2.0%) | 2.28 |
| Non-family | 866 (26.4%) | 1.07 |
| Total Households | 3,287 (100.0%) | 1.89 |
Household Size by Marriage Status in Tellico Village
Out of a total of 3,287 households in Tellico Village, 2,421 (73.7%) are family households, while 866 (26.4%) are nonfamily households. The most numerous type of family households are 2-person households, comprising 2,207, and the most common type of nonfamily households are 1-person households, comprising 786.
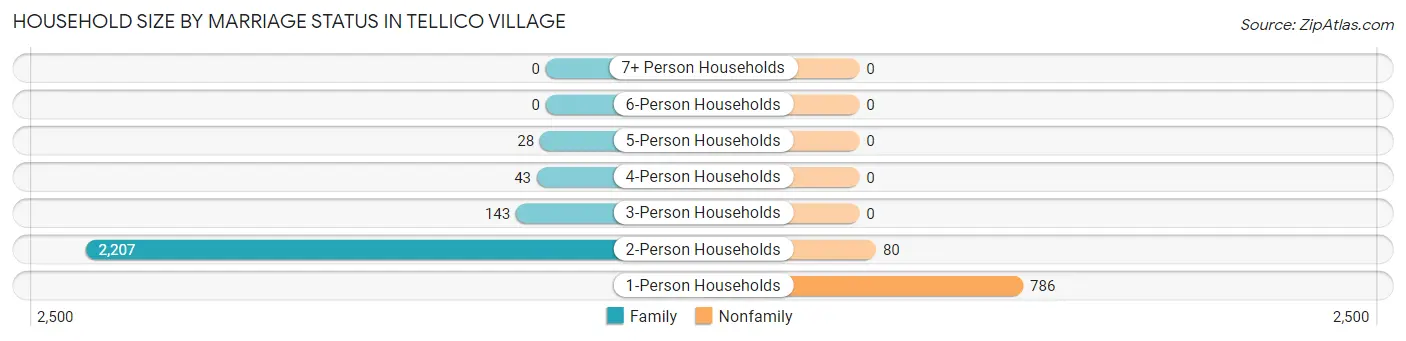
| Household Size | Family Households | Nonfamily Households |
| 1-Person Households | - | 786 (23.9%) |
| 2-Person Households | 2,207 (67.1%) | 80 (2.4%) |
| 3-Person Households | 143 (4.3%) | 0 (0.0%) |
| 4-Person Households | 43 (1.3%) | 0 (0.0%) |
| 5-Person Households | 28 (0.9%) | 0 (0.0%) |
| 6-Person Households | 0 (0.0%) | 0 (0.0%) |
| 7+ Person Households | 0 (0.0%) | 0 (0.0%) |
| Total | 2,421 (73.7%) | 866 (26.4%) |
Female Fertility in Tellico Village
Fertility by Age in Tellico Village
| Age Bracket | Women with Births | Births / 1,000 Women |
| 15 to 19 years | 0 (0.0%) | 0.0 |
| 20 to 34 years | 0 (0.0%) | 0.0 |
| 35 to 50 years | 0 (0.0%) | 0.0 |
| Total | 0 (0.0%) | 0.0 |
Fertility by Age by Marriage Status in Tellico Village
| Age Bracket | Married | Unmarried |
| 15 to 19 years | 0 (0.0%) | 0 (0.0%) |
| 20 to 34 years | 0 (0.0%) | 0 (0.0%) |
| 35 to 50 years | 0 (0.0%) | 0 (0.0%) |
| Total | 0 (0.0%) | 0 (0.0%) |
Fertility by Education in Tellico Village
| Educational Attainment | Women with Births | Births / 1,000 Women |
| Less than High School | 0 (0.0%) | 0.0 |
| High School Diploma | 0 (0.0%) | 0.0 |
| College or Associate's Degree | 0 (0.0%) | 0.0 |
| Bachelor's Degree | 0 (0.0%) | 0.0 |
| Graduate Degree | 0 (0.0%) | 0.0 |
| Total | 0 (0.0%) | 0.0 |
Fertility by Education by Marriage Status in Tellico Village
| Educational Attainment | Married | Unmarried |
| Less than High School | 0 (0.0%) | 0 (0.0%) |
| High School Diploma | 0 (0.0%) | 0 (0.0%) |
| College or Associate's Degree | 0 (0.0%) | 0 (0.0%) |
| Bachelor's Degree | 0 (0.0%) | 0 (0.0%) |
| Graduate Degree | 0 (0.0%) | 0 (0.0%) |
| Total | 0 (0.0%) | 0 (0.0%) |
Income in Tellico Village
Income Overview in Tellico Village
Per Capita Income in Tellico Village is $64,527, while median incomes of families and households are $107,349 and $95,038 respectively.
| Characteristic | Number | Measure |
| Per Capita Income | 6,224 | $64,527 |
| Median Family Income | 2,421 | $107,349 |
| Mean Family Income | 2,421 | $132,448 |
| Median Household Income | 3,287 | $95,038 |
| Mean Household Income | 3,287 | $119,192 |
| Income Deficit | 2,421 | $0 |
| Wage / Income Gap (%) | 6,224 | 49.05% |
| Wage / Income Gap ($) | 6,224 | 50.95¢ per $1 |
| Gini / Inequality Index | 6,224 | 0.40 |
Earnings by Sex in Tellico Village
Average Earnings in Tellico Village are $27,301, $50,698 for men and $25,829 for women, a difference of 49.0%.
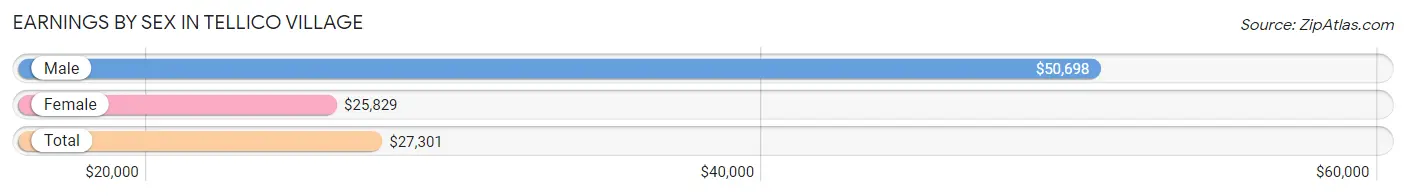
| Sex | Number | Average Earnings |
| Male | 726 (60.6%) | $50,698 |
| Female | 473 (39.5%) | $25,829 |
| Total | 1,199 (100.0%) | $27,301 |
Earnings by Sex by Income Bracket in Tellico Village
The most common earnings brackets in Tellico Village are $100,000+ for men (182 | 25.1%) and $25,000 to $29,999 for women (126 | 26.6%).
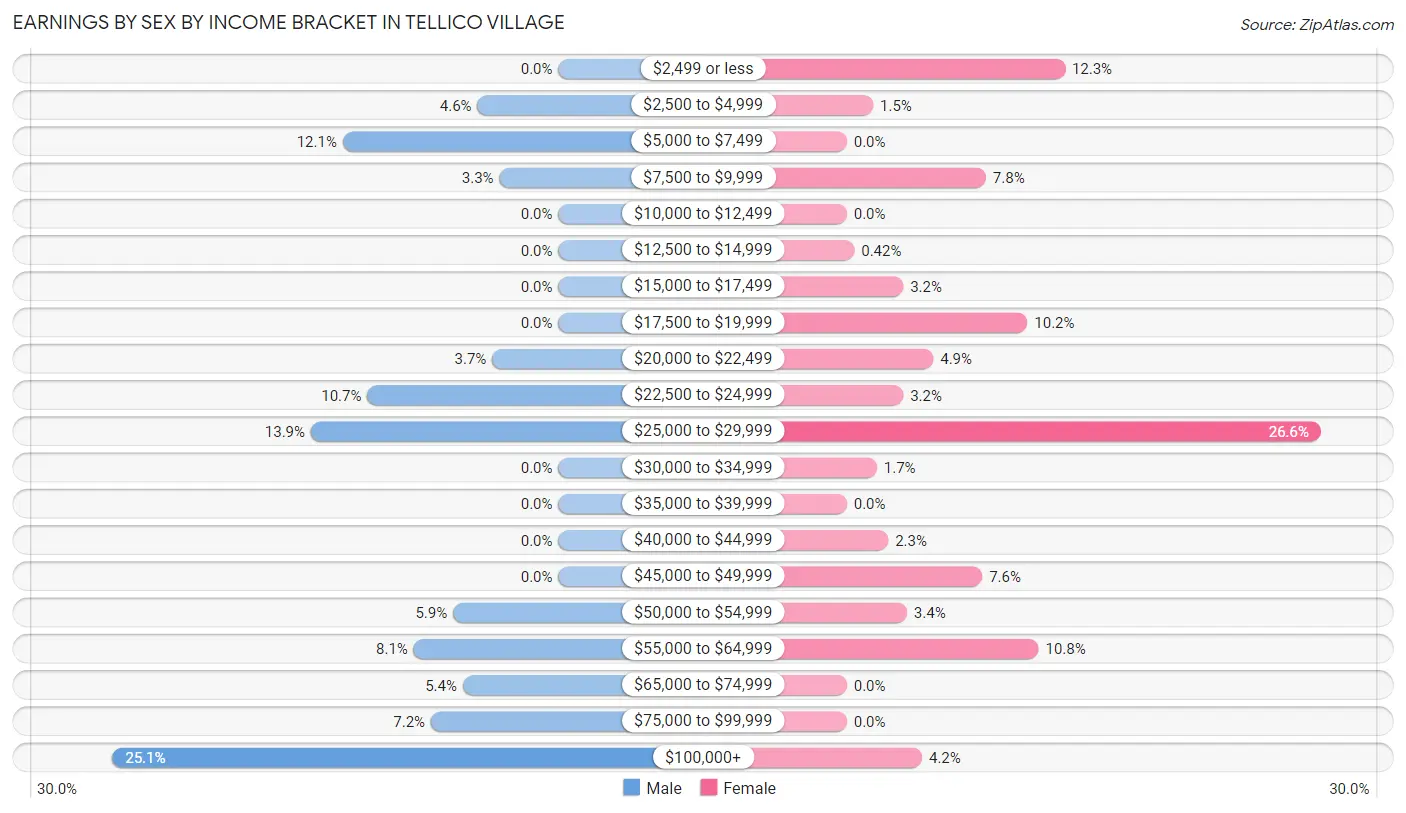
| Income | Male | Female |
| $2,499 or less | 0 (0.0%) | 58 (12.3%) |
| $2,500 to $4,999 | 33 (4.5%) | 7 (1.5%) |
| $5,000 to $7,499 | 88 (12.1%) | 0 (0.0%) |
| $7,500 to $9,999 | 24 (3.3%) | 37 (7.8%) |
| $10,000 to $12,499 | 0 (0.0%) | 0 (0.0%) |
| $12,500 to $14,999 | 0 (0.0%) | 2 (0.4%) |
| $15,000 to $17,499 | 0 (0.0%) | 15 (3.2%) |
| $17,500 to $19,999 | 0 (0.0%) | 48 (10.2%) |
| $20,000 to $22,499 | 27 (3.7%) | 23 (4.9%) |
| $22,500 to $24,999 | 78 (10.7%) | 15 (3.2%) |
| $25,000 to $29,999 | 101 (13.9%) | 126 (26.6%) |
| $30,000 to $34,999 | 0 (0.0%) | 8 (1.7%) |
| $35,000 to $39,999 | 0 (0.0%) | 0 (0.0%) |
| $40,000 to $44,999 | 0 (0.0%) | 11 (2.3%) |
| $45,000 to $49,999 | 0 (0.0%) | 36 (7.6%) |
| $50,000 to $54,999 | 43 (5.9%) | 16 (3.4%) |
| $55,000 to $64,999 | 59 (8.1%) | 51 (10.8%) |
| $65,000 to $74,999 | 39 (5.4%) | 0 (0.0%) |
| $75,000 to $99,999 | 52 (7.2%) | 0 (0.0%) |
| $100,000+ | 182 (25.1%) | 20 (4.2%) |
| Total | 726 (100.0%) | 473 (100.0%) |
Earnings by Sex by Educational Attainment in Tellico Village
Average earnings in Tellico Village are $52,297 for men and $25,829 for women, a difference of 50.6%. Men with an educational attainment of bachelor's degree enjoy the highest average annual earnings of $58,147, while those with high school diploma education earn the least with $51,094. Women with an educational attainment of graduate degree earn the most with the average annual earnings of $28,347, while those with high school diploma education have the smallest earnings of $25,707.
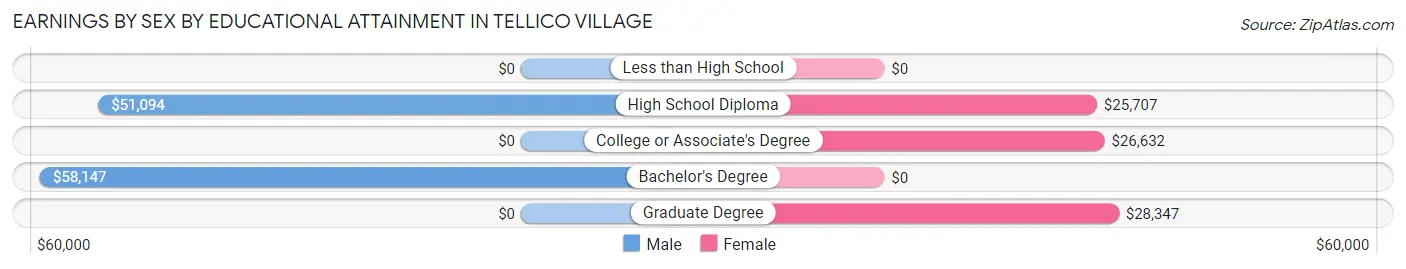
| Educational Attainment | Male Income | Female Income |
| Less than High School | - | - |
| High School Diploma | $51,094 | $25,707 |
| College or Associate's Degree | - | - |
| Bachelor's Degree | $58,147 | $0 |
| Graduate Degree | - | - |
| Total | $52,297 | $25,829 |
Family Income in Tellico Village
Family Income Brackets in Tellico Village
According to the Tellico Village family income data, there are 799 families falling into the $100,000 to $149,999 income range, which is the most common income bracket and makes up 33.0% of all families.
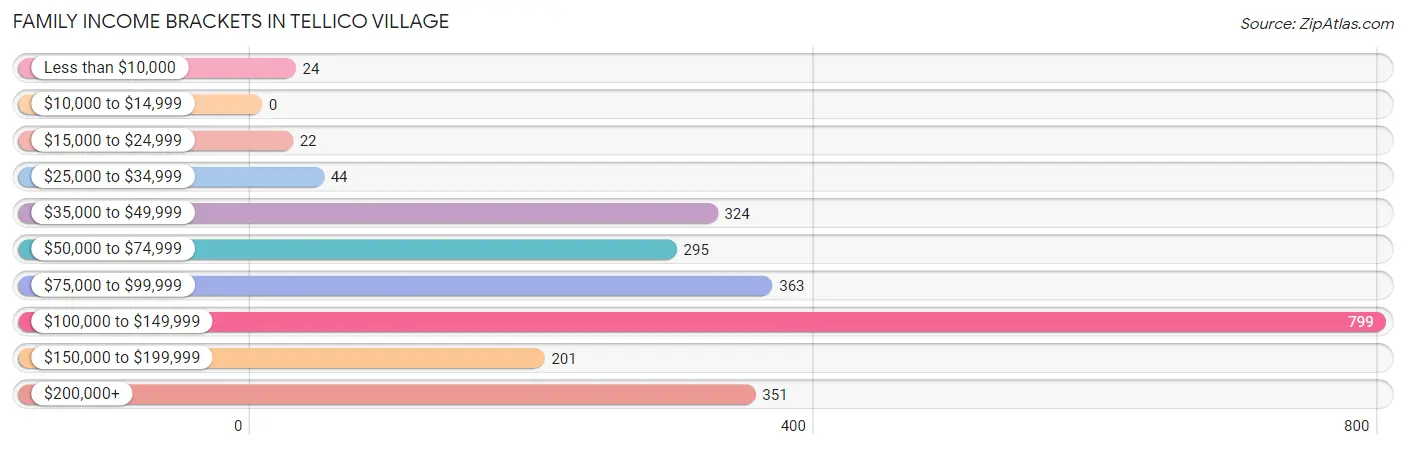
| Income Bracket | # Families | % Families |
| Less than $10,000 | 24 | 1.0% |
| $10,000 to $14,999 | 0 | 0.0% |
| $15,000 to $24,999 | 22 | 0.9% |
| $25,000 to $34,999 | 44 | 1.8% |
| $35,000 to $49,999 | 324 | 13.4% |
| $50,000 to $74,999 | 295 | 12.2% |
| $75,000 to $99,999 | 363 | 15.0% |
| $100,000 to $149,999 | 799 | 33.0% |
| $150,000 to $199,999 | 201 | 8.3% |
| $200,000+ | 351 | 14.5% |
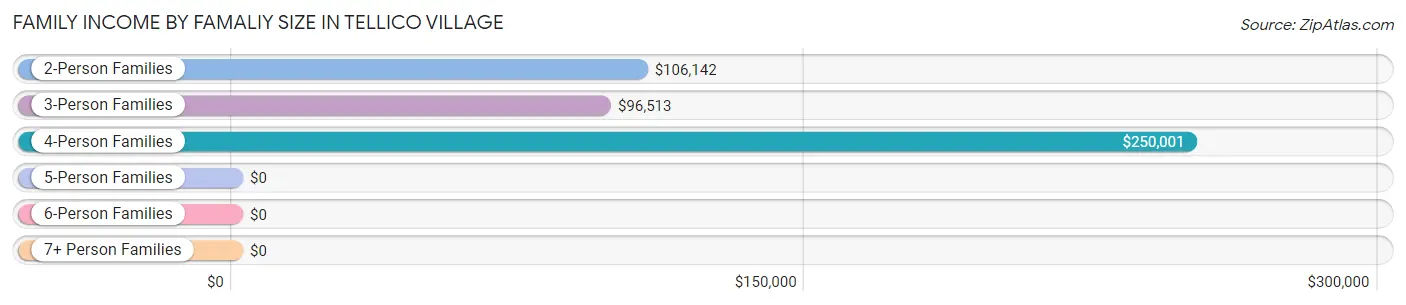
Family Income by Famaliy Size in Tellico Village
4-person families (43 | 1.8%) account for the highest median family income in Tellico Village with $250,001 per family, while 4-person families (43 | 1.8%) have the highest median income of $62,500 per family member.
| Income Bracket | # Families | Median Income |
| 2-Person Families | 2,207 (91.2%) | $106,142 |
| 3-Person Families | 143 (5.9%) | $96,513 |
| 4-Person Families | 43 (1.8%) | $250,001 |
| 5-Person Families | 28 (1.2%) | $0 |
| 6-Person Families | 0 (0.0%) | $0 |
| 7+ Person Families | 0 (0.0%) | $0 |
| Total | 2,421 (100.0%) | $107,349 |
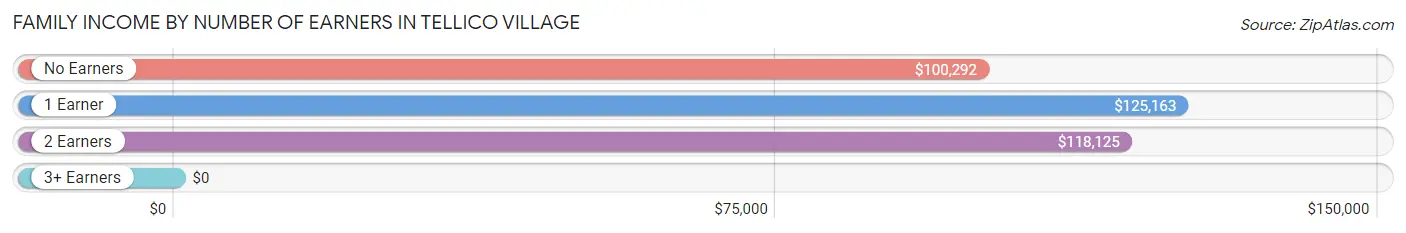
Family Income by Number of Earners in Tellico Village
| Number of Earners | # Families | Median Income |
| No Earners | 1,702 (70.3%) | $100,292 |
| 1 Earner | 547 (22.6%) | $125,163 |
| 2 Earners | 172 (7.1%) | $118,125 |
| 3+ Earners | 0 (0.0%) | $0 |
| Total | 2,421 (100.0%) | $107,349 |
Household Income in Tellico Village
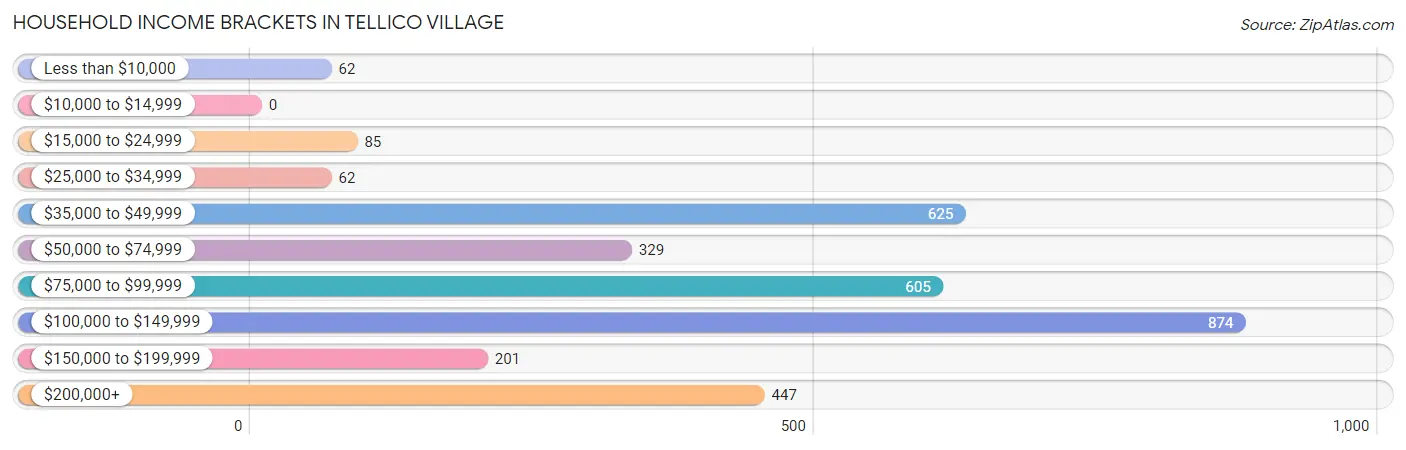
Household Income Brackets in Tellico Village
With 874 households falling in the category, the $100,000 to $149,999 income range is the most frequent in Tellico Village, accounting for 26.6% of all households.
| Income Bracket | # Households | % Households |
| Less than $10,000 | 62 | 1.9% |
| $10,000 to $14,999 | 0 | 0.0% |
| $15,000 to $24,999 | 85 | 2.6% |
| $25,000 to $34,999 | 62 | 1.9% |
| $35,000 to $49,999 | 625 | 19.0% |
| $50,000 to $74,999 | 329 | 10.0% |
| $75,000 to $99,999 | 605 | 18.4% |
| $100,000 to $149,999 | 874 | 26.6% |
| $150,000 to $199,999 | 201 | 6.1% |
| $200,000+ | 447 | 13.6% |
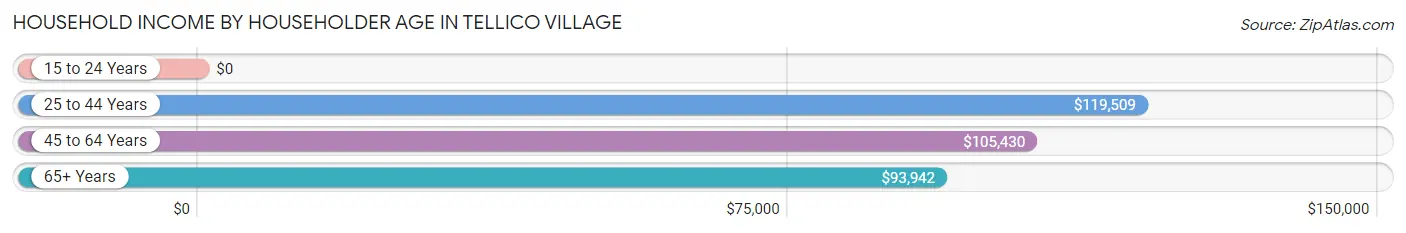
Household Income by Householder Age in Tellico Village
The median household income in Tellico Village is $95,038, with the highest median household income of $119,509 found in the 25 to 44 years age bracket for the primary householder. A total of 89 households (2.7%) fall into this category.
| Income Bracket | # Households | Median Income |
| 15 to 24 Years | 0 (0.0%) | $0 |
| 25 to 44 Years | 89 (2.7%) | $119,509 |
| 45 to 64 Years | 607 (18.5%) | $105,430 |
| 65+ Years | 2,591 (78.8%) | $93,942 |
| Total | 3,287 (100.0%) | $95,038 |
Poverty in Tellico Village
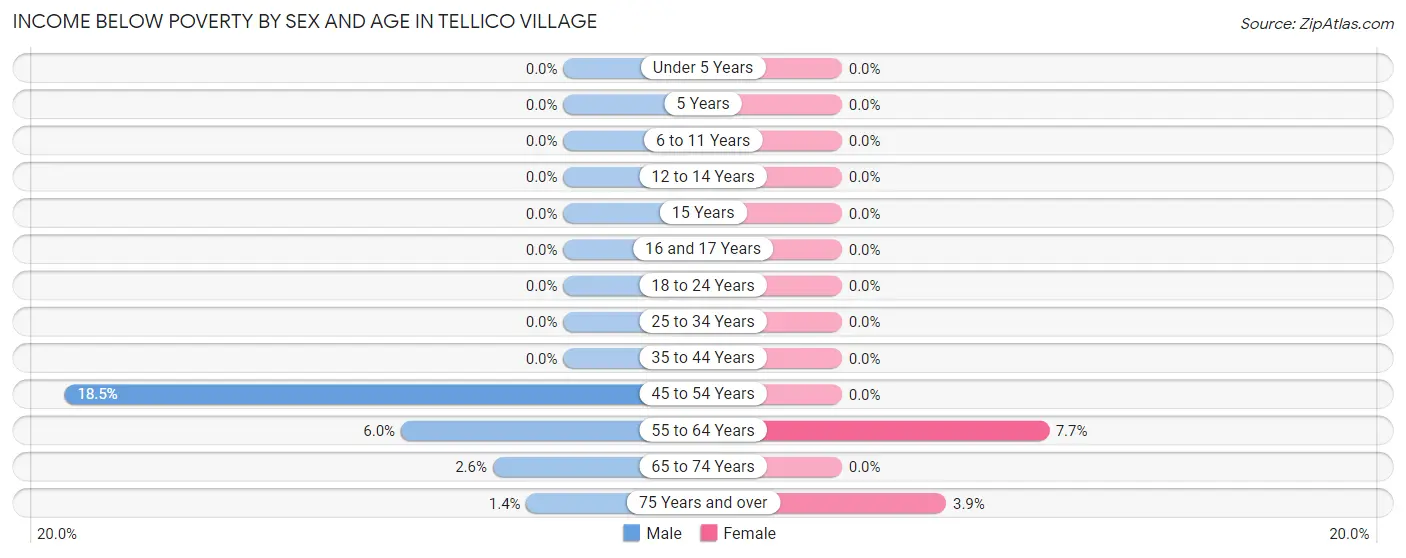
Income Below Poverty by Sex and Age in Tellico Village
With 2.9% poverty level for males and 2.8% for females among the residents of Tellico Village, 45 to 54 year old males and 55 to 64 year old females are the most vulnerable to poverty, with 20 males (18.5%) and 45 females (7.7%) in their respective age groups living below the poverty level.
| Age Bracket | Male | Female |
| Under 5 Years | 0 (0.0%) | 0 (0.0%) |
| 5 Years | 0 (0.0%) | 0 (0.0%) |
| 6 to 11 Years | 0 (0.0%) | 0 (0.0%) |
| 12 to 14 Years | 0 (0.0%) | 0 (0.0%) |
| 15 Years | 0 (0.0%) | 0 (0.0%) |
| 16 and 17 Years | 0 (0.0%) | 0 (0.0%) |
| 18 to 24 Years | 0 (0.0%) | 0 (0.0%) |
| 25 to 34 Years | 0 (0.0%) | 0 (0.0%) |
| 35 to 44 Years | 0 (0.0%) | 0 (0.0%) |
| 45 to 54 Years | 20 (18.5%) | 0 (0.0%) |
| 55 to 64 Years | 33 (6.0%) | 45 (7.7%) |
| 65 to 74 Years | 23 (2.6%) | 0 (0.0%) |
| 75 Years and over | 19 (1.4%) | 38 (3.9%) |
| Total | 95 (2.9%) | 83 (2.8%) |
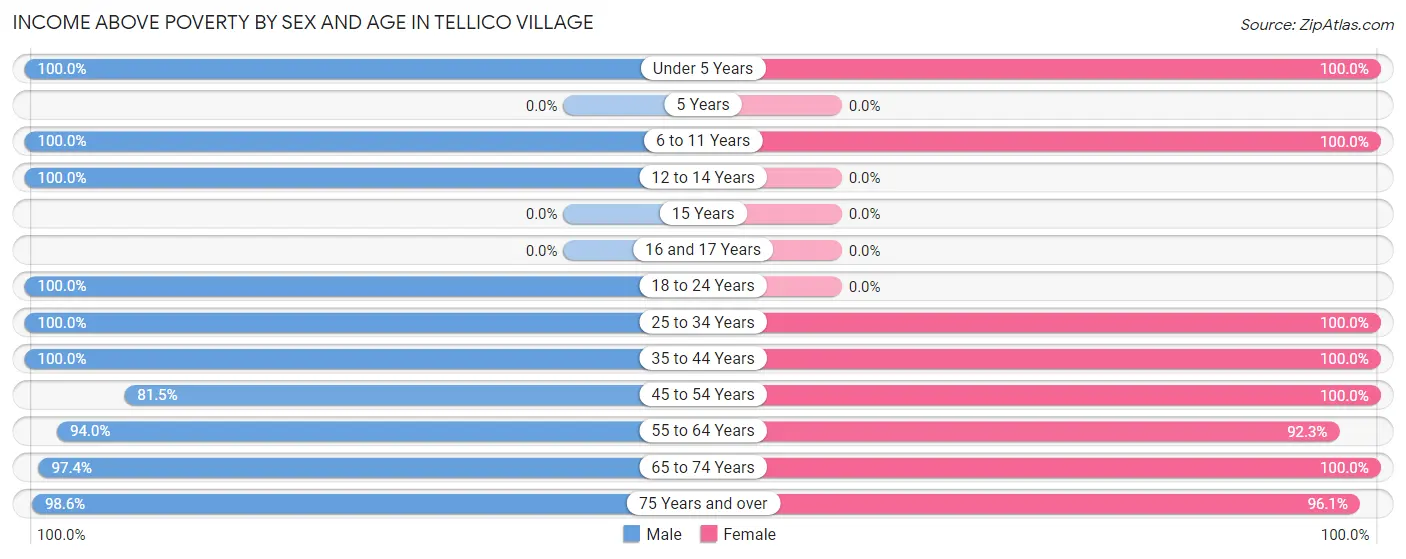
Income Above Poverty by Sex and Age in Tellico Village
According to the poverty statistics in Tellico Village, males aged under 5 years and females aged under 5 years are the age groups that are most secure financially, with 100.0% of males and 100.0% of females in these age groups living above the poverty line.
| Age Bracket | Male | Female |
| Under 5 Years | 20 (100.0%) | 15 (100.0%) |
| 5 Years | 0 (0.0%) | 0 (0.0%) |
| 6 to 11 Years | 62 (100.0%) | 33 (100.0%) |
| 12 to 14 Years | 30 (100.0%) | 0 (0.0%) |
| 15 Years | 0 (0.0%) | 0 (0.0%) |
| 16 and 17 Years | 0 (0.0%) | 0 (0.0%) |
| 18 to 24 Years | 63 (100.0%) | 0 (0.0%) |
| 25 to 34 Years | 13 (100.0%) | 60 (100.0%) |
| 35 to 44 Years | 127 (100.0%) | 126 (100.0%) |
| 45 to 54 Years | 88 (81.5%) | 42 (100.0%) |
| 55 to 64 Years | 514 (94.0%) | 541 (92.3%) |
| 65 to 74 Years | 854 (97.4%) | 1,146 (100.0%) |
| 75 Years and over | 1,369 (98.6%) | 943 (96.1%) |
| Total | 3,140 (97.1%) | 2,906 (97.2%) |
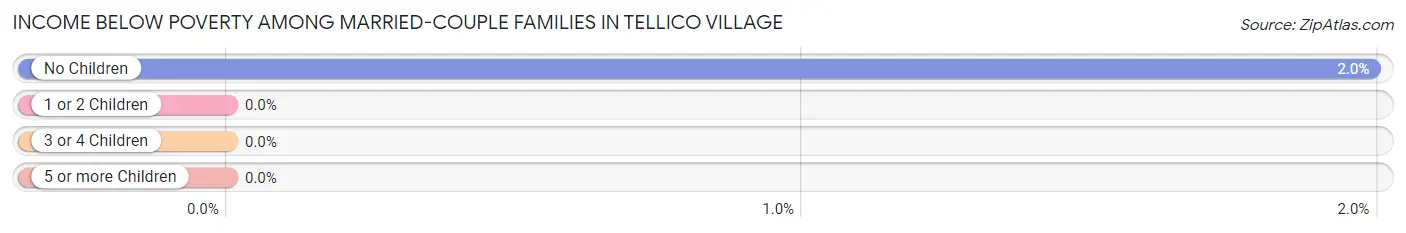
Income Below Poverty Among Married-Couple Families in Tellico Village
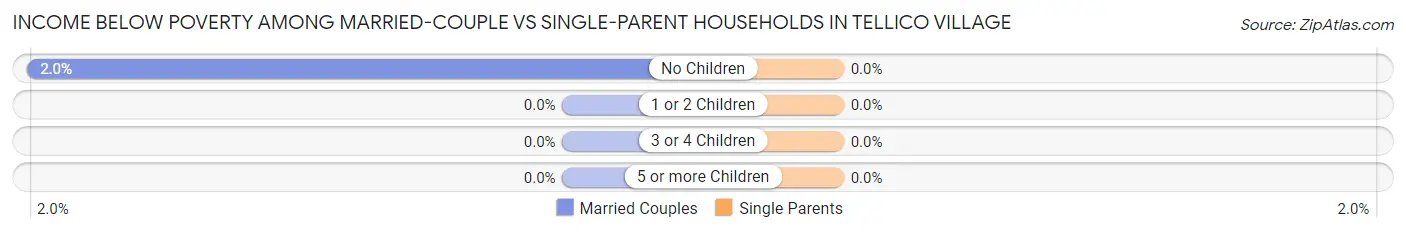
The poverty statistics for married-couple families in Tellico Village show that 1.9% or 45 of the total 2,356 families live below the poverty line. Families with no children have the highest poverty rate of 2.0%, comprising of 45 families. On the other hand, families with 1 or 2 children have the lowest poverty rate of 0.0%, which includes 0 families.
| Children | Above Poverty | Below Poverty |
| No Children | 2,220 (98.0%) | 45 (2.0%) |
| 1 or 2 Children | 91 (100.0%) | 0 (0.0%) |
| 3 or 4 Children | 0 (0.0%) | 0 (0.0%) |
| 5 or more Children | 0 (0.0%) | 0 (0.0%) |
| Total | 2,311 (98.1%) | 45 (1.9%) |
Income Below Poverty Among Single-Parent Households in Tellico Village
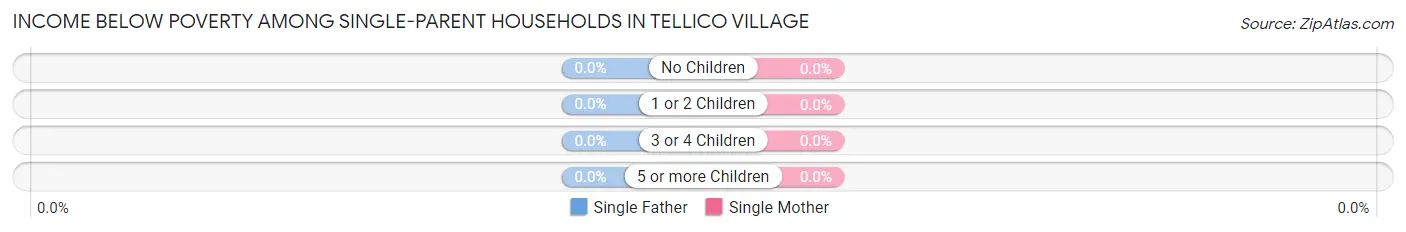
| Children | Single Father | Single Mother |
| No Children | 0 (0.0%) | 0 (0.0%) |
| 1 or 2 Children | 0 (0.0%) | 0 (0.0%) |
| 3 or 4 Children | 0 (0.0%) | 0 (0.0%) |
| 5 or more Children | 0 (0.0%) | 0 (0.0%) |
| Total | 0 (0.0%) | 0 (0.0%) |
Income Below Poverty Among Married-Couple vs Single-Parent Households in Tellico Village
| Children | Married-Couple Families | Single-Parent Households |
| No Children | 45 (2.0%) | 0 (0.0%) |
| 1 or 2 Children | 0 (0.0%) | 0 (0.0%) |
| 3 or 4 Children | 0 (0.0%) | 0 (0.0%) |
| 5 or more Children | 0 (0.0%) | 0 (0.0%) |
| Total | 45 (1.9%) | 0 (0.0%) |
Employment Characteristics in Tellico Village
Employment by Class of Employer in Tellico Village
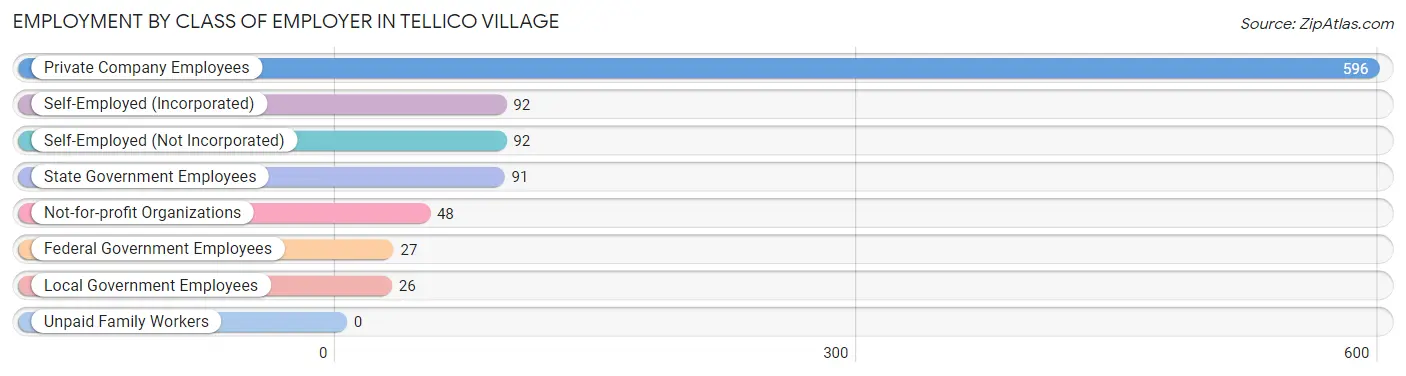
Among the 972 employed individuals in Tellico Village, private company employees (596 | 61.3%), self-employed (incorporated) (92 | 9.5%), and self-employed (not incorporated) (92 | 9.5%) make up the most common classes of employment.
| Employer Class | # Employees | % Employees |
| Private Company Employees | 596 | 61.3% |
| Self-Employed (Incorporated) | 92 | 9.5% |
| Self-Employed (Not Incorporated) | 92 | 9.5% |
| Not-for-profit Organizations | 48 | 4.9% |
| Local Government Employees | 26 | 2.7% |
| State Government Employees | 91 | 9.4% |
| Federal Government Employees | 27 | 2.8% |
| Unpaid Family Workers | 0 | 0.0% |
| Total | 972 | 100.0% |
Employment Status by Age in Tellico Village
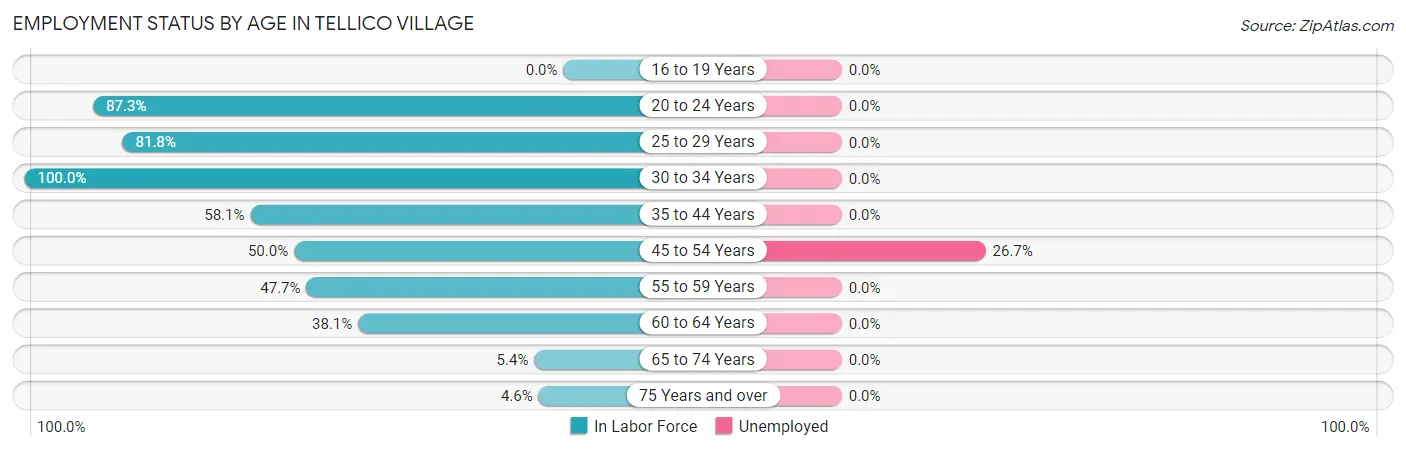
According to the labor force statistics for Tellico Village, out of the total population over 16 years of age (6,064), 16.7% or 1,013 individuals are in the labor force, with 2.0% or 20 of them unemployed. The age group with the highest labor force participation rate is 30 to 34 years, with 100.0% or 7 individuals in the labor force. Within the labor force, the 45 to 54 years age range has the highest percentage of unemployed individuals, with 26.7% or 20 of them being unemployed.
| Age Bracket | In Labor Force | Unemployed |
| 16 to 19 Years | 0 (0.0%) | 0 (0.0%) |
| 20 to 24 Years | 55 (87.3%) | 0 (0.0%) |
| 25 to 29 Years | 54 (81.8%) | 0 (0.0%) |
| 30 to 34 Years | 7 (100.0%) | 0 (0.0%) |
| 35 to 44 Years | 147 (58.1%) | 0 (0.0%) |
| 45 to 54 Years | 75 (50.0%) | 20 (26.7%) |
| 55 to 59 Years | 125 (47.7%) | 0 (0.0%) |
| 60 to 64 Years | 332 (38.1%) | 0 (0.0%) |
| 65 to 74 Years | 109 (5.4%) | 0 (0.0%) |
| 75 Years and over | 109 (4.6%) | 0 (0.0%) |
| Total | 1,013 (16.7%) | 20 (2.0%) |
Employment Status by Educational Attainment in Tellico Village
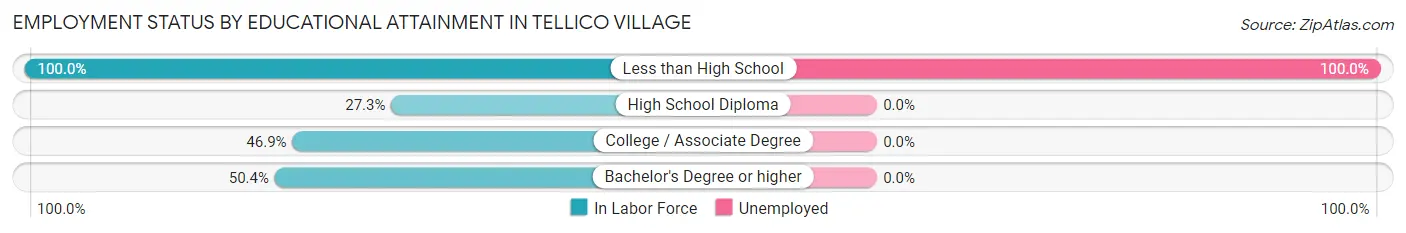
According to labor force statistics for Tellico Village, 46.0% of individuals (740) out of the total population between 25 and 64 years of age (1,609) are in the labor force, with 2.8% or 21 of them being unemployed. The group with the highest labor force participation rate are those with the educational attainment of less than high school, with 100.0% or 20 individuals in the labor force. Within the labor force, individuals with less than high school education have the highest percentage of unemployment, with 100.0% or 20 of them being unemployed.
| Educational Attainment | In Labor Force | Unemployed |
| Less than High School | 20 (100.0%) | 20 (100.0%) |
| High School Diploma | 79 (27.3%) | 0 (0.0%) |
| College / Associate Degree | 186 (46.9%) | 0 (0.0%) |
| Bachelor's Degree or higher | 455 (50.4%) | 0 (0.0%) |
| Total | 740 (46.0%) | 45 (2.8%) |
Employment Occupations by Sex in Tellico Village
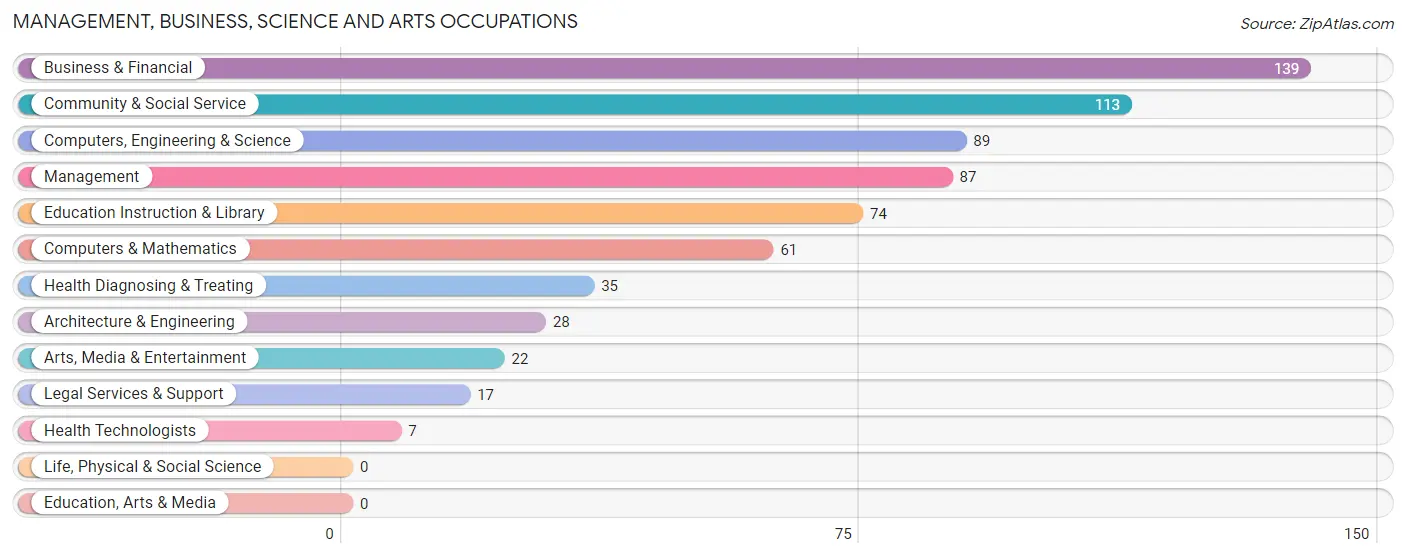
Management, Business, Science and Arts Occupations
The most common Management, Business, Science and Arts occupations in Tellico Village are Business & Financial (139 | 14.2%), Community & Social Service (113 | 11.5%), Computers, Engineering & Science (89 | 9.1%), Management (87 | 8.9%), and Education Instruction & Library (74 | 7.6%).
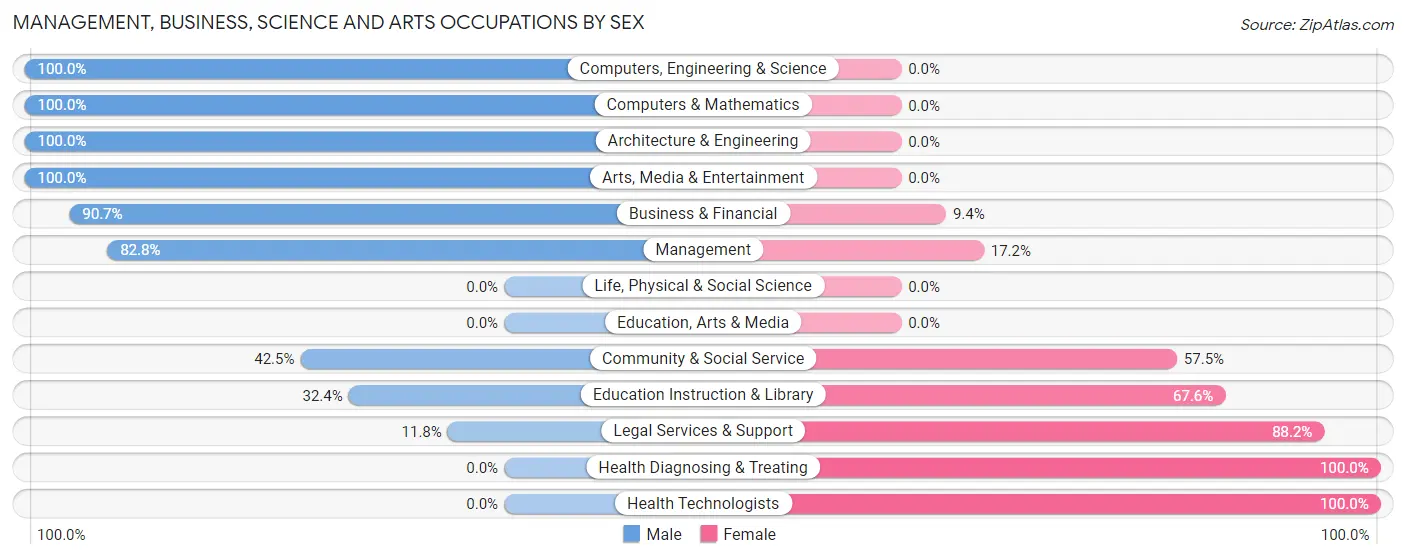
Management, Business, Science and Arts Occupations by Sex
Within the Management, Business, Science and Arts occupations in Tellico Village, the most male-oriented occupations are Computers, Engineering & Science (100.0%), Computers & Mathematics (100.0%), and Architecture & Engineering (100.0%), while the most female-oriented occupations are Health Diagnosing & Treating (100.0%), Health Technologists (100.0%), and Legal Services & Support (88.2%).
| Occupation | Male | Female |
| Management | 72 (82.8%) | 15 (17.2%) |
| Business & Financial | 126 (90.6%) | 13 (9.3%) |
| Computers, Engineering & Science | 89 (100.0%) | 0 (0.0%) |
| Computers & Mathematics | 61 (100.0%) | 0 (0.0%) |
| Architecture & Engineering | 28 (100.0%) | 0 (0.0%) |
| Life, Physical & Social Science | 0 (0.0%) | 0 (0.0%) |
| Community & Social Service | 48 (42.5%) | 65 (57.5%) |
| Education, Arts & Media | 0 (0.0%) | 0 (0.0%) |
| Legal Services & Support | 2 (11.8%) | 15 (88.2%) |
| Education Instruction & Library | 24 (32.4%) | 50 (67.6%) |
| Arts, Media & Entertainment | 22 (100.0%) | 0 (0.0%) |
| Health Diagnosing & Treating | 0 (0.0%) | 35 (100.0%) |
| Health Technologists | 0 (0.0%) | 7 (100.0%) |
| Total (Category) | 335 (72.4%) | 128 (27.7%) |
| Total (Overall) | 625 (63.8%) | 354 (36.2%) |
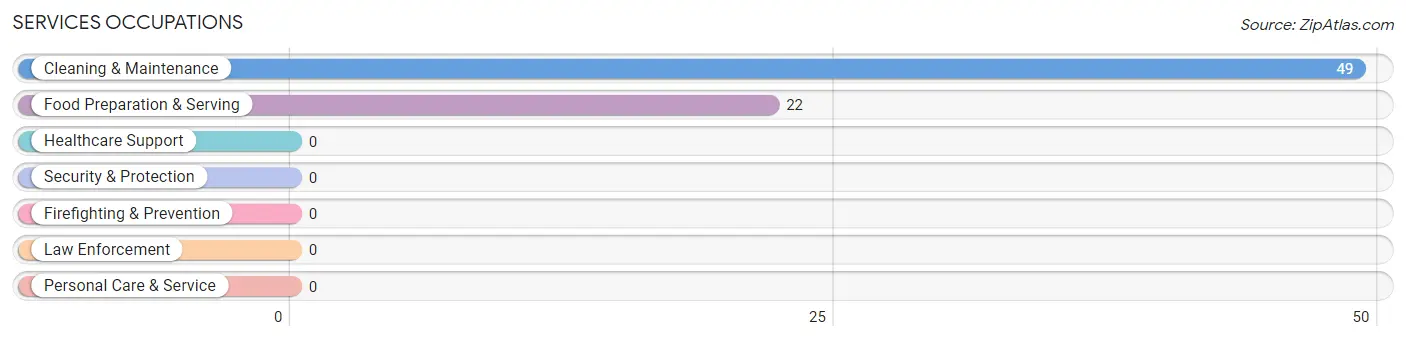
Services Occupations
The most common Services occupations in Tellico Village are Cleaning & Maintenance (49 | 5.0%), and Food Preparation & Serving (22 | 2.2%).
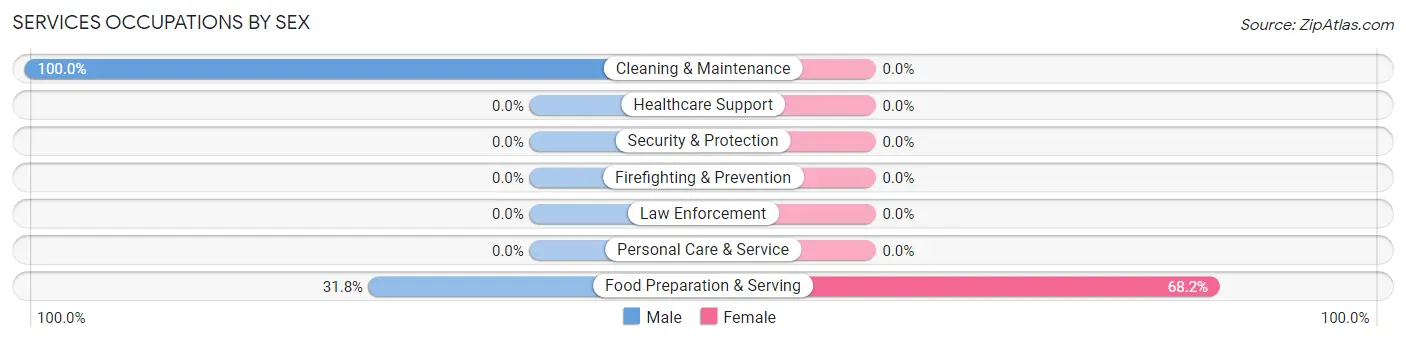
Services Occupations by Sex
| Occupation | Male | Female |
| Healthcare Support | 0 (0.0%) | 0 (0.0%) |
| Security & Protection | 0 (0.0%) | 0 (0.0%) |
| Firefighting & Prevention | 0 (0.0%) | 0 (0.0%) |
| Law Enforcement | 0 (0.0%) | 0 (0.0%) |
| Food Preparation & Serving | 7 (31.8%) | 15 (68.2%) |
| Cleaning & Maintenance | 49 (100.0%) | 0 (0.0%) |
| Personal Care & Service | 0 (0.0%) | 0 (0.0%) |
| Total (Category) | 56 (78.9%) | 15 (21.1%) |
| Total (Overall) | 625 (63.8%) | 354 (36.2%) |
Sales and Office Occupations
The most common Sales and Office occupations in Tellico Village are Office & Administration (149 | 15.2%), and Sales & Related (52 | 5.3%).

Sales and Office Occupations by Sex

| Occupation | Male | Female |
| Sales & Related | 16 (30.8%) | 36 (69.2%) |
| Office & Administration | 3 (2.0%) | 146 (98.0%) |
| Total (Category) | 19 (9.5%) | 182 (90.5%) |
| Total (Overall) | 625 (63.8%) | 354 (36.2%) |
Natural Resources, Construction and Maintenance Occupations

Natural Resources, Construction and Maintenance Occupations by Sex

| Occupation | Male | Female |
| Farming, Fishing & Forestry | 0 (0.0%) | 0 (0.0%) |
| Construction & Extraction | 0 (0.0%) | 0 (0.0%) |
| Installation, Maintenance & Repair | 0 (0.0%) | 0 (0.0%) |
| Total (Category) | 0 (0.0%) | 0 (0.0%) |
| Total (Overall) | 625 (63.8%) | 354 (36.2%) |
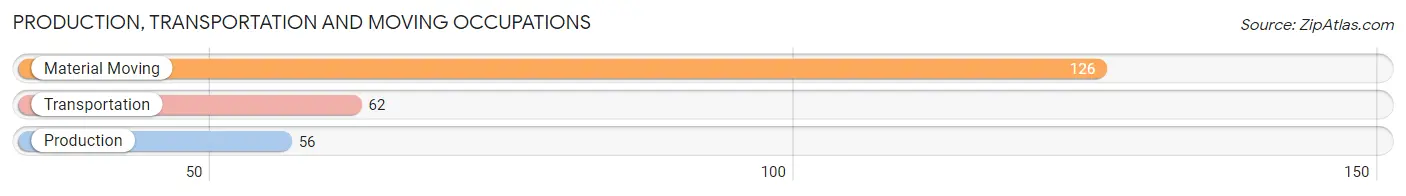
Production, Transportation and Moving Occupations
The most common Production, Transportation and Moving occupations in Tellico Village are Material Moving (126 | 12.9%), Transportation (62 | 6.3%), and Production (56 | 5.7%).
Production, Transportation and Moving Occupations by Sex
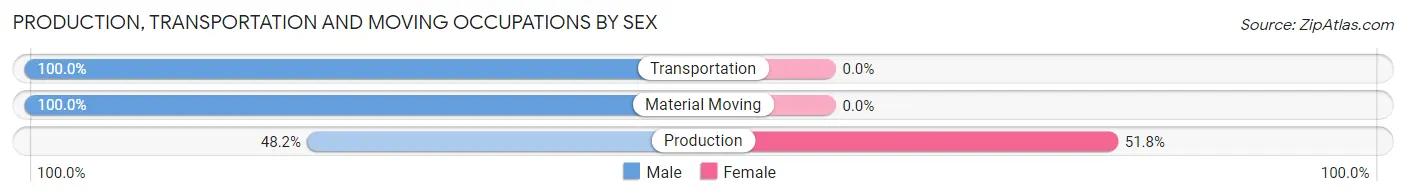
| Occupation | Male | Female |
| Production | 27 (48.2%) | 29 (51.8%) |
| Transportation | 62 (100.0%) | 0 (0.0%) |
| Material Moving | 126 (100.0%) | 0 (0.0%) |
| Total (Category) | 215 (88.1%) | 29 (11.9%) |
| Total (Overall) | 625 (63.8%) | 354 (36.2%) |
Employment Industries by Sex in Tellico Village
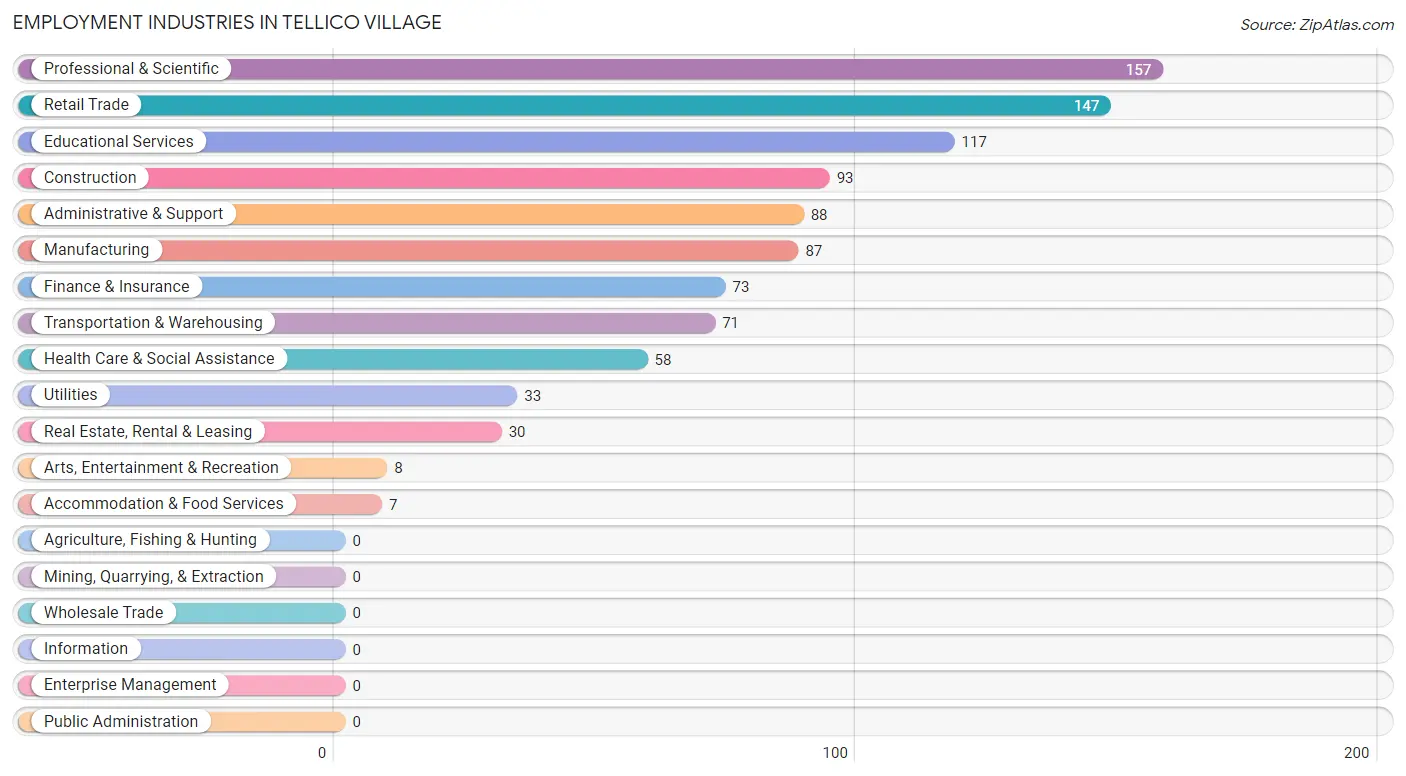
Employment Industries in Tellico Village
The major employment industries in Tellico Village include Professional & Scientific (157 | 16.0%), Retail Trade (147 | 15.0%), Educational Services (117 | 11.9%), Construction (93 | 9.5%), and Administrative & Support (88 | 9.0%).
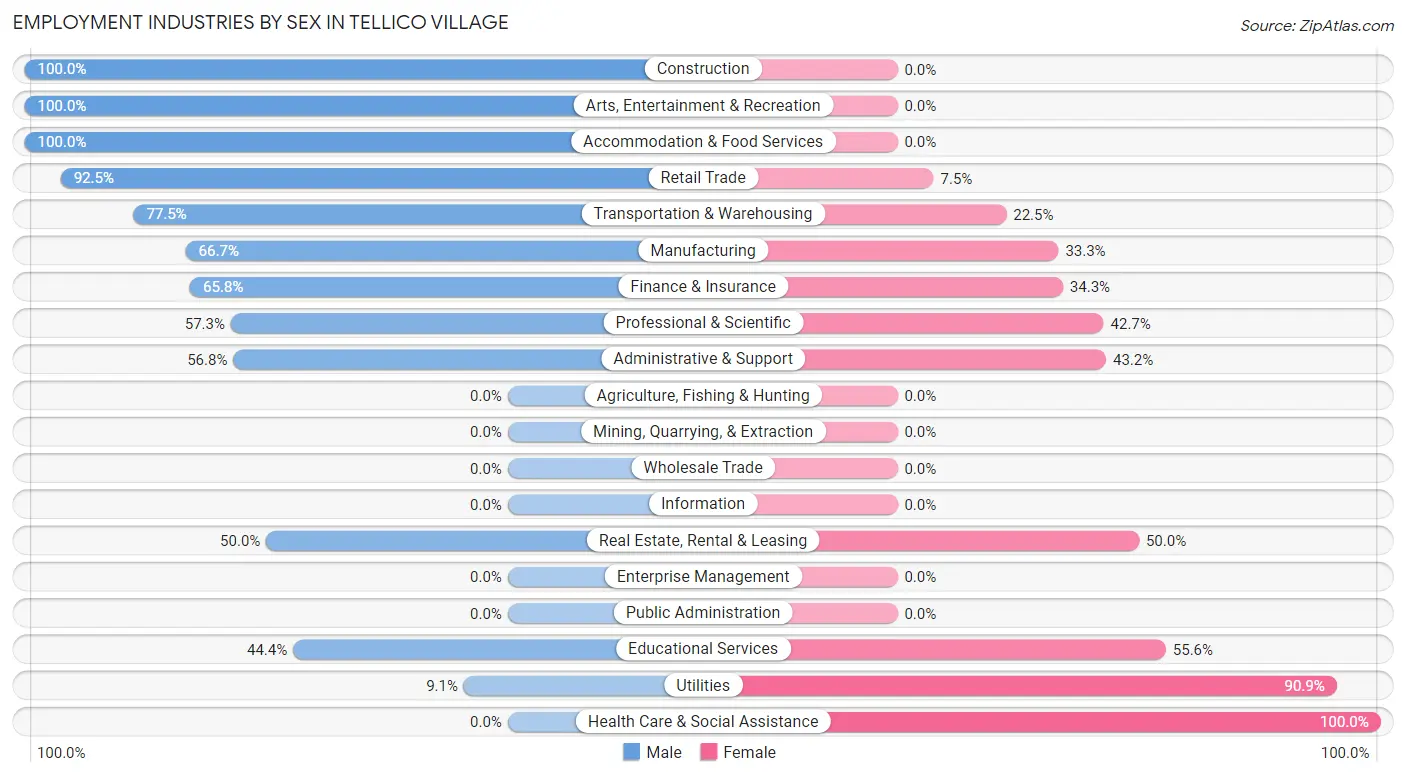
Employment Industries by Sex in Tellico Village
The Tellico Village industries that see more men than women are Construction (100.0%), Arts, Entertainment & Recreation (100.0%), and Accommodation & Food Services (100.0%), whereas the industries that tend to have a higher number of women are Health Care & Social Assistance (100.0%), Utilities (90.9%), and Educational Services (55.6%).
| Industry | Male | Female |
| Agriculture, Fishing & Hunting | 0 (0.0%) | 0 (0.0%) |
| Mining, Quarrying, & Extraction | 0 (0.0%) | 0 (0.0%) |
| Construction | 93 (100.0%) | 0 (0.0%) |
| Manufacturing | 58 (66.7%) | 29 (33.3%) |
| Wholesale Trade | 0 (0.0%) | 0 (0.0%) |
| Retail Trade | 136 (92.5%) | 11 (7.5%) |
| Transportation & Warehousing | 55 (77.5%) | 16 (22.5%) |
| Utilities | 3 (9.1%) | 30 (90.9%) |
| Information | 0 (0.0%) | 0 (0.0%) |
| Finance & Insurance | 48 (65.7%) | 25 (34.3%) |
| Real Estate, Rental & Leasing | 15 (50.0%) | 15 (50.0%) |
| Professional & Scientific | 90 (57.3%) | 67 (42.7%) |
| Enterprise Management | 0 (0.0%) | 0 (0.0%) |
| Administrative & Support | 50 (56.8%) | 38 (43.2%) |
| Educational Services | 52 (44.4%) | 65 (55.6%) |
| Health Care & Social Assistance | 0 (0.0%) | 58 (100.0%) |
| Arts, Entertainment & Recreation | 8 (100.0%) | 0 (0.0%) |
| Accommodation & Food Services | 7 (100.0%) | 0 (0.0%) |
| Public Administration | 0 (0.0%) | 0 (0.0%) |
| Total | 625 (63.8%) | 354 (36.2%) |
Education in Tellico Village
School Enrollment in Tellico Village
The most common levels of schooling among the 269 students in Tellico Village are graduate / professional (85 | 31.6%), elementary school (70 | 26.0%), and middle school (55 | 20.4%).
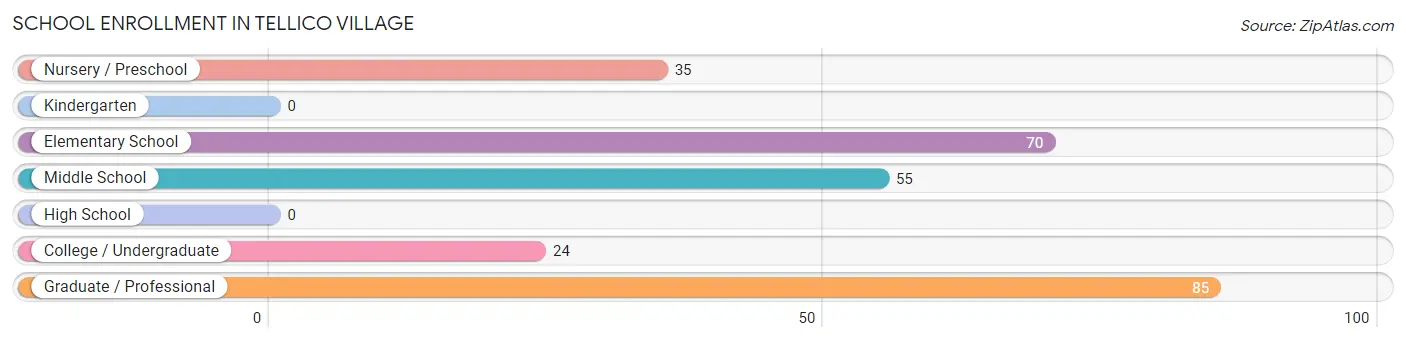
| School Level | # Students | % Students |
| Nursery / Preschool | 35 | 13.0% |
| Kindergarten | 0 | 0.0% |
| Elementary School | 70 | 26.0% |
| Middle School | 55 | 20.4% |
| High School | 0 | 0.0% |
| College / Undergraduate | 24 | 8.9% |
| Graduate / Professional | 85 | 31.6% |
| Total | 269 | 100.0% |
School Enrollment by Age by Funding Source in Tellico Village
Out of a total of 269 students who are enrolled in schools in Tellico Village, 70 (26.0%) attend a private institution, while the remaining 199 (74.0%) are enrolled in public schools. The age group of 3 to 4 year olds has the highest likelihood of being enrolled in private schools, with 20 (57.1% in the age bracket) enrolled. Conversely, the age group of 5 to 9 year old has the lowest likelihood of being enrolled in a private school, with 26 (100.0% in the age bracket) attending a public institution.
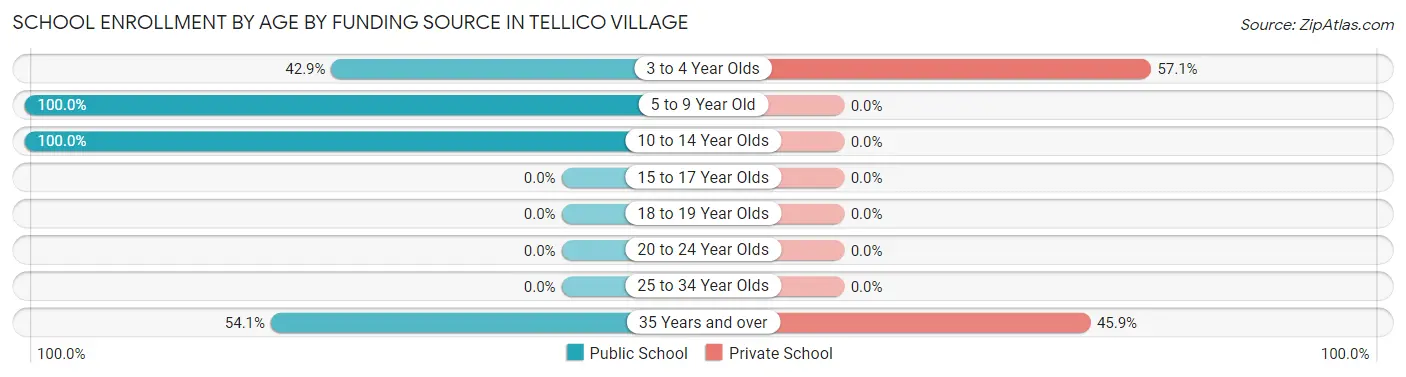
| Age Bracket | Public School | Private School |
| 3 to 4 Year Olds | 15 (42.9%) | 20 (57.1%) |
| 5 to 9 Year Old | 26 (100.0%) | 0 (0.0%) |
| 10 to 14 Year Olds | 99 (100.0%) | 0 (0.0%) |
| 15 to 17 Year Olds | 0 (0.0%) | 0 (0.0%) |
| 18 to 19 Year Olds | 0 (0.0%) | 0 (0.0%) |
| 20 to 24 Year Olds | 0 (0.0%) | 0 (0.0%) |
| 25 to 34 Year Olds | 0 (0.0%) | 0 (0.0%) |
| 35 Years and over | 59 (54.1%) | 50 (45.9%) |
| Total | 199 (74.0%) | 70 (26.0%) |
Educational Attainment by Field of Study in Tellico Village
Business (829 | 23.6%), education (509 | 14.5%), engineering (481 | 13.7%), science & technology (308 | 8.8%), and arts & humanities (287 | 8.2%) are the most common fields of study among 3,508 individuals in Tellico Village who have obtained a bachelor's degree or higher.
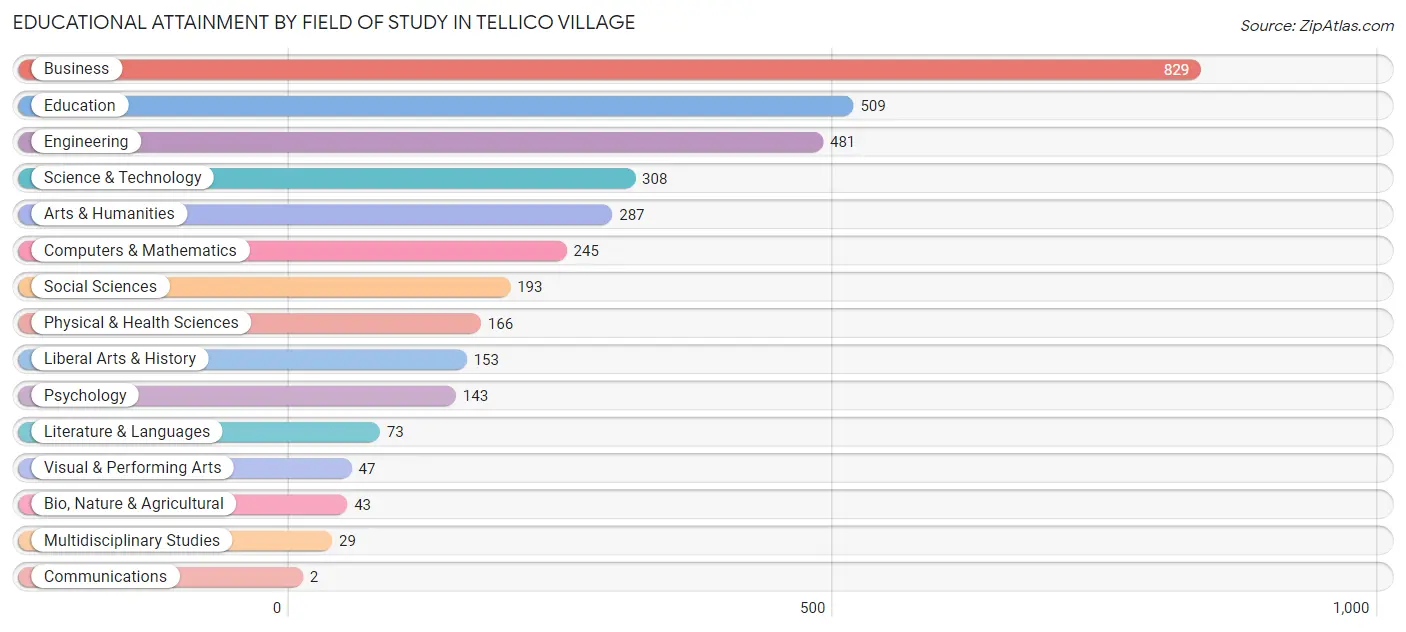
| Field of Study | # Graduates | % Graduates |
| Computers & Mathematics | 245 | 7.0% |
| Bio, Nature & Agricultural | 43 | 1.2% |
| Physical & Health Sciences | 166 | 4.7% |
| Psychology | 143 | 4.1% |
| Social Sciences | 193 | 5.5% |
| Engineering | 481 | 13.7% |
| Multidisciplinary Studies | 29 | 0.8% |
| Science & Technology | 308 | 8.8% |
| Business | 829 | 23.6% |
| Education | 509 | 14.5% |
| Literature & Languages | 73 | 2.1% |
| Liberal Arts & History | 153 | 4.4% |
| Visual & Performing Arts | 47 | 1.3% |
| Communications | 2 | 0.1% |
| Arts & Humanities | 287 | 8.2% |
| Total | 3,508 | 100.0% |
Transportation & Commute in Tellico Village
Vehicle Availability by Sex in Tellico Village
The most prevalent vehicle ownership categories in Tellico Village are males with 2 vehicles (299, accounting for 49.2%) and females with 2 vehicles (203, making up 84.5%).
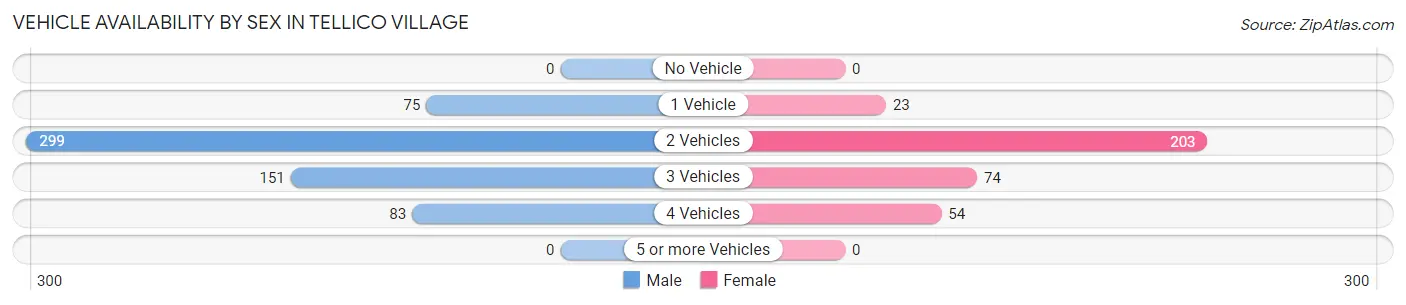
| Vehicles Available | Male | Female |
| No Vehicle | 0 (0.0%) | 0 (0.0%) |
| 1 Vehicle | 75 (12.3%) | 23 (6.5%) |
| 2 Vehicles | 299 (49.2%) | 203 (57.3%) |
| 3 Vehicles | 151 (24.8%) | 74 (20.9%) |
| 4 Vehicles | 83 (13.7%) | 54 (15.2%) |
| 5 or more Vehicles | 0 (0.0%) | 0 (0.0%) |
| Total | 608 (100.0%) | 354 (100.0%) |
Commute Time in Tellico Village
The most frequently occuring commute durations in Tellico Village are 45 to 59 minutes (146 commuters, 20.1%), 20 to 24 minutes (140 commuters, 19.3%), and 30 to 34 minutes (110 commuters, 15.1%).
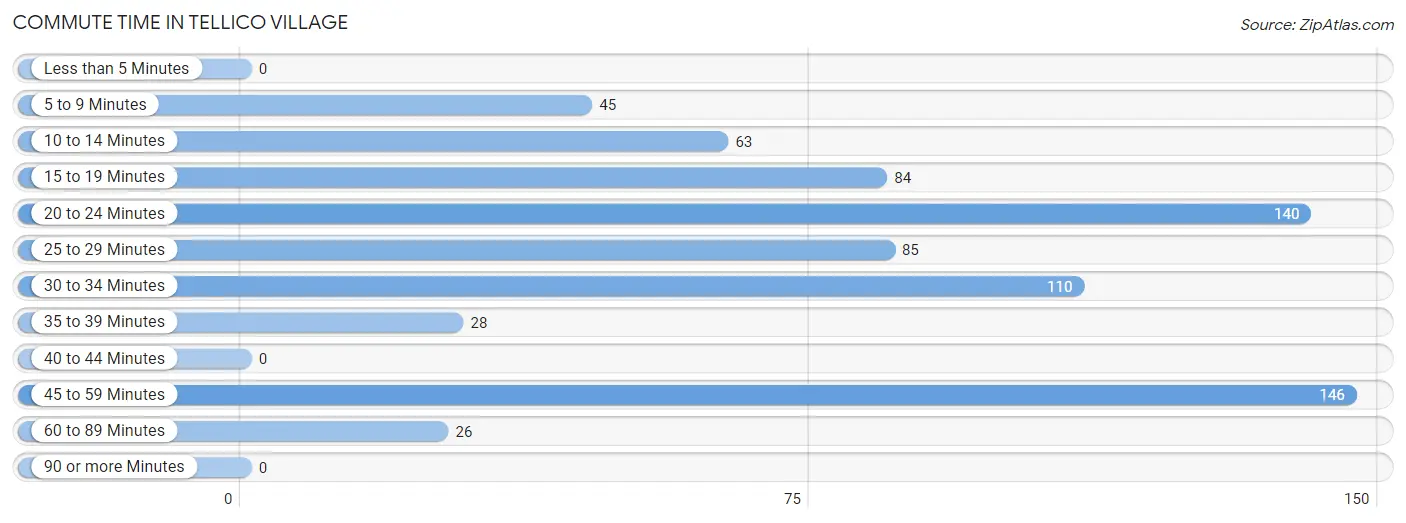
| Commute Time | # Commuters | % Commuters |
| Less than 5 Minutes | 0 | 0.0% |
| 5 to 9 Minutes | 45 | 6.2% |
| 10 to 14 Minutes | 63 | 8.7% |
| 15 to 19 Minutes | 84 | 11.6% |
| 20 to 24 Minutes | 140 | 19.3% |
| 25 to 29 Minutes | 85 | 11.7% |
| 30 to 34 Minutes | 110 | 15.1% |
| 35 to 39 Minutes | 28 | 3.8% |
| 40 to 44 Minutes | 0 | 0.0% |
| 45 to 59 Minutes | 146 | 20.1% |
| 60 to 89 Minutes | 26 | 3.6% |
| 90 or more Minutes | 0 | 0.0% |
Commute Time by Sex in Tellico Village
The most common commute times in Tellico Village are 45 to 59 minutes (116 commuters, 25.5%) for males and 20 to 24 minutes (108 commuters, 39.7%) for females.
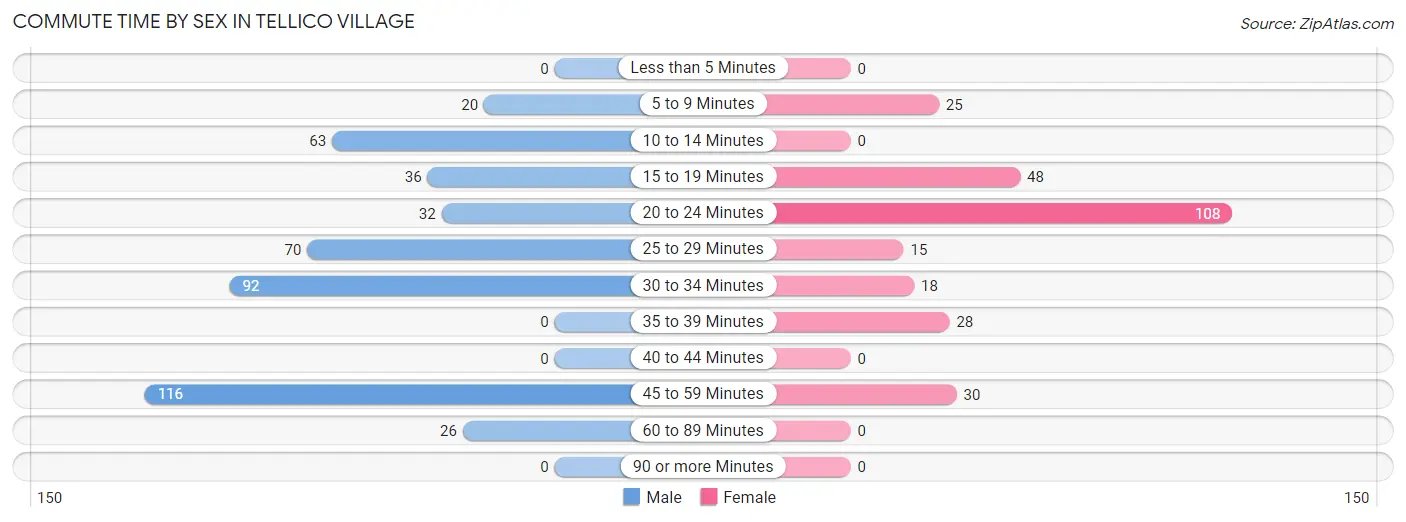
| Commute Time | Male | Female |
| Less than 5 Minutes | 0 (0.0%) | 0 (0.0%) |
| 5 to 9 Minutes | 20 (4.4%) | 25 (9.2%) |
| 10 to 14 Minutes | 63 (13.9%) | 0 (0.0%) |
| 15 to 19 Minutes | 36 (7.9%) | 48 (17.6%) |
| 20 to 24 Minutes | 32 (7.0%) | 108 (39.7%) |
| 25 to 29 Minutes | 70 (15.4%) | 15 (5.5%) |
| 30 to 34 Minutes | 92 (20.2%) | 18 (6.6%) |
| 35 to 39 Minutes | 0 (0.0%) | 28 (10.3%) |
| 40 to 44 Minutes | 0 (0.0%) | 0 (0.0%) |
| 45 to 59 Minutes | 116 (25.5%) | 30 (11.0%) |
| 60 to 89 Minutes | 26 (5.7%) | 0 (0.0%) |
| 90 or more Minutes | 0 (0.0%) | 0 (0.0%) |
Time of Departure to Work by Sex in Tellico Village
The most frequent times of departure to work in Tellico Village are 9:00 AM to 9:59 AM (102, 22.4%) for males and 8:00 AM to 8:29 AM (77, 28.3%) for females.
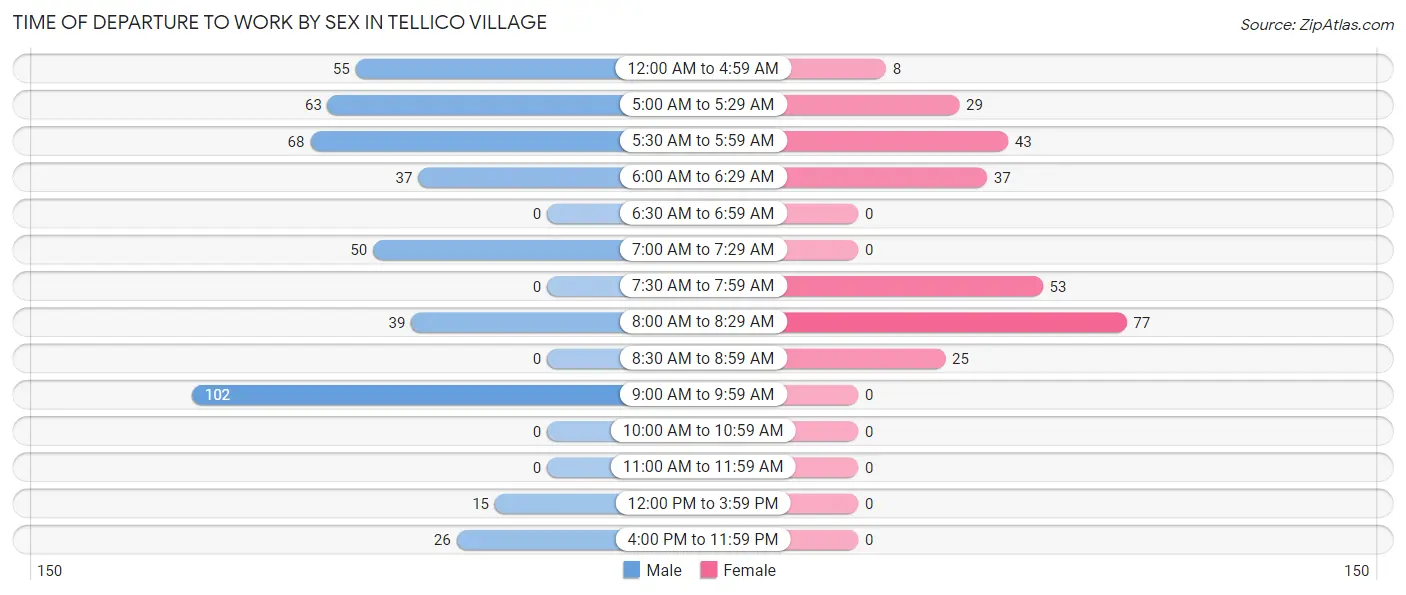
| Time of Departure | Male | Female |
| 12:00 AM to 4:59 AM | 55 (12.1%) | 8 (2.9%) |
| 5:00 AM to 5:29 AM | 63 (13.9%) | 29 (10.7%) |
| 5:30 AM to 5:59 AM | 68 (14.9%) | 43 (15.8%) |
| 6:00 AM to 6:29 AM | 37 (8.1%) | 37 (13.6%) |
| 6:30 AM to 6:59 AM | 0 (0.0%) | 0 (0.0%) |
| 7:00 AM to 7:29 AM | 50 (11.0%) | 0 (0.0%) |
| 7:30 AM to 7:59 AM | 0 (0.0%) | 53 (19.5%) |
| 8:00 AM to 8:29 AM | 39 (8.6%) | 77 (28.3%) |
| 8:30 AM to 8:59 AM | 0 (0.0%) | 25 (9.2%) |
| 9:00 AM to 9:59 AM | 102 (22.4%) | 0 (0.0%) |
| 10:00 AM to 10:59 AM | 0 (0.0%) | 0 (0.0%) |
| 11:00 AM to 11:59 AM | 0 (0.0%) | 0 (0.0%) |
| 12:00 PM to 3:59 PM | 15 (3.3%) | 0 (0.0%) |
| 4:00 PM to 11:59 PM | 26 (5.7%) | 0 (0.0%) |
| Total | 455 (100.0%) | 272 (100.0%) |
Housing Occupancy in Tellico Village
Occupancy by Ownership in Tellico Village
Of the total 3,287 dwellings in Tellico Village, owner-occupied units account for 3,236 (98.5%), while renter-occupied units make up 51 (1.5%).
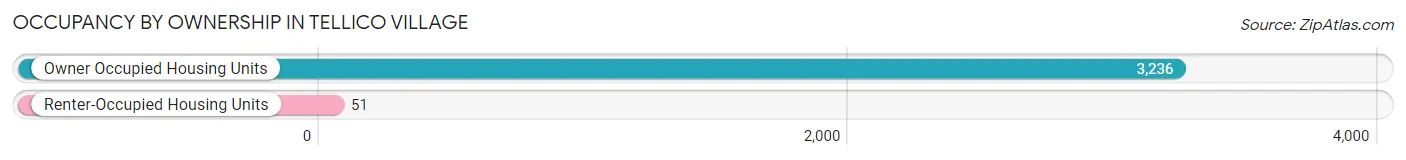
| Occupancy | # Housing Units | % Housing Units |
| Owner Occupied Housing Units | 3,236 | 98.5% |
| Renter-Occupied Housing Units | 51 | 1.5% |
| Total Occupied Housing Units | 3,287 | 100.0% |
Occupancy by Household Size in Tellico Village
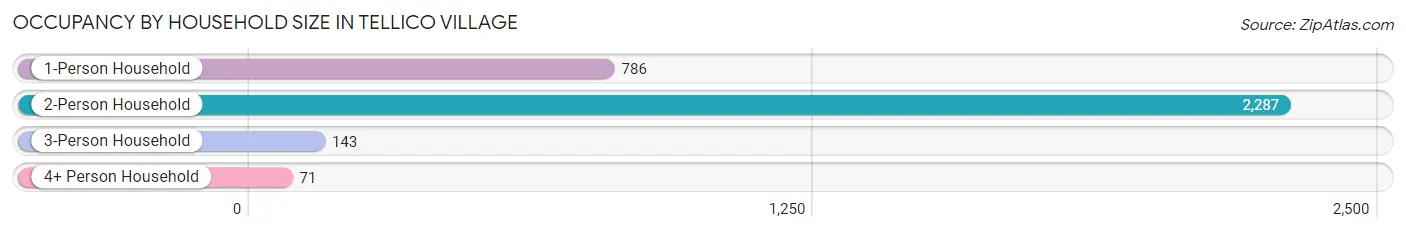
| Household Size | # Housing Units | % Housing Units |
| 1-Person Household | 786 | 23.9% |
| 2-Person Household | 2,287 | 69.6% |
| 3-Person Household | 143 | 4.3% |
| 4+ Person Household | 71 | 2.2% |
| Total Housing Units | 3,287 | 100.0% |
Occupancy by Ownership by Household Size in Tellico Village
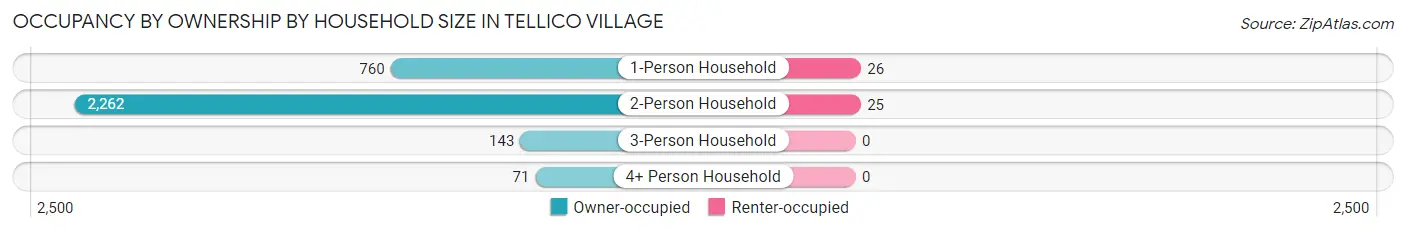
| Household Size | Owner-occupied | Renter-occupied |
| 1-Person Household | 760 (96.7%) | 26 (3.3%) |
| 2-Person Household | 2,262 (98.9%) | 25 (1.1%) |
| 3-Person Household | 143 (100.0%) | 0 (0.0%) |
| 4+ Person Household | 71 (100.0%) | 0 (0.0%) |
| Total Housing Units | 3,236 (98.5%) | 51 (1.5%) |
Occupancy by Educational Attainment in Tellico Village
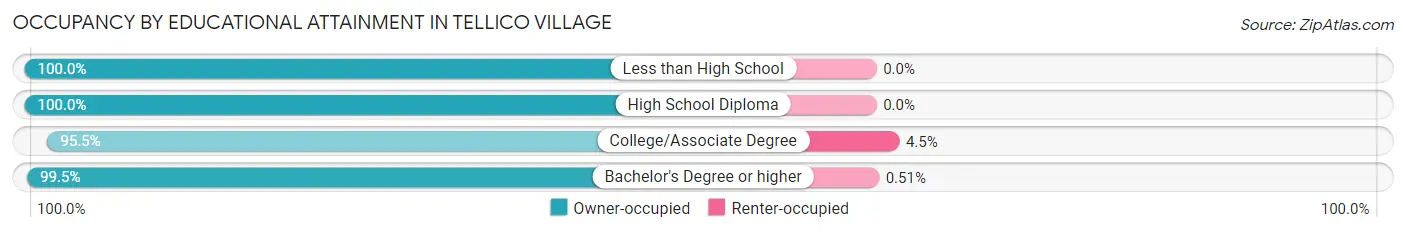
| Household Size | Owner-occupied | Renter-occupied |
| Less than High School | 86 (100.0%) | 0 (0.0%) |
| High School Diploma | 324 (100.0%) | 0 (0.0%) |
| College/Associate Degree | 867 (95.5%) | 41 (4.5%) |
| Bachelor's Degree or higher | 1,959 (99.5%) | 10 (0.5%) |
Occupancy by Age of Householder in Tellico Village
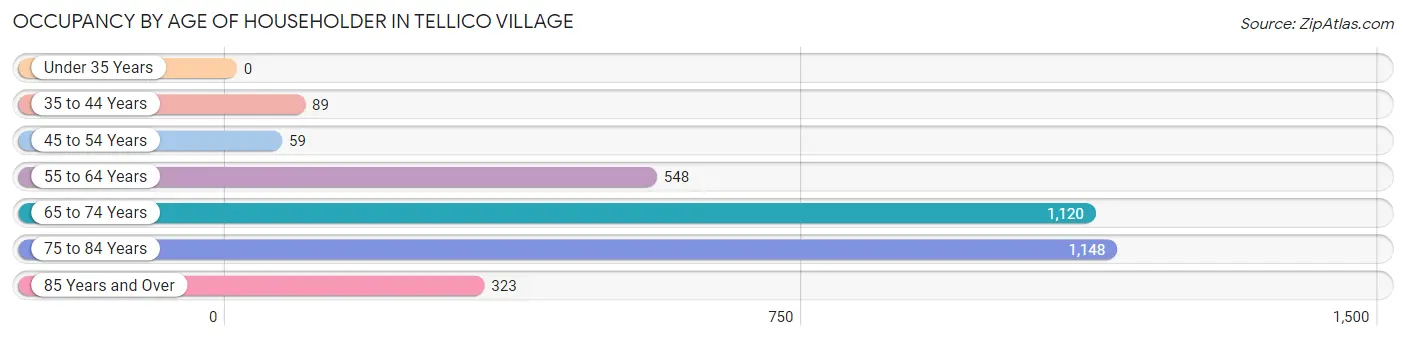
| Age Bracket | # Households | % Households |
| Under 35 Years | 0 | 0.0% |
| 35 to 44 Years | 89 | 2.7% |
| 45 to 54 Years | 59 | 1.8% |
| 55 to 64 Years | 548 | 16.7% |
| 65 to 74 Years | 1,120 | 34.1% |
| 75 to 84 Years | 1,148 | 34.9% |
| 85 Years and Over | 323 | 9.8% |
| Total | 3,287 | 100.0% |
Housing Finances in Tellico Village
Median Income by Occupancy in Tellico Village
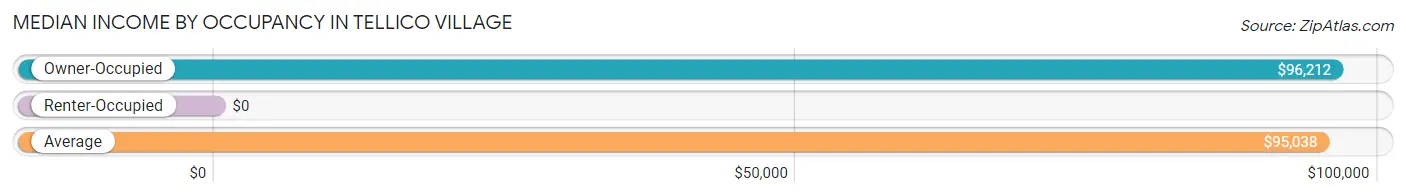
| Occupancy Type | # Households | Median Income |
| Owner-Occupied | 3,236 (98.5%) | $96,212 |
| Renter-Occupied | 51 (1.5%) | $0 |
| Average | 3,287 (100.0%) | $95,038 |
Occupancy by Householder Income Bracket in Tellico Village
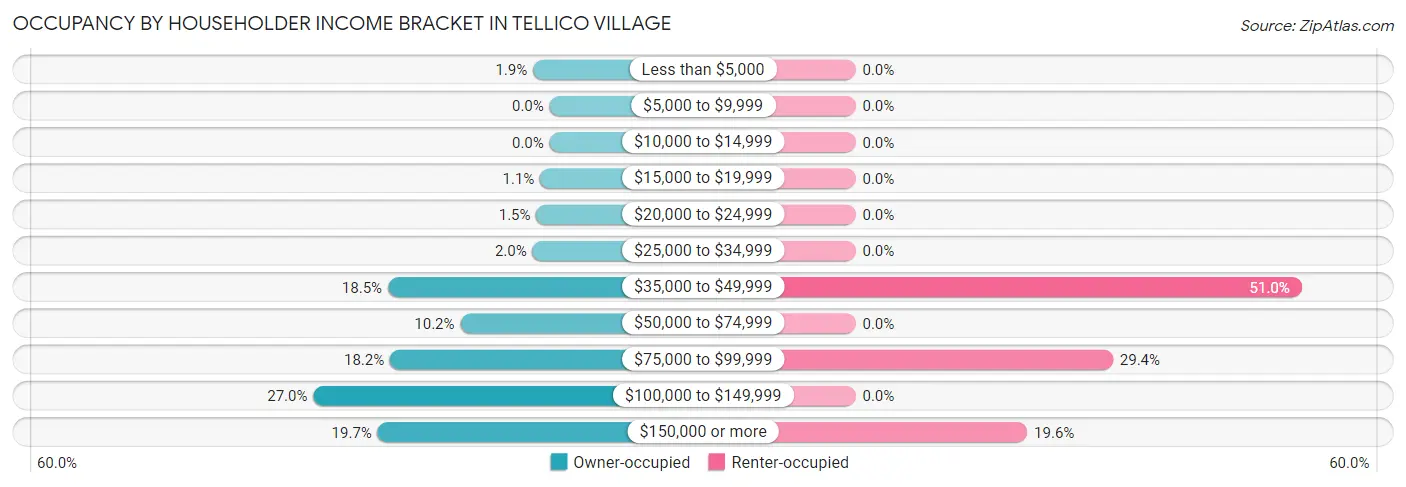
| Income Bracket | Owner-occupied | Renter-occupied |
| Less than $5,000 | 61 (1.9%) | 0 (0.0%) |
| $5,000 to $9,999 | 0 (0.0%) | 0 (0.0%) |
| $10,000 to $14,999 | 0 (0.0%) | 0 (0.0%) |
| $15,000 to $19,999 | 35 (1.1%) | 0 (0.0%) |
| $20,000 to $24,999 | 49 (1.5%) | 0 (0.0%) |
| $25,000 to $34,999 | 63 (1.9%) | 0 (0.0%) |
| $35,000 to $49,999 | 598 (18.5%) | 26 (51.0%) |
| $50,000 to $74,999 | 330 (10.2%) | 0 (0.0%) |
| $75,000 to $99,999 | 590 (18.2%) | 15 (29.4%) |
| $100,000 to $149,999 | 874 (27.0%) | 0 (0.0%) |
| $150,000 or more | 636 (19.7%) | 10 (19.6%) |
| Total | 3,236 (100.0%) | 51 (100.0%) |
Monthly Housing Cost Tiers in Tellico Village
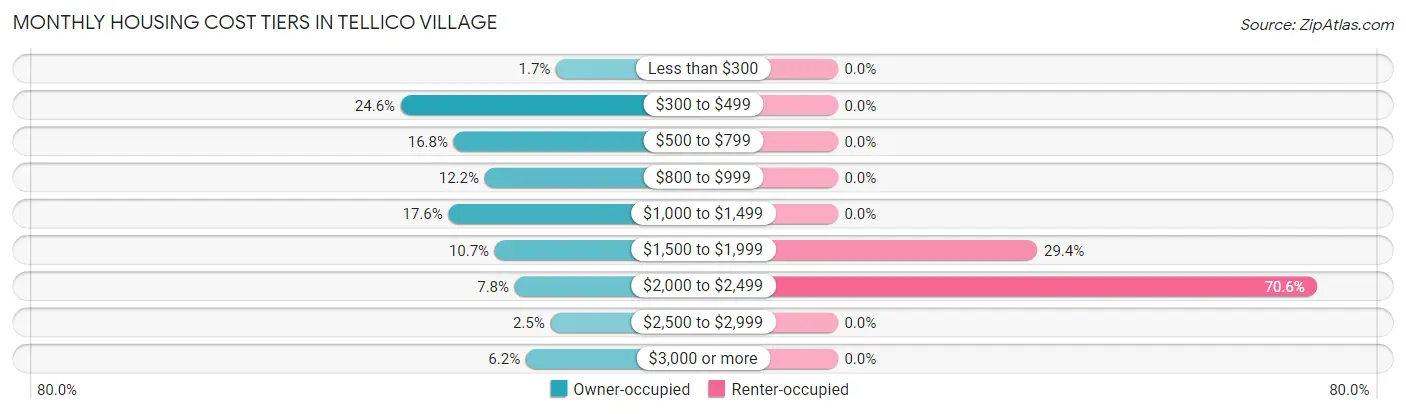
| Monthly Cost | Owner-occupied | Renter-occupied |
| Less than $300 | 55 (1.7%) | 0 (0.0%) |
| $300 to $499 | 795 (24.6%) | 0 (0.0%) |
| $500 to $799 | 543 (16.8%) | 0 (0.0%) |
| $800 to $999 | 395 (12.2%) | 0 (0.0%) |
| $1,000 to $1,499 | 568 (17.5%) | 0 (0.0%) |
| $1,500 to $1,999 | 347 (10.7%) | 15 (29.4%) |
| $2,000 to $2,499 | 252 (7.8%) | 36 (70.6%) |
| $2,500 to $2,999 | 82 (2.5%) | 0 (0.0%) |
| $3,000 or more | 199 (6.1%) | 0 (0.0%) |
| Total | 3,236 (100.0%) | 51 (100.0%) |
Physical Housing Characteristics in Tellico Village
Housing Structures in Tellico Village
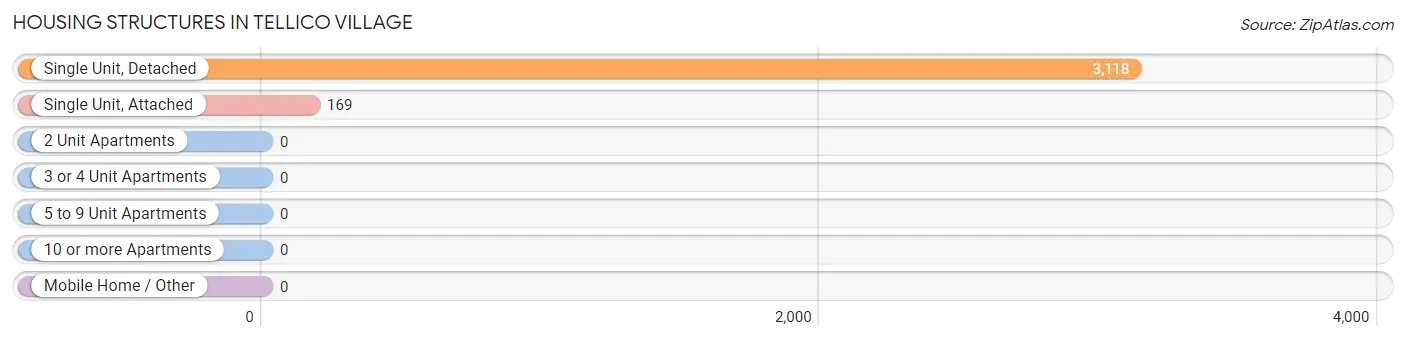
| Structure Type | # Housing Units | % Housing Units |
| Single Unit, Detached | 3,118 | 94.9% |
| Single Unit, Attached | 169 | 5.1% |
| 2 Unit Apartments | 0 | 0.0% |
| 3 or 4 Unit Apartments | 0 | 0.0% |
| 5 to 9 Unit Apartments | 0 | 0.0% |
| 10 or more Apartments | 0 | 0.0% |
| Mobile Home / Other | 0 | 0.0% |
| Total | 3,287 | 100.0% |
Housing Structures by Occupancy in Tellico Village
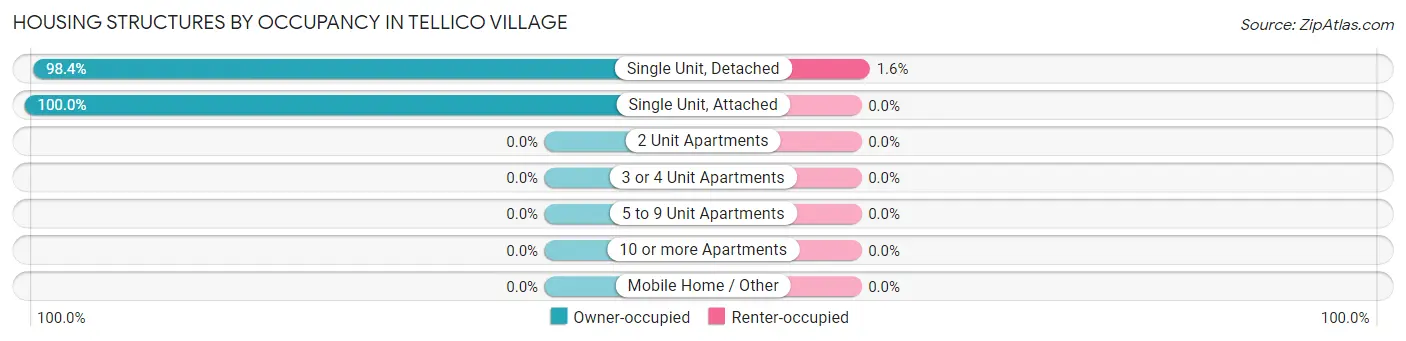
| Structure Type | Owner-occupied | Renter-occupied |
| Single Unit, Detached | 3,067 (98.4%) | 51 (1.6%) |
| Single Unit, Attached | 169 (100.0%) | 0 (0.0%) |
| 2 Unit Apartments | 0 (0.0%) | 0 (0.0%) |
| 3 or 4 Unit Apartments | 0 (0.0%) | 0 (0.0%) |
| 5 to 9 Unit Apartments | 0 (0.0%) | 0 (0.0%) |
| 10 or more Apartments | 0 (0.0%) | 0 (0.0%) |
| Mobile Home / Other | 0 (0.0%) | 0 (0.0%) |
| Total | 3,236 (98.5%) | 51 (1.5%) |
Housing Structures by Number of Rooms in Tellico Village
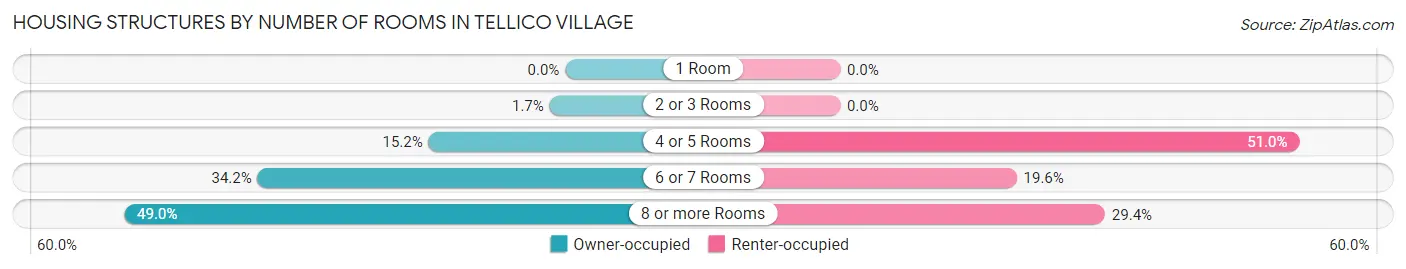
| Number of Rooms | Owner-occupied | Renter-occupied |
| 1 Room | 0 (0.0%) | 0 (0.0%) |
| 2 or 3 Rooms | 56 (1.7%) | 0 (0.0%) |
| 4 or 5 Rooms | 491 (15.2%) | 26 (51.0%) |
| 6 or 7 Rooms | 1,105 (34.2%) | 10 (19.6%) |
| 8 or more Rooms | 1,584 (48.9%) | 15 (29.4%) |
| Total | 3,236 (100.0%) | 51 (100.0%) |
Housing Structure by Heating Type in Tellico Village
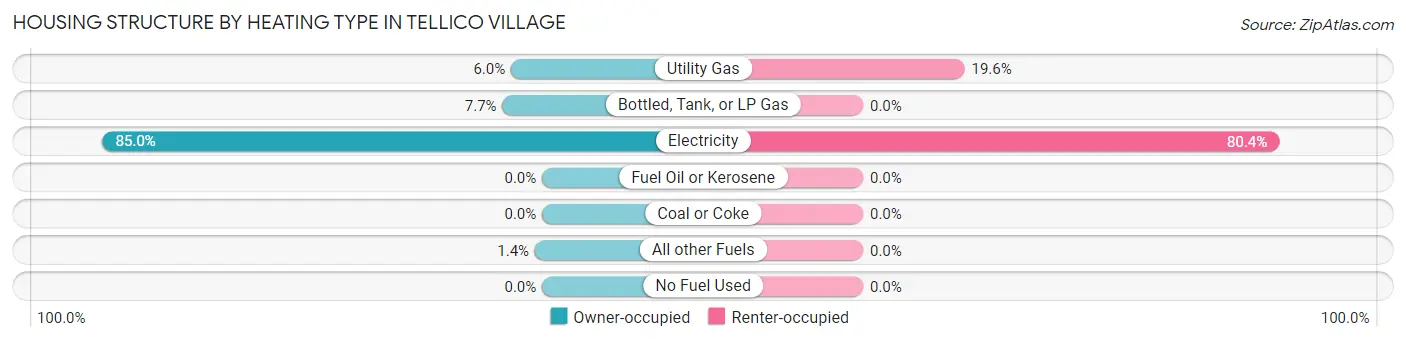
| Heating Type | Owner-occupied | Renter-occupied |
| Utility Gas | 194 (6.0%) | 10 (19.6%) |
| Bottled, Tank, or LP Gas | 248 (7.7%) | 0 (0.0%) |
| Electricity | 2,749 (85.0%) | 41 (80.4%) |
| Fuel Oil or Kerosene | 0 (0.0%) | 0 (0.0%) |
| Coal or Coke | 0 (0.0%) | 0 (0.0%) |
| All other Fuels | 45 (1.4%) | 0 (0.0%) |
| No Fuel Used | 0 (0.0%) | 0 (0.0%) |
| Total | 3,236 (100.0%) | 51 (100.0%) |
Household Vehicle Usage in Tellico Village
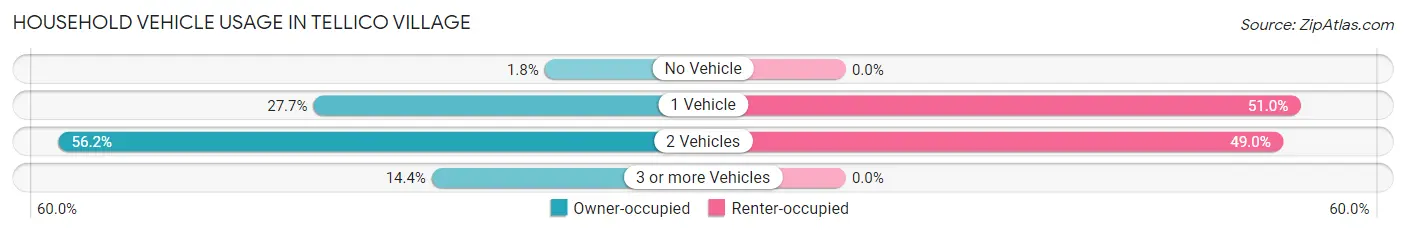
| Vehicles per Household | Owner-occupied | Renter-occupied |
| No Vehicle | 57 (1.8%) | 0 (0.0%) |
| 1 Vehicle | 895 (27.7%) | 26 (51.0%) |
| 2 Vehicles | 1,818 (56.2%) | 25 (49.0%) |
| 3 or more Vehicles | 466 (14.4%) | 0 (0.0%) |
| Total | 3,236 (100.0%) | 51 (100.0%) |
Real Estate & Mortgages in Tellico Village
Real Estate and Mortgage Overview in Tellico Village
| Characteristic | Without Mortgage | With Mortgage |
| Housing Units | 1,851 | 1,385 |
| Median Property Value | $445,700 | $472,500 |
| Median Household Income | $77,478 | $352 |
| Monthly Housing Costs | $528 | $161 |
| Real Estate Taxes | $1,790 | $0 |
Property Value by Mortgage Status in Tellico Village
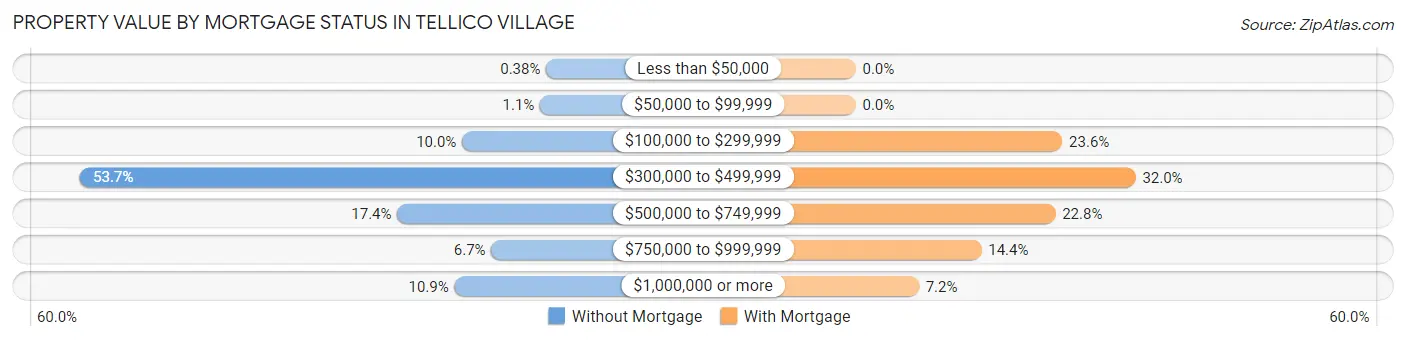
| Property Value | Without Mortgage | With Mortgage |
| Less than $50,000 | 7 (0.4%) | 0 (0.0%) |
| $50,000 to $99,999 | 20 (1.1%) | 0 (0.0%) |
| $100,000 to $299,999 | 185 (10.0%) | 327 (23.6%) |
| $300,000 to $499,999 | 993 (53.6%) | 443 (32.0%) |
| $500,000 to $749,999 | 322 (17.4%) | 316 (22.8%) |
| $750,000 to $999,999 | 123 (6.7%) | 199 (14.4%) |
| $1,000,000 or more | 201 (10.9%) | 100 (7.2%) |
| Total | 1,851 (100.0%) | 1,385 (100.0%) |
Household Income by Mortgage Status in Tellico Village
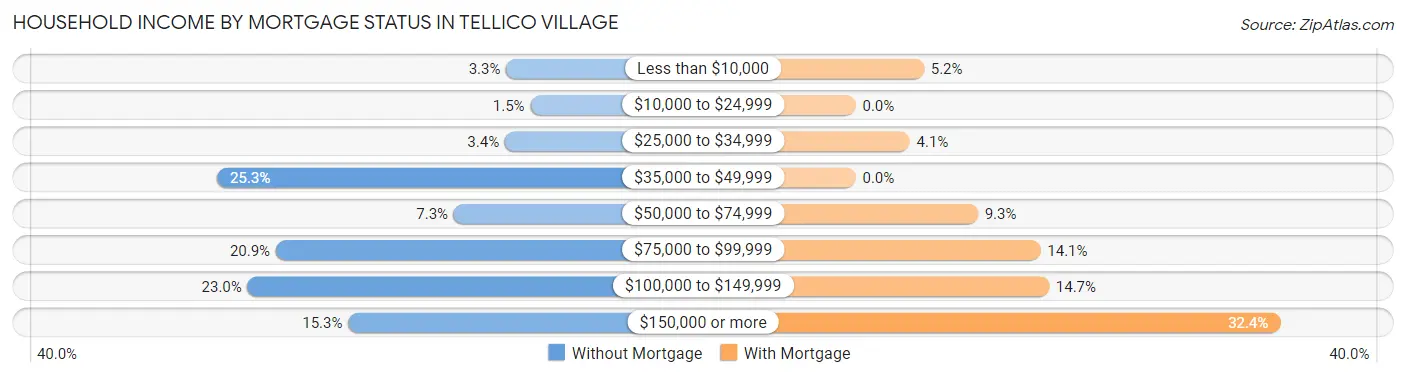
| Household Income | Without Mortgage | With Mortgage |
| Less than $10,000 | 61 (3.3%) | 72 (5.2%) |
| $10,000 to $24,999 | 27 (1.5%) | 0 (0.0%) |
| $25,000 to $34,999 | 63 (3.4%) | 57 (4.1%) |
| $35,000 to $49,999 | 469 (25.3%) | 0 (0.0%) |
| $50,000 to $74,999 | 135 (7.3%) | 129 (9.3%) |
| $75,000 to $99,999 | 386 (20.8%) | 195 (14.1%) |
| $100,000 to $149,999 | 426 (23.0%) | 204 (14.7%) |
| $150,000 or more | 284 (15.3%) | 448 (32.4%) |
| Total | 1,851 (100.0%) | 1,385 (100.0%) |
Property Value to Household Income Ratio in Tellico Village
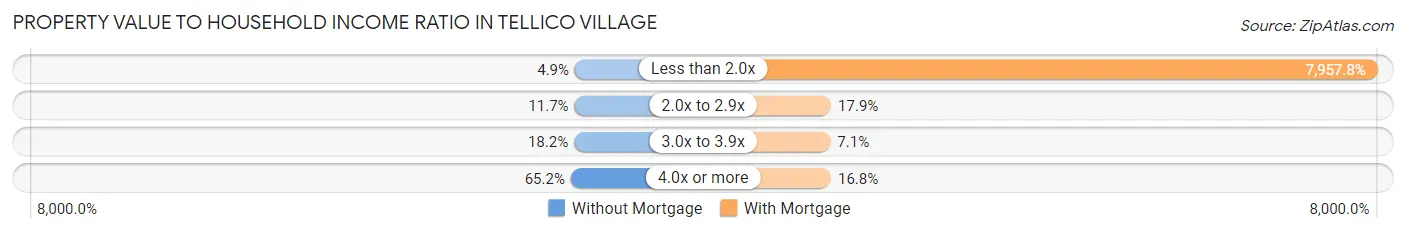
| Value-to-Income Ratio | Without Mortgage | With Mortgage |
| Less than 2.0x | 90 (4.9%) | 110,216 (7,957.8%) |
| 2.0x to 2.9x | 217 (11.7%) | 248 (17.9%) |
| 3.0x to 3.9x | 337 (18.2%) | 98 (7.1%) |
| 4.0x or more | 1,207 (65.2%) | 233 (16.8%) |
| Total | 1,851 (100.0%) | 1,385 (100.0%) |
Real Estate Taxes by Mortgage Status in Tellico Village

| Property Taxes | Without Mortgage | With Mortgage |
| Less than $800 | 150 (8.1%) | 0 (0.0%) |
| $800 to $1,499 | 533 (28.8%) | 57 (4.1%) |
| $800 to $1,499 | 1,140 (61.6%) | 379 (27.4%) |
| Total | 1,851 (100.0%) | 1,385 (100.0%) |
Health & Disability in Tellico Village
Health Insurance Coverage by Age in Tellico Village
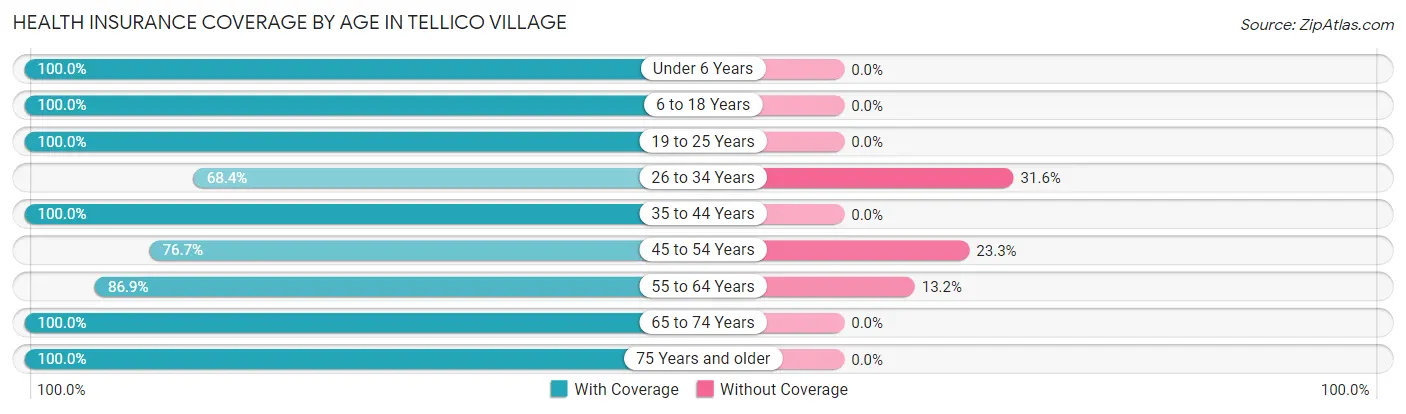
| Age Bracket | With Coverage | Without Coverage |
| Under 6 Years | 35 (100.0%) | 0 (0.0%) |
| 6 to 18 Years | 125 (100.0%) | 0 (0.0%) |
| 19 to 25 Years | 117 (100.0%) | 0 (0.0%) |
| 26 to 34 Years | 13 (68.4%) | 6 (31.6%) |
| 35 to 44 Years | 239 (100.0%) | 0 (0.0%) |
| 45 to 54 Years | 115 (76.7%) | 35 (23.3%) |
| 55 to 64 Years | 984 (86.9%) | 149 (13.2%) |
| 65 to 74 Years | 2,023 (100.0%) | 0 (0.0%) |
| 75 Years and older | 2,369 (100.0%) | 0 (0.0%) |
| Total | 6,020 (96.9%) | 190 (3.1%) |
Health Insurance Coverage by Citizenship Status in Tellico Village

| Citizenship Status | With Coverage | Without Coverage |
| Native Born | 35 (100.0%) | 0 (0.0%) |
| Foreign Born, Citizen | 125 (100.0%) | 0 (0.0%) |
| Foreign Born, not a Citizen | 117 (100.0%) | 0 (0.0%) |
Health Insurance Coverage by Household Income in Tellico Village
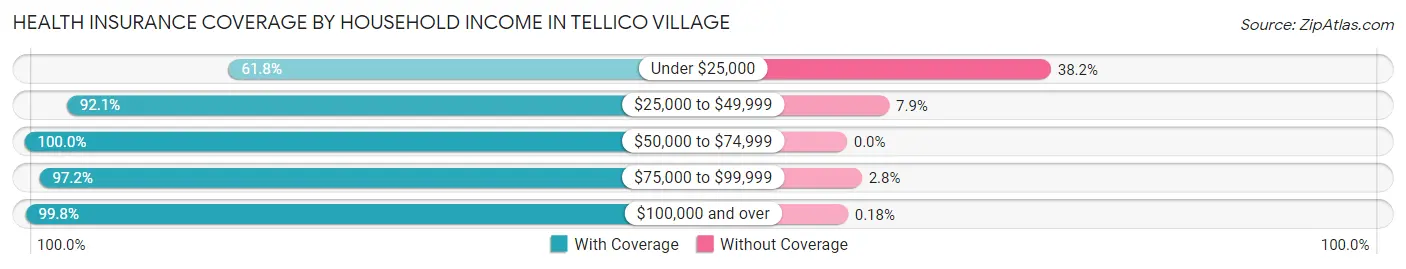
| Household Income | With Coverage | Without Coverage |
| Under $25,000 | 118 (61.8%) | 73 (38.2%) |
| $25,000 to $49,999 | 941 (92.1%) | 81 (7.9%) |
| $50,000 to $74,999 | 662 (100.0%) | 0 (0.0%) |
| $75,000 to $99,999 | 1,043 (97.2%) | 30 (2.8%) |
| $100,000 and over | 3,246 (99.8%) | 6 (0.2%) |
Public vs Private Health Insurance Coverage by Age in Tellico Village
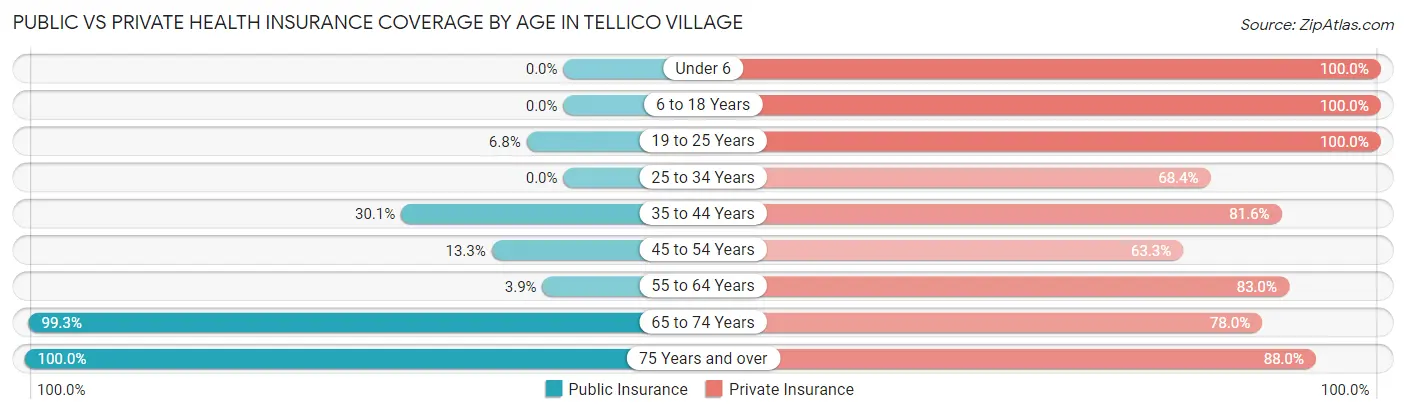
| Age Bracket | Public Insurance | Private Insurance |
| Under 6 | 0 (0.0%) | 35 (100.0%) |
| 6 to 18 Years | 0 (0.0%) | 125 (100.0%) |
| 19 to 25 Years | 8 (6.8%) | 117 (100.0%) |
| 25 to 34 Years | 0 (0.0%) | 13 (68.4%) |
| 35 to 44 Years | 72 (30.1%) | 195 (81.6%) |
| 45 to 54 Years | 20 (13.3%) | 95 (63.3%) |
| 55 to 64 Years | 44 (3.9%) | 940 (83.0%) |
| 65 to 74 Years | 2,008 (99.3%) | 1,578 (78.0%) |
| 75 Years and over | 2,369 (100.0%) | 2,084 (88.0%) |
| Total | 4,521 (72.8%) | 5,182 (83.5%) |
Disability Status by Sex by Age in Tellico Village
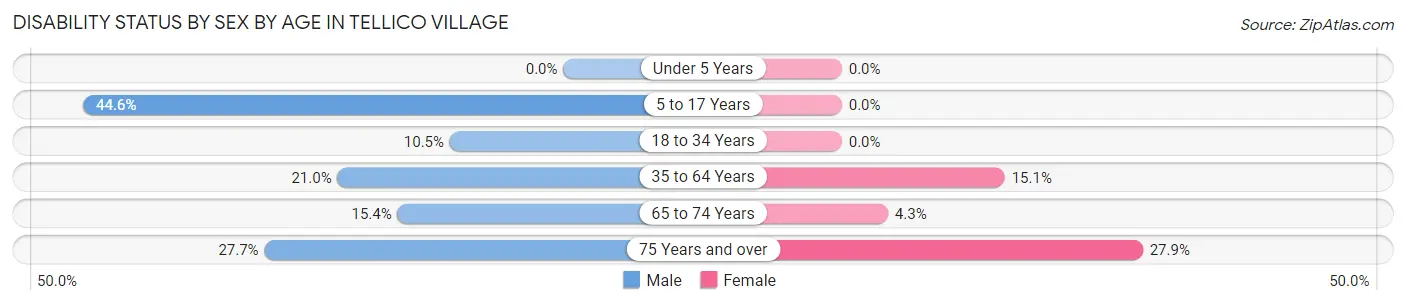
| Age Bracket | Male | Female |
| Under 5 Years | 0 (0.0%) | 0 (0.0%) |
| 5 to 17 Years | 41 (44.6%) | 0 (0.0%) |
| 18 to 34 Years | 8 (10.5%) | 0 (0.0%) |
| 35 to 64 Years | 161 (21.0%) | 114 (15.1%) |
| 65 to 74 Years | 135 (15.4%) | 49 (4.3%) |
| 75 Years and over | 385 (27.7%) | 274 (27.9%) |
Disability Class by Sex by Age in Tellico Village
Disability Class: Hearing Difficulty
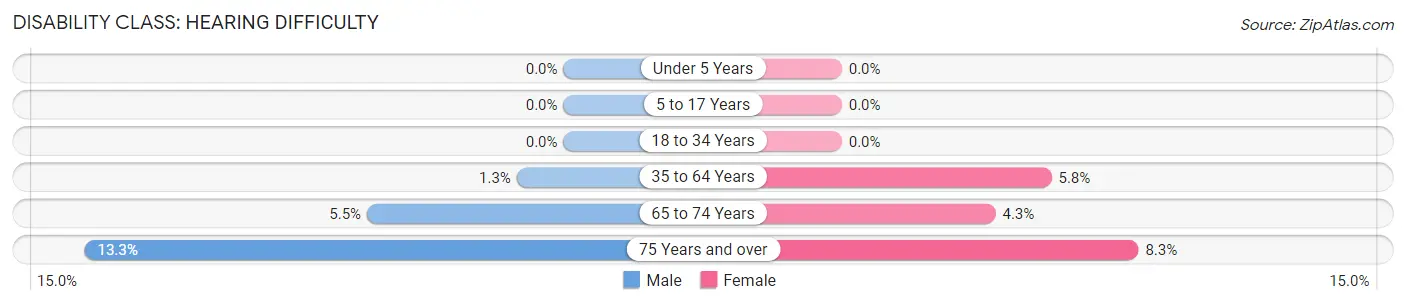
| Age Bracket | Male | Female |
| Under 5 Years | 0 (0.0%) | 0 (0.0%) |
| 5 to 17 Years | 0 (0.0%) | 0 (0.0%) |
| 18 to 34 Years | 0 (0.0%) | 0 (0.0%) |
| 35 to 64 Years | 10 (1.3%) | 44 (5.8%) |
| 65 to 74 Years | 48 (5.5%) | 49 (4.3%) |
| 75 Years and over | 185 (13.3%) | 81 (8.3%) |
Disability Class: Vision Difficulty
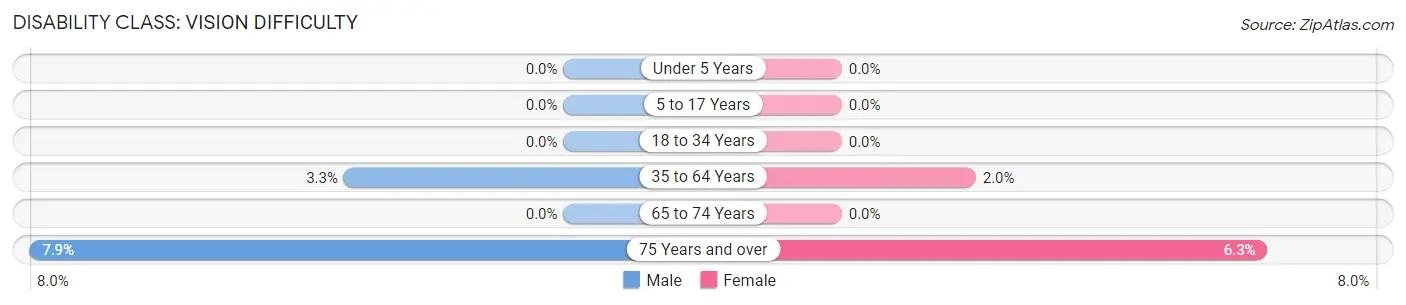
| Age Bracket | Male | Female |
| Under 5 Years | 0 (0.0%) | 0 (0.0%) |
| 5 to 17 Years | 0 (0.0%) | 0 (0.0%) |
| 18 to 34 Years | 0 (0.0%) | 0 (0.0%) |
| 35 to 64 Years | 25 (3.3%) | 15 (2.0%) |
| 65 to 74 Years | 0 (0.0%) | 0 (0.0%) |
| 75 Years and over | 110 (7.9%) | 62 (6.3%) |
Disability Class: Cognitive Difficulty
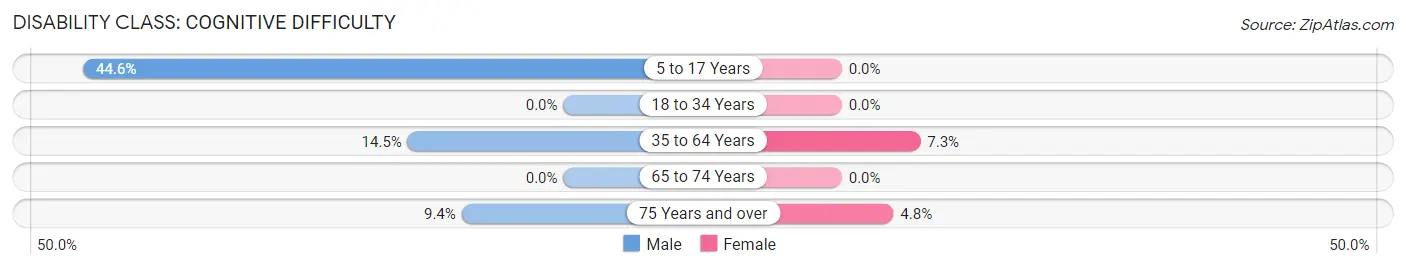
| Age Bracket | Male | Female |
| 5 to 17 Years | 41 (44.6%) | 0 (0.0%) |
| 18 to 34 Years | 0 (0.0%) | 0 (0.0%) |
| 35 to 64 Years | 111 (14.4%) | 55 (7.3%) |
| 65 to 74 Years | 0 (0.0%) | 0 (0.0%) |
| 75 Years and over | 131 (9.4%) | 47 (4.8%) |
Disability Class: Ambulatory Difficulty
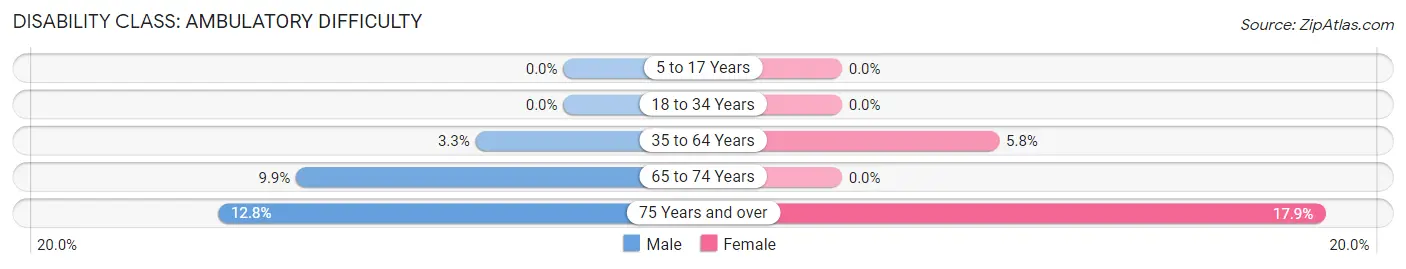
| Age Bracket | Male | Female |
| 5 to 17 Years | 0 (0.0%) | 0 (0.0%) |
| 18 to 34 Years | 0 (0.0%) | 0 (0.0%) |
| 35 to 64 Years | 25 (3.3%) | 44 (5.8%) |
| 65 to 74 Years | 87 (9.9%) | 0 (0.0%) |
| 75 Years and over | 178 (12.8%) | 176 (17.9%) |
Disability Class: Self-Care Difficulty
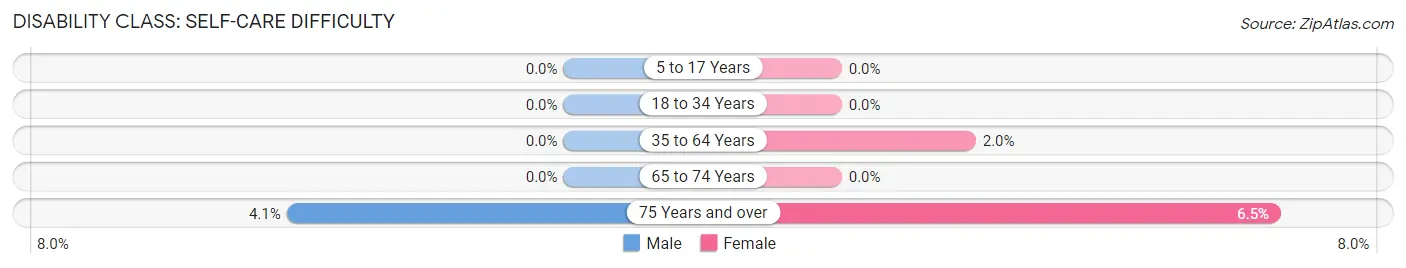
| Age Bracket | Male | Female |
| 5 to 17 Years | 0 (0.0%) | 0 (0.0%) |
| 18 to 34 Years | 0 (0.0%) | 0 (0.0%) |
| 35 to 64 Years | 0 (0.0%) | 15 (2.0%) |
| 65 to 74 Years | 0 (0.0%) | 0 (0.0%) |
| 75 Years and over | 57 (4.1%) | 64 (6.5%) |
Technology Access in Tellico Village
Computing Device Access in Tellico Village

| Device Type | # Households | % Households |
| Desktop or Laptop | 3,167 | 96.4% |
| Smartphone | 2,888 | 87.9% |
| Tablet | 2,388 | 72.7% |
| No Computing Device | 0 | 0.0% |
| Total | 3,287 | 100.0% |
Internet Access in Tellico Village
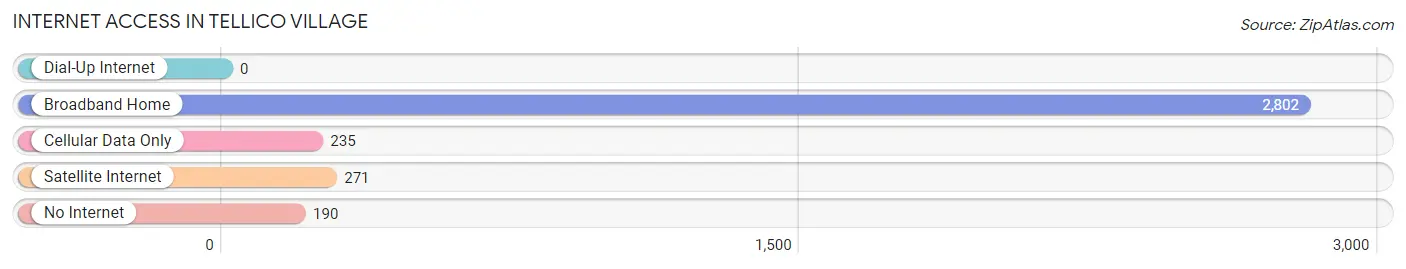
| Internet Type | # Households | % Households |
| Dial-Up Internet | 0 | 0.0% |
| Broadband Home | 2,802 | 85.2% |
| Cellular Data Only | 235 | 7.1% |
| Satellite Internet | 271 | 8.2% |
| No Internet | 190 | 5.8% |
| Total | 3,287 | 100.0% |
Tellico Village Summary
History
Tellico Village is a planned community located in Loudon County, Tennessee, on the shores of Tellico Lake. The community was founded in 1986 by the Tellico Village Development Corporation, a subsidiary of the Tennessee Valley Authority (TVA). The community was designed to provide a high quality of life for its residents, with a focus on outdoor recreation, natural beauty, and a strong sense of community.
The area that is now Tellico Village was originally inhabited by the Cherokee Indians. The Cherokee were forcibly removed from the area in the 1830s as part of the Indian Removal Act. The area was then settled by European-American settlers in the late 19th century. The area was known as “Tellico Plains” and was home to a small farming community.
In the early 20th century, the Tennessee Valley Authority (TVA) began to develop the area for hydroelectric power. The TVA built the Tellico Dam in 1979, creating Tellico Lake. The TVA then began to develop the area around the lake as a planned community. The Tellico Village Development Corporation was formed in 1986 to oversee the development of the community.
The community was designed to provide a high quality of life for its residents, with a focus on outdoor recreation, natural beauty, and a strong sense of community. The community was designed to be a self-contained community, with its own schools, shopping centers, and recreational facilities.
Geography
Tellico Village is located in Loudon County, Tennessee, on the shores of Tellico Lake. The community is situated in the foothills of the Great Smoky Mountains, and is surrounded by the Cherokee National Forest. The area is known for its natural beauty, with rolling hills, lush forests, and crystal clear lakes.
The climate in Tellico Village is mild, with hot summers and cool winters. The average temperature in the summer is around 80 degrees Fahrenheit, and the average temperature in the winter is around 40 degrees Fahrenheit.
Economy
The economy of Tellico Village is largely based on tourism and retirement. The community is home to several resorts and golf courses, which attract visitors from all over the country. The community is also home to several retirement communities, which attract retirees from all over the country.
The community is also home to several small businesses, including restaurants, retail stores, and professional services. The community is also home to several manufacturing companies, which produce a variety of products, including furniture, clothing, and electronics.
Demographics
As of the 2010 census, the population of Tellico Village was 8,845. The population is largely white (93.3%), with a small percentage of African Americans (3.2%) and Hispanics (2.2%). The median household income in the community is $63,945, and the median home value is $269,000.
The community is home to several churches, including Baptist, Methodist, Presbyterian, and Catholic. The community is also home to several schools, including Tellico Elementary School, Tellico Middle School, and Tellico High School.
Conclusion
Tellico Village is a planned community located in Loudon County, Tennessee, on the shores of Tellico Lake. The community was founded in 1986 by the Tellico Village Development Corporation, a subsidiary of the Tennessee Valley Authority (TVA). The community was designed to provide a high quality of life for its residents, with a focus on outdoor recreation, natural beauty, and a strong sense of community. The economy of Tellico Village is largely based on tourism and retirement, and the population is largely white. The community is home to several churches, schools, and small businesses, and is known for its natural beauty and outdoor recreation opportunities.
Common Questions
What is the Total Population of Tellico Village?
Total Population of Tellico Village is 6,224.
What is the Total Male Population of Tellico Village?
Total Male Population of Tellico Village is 3,235.
What is the Total Female Population of Tellico Village?
Total Female Population of Tellico Village is 2,989.
What is the Ratio of Males per 100 Females in Tellico Village?
There are 108.23 Males per 100 Females in Tellico Village.
What is the Ratio of Females per 100 Males in Tellico Village?
There are 92.40 Females per 100 Males in Tellico Village.
What is the Median Population Age in Tellico Village?
Median Population Age in Tellico Village is 71.4 Years.
What is the Average Family Size in Tellico Village
Average Family Size in Tellico Village is 2.2 People.
What is the Average Household Size in Tellico Village
Average Household Size in Tellico Village is 1.9 People.
What is Per Capita Income in Tellico Village?
Per Capita income in Tellico Village is $64,527.
What is the Median Family Income in Tellico Village?
Median Family Income in Tellico Village is $107,349.
What is the Median Household income in Tellico Village?
Median Household Income in Tellico Village is $95,038.
What is Income or Wage Gap in Tellico Village?
Income or Wage Gap in Tellico Village is 49.1%.
Women in Tellico Village earn 50.9 cents for every dollar earned by a man.
What is Inequality or Gini Index in Tellico Village?
Inequality or Gini Index in Tellico Village is 0.40.
How Large is the Labor Force in Tellico Village?
There are 1,013 People in the Labor Forcein in Tellico Village.
What is the Percentage of People in the Labor Force in Tellico Village?
16.7% of People are in the Labor Force in Tellico Village.
What is the Unemployment Rate in Tellico Village?
Unemployment Rate in Tellico Village is 2.0%.