Spurgeon, TN
Spurgeon Map
Spurgeon Overview
4,006
TOTAL POPULATION
1,897
MALE POPULATION
2,109
FEMALE POPULATION
89.95
MALES / 100 FEMALES
111.18
FEMALES / 100 MALES
44.1
MEDIAN AGE
3.1
AVG FAMILY SIZE
2.2
AVG HOUSEHOLD SIZE
$37,100
PER CAPITA INCOME
$80,337
AVG FAMILY INCOME
$73,002
AVG HOUSEHOLD INCOME
33.7%
WAGE / INCOME GAP [ % ]
66.3¢/ $1
WAGE / INCOME GAP [ $ ]
0.42
INEQUALITY / GINI INDEX
1,949
LABOR FORCE [ PEOPLE ]
56.8%
PERCENT IN LABOR FORCE
0.8%
UNEMPLOYMENT RATE
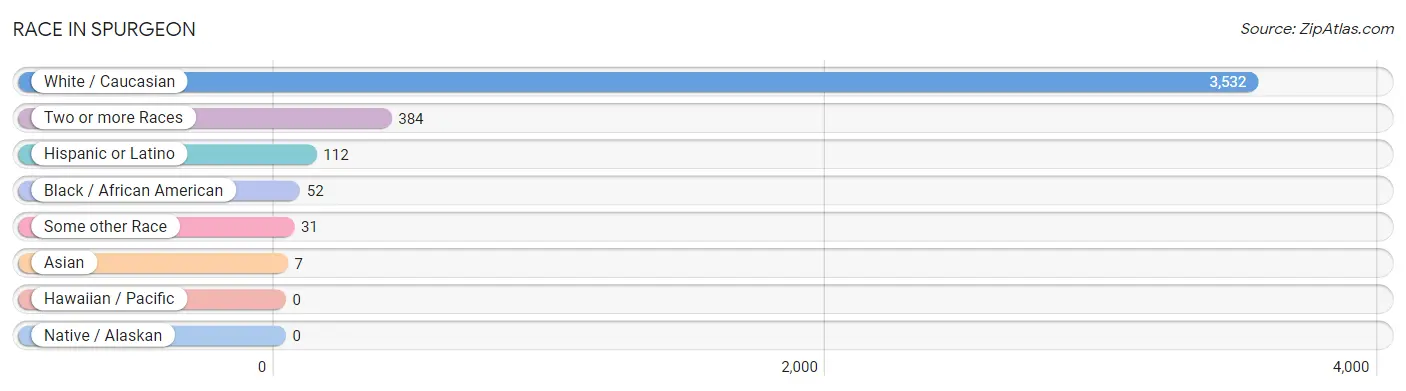
Race in Spurgeon
The most populous races in Spurgeon are White / Caucasian (3,532 | 88.2%), Two or more Races (384 | 9.6%), and Hispanic or Latino (112 | 2.8%).
| Race | # Population | % Population |
| Asian | 7 | 0.2% |
| Black / African American | 52 | 1.3% |
| Hawaiian / Pacific | 0 | 0.0% |
| Hispanic or Latino | 112 | 2.8% |
| Native / Alaskan | 0 | 0.0% |
| White / Caucasian | 3,532 | 88.2% |
| Two or more Races | 384 | 9.6% |
| Some other Race | 31 | 0.8% |
| Total | 4,006 | 100.0% |
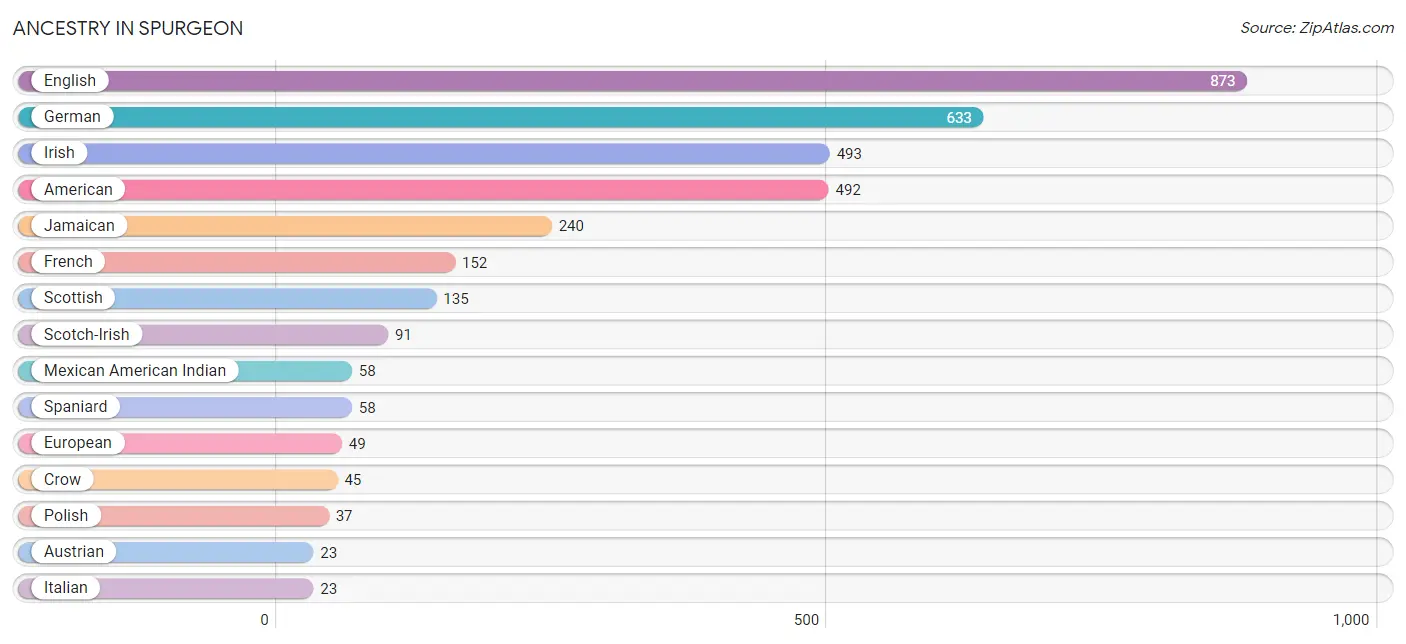
Ancestry in Spurgeon
The most populous ancestries reported in Spurgeon are English (873 | 21.8%), German (633 | 15.8%), Irish (493 | 12.3%), American (492 | 12.3%), and Jamaican (240 | 6.0%), together accounting for 68.2% of all Spurgeon residents.
| Ancestry | # Population | % Population |
| American | 492 | 12.3% |
| Austrian | 23 | 0.6% |
| British | 9 | 0.2% |
| Burmese | 7 | 0.2% |
| Cherokee | 4 | 0.1% |
| Crow | 45 | 1.1% |
| Cuban | 9 | 0.2% |
| English | 873 | 21.8% |
| European | 49 | 1.2% |
| French | 152 | 3.8% |
| German | 633 | 15.8% |
| Greek | 9 | 0.2% |
| Irish | 493 | 12.3% |
| Italian | 23 | 0.6% |
| Jamaican | 240 | 6.0% |
| Mexican | 23 | 0.6% |
| Mexican American Indian | 58 | 1.5% |
| Northern European | 14 | 0.4% |
| Norwegian | 10 | 0.3% |
| Polish | 37 | 0.9% |
| Puerto Rican | 22 | 0.5% |
| Scotch-Irish | 91 | 2.3% |
| Scottish | 135 | 3.4% |
| Spaniard | 58 | 1.5% |
| Welsh | 5 | 0.1% | View All 25 Rows |
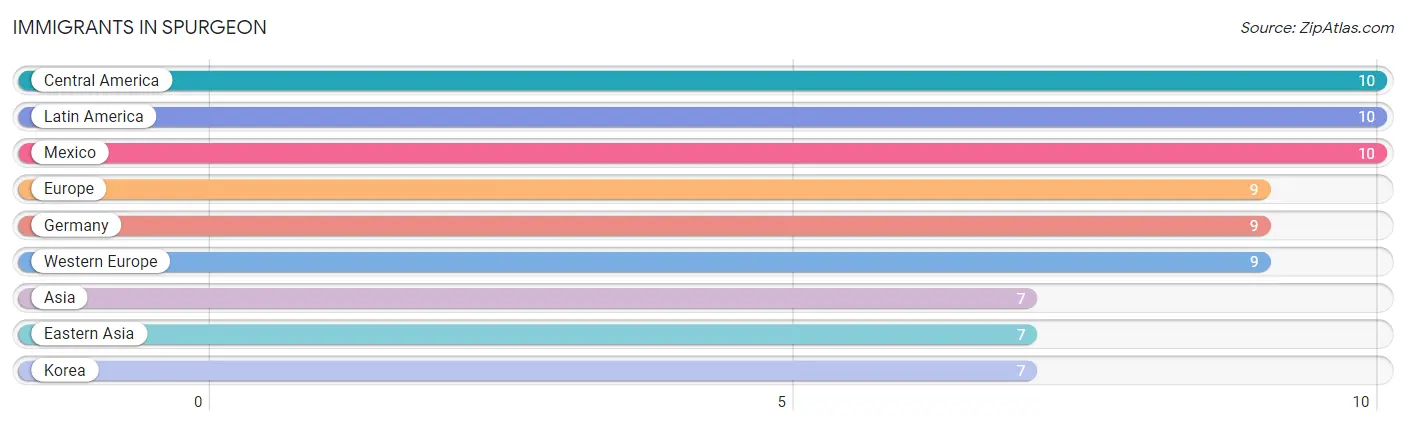
Immigrants in Spurgeon
The most numerous immigrant groups reported in Spurgeon came from Central America (10 | 0.3%), Latin America (10 | 0.3%), Mexico (10 | 0.3%), Europe (9 | 0.2%), and Germany (9 | 0.2%), together accounting for 1.2% of all Spurgeon residents.
| Immigration Origin | # Population | % Population |
| Asia | 7 | 0.2% |
| Central America | 10 | 0.3% |
| Eastern Asia | 7 | 0.2% |
| Europe | 9 | 0.2% |
| Germany | 9 | 0.2% |
| Korea | 7 | 0.2% |
| Latin America | 10 | 0.3% |
| Mexico | 10 | 0.3% |
| Western Europe | 9 | 0.2% | View All 9 Rows |
Sex and Age in Spurgeon
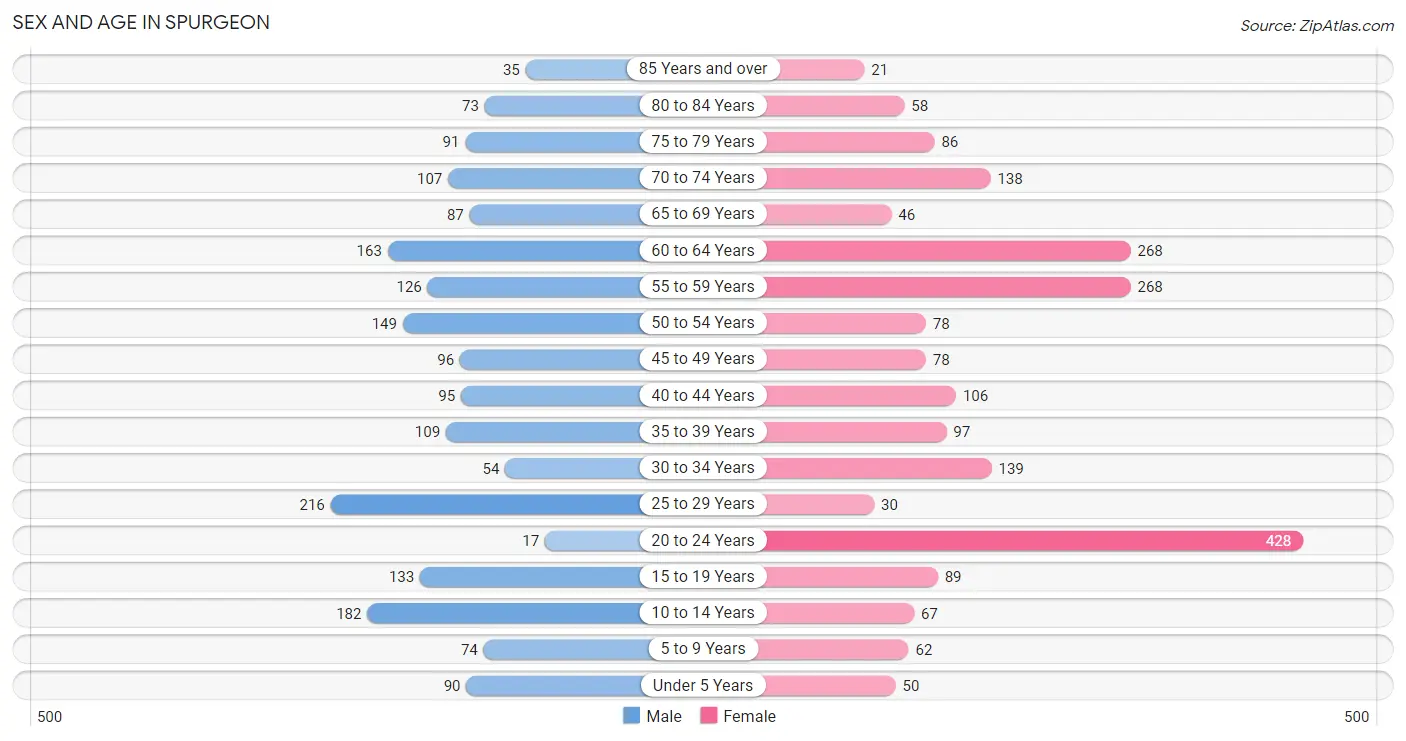
Sex and Age in Spurgeon
The most populous age groups in Spurgeon are 25 to 29 Years (216 | 11.4%) for men and 20 to 24 Years (428 | 20.3%) for women.
| Age Bracket | Male | Female |
| Under 5 Years | 90 (4.7%) | 50 (2.4%) |
| 5 to 9 Years | 74 (3.9%) | 62 (2.9%) |
| 10 to 14 Years | 182 (9.6%) | 67 (3.2%) |
| 15 to 19 Years | 133 (7.0%) | 89 (4.2%) |
| 20 to 24 Years | 17 (0.9%) | 428 (20.3%) |
| 25 to 29 Years | 216 (11.4%) | 30 (1.4%) |
| 30 to 34 Years | 54 (2.9%) | 139 (6.6%) |
| 35 to 39 Years | 109 (5.8%) | 97 (4.6%) |
| 40 to 44 Years | 95 (5.0%) | 106 (5.0%) |
| 45 to 49 Years | 96 (5.1%) | 78 (3.7%) |
| 50 to 54 Years | 149 (7.9%) | 78 (3.7%) |
| 55 to 59 Years | 126 (6.6%) | 268 (12.7%) |
| 60 to 64 Years | 163 (8.6%) | 268 (12.7%) |
| 65 to 69 Years | 87 (4.6%) | 46 (2.2%) |
| 70 to 74 Years | 107 (5.6%) | 138 (6.5%) |
| 75 to 79 Years | 91 (4.8%) | 86 (4.1%) |
| 80 to 84 Years | 73 (3.8%) | 58 (2.8%) |
| 85 Years and over | 35 (1.8%) | 21 (1.0%) |
| Total | 1,897 (100.0%) | 2,109 (100.0%) |
Families and Households in Spurgeon
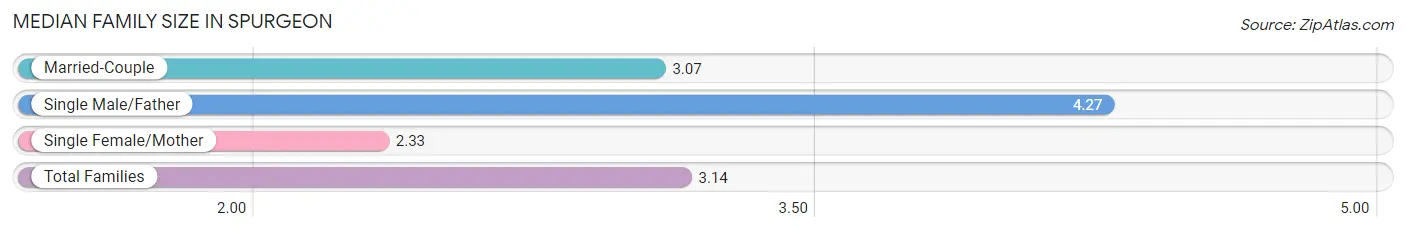
Median Family Size in Spurgeon
The median family size in Spurgeon is 3.14 persons per family, with single male/father families (108 | 11.3%) accounting for the largest median family size of 4.27 persons per family. On the other hand, single female/mother families (91 | 9.6%) represent the smallest median family size with 2.33 persons per family.
| Family Type | # Families | Family Size |
| Married-Couple | 753 (79.1%) | 3.07 |
| Single Male/Father | 108 (11.3%) | 4.27 |
| Single Female/Mother | 91 (9.6%) | 2.33 |
| Total Families | 952 (100.0%) | 3.14 |
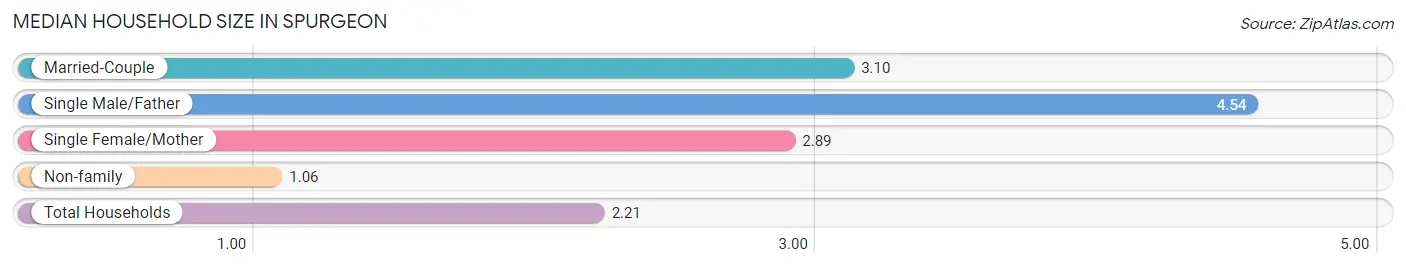
Median Household Size in Spurgeon
The median household size in Spurgeon is 2.21 persons per household, with single male/father households (108 | 5.9%) accounting for the largest median household size of 4.54 persons per household. non-family households (863 | 47.5%) represent the smallest median household size with 1.06 persons per household.
| Household Type | # Households | Household Size |
| Married-Couple | 753 (41.5%) | 3.10 |
| Single Male/Father | 108 (5.9%) | 4.54 |
| Single Female/Mother | 91 (5.0%) | 2.89 |
| Non-family | 863 (47.5%) | 1.06 |
| Total Households | 1,815 (100.0%) | 2.21 |
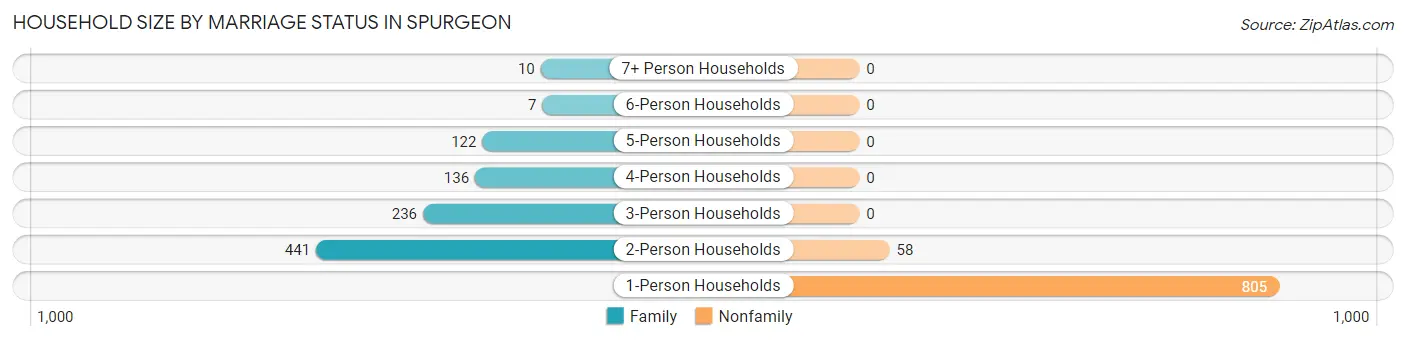
Household Size by Marriage Status in Spurgeon
Out of a total of 1,815 households in Spurgeon, 952 (52.4%) are family households, while 863 (47.5%) are nonfamily households. The most numerous type of family households are 2-person households, comprising 441, and the most common type of nonfamily households are 1-person households, comprising 805.
| Household Size | Family Households | Nonfamily Households |
| 1-Person Households | - | 805 (44.4%) |
| 2-Person Households | 441 (24.3%) | 58 (3.2%) |
| 3-Person Households | 236 (13.0%) | 0 (0.0%) |
| 4-Person Households | 136 (7.5%) | 0 (0.0%) |
| 5-Person Households | 122 (6.7%) | 0 (0.0%) |
| 6-Person Households | 7 (0.4%) | 0 (0.0%) |
| 7+ Person Households | 10 (0.5%) | 0 (0.0%) |
| Total | 952 (52.4%) | 863 (47.5%) |
Female Fertility in Spurgeon
Fertility by Age in Spurgeon
Average fertility rate in Spurgeon is 47.0 births per 1,000 women. Women in the age bracket of 20 to 34 years have the highest fertility rate with 75.0 births per 1,000 women. Women in the age bracket of 20 to 34 years acount for 100.0% of all women with births.
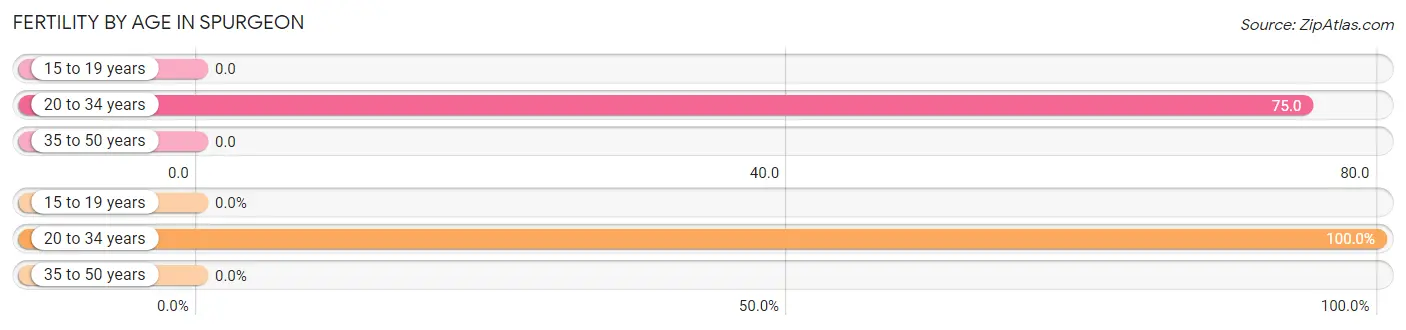
| Age Bracket | Women with Births | Births / 1,000 Women |
| 15 to 19 years | 0 (0.0%) | 0.0 |
| 20 to 34 years | 45 (100.0%) | 75.0 |
| 35 to 50 years | 0 (0.0%) | 0.0 |
| Total | 45 (100.0%) | 47.0 |
Fertility by Age by Marriage Status in Spurgeon
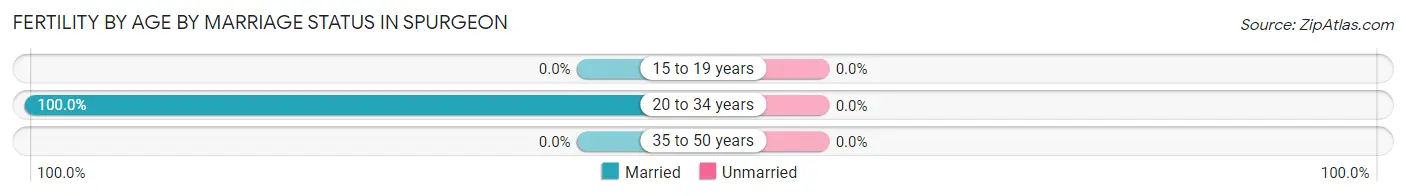
| Age Bracket | Married | Unmarried |
| 15 to 19 years | 0 (0.0%) | 0 (0.0%) |
| 20 to 34 years | 45 (100.0%) | 0 (0.0%) |
| 35 to 50 years | 0 (0.0%) | 0 (0.0%) |
| Total | 45 (100.0%) | 0 (0.0%) |
Fertility by Education in Spurgeon
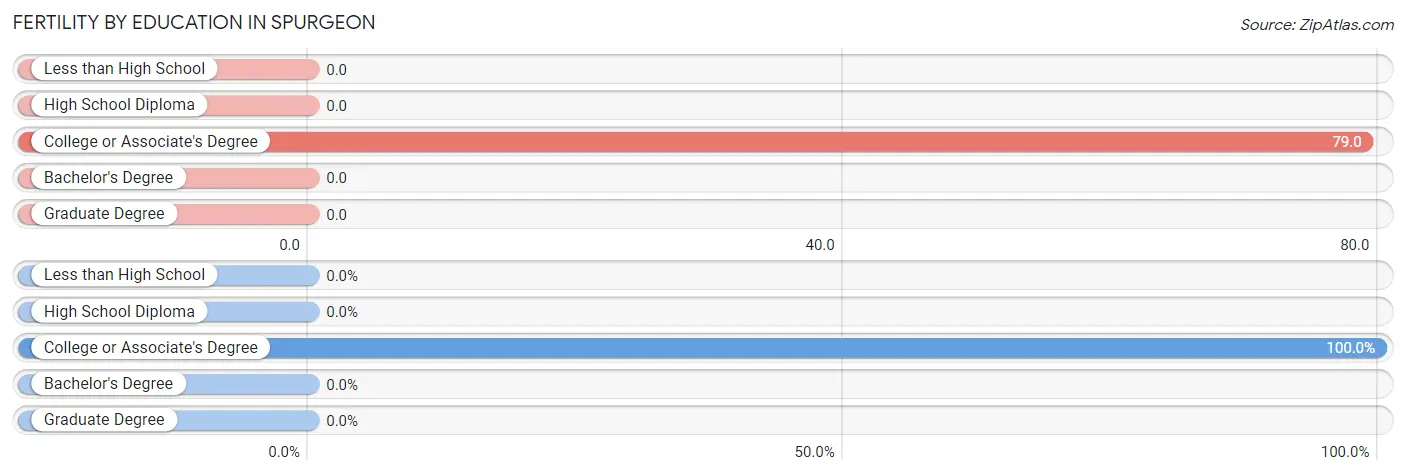
| Educational Attainment | Women with Births | Births / 1,000 Women |
| Less than High School | 0 (0.0%) | 0.0 |
| High School Diploma | 0 (0.0%) | 0.0 |
| College or Associate's Degree | 45 (100.0%) | 79.0 |
| Bachelor's Degree | 0 (0.0%) | 0.0 |
| Graduate Degree | 0 (0.0%) | 0.0 |
| Total | 45 (100.0%) | 47.0 |
Fertility by Education by Marriage Status in Spurgeon
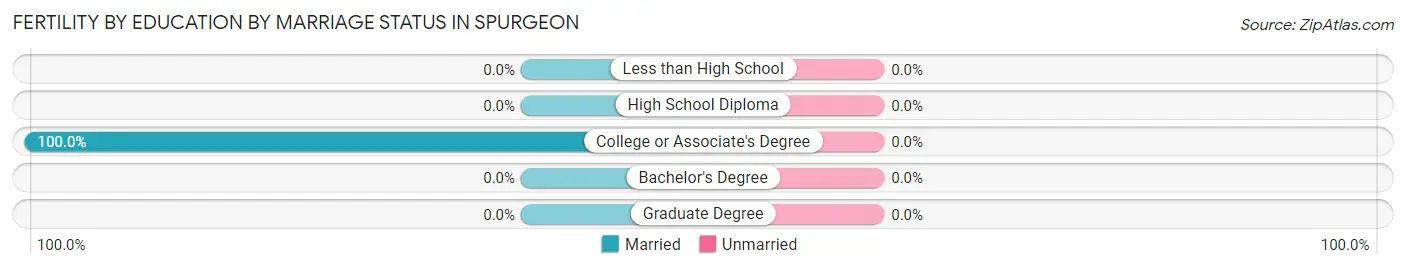
| Educational Attainment | Married | Unmarried |
| Less than High School | 0 (0.0%) | 0 (0.0%) |
| High School Diploma | 0 (0.0%) | 0 (0.0%) |
| College or Associate's Degree | 45 (100.0%) | 0 (0.0%) |
| Bachelor's Degree | 0 (0.0%) | 0 (0.0%) |
| Graduate Degree | 0 (0.0%) | 0 (0.0%) |
| Total | 45 (100.0%) | 0 (0.0%) |
Income in Spurgeon
Income Overview in Spurgeon
Per Capita Income in Spurgeon is $37,100, while median incomes of families and households are $80,337 and $73,002 respectively.
| Characteristic | Number | Measure |
| Per Capita Income | 4,006 | $37,100 |
| Median Family Income | 952 | $80,337 |
| Mean Family Income | 952 | $95,616 |
| Median Household Income | 1,815 | $73,002 |
| Mean Household Income | 1,815 | $82,249 |
| Income Deficit | 952 | $0 |
| Wage / Income Gap (%) | 4,006 | 33.71% |
| Wage / Income Gap ($) | 4,006 | 66.29¢ per $1 |
| Gini / Inequality Index | 4,006 | 0.42 |
Earnings by Sex in Spurgeon
Average Earnings in Spurgeon are $45,394, $50,703 for men and $33,609 for women, a difference of 33.7%.
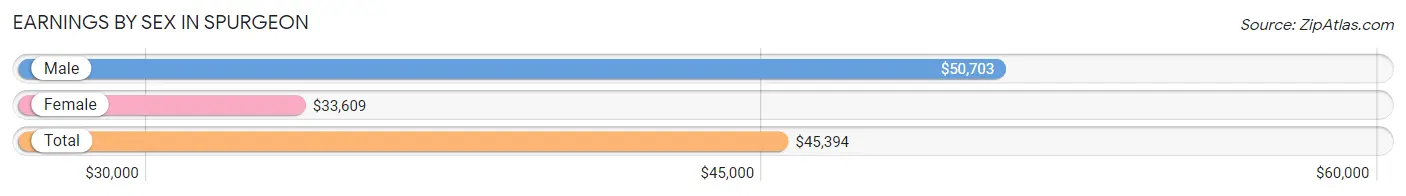
| Sex | Number | Average Earnings |
| Male | 891 (43.1%) | $50,703 |
| Female | 1,177 (56.9%) | $33,609 |
| Total | 2,068 (100.0%) | $45,394 |
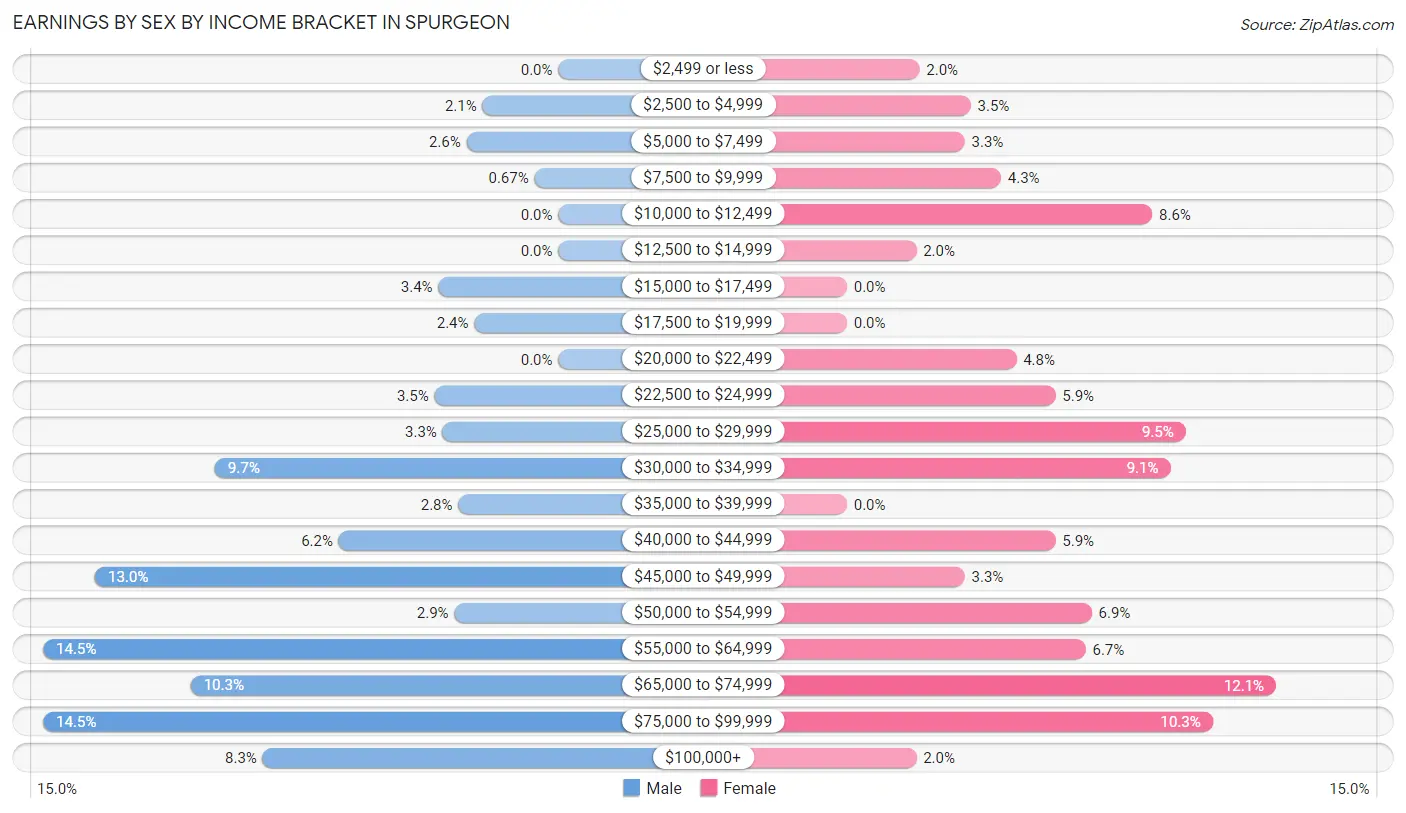
Earnings by Sex by Income Bracket in Spurgeon
The most common earnings brackets in Spurgeon are $55,000 to $64,999 for men (129 | 14.5%) and $65,000 to $74,999 for women (142 | 12.1%).
| Income | Male | Female |
| $2,499 or less | 0 (0.0%) | 24 (2.0%) |
| $2,500 to $4,999 | 19 (2.1%) | 41 (3.5%) |
| $5,000 to $7,499 | 23 (2.6%) | 39 (3.3%) |
| $7,500 to $9,999 | 6 (0.7%) | 51 (4.3%) |
| $10,000 to $12,499 | 0 (0.0%) | 101 (8.6%) |
| $12,500 to $14,999 | 0 (0.0%) | 23 (1.9%) |
| $15,000 to $17,499 | 30 (3.4%) | 0 (0.0%) |
| $17,500 to $19,999 | 21 (2.4%) | 0 (0.0%) |
| $20,000 to $22,499 | 0 (0.0%) | 56 (4.8%) |
| $22,500 to $24,999 | 31 (3.5%) | 69 (5.9%) |
| $25,000 to $29,999 | 29 (3.3%) | 112 (9.5%) |
| $30,000 to $34,999 | 86 (9.7%) | 107 (9.1%) |
| $35,000 to $39,999 | 25 (2.8%) | 0 (0.0%) |
| $40,000 to $44,999 | 55 (6.2%) | 69 (5.9%) |
| $45,000 to $49,999 | 116 (13.0%) | 39 (3.3%) |
| $50,000 to $54,999 | 26 (2.9%) | 81 (6.9%) |
| $55,000 to $64,999 | 129 (14.5%) | 79 (6.7%) |
| $65,000 to $74,999 | 92 (10.3%) | 142 (12.1%) |
| $75,000 to $99,999 | 129 (14.5%) | 121 (10.3%) |
| $100,000+ | 74 (8.3%) | 23 (1.9%) |
| Total | 891 (100.0%) | 1,177 (100.0%) |
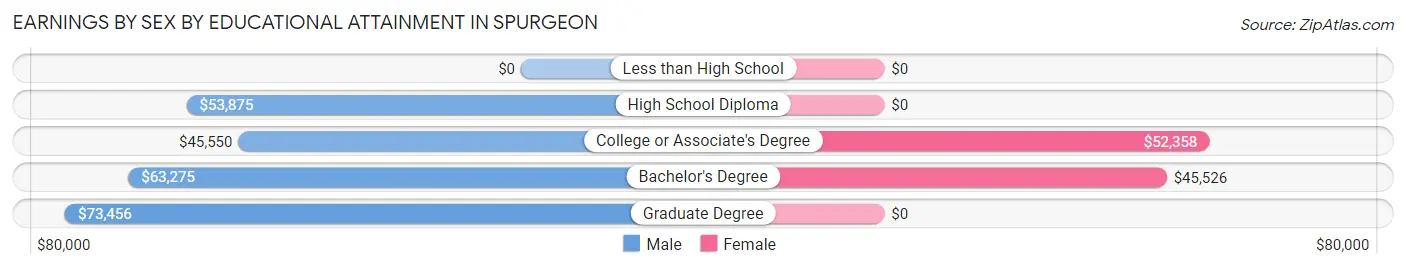
Earnings by Sex by Educational Attainment in Spurgeon
Average earnings in Spurgeon are $52,875 for men and $44,360 for women, a difference of 16.1%. Men with an educational attainment of graduate degree enjoy the highest average annual earnings of $73,456, while those with college or associate's degree education earn the least with $45,550. Women with an educational attainment of college or associate's degree earn the most with the average annual earnings of $52,358, while those with bachelor's degree education have the smallest earnings of $45,526.
| Educational Attainment | Male Income | Female Income |
| Less than High School | - | - |
| High School Diploma | $53,875 | $0 |
| College or Associate's Degree | $45,550 | $52,358 |
| Bachelor's Degree | $63,275 | $45,526 |
| Graduate Degree | $73,456 | $0 |
| Total | $52,875 | $44,360 |
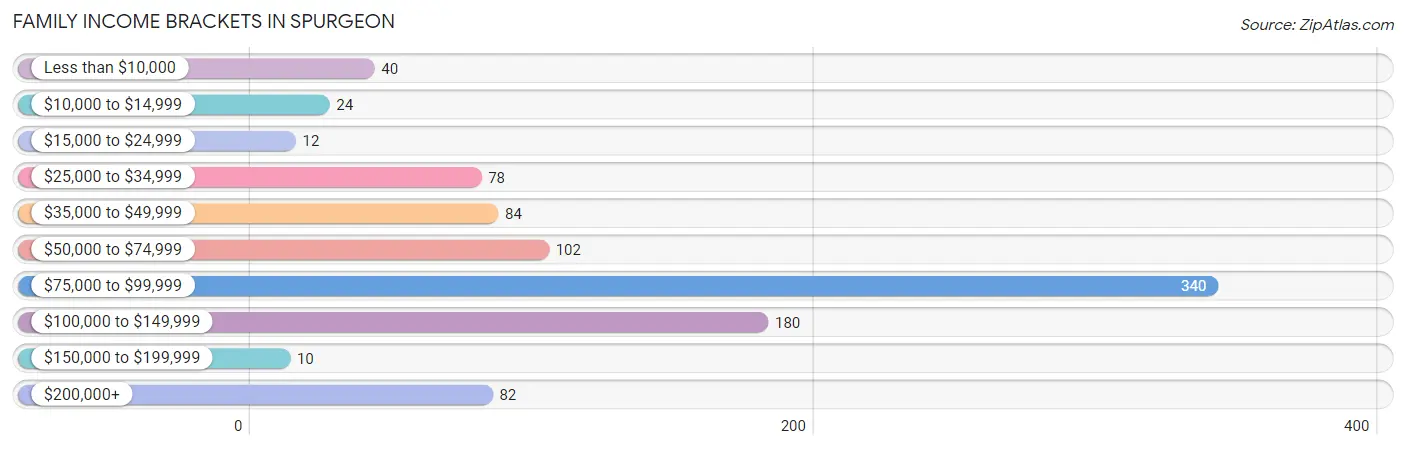
Family Income in Spurgeon
Family Income Brackets in Spurgeon
According to the Spurgeon family income data, there are 340 families falling into the $75,000 to $99,999 income range, which is the most common income bracket and makes up 35.7% of all families. Conversely, the $150,000 to $199,999 income bracket is the least frequent group with only 10 families (1.1%) belonging to this category.
| Income Bracket | # Families | % Families |
| Less than $10,000 | 40 | 4.2% |
| $10,000 to $14,999 | 24 | 2.5% |
| $15,000 to $24,999 | 12 | 1.3% |
| $25,000 to $34,999 | 78 | 8.2% |
| $35,000 to $49,999 | 84 | 8.8% |
| $50,000 to $74,999 | 102 | 10.7% |
| $75,000 to $99,999 | 340 | 35.7% |
| $100,000 to $149,999 | 180 | 18.9% |
| $150,000 to $199,999 | 10 | 1.1% |
| $200,000+ | 82 | 8.6% |
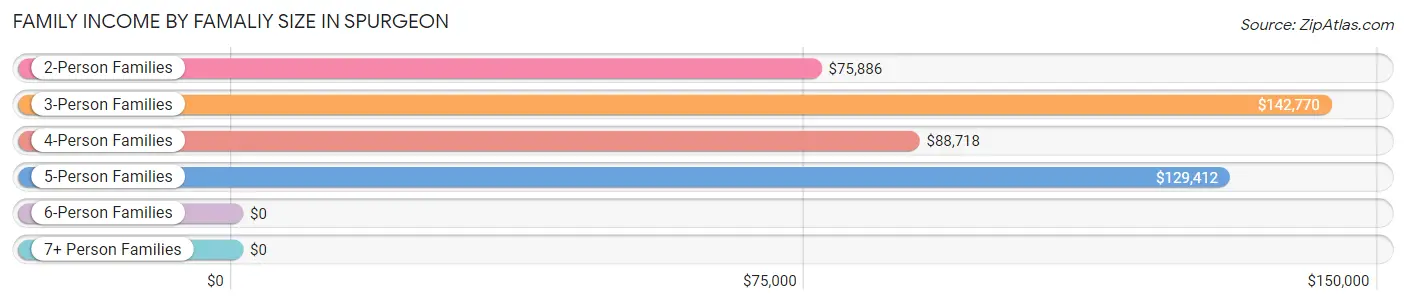
Family Income by Famaliy Size in Spurgeon
3-person families (172 | 18.1%) account for the highest median family income in Spurgeon with $142,770 per family, while 3-person families (172 | 18.1%) have the highest median income of $47,590 per family member.
| Income Bracket | # Families | Median Income |
| 2-Person Families | 517 (54.3%) | $75,886 |
| 3-Person Families | 172 (18.1%) | $142,770 |
| 4-Person Families | 142 (14.9%) | $88,718 |
| 5-Person Families | 104 (10.9%) | $129,412 |
| 6-Person Families | 7 (0.7%) | $0 |
| 7+ Person Families | 10 (1.1%) | $0 |
| Total | 952 (100.0%) | $80,337 |
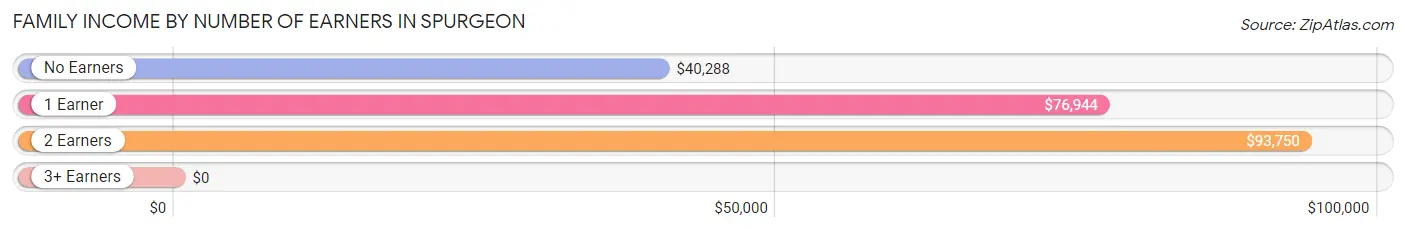
Family Income by Number of Earners in Spurgeon
| Number of Earners | # Families | Median Income |
| No Earners | 215 (22.6%) | $40,288 |
| 1 Earner | 274 (28.8%) | $76,944 |
| 2 Earners | 399 (41.9%) | $93,750 |
| 3+ Earners | 64 (6.7%) | $0 |
| Total | 952 (100.0%) | $80,337 |
Household Income in Spurgeon
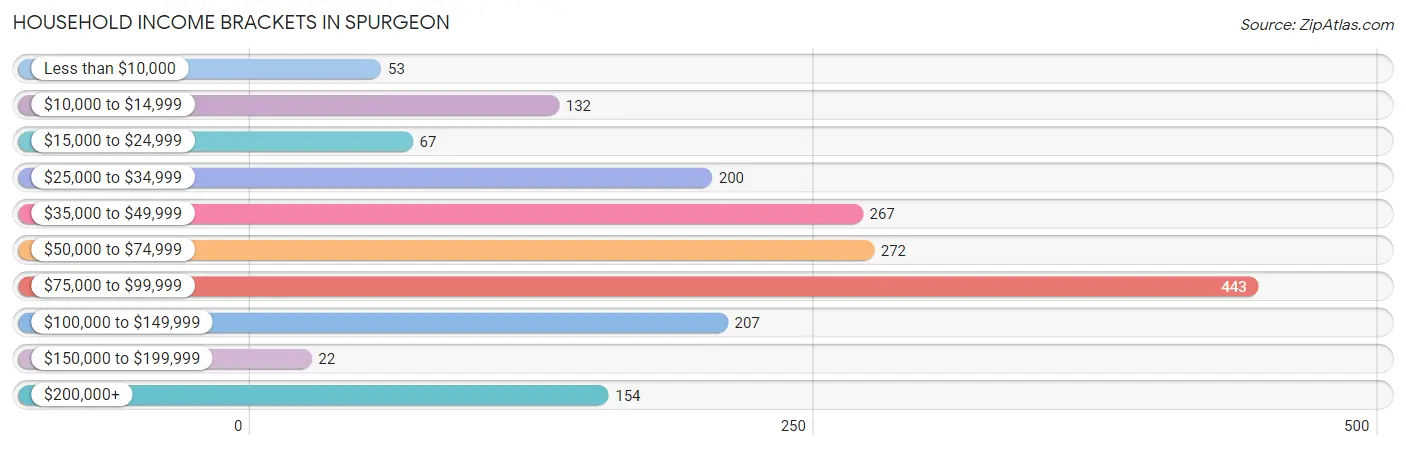
Household Income Brackets in Spurgeon
With 443 households falling in the category, the $75,000 to $99,999 income range is the most frequent in Spurgeon, accounting for 24.4% of all households. In contrast, only 22 households (1.2%) fall into the $150,000 to $199,999 income bracket, making it the least populous group.
| Income Bracket | # Households | % Households |
| Less than $10,000 | 53 | 2.9% |
| $10,000 to $14,999 | 132 | 7.3% |
| $15,000 to $24,999 | 67 | 3.7% |
| $25,000 to $34,999 | 200 | 11.0% |
| $35,000 to $49,999 | 267 | 14.7% |
| $50,000 to $74,999 | 272 | 15.0% |
| $75,000 to $99,999 | 443 | 24.4% |
| $100,000 to $149,999 | 207 | 11.4% |
| $150,000 to $199,999 | 22 | 1.2% |
| $200,000+ | 154 | 8.5% |
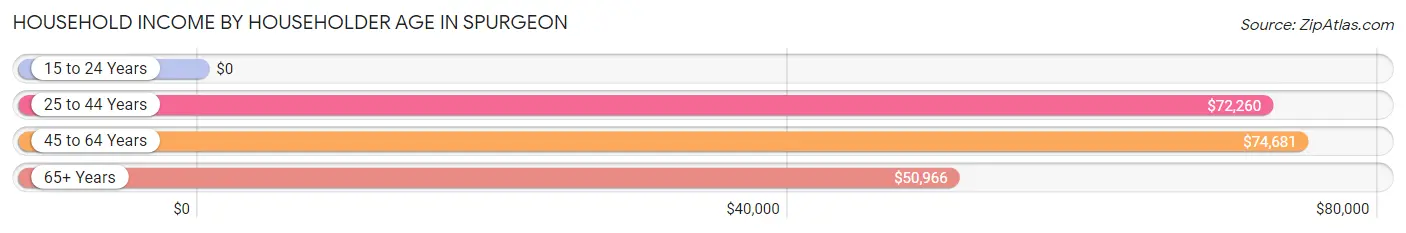
Household Income by Householder Age in Spurgeon
The median household income in Spurgeon is $73,002, with the highest median household income of $74,681 found in the 45 to 64 years age bracket for the primary householder. A total of 770 households (42.4%) fall into this category. Meanwhile, the 15 to 24 years age bracket for the primary householder has the lowest median household income of $0, with 69 households (3.8%) in this group.
| Income Bracket | # Households | Median Income |
| 15 to 24 Years | 69 (3.8%) | $0 |
| 25 to 44 Years | 485 (26.7%) | $72,260 |
| 45 to 64 Years | 770 (42.4%) | $74,681 |
| 65+ Years | 491 (27.1%) | $50,966 |
| Total | 1,815 (100.0%) | $73,002 |
Poverty in Spurgeon
Income Below Poverty by Sex and Age in Spurgeon
With 10.9% poverty level for males and 21.6% for females among the residents of Spurgeon, 5 year old males and 18 to 24 year old females are the most vulnerable to poverty, with 13 males (100.0%) and 292 females (58.9%) in their respective age groups living below the poverty level.
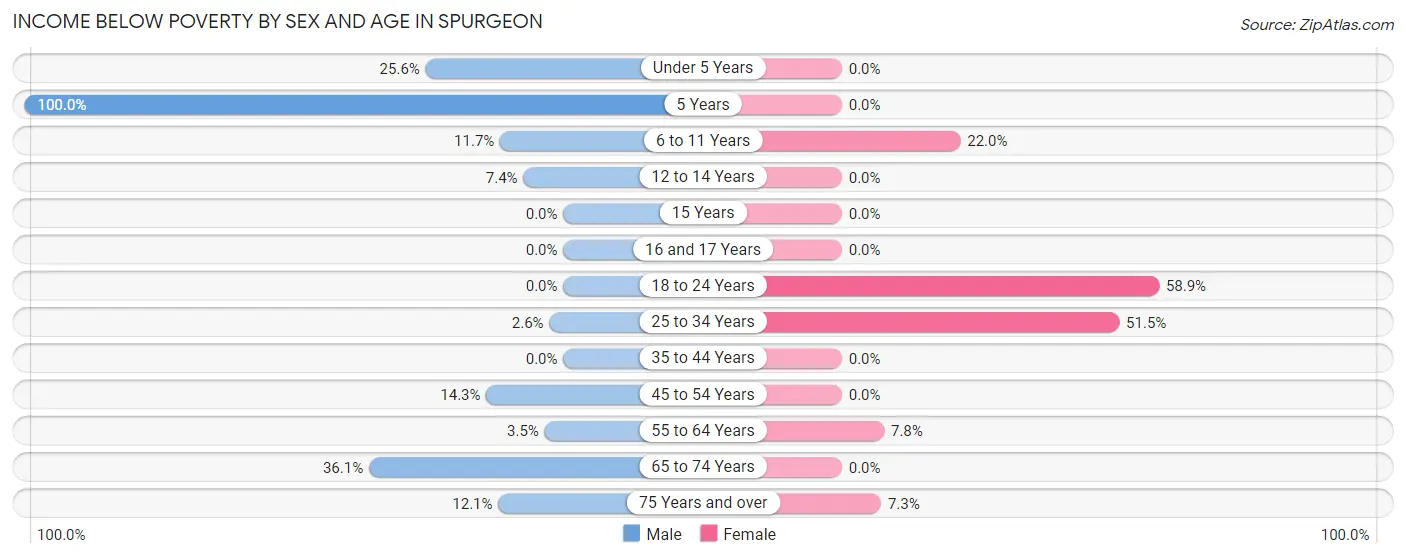
| Age Bracket | Male | Female |
| Under 5 Years | 23 (25.6%) | 0 (0.0%) |
| 5 Years | 13 (100.0%) | 0 (0.0%) |
| 6 to 11 Years | 19 (11.7%) | 22 (22.0%) |
| 12 to 14 Years | 6 (7.4%) | 0 (0.0%) |
| 15 Years | 0 (0.0%) | 0 (0.0%) |
| 16 and 17 Years | 0 (0.0%) | 0 (0.0%) |
| 18 to 24 Years | 0 (0.0%) | 292 (58.9%) |
| 25 to 34 Years | 7 (2.6%) | 87 (51.5%) |
| 35 to 44 Years | 0 (0.0%) | 0 (0.0%) |
| 45 to 54 Years | 35 (14.3%) | 0 (0.0%) |
| 55 to 64 Years | 10 (3.5%) | 42 (7.8%) |
| 65 to 74 Years | 70 (36.1%) | 0 (0.0%) |
| 75 Years and over | 24 (12.1%) | 12 (7.3%) |
| Total | 207 (10.9%) | 455 (21.6%) |
Income Above Poverty by Sex and Age in Spurgeon
According to the poverty statistics in Spurgeon, males aged 15 years and females aged under 5 years are the age groups that are most secure financially, with 100.0% of males and 100.0% of females in these age groups living above the poverty line.
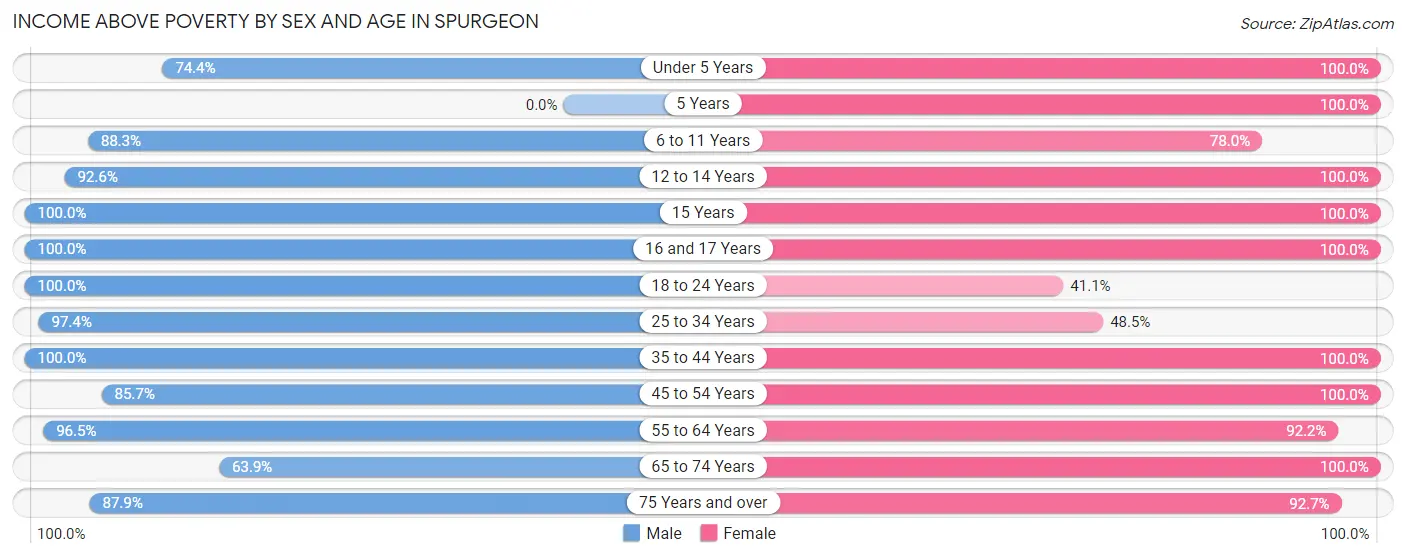
| Age Bracket | Male | Female |
| Under 5 Years | 67 (74.4%) | 50 (100.0%) |
| 5 Years | 0 (0.0%) | 11 (100.0%) |
| 6 to 11 Years | 143 (88.3%) | 78 (78.0%) |
| 12 to 14 Years | 75 (92.6%) | 18 (100.0%) |
| 15 Years | 42 (100.0%) | 8 (100.0%) |
| 16 and 17 Years | 24 (100.0%) | 13 (100.0%) |
| 18 to 24 Years | 84 (100.0%) | 204 (41.1%) |
| 25 to 34 Years | 263 (97.4%) | 82 (48.5%) |
| 35 to 44 Years | 204 (100.0%) | 203 (100.0%) |
| 45 to 54 Years | 210 (85.7%) | 156 (100.0%) |
| 55 to 64 Years | 279 (96.5%) | 494 (92.2%) |
| 65 to 74 Years | 124 (63.9%) | 184 (100.0%) |
| 75 Years and over | 175 (87.9%) | 153 (92.7%) |
| Total | 1,690 (89.1%) | 1,654 (78.4%) |
Income Below Poverty Among Married-Couple Families in Spurgeon
The poverty statistics for married-couple families in Spurgeon show that 5.2% or 39 of the total 753 families live below the poverty line. Families with 3 or 4 children have the highest poverty rate of 20.7%, comprising of 17 families. On the other hand, families with 1 or 2 children have the lowest poverty rate of 0.0%, which includes 0 families.
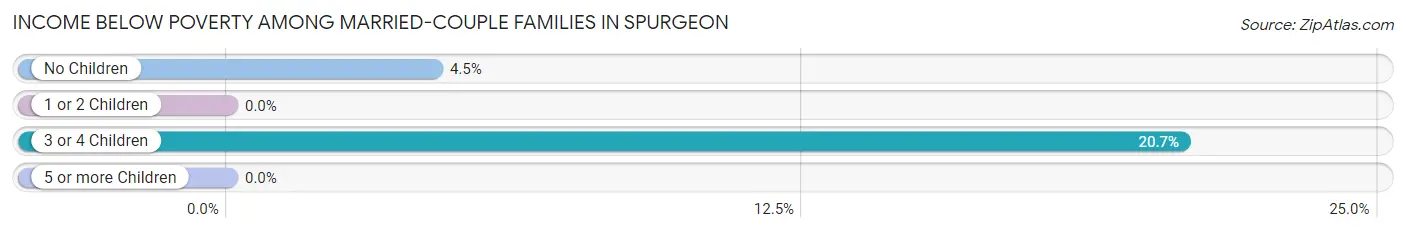
| Children | Above Poverty | Below Poverty |
| No Children | 471 (95.5%) | 22 (4.5%) |
| 1 or 2 Children | 178 (100.0%) | 0 (0.0%) |
| 3 or 4 Children | 65 (79.3%) | 17 (20.7%) |
| 5 or more Children | 0 (0.0%) | 0 (0.0%) |
| Total | 714 (94.8%) | 39 (5.2%) |
Income Below Poverty Among Single-Parent Households in Spurgeon
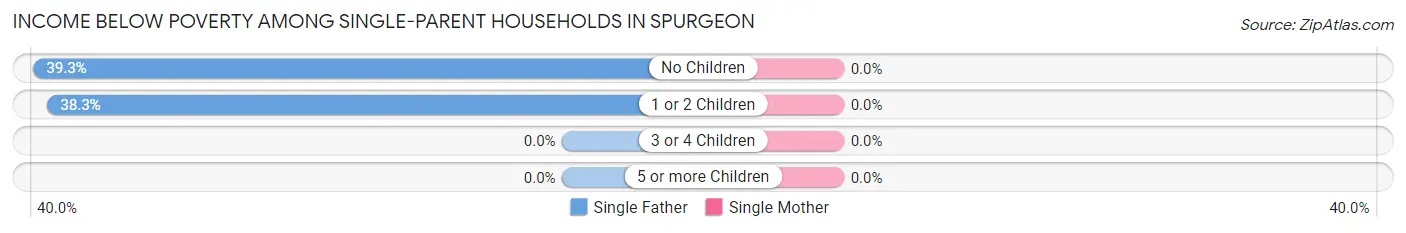
| Children | Single Father | Single Mother |
| No Children | 24 (39.3%) | 0 (0.0%) |
| 1 or 2 Children | 18 (38.3%) | 0 (0.0%) |
| 3 or 4 Children | 0 (0.0%) | 0 (0.0%) |
| 5 or more Children | 0 (0.0%) | 0 (0.0%) |
| Total | 42 (38.9%) | 0 (0.0%) |
Income Below Poverty Among Married-Couple vs Single-Parent Households in Spurgeon
The poverty data for Spurgeon shows that 39 of the married-couple family households (5.2%) and 42 of the single-parent households (21.1%) are living below the poverty level. Within the married-couple family households, those with 3 or 4 children have the highest poverty rate, with 17 households (20.7%) falling below the poverty line. Among the single-parent households, those with 1 or 2 children have the highest poverty rate, with 18 household (30.5%) living below poverty.
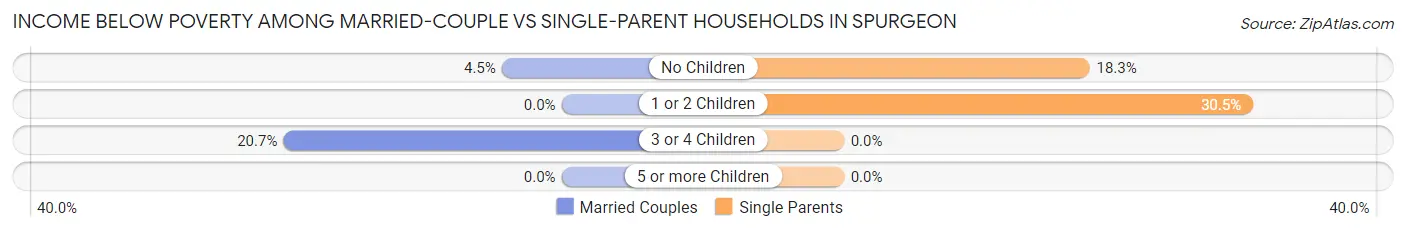
| Children | Married-Couple Families | Single-Parent Households |
| No Children | 22 (4.5%) | 24 (18.3%) |
| 1 or 2 Children | 0 (0.0%) | 18 (30.5%) |
| 3 or 4 Children | 17 (20.7%) | 0 (0.0%) |
| 5 or more Children | 0 (0.0%) | 0 (0.0%) |
| Total | 39 (5.2%) | 42 (21.1%) |
Employment Characteristics in Spurgeon
Employment by Class of Employer in Spurgeon
Among the 1,925 employed individuals in Spurgeon, private company employees (1,401 | 72.8%), not-for-profit organizations (269 | 14.0%), and local government employees (93 | 4.8%) make up the most common classes of employment.
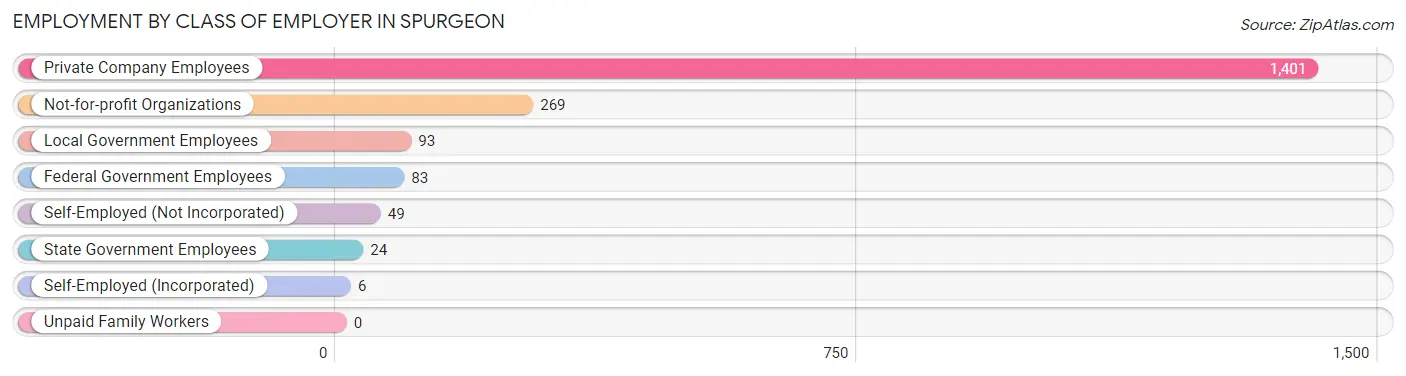
| Employer Class | # Employees | % Employees |
| Private Company Employees | 1,401 | 72.8% |
| Self-Employed (Incorporated) | 6 | 0.3% |
| Self-Employed (Not Incorporated) | 49 | 2.5% |
| Not-for-profit Organizations | 269 | 14.0% |
| Local Government Employees | 93 | 4.8% |
| State Government Employees | 24 | 1.3% |
| Federal Government Employees | 83 | 4.3% |
| Unpaid Family Workers | 0 | 0.0% |
| Total | 1,925 | 100.0% |
Employment Status by Age in Spurgeon
According to the labor force statistics for Spurgeon, out of the total population over 16 years of age (3,431), 56.8% or 1,949 individuals are in the labor force, with 0.8% or 16 of them unemployed. The age group with the highest labor force participation rate is 25 to 29 years, with 100.0% or 246 individuals in the labor force. Within the labor force, the 20 to 24 years age range has the highest percentage of unemployed individuals, with 5.3% or 7 of them being unemployed.
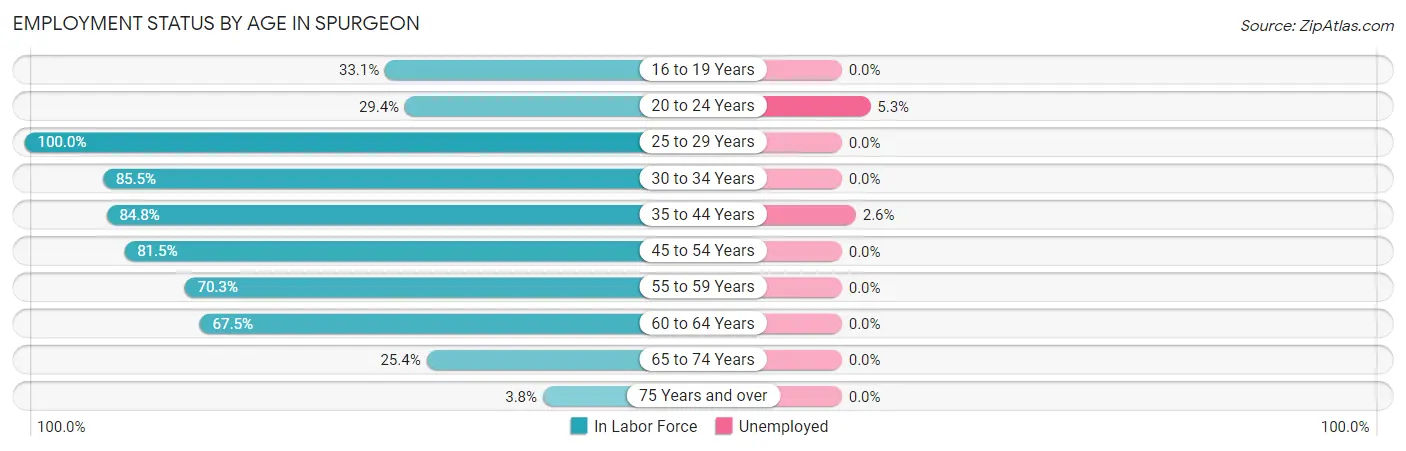
| Age Bracket | In Labor Force | Unemployed |
| 16 to 19 Years | 57 (33.1%) | 0 (0.0%) |
| 20 to 24 Years | 131 (29.4%) | 7 (5.3%) |
| 25 to 29 Years | 246 (100.0%) | 0 (0.0%) |
| 30 to 34 Years | 165 (85.5%) | 0 (0.0%) |
| 35 to 44 Years | 345 (84.8%) | 9 (2.6%) |
| 45 to 54 Years | 327 (81.5%) | 0 (0.0%) |
| 55 to 59 Years | 277 (70.3%) | 0 (0.0%) |
| 60 to 64 Years | 291 (67.5%) | 0 (0.0%) |
| 65 to 74 Years | 96 (25.4%) | 0 (0.0%) |
| 75 Years and over | 14 (3.8%) | 0 (0.0%) |
| Total | 1,949 (56.8%) | 16 (0.8%) |
Employment Status by Educational Attainment in Spurgeon
According to labor force statistics for Spurgeon, 79.7% of individuals (1,651) out of the total population between 25 and 64 years of age (2,072) are in the labor force, with 0.5% or 8 of them being unemployed. The group with the highest labor force participation rate are those with the educational attainment of college / associate degree, with 88.5% or 539 individuals in the labor force. Within the labor force, individuals with bachelor's degree or higher education have the highest percentage of unemployment, with 1.6% or 9 of them being unemployed.
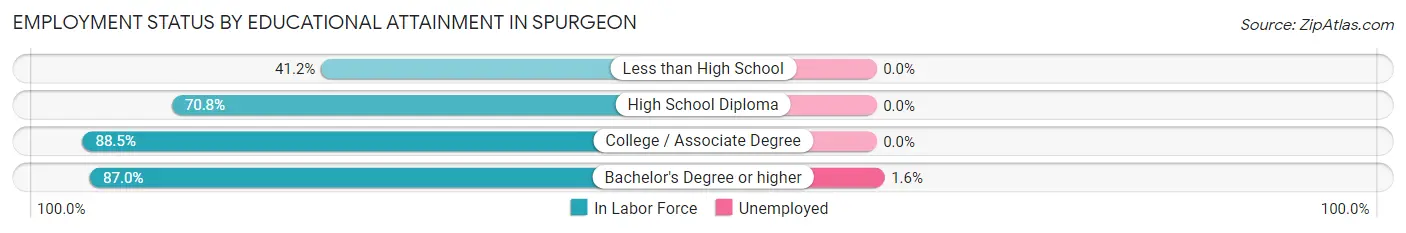
| Educational Attainment | In Labor Force | Unemployed |
| Less than High School | 42 (41.2%) | 0 (0.0%) |
| High School Diploma | 499 (70.8%) | 0 (0.0%) |
| College / Associate Degree | 539 (88.5%) | 0 (0.0%) |
| Bachelor's Degree or higher | 571 (87.0%) | 10 (1.6%) |
| Total | 1,651 (79.7%) | 10 (0.5%) |
Employment Occupations by Sex in Spurgeon
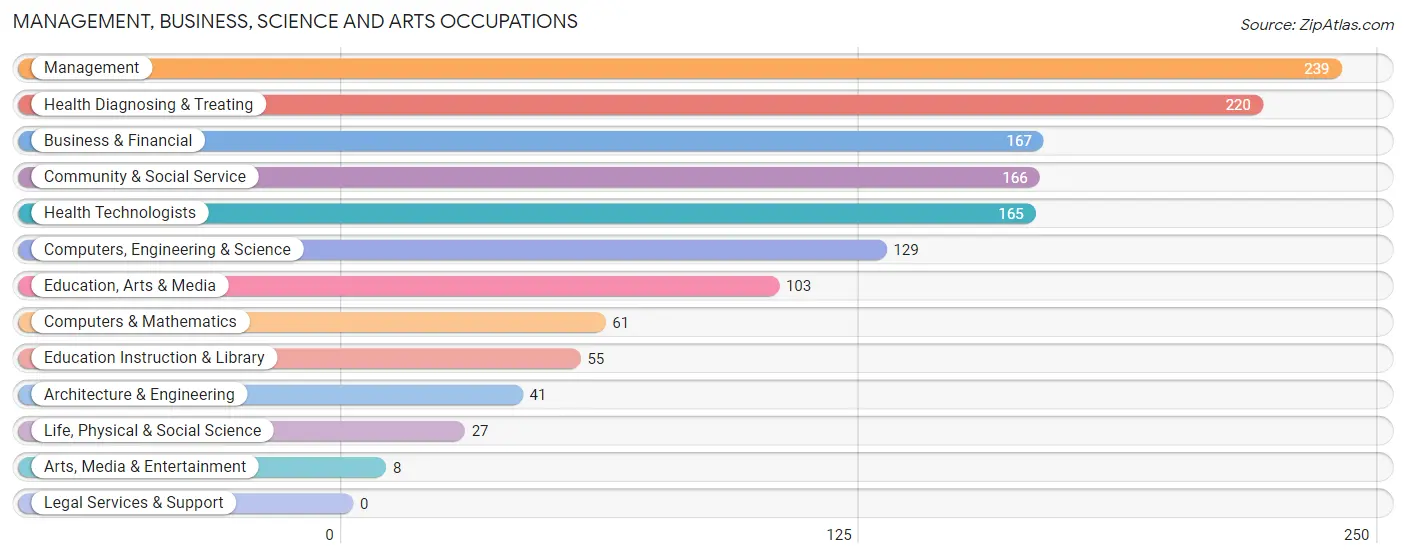
Management, Business, Science and Arts Occupations
The most common Management, Business, Science and Arts occupations in Spurgeon are Management (239 | 12.4%), Health Diagnosing & Treating (220 | 11.4%), Business & Financial (167 | 8.6%), Community & Social Service (166 | 8.6%), and Health Technologists (165 | 8.5%).
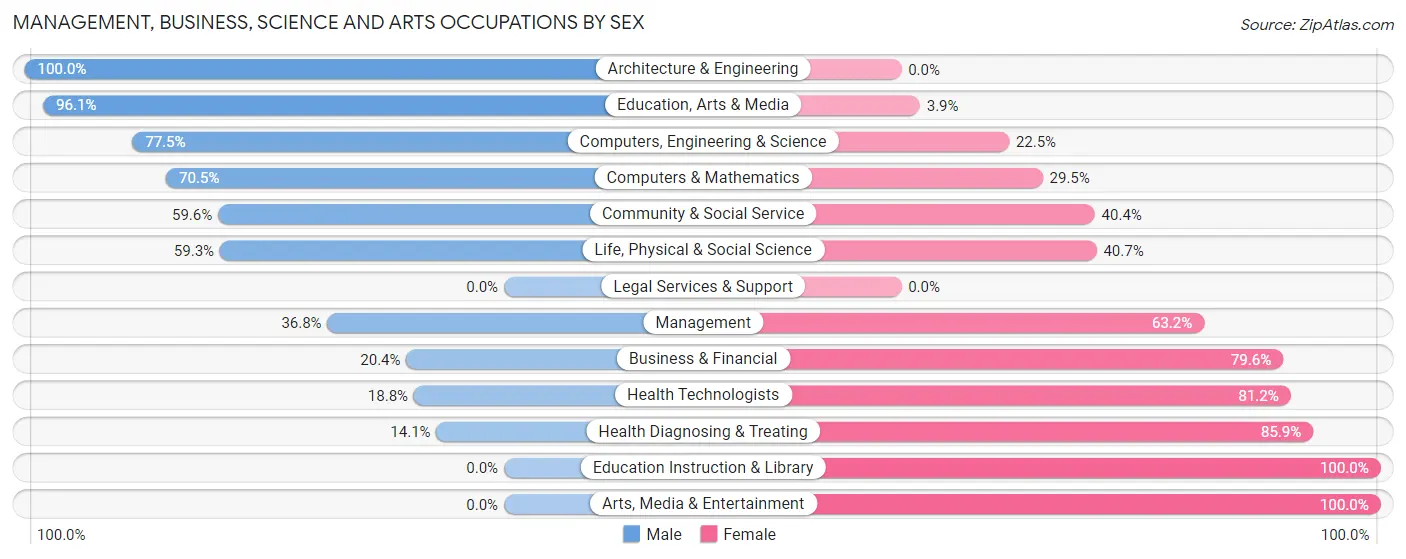
Management, Business, Science and Arts Occupations by Sex
Within the Management, Business, Science and Arts occupations in Spurgeon, the most male-oriented occupations are Architecture & Engineering (100.0%), Education, Arts & Media (96.1%), and Computers, Engineering & Science (77.5%), while the most female-oriented occupations are Education Instruction & Library (100.0%), Arts, Media & Entertainment (100.0%), and Health Diagnosing & Treating (85.9%).
| Occupation | Male | Female |
| Management | 88 (36.8%) | 151 (63.2%) |
| Business & Financial | 34 (20.4%) | 133 (79.6%) |
| Computers, Engineering & Science | 100 (77.5%) | 29 (22.5%) |
| Computers & Mathematics | 43 (70.5%) | 18 (29.5%) |
| Architecture & Engineering | 41 (100.0%) | 0 (0.0%) |
| Life, Physical & Social Science | 16 (59.3%) | 11 (40.7%) |
| Community & Social Service | 99 (59.6%) | 67 (40.4%) |
| Education, Arts & Media | 99 (96.1%) | 4 (3.9%) |
| Legal Services & Support | 0 (0.0%) | 0 (0.0%) |
| Education Instruction & Library | 0 (0.0%) | 55 (100.0%) |
| Arts, Media & Entertainment | 0 (0.0%) | 8 (100.0%) |
| Health Diagnosing & Treating | 31 (14.1%) | 189 (85.9%) |
| Health Technologists | 31 (18.8%) | 134 (81.2%) |
| Total (Category) | 352 (38.2%) | 569 (61.8%) |
| Total (Overall) | 869 (45.0%) | 1,064 (55.0%) |
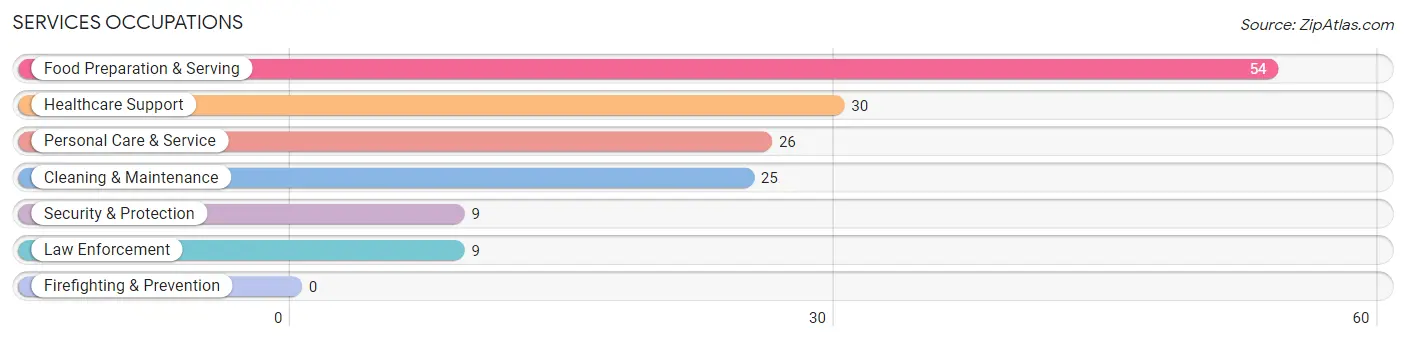
Services Occupations
The most common Services occupations in Spurgeon are Food Preparation & Serving (54 | 2.8%), Healthcare Support (30 | 1.5%), Personal Care & Service (26 | 1.3%), Cleaning & Maintenance (25 | 1.3%), and Security & Protection (9 | 0.5%).
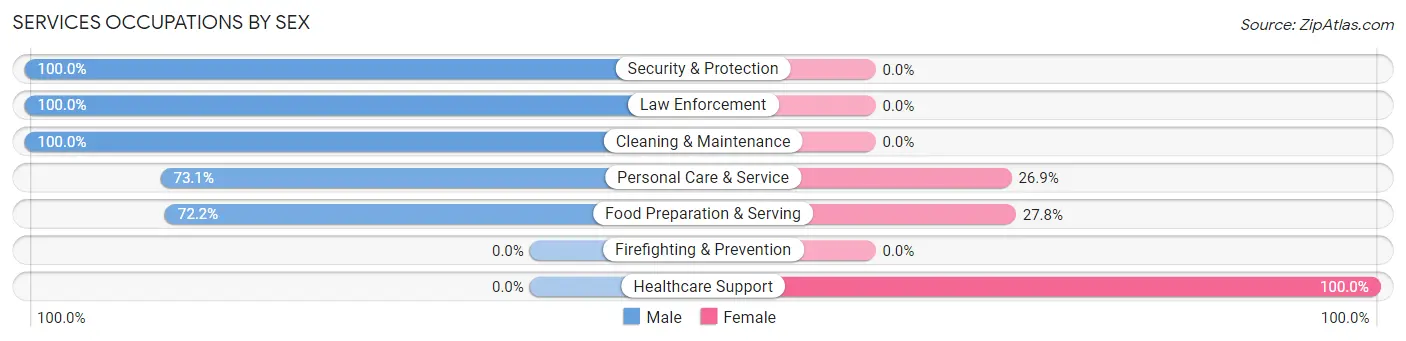
Services Occupations by Sex
Within the Services occupations in Spurgeon, the most male-oriented occupations are Security & Protection (100.0%), Law Enforcement (100.0%), and Cleaning & Maintenance (100.0%), while the most female-oriented occupations are Healthcare Support (100.0%), Food Preparation & Serving (27.8%), and Personal Care & Service (26.9%).
| Occupation | Male | Female |
| Healthcare Support | 0 (0.0%) | 30 (100.0%) |
| Security & Protection | 9 (100.0%) | 0 (0.0%) |
| Firefighting & Prevention | 0 (0.0%) | 0 (0.0%) |
| Law Enforcement | 9 (100.0%) | 0 (0.0%) |
| Food Preparation & Serving | 39 (72.2%) | 15 (27.8%) |
| Cleaning & Maintenance | 25 (100.0%) | 0 (0.0%) |
| Personal Care & Service | 19 (73.1%) | 7 (26.9%) |
| Total (Category) | 92 (63.9%) | 52 (36.1%) |
| Total (Overall) | 869 (45.0%) | 1,064 (55.0%) |
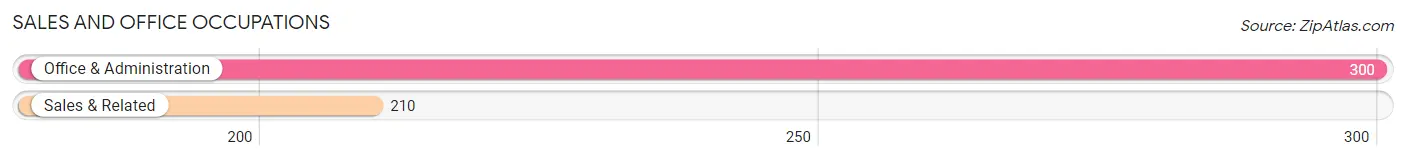
Sales and Office Occupations
The most common Sales and Office occupations in Spurgeon are Office & Administration (300 | 15.5%), and Sales & Related (210 | 10.9%).
Sales and Office Occupations by Sex

| Occupation | Male | Female |
| Sales & Related | 96 (45.7%) | 114 (54.3%) |
| Office & Administration | 37 (12.3%) | 263 (87.7%) |
| Total (Category) | 133 (26.1%) | 377 (73.9%) |
| Total (Overall) | 869 (45.0%) | 1,064 (55.0%) |
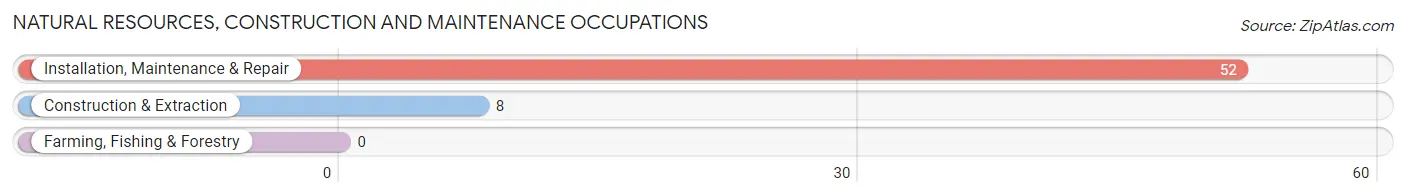
Natural Resources, Construction and Maintenance Occupations
The most common Natural Resources, Construction and Maintenance occupations in Spurgeon are Installation, Maintenance & Repair (52 | 2.7%), and Construction & Extraction (8 | 0.4%).
Natural Resources, Construction and Maintenance Occupations by Sex
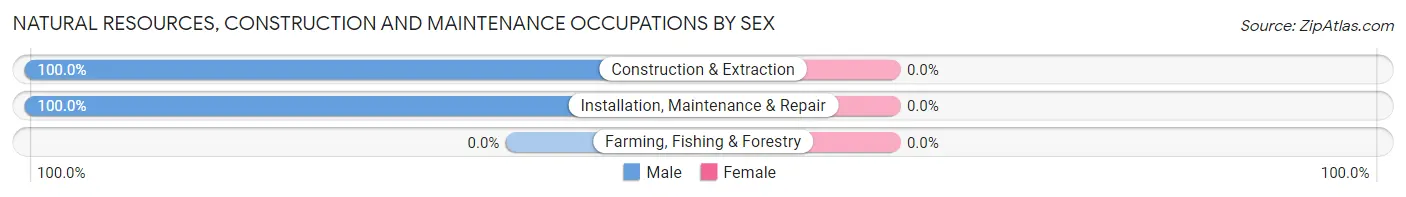
| Occupation | Male | Female |
| Farming, Fishing & Forestry | 0 (0.0%) | 0 (0.0%) |
| Construction & Extraction | 8 (100.0%) | 0 (0.0%) |
| Installation, Maintenance & Repair | 52 (100.0%) | 0 (0.0%) |
| Total (Category) | 60 (100.0%) | 0 (0.0%) |
| Total (Overall) | 869 (45.0%) | 1,064 (55.0%) |
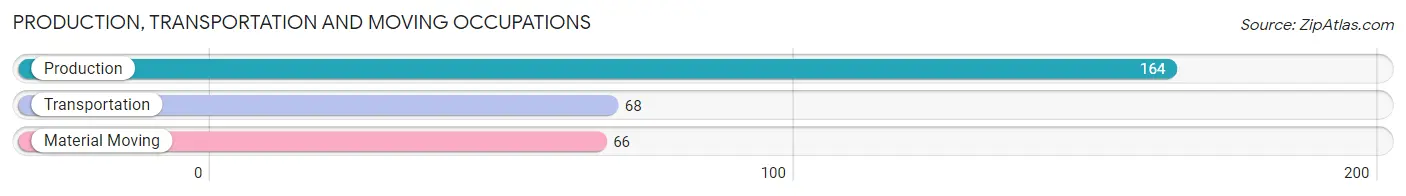
Production, Transportation and Moving Occupations
The most common Production, Transportation and Moving occupations in Spurgeon are Production (164 | 8.5%), Transportation (68 | 3.5%), and Material Moving (66 | 3.4%).
Production, Transportation and Moving Occupations by Sex
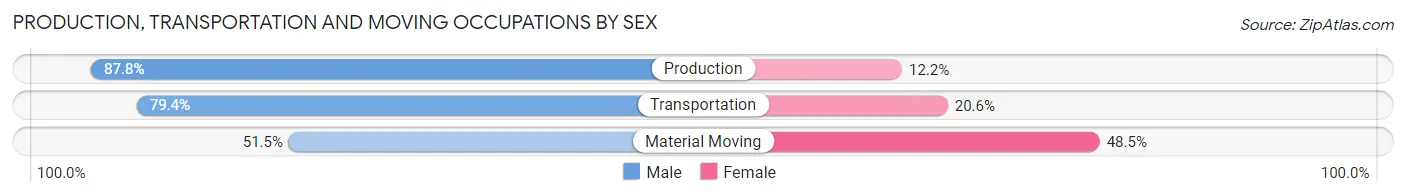
| Occupation | Male | Female |
| Production | 144 (87.8%) | 20 (12.2%) |
| Transportation | 54 (79.4%) | 14 (20.6%) |
| Material Moving | 34 (51.5%) | 32 (48.5%) |
| Total (Category) | 232 (77.8%) | 66 (22.2%) |
| Total (Overall) | 869 (45.0%) | 1,064 (55.0%) |
Employment Industries by Sex in Spurgeon
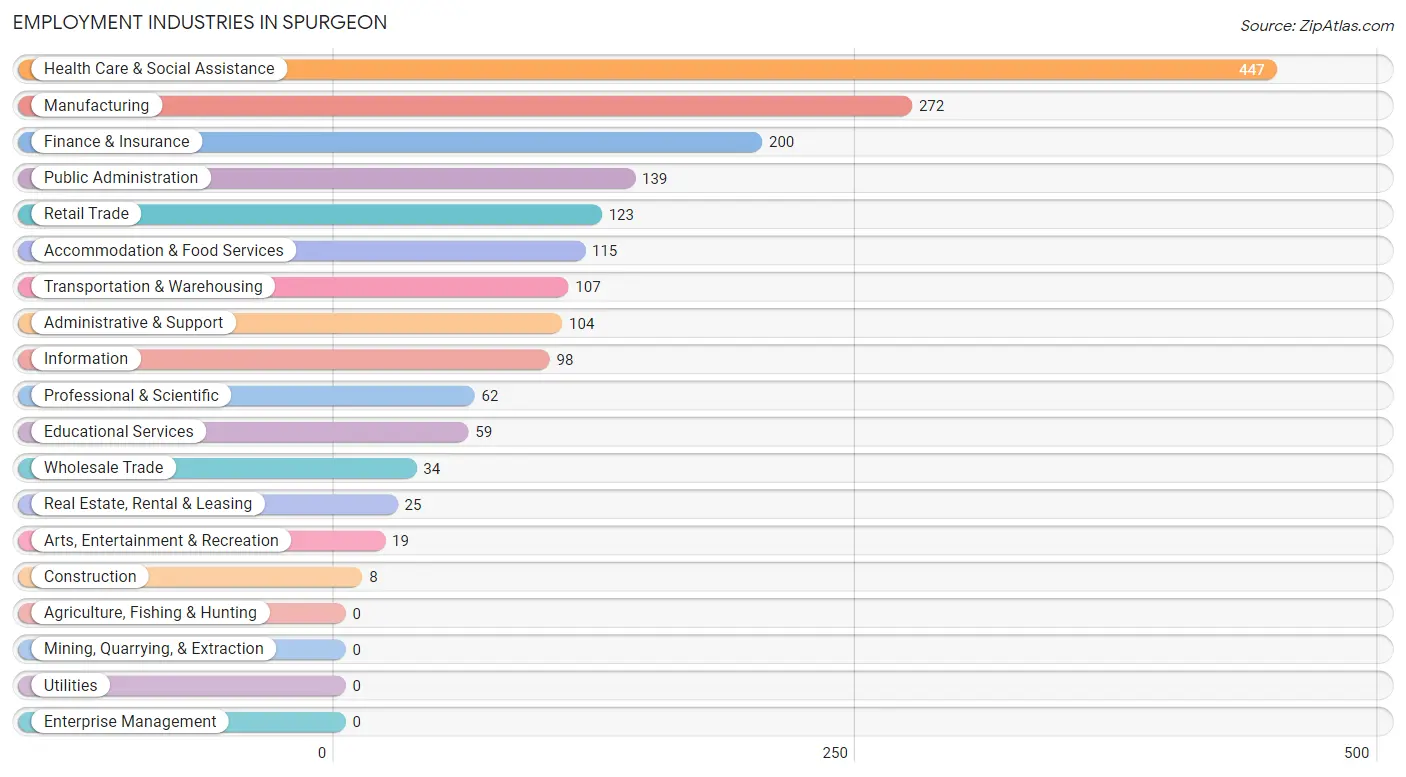
Employment Industries in Spurgeon
The major employment industries in Spurgeon include Health Care & Social Assistance (447 | 23.1%), Manufacturing (272 | 14.1%), Finance & Insurance (200 | 10.3%), Public Administration (139 | 7.2%), and Retail Trade (123 | 6.4%).
Employment Industries by Sex in Spurgeon
The Spurgeon industries that see more men than women are Construction (100.0%), Wholesale Trade (100.0%), and Real Estate, Rental & Leasing (100.0%), whereas the industries that tend to have a higher number of women are Educational Services (100.0%), Finance & Insurance (93.5%), and Professional & Scientific (74.2%).
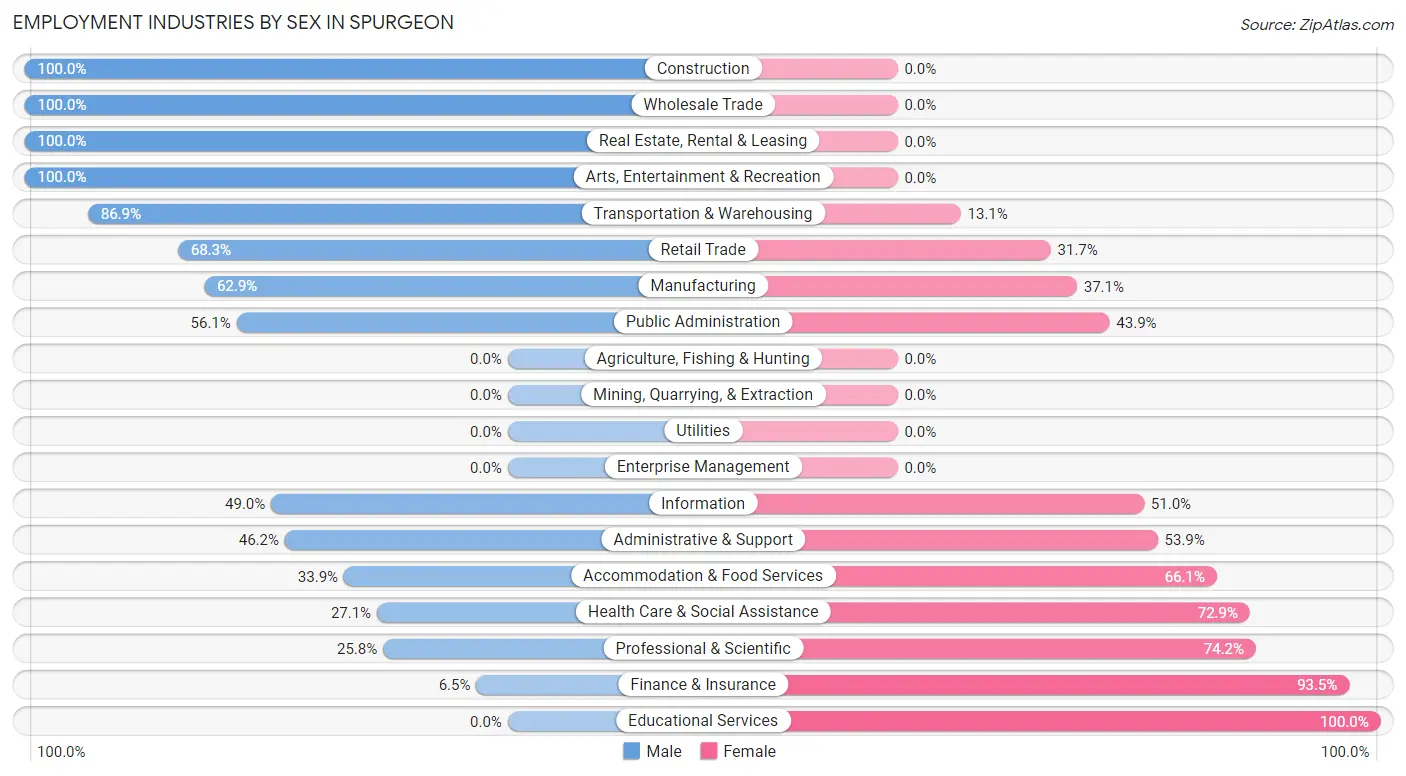
| Industry | Male | Female |
| Agriculture, Fishing & Hunting | 0 (0.0%) | 0 (0.0%) |
| Mining, Quarrying, & Extraction | 0 (0.0%) | 0 (0.0%) |
| Construction | 8 (100.0%) | 0 (0.0%) |
| Manufacturing | 171 (62.9%) | 101 (37.1%) |
| Wholesale Trade | 34 (100.0%) | 0 (0.0%) |
| Retail Trade | 84 (68.3%) | 39 (31.7%) |
| Transportation & Warehousing | 93 (86.9%) | 14 (13.1%) |
| Utilities | 0 (0.0%) | 0 (0.0%) |
| Information | 48 (49.0%) | 50 (51.0%) |
| Finance & Insurance | 13 (6.5%) | 187 (93.5%) |
| Real Estate, Rental & Leasing | 25 (100.0%) | 0 (0.0%) |
| Professional & Scientific | 16 (25.8%) | 46 (74.2%) |
| Enterprise Management | 0 (0.0%) | 0 (0.0%) |
| Administrative & Support | 48 (46.2%) | 56 (53.8%) |
| Educational Services | 0 (0.0%) | 59 (100.0%) |
| Health Care & Social Assistance | 121 (27.1%) | 326 (72.9%) |
| Arts, Entertainment & Recreation | 19 (100.0%) | 0 (0.0%) |
| Accommodation & Food Services | 39 (33.9%) | 76 (66.1%) |
| Public Administration | 78 (56.1%) | 61 (43.9%) |
| Total | 869 (45.0%) | 1,064 (55.0%) |
Education in Spurgeon
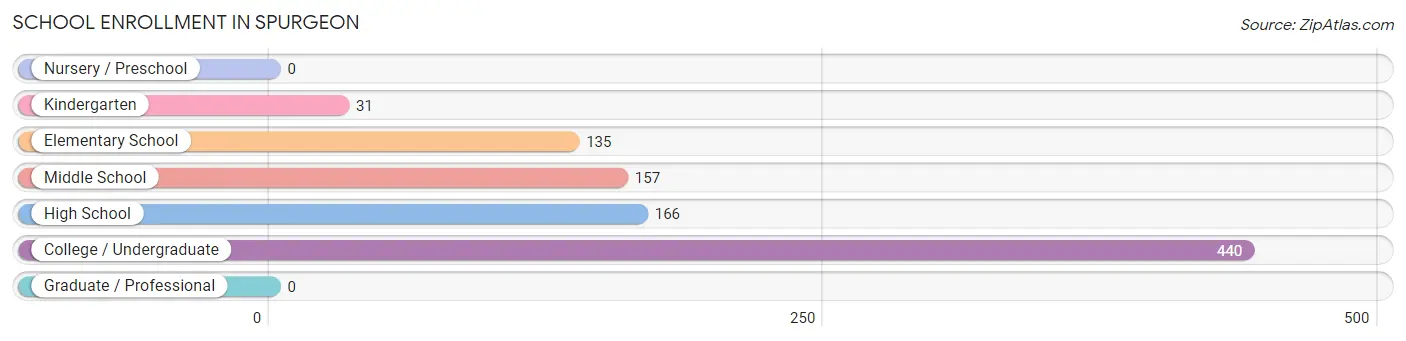
School Enrollment in Spurgeon
The most common levels of schooling among the 929 students in Spurgeon are college / undergraduate (440 | 47.4%), high school (166 | 17.9%), and middle school (157 | 16.9%).
| School Level | # Students | % Students |
| Nursery / Preschool | 0 | 0.0% |
| Kindergarten | 31 | 3.3% |
| Elementary School | 135 | 14.5% |
| Middle School | 157 | 16.9% |
| High School | 166 | 17.9% |
| College / Undergraduate | 440 | 47.4% |
| Graduate / Professional | 0 | 0.0% |
| Total | 929 | 100.0% |
School Enrollment by Age by Funding Source in Spurgeon
Out of a total of 929 students who are enrolled in schools in Spurgeon, 96 (10.3%) attend a private institution, while the remaining 833 (89.7%) are enrolled in public schools. The age group of 18 to 19 year olds has the highest likelihood of being enrolled in private schools, with 34 (35.0% in the age bracket) enrolled. Conversely, the age group of 5 to 9 year old has the lowest likelihood of being enrolled in a private school, with 136 (100.0% in the age bracket) attending a public institution.
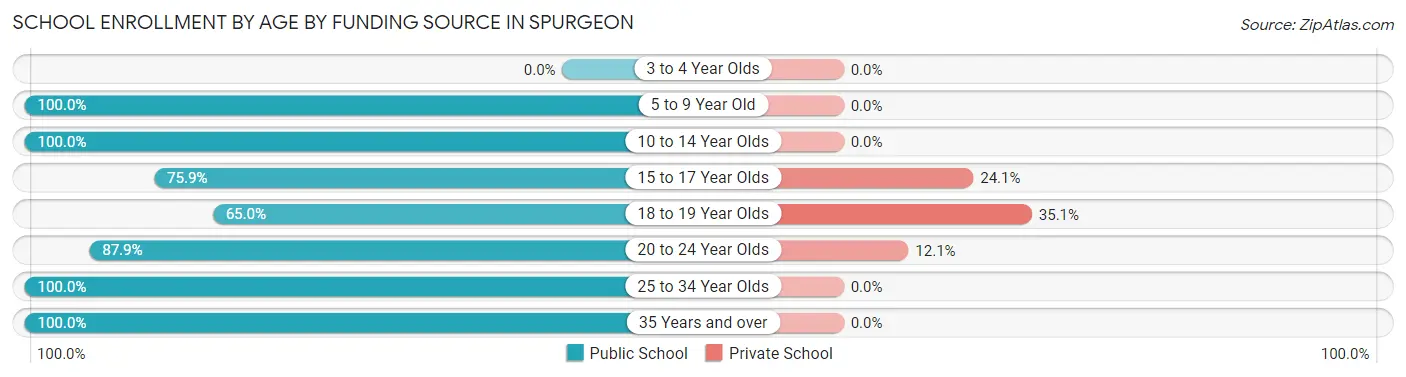
| Age Bracket | Public School | Private School |
| 3 to 4 Year Olds | 0 (0.0%) | 0 (0.0%) |
| 5 to 9 Year Old | 136 (100.0%) | 0 (0.0%) |
| 10 to 14 Year Olds | 218 (100.0%) | 0 (0.0%) |
| 15 to 17 Year Olds | 66 (75.9%) | 21 (24.1%) |
| 18 to 19 Year Olds | 63 (64.9%) | 34 (35.0%) |
| 20 to 24 Year Olds | 299 (87.9%) | 41 (12.1%) |
| 25 to 34 Year Olds | 18 (100.0%) | 0 (0.0%) |
| 35 Years and over | 33 (100.0%) | 0 (0.0%) |
| Total | 833 (89.7%) | 96 (10.3%) |
Educational Attainment by Field of Study in Spurgeon
Science & technology (228 | 25.7%), business (152 | 17.2%), education (96 | 10.8%), computers & mathematics (63 | 7.1%), and engineering (60 | 6.8%) are the most common fields of study among 886 individuals in Spurgeon who have obtained a bachelor's degree or higher.
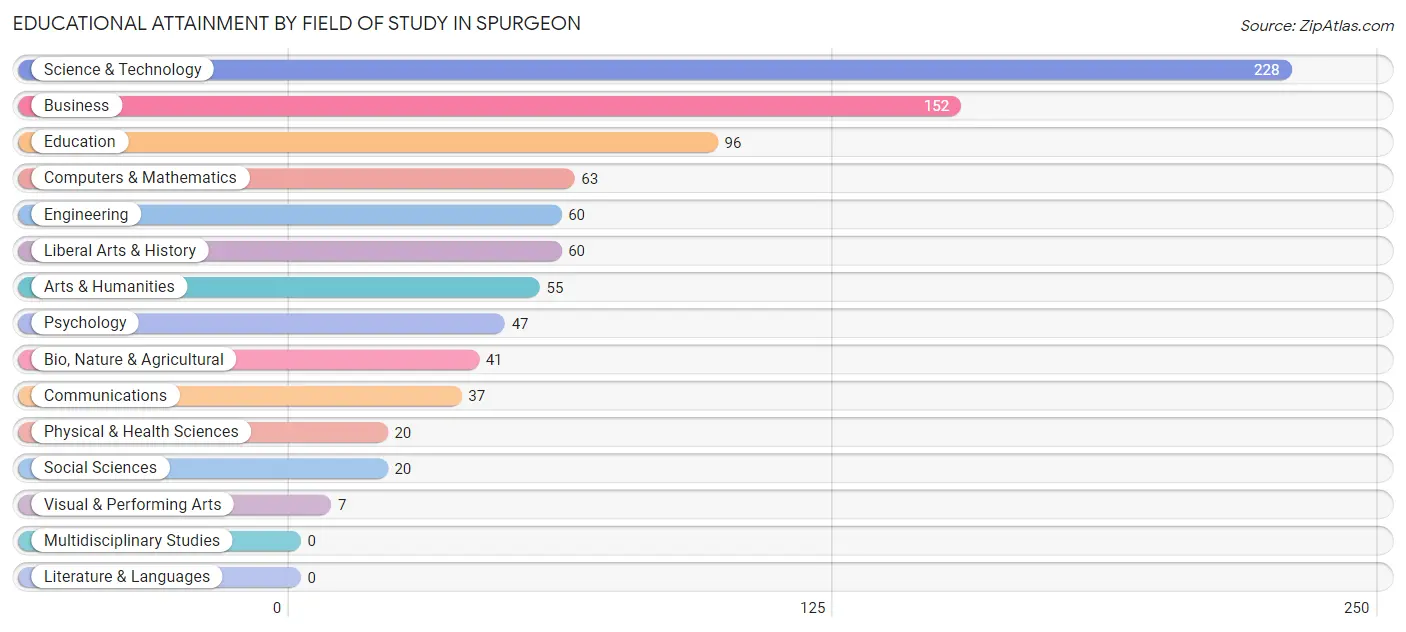
| Field of Study | # Graduates | % Graduates |
| Computers & Mathematics | 63 | 7.1% |
| Bio, Nature & Agricultural | 41 | 4.6% |
| Physical & Health Sciences | 20 | 2.3% |
| Psychology | 47 | 5.3% |
| Social Sciences | 20 | 2.3% |
| Engineering | 60 | 6.8% |
| Multidisciplinary Studies | 0 | 0.0% |
| Science & Technology | 228 | 25.7% |
| Business | 152 | 17.2% |
| Education | 96 | 10.8% |
| Literature & Languages | 0 | 0.0% |
| Liberal Arts & History | 60 | 6.8% |
| Visual & Performing Arts | 7 | 0.8% |
| Communications | 37 | 4.2% |
| Arts & Humanities | 55 | 6.2% |
| Total | 886 | 100.0% |
Transportation & Commute in Spurgeon
Vehicle Availability by Sex in Spurgeon
The most prevalent vehicle ownership categories in Spurgeon are males with 2 vehicles (270, accounting for 31.4%) and females with 2 vehicles (308, making up 25.4%).
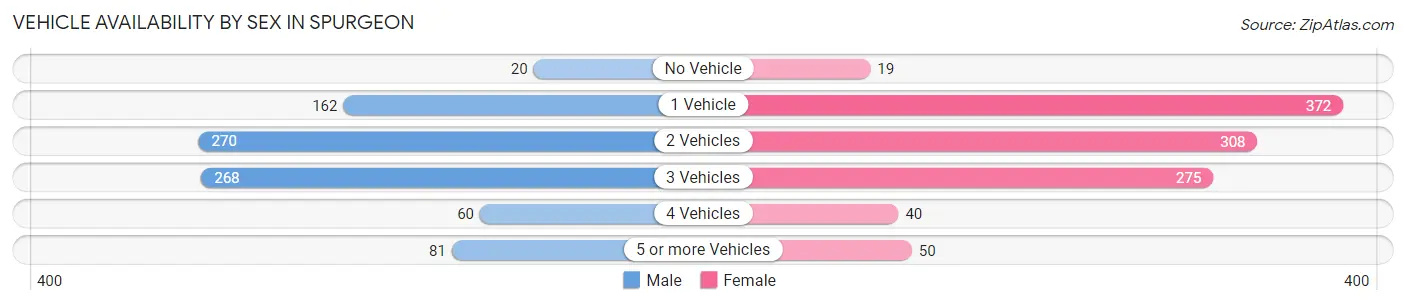
| Vehicles Available | Male | Female |
| No Vehicle | 20 (2.3%) | 19 (1.8%) |
| 1 Vehicle | 162 (18.8%) | 372 (35.0%) |
| 2 Vehicles | 270 (31.4%) | 308 (28.9%) |
| 3 Vehicles | 268 (31.1%) | 275 (25.9%) |
| 4 Vehicles | 60 (7.0%) | 40 (3.8%) |
| 5 or more Vehicles | 81 (9.4%) | 50 (4.7%) |
| Total | 861 (100.0%) | 1,064 (100.0%) |
Commute Time in Spurgeon
The most frequently occuring commute durations in Spurgeon are 20 to 24 minutes (468 commuters, 29.0%), 15 to 19 minutes (352 commuters, 21.8%), and 30 to 34 minutes (204 commuters, 12.7%).
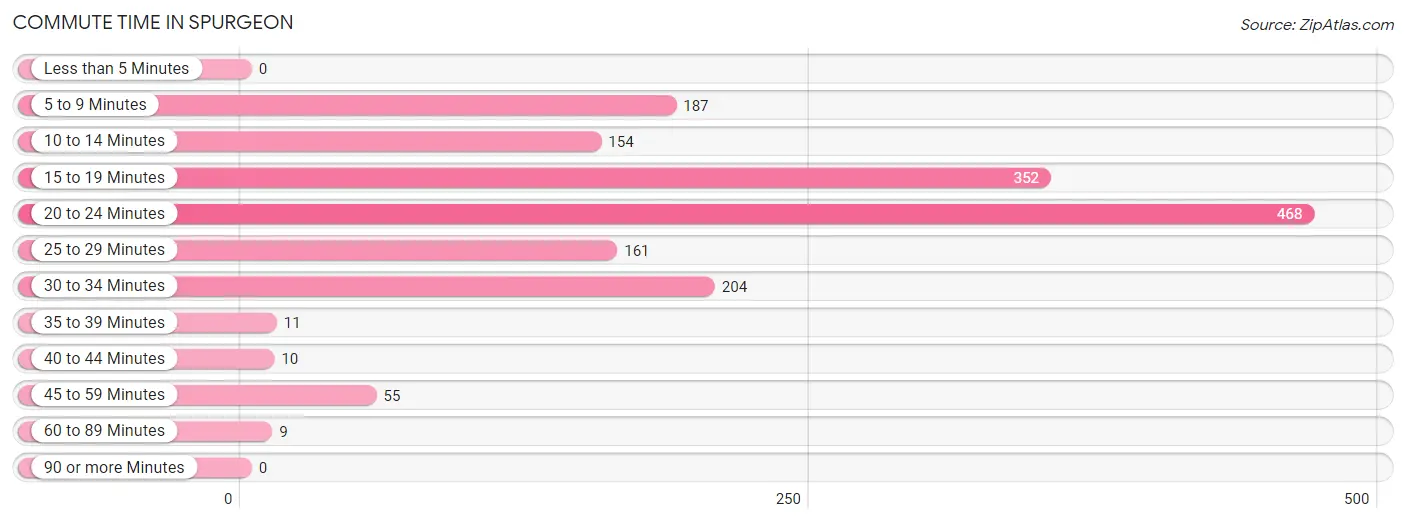
| Commute Time | # Commuters | % Commuters |
| Less than 5 Minutes | 0 | 0.0% |
| 5 to 9 Minutes | 187 | 11.6% |
| 10 to 14 Minutes | 154 | 9.6% |
| 15 to 19 Minutes | 352 | 21.8% |
| 20 to 24 Minutes | 468 | 29.0% |
| 25 to 29 Minutes | 161 | 10.0% |
| 30 to 34 Minutes | 204 | 12.7% |
| 35 to 39 Minutes | 11 | 0.7% |
| 40 to 44 Minutes | 10 | 0.6% |
| 45 to 59 Minutes | 55 | 3.4% |
| 60 to 89 Minutes | 9 | 0.6% |
| 90 or more Minutes | 0 | 0.0% |
Commute Time by Sex in Spurgeon
The most common commute times in Spurgeon are 20 to 24 minutes (213 commuters, 27.7%) for males and 20 to 24 minutes (255 commuters, 30.2%) for females.
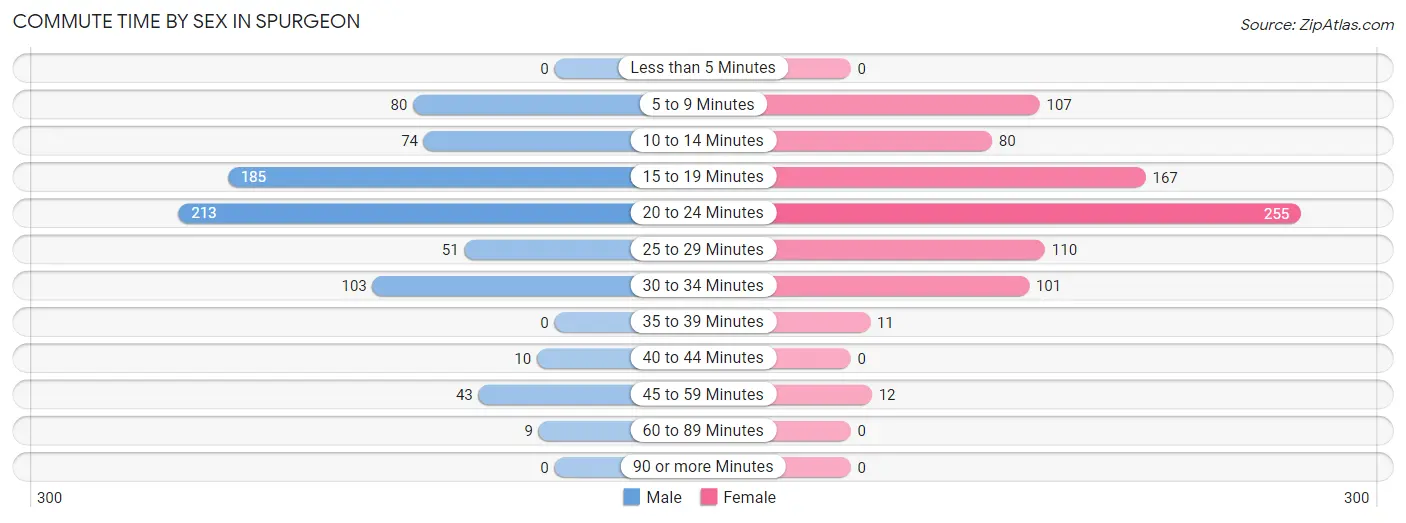
| Commute Time | Male | Female |
| Less than 5 Minutes | 0 (0.0%) | 0 (0.0%) |
| 5 to 9 Minutes | 80 (10.4%) | 107 (12.7%) |
| 10 to 14 Minutes | 74 (9.6%) | 80 (9.5%) |
| 15 to 19 Minutes | 185 (24.1%) | 167 (19.8%) |
| 20 to 24 Minutes | 213 (27.7%) | 255 (30.2%) |
| 25 to 29 Minutes | 51 (6.6%) | 110 (13.1%) |
| 30 to 34 Minutes | 103 (13.4%) | 101 (12.0%) |
| 35 to 39 Minutes | 0 (0.0%) | 11 (1.3%) |
| 40 to 44 Minutes | 10 (1.3%) | 0 (0.0%) |
| 45 to 59 Minutes | 43 (5.6%) | 12 (1.4%) |
| 60 to 89 Minutes | 9 (1.2%) | 0 (0.0%) |
| 90 or more Minutes | 0 (0.0%) | 0 (0.0%) |
Time of Departure to Work by Sex in Spurgeon
The most frequent times of departure to work in Spurgeon are 7:30 AM to 7:59 AM (175, 22.8%) for males and 8:00 AM to 8:29 AM (217, 25.7%) for females.
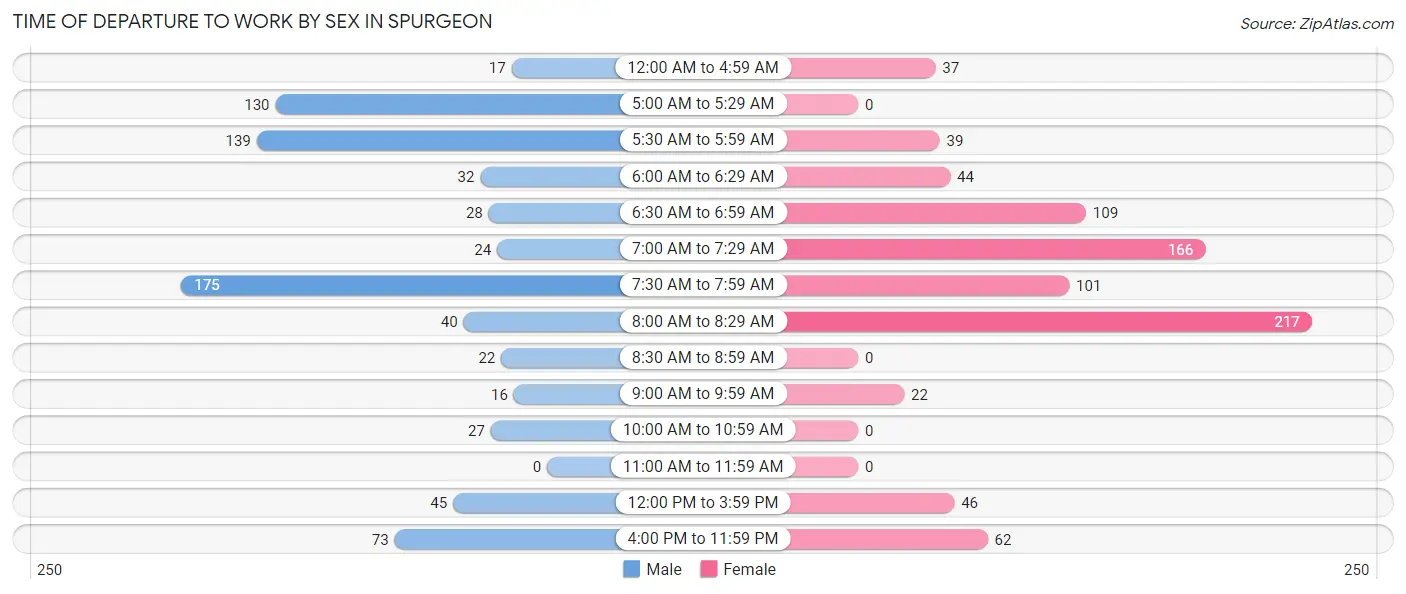
| Time of Departure | Male | Female |
| 12:00 AM to 4:59 AM | 17 (2.2%) | 37 (4.4%) |
| 5:00 AM to 5:29 AM | 130 (16.9%) | 0 (0.0%) |
| 5:30 AM to 5:59 AM | 139 (18.1%) | 39 (4.6%) |
| 6:00 AM to 6:29 AM | 32 (4.2%) | 44 (5.2%) |
| 6:30 AM to 6:59 AM | 28 (3.6%) | 109 (12.9%) |
| 7:00 AM to 7:29 AM | 24 (3.1%) | 166 (19.7%) |
| 7:30 AM to 7:59 AM | 175 (22.8%) | 101 (12.0%) |
| 8:00 AM to 8:29 AM | 40 (5.2%) | 217 (25.7%) |
| 8:30 AM to 8:59 AM | 22 (2.9%) | 0 (0.0%) |
| 9:00 AM to 9:59 AM | 16 (2.1%) | 22 (2.6%) |
| 10:00 AM to 10:59 AM | 27 (3.5%) | 0 (0.0%) |
| 11:00 AM to 11:59 AM | 0 (0.0%) | 0 (0.0%) |
| 12:00 PM to 3:59 PM | 45 (5.9%) | 46 (5.5%) |
| 4:00 PM to 11:59 PM | 73 (9.5%) | 62 (7.3%) |
| Total | 768 (100.0%) | 843 (100.0%) |
Housing Occupancy in Spurgeon
Occupancy by Ownership in Spurgeon
Of the total 1,815 dwellings in Spurgeon, owner-occupied units account for 1,353 (74.6%), while renter-occupied units make up 462 (25.5%).
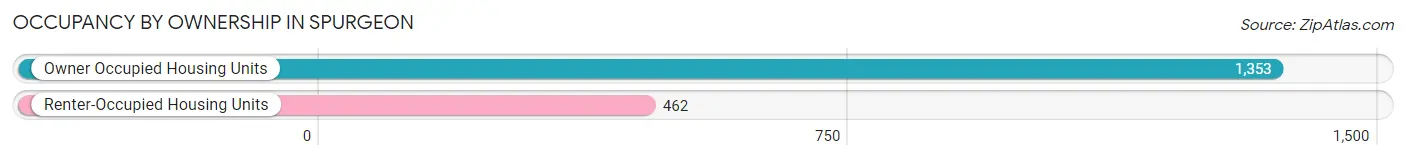
| Occupancy | # Housing Units | % Housing Units |
| Owner Occupied Housing Units | 1,353 | 74.6% |
| Renter-Occupied Housing Units | 462 | 25.5% |
| Total Occupied Housing Units | 1,815 | 100.0% |
Occupancy by Household Size in Spurgeon
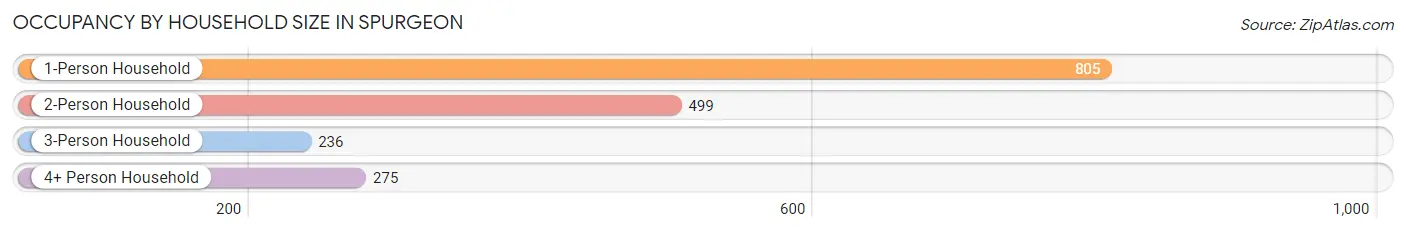
| Household Size | # Housing Units | % Housing Units |
| 1-Person Household | 805 | 44.4% |
| 2-Person Household | 499 | 27.5% |
| 3-Person Household | 236 | 13.0% |
| 4+ Person Household | 275 | 15.1% |
| Total Housing Units | 1,815 | 100.0% |
Occupancy by Ownership by Household Size in Spurgeon
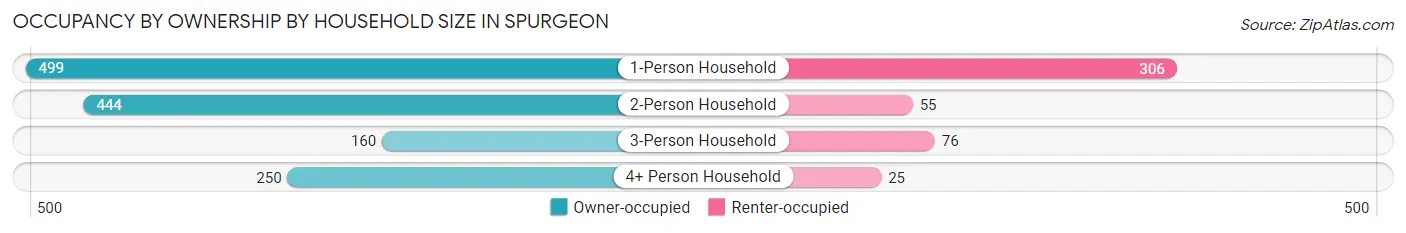
| Household Size | Owner-occupied | Renter-occupied |
| 1-Person Household | 499 (62.0%) | 306 (38.0%) |
| 2-Person Household | 444 (89.0%) | 55 (11.0%) |
| 3-Person Household | 160 (67.8%) | 76 (32.2%) |
| 4+ Person Household | 250 (90.9%) | 25 (9.1%) |
| Total Housing Units | 1,353 (74.6%) | 462 (25.5%) |
Occupancy by Educational Attainment in Spurgeon
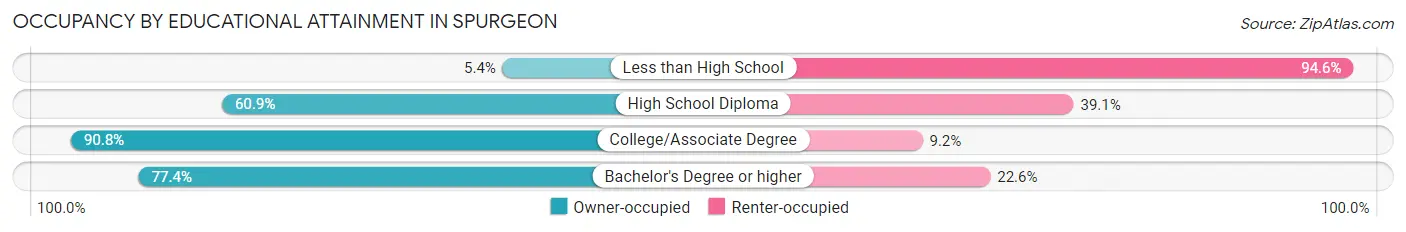
| Household Size | Owner-occupied | Renter-occupied |
| Less than High School | 4 (5.4%) | 70 (94.6%) |
| High School Diploma | 311 (60.9%) | 200 (39.1%) |
| College/Associate Degree | 583 (90.8%) | 59 (9.2%) |
| Bachelor's Degree or higher | 455 (77.4%) | 133 (22.6%) |
Occupancy by Age of Householder in Spurgeon
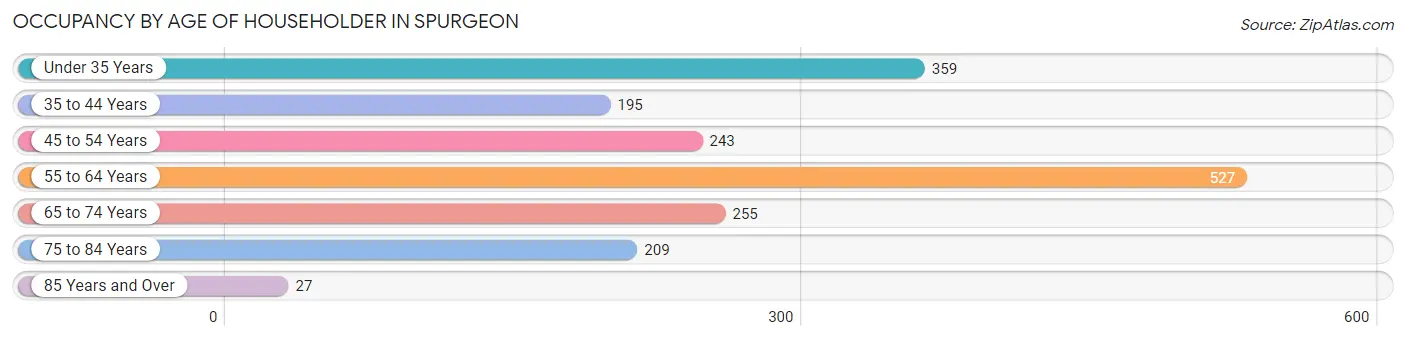
| Age Bracket | # Households | % Households |
| Under 35 Years | 359 | 19.8% |
| 35 to 44 Years | 195 | 10.7% |
| 45 to 54 Years | 243 | 13.4% |
| 55 to 64 Years | 527 | 29.0% |
| 65 to 74 Years | 255 | 14.1% |
| 75 to 84 Years | 209 | 11.5% |
| 85 Years and Over | 27 | 1.5% |
| Total | 1,815 | 100.0% |
Housing Finances in Spurgeon
Median Income by Occupancy in Spurgeon
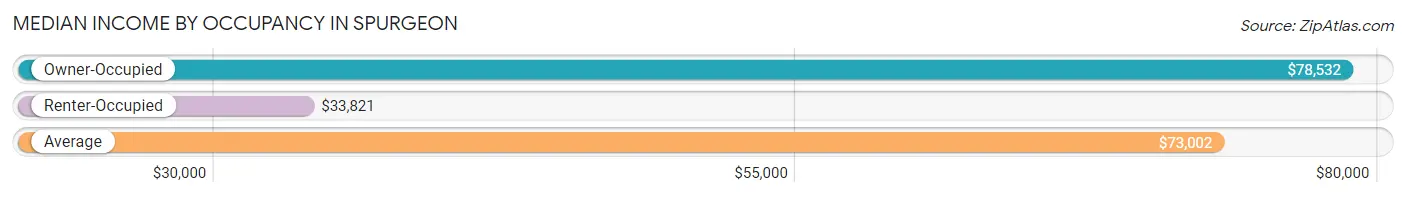
| Occupancy Type | # Households | Median Income |
| Owner-Occupied | 1,353 (74.6%) | $78,532 |
| Renter-Occupied | 462 (25.5%) | $33,821 |
| Average | 1,815 (100.0%) | $73,002 |
Occupancy by Householder Income Bracket in Spurgeon
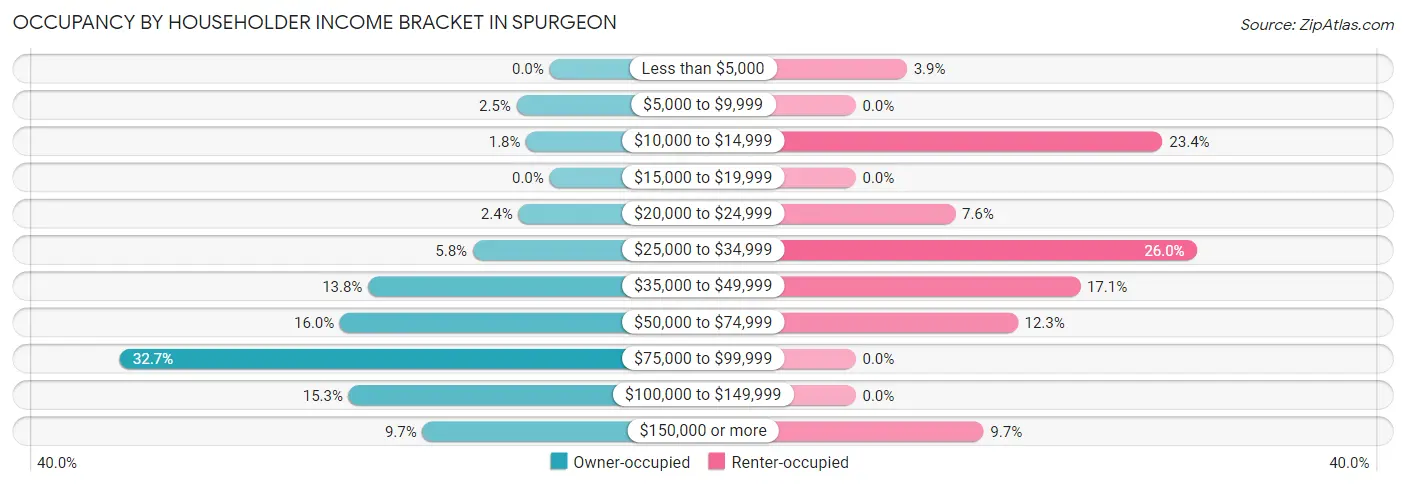
| Income Bracket | Owner-occupied | Renter-occupied |
| Less than $5,000 | 0 (0.0%) | 18 (3.9%) |
| $5,000 to $9,999 | 34 (2.5%) | 0 (0.0%) |
| $10,000 to $14,999 | 24 (1.8%) | 108 (23.4%) |
| $15,000 to $19,999 | 0 (0.0%) | 0 (0.0%) |
| $20,000 to $24,999 | 32 (2.4%) | 35 (7.6%) |
| $25,000 to $34,999 | 79 (5.8%) | 120 (26.0%) |
| $35,000 to $49,999 | 187 (13.8%) | 79 (17.1%) |
| $50,000 to $74,999 | 216 (16.0%) | 57 (12.3%) |
| $75,000 to $99,999 | 443 (32.7%) | 0 (0.0%) |
| $100,000 to $149,999 | 207 (15.3%) | 0 (0.0%) |
| $150,000 or more | 131 (9.7%) | 45 (9.7%) |
| Total | 1,353 (100.0%) | 462 (100.0%) |
Monthly Housing Cost Tiers in Spurgeon
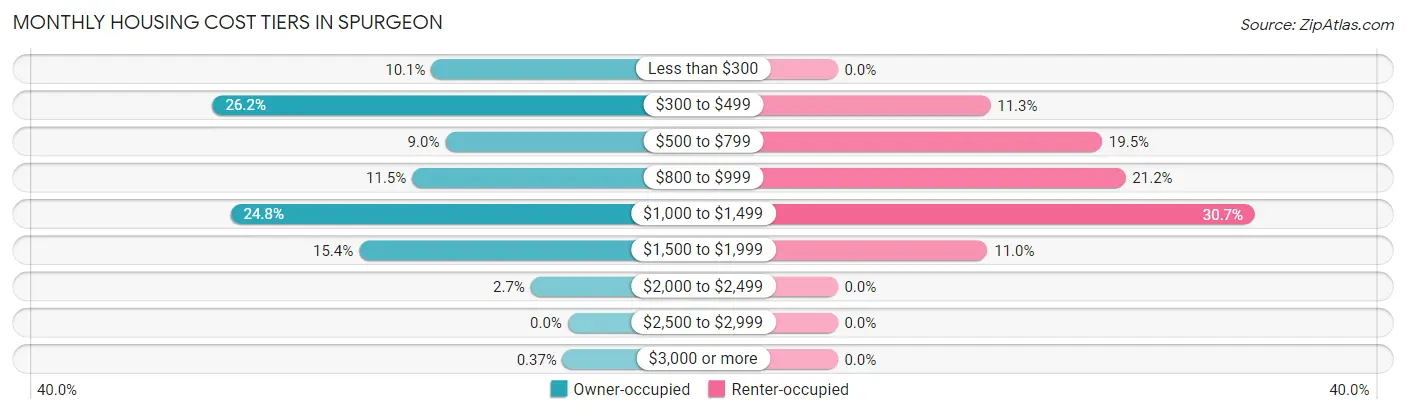
| Monthly Cost | Owner-occupied | Renter-occupied |
| Less than $300 | 136 (10.1%) | 0 (0.0%) |
| $300 to $499 | 354 (26.2%) | 52 (11.3%) |
| $500 to $799 | 122 (9.0%) | 90 (19.5%) |
| $800 to $999 | 155 (11.5%) | 98 (21.2%) |
| $1,000 to $1,499 | 336 (24.8%) | 142 (30.7%) |
| $1,500 to $1,999 | 208 (15.4%) | 51 (11.0%) |
| $2,000 to $2,499 | 37 (2.7%) | 0 (0.0%) |
| $2,500 to $2,999 | 0 (0.0%) | 0 (0.0%) |
| $3,000 or more | 5 (0.4%) | 0 (0.0%) |
| Total | 1,353 (100.0%) | 462 (100.0%) |
Physical Housing Characteristics in Spurgeon
Housing Structures in Spurgeon
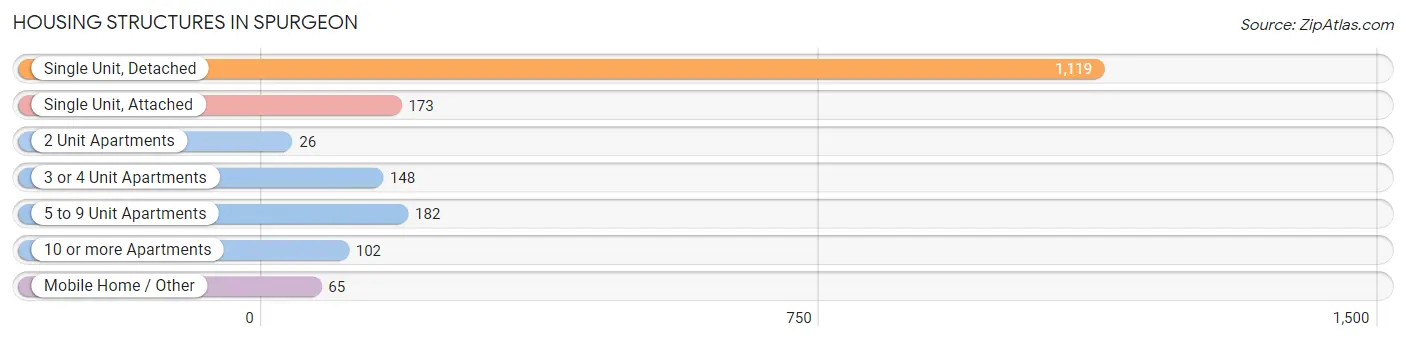
| Structure Type | # Housing Units | % Housing Units |
| Single Unit, Detached | 1,119 | 61.7% |
| Single Unit, Attached | 173 | 9.5% |
| 2 Unit Apartments | 26 | 1.4% |
| 3 or 4 Unit Apartments | 148 | 8.2% |
| 5 to 9 Unit Apartments | 182 | 10.0% |
| 10 or more Apartments | 102 | 5.6% |
| Mobile Home / Other | 65 | 3.6% |
| Total | 1,815 | 100.0% |
Housing Structures by Occupancy in Spurgeon
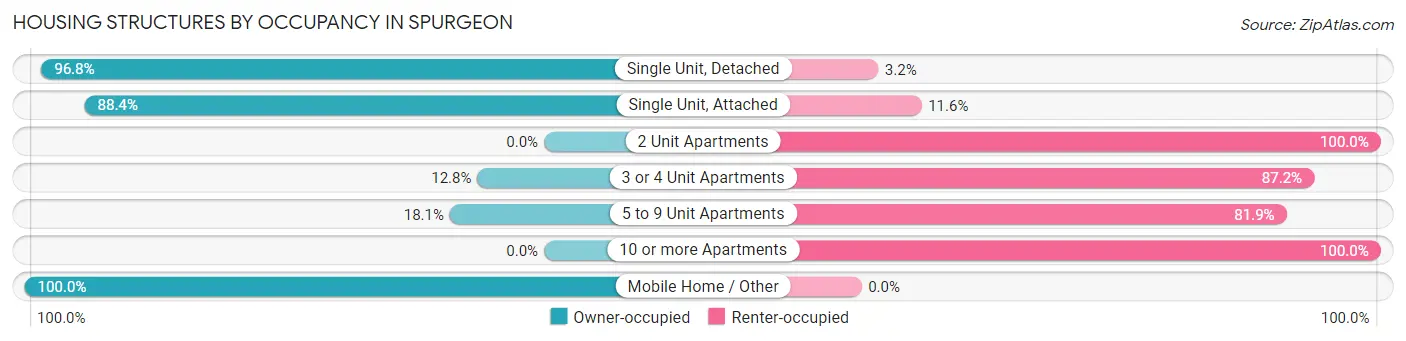
| Structure Type | Owner-occupied | Renter-occupied |
| Single Unit, Detached | 1,083 (96.8%) | 36 (3.2%) |
| Single Unit, Attached | 153 (88.4%) | 20 (11.6%) |
| 2 Unit Apartments | 0 (0.0%) | 26 (100.0%) |
| 3 or 4 Unit Apartments | 19 (12.8%) | 129 (87.2%) |
| 5 to 9 Unit Apartments | 33 (18.1%) | 149 (81.9%) |
| 10 or more Apartments | 0 (0.0%) | 102 (100.0%) |
| Mobile Home / Other | 65 (100.0%) | 0 (0.0%) |
| Total | 1,353 (74.6%) | 462 (25.5%) |
Housing Structures by Number of Rooms in Spurgeon
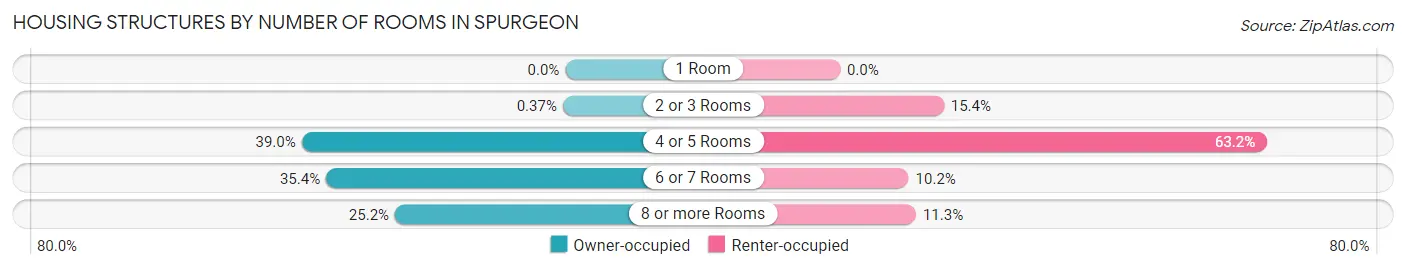
| Number of Rooms | Owner-occupied | Renter-occupied |
| 1 Room | 0 (0.0%) | 0 (0.0%) |
| 2 or 3 Rooms | 5 (0.4%) | 71 (15.4%) |
| 4 or 5 Rooms | 528 (39.0%) | 292 (63.2%) |
| 6 or 7 Rooms | 479 (35.4%) | 47 (10.2%) |
| 8 or more Rooms | 341 (25.2%) | 52 (11.3%) |
| Total | 1,353 (100.0%) | 462 (100.0%) |
Housing Structure by Heating Type in Spurgeon
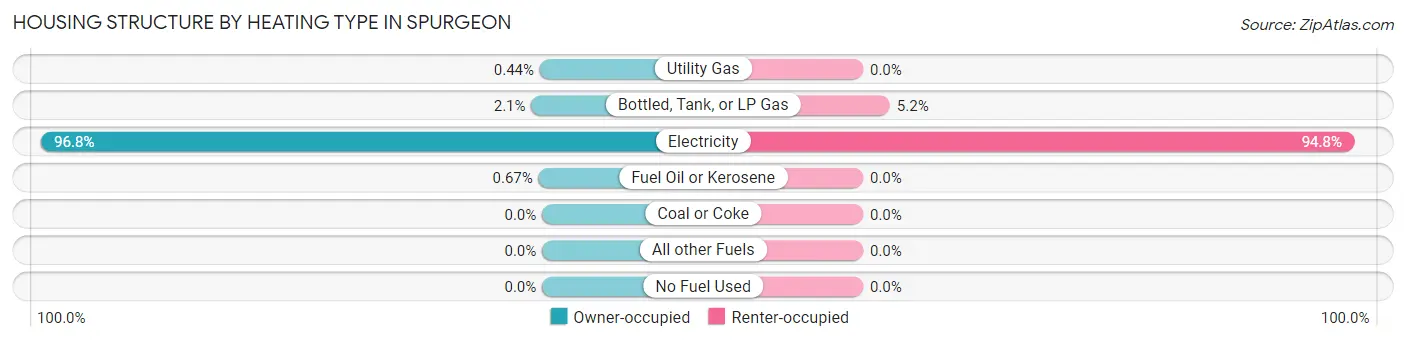
| Heating Type | Owner-occupied | Renter-occupied |
| Utility Gas | 6 (0.4%) | 0 (0.0%) |
| Bottled, Tank, or LP Gas | 28 (2.1%) | 24 (5.2%) |
| Electricity | 1,310 (96.8%) | 438 (94.8%) |
| Fuel Oil or Kerosene | 9 (0.7%) | 0 (0.0%) |
| Coal or Coke | 0 (0.0%) | 0 (0.0%) |
| All other Fuels | 0 (0.0%) | 0 (0.0%) |
| No Fuel Used | 0 (0.0%) | 0 (0.0%) |
| Total | 1,353 (100.0%) | 462 (100.0%) |
Household Vehicle Usage in Spurgeon
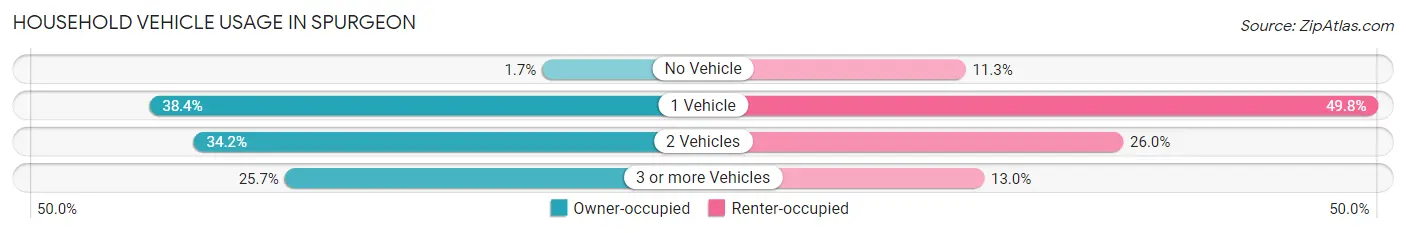
| Vehicles per Household | Owner-occupied | Renter-occupied |
| No Vehicle | 23 (1.7%) | 52 (11.3%) |
| 1 Vehicle | 519 (38.4%) | 230 (49.8%) |
| 2 Vehicles | 463 (34.2%) | 120 (26.0%) |
| 3 or more Vehicles | 348 (25.7%) | 60 (13.0%) |
| Total | 1,353 (100.0%) | 462 (100.0%) |
Real Estate & Mortgages in Spurgeon
Real Estate and Mortgage Overview in Spurgeon
| Characteristic | Without Mortgage | With Mortgage |
| Housing Units | 536 | 817 |
| Median Property Value | $182,900 | $173,100 |
| Median Household Income | $70,682 | $66 |
| Monthly Housing Costs | $396 | $5 |
| Real Estate Taxes | $1,033 | $0 |
Property Value by Mortgage Status in Spurgeon
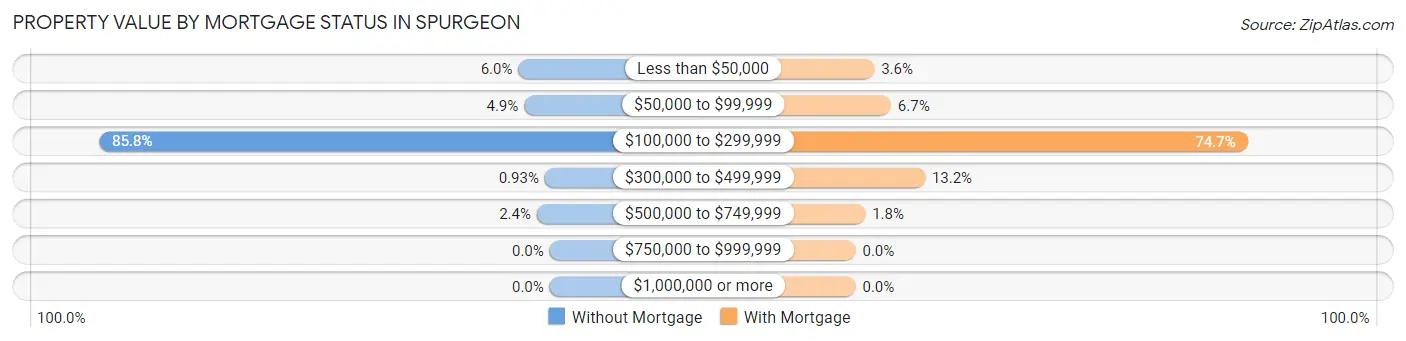
| Property Value | Without Mortgage | With Mortgage |
| Less than $50,000 | 32 (6.0%) | 29 (3.5%) |
| $50,000 to $99,999 | 26 (4.9%) | 55 (6.7%) |
| $100,000 to $299,999 | 460 (85.8%) | 610 (74.7%) |
| $300,000 to $499,999 | 5 (0.9%) | 108 (13.2%) |
| $500,000 to $749,999 | 13 (2.4%) | 15 (1.8%) |
| $750,000 to $999,999 | 0 (0.0%) | 0 (0.0%) |
| $1,000,000 or more | 0 (0.0%) | 0 (0.0%) |
| Total | 536 (100.0%) | 817 (100.0%) |
Household Income by Mortgage Status in Spurgeon
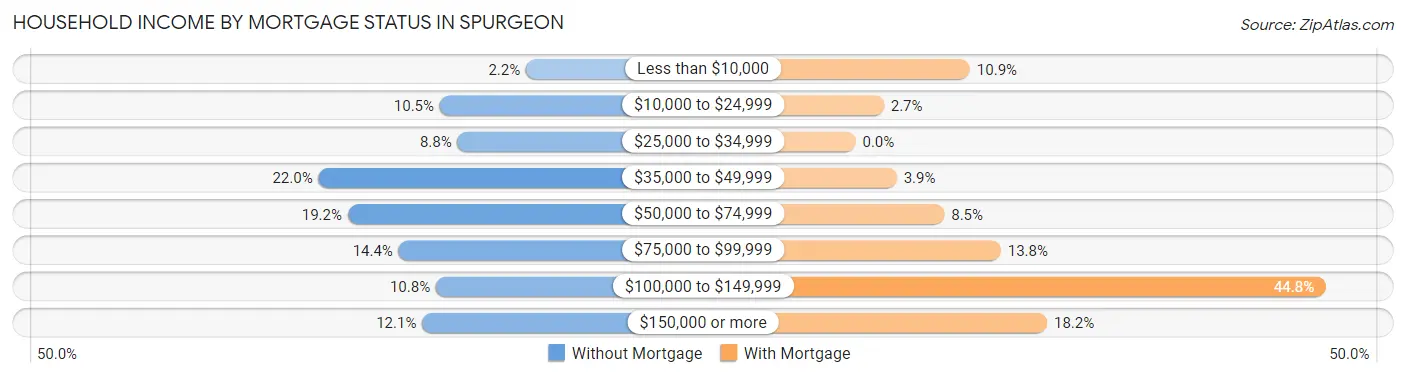
| Household Income | Without Mortgage | With Mortgage |
| Less than $10,000 | 12 (2.2%) | 89 (10.9%) |
| $10,000 to $24,999 | 56 (10.4%) | 22 (2.7%) |
| $25,000 to $34,999 | 47 (8.8%) | 0 (0.0%) |
| $35,000 to $49,999 | 118 (22.0%) | 32 (3.9%) |
| $50,000 to $74,999 | 103 (19.2%) | 69 (8.5%) |
| $75,000 to $99,999 | 77 (14.4%) | 113 (13.8%) |
| $100,000 to $149,999 | 58 (10.8%) | 366 (44.8%) |
| $150,000 or more | 65 (12.1%) | 149 (18.2%) |
| Total | 536 (100.0%) | 817 (100.0%) |
Property Value to Household Income Ratio in Spurgeon
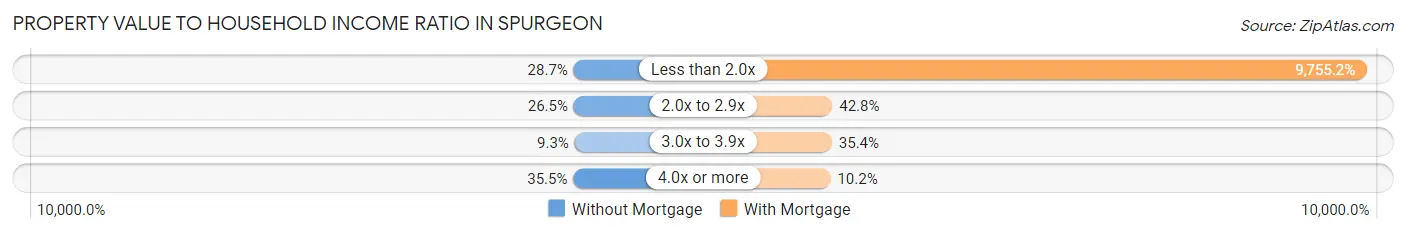
| Value-to-Income Ratio | Without Mortgage | With Mortgage |
| Less than 2.0x | 154 (28.7%) | 79,700 (9,755.2%) |
| 2.0x to 2.9x | 142 (26.5%) | 350 (42.8%) |
| 3.0x to 3.9x | 50 (9.3%) | 289 (35.4%) |
| 4.0x or more | 190 (35.4%) | 83 (10.2%) |
| Total | 536 (100.0%) | 817 (100.0%) |
Real Estate Taxes by Mortgage Status in Spurgeon
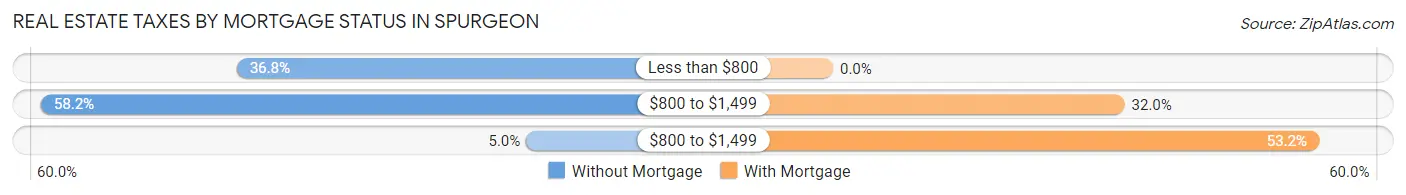
| Property Taxes | Without Mortgage | With Mortgage |
| Less than $800 | 197 (36.7%) | 0 (0.0%) |
| $800 to $1,499 | 312 (58.2%) | 261 (32.0%) |
| $800 to $1,499 | 27 (5.0%) | 435 (53.2%) |
| Total | 536 (100.0%) | 817 (100.0%) |
Health & Disability in Spurgeon
Health Insurance Coverage by Age in Spurgeon
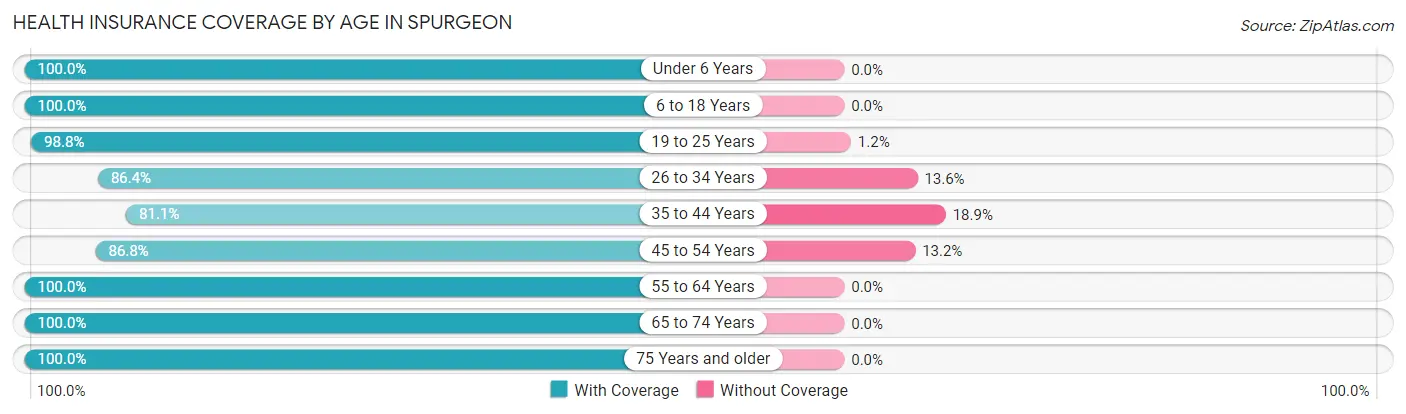
| Age Bracket | With Coverage | Without Coverage |
| Under 6 Years | 164 (100.0%) | 0 (0.0%) |
| 6 to 18 Years | 503 (100.0%) | 0 (0.0%) |
| 19 to 25 Years | 561 (98.8%) | 7 (1.2%) |
| 26 to 34 Years | 342 (86.4%) | 54 (13.6%) |
| 35 to 44 Years | 330 (81.1%) | 77 (18.9%) |
| 45 to 54 Years | 348 (86.8%) | 53 (13.2%) |
| 55 to 64 Years | 825 (100.0%) | 0 (0.0%) |
| 65 to 74 Years | 378 (100.0%) | 0 (0.0%) |
| 75 Years and older | 364 (100.0%) | 0 (0.0%) |
| Total | 3,815 (95.2%) | 191 (4.8%) |
Health Insurance Coverage by Citizenship Status in Spurgeon
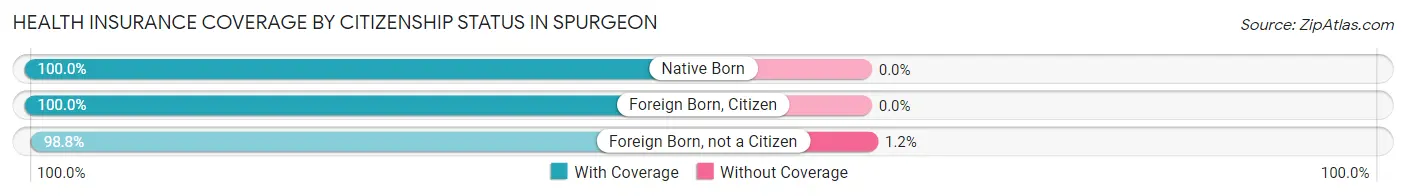
| Citizenship Status | With Coverage | Without Coverage |
| Native Born | 164 (100.0%) | 0 (0.0%) |
| Foreign Born, Citizen | 503 (100.0%) | 0 (0.0%) |
| Foreign Born, not a Citizen | 561 (98.8%) | 7 (1.2%) |
Health Insurance Coverage by Household Income in Spurgeon
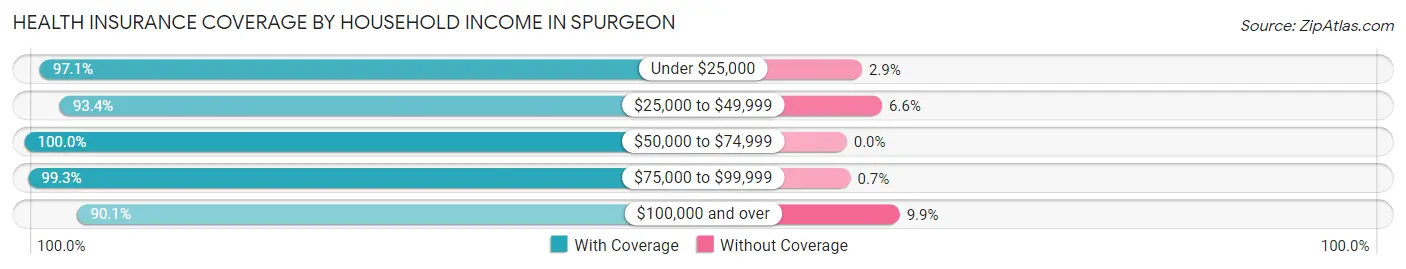
| Household Income | With Coverage | Without Coverage |
| Under $25,000 | 543 (97.1%) | 16 (2.9%) |
| $25,000 to $49,999 | 677 (93.4%) | 48 (6.6%) |
| $50,000 to $74,999 | 506 (100.0%) | 0 (0.0%) |
| $75,000 to $99,999 | 995 (99.3%) | 7 (0.7%) |
| $100,000 and over | 1,091 (90.1%) | 120 (9.9%) |
Public vs Private Health Insurance Coverage by Age in Spurgeon
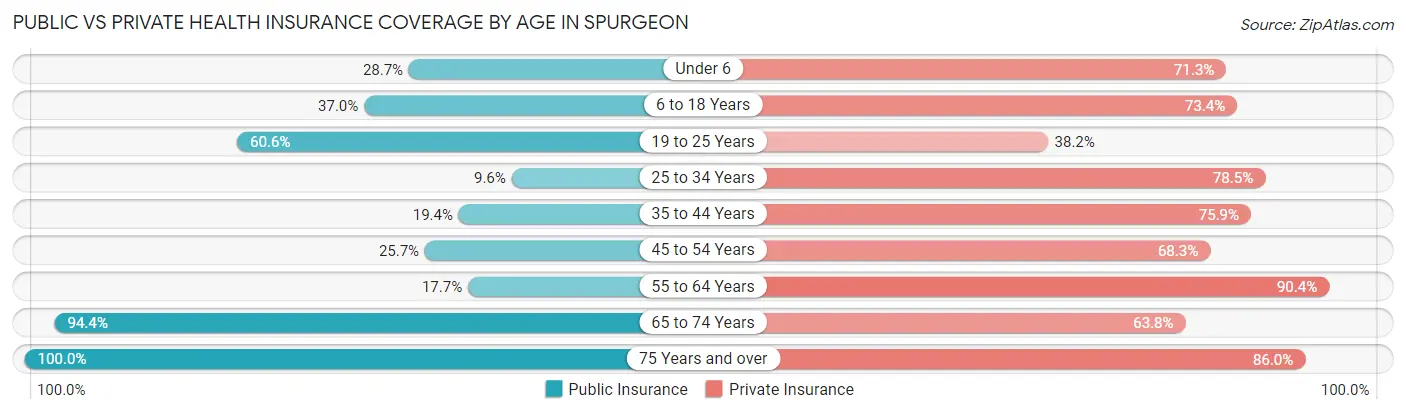
| Age Bracket | Public Insurance | Private Insurance |
| Under 6 | 47 (28.7%) | 117 (71.3%) |
| 6 to 18 Years | 186 (37.0%) | 369 (73.4%) |
| 19 to 25 Years | 344 (60.6%) | 217 (38.2%) |
| 25 to 34 Years | 38 (9.6%) | 311 (78.5%) |
| 35 to 44 Years | 79 (19.4%) | 309 (75.9%) |
| 45 to 54 Years | 103 (25.7%) | 274 (68.3%) |
| 55 to 64 Years | 146 (17.7%) | 746 (90.4%) |
| 65 to 74 Years | 357 (94.4%) | 241 (63.8%) |
| 75 Years and over | 364 (100.0%) | 313 (86.0%) |
| Total | 1,664 (41.5%) | 2,897 (72.3%) |
Disability Status by Sex by Age in Spurgeon
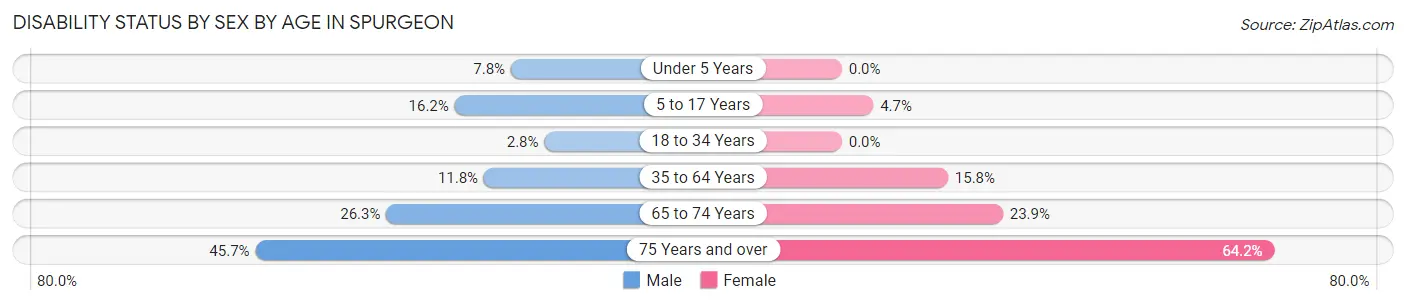
| Age Bracket | Male | Female |
| Under 5 Years | 7 (7.8%) | 0 (0.0%) |
| 5 to 17 Years | 52 (16.2%) | 7 (4.7%) |
| 18 to 34 Years | 10 (2.8%) | 0 (0.0%) |
| 35 to 64 Years | 87 (11.8%) | 141 (15.8%) |
| 65 to 74 Years | 51 (26.3%) | 44 (23.9%) |
| 75 Years and over | 91 (45.7%) | 106 (64.2%) |
Disability Class by Sex by Age in Spurgeon
Disability Class: Hearing Difficulty
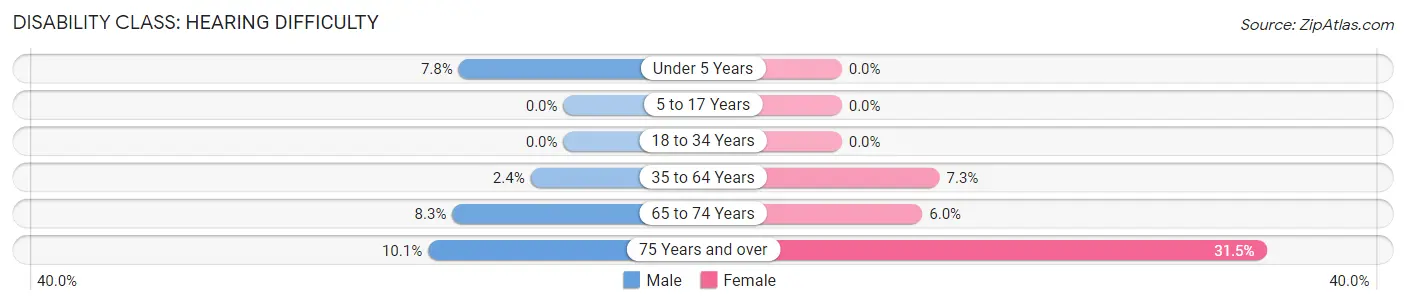
| Age Bracket | Male | Female |
| Under 5 Years | 7 (7.8%) | 0 (0.0%) |
| 5 to 17 Years | 0 (0.0%) | 0 (0.0%) |
| 18 to 34 Years | 0 (0.0%) | 0 (0.0%) |
| 35 to 64 Years | 18 (2.4%) | 65 (7.3%) |
| 65 to 74 Years | 16 (8.3%) | 11 (6.0%) |
| 75 Years and over | 20 (10.1%) | 52 (31.5%) |
Disability Class: Vision Difficulty
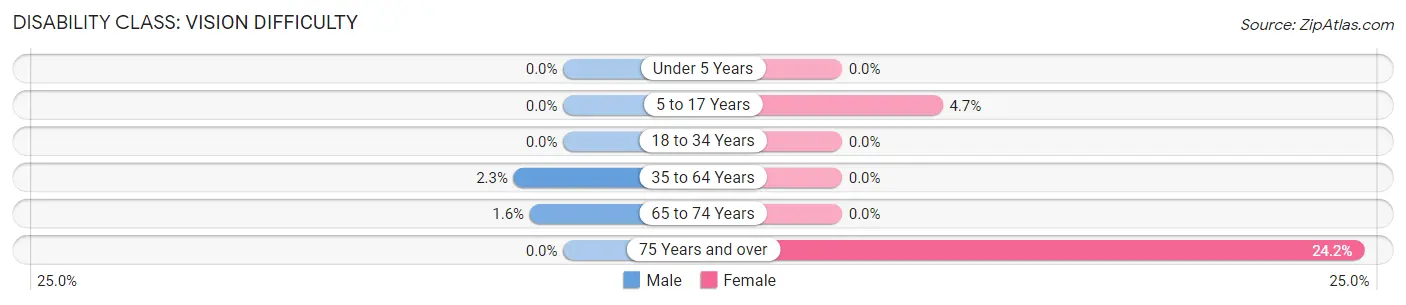
| Age Bracket | Male | Female |
| Under 5 Years | 0 (0.0%) | 0 (0.0%) |
| 5 to 17 Years | 0 (0.0%) | 7 (4.7%) |
| 18 to 34 Years | 0 (0.0%) | 0 (0.0%) |
| 35 to 64 Years | 17 (2.3%) | 0 (0.0%) |
| 65 to 74 Years | 3 (1.5%) | 0 (0.0%) |
| 75 Years and over | 0 (0.0%) | 40 (24.2%) |
Disability Class: Cognitive Difficulty
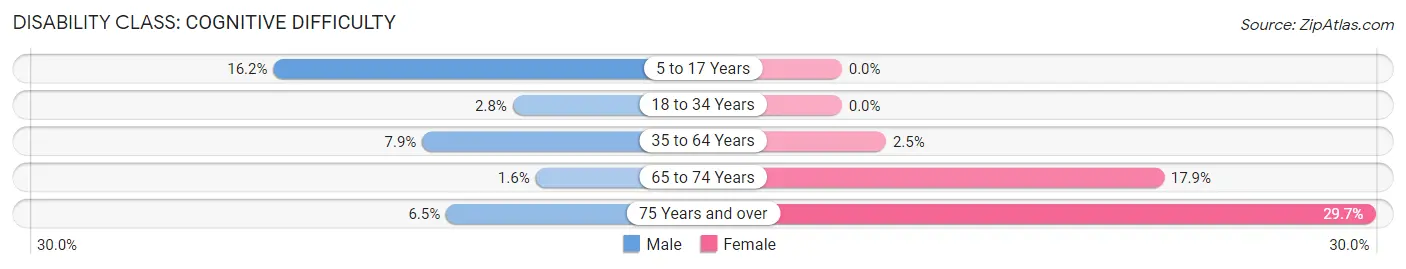
| Age Bracket | Male | Female |
| 5 to 17 Years | 52 (16.2%) | 0 (0.0%) |
| 18 to 34 Years | 10 (2.8%) | 0 (0.0%) |
| 35 to 64 Years | 58 (7.9%) | 22 (2.5%) |
| 65 to 74 Years | 3 (1.5%) | 33 (17.9%) |
| 75 Years and over | 13 (6.5%) | 49 (29.7%) |
Disability Class: Ambulatory Difficulty
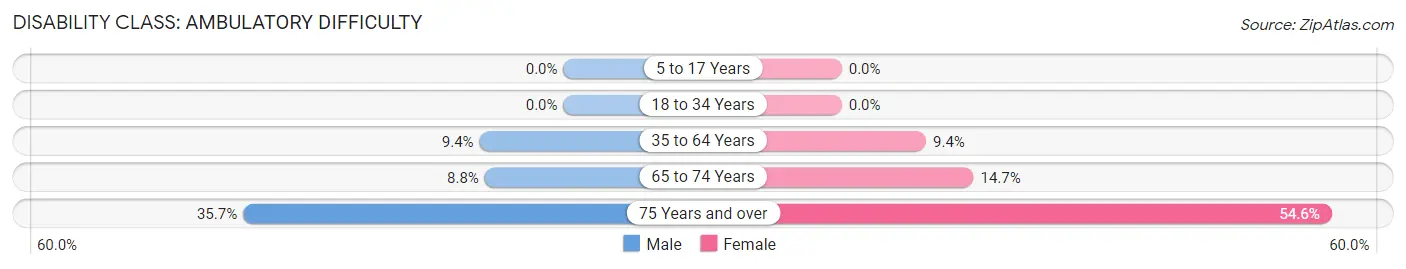
| Age Bracket | Male | Female |
| 5 to 17 Years | 0 (0.0%) | 0 (0.0%) |
| 18 to 34 Years | 0 (0.0%) | 0 (0.0%) |
| 35 to 64 Years | 69 (9.3%) | 84 (9.4%) |
| 65 to 74 Years | 17 (8.8%) | 27 (14.7%) |
| 75 Years and over | 71 (35.7%) | 90 (54.5%) |
Disability Class: Self-Care Difficulty
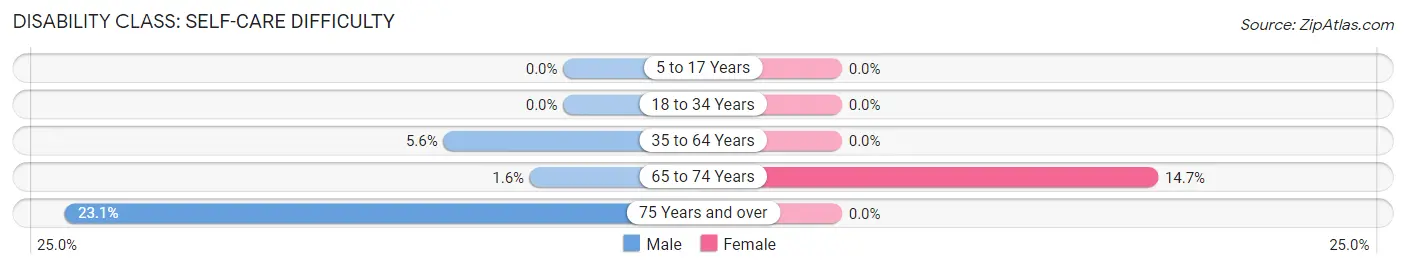
| Age Bracket | Male | Female |
| 5 to 17 Years | 0 (0.0%) | 0 (0.0%) |
| 18 to 34 Years | 0 (0.0%) | 0 (0.0%) |
| 35 to 64 Years | 41 (5.6%) | 0 (0.0%) |
| 65 to 74 Years | 3 (1.5%) | 27 (14.7%) |
| 75 Years and over | 46 (23.1%) | 0 (0.0%) |
Technology Access in Spurgeon
Computing Device Access in Spurgeon
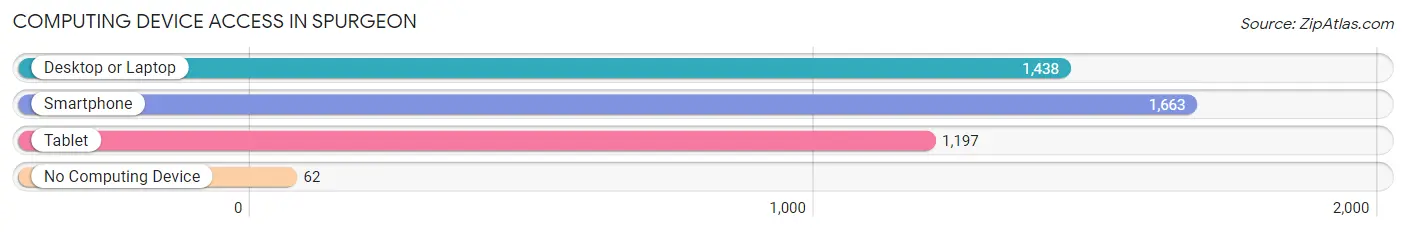
| Device Type | # Households | % Households |
| Desktop or Laptop | 1,438 | 79.2% |
| Smartphone | 1,663 | 91.6% |
| Tablet | 1,197 | 65.9% |
| No Computing Device | 62 | 3.4% |
| Total | 1,815 | 100.0% |
Internet Access in Spurgeon
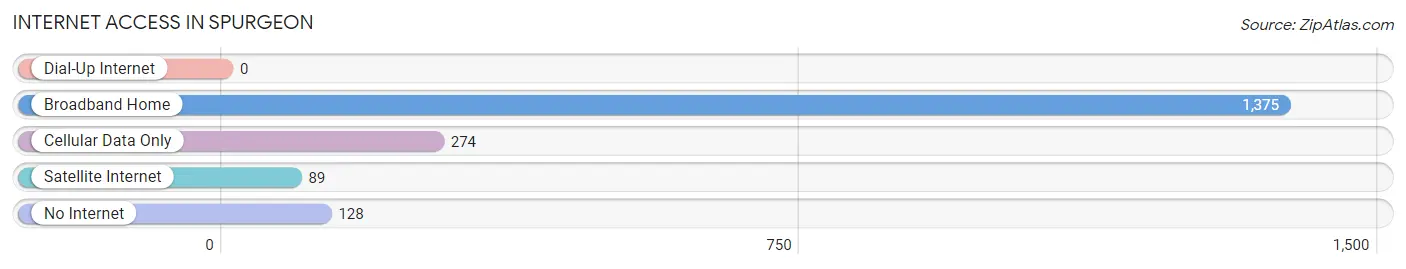
| Internet Type | # Households | % Households |
| Dial-Up Internet | 0 | 0.0% |
| Broadband Home | 1,375 | 75.8% |
| Cellular Data Only | 274 | 15.1% |
| Satellite Internet | 89 | 4.9% |
| No Internet | 128 | 7.0% |
| Total | 1,815 | 100.0% |
Spurgeon Summary
Spurgeon is a small town located in the state of Tennessee, in the United States. It is situated in the foothills of the Appalachian Mountains, and is part of the Cumberland Plateau region. The town has a population of just over 1,000 people, and is located in the county of Hawkins.
History
The area that is now Spurgeon was first settled in the early 1800s by a group of settlers from North Carolina. The town was originally known as “Spurgeon’s Crossroads”, named after the first settler, William Spurgeon. The town was officially incorporated in 1883, and the name was changed to Spurgeon.
The town was a small farming community for many years, and the main industry was tobacco farming. In the early 1900s, the town began to grow and develop, and the population increased. The town was home to several small businesses, including a general store, a blacksmith shop, and a sawmill.
In the 1950s, the town began to decline, as many of the businesses closed and the population decreased. In the late 1970s, the town began to experience a resurgence, as new businesses opened and the population began to increase.
Geography
Spurgeon is located in the foothills of the Appalachian Mountains, and is part of the Cumberland Plateau region. The town is situated in a valley, and is surrounded by hills and mountains. The town is located near the Holston River, and is about 25 miles from the city of Knoxville.
The climate in Spurgeon is humid subtropical, with hot summers and mild winters. The average annual temperature is around 60 degrees Fahrenheit, and the average annual precipitation is around 45 inches.
Economy
The economy of Spurgeon is largely based on agriculture and tourism. The town is home to several small farms, and the main crops grown are tobacco, corn, and hay. The town is also home to several small businesses, including a general store, a hardware store, and a restaurant.
The town is also a popular tourist destination, as it is located near several popular attractions, including the Great Smoky Mountains National Park, the Appalachian Trail, and the Cherokee National Forest.
Demographics
As of the 2010 census, the population of Spurgeon was 1,072. The racial makeup of the town was 97.3% White, 0.9% African American, 0.3% Native American, 0.2% Asian, and 1.3% from other races. The median household income was $30,938, and the median family income was $37,813.
The town is home to several churches, including the Spurgeon United Methodist Church, the Spurgeon Baptist Church, and the Spurgeon Presbyterian Church. The town is also home to a public library, a post office, and a volunteer fire department.
Conclusion
Spurgeon is a small town located in the state of Tennessee, in the United States. It is situated in the foothills of the Appalachian Mountains, and is part of the Cumberland Plateau region. The town has a population of just over 1,000 people, and is located in the county of Hawkins. The economy of Spurgeon is largely based on agriculture and tourism, and the town is home to several small businesses and farms. The town is also a popular tourist destination, as it is located near several popular attractions. The racial makeup of the town is 97.3% White, 0.9% African American, 0.3% Native American, 0.2% Asian, and 1.3% from other races. The median household income was $30,938, and the median family income was $37,813. Spurgeon is home to several churches, a public library, a post office, and a volunteer fire department.
Common Questions
What is the Total Population of Spurgeon?
Total Population of Spurgeon is 4,006.
What is the Total Male Population of Spurgeon?
Total Male Population of Spurgeon is 1,897.
What is the Total Female Population of Spurgeon?
Total Female Population of Spurgeon is 2,109.
What is the Ratio of Males per 100 Females in Spurgeon?
There are 89.95 Males per 100 Females in Spurgeon.
What is the Ratio of Females per 100 Males in Spurgeon?
There are 111.18 Females per 100 Males in Spurgeon.
What is the Median Population Age in Spurgeon?
Median Population Age in Spurgeon is 44.1 Years.
What is the Average Family Size in Spurgeon
Average Family Size in Spurgeon is 3.1 People.
What is the Average Household Size in Spurgeon
Average Household Size in Spurgeon is 2.2 People.
What is Per Capita Income in Spurgeon?
Per Capita income in Spurgeon is $37,100.
What is the Median Family Income in Spurgeon?
Median Family Income in Spurgeon is $80,337.
What is the Median Household income in Spurgeon?
Median Household Income in Spurgeon is $73,002.
What is Income or Wage Gap in Spurgeon?
Income or Wage Gap in Spurgeon is 33.7%.
Women in Spurgeon earn 66.3 cents for every dollar earned by a man.
What is Inequality or Gini Index in Spurgeon?
Inequality or Gini Index in Spurgeon is 0.42.
How Large is the Labor Force in Spurgeon?
There are 1,949 People in the Labor Forcein in Spurgeon.
What is the Percentage of People in the Labor Force in Spurgeon?
56.8% of People are in the Labor Force in Spurgeon.
What is the Unemployment Rate in Spurgeon?
Unemployment Rate in Spurgeon is 0.8%.