McEwen, TN
McEwen Map
McEwen Overview
1,820
TOTAL POPULATION
901
MALE POPULATION
919
FEMALE POPULATION
98.04
MALES / 100 FEMALES
102.00
FEMALES / 100 MALES
41.2
MEDIAN AGE
3.6
AVG FAMILY SIZE
2.9
AVG HOUSEHOLD SIZE
$43,652
PER CAPITA INCOME
$81,875
AVG FAMILY INCOME
$66,875
AVG HOUSEHOLD INCOME
50.6%
WAGE / INCOME GAP [ % ]
49.4¢/ $1
WAGE / INCOME GAP [ $ ]
$2,615
FAMILY INCOME DEFICIT
0.49
INEQUALITY / GINI INDEX
867
LABOR FORCE [ PEOPLE ]
56.1%
PERCENT IN LABOR FORCE
20.2%
UNEMPLOYMENT RATE
Race in McEwen
The most populous races in McEwen are White / Caucasian (1,799 | 98.9%), Two or more Races (20 | 1.1%), and Black / African American (1 | 0.1%).
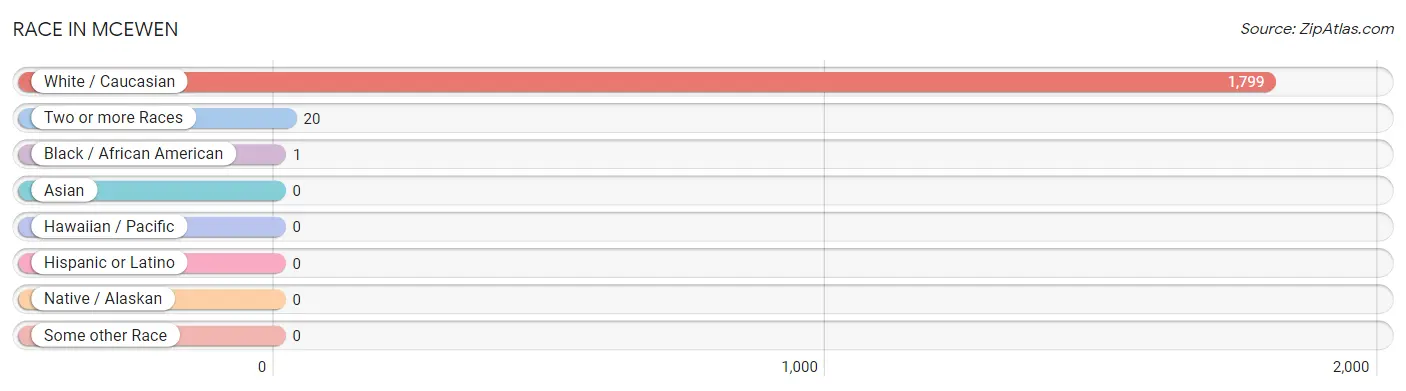
| Race | # Population | % Population |
| Asian | 0 | 0.0% |
| Black / African American | 1 | 0.1% |
| Hawaiian / Pacific | 0 | 0.0% |
| Hispanic or Latino | 0 | 0.0% |
| Native / Alaskan | 0 | 0.0% |
| White / Caucasian | 1,799 | 98.9% |
| Two or more Races | 20 | 1.1% |
| Some other Race | 0 | 0.0% |
| Total | 1,820 | 100.0% |
Ancestry in McEwen
The most populous ancestries reported in McEwen are English (390 | 21.4%), American (386 | 21.2%), Irish (238 | 13.1%), European (82 | 4.5%), and German (67 | 3.7%), together accounting for 63.9% of all McEwen residents.
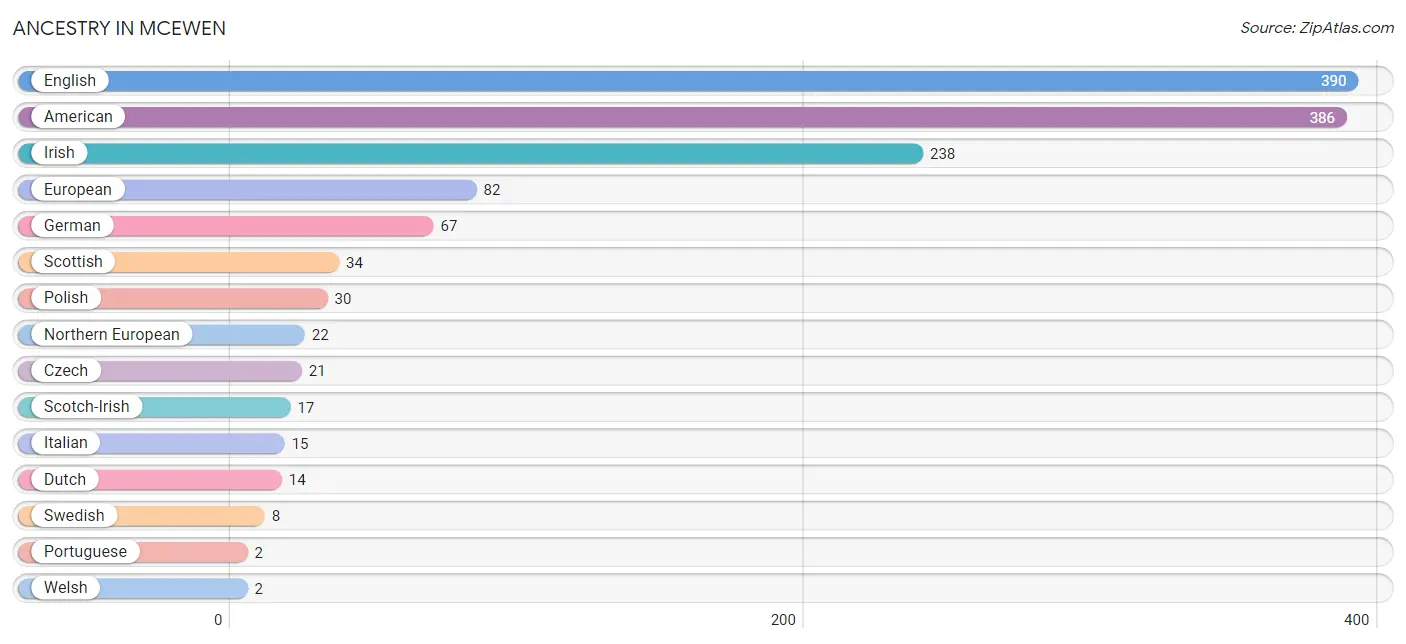
| Ancestry | # Population | % Population |
| American | 386 | 21.2% |
| Czech | 21 | 1.1% |
| Dutch | 14 | 0.8% |
| English | 390 | 21.4% |
| European | 82 | 4.5% |
| German | 67 | 3.7% |
| Irish | 238 | 13.1% |
| Italian | 15 | 0.8% |
| Northern European | 22 | 1.2% |
| Polish | 30 | 1.7% |
| Portuguese | 2 | 0.1% |
| Scotch-Irish | 17 | 0.9% |
| Scottish | 34 | 1.9% |
| Swedish | 8 | 0.4% |
| Welsh | 2 | 0.1% | View All 15 Rows |
Immigrants in McEwen
The most numerous immigrant groups reported in McEwen came from Europe (9 | 0.5%), Germany (9 | 0.5%), Western Europe (9 | 0.5%), and Canada (2 | 0.1%), together accounting for 1.6% of all McEwen residents.
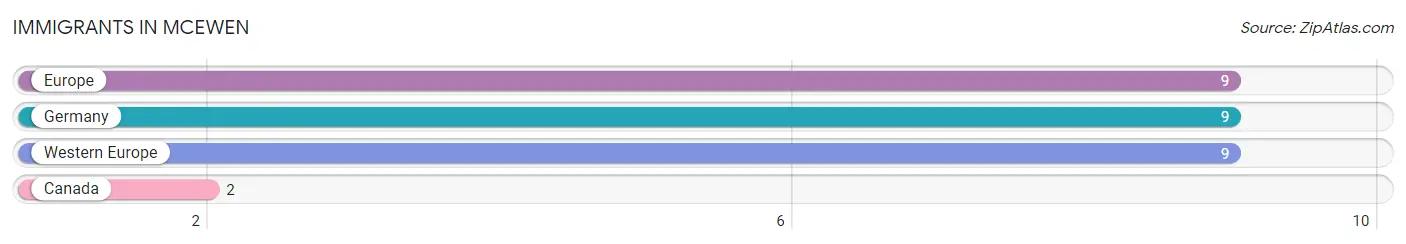
| Immigration Origin | # Population | % Population |
| Canada | 2 | 0.1% |
| Europe | 9 | 0.5% |
| Germany | 9 | 0.5% |
| Western Europe | 9 | 0.5% | View All 4 Rows |
Sex and Age in McEwen
Sex and Age in McEwen
The most populous age groups in McEwen are 55 to 59 Years (98 | 10.9%) for men and 25 to 29 Years (136 | 14.8%) for women.
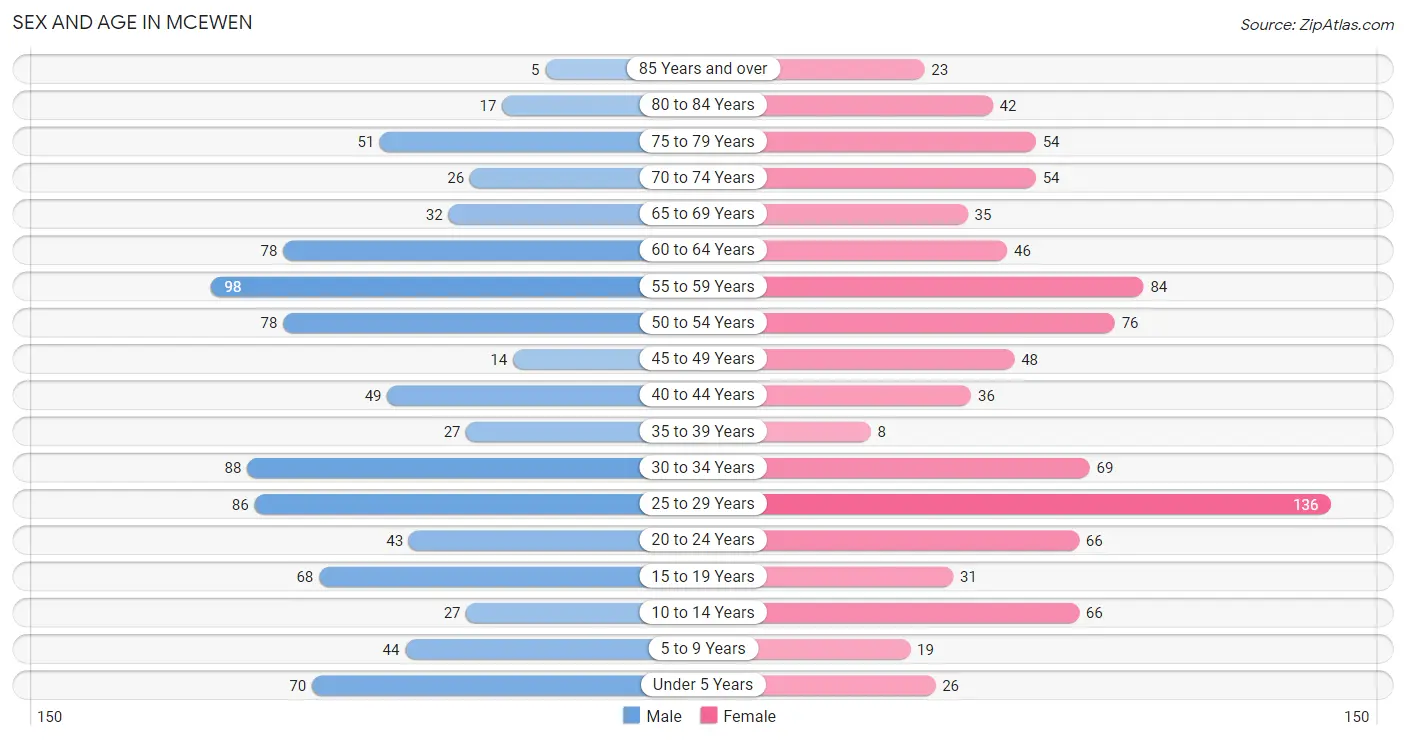
| Age Bracket | Male | Female |
| Under 5 Years | 70 (7.8%) | 26 (2.8%) |
| 5 to 9 Years | 44 (4.9%) | 19 (2.1%) |
| 10 to 14 Years | 27 (3.0%) | 66 (7.2%) |
| 15 to 19 Years | 68 (7.5%) | 31 (3.4%) |
| 20 to 24 Years | 43 (4.8%) | 66 (7.2%) |
| 25 to 29 Years | 86 (9.5%) | 136 (14.8%) |
| 30 to 34 Years | 88 (9.8%) | 69 (7.5%) |
| 35 to 39 Years | 27 (3.0%) | 8 (0.9%) |
| 40 to 44 Years | 49 (5.4%) | 36 (3.9%) |
| 45 to 49 Years | 14 (1.5%) | 48 (5.2%) |
| 50 to 54 Years | 78 (8.7%) | 76 (8.3%) |
| 55 to 59 Years | 98 (10.9%) | 84 (9.1%) |
| 60 to 64 Years | 78 (8.7%) | 46 (5.0%) |
| 65 to 69 Years | 32 (3.5%) | 35 (3.8%) |
| 70 to 74 Years | 26 (2.9%) | 54 (5.9%) |
| 75 to 79 Years | 51 (5.7%) | 54 (5.9%) |
| 80 to 84 Years | 17 (1.9%) | 42 (4.6%) |
| 85 Years and over | 5 (0.5%) | 23 (2.5%) |
| Total | 901 (100.0%) | 919 (100.0%) |
Families and Households in McEwen
Median Family Size in McEwen
The median family size in McEwen is 3.62 persons per family, with married-couple families (341 | 79.3%) accounting for the largest median family size of 3.7 persons per family. On the other hand, single male/father families (23 | 5.3%) represent the smallest median family size with 2.57 persons per family.
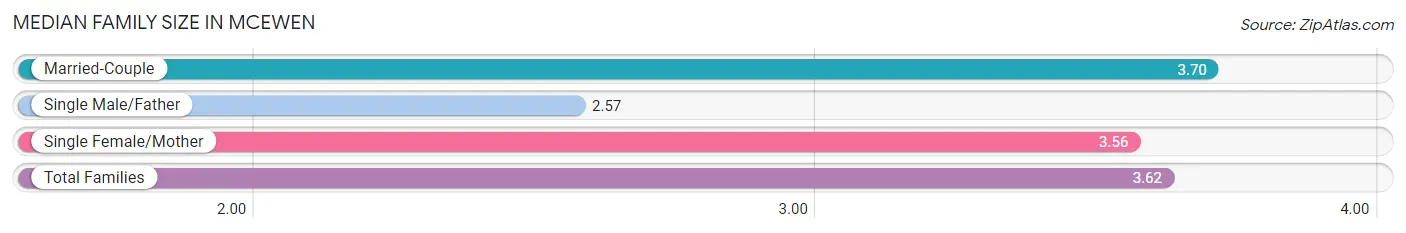
| Family Type | # Families | Family Size |
| Married-Couple | 341 (79.3%) | 3.70 |
| Single Male/Father | 23 (5.3%) | 2.57 |
| Single Female/Mother | 66 (15.3%) | 3.56 |
| Total Families | 430 (100.0%) | 3.62 |
Median Household Size in McEwen
The median household size in McEwen is 2.91 persons per household, with single female/mother households (66 | 10.5%) accounting for the largest median household size of 3.82 persons per household. non-family households (196 | 31.3%) represent the smallest median household size with 1.18 persons per household.
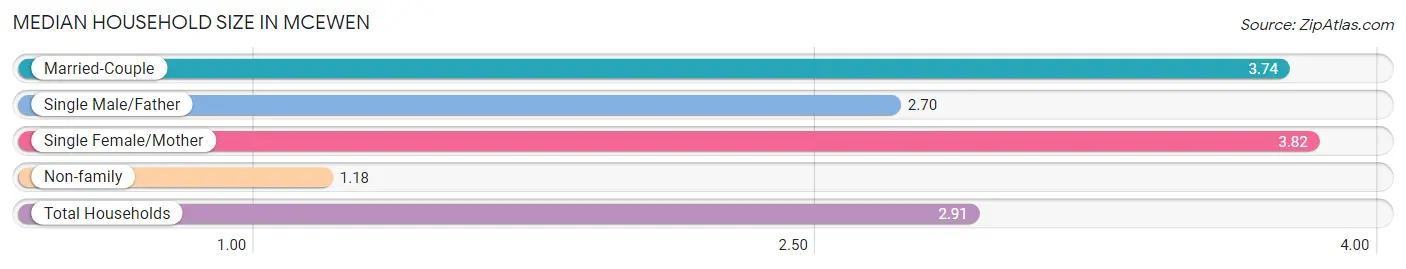
| Household Type | # Households | Household Size |
| Married-Couple | 341 (54.5%) | 3.74 |
| Single Male/Father | 23 (3.7%) | 2.70 |
| Single Female/Mother | 66 (10.5%) | 3.82 |
| Non-family | 196 (31.3%) | 1.18 |
| Total Households | 626 (100.0%) | 2.91 |
Household Size by Marriage Status in McEwen
Out of a total of 626 households in McEwen, 430 (68.7%) are family households, while 196 (31.3%) are nonfamily households. The most numerous type of family households are 2-person households, comprising 243, and the most common type of nonfamily households are 1-person households, comprising 164.
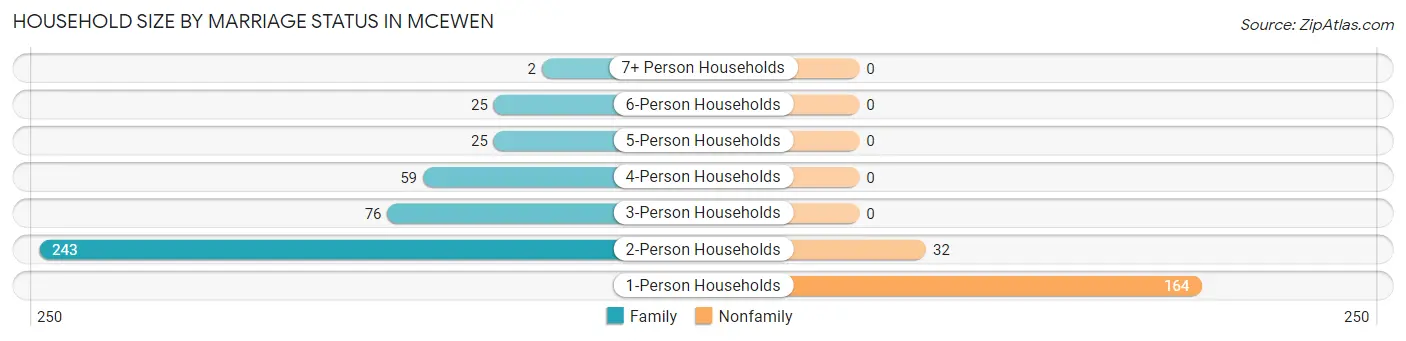
| Household Size | Family Households | Nonfamily Households |
| 1-Person Households | - | 164 (26.2%) |
| 2-Person Households | 243 (38.8%) | 32 (5.1%) |
| 3-Person Households | 76 (12.1%) | 0 (0.0%) |
| 4-Person Households | 59 (9.4%) | 0 (0.0%) |
| 5-Person Households | 25 (4.0%) | 0 (0.0%) |
| 6-Person Households | 25 (4.0%) | 0 (0.0%) |
| 7+ Person Households | 2 (0.3%) | 0 (0.0%) |
| Total | 430 (68.7%) | 196 (31.3%) |
Female Fertility in McEwen
Fertility by Age in McEwen
Average fertility rate in McEwen is 313.0 births per 1,000 women. Women in the age bracket of 20 to 34 years have the highest fertility rate with 450.0 births per 1,000 women. Women in the age bracket of 20 to 34 years acount for 98.4% of all women with births.
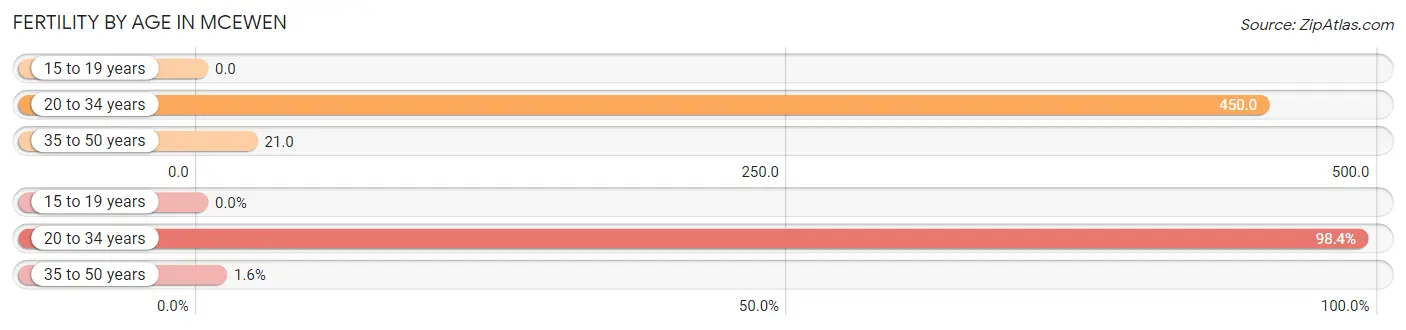
| Age Bracket | Women with Births | Births / 1,000 Women |
| 15 to 19 years | 0 (0.0%) | 0.0 |
| 20 to 34 years | 122 (98.4%) | 450.0 |
| 35 to 50 years | 2 (1.6%) | 21.0 |
| Total | 124 (100.0%) | 313.0 |
Fertility by Age by Marriage Status in McEwen
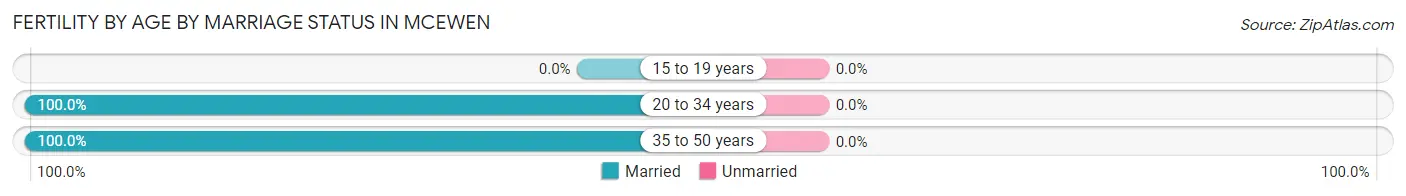
| Age Bracket | Married | Unmarried |
| 15 to 19 years | 0 (0.0%) | 0 (0.0%) |
| 20 to 34 years | 122 (100.0%) | 0 (0.0%) |
| 35 to 50 years | 2 (100.0%) | 0 (0.0%) |
| Total | 124 (100.0%) | 0 (0.0%) |
Fertility by Education in McEwen
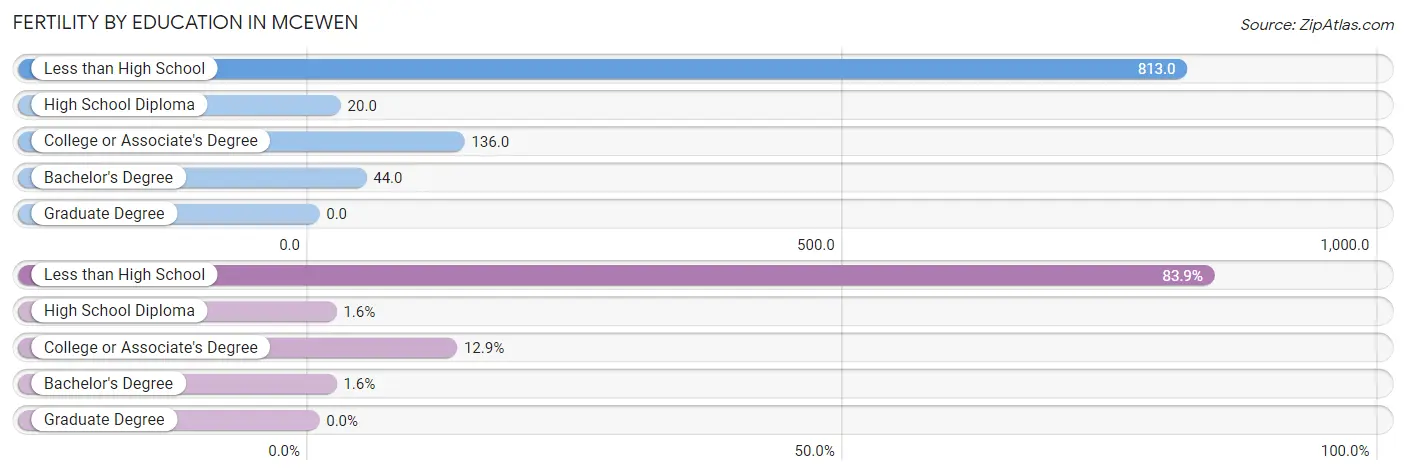
| Educational Attainment | Women with Births | Births / 1,000 Women |
| Less than High School | 104 (83.9%) | 813.0 |
| High School Diploma | 2 (1.6%) | 20.0 |
| College or Associate's Degree | 16 (12.9%) | 136.0 |
| Bachelor's Degree | 2 (1.6%) | 44.0 |
| Graduate Degree | 0 (0.0%) | 0.0 |
| Total | 124 (100.0%) | 313.0 |
Fertility by Education by Marriage Status in McEwen
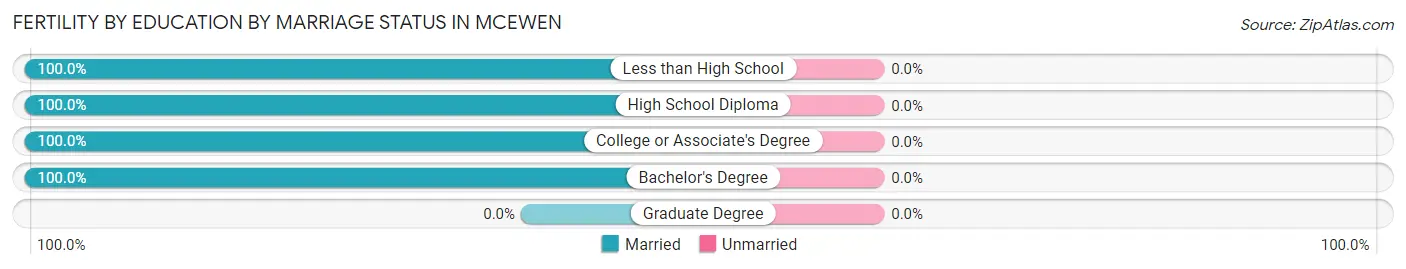
| Educational Attainment | Married | Unmarried |
| Less than High School | 104 (100.0%) | 0 (0.0%) |
| High School Diploma | 2 (100.0%) | 0 (0.0%) |
| College or Associate's Degree | 16 (100.0%) | 0 (0.0%) |
| Bachelor's Degree | 2 (100.0%) | 0 (0.0%) |
| Graduate Degree | 0 (0.0%) | 0 (0.0%) |
| Total | 124 (100.0%) | 0 (0.0%) |
Income in McEwen
Income Overview in McEwen
Per Capita Income in McEwen is $43,652, while median incomes of families and households are $81,875 and $66,875 respectively.
| Characteristic | Number | Measure |
| Per Capita Income | 1,820 | $43,652 |
| Median Family Income | 430 | $81,875 |
| Mean Family Income | 430 | $99,338 |
| Median Household Income | 626 | $66,875 |
| Mean Household Income | 626 | $90,178 |
| Income Deficit | 430 | $2,615 |
| Wage / Income Gap (%) | 1,820 | 50.62% |
| Wage / Income Gap ($) | 1,820 | 49.38¢ per $1 |
| Gini / Inequality Index | 1,820 | 0.49 |
Earnings by Sex in McEwen
Average Earnings in McEwen are $37,458, $58,221 for men and $28,750 for women, a difference of 50.6%.
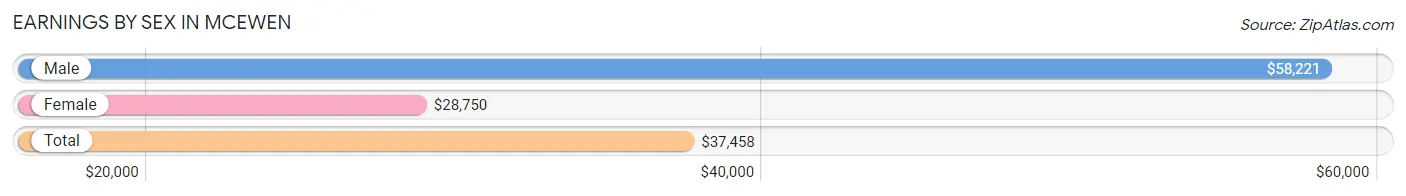
| Sex | Number | Average Earnings |
| Male | 427 (49.0%) | $58,221 |
| Female | 444 (51.0%) | $28,750 |
| Total | 871 (100.0%) | $37,458 |
Earnings by Sex by Income Bracket in McEwen
The most common earnings brackets in McEwen are $55,000 to $64,999 for men (75 | 17.6%) and $25,000 to $29,999 for women (137 | 30.9%).
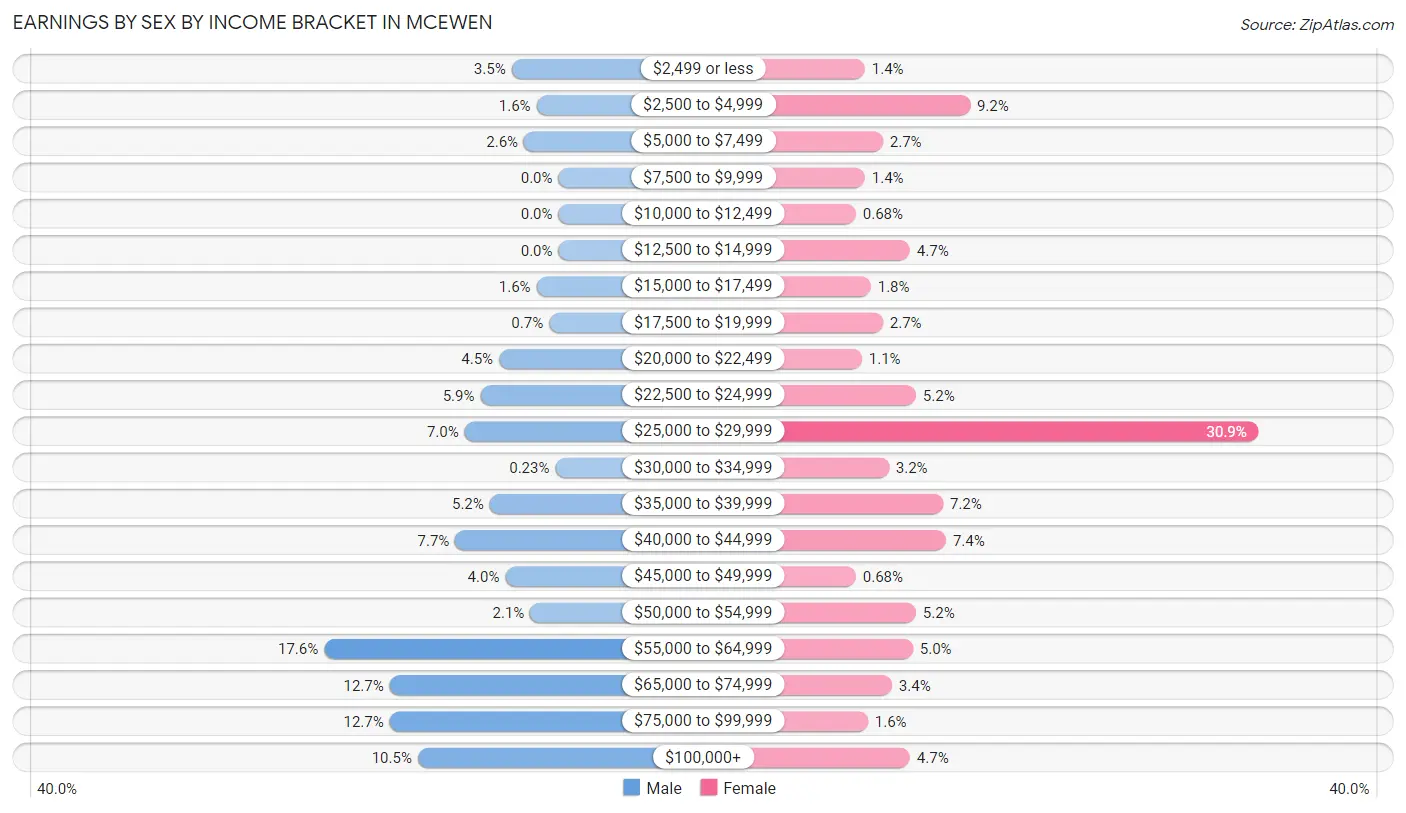
| Income | Male | Female |
| $2,499 or less | 15 (3.5%) | 6 (1.3%) |
| $2,500 to $4,999 | 7 (1.6%) | 41 (9.2%) |
| $5,000 to $7,499 | 11 (2.6%) | 12 (2.7%) |
| $7,500 to $9,999 | 0 (0.0%) | 6 (1.3%) |
| $10,000 to $12,499 | 0 (0.0%) | 3 (0.7%) |
| $12,500 to $14,999 | 0 (0.0%) | 21 (4.7%) |
| $15,000 to $17,499 | 7 (1.6%) | 8 (1.8%) |
| $17,500 to $19,999 | 3 (0.7%) | 12 (2.7%) |
| $20,000 to $22,499 | 19 (4.4%) | 5 (1.1%) |
| $22,500 to $24,999 | 25 (5.9%) | 23 (5.2%) |
| $25,000 to $29,999 | 30 (7.0%) | 137 (30.9%) |
| $30,000 to $34,999 | 1 (0.2%) | 14 (3.2%) |
| $35,000 to $39,999 | 22 (5.1%) | 32 (7.2%) |
| $40,000 to $44,999 | 33 (7.7%) | 33 (7.4%) |
| $45,000 to $49,999 | 17 (4.0%) | 3 (0.7%) |
| $50,000 to $54,999 | 9 (2.1%) | 23 (5.2%) |
| $55,000 to $64,999 | 75 (17.6%) | 22 (5.0%) |
| $65,000 to $74,999 | 54 (12.7%) | 15 (3.4%) |
| $75,000 to $99,999 | 54 (12.7%) | 7 (1.6%) |
| $100,000+ | 45 (10.5%) | 21 (4.7%) |
| Total | 427 (100.0%) | 444 (100.0%) |
Earnings by Sex by Educational Attainment in McEwen
Average earnings in McEwen are $60,313 for men and $29,087 for women, a difference of 51.8%. Men with an educational attainment of college or associate's degree enjoy the highest average annual earnings of $68,594, while those with high school diploma education earn the least with $53,750. Women with an educational attainment of graduate degree earn the most with the average annual earnings of $50,938, while those with high school diploma education have the smallest earnings of $26,089.
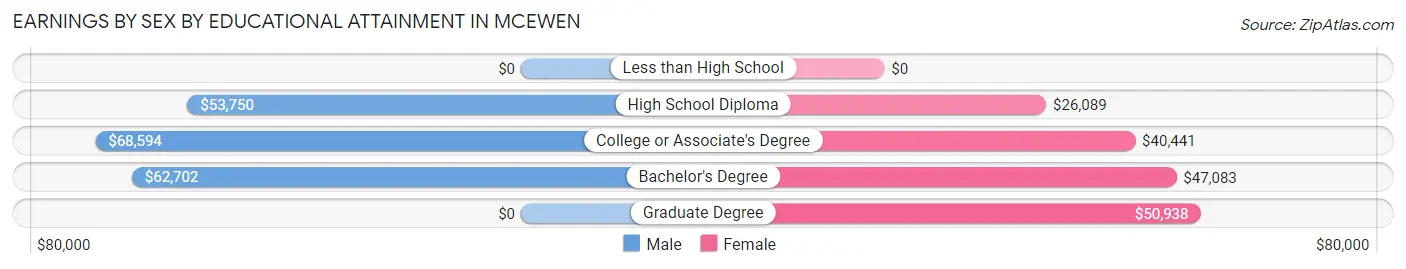
| Educational Attainment | Male Income | Female Income |
| Less than High School | - | - |
| High School Diploma | $53,750 | $26,089 |
| College or Associate's Degree | $68,594 | $40,441 |
| Bachelor's Degree | $62,702 | $47,083 |
| Graduate Degree | - | - |
| Total | $60,313 | $29,087 |
Family Income in McEwen
Family Income Brackets in McEwen
According to the McEwen family income data, there are 107 families falling into the $100,000 to $149,999 income range, which is the most common income bracket and makes up 24.9% of all families. Conversely, the less than $10,000 income bracket is the least frequent group with only 2 families (0.5%) belonging to this category.
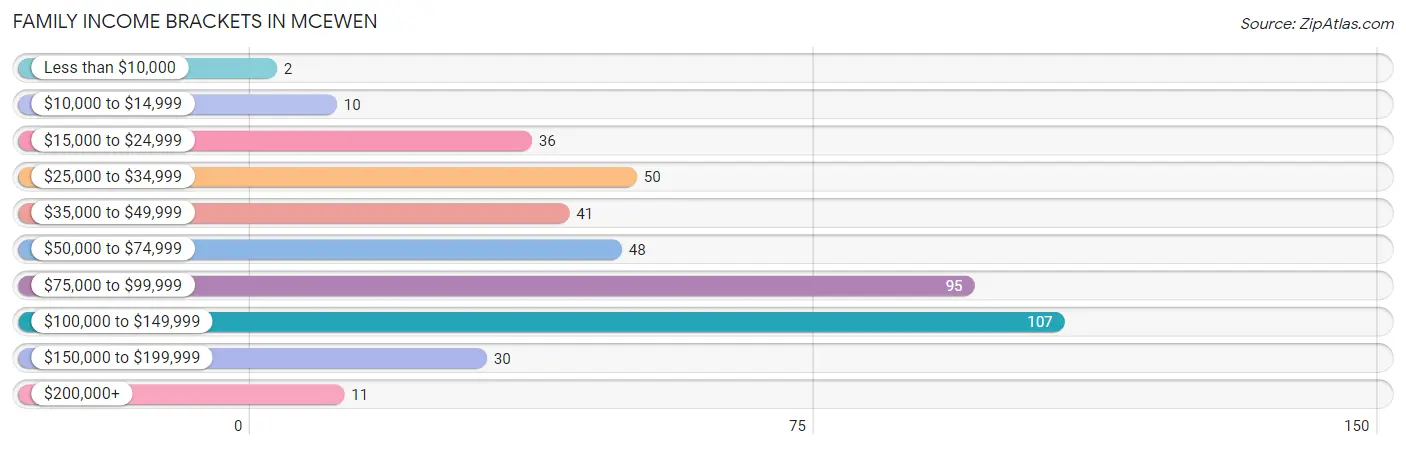
| Income Bracket | # Families | % Families |
| Less than $10,000 | 2 | 0.5% |
| $10,000 to $14,999 | 10 | 2.3% |
| $15,000 to $24,999 | 36 | 8.4% |
| $25,000 to $34,999 | 50 | 11.6% |
| $35,000 to $49,999 | 41 | 9.5% |
| $50,000 to $74,999 | 48 | 11.2% |
| $75,000 to $99,999 | 95 | 22.1% |
| $100,000 to $149,999 | 107 | 24.9% |
| $150,000 to $199,999 | 30 | 7.0% |
| $200,000+ | 11 | 2.6% |
Family Income by Famaliy Size in McEwen
4-person families (59 | 13.7%) account for the highest median family income in McEwen with $119,464 per family, while 2-person families (259 | 60.2%) have the highest median income of $30,852 per family member.
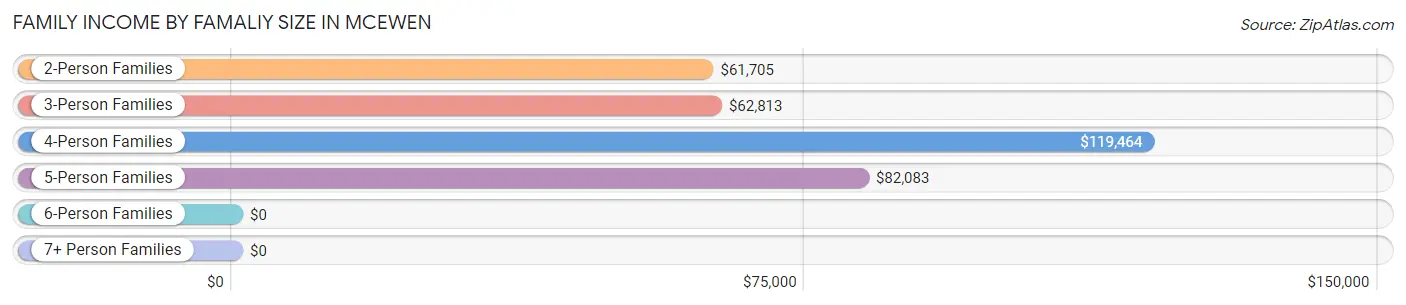
| Income Bracket | # Families | Median Income |
| 2-Person Families | 259 (60.2%) | $61,705 |
| 3-Person Families | 63 (14.6%) | $62,813 |
| 4-Person Families | 59 (13.7%) | $119,464 |
| 5-Person Families | 25 (5.8%) | $82,083 |
| 6-Person Families | 24 (5.6%) | $0 |
| 7+ Person Families | 0 (0.0%) | $0 |
| Total | 430 (100.0%) | $81,875 |
Family Income by Number of Earners in McEwen
The median family income in McEwen is $81,875, with families comprising 3+ earners (28) having the highest median family income of $121,111, while families with no earners (97) have the lowest median family income of $32,614, accounting for 6.5% and 22.6% of families, respectively.
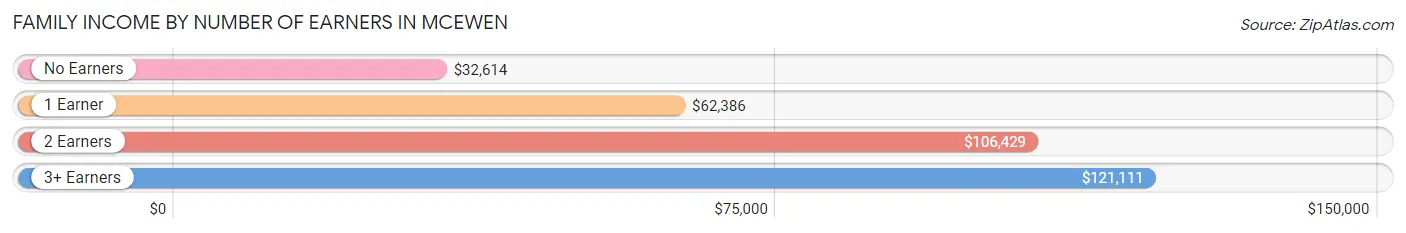
| Number of Earners | # Families | Median Income |
| No Earners | 97 (22.6%) | $32,614 |
| 1 Earner | 125 (29.1%) | $62,386 |
| 2 Earners | 180 (41.9%) | $106,429 |
| 3+ Earners | 28 (6.5%) | $121,111 |
| Total | 430 (100.0%) | $81,875 |
Household Income in McEwen
Household Income Brackets in McEwen
With 125 households falling in the category, the $75,000 to $99,999 income range is the most frequent in McEwen, accounting for 20.0% of all households. In contrast, only 17 households (2.7%) fall into the less than $10,000 income bracket, making it the least populous group.
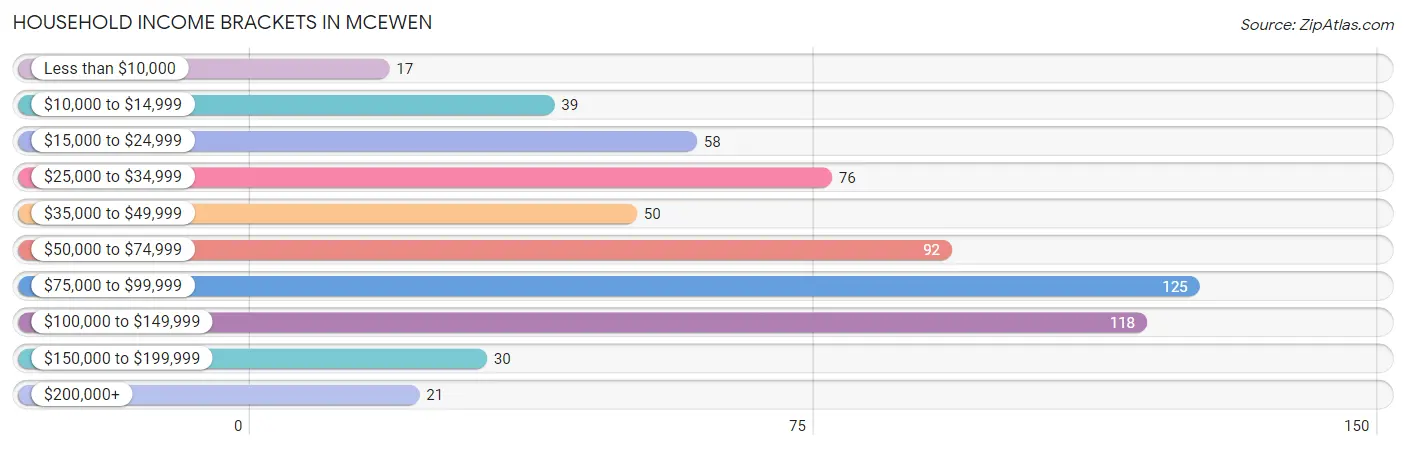
| Income Bracket | # Households | % Households |
| Less than $10,000 | 17 | 2.7% |
| $10,000 to $14,999 | 39 | 6.2% |
| $15,000 to $24,999 | 58 | 9.3% |
| $25,000 to $34,999 | 76 | 12.1% |
| $35,000 to $49,999 | 50 | 8.0% |
| $50,000 to $74,999 | 92 | 14.7% |
| $75,000 to $99,999 | 125 | 20.0% |
| $100,000 to $149,999 | 118 | 18.8% |
| $150,000 to $199,999 | 30 | 4.8% |
| $200,000+ | 21 | 3.4% |
Household Income by Householder Age in McEwen
The median household income in McEwen is $66,875, with the highest median household income of $90,144 found in the 45 to 64 years age bracket for the primary householder. A total of 233 households (37.2%) fall into this category. Meanwhile, the 65+ years age bracket for the primary householder has the lowest median household income of $34,602, with 215 households (34.4%) in this group.
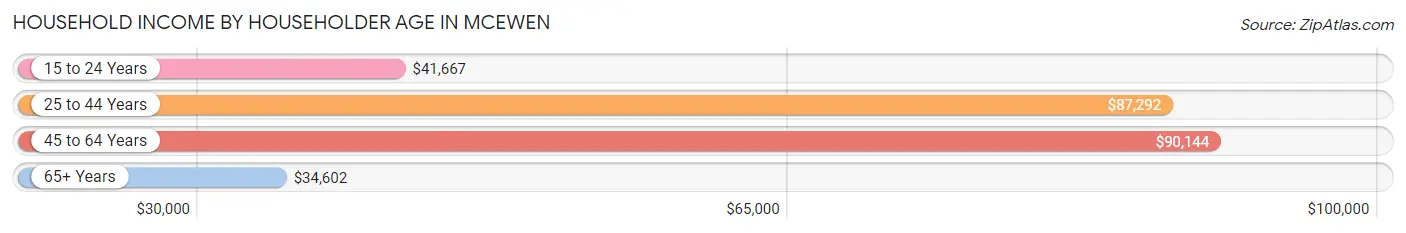
| Income Bracket | # Households | Median Income |
| 15 to 24 Years | 18 (2.9%) | $41,667 |
| 25 to 44 Years | 160 (25.6%) | $87,292 |
| 45 to 64 Years | 233 (37.2%) | $90,144 |
| 65+ Years | 215 (34.4%) | $34,602 |
| Total | 626 (100.0%) | $66,875 |
Poverty in McEwen
Income Below Poverty by Sex and Age in McEwen
With 8.8% poverty level for males and 13.5% for females among the residents of McEwen, 75 year old and over males and 12 to 14 year old females are the most vulnerable to poverty, with 20 males (27.4%) and 31 females (86.1%) in their respective age groups living below the poverty level.
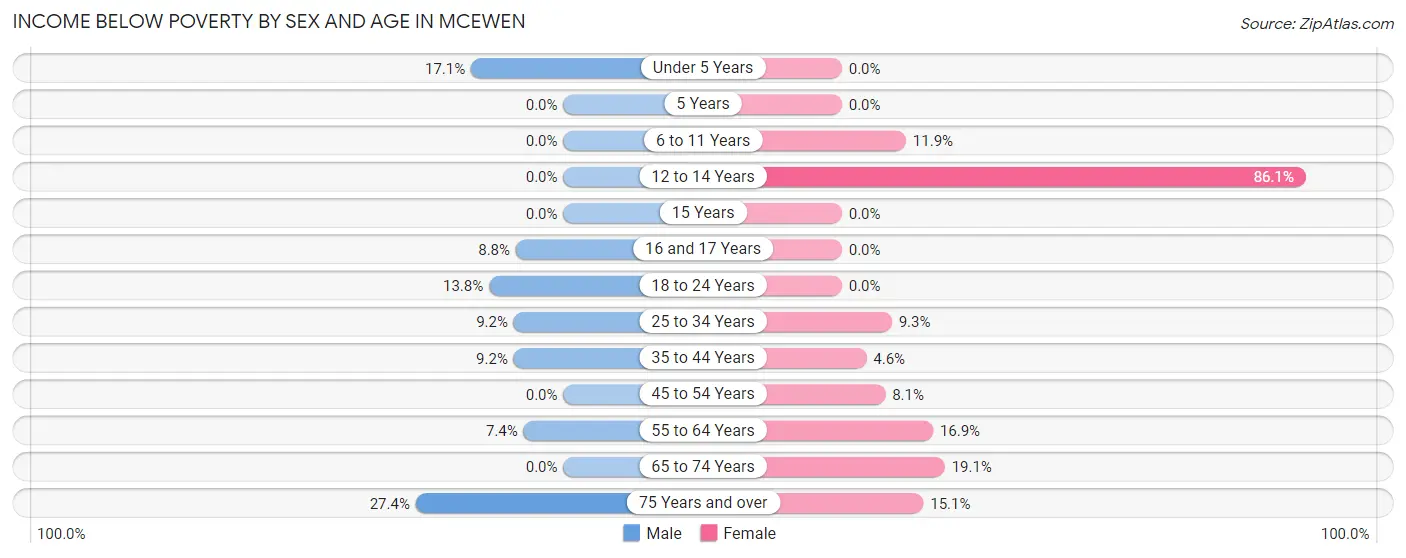
| Age Bracket | Male | Female |
| Under 5 Years | 12 (17.1%) | 0 (0.0%) |
| 5 Years | 0 (0.0%) | 0 (0.0%) |
| 6 to 11 Years | 0 (0.0%) | 5 (11.9%) |
| 12 to 14 Years | 0 (0.0%) | 31 (86.1%) |
| 15 Years | 0 (0.0%) | 0 (0.0%) |
| 16 and 17 Years | 3 (8.8%) | 0 (0.0%) |
| 18 to 24 Years | 8 (13.8%) | 0 (0.0%) |
| 25 to 34 Years | 16 (9.2%) | 19 (9.3%) |
| 35 to 44 Years | 7 (9.2%) | 2 (4.5%) |
| 45 to 54 Years | 0 (0.0%) | 10 (8.1%) |
| 55 to 64 Years | 13 (7.4%) | 22 (16.9%) |
| 65 to 74 Years | 0 (0.0%) | 17 (19.1%) |
| 75 Years and over | 20 (27.4%) | 18 (15.1%) |
| Total | 79 (8.8%) | 124 (13.5%) |
Income Above Poverty by Sex and Age in McEwen
According to the poverty statistics in McEwen, males aged 6 to 11 years and females aged under 5 years are the age groups that are most secure financially, with 100.0% of males and 100.0% of females in these age groups living above the poverty line.
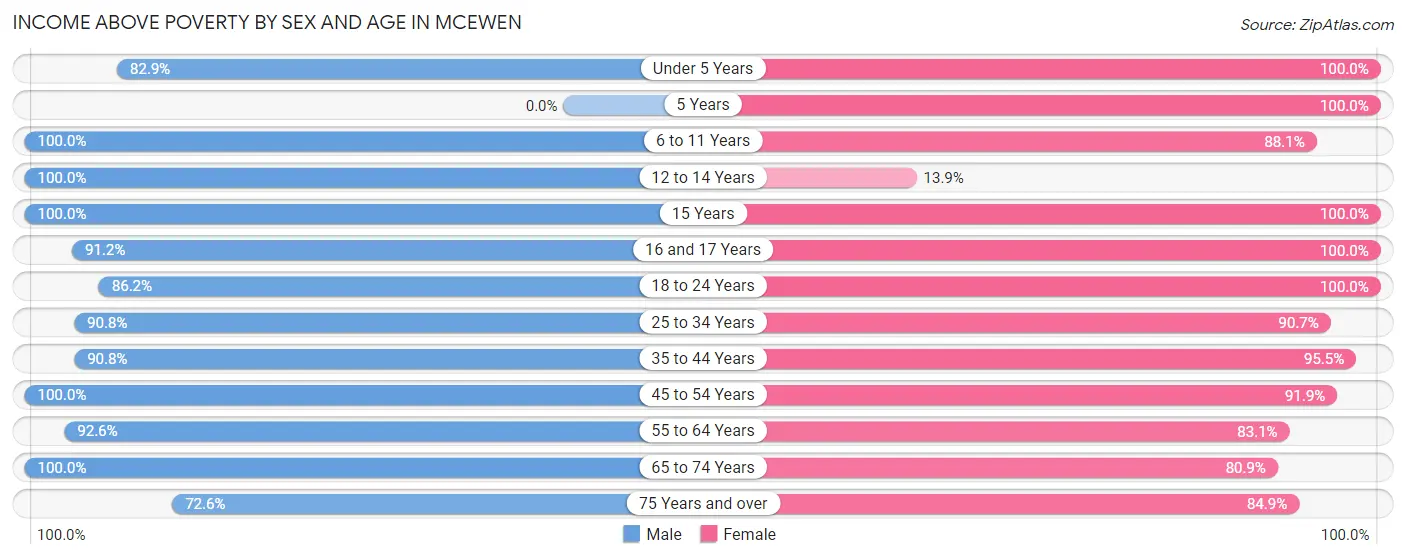
| Age Bracket | Male | Female |
| Under 5 Years | 58 (82.9%) | 26 (100.0%) |
| 5 Years | 0 (0.0%) | 7 (100.0%) |
| 6 to 11 Years | 58 (100.0%) | 37 (88.1%) |
| 12 to 14 Years | 13 (100.0%) | 5 (13.9%) |
| 15 Years | 19 (100.0%) | 4 (100.0%) |
| 16 and 17 Years | 31 (91.2%) | 9 (100.0%) |
| 18 to 24 Years | 50 (86.2%) | 84 (100.0%) |
| 25 to 34 Years | 158 (90.8%) | 186 (90.7%) |
| 35 to 44 Years | 69 (90.8%) | 42 (95.5%) |
| 45 to 54 Years | 92 (100.0%) | 114 (91.9%) |
| 55 to 64 Years | 163 (92.6%) | 108 (83.1%) |
| 65 to 74 Years | 58 (100.0%) | 72 (80.9%) |
| 75 Years and over | 53 (72.6%) | 101 (84.9%) |
| Total | 822 (91.2%) | 795 (86.5%) |
Income Below Poverty Among Married-Couple Families in McEwen
The poverty statistics for married-couple families in McEwen show that 6.5% or 22 of the total 341 families live below the poverty line. Families with no children have the highest poverty rate of 9.0%, comprising of 20 families. On the other hand, families with 3 or 4 children have the lowest poverty rate of 0.0%, which includes 0 families.
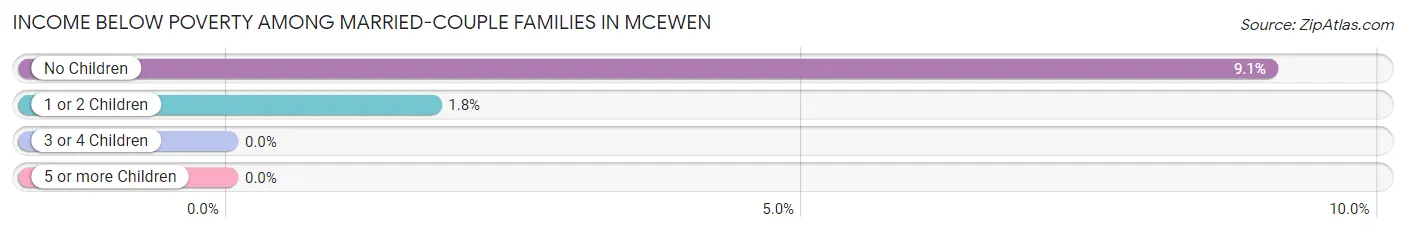
| Children | Above Poverty | Below Poverty |
| No Children | 201 (90.9%) | 20 (9.0%) |
| 1 or 2 Children | 111 (98.2%) | 2 (1.8%) |
| 3 or 4 Children | 7 (100.0%) | 0 (0.0%) |
| 5 or more Children | 0 (0.0%) | 0 (0.0%) |
| Total | 319 (93.5%) | 22 (6.5%) |
Income Below Poverty Among Single-Parent Households in McEwen
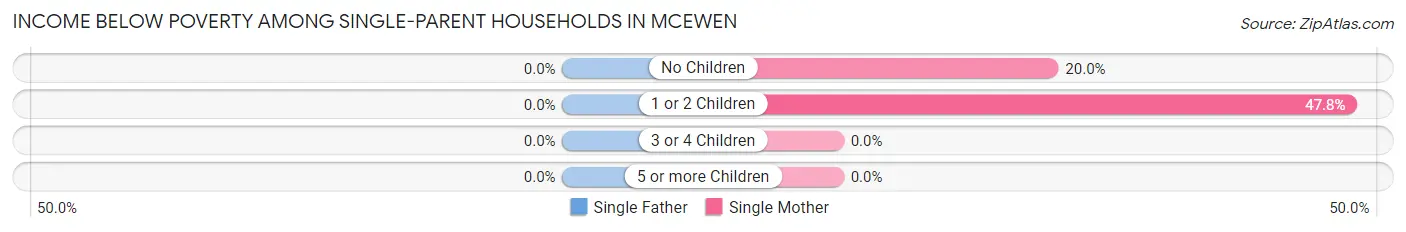
| Children | Single Father | Single Mother |
| No Children | 0 (0.0%) | 4 (20.0%) |
| 1 or 2 Children | 0 (0.0%) | 22 (47.8%) |
| 3 or 4 Children | 0 (0.0%) | 0 (0.0%) |
| 5 or more Children | 0 (0.0%) | 0 (0.0%) |
| Total | 0 (0.0%) | 26 (39.4%) |
Income Below Poverty Among Married-Couple vs Single-Parent Households in McEwen
The poverty data for McEwen shows that 22 of the married-couple family households (6.5%) and 26 of the single-parent households (29.2%) are living below the poverty level. Within the married-couple family households, those with no children have the highest poverty rate, with 20 households (9.0%) falling below the poverty line. Among the single-parent households, those with 1 or 2 children have the highest poverty rate, with 22 household (40.0%) living below poverty.
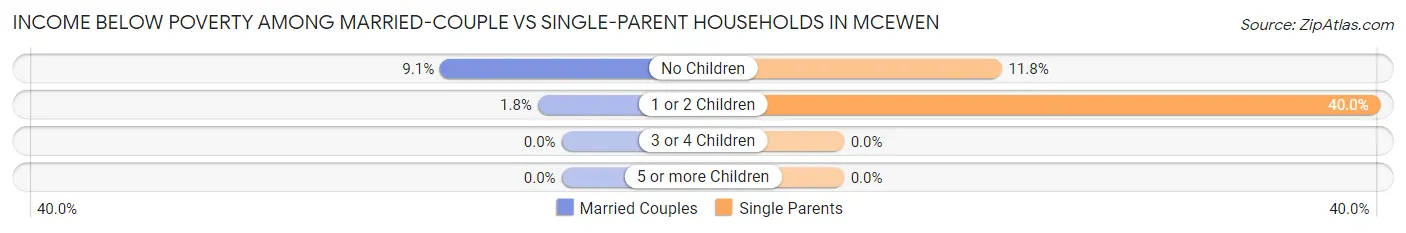
| Children | Married-Couple Families | Single-Parent Households |
| No Children | 20 (9.0%) | 4 (11.8%) |
| 1 or 2 Children | 2 (1.8%) | 22 (40.0%) |
| 3 or 4 Children | 0 (0.0%) | 0 (0.0%) |
| 5 or more Children | 0 (0.0%) | 0 (0.0%) |
| Total | 22 (6.5%) | 26 (29.2%) |
Employment Characteristics in McEwen
Employment by Class of Employer in McEwen
Among the 691 employed individuals in McEwen, private company employees (451 | 65.3%), state government employees (68 | 9.8%), and self-employed (not incorporated) (59 | 8.5%) make up the most common classes of employment.
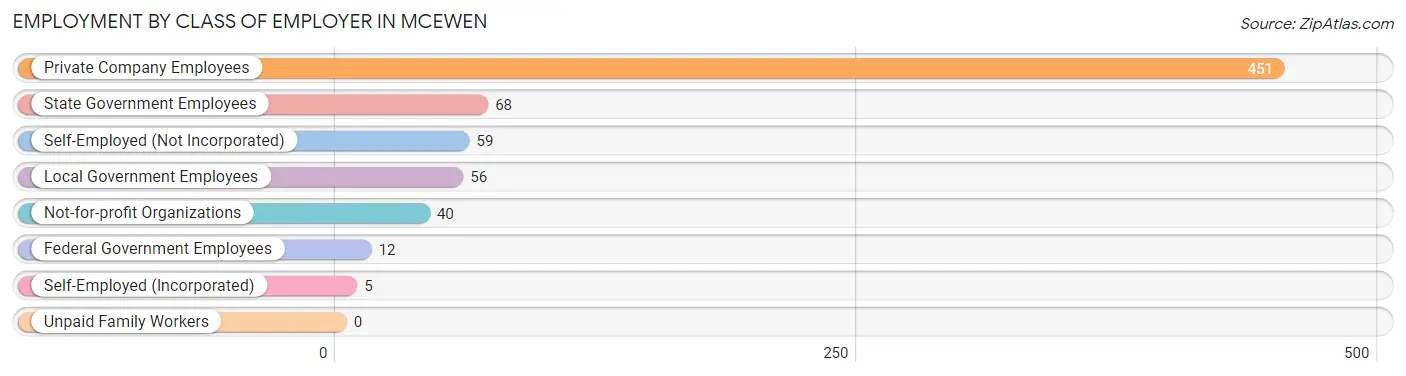
| Employer Class | # Employees | % Employees |
| Private Company Employees | 451 | 65.3% |
| Self-Employed (Incorporated) | 5 | 0.7% |
| Self-Employed (Not Incorporated) | 59 | 8.5% |
| Not-for-profit Organizations | 40 | 5.8% |
| Local Government Employees | 56 | 8.1% |
| State Government Employees | 68 | 9.8% |
| Federal Government Employees | 12 | 1.7% |
| Unpaid Family Workers | 0 | 0.0% |
| Total | 691 | 100.0% |
Employment Status by Age in McEwen
According to the labor force statistics for McEwen, out of the total population over 16 years of age (1,545), 56.1% or 867 individuals are in the labor force, with 20.2% or 175 of them unemployed. The age group with the highest labor force participation rate is 25 to 29 years, with 97.3% or 216 individuals in the labor force. Within the labor force, the 25 to 29 years age range has the highest percentage of unemployed individuals, with 51.9% or 112 of them being unemployed.
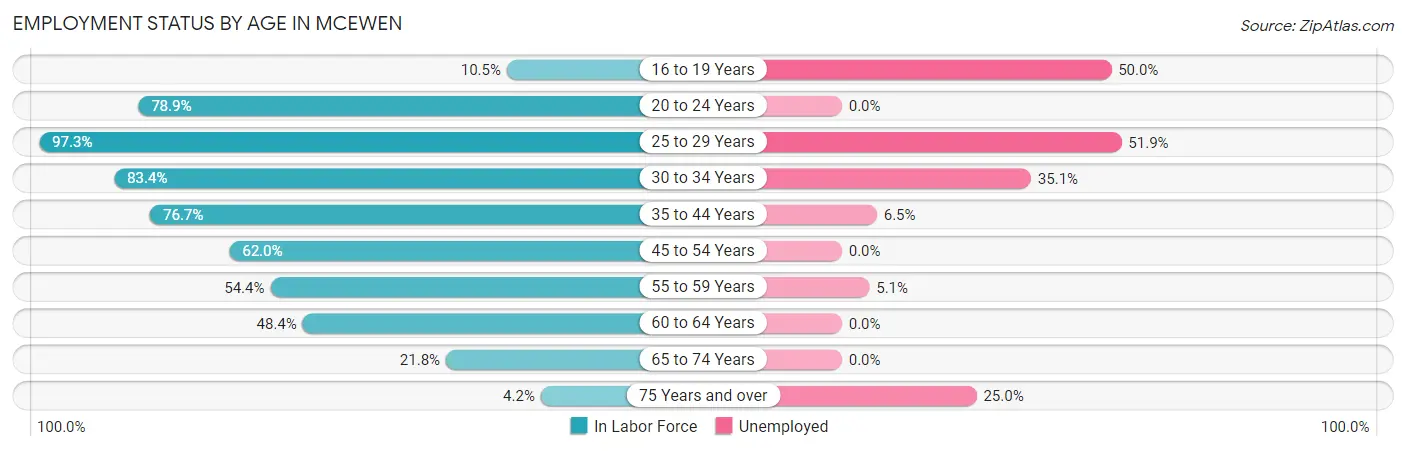
| Age Bracket | In Labor Force | Unemployed |
| 16 to 19 Years | 8 (10.5%) | 4 (50.0%) |
| 20 to 24 Years | 86 (78.9%) | 0 (0.0%) |
| 25 to 29 Years | 216 (97.3%) | 112 (51.9%) |
| 30 to 34 Years | 131 (83.4%) | 46 (35.1%) |
| 35 to 44 Years | 92 (76.7%) | 6 (6.5%) |
| 45 to 54 Years | 134 (62.0%) | 0 (0.0%) |
| 55 to 59 Years | 99 (54.4%) | 5 (5.1%) |
| 60 to 64 Years | 60 (48.4%) | 0 (0.0%) |
| 65 to 74 Years | 32 (21.8%) | 0 (0.0%) |
| 75 Years and over | 8 (4.2%) | 2 (25.0%) |
| Total | 867 (56.1%) | 175 (20.2%) |
Employment Status by Educational Attainment in McEwen
According to labor force statistics for McEwen, 71.7% of individuals (732) out of the total population between 25 and 64 years of age (1,021) are in the labor force, with 23.1% or 169 of them being unemployed. The group with the highest labor force participation rate are those with the educational attainment of bachelor's degree or higher, with 85.4% or 134 individuals in the labor force. Within the labor force, individuals with less than high school education have the highest percentage of unemployment, with 100.0% or 104 of them being unemployed.
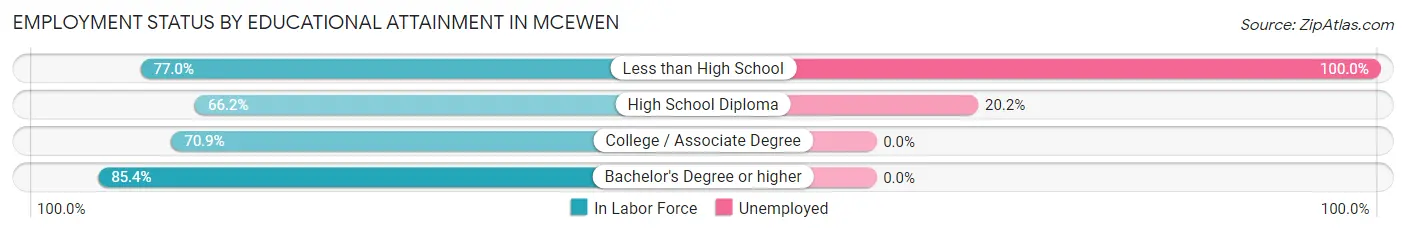
| Educational Attainment | In Labor Force | Unemployed |
| Less than High School | 104 (77.0%) | 135 (100.0%) |
| High School Diploma | 321 (66.2%) | 98 (20.2%) |
| College / Associate Degree | 173 (70.9%) | 0 (0.0%) |
| Bachelor's Degree or higher | 134 (85.4%) | 0 (0.0%) |
| Total | 732 (71.7%) | 236 (23.1%) |
Employment Occupations by Sex in McEwen
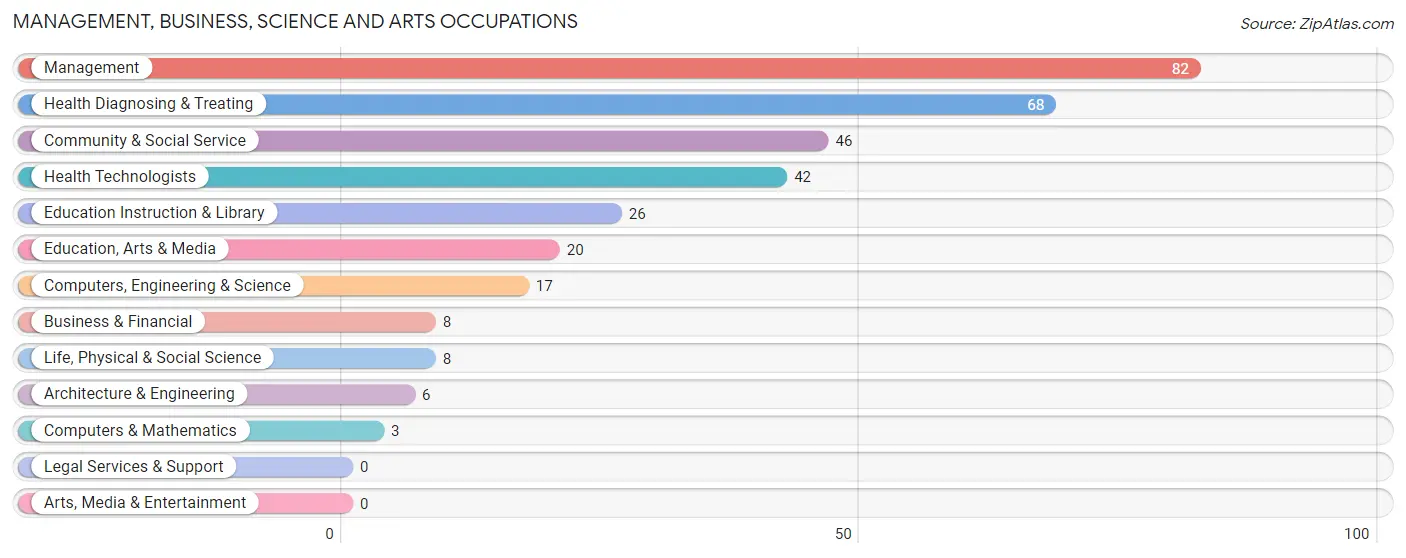
Management, Business, Science and Arts Occupations
The most common Management, Business, Science and Arts occupations in McEwen are Management (82 | 11.9%), Health Diagnosing & Treating (68 | 9.8%), Community & Social Service (46 | 6.7%), Health Technologists (42 | 6.1%), and Education Instruction & Library (26 | 3.8%).
Management, Business, Science and Arts Occupations by Sex
Within the Management, Business, Science and Arts occupations in McEwen, the most male-oriented occupations are Computers & Mathematics (100.0%), Architecture & Engineering (83.3%), and Management (52.4%), while the most female-oriented occupations are Life, Physical & Social Science (100.0%), Health Technologists (92.9%), and Health Diagnosing & Treating (85.3%).
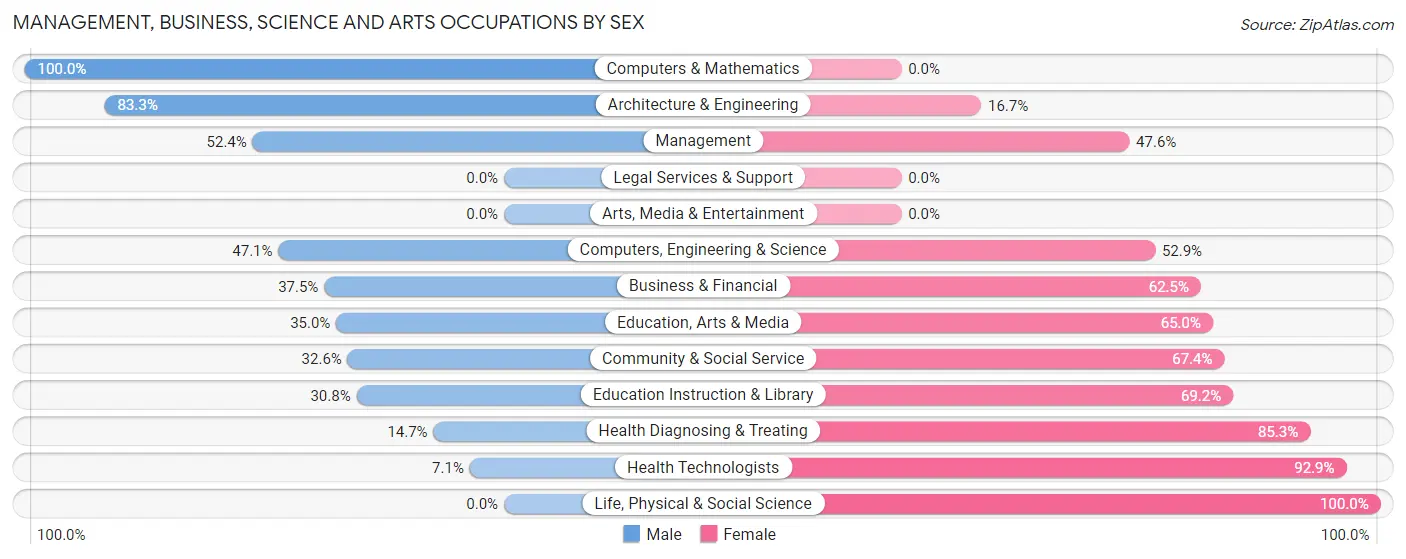
| Occupation | Male | Female |
| Management | 43 (52.4%) | 39 (47.6%) |
| Business & Financial | 3 (37.5%) | 5 (62.5%) |
| Computers, Engineering & Science | 8 (47.1%) | 9 (52.9%) |
| Computers & Mathematics | 3 (100.0%) | 0 (0.0%) |
| Architecture & Engineering | 5 (83.3%) | 1 (16.7%) |
| Life, Physical & Social Science | 0 (0.0%) | 8 (100.0%) |
| Community & Social Service | 15 (32.6%) | 31 (67.4%) |
| Education, Arts & Media | 7 (35.0%) | 13 (65.0%) |
| Legal Services & Support | 0 (0.0%) | 0 (0.0%) |
| Education Instruction & Library | 8 (30.8%) | 18 (69.2%) |
| Arts, Media & Entertainment | 0 (0.0%) | 0 (0.0%) |
| Health Diagnosing & Treating | 10 (14.7%) | 58 (85.3%) |
| Health Technologists | 3 (7.1%) | 39 (92.9%) |
| Total (Category) | 79 (35.7%) | 142 (64.2%) |
| Total (Overall) | 371 (53.7%) | 320 (46.3%) |
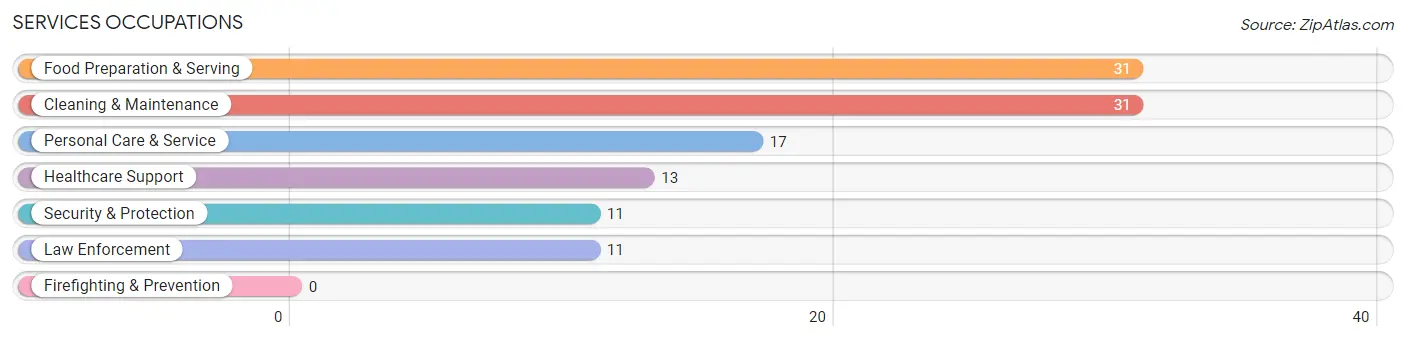
Services Occupations
The most common Services occupations in McEwen are Food Preparation & Serving (31 | 4.5%), Cleaning & Maintenance (31 | 4.5%), Personal Care & Service (17 | 2.5%), Healthcare Support (13 | 1.9%), and Security & Protection (11 | 1.6%).
Services Occupations by Sex
Within the Services occupations in McEwen, the most male-oriented occupations are Security & Protection (100.0%), Law Enforcement (100.0%), and Personal Care & Service (82.4%), while the most female-oriented occupations are Healthcare Support (100.0%), Food Preparation & Serving (100.0%), and Cleaning & Maintenance (38.7%).
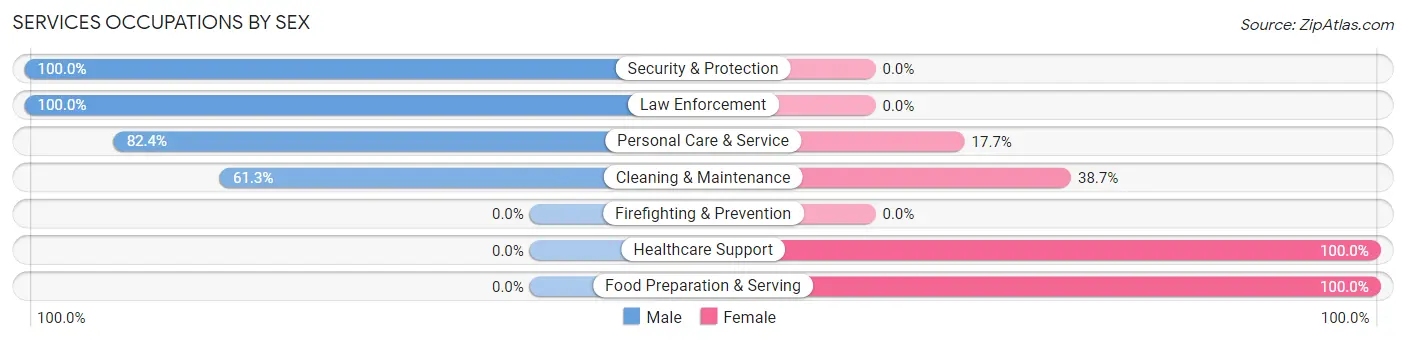
| Occupation | Male | Female |
| Healthcare Support | 0 (0.0%) | 13 (100.0%) |
| Security & Protection | 11 (100.0%) | 0 (0.0%) |
| Firefighting & Prevention | 0 (0.0%) | 0 (0.0%) |
| Law Enforcement | 11 (100.0%) | 0 (0.0%) |
| Food Preparation & Serving | 0 (0.0%) | 31 (100.0%) |
| Cleaning & Maintenance | 19 (61.3%) | 12 (38.7%) |
| Personal Care & Service | 14 (82.4%) | 3 (17.6%) |
| Total (Category) | 44 (42.7%) | 59 (57.3%) |
| Total (Overall) | 371 (53.7%) | 320 (46.3%) |
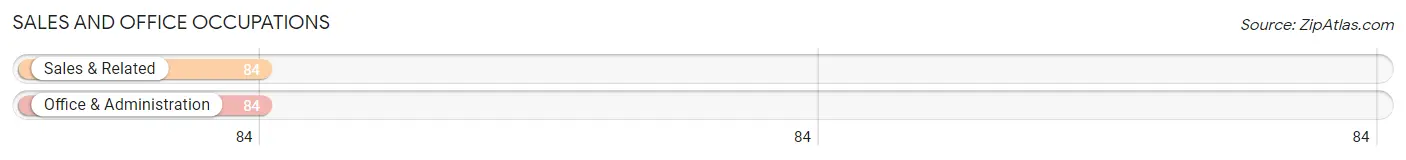
Sales and Office Occupations
The most common Sales and Office occupations in McEwen are Sales & Related (84 | 12.2%), and Office & Administration (84 | 12.2%).
Sales and Office Occupations by Sex
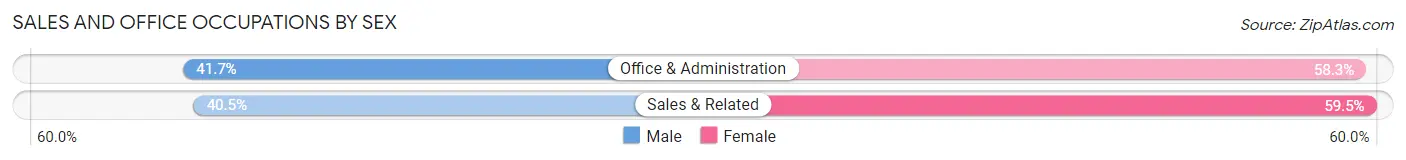
| Occupation | Male | Female |
| Sales & Related | 34 (40.5%) | 50 (59.5%) |
| Office & Administration | 35 (41.7%) | 49 (58.3%) |
| Total (Category) | 69 (41.1%) | 99 (58.9%) |
| Total (Overall) | 371 (53.7%) | 320 (46.3%) |
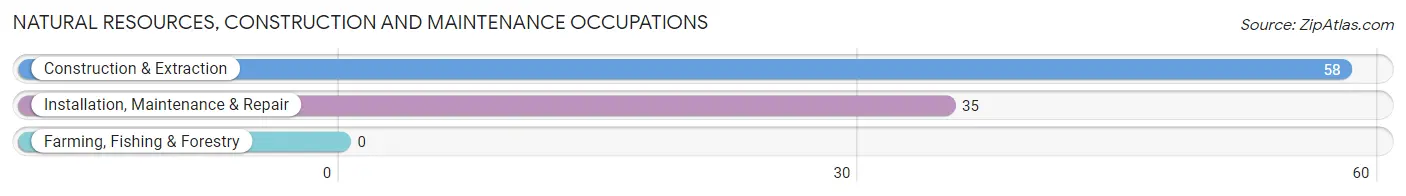
Natural Resources, Construction and Maintenance Occupations
The most common Natural Resources, Construction and Maintenance occupations in McEwen are Construction & Extraction (58 | 8.4%), and Installation, Maintenance & Repair (35 | 5.1%).
Natural Resources, Construction and Maintenance Occupations by Sex
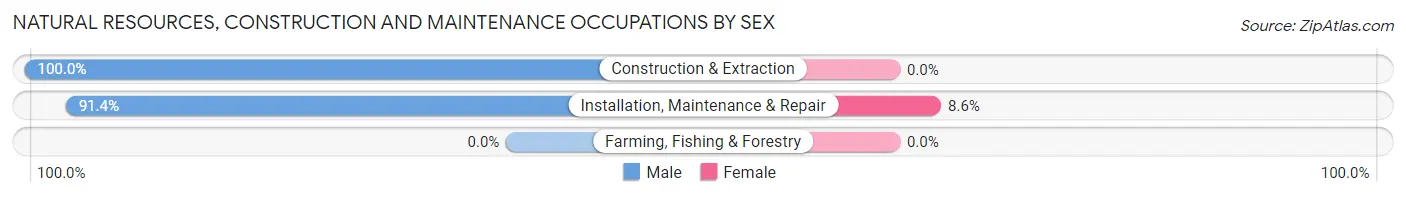
| Occupation | Male | Female |
| Farming, Fishing & Forestry | 0 (0.0%) | 0 (0.0%) |
| Construction & Extraction | 58 (100.0%) | 0 (0.0%) |
| Installation, Maintenance & Repair | 32 (91.4%) | 3 (8.6%) |
| Total (Category) | 90 (96.8%) | 3 (3.2%) |
| Total (Overall) | 371 (53.7%) | 320 (46.3%) |
Production, Transportation and Moving Occupations
The most common Production, Transportation and Moving occupations in McEwen are Production (77 | 11.1%), Material Moving (23 | 3.3%), and Transportation (6 | 0.9%).
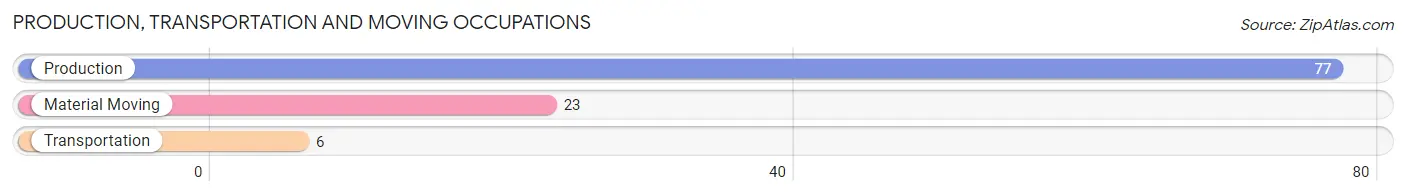
Production, Transportation and Moving Occupations by Sex
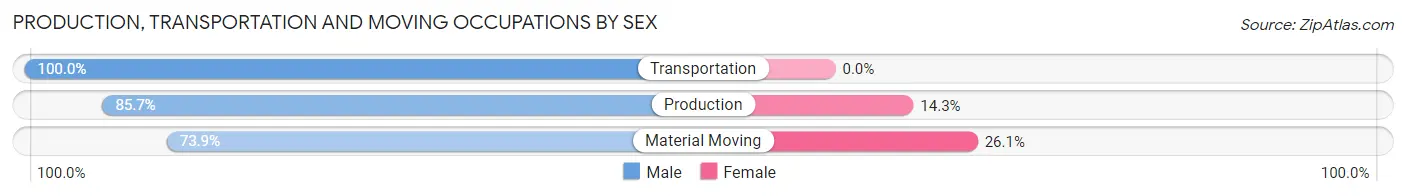
| Occupation | Male | Female |
| Production | 66 (85.7%) | 11 (14.3%) |
| Transportation | 6 (100.0%) | 0 (0.0%) |
| Material Moving | 17 (73.9%) | 6 (26.1%) |
| Total (Category) | 89 (84.0%) | 17 (16.0%) |
| Total (Overall) | 371 (53.7%) | 320 (46.3%) |
Employment Industries by Sex in McEwen
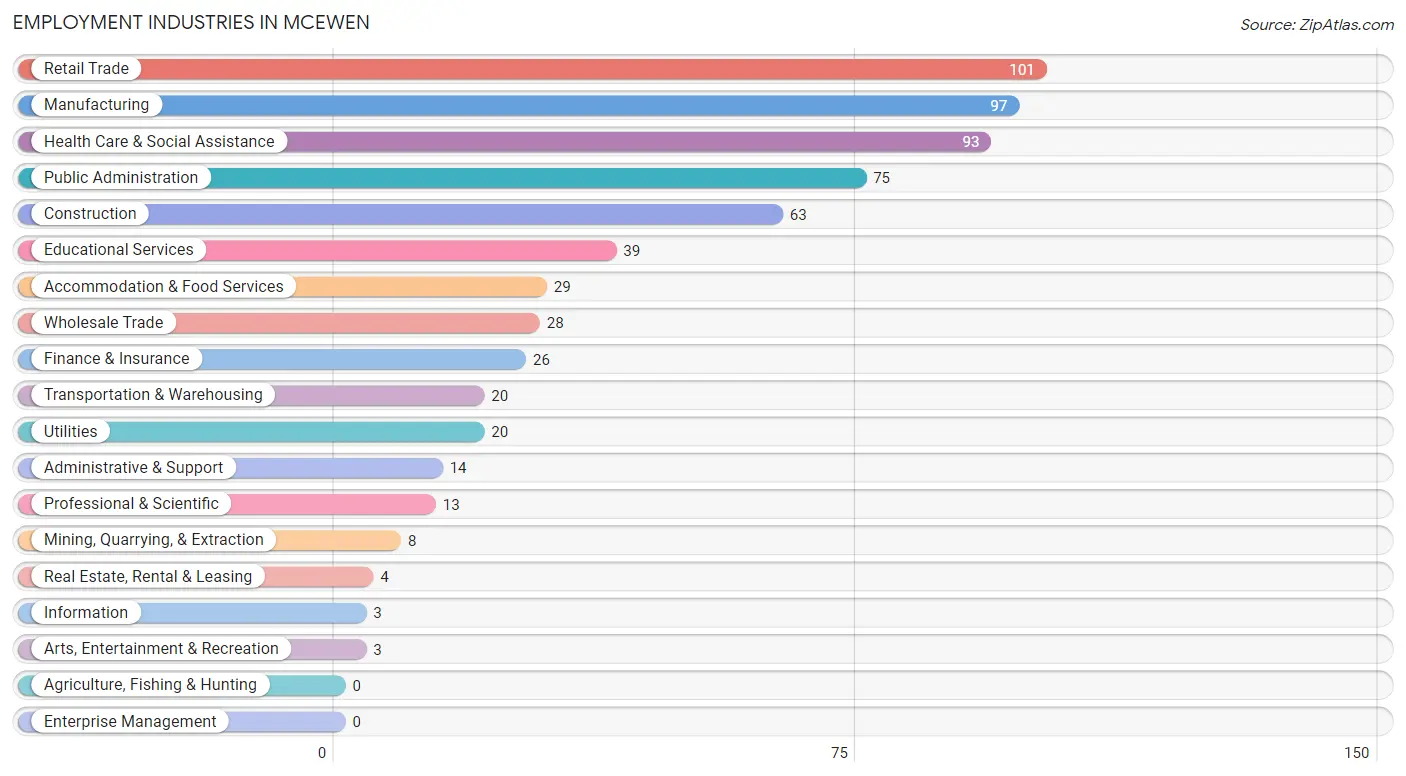
Employment Industries in McEwen
The major employment industries in McEwen include Retail Trade (101 | 14.6%), Manufacturing (97 | 14.0%), Health Care & Social Assistance (93 | 13.5%), Public Administration (75 | 10.8%), and Construction (63 | 9.1%).
Employment Industries by Sex in McEwen
The McEwen industries that see more men than women are Mining, Quarrying, & Extraction (100.0%), Information (100.0%), and Real Estate, Rental & Leasing (100.0%), whereas the industries that tend to have a higher number of women are Finance & Insurance (100.0%), Arts, Entertainment & Recreation (100.0%), and Accommodation & Food Services (89.7%).
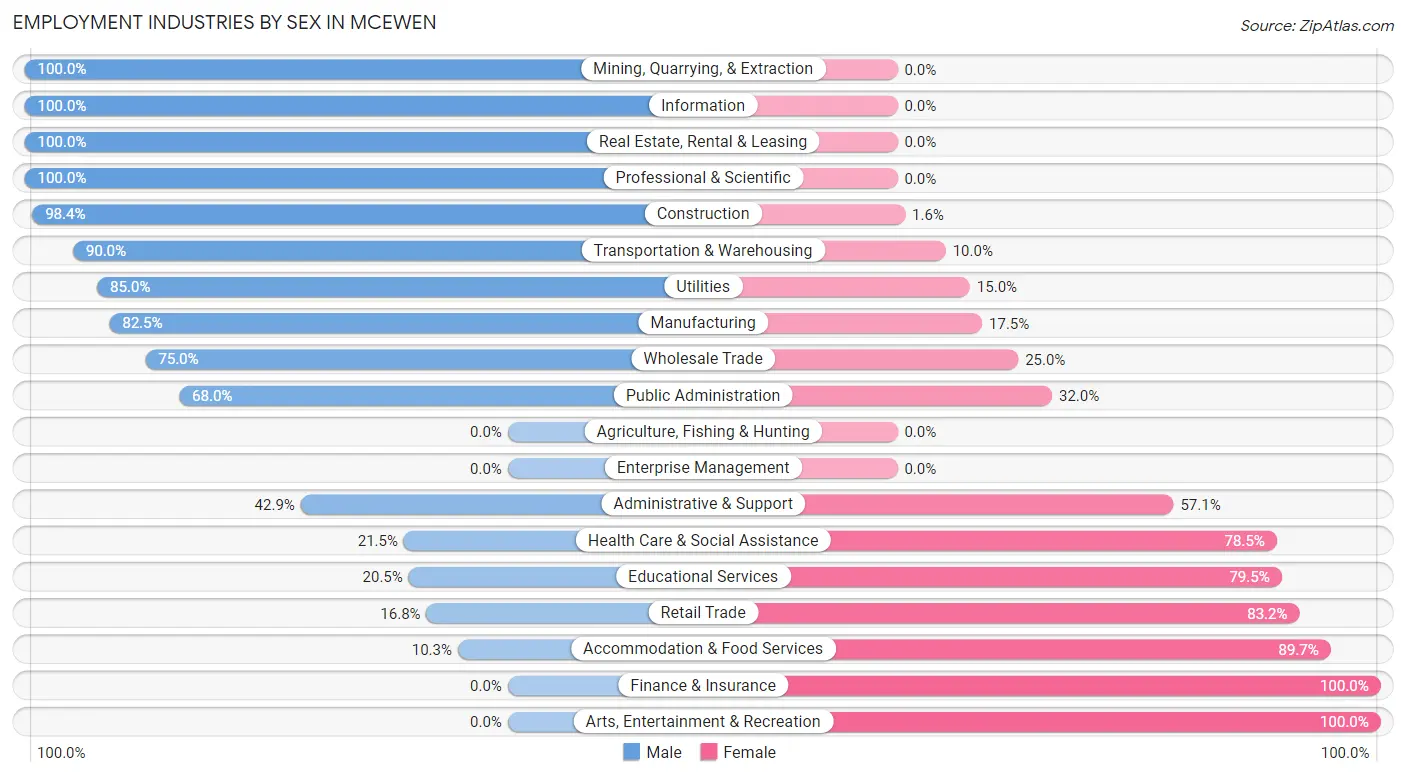
| Industry | Male | Female |
| Agriculture, Fishing & Hunting | 0 (0.0%) | 0 (0.0%) |
| Mining, Quarrying, & Extraction | 8 (100.0%) | 0 (0.0%) |
| Construction | 62 (98.4%) | 1 (1.6%) |
| Manufacturing | 80 (82.5%) | 17 (17.5%) |
| Wholesale Trade | 21 (75.0%) | 7 (25.0%) |
| Retail Trade | 17 (16.8%) | 84 (83.2%) |
| Transportation & Warehousing | 18 (90.0%) | 2 (10.0%) |
| Utilities | 17 (85.0%) | 3 (15.0%) |
| Information | 3 (100.0%) | 0 (0.0%) |
| Finance & Insurance | 0 (0.0%) | 26 (100.0%) |
| Real Estate, Rental & Leasing | 4 (100.0%) | 0 (0.0%) |
| Professional & Scientific | 13 (100.0%) | 0 (0.0%) |
| Enterprise Management | 0 (0.0%) | 0 (0.0%) |
| Administrative & Support | 6 (42.9%) | 8 (57.1%) |
| Educational Services | 8 (20.5%) | 31 (79.5%) |
| Health Care & Social Assistance | 20 (21.5%) | 73 (78.5%) |
| Arts, Entertainment & Recreation | 0 (0.0%) | 3 (100.0%) |
| Accommodation & Food Services | 3 (10.3%) | 26 (89.7%) |
| Public Administration | 51 (68.0%) | 24 (32.0%) |
| Total | 371 (53.7%) | 320 (46.3%) |
Education in McEwen
School Enrollment in McEwen
The most common levels of schooling among the 272 students in McEwen are elementary school (84 | 30.9%), middle school (67 | 24.6%), and high school (67 | 24.6%).
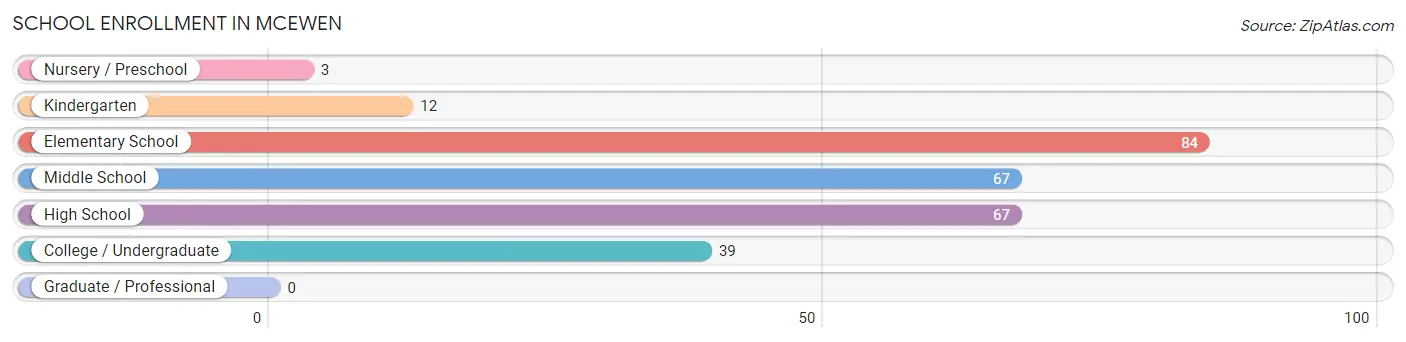
| School Level | # Students | % Students |
| Nursery / Preschool | 3 | 1.1% |
| Kindergarten | 12 | 4.4% |
| Elementary School | 84 | 30.9% |
| Middle School | 67 | 24.6% |
| High School | 67 | 24.6% |
| College / Undergraduate | 39 | 14.3% |
| Graduate / Professional | 0 | 0.0% |
| Total | 272 | 100.0% |
School Enrollment by Age by Funding Source in McEwen
Out of a total of 272 students who are enrolled in schools in McEwen, 48 (17.6%) attend a private institution, while the remaining 224 (82.4%) are enrolled in public schools. The age group of 35 years and over has the highest likelihood of being enrolled in private schools, with 14 (100.0% in the age bracket) enrolled. Conversely, the age group of 3 to 4 year olds has the lowest likelihood of being enrolled in a private school, with 3 (100.0% in the age bracket) attending a public institution.
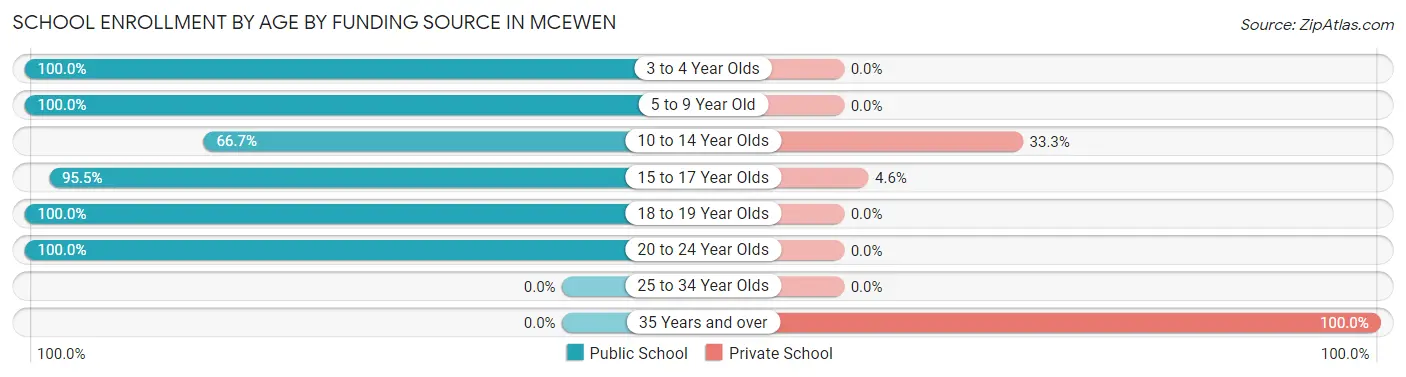
| Age Bracket | Public School | Private School |
| 3 to 4 Year Olds | 3 (100.0%) | 0 (0.0%) |
| 5 to 9 Year Old | 63 (100.0%) | 0 (0.0%) |
| 10 to 14 Year Olds | 62 (66.7%) | 31 (33.3%) |
| 15 to 17 Year Olds | 63 (95.5%) | 3 (4.5%) |
| 18 to 19 Year Olds | 8 (100.0%) | 0 (0.0%) |
| 20 to 24 Year Olds | 25 (100.0%) | 0 (0.0%) |
| 25 to 34 Year Olds | 0 (0.0%) | 0 (0.0%) |
| 35 Years and over | 0 (0.0%) | 14 (100.0%) |
| Total | 224 (82.4%) | 48 (17.6%) |
Educational Attainment by Field of Study in McEwen
Liberal arts & history (56 | 26.1%), business (40 | 18.6%), education (33 | 15.3%), engineering (18 | 8.4%), and science & technology (17 | 7.9%) are the most common fields of study among 215 individuals in McEwen who have obtained a bachelor's degree or higher.
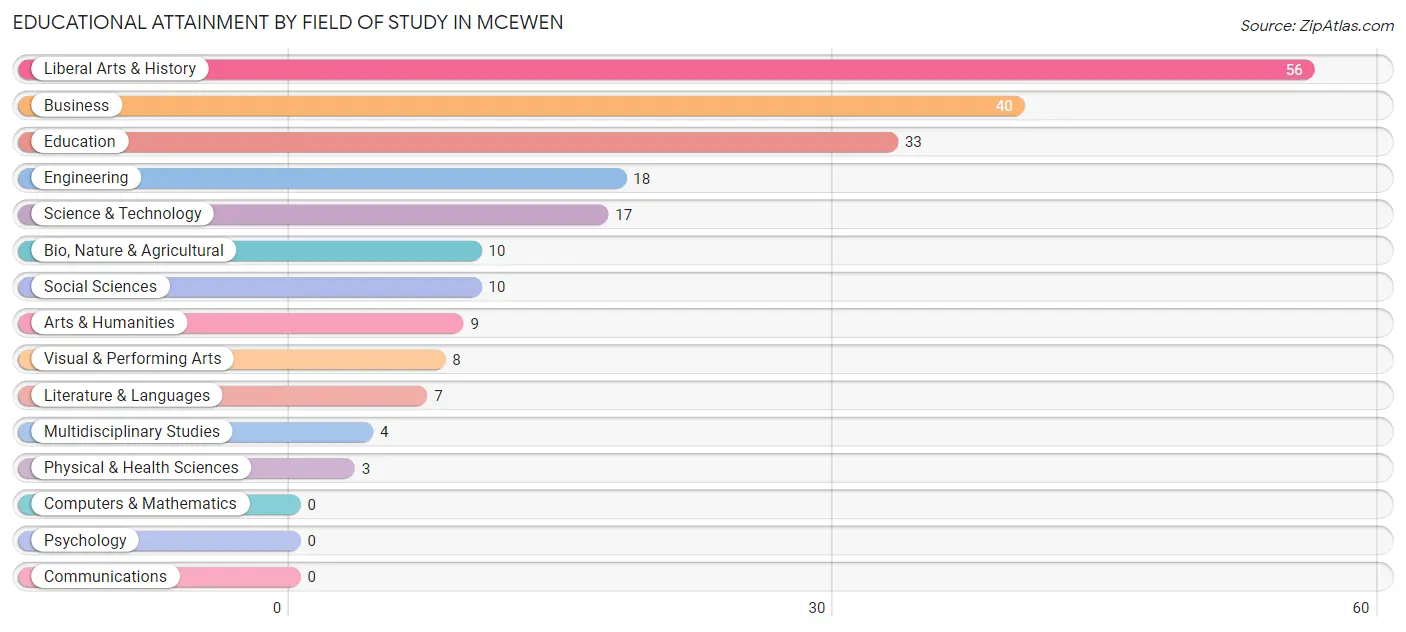
| Field of Study | # Graduates | % Graduates |
| Computers & Mathematics | 0 | 0.0% |
| Bio, Nature & Agricultural | 10 | 4.6% |
| Physical & Health Sciences | 3 | 1.4% |
| Psychology | 0 | 0.0% |
| Social Sciences | 10 | 4.6% |
| Engineering | 18 | 8.4% |
| Multidisciplinary Studies | 4 | 1.9% |
| Science & Technology | 17 | 7.9% |
| Business | 40 | 18.6% |
| Education | 33 | 15.3% |
| Literature & Languages | 7 | 3.3% |
| Liberal Arts & History | 56 | 26.1% |
| Visual & Performing Arts | 8 | 3.7% |
| Communications | 0 | 0.0% |
| Arts & Humanities | 9 | 4.2% |
| Total | 215 | 100.0% |
Transportation & Commute in McEwen
Vehicle Availability by Sex in McEwen
The most prevalent vehicle ownership categories in McEwen are males with 3 vehicles (183, accounting for 49.3%) and females with 3 vehicles (157, making up 57.2%).
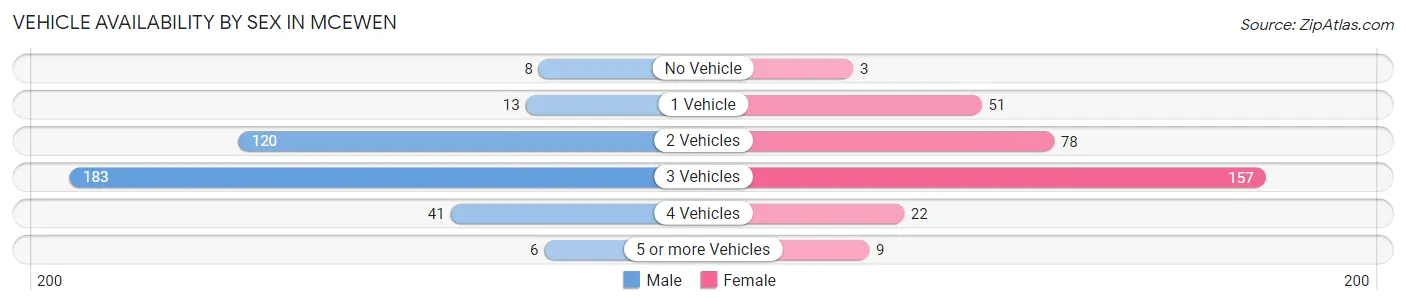
| Vehicles Available | Male | Female |
| No Vehicle | 8 (2.2%) | 3 (0.9%) |
| 1 Vehicle | 13 (3.5%) | 51 (15.9%) |
| 2 Vehicles | 120 (32.4%) | 78 (24.4%) |
| 3 Vehicles | 183 (49.3%) | 157 (49.1%) |
| 4 Vehicles | 41 (11.1%) | 22 (6.9%) |
| 5 or more Vehicles | 6 (1.6%) | 9 (2.8%) |
| Total | 371 (100.0%) | 320 (100.0%) |
Commute Time in McEwen
The most frequently occuring commute durations in McEwen are 25 to 29 minutes (149 commuters, 21.8%), 90 or more minutes (106 commuters, 15.5%), and 60 to 89 minutes (94 commuters, 13.8%).
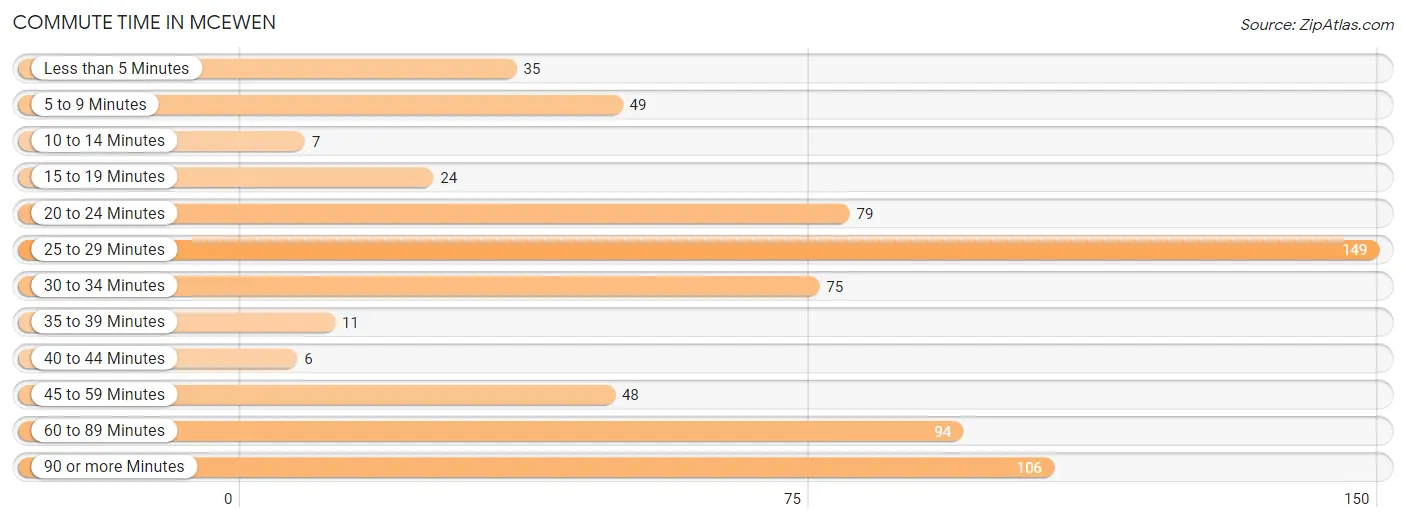
| Commute Time | # Commuters | % Commuters |
| Less than 5 Minutes | 35 | 5.1% |
| 5 to 9 Minutes | 49 | 7.2% |
| 10 to 14 Minutes | 7 | 1.0% |
| 15 to 19 Minutes | 24 | 3.5% |
| 20 to 24 Minutes | 79 | 11.6% |
| 25 to 29 Minutes | 149 | 21.8% |
| 30 to 34 Minutes | 75 | 11.0% |
| 35 to 39 Minutes | 11 | 1.6% |
| 40 to 44 Minutes | 6 | 0.9% |
| 45 to 59 Minutes | 48 | 7.0% |
| 60 to 89 Minutes | 94 | 13.8% |
| 90 or more Minutes | 106 | 15.5% |
Commute Time by Sex in McEwen
The most common commute times in McEwen are 90 or more minutes (85 commuters, 22.9%) for males and 25 to 29 minutes (86 commuters, 27.6%) for females.
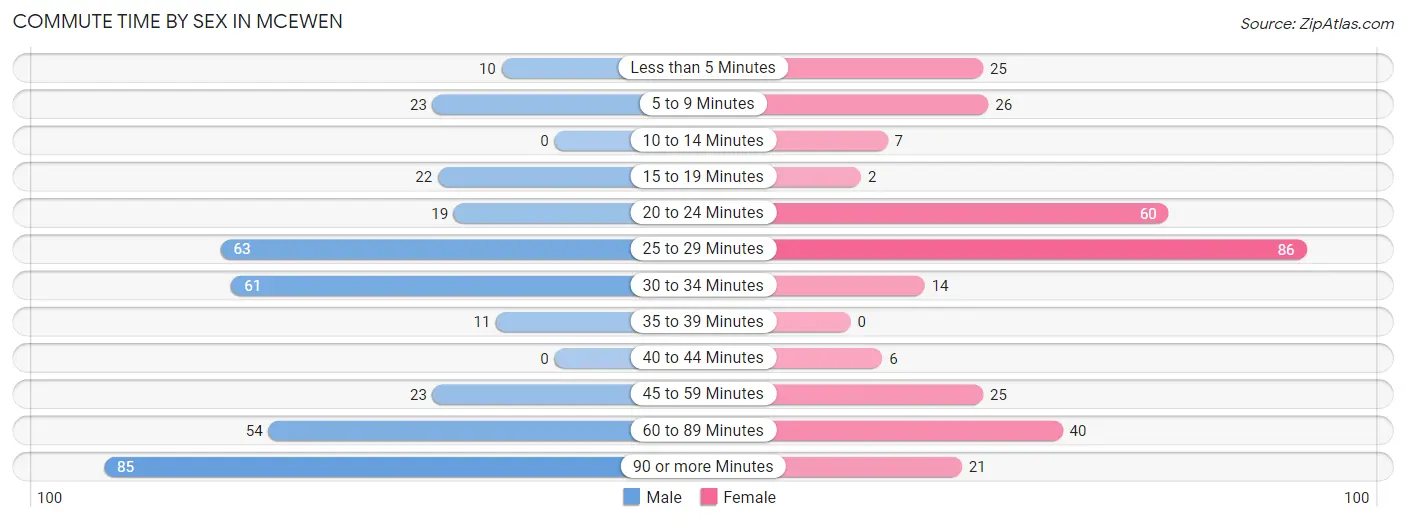
| Commute Time | Male | Female |
| Less than 5 Minutes | 10 (2.7%) | 25 (8.0%) |
| 5 to 9 Minutes | 23 (6.2%) | 26 (8.3%) |
| 10 to 14 Minutes | 0 (0.0%) | 7 (2.2%) |
| 15 to 19 Minutes | 22 (5.9%) | 2 (0.6%) |
| 20 to 24 Minutes | 19 (5.1%) | 60 (19.2%) |
| 25 to 29 Minutes | 63 (17.0%) | 86 (27.6%) |
| 30 to 34 Minutes | 61 (16.4%) | 14 (4.5%) |
| 35 to 39 Minutes | 11 (3.0%) | 0 (0.0%) |
| 40 to 44 Minutes | 0 (0.0%) | 6 (1.9%) |
| 45 to 59 Minutes | 23 (6.2%) | 25 (8.0%) |
| 60 to 89 Minutes | 54 (14.6%) | 40 (12.8%) |
| 90 or more Minutes | 85 (22.9%) | 21 (6.7%) |
Time of Departure to Work by Sex in McEwen
The most frequent times of departure to work in McEwen are 5:00 AM to 5:29 AM (95, 25.6%) for males and 7:00 AM to 7:29 AM (67, 21.5%) for females.
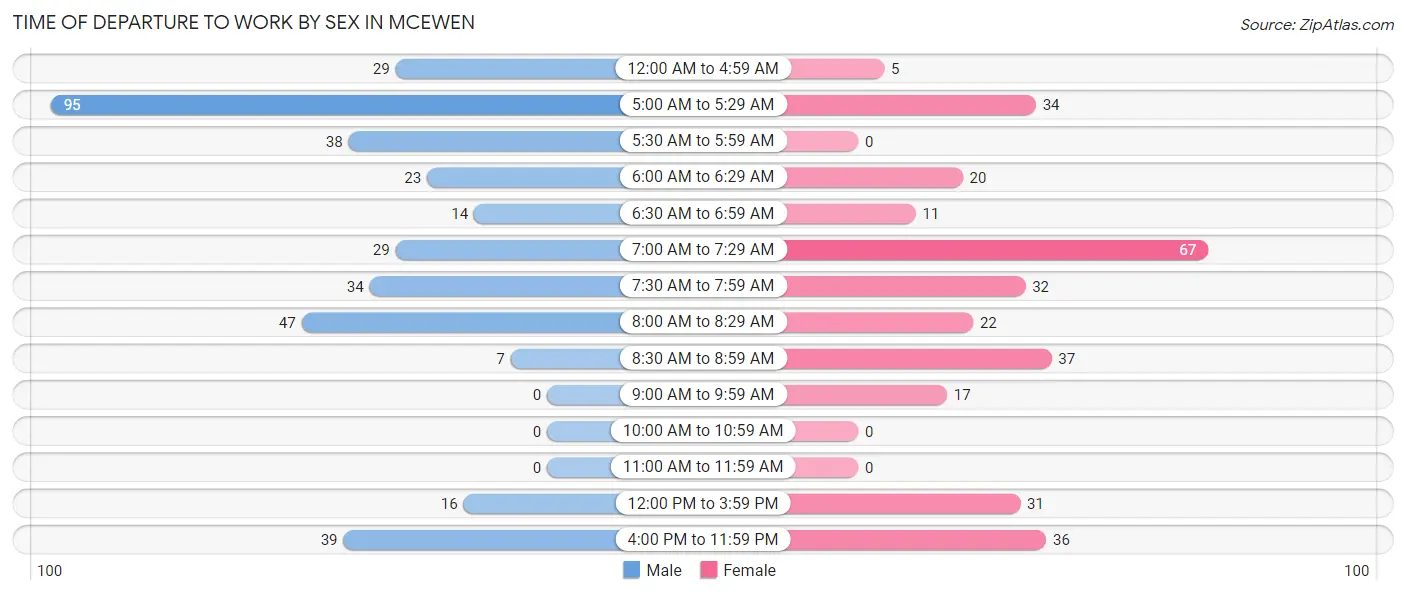
| Time of Departure | Male | Female |
| 12:00 AM to 4:59 AM | 29 (7.8%) | 5 (1.6%) |
| 5:00 AM to 5:29 AM | 95 (25.6%) | 34 (10.9%) |
| 5:30 AM to 5:59 AM | 38 (10.2%) | 0 (0.0%) |
| 6:00 AM to 6:29 AM | 23 (6.2%) | 20 (6.4%) |
| 6:30 AM to 6:59 AM | 14 (3.8%) | 11 (3.5%) |
| 7:00 AM to 7:29 AM | 29 (7.8%) | 67 (21.5%) |
| 7:30 AM to 7:59 AM | 34 (9.2%) | 32 (10.3%) |
| 8:00 AM to 8:29 AM | 47 (12.7%) | 22 (7.0%) |
| 8:30 AM to 8:59 AM | 7 (1.9%) | 37 (11.9%) |
| 9:00 AM to 9:59 AM | 0 (0.0%) | 17 (5.4%) |
| 10:00 AM to 10:59 AM | 0 (0.0%) | 0 (0.0%) |
| 11:00 AM to 11:59 AM | 0 (0.0%) | 0 (0.0%) |
| 12:00 PM to 3:59 PM | 16 (4.3%) | 31 (9.9%) |
| 4:00 PM to 11:59 PM | 39 (10.5%) | 36 (11.5%) |
| Total | 371 (100.0%) | 312 (100.0%) |
Housing Occupancy in McEwen
Occupancy by Ownership in McEwen
Of the total 626 dwellings in McEwen, owner-occupied units account for 480 (76.7%), while renter-occupied units make up 146 (23.3%).
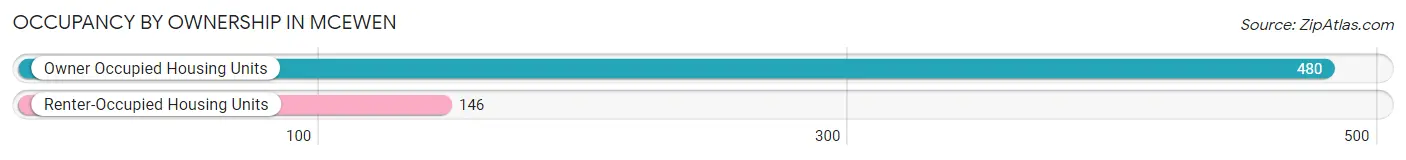
| Occupancy | # Housing Units | % Housing Units |
| Owner Occupied Housing Units | 480 | 76.7% |
| Renter-Occupied Housing Units | 146 | 23.3% |
| Total Occupied Housing Units | 626 | 100.0% |
Occupancy by Household Size in McEwen
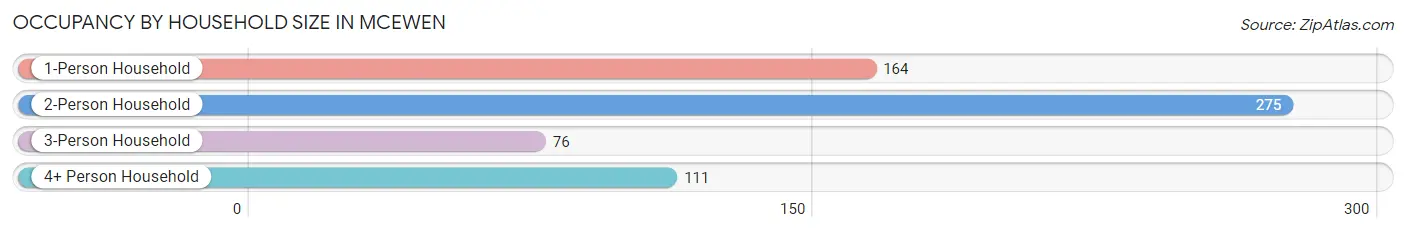
| Household Size | # Housing Units | % Housing Units |
| 1-Person Household | 164 | 26.2% |
| 2-Person Household | 275 | 43.9% |
| 3-Person Household | 76 | 12.1% |
| 4+ Person Household | 111 | 17.7% |
| Total Housing Units | 626 | 100.0% |
Occupancy by Ownership by Household Size in McEwen

| Household Size | Owner-occupied | Renter-occupied |
| 1-Person Household | 114 (69.5%) | 50 (30.5%) |
| 2-Person Household | 226 (82.2%) | 49 (17.8%) |
| 3-Person Household | 48 (63.2%) | 28 (36.8%) |
| 4+ Person Household | 92 (82.9%) | 19 (17.1%) |
| Total Housing Units | 480 (76.7%) | 146 (23.3%) |
Occupancy by Educational Attainment in McEwen
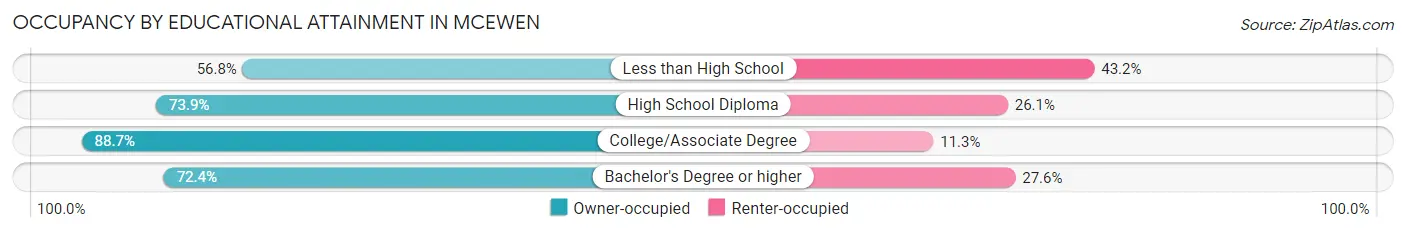
| Household Size | Owner-occupied | Renter-occupied |
| Less than High School | 42 (56.8%) | 32 (43.2%) |
| High School Diploma | 187 (73.9%) | 66 (26.1%) |
| College/Associate Degree | 188 (88.7%) | 24 (11.3%) |
| Bachelor's Degree or higher | 63 (72.4%) | 24 (27.6%) |
Occupancy by Age of Householder in McEwen
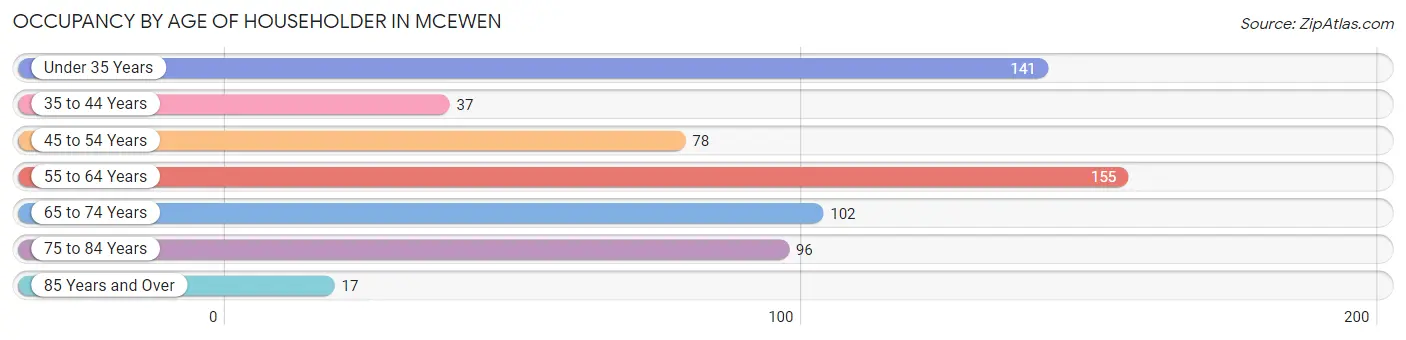
| Age Bracket | # Households | % Households |
| Under 35 Years | 141 | 22.5% |
| 35 to 44 Years | 37 | 5.9% |
| 45 to 54 Years | 78 | 12.5% |
| 55 to 64 Years | 155 | 24.8% |
| 65 to 74 Years | 102 | 16.3% |
| 75 to 84 Years | 96 | 15.3% |
| 85 Years and Over | 17 | 2.7% |
| Total | 626 | 100.0% |
Housing Finances in McEwen
Median Income by Occupancy in McEwen
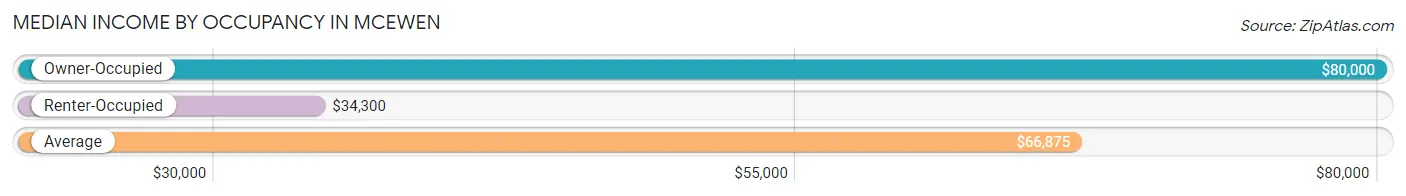
| Occupancy Type | # Households | Median Income |
| Owner-Occupied | 480 (76.7%) | $80,000 |
| Renter-Occupied | 146 (23.3%) | $34,300 |
| Average | 626 (100.0%) | $66,875 |
Occupancy by Householder Income Bracket in McEwen
| Income Bracket | Owner-occupied | Renter-occupied |
| Less than $5,000 | 5 (1.0%) | 9 (6.2%) |
| $5,000 to $9,999 | 0 (0.0%) | 3 (2.1%) |
| $10,000 to $14,999 | 30 (6.2%) | 9 (6.2%) |
| $15,000 to $19,999 | 20 (4.2%) | 9 (6.2%) |
| $20,000 to $24,999 | 10 (2.1%) | 19 (13.0%) |
| $25,000 to $34,999 | 45 (9.4%) | 31 (21.2%) |
| $35,000 to $49,999 | 38 (7.9%) | 12 (8.2%) |
| $50,000 to $74,999 | 73 (15.2%) | 19 (13.0%) |
| $75,000 to $99,999 | 118 (24.6%) | 7 (4.8%) |
| $100,000 to $149,999 | 97 (20.2%) | 21 (14.4%) |
| $150,000 or more | 44 (9.2%) | 7 (4.8%) |
| Total | 480 (100.0%) | 146 (100.0%) |
Monthly Housing Cost Tiers in McEwen
| Monthly Cost | Owner-occupied | Renter-occupied |
| Less than $300 | 39 (8.1%) | 0 (0.0%) |
| $300 to $499 | 158 (32.9%) | 5 (3.4%) |
| $500 to $799 | 89 (18.5%) | 81 (55.5%) |
| $800 to $999 | 75 (15.6%) | 25 (17.1%) |
| $1,000 to $1,499 | 94 (19.6%) | 7 (4.8%) |
| $1,500 to $1,999 | 19 (4.0%) | 0 (0.0%) |
| $2,000 to $2,499 | 6 (1.3%) | 0 (0.0%) |
| $2,500 to $2,999 | 0 (0.0%) | 0 (0.0%) |
| $3,000 or more | 0 (0.0%) | 0 (0.0%) |
| Total | 480 (100.0%) | 146 (100.0%) |
Physical Housing Characteristics in McEwen
Housing Structures in McEwen
| Structure Type | # Housing Units | % Housing Units |
| Single Unit, Detached | 493 | 78.7% |
| Single Unit, Attached | 0 | 0.0% |
| 2 Unit Apartments | 31 | 5.0% |
| 3 or 4 Unit Apartments | 14 | 2.2% |
| 5 to 9 Unit Apartments | 14 | 2.2% |
| 10 or more Apartments | 1 | 0.2% |
| Mobile Home / Other | 73 | 11.7% |
| Total | 626 | 100.0% |
Housing Structures by Occupancy in McEwen
| Structure Type | Owner-occupied | Renter-occupied |
| Single Unit, Detached | 419 (85.0%) | 74 (15.0%) |
| Single Unit, Attached | 0 (0.0%) | 0 (0.0%) |
| 2 Unit Apartments | 0 (0.0%) | 31 (100.0%) |
| 3 or 4 Unit Apartments | 0 (0.0%) | 14 (100.0%) |
| 5 to 9 Unit Apartments | 5 (35.7%) | 9 (64.3%) |
| 10 or more Apartments | 0 (0.0%) | 1 (100.0%) |
| Mobile Home / Other | 56 (76.7%) | 17 (23.3%) |
| Total | 480 (76.7%) | 146 (23.3%) |
Housing Structures by Number of Rooms in McEwen
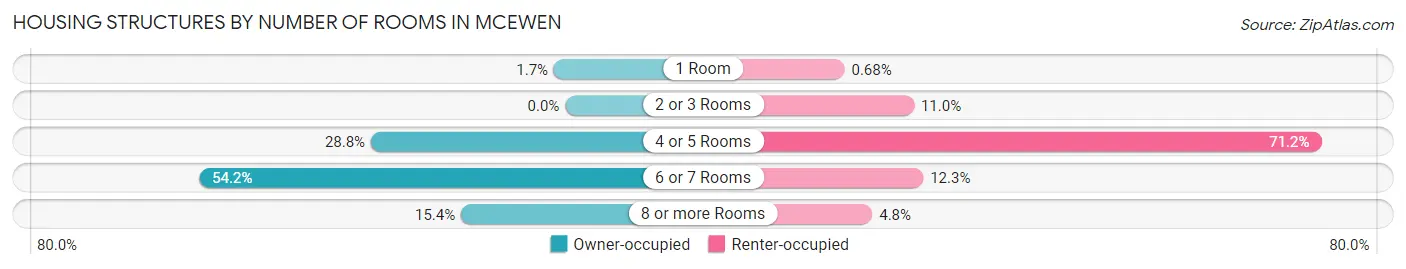
| Number of Rooms | Owner-occupied | Renter-occupied |
| 1 Room | 8 (1.7%) | 1 (0.7%) |
| 2 or 3 Rooms | 0 (0.0%) | 16 (11.0%) |
| 4 or 5 Rooms | 138 (28.7%) | 104 (71.2%) |
| 6 or 7 Rooms | 260 (54.2%) | 18 (12.3%) |
| 8 or more Rooms | 74 (15.4%) | 7 (4.8%) |
| Total | 480 (100.0%) | 146 (100.0%) |
Housing Structure by Heating Type in McEwen
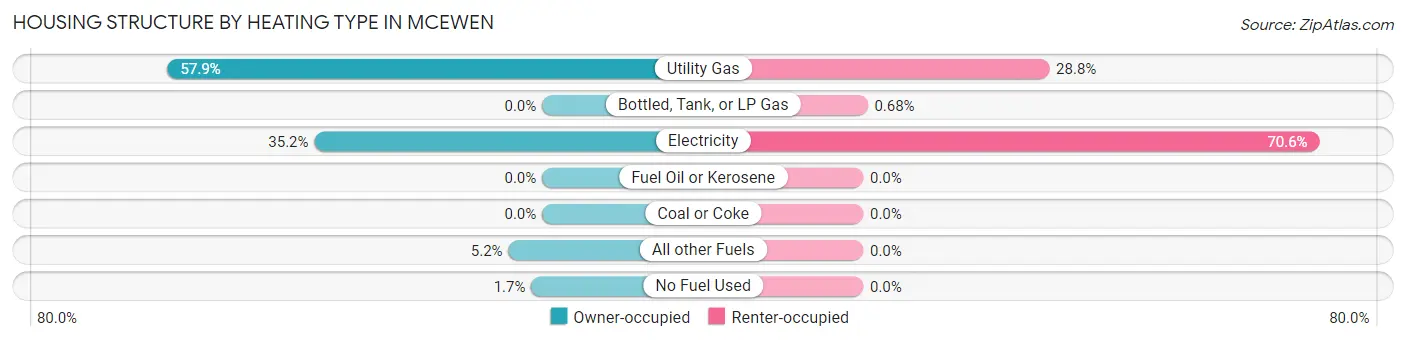
| Heating Type | Owner-occupied | Renter-occupied |
| Utility Gas | 278 (57.9%) | 42 (28.8%) |
| Bottled, Tank, or LP Gas | 0 (0.0%) | 1 (0.7%) |
| Electricity | 169 (35.2%) | 103 (70.6%) |
| Fuel Oil or Kerosene | 0 (0.0%) | 0 (0.0%) |
| Coal or Coke | 0 (0.0%) | 0 (0.0%) |
| All other Fuels | 25 (5.2%) | 0 (0.0%) |
| No Fuel Used | 8 (1.7%) | 0 (0.0%) |
| Total | 480 (100.0%) | 146 (100.0%) |
Household Vehicle Usage in McEwen
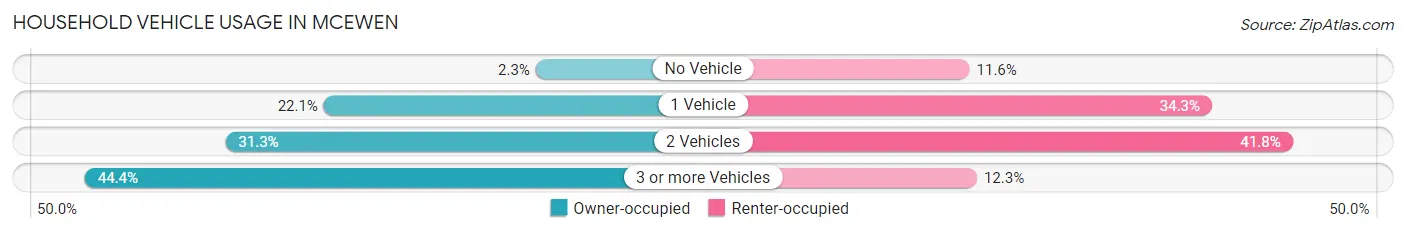
| Vehicles per Household | Owner-occupied | Renter-occupied |
| No Vehicle | 11 (2.3%) | 17 (11.6%) |
| 1 Vehicle | 106 (22.1%) | 50 (34.3%) |
| 2 Vehicles | 150 (31.2%) | 61 (41.8%) |
| 3 or more Vehicles | 213 (44.4%) | 18 (12.3%) |
| Total | 480 (100.0%) | 146 (100.0%) |
Real Estate & Mortgages in McEwen
Real Estate and Mortgage Overview in McEwen
| Characteristic | Without Mortgage | With Mortgage |
| Housing Units | 269 | 211 |
| Median Property Value | $143,800 | $146,500 |
| Median Household Income | $61,750 | $17 |
| Monthly Housing Costs | $425 | $0 |
| Real Estate Taxes | $692 | $9 |
Property Value by Mortgage Status in McEwen
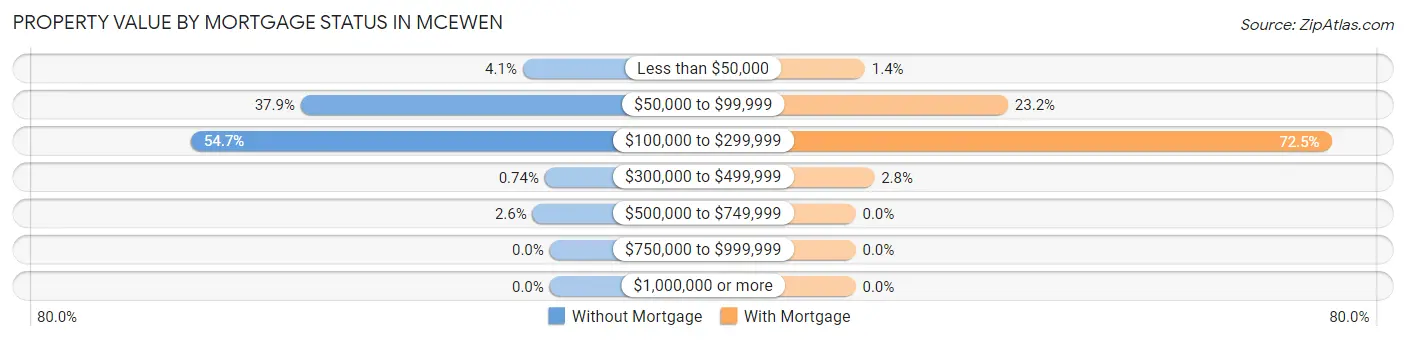
| Property Value | Without Mortgage | With Mortgage |
| Less than $50,000 | 11 (4.1%) | 3 (1.4%) |
| $50,000 to $99,999 | 102 (37.9%) | 49 (23.2%) |
| $100,000 to $299,999 | 147 (54.6%) | 153 (72.5%) |
| $300,000 to $499,999 | 2 (0.7%) | 6 (2.8%) |
| $500,000 to $749,999 | 7 (2.6%) | 0 (0.0%) |
| $750,000 to $999,999 | 0 (0.0%) | 0 (0.0%) |
| $1,000,000 or more | 0 (0.0%) | 0 (0.0%) |
| Total | 269 (100.0%) | 211 (100.0%) |
Household Income by Mortgage Status in McEwen
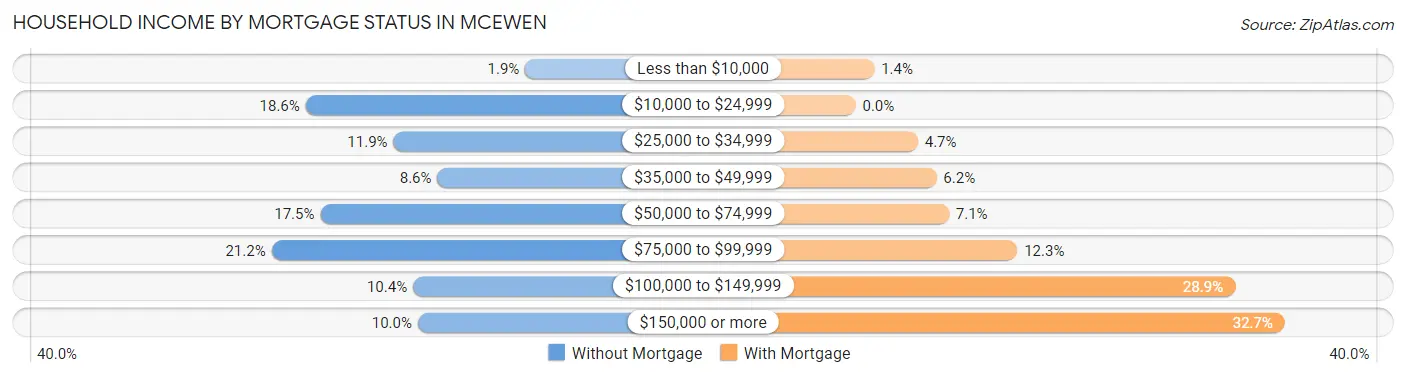
| Household Income | Without Mortgage | With Mortgage |
| Less than $10,000 | 5 (1.9%) | 3 (1.4%) |
| $10,000 to $24,999 | 50 (18.6%) | 0 (0.0%) |
| $25,000 to $34,999 | 32 (11.9%) | 10 (4.7%) |
| $35,000 to $49,999 | 23 (8.6%) | 13 (6.2%) |
| $50,000 to $74,999 | 47 (17.5%) | 15 (7.1%) |
| $75,000 to $99,999 | 57 (21.2%) | 26 (12.3%) |
| $100,000 to $149,999 | 28 (10.4%) | 61 (28.9%) |
| $150,000 or more | 27 (10.0%) | 69 (32.7%) |
| Total | 269 (100.0%) | 211 (100.0%) |
Property Value to Household Income Ratio in McEwen
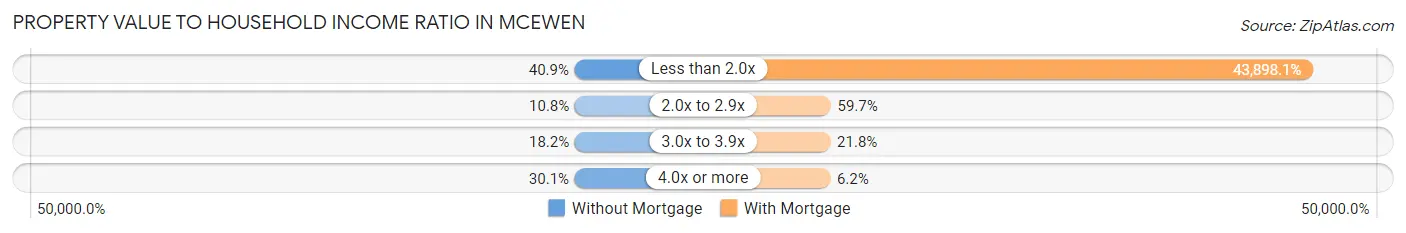
| Value-to-Income Ratio | Without Mortgage | With Mortgage |
| Less than 2.0x | 110 (40.9%) | 92,625 (43,898.1%) |
| 2.0x to 2.9x | 29 (10.8%) | 126 (59.7%) |
| 3.0x to 3.9x | 49 (18.2%) | 46 (21.8%) |
| 4.0x or more | 81 (30.1%) | 13 (6.2%) |
| Total | 269 (100.0%) | 211 (100.0%) |
Real Estate Taxes by Mortgage Status in McEwen
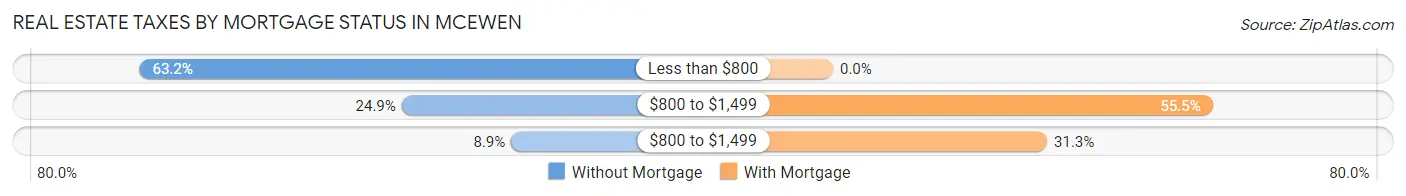
| Property Taxes | Without Mortgage | With Mortgage |
| Less than $800 | 170 (63.2%) | 0 (0.0%) |
| $800 to $1,499 | 67 (24.9%) | 117 (55.4%) |
| $800 to $1,499 | 24 (8.9%) | 66 (31.3%) |
| Total | 269 (100.0%) | 211 (100.0%) |
Health & Disability in McEwen
Health Insurance Coverage by Age in McEwen
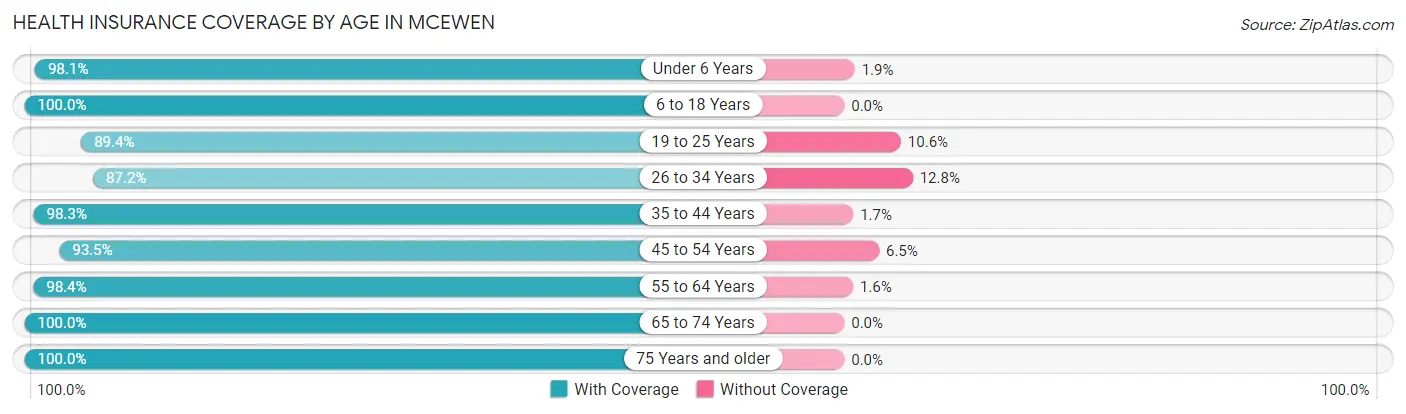
| Age Bracket | With Coverage | Without Coverage |
| Under 6 Years | 101 (98.1%) | 2 (1.9%) |
| 6 to 18 Years | 219 (100.0%) | 0 (0.0%) |
| 19 to 25 Years | 161 (89.4%) | 19 (10.6%) |
| 26 to 34 Years | 294 (87.2%) | 43 (12.8%) |
| 35 to 44 Years | 118 (98.3%) | 2 (1.7%) |
| 45 to 54 Years | 202 (93.5%) | 14 (6.5%) |
| 55 to 64 Years | 301 (98.4%) | 5 (1.6%) |
| 65 to 74 Years | 147 (100.0%) | 0 (0.0%) |
| 75 Years and older | 192 (100.0%) | 0 (0.0%) |
| Total | 1,735 (95.3%) | 85 (4.7%) |
Health Insurance Coverage by Citizenship Status in McEwen
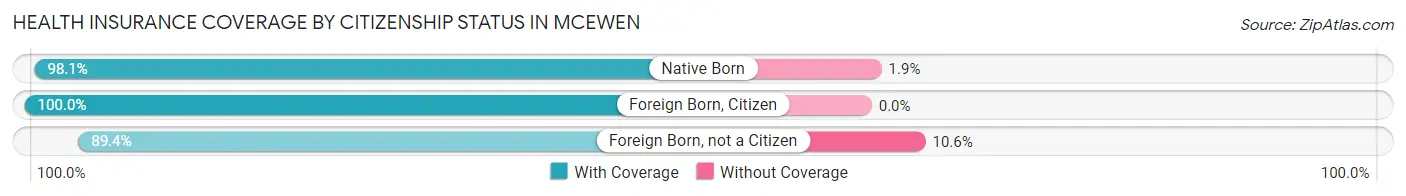
| Citizenship Status | With Coverage | Without Coverage |
| Native Born | 101 (98.1%) | 2 (1.9%) |
| Foreign Born, Citizen | 219 (100.0%) | 0 (0.0%) |
| Foreign Born, not a Citizen | 161 (89.4%) | 19 (10.6%) |
Health Insurance Coverage by Household Income in McEwen
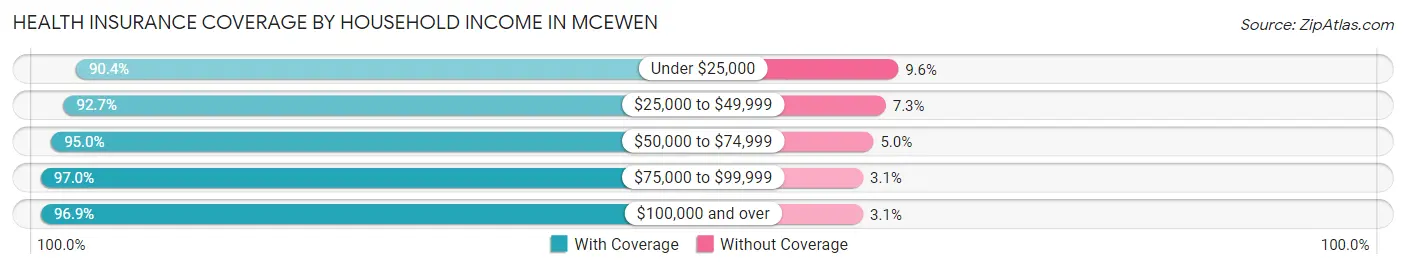
| Household Income | With Coverage | Without Coverage |
| Under $25,000 | 197 (90.4%) | 21 (9.6%) |
| $25,000 to $49,999 | 241 (92.7%) | 19 (7.3%) |
| $50,000 to $74,999 | 190 (95.0%) | 10 (5.0%) |
| $75,000 to $99,999 | 318 (97.0%) | 10 (3.0%) |
| $100,000 and over | 789 (96.9%) | 25 (3.1%) |
Public vs Private Health Insurance Coverage by Age in McEwen
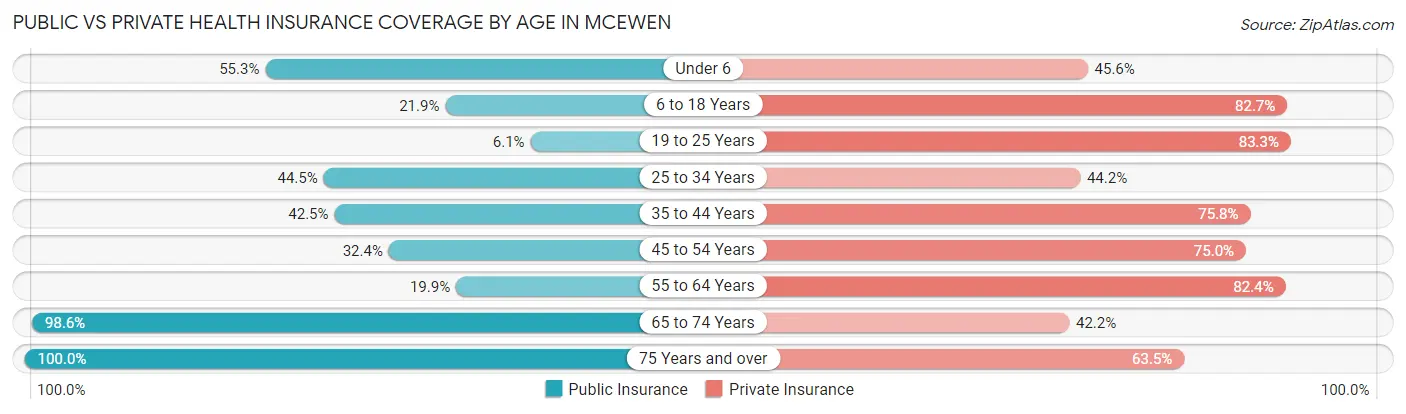
| Age Bracket | Public Insurance | Private Insurance |
| Under 6 | 57 (55.3%) | 47 (45.6%) |
| 6 to 18 Years | 48 (21.9%) | 181 (82.7%) |
| 19 to 25 Years | 11 (6.1%) | 150 (83.3%) |
| 25 to 34 Years | 150 (44.5%) | 149 (44.2%) |
| 35 to 44 Years | 51 (42.5%) | 91 (75.8%) |
| 45 to 54 Years | 70 (32.4%) | 162 (75.0%) |
| 55 to 64 Years | 61 (19.9%) | 252 (82.4%) |
| 65 to 74 Years | 145 (98.6%) | 62 (42.2%) |
| 75 Years and over | 192 (100.0%) | 122 (63.5%) |
| Total | 785 (43.1%) | 1,216 (66.8%) |
Disability Status by Sex by Age in McEwen
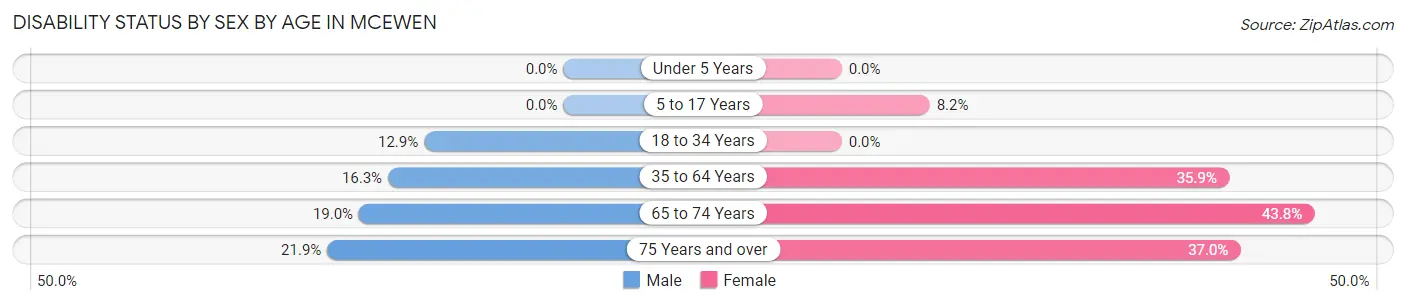
| Age Bracket | Male | Female |
| Under 5 Years | 0 (0.0%) | 0 (0.0%) |
| 5 to 17 Years | 0 (0.0%) | 8 (8.2%) |
| 18 to 34 Years | 30 (12.9%) | 0 (0.0%) |
| 35 to 64 Years | 56 (16.3%) | 107 (35.9%) |
| 65 to 74 Years | 11 (19.0%) | 39 (43.8%) |
| 75 Years and over | 16 (21.9%) | 44 (37.0%) |
Disability Class by Sex by Age in McEwen
Disability Class: Hearing Difficulty
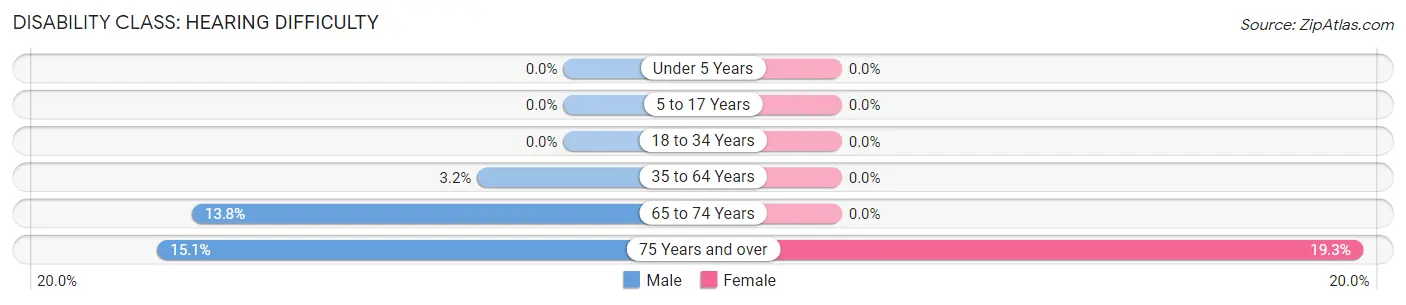
| Age Bracket | Male | Female |
| Under 5 Years | 0 (0.0%) | 0 (0.0%) |
| 5 to 17 Years | 0 (0.0%) | 0 (0.0%) |
| 18 to 34 Years | 0 (0.0%) | 0 (0.0%) |
| 35 to 64 Years | 11 (3.2%) | 0 (0.0%) |
| 65 to 74 Years | 8 (13.8%) | 0 (0.0%) |
| 75 Years and over | 11 (15.1%) | 23 (19.3%) |
Disability Class: Vision Difficulty
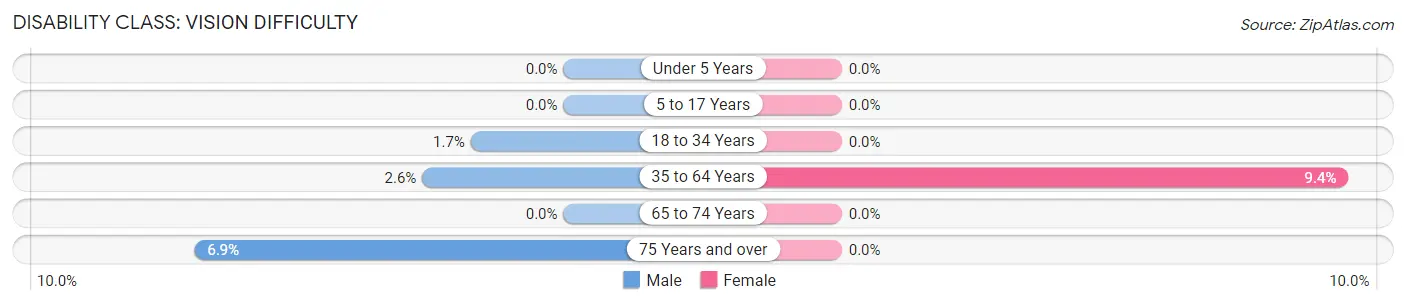
| Age Bracket | Male | Female |
| Under 5 Years | 0 (0.0%) | 0 (0.0%) |
| 5 to 17 Years | 0 (0.0%) | 0 (0.0%) |
| 18 to 34 Years | 4 (1.7%) | 0 (0.0%) |
| 35 to 64 Years | 9 (2.6%) | 28 (9.4%) |
| 65 to 74 Years | 0 (0.0%) | 0 (0.0%) |
| 75 Years and over | 5 (6.9%) | 0 (0.0%) |
Disability Class: Cognitive Difficulty
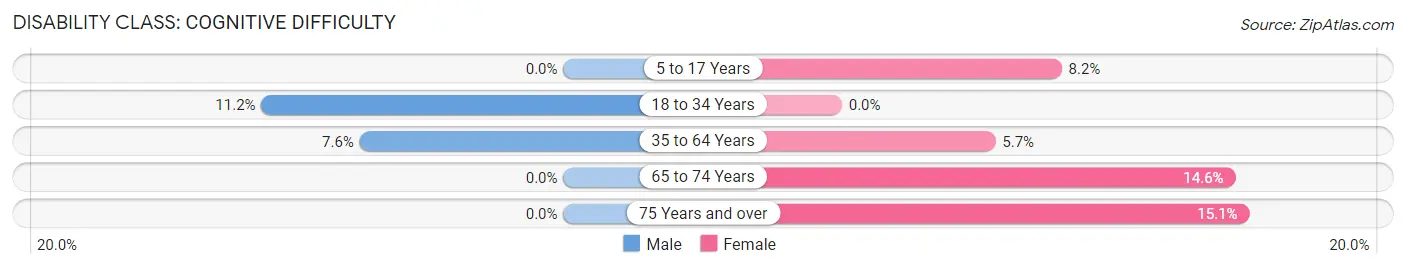
| Age Bracket | Male | Female |
| 5 to 17 Years | 0 (0.0%) | 8 (8.2%) |
| 18 to 34 Years | 26 (11.2%) | 0 (0.0%) |
| 35 to 64 Years | 26 (7.6%) | 17 (5.7%) |
| 65 to 74 Years | 0 (0.0%) | 13 (14.6%) |
| 75 Years and over | 0 (0.0%) | 18 (15.1%) |
Disability Class: Ambulatory Difficulty
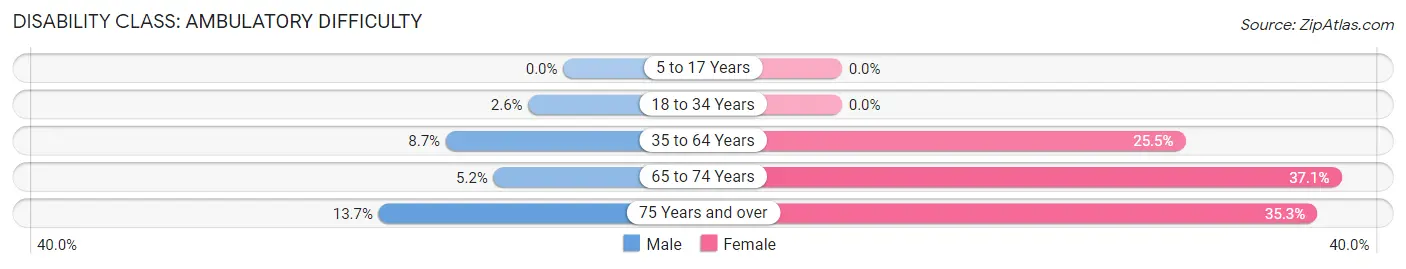
| Age Bracket | Male | Female |
| 5 to 17 Years | 0 (0.0%) | 0 (0.0%) |
| 18 to 34 Years | 6 (2.6%) | 0 (0.0%) |
| 35 to 64 Years | 30 (8.7%) | 76 (25.5%) |
| 65 to 74 Years | 3 (5.2%) | 33 (37.1%) |
| 75 Years and over | 10 (13.7%) | 42 (35.3%) |
Disability Class: Self-Care Difficulty
| Age Bracket | Male | Female |
| 5 to 17 Years | 0 (0.0%) | 0 (0.0%) |
| 18 to 34 Years | 6 (2.6%) | 0 (0.0%) |
| 35 to 64 Years | 19 (5.5%) | 23 (7.7%) |
| 65 to 74 Years | 3 (5.2%) | 11 (12.4%) |
| 75 Years and over | 5 (6.9%) | 0 (0.0%) |
Technology Access in McEwen
Computing Device Access in McEwen
| Device Type | # Households | % Households |
| Desktop or Laptop | 427 | 68.2% |
| Smartphone | 463 | 74.0% |
| Tablet | 320 | 51.1% |
| No Computing Device | 103 | 16.5% |
| Total | 626 | 100.0% |
Internet Access in McEwen
| Internet Type | # Households | % Households |
| Dial-Up Internet | 4 | 0.6% |
| Broadband Home | 354 | 56.6% |
| Cellular Data Only | 140 | 22.4% |
| Satellite Internet | 9 | 1.4% |
| No Internet | 118 | 18.9% |
| Total | 626 | 100.0% |
McEwen Summary
Mcewen is a small town located in Humphreys County, Tennessee. It is situated on the banks of the Duck River, approximately 50 miles west of Nashville. The town was founded in 1836 and has a population of approximately 1,500 people.
History
Mcewen was founded in 1836 by a group of settlers from North Carolina. The town was named after a local Native American chief, Chief Mcewen. The town was originally a trading post and was known as Mcewen's Trading Post. The town grew quickly and by the mid-1800s, it had become a thriving community.
The town was an important stop on the railroad line that ran from Nashville to Memphis. The railroad brought many new businesses to the town, including a cotton gin, a sawmill, and a gristmill. The town also had a number of stores, churches, and schools.
In the late 1800s, the town was hit hard by the Civil War. Many of the town's buildings were destroyed and the population declined. After the war, the town slowly began to rebuild and by the early 1900s, it had become a thriving community once again.
Geography
Mcewen is located in Humphreys County, Tennessee. It is situated on the banks of the Duck River, approximately 50 miles west of Nashville. The town is surrounded by rolling hills and farmland. The climate is mild and humid, with temperatures ranging from the mid-50s in the winter to the mid-80s in the summer.
Economy
Mcewen's economy is largely based on agriculture. The town is home to several farms, which produce a variety of crops, including corn, soybeans, and cotton. The town also has a number of small businesses, including restaurants, stores, and service providers.
Demographics
As of the 2010 census, the population of Mcewen was 1,500. The racial makeup of the town was 95.2% White, 2.7% African American, 0.2% Native American, 0.2% Asian, and 1.7% from other races. The median household income was $31,250 and the median family income was $37,500.
Conclusion
Mcewen is a small town located in Humphreys County, Tennessee. It was founded in 1836 and has a population of approximately 1,500 people. The town's economy is largely based on agriculture and it is home to several small businesses. The town has a diverse population and a median household income of $31,250.
Common Questions
What is the Total Population of McEwen?
Total Population of McEwen is 1,820.
What is the Total Male Population of McEwen?
Total Male Population of McEwen is 901.
What is the Total Female Population of McEwen?
Total Female Population of McEwen is 919.
What is the Ratio of Males per 100 Females in McEwen?
There are 98.04 Males per 100 Females in McEwen.
What is the Ratio of Females per 100 Males in McEwen?
There are 102.00 Females per 100 Males in McEwen.
What is the Median Population Age in McEwen?
Median Population Age in McEwen is 41.2 Years.
What is the Average Family Size in McEwen
Average Family Size in McEwen is 3.6 People.
What is the Average Household Size in McEwen
Average Household Size in McEwen is 2.9 People.
What is Per Capita Income in McEwen?
Per Capita income in McEwen is $43,652.
What is the Median Family Income in McEwen?
Median Family Income in McEwen is $81,875.
What is the Median Household income in McEwen?
Median Household Income in McEwen is $66,875.
What is Income or Wage Gap in McEwen?
Income or Wage Gap in McEwen is 50.6%.
Women in McEwen earn 49.4 cents for every dollar earned by a man.
What is Family Income Deficit in McEwen?
Family Income Deficit in McEwen is $2,615.
Families that are below poverty line in McEwen earn $2,615 less on average than the poverty threshold level.
What is Inequality or Gini Index in McEwen?
Inequality or Gini Index in McEwen is 0.49.
How Large is the Labor Force in McEwen?
There are 867 People in the Labor Forcein in McEwen.
What is the Percentage of People in the Labor Force in McEwen?
56.1% of People are in the Labor Force in McEwen.
What is the Unemployment Rate in McEwen?
Unemployment Rate in McEwen is 20.2%.