Bell Buckle, TN
Bell Buckle Map
Bell Buckle Overview
621
TOTAL POPULATION
321
MALE POPULATION
300
FEMALE POPULATION
107.00
MALES / 100 FEMALES
93.46
FEMALES / 100 MALES
31.4
MEDIAN AGE
3.0
AVG FAMILY SIZE
2.7
AVG HOUSEHOLD SIZE
$32,628
PER CAPITA INCOME
$85,500
AVG FAMILY INCOME
$78,750
AVG HOUSEHOLD INCOME
23.1%
WAGE / INCOME GAP [ % ]
76.9¢/ $1
WAGE / INCOME GAP [ $ ]
0.35
INEQUALITY / GINI INDEX
394
LABOR FORCE [ PEOPLE ]
79.3%
PERCENT IN LABOR FORCE
2.8%
UNEMPLOYMENT RATE
Bell Buckle Zip Codes
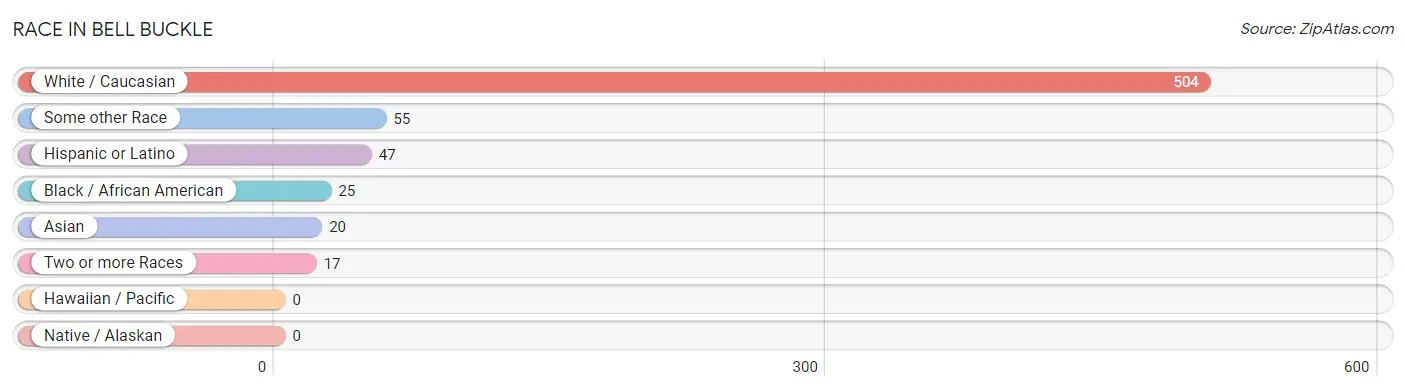
Race in Bell Buckle
The most populous races in Bell Buckle are White / Caucasian (504 | 81.2%), Some other Race (55 | 8.9%), and Hispanic or Latino (47 | 7.6%).
| Race | # Population | % Population |
| Asian | 20 | 3.2% |
| Black / African American | 25 | 4.0% |
| Hawaiian / Pacific | 0 | 0.0% |
| Hispanic or Latino | 47 | 7.6% |
| Native / Alaskan | 0 | 0.0% |
| White / Caucasian | 504 | 81.2% |
| Two or more Races | 17 | 2.7% |
| Some other Race | 55 | 8.9% |
| Total | 621 | 100.0% |
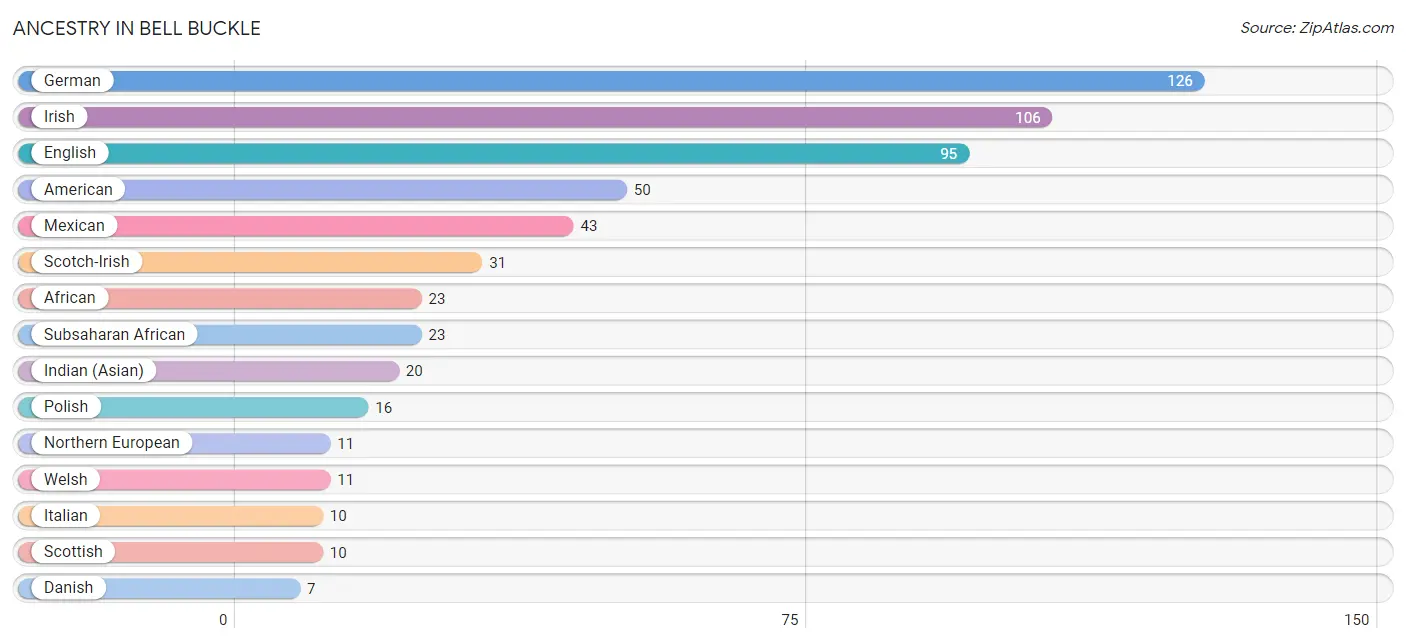
Ancestry in Bell Buckle
The most populous ancestries reported in Bell Buckle are German (126 | 20.3%), Irish (106 | 17.1%), English (95 | 15.3%), American (50 | 8.1%), and Mexican (43 | 6.9%), together accounting for 67.6% of all Bell Buckle residents.
| Ancestry | # Population | % Population |
| African | 23 | 3.7% |
| American | 50 | 8.1% |
| Arab | 1 | 0.2% |
| Austrian | 2 | 0.3% |
| British | 3 | 0.5% |
| Central American Indian | 2 | 0.3% |
| Danish | 7 | 1.1% |
| Dutch | 4 | 0.6% |
| Eastern European | 4 | 0.6% |
| English | 95 | 15.3% |
| European | 6 | 1.0% |
| French | 3 | 0.5% |
| German | 126 | 20.3% |
| Indian (Asian) | 20 | 3.2% |
| Irish | 106 | 17.1% |
| Italian | 10 | 1.6% |
| Lithuanian | 6 | 1.0% |
| Mexican | 43 | 6.9% |
| Mexican American Indian | 2 | 0.3% |
| Northern European | 11 | 1.8% |
| Polish | 16 | 2.6% |
| Scotch-Irish | 31 | 5.0% |
| Scottish | 10 | 1.6% |
| Spanish | 4 | 0.6% |
| Subsaharan African | 23 | 3.7% |
| Swedish | 7 | 1.1% |
| Swiss | 2 | 0.3% |
| Welsh | 11 | 1.8% | View All 28 Rows |
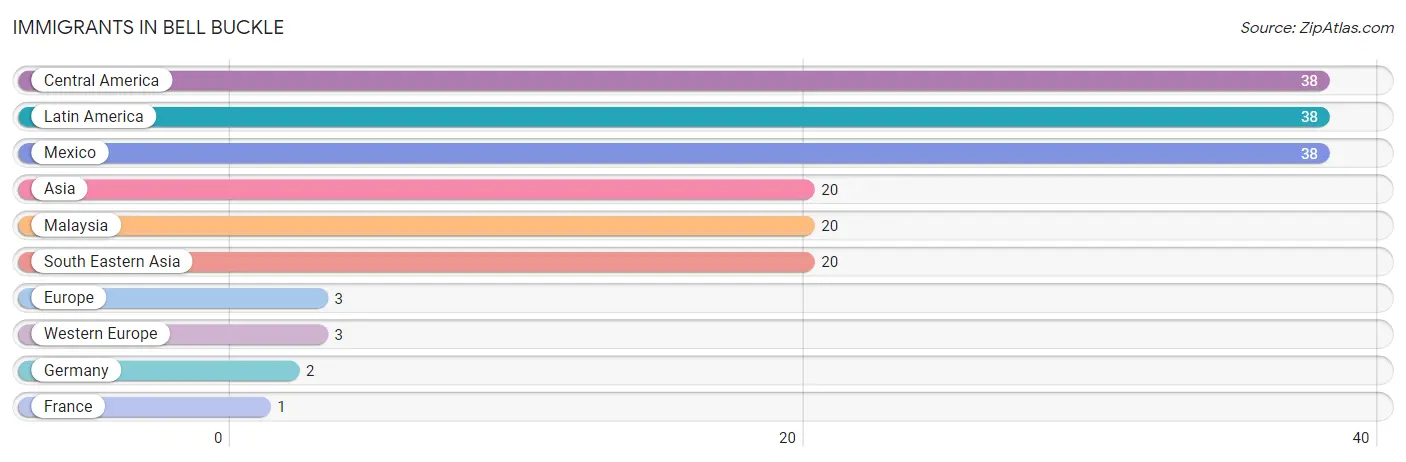
Immigrants in Bell Buckle
The most numerous immigrant groups reported in Bell Buckle came from Central America (38 | 6.1%), Latin America (38 | 6.1%), Mexico (38 | 6.1%), Asia (20 | 3.2%), and Malaysia (20 | 3.2%), together accounting for 24.8% of all Bell Buckle residents.
| Immigration Origin | # Population | % Population |
| Asia | 20 | 3.2% |
| Central America | 38 | 6.1% |
| Europe | 3 | 0.5% |
| France | 1 | 0.2% |
| Germany | 2 | 0.3% |
| Latin America | 38 | 6.1% |
| Malaysia | 20 | 3.2% |
| Mexico | 38 | 6.1% |
| South Eastern Asia | 20 | 3.2% |
| Western Europe | 3 | 0.5% | View All 10 Rows |
Sex and Age in Bell Buckle
Sex and Age in Bell Buckle
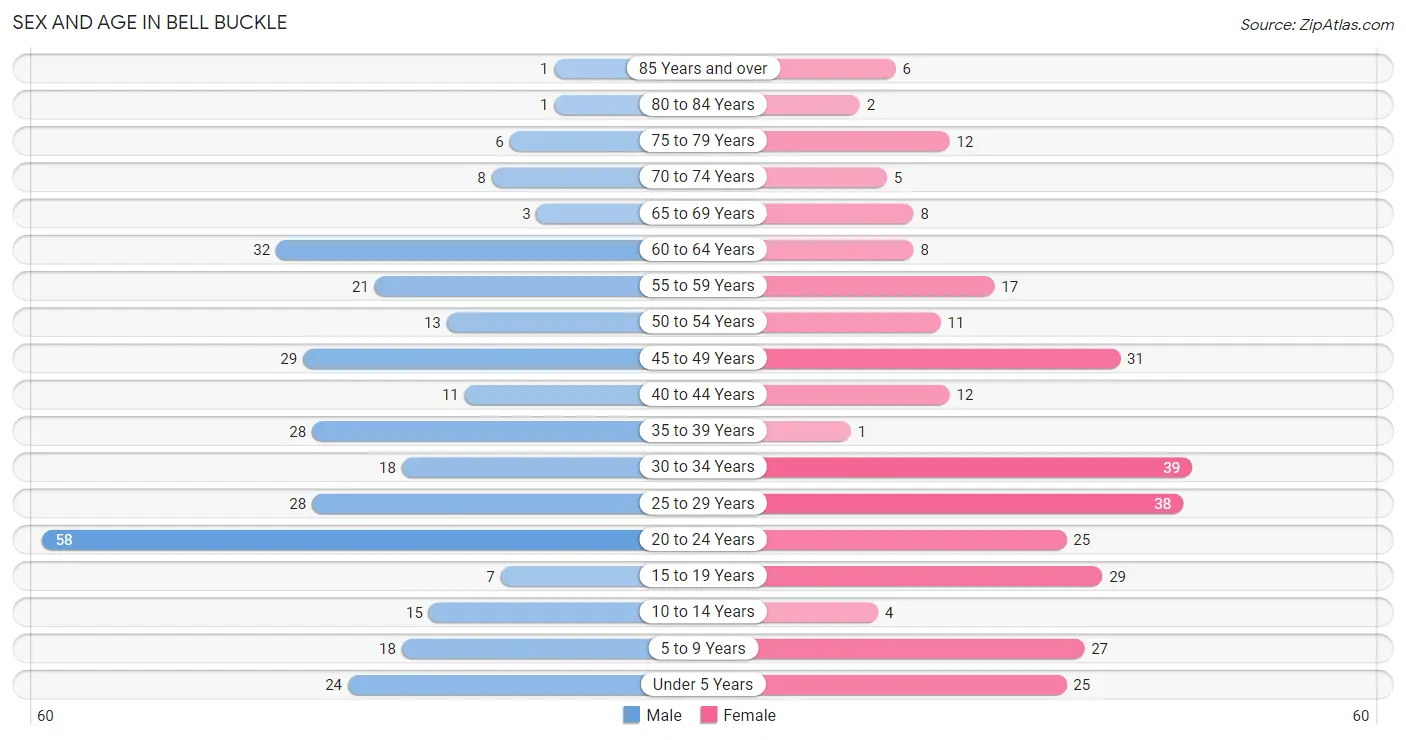
The most populous age groups in Bell Buckle are 20 to 24 Years (58 | 18.1%) for men and 30 to 34 Years (39 | 13.0%) for women.
| Age Bracket | Male | Female |
| Under 5 Years | 24 (7.5%) | 25 (8.3%) |
| 5 to 9 Years | 18 (5.6%) | 27 (9.0%) |
| 10 to 14 Years | 15 (4.7%) | 4 (1.3%) |
| 15 to 19 Years | 7 (2.2%) | 29 (9.7%) |
| 20 to 24 Years | 58 (18.1%) | 25 (8.3%) |
| 25 to 29 Years | 28 (8.7%) | 38 (12.7%) |
| 30 to 34 Years | 18 (5.6%) | 39 (13.0%) |
| 35 to 39 Years | 28 (8.7%) | 1 (0.3%) |
| 40 to 44 Years | 11 (3.4%) | 12 (4.0%) |
| 45 to 49 Years | 29 (9.0%) | 31 (10.3%) |
| 50 to 54 Years | 13 (4.1%) | 11 (3.7%) |
| 55 to 59 Years | 21 (6.5%) | 17 (5.7%) |
| 60 to 64 Years | 32 (10.0%) | 8 (2.7%) |
| 65 to 69 Years | 3 (0.9%) | 8 (2.7%) |
| 70 to 74 Years | 8 (2.5%) | 5 (1.7%) |
| 75 to 79 Years | 6 (1.9%) | 12 (4.0%) |
| 80 to 84 Years | 1 (0.3%) | 2 (0.7%) |
| 85 Years and over | 1 (0.3%) | 6 (2.0%) |
| Total | 321 (100.0%) | 300 (100.0%) |
Families and Households in Bell Buckle
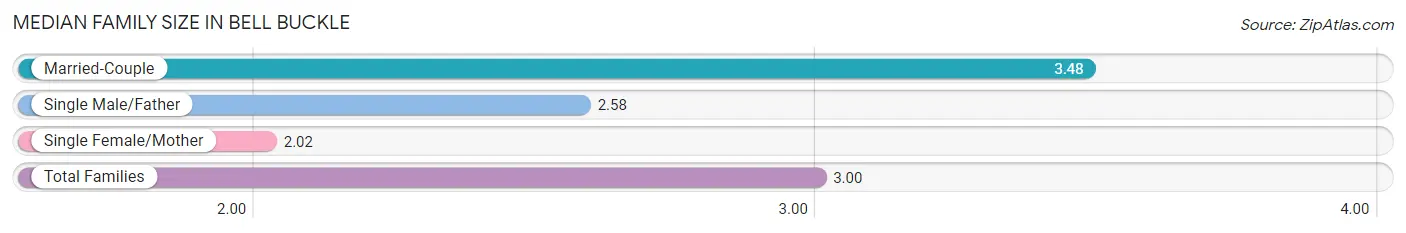
Median Family Size in Bell Buckle
The median family size in Bell Buckle is 3.00 persons per family, with married-couple families (93 | 63.7%) accounting for the largest median family size of 3.48 persons per family. On the other hand, single female/mother families (41 | 28.1%) represent the smallest median family size with 2.02 persons per family.
| Family Type | # Families | Family Size |
| Married-Couple | 93 (63.7%) | 3.48 |
| Single Male/Father | 12 (8.2%) | 2.58 |
| Single Female/Mother | 41 (28.1%) | 2.02 |
| Total Families | 146 (100.0%) | 3.00 |
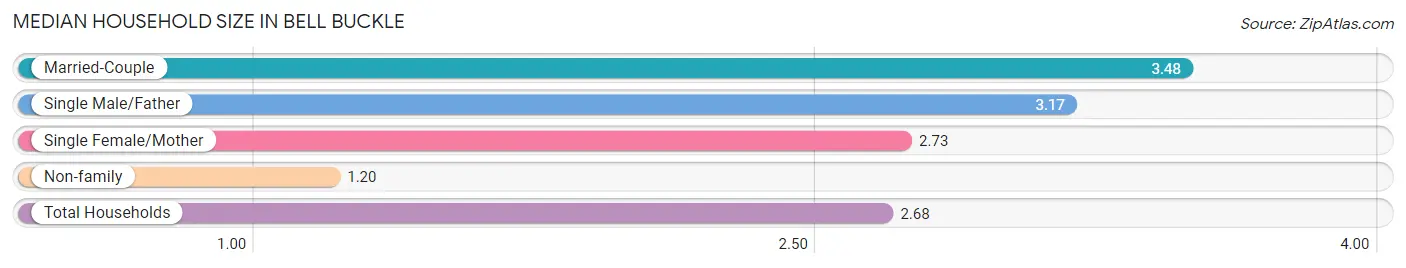
Median Household Size in Bell Buckle
The median household size in Bell Buckle is 2.68 persons per household, with married-couple households (93 | 46.0%) accounting for the largest median household size of 3.48 persons per household. non-family households (56 | 27.7%) represent the smallest median household size with 1.20 persons per household.
| Household Type | # Households | Household Size |
| Married-Couple | 93 (46.0%) | 3.48 |
| Single Male/Father | 12 (5.9%) | 3.17 |
| Single Female/Mother | 41 (20.3%) | 2.73 |
| Non-family | 56 (27.7%) | 1.20 |
| Total Households | 202 (100.0%) | 2.68 |
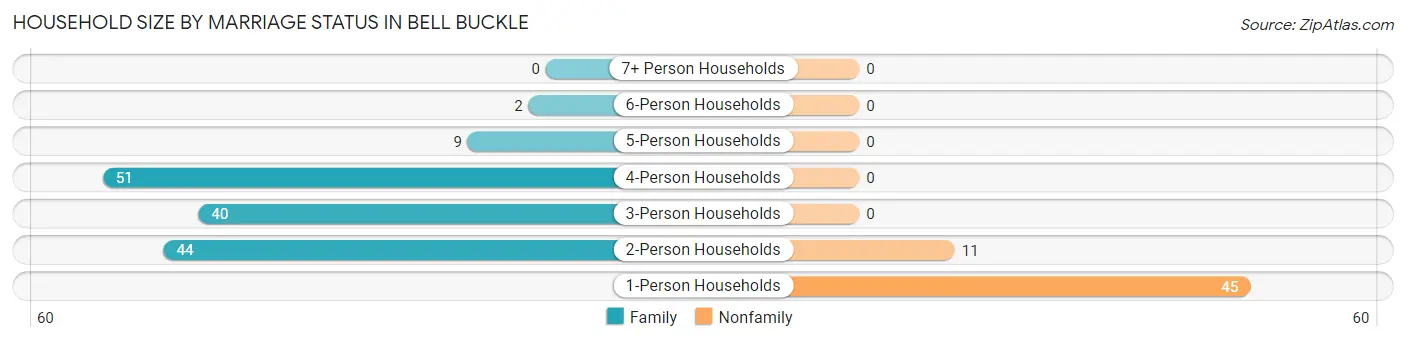
Household Size by Marriage Status in Bell Buckle
Out of a total of 202 households in Bell Buckle, 146 (72.3%) are family households, while 56 (27.7%) are nonfamily households. The most numerous type of family households are 4-person households, comprising 51, and the most common type of nonfamily households are 1-person households, comprising 45.
| Household Size | Family Households | Nonfamily Households |
| 1-Person Households | - | 45 (22.3%) |
| 2-Person Households | 44 (21.8%) | 11 (5.4%) |
| 3-Person Households | 40 (19.8%) | 0 (0.0%) |
| 4-Person Households | 51 (25.3%) | 0 (0.0%) |
| 5-Person Households | 9 (4.5%) | 0 (0.0%) |
| 6-Person Households | 2 (1.0%) | 0 (0.0%) |
| 7+ Person Households | 0 (0.0%) | 0 (0.0%) |
| Total | 146 (72.3%) | 56 (27.7%) |
Female Fertility in Bell Buckle
Fertility by Age in Bell Buckle
Average fertility rate in Bell Buckle is 86.0 births per 1,000 women. Women in the age bracket of 35 to 50 years have the highest fertility rate with 273.0 births per 1,000 women. Women in the age bracket of 35 to 50 years acount for 80.0% of all women with births.
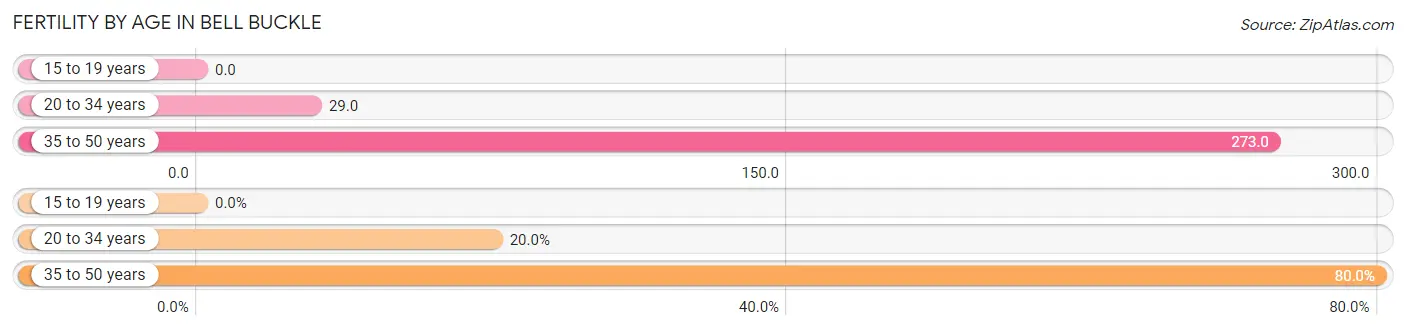
| Age Bracket | Women with Births | Births / 1,000 Women |
| 15 to 19 years | 0 (0.0%) | 0.0 |
| 20 to 34 years | 3 (20.0%) | 29.0 |
| 35 to 50 years | 12 (80.0%) | 273.0 |
| Total | 15 (100.0%) | 86.0 |
Fertility by Age by Marriage Status in Bell Buckle
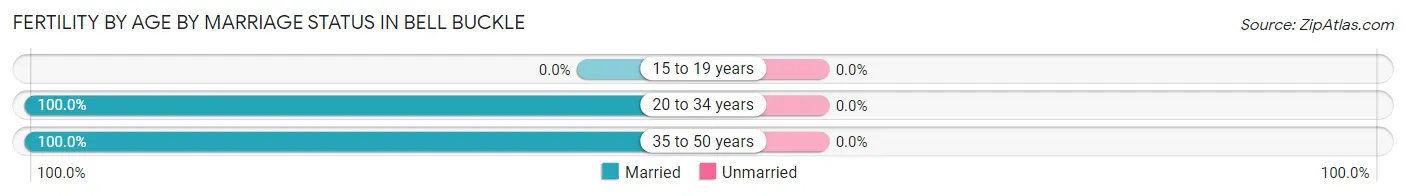
| Age Bracket | Married | Unmarried |
| 15 to 19 years | 0 (0.0%) | 0 (0.0%) |
| 20 to 34 years | 3 (100.0%) | 0 (0.0%) |
| 35 to 50 years | 12 (100.0%) | 0 (0.0%) |
| Total | 15 (100.0%) | 0 (0.0%) |
Fertility by Education in Bell Buckle
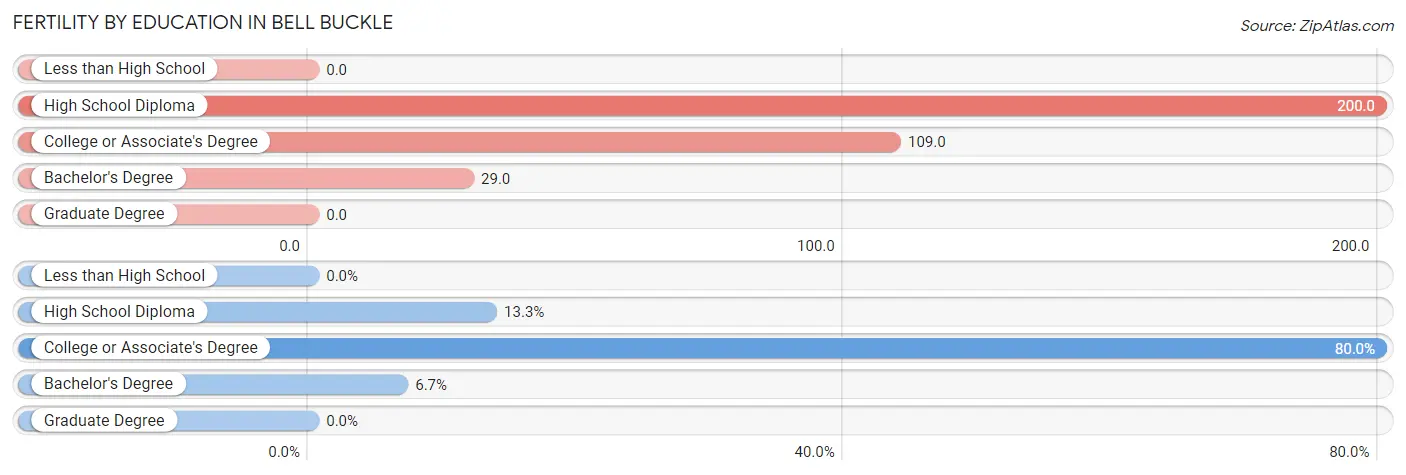
| Educational Attainment | Women with Births | Births / 1,000 Women |
| Less than High School | 0 (0.0%) | 0.0 |
| High School Diploma | 2 (13.3%) | 200.0 |
| College or Associate's Degree | 12 (80.0%) | 109.0 |
| Bachelor's Degree | 1 (6.7%) | 29.0 |
| Graduate Degree | 0 (0.0%) | 0.0 |
| Total | 15 (100.0%) | 86.0 |
Fertility by Education by Marriage Status in Bell Buckle
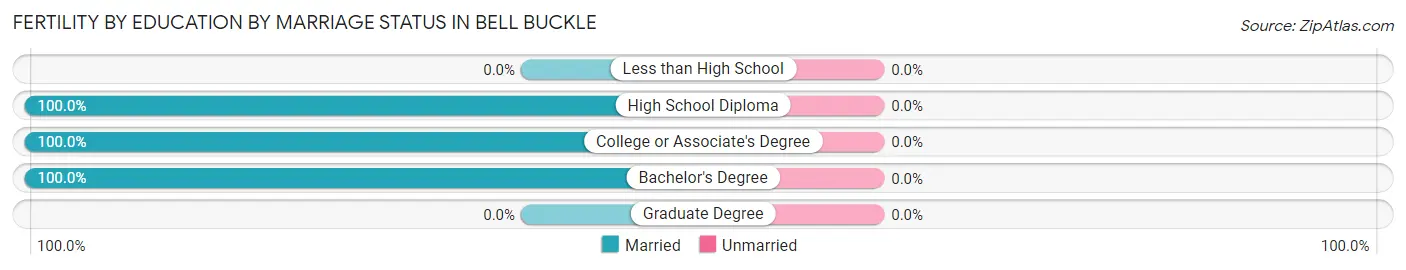
| Educational Attainment | Married | Unmarried |
| Less than High School | 0 (0.0%) | 0 (0.0%) |
| High School Diploma | 2 (100.0%) | 0 (0.0%) |
| College or Associate's Degree | 12 (100.0%) | 0 (0.0%) |
| Bachelor's Degree | 1 (100.0%) | 0 (0.0%) |
| Graduate Degree | 0 (0.0%) | 0 (0.0%) |
| Total | 15 (100.0%) | 0 (0.0%) |
Income in Bell Buckle
Income Overview in Bell Buckle
Per Capita Income in Bell Buckle is $32,628, while median incomes of families and households are $85,500 and $78,750 respectively.
| Characteristic | Number | Measure |
| Per Capita Income | 621 | $32,628 |
| Median Family Income | 146 | $85,500 |
| Mean Family Income | 146 | $94,984 |
| Median Household Income | 202 | $78,750 |
| Mean Household Income | 202 | $91,266 |
| Income Deficit | 146 | $0 |
| Wage / Income Gap (%) | 621 | 23.08% |
| Wage / Income Gap ($) | 621 | 76.92¢ per $1 |
| Gini / Inequality Index | 621 | 0.35 |
Earnings by Sex in Bell Buckle
Average Earnings in Bell Buckle are $35,000, $31,250 for men and $40,625 for women, a difference of 23.1%.
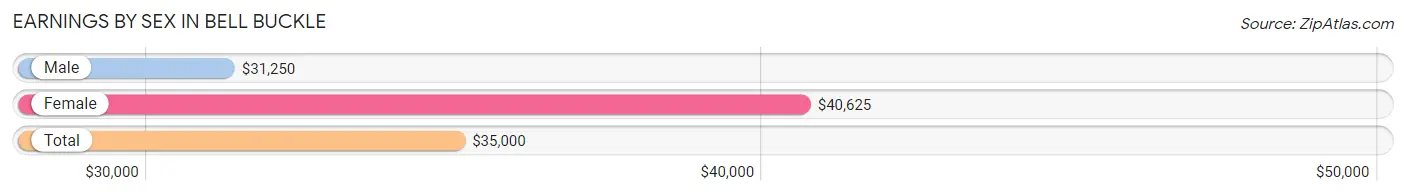
| Sex | Number | Average Earnings |
| Male | 225 (54.1%) | $31,250 |
| Female | 191 (45.9%) | $40,625 |
| Total | 416 (100.0%) | $35,000 |
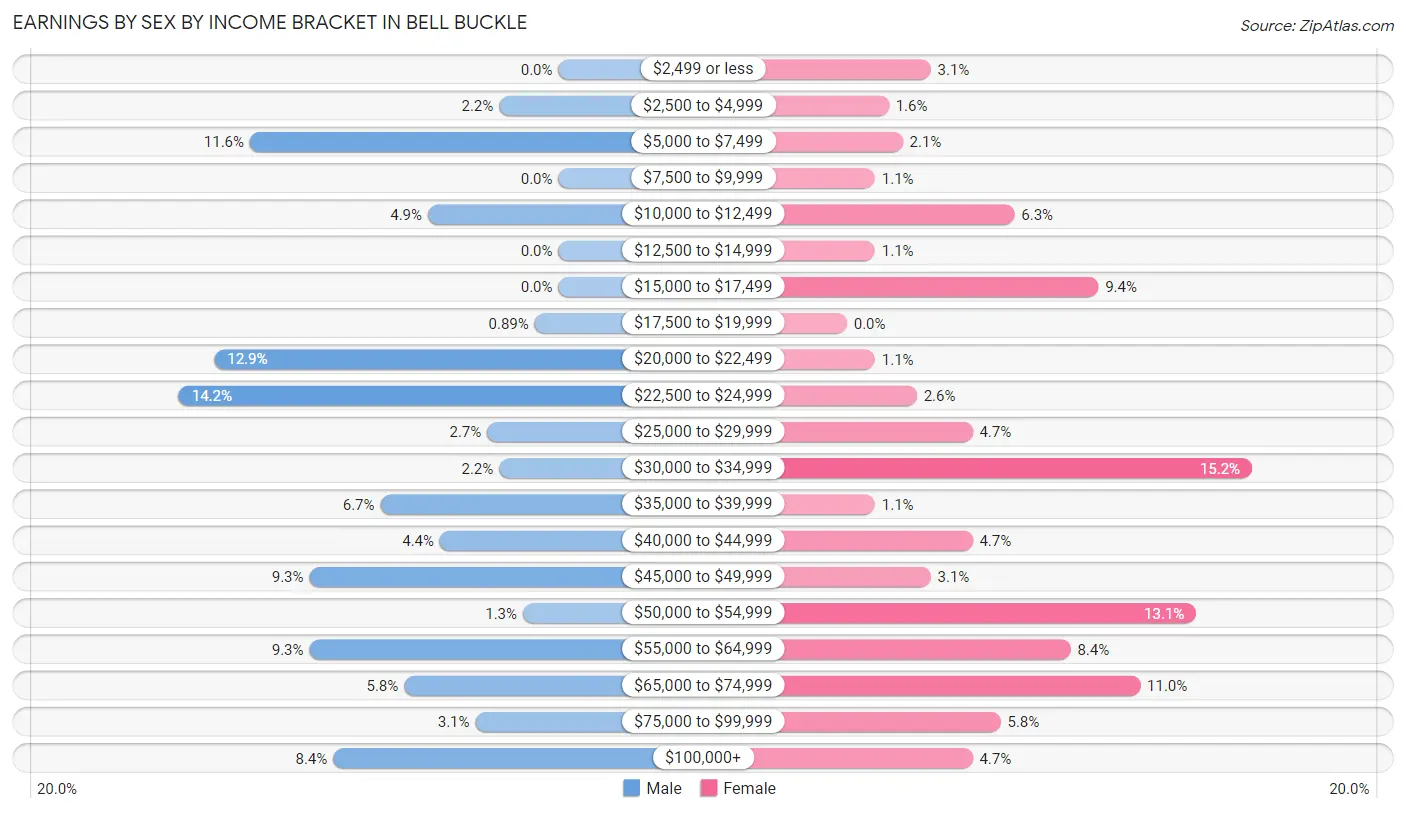
Earnings by Sex by Income Bracket in Bell Buckle
The most common earnings brackets in Bell Buckle are $22,500 to $24,999 for men (32 | 14.2%) and $30,000 to $34,999 for women (29 | 15.2%).
| Income | Male | Female |
| $2,499 or less | 0 (0.0%) | 6 (3.1%) |
| $2,500 to $4,999 | 5 (2.2%) | 3 (1.6%) |
| $5,000 to $7,499 | 26 (11.6%) | 4 (2.1%) |
| $7,500 to $9,999 | 0 (0.0%) | 2 (1.1%) |
| $10,000 to $12,499 | 11 (4.9%) | 12 (6.3%) |
| $12,500 to $14,999 | 0 (0.0%) | 2 (1.1%) |
| $15,000 to $17,499 | 0 (0.0%) | 18 (9.4%) |
| $17,500 to $19,999 | 2 (0.9%) | 0 (0.0%) |
| $20,000 to $22,499 | 29 (12.9%) | 2 (1.1%) |
| $22,500 to $24,999 | 32 (14.2%) | 5 (2.6%) |
| $25,000 to $29,999 | 6 (2.7%) | 9 (4.7%) |
| $30,000 to $34,999 | 5 (2.2%) | 29 (15.2%) |
| $35,000 to $39,999 | 15 (6.7%) | 2 (1.1%) |
| $40,000 to $44,999 | 10 (4.4%) | 9 (4.7%) |
| $45,000 to $49,999 | 21 (9.3%) | 6 (3.1%) |
| $50,000 to $54,999 | 3 (1.3%) | 25 (13.1%) |
| $55,000 to $64,999 | 21 (9.3%) | 16 (8.4%) |
| $65,000 to $74,999 | 13 (5.8%) | 21 (11.0%) |
| $75,000 to $99,999 | 7 (3.1%) | 11 (5.8%) |
| $100,000+ | 19 (8.4%) | 9 (4.7%) |
| Total | 225 (100.0%) | 191 (100.0%) |
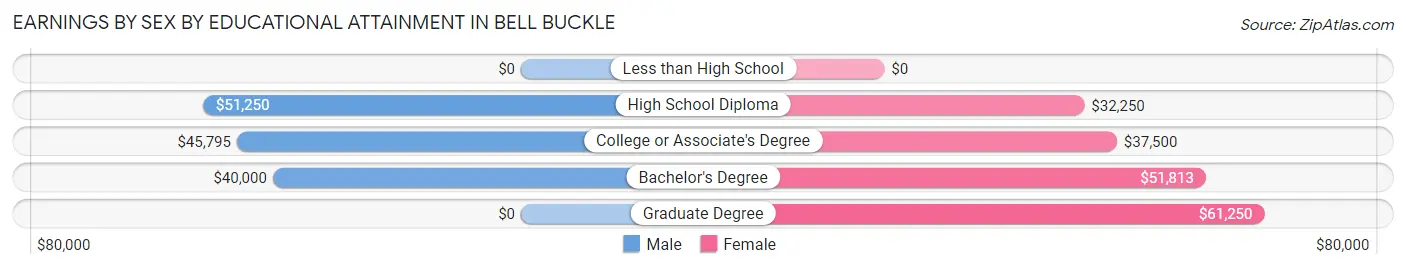
Earnings by Sex by Educational Attainment in Bell Buckle
Average earnings in Bell Buckle are $43,036 for men and $50,109 for women, a difference of 14.1%. Men with an educational attainment of high school diploma enjoy the highest average annual earnings of $51,250, while those with bachelor's degree education earn the least with $40,000. Women with an educational attainment of graduate degree earn the most with the average annual earnings of $61,250, while those with high school diploma education have the smallest earnings of $32,250.
| Educational Attainment | Male Income | Female Income |
| Less than High School | - | - |
| High School Diploma | $51,250 | $32,250 |
| College or Associate's Degree | $45,795 | $37,500 |
| Bachelor's Degree | $40,000 | $51,813 |
| Graduate Degree | - | - |
| Total | $43,036 | $50,109 |
Family Income in Bell Buckle
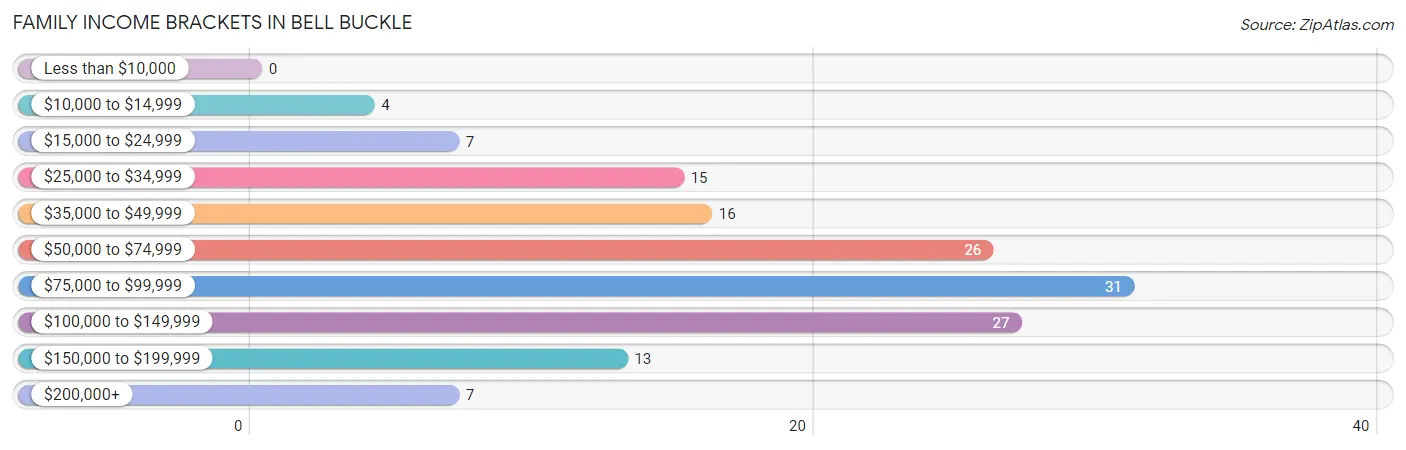
Family Income Brackets in Bell Buckle
According to the Bell Buckle family income data, there are 31 families falling into the $75,000 to $99,999 income range, which is the most common income bracket and makes up 21.2% of all families.
| Income Bracket | # Families | % Families |
| Less than $10,000 | 0 | 0.0% |
| $10,000 to $14,999 | 4 | 2.7% |
| $15,000 to $24,999 | 7 | 4.8% |
| $25,000 to $34,999 | 15 | 10.3% |
| $35,000 to $49,999 | 16 | 11.0% |
| $50,000 to $74,999 | 26 | 17.8% |
| $75,000 to $99,999 | 31 | 21.2% |
| $100,000 to $149,999 | 27 | 18.5% |
| $150,000 to $199,999 | 13 | 8.9% |
| $200,000+ | 7 | 4.8% |
Family Income by Famaliy Size in Bell Buckle
5-person families (9 | 6.2%) account for the highest median family income in Bell Buckle with $175,250 per family, while 5-person families (9 | 6.2%) have the highest median income of $35,050 per family member.
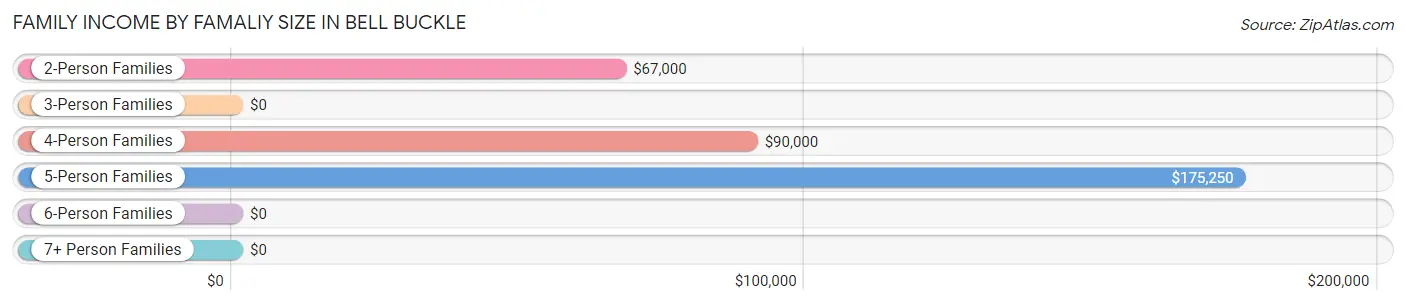
| Income Bracket | # Families | Median Income |
| 2-Person Families | 64 (43.8%) | $67,000 |
| 3-Person Families | 35 (24.0%) | $0 |
| 4-Person Families | 36 (24.7%) | $90,000 |
| 5-Person Families | 9 (6.2%) | $175,250 |
| 6-Person Families | 2 (1.4%) | $0 |
| 7+ Person Families | 0 (0.0%) | $0 |
| Total | 146 (100.0%) | $85,500 |
Family Income by Number of Earners in Bell Buckle
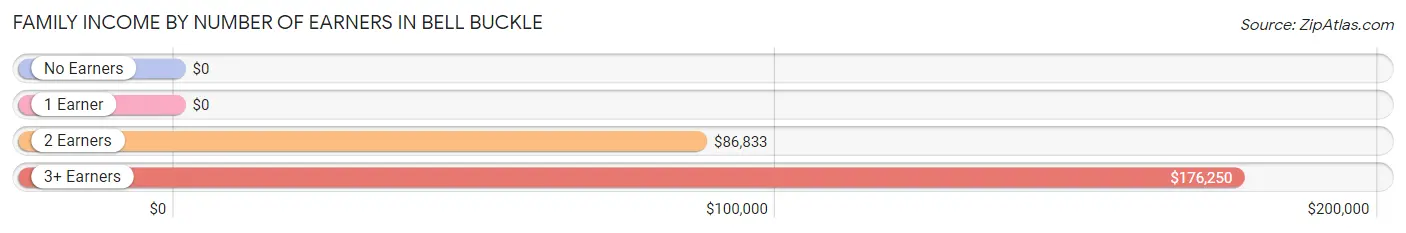
| Number of Earners | # Families | Median Income |
| No Earners | 4 (2.7%) | $0 |
| 1 Earner | 47 (32.2%) | $0 |
| 2 Earners | 78 (53.4%) | $86,833 |
| 3+ Earners | 17 (11.6%) | $176,250 |
| Total | 146 (100.0%) | $85,500 |
Household Income in Bell Buckle
Household Income Brackets in Bell Buckle
With 53 households falling in the category, the $50,000 to $74,999 income range is the most frequent in Bell Buckle, accounting for 26.2% of all households. In contrast, only 3 households (1.5%) fall into the $10,000 to $14,999 income bracket, making it the least populous group.
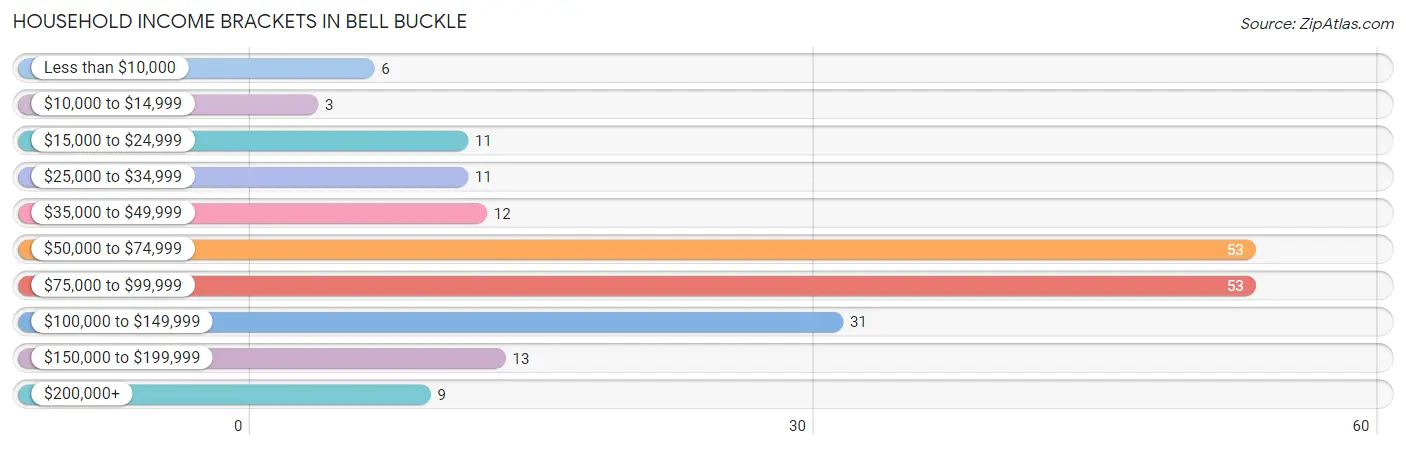
| Income Bracket | # Households | % Households |
| Less than $10,000 | 6 | 3.0% |
| $10,000 to $14,999 | 3 | 1.5% |
| $15,000 to $24,999 | 11 | 5.4% |
| $25,000 to $34,999 | 11 | 5.4% |
| $35,000 to $49,999 | 12 | 5.9% |
| $50,000 to $74,999 | 53 | 26.2% |
| $75,000 to $99,999 | 53 | 26.2% |
| $100,000 to $149,999 | 31 | 15.3% |
| $150,000 to $199,999 | 13 | 6.4% |
| $200,000+ | 9 | 4.5% |
Household Income by Householder Age in Bell Buckle
The median household income in Bell Buckle is $78,750, with the highest median household income of $97,500 found in the 45 to 64 years age bracket for the primary householder. A total of 66 households (32.7%) fall into this category. Meanwhile, the 15 to 24 years age bracket for the primary householder has the lowest median household income of $0, with 4 households (2.0%) in this group.
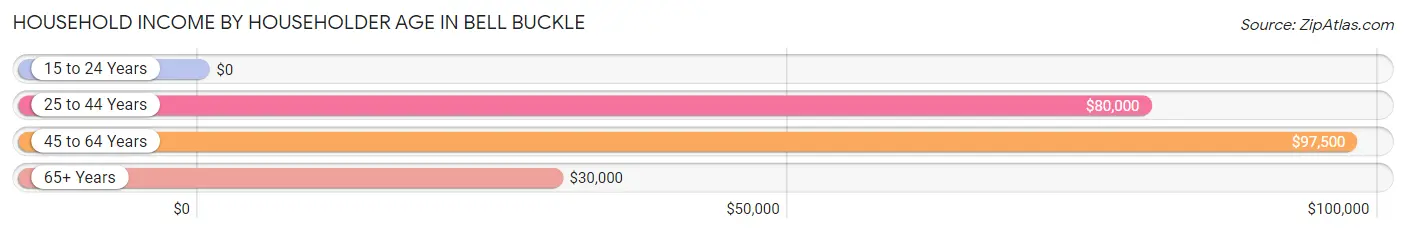
| Income Bracket | # Households | Median Income |
| 15 to 24 Years | 4 (2.0%) | $0 |
| 25 to 44 Years | 94 (46.5%) | $80,000 |
| 45 to 64 Years | 66 (32.7%) | $97,500 |
| 65+ Years | 38 (18.8%) | $30,000 |
| Total | 202 (100.0%) | $78,750 |
Poverty in Bell Buckle
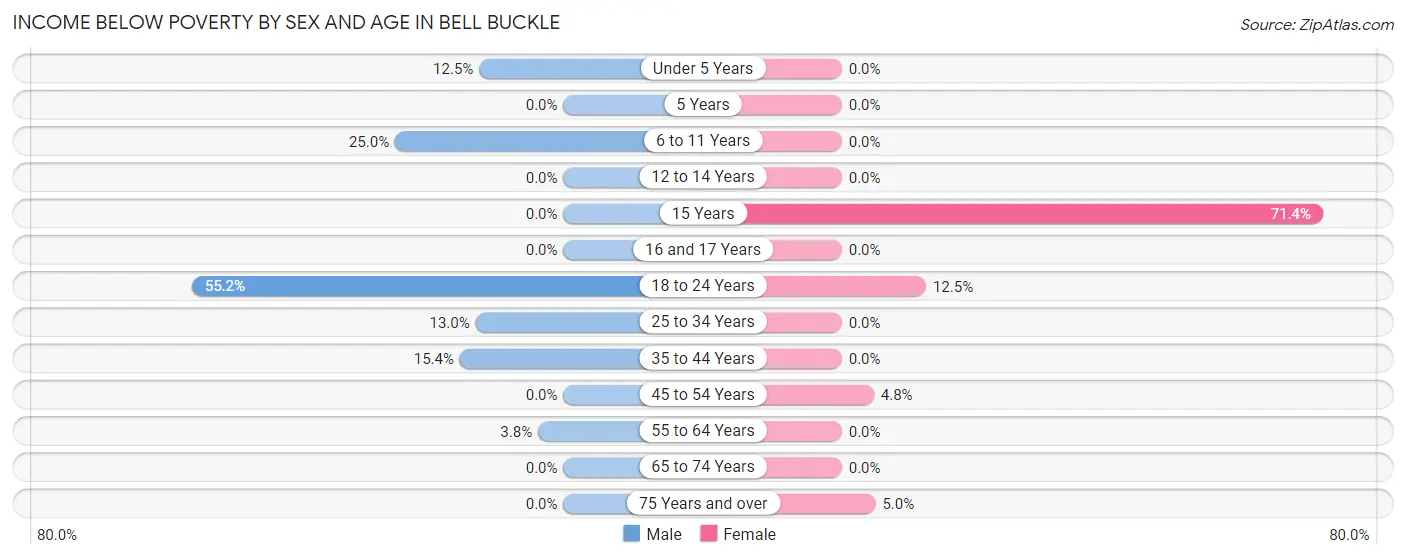
Income Below Poverty by Sex and Age in Bell Buckle
With 17.1% poverty level for males and 4.1% for females among the residents of Bell Buckle, 18 to 24 year old males and 15 year old females are the most vulnerable to poverty, with 32 males (55.2%) and 5 females (71.4%) in their respective age groups living below the poverty level.
| Age Bracket | Male | Female |
| Under 5 Years | 3 (12.5%) | 0 (0.0%) |
| 5 Years | 0 (0.0%) | 0 (0.0%) |
| 6 to 11 Years | 6 (25.0%) | 0 (0.0%) |
| 12 to 14 Years | 0 (0.0%) | 0 (0.0%) |
| 15 Years | 0 (0.0%) | 5 (71.4%) |
| 16 and 17 Years | 0 (0.0%) | 0 (0.0%) |
| 18 to 24 Years | 32 (55.2%) | 4 (12.5%) |
| 25 to 34 Years | 6 (13.0%) | 0 (0.0%) |
| 35 to 44 Years | 6 (15.4%) | 0 (0.0%) |
| 45 to 54 Years | 0 (0.0%) | 2 (4.8%) |
| 55 to 64 Years | 2 (3.8%) | 0 (0.0%) |
| 65 to 74 Years | 0 (0.0%) | 0 (0.0%) |
| 75 Years and over | 0 (0.0%) | 1 (5.0%) |
| Total | 55 (17.1%) | 12 (4.1%) |
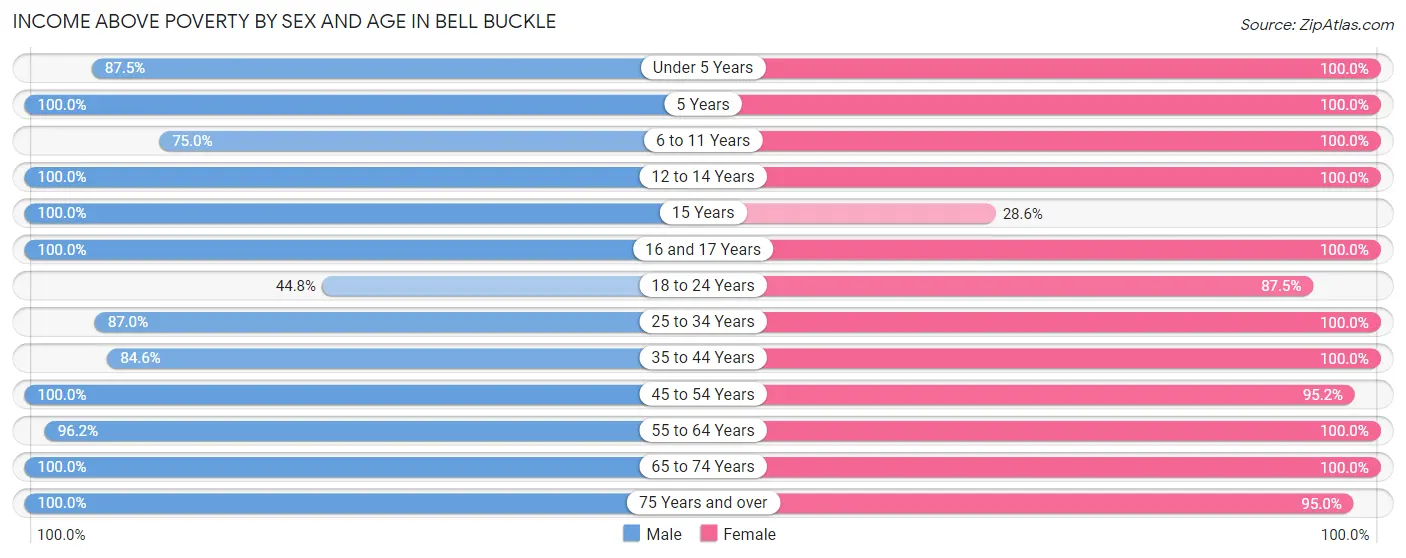
Income Above Poverty by Sex and Age in Bell Buckle
According to the poverty statistics in Bell Buckle, males aged 5 years and females aged under 5 years are the age groups that are most secure financially, with 100.0% of males and 100.0% of females in these age groups living above the poverty line.
| Age Bracket | Male | Female |
| Under 5 Years | 21 (87.5%) | 25 (100.0%) |
| 5 Years | 3 (100.0%) | 3 (100.0%) |
| 6 to 11 Years | 18 (75.0%) | 26 (100.0%) |
| 12 to 14 Years | 6 (100.0%) | 2 (100.0%) |
| 15 Years | 4 (100.0%) | 2 (28.6%) |
| 16 and 17 Years | 3 (100.0%) | 7 (100.0%) |
| 18 to 24 Years | 26 (44.8%) | 28 (87.5%) |
| 25 to 34 Years | 40 (87.0%) | 77 (100.0%) |
| 35 to 44 Years | 33 (84.6%) | 13 (100.0%) |
| 45 to 54 Years | 42 (100.0%) | 40 (95.2%) |
| 55 to 64 Years | 51 (96.2%) | 25 (100.0%) |
| 65 to 74 Years | 11 (100.0%) | 13 (100.0%) |
| 75 Years and over | 8 (100.0%) | 19 (95.0%) |
| Total | 266 (82.9%) | 280 (95.9%) |
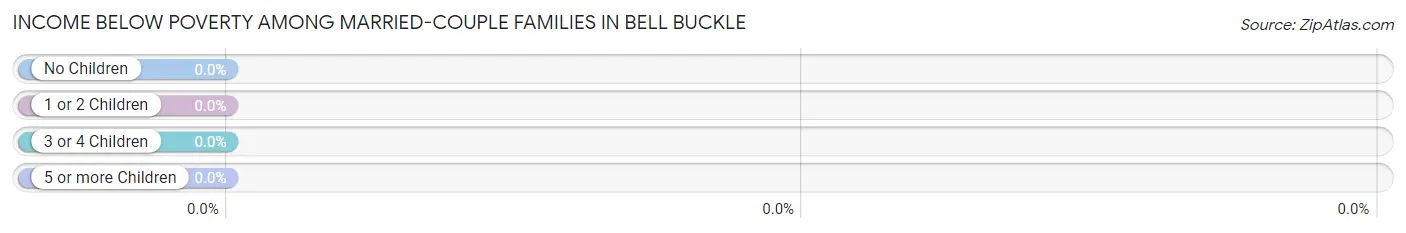
Income Below Poverty Among Married-Couple Families in Bell Buckle
| Children | Above Poverty | Below Poverty |
| No Children | 40 (100.0%) | 0 (0.0%) |
| 1 or 2 Children | 48 (100.0%) | 0 (0.0%) |
| 3 or 4 Children | 5 (100.0%) | 0 (0.0%) |
| 5 or more Children | 0 (0.0%) | 0 (0.0%) |
| Total | 93 (100.0%) | 0 (0.0%) |
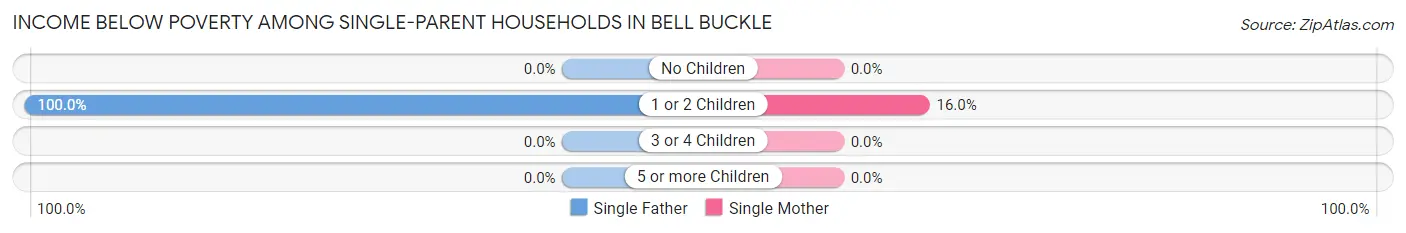
Income Below Poverty Among Single-Parent Households in Bell Buckle
According to the poverty data in Bell Buckle, 50.0% or 6 single-father households and 9.8% or 4 single-mother households are living below the poverty line. Among single-father households, those with 1 or 2 children have the highest poverty rate, with 6 households (100.0%) experiencing poverty. Likewise, among single-mother households, those with 1 or 2 children have the highest poverty rate, with 4 households (16.0%) falling below the poverty line.
| Children | Single Father | Single Mother |
| No Children | 0 (0.0%) | 0 (0.0%) |
| 1 or 2 Children | 6 (100.0%) | 4 (16.0%) |
| 3 or 4 Children | 0 (0.0%) | 0 (0.0%) |
| 5 or more Children | 0 (0.0%) | 0 (0.0%) |
| Total | 6 (50.0%) | 4 (9.8%) |
Income Below Poverty Among Married-Couple vs Single-Parent Households in Bell Buckle
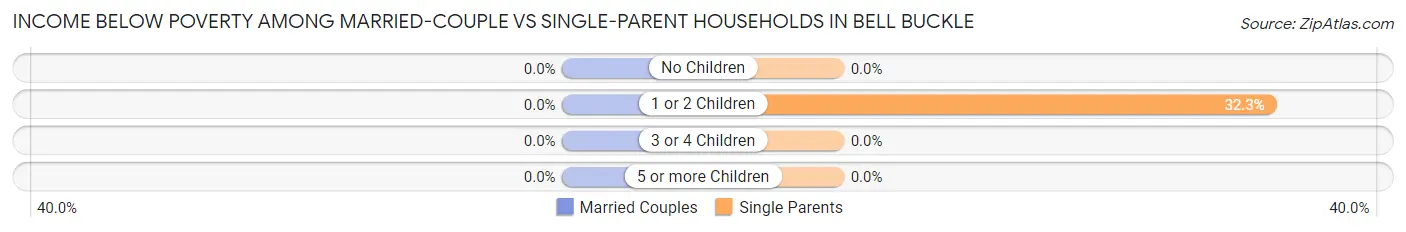
| Children | Married-Couple Families | Single-Parent Households |
| No Children | 0 (0.0%) | 0 (0.0%) |
| 1 or 2 Children | 0 (0.0%) | 10 (32.3%) |
| 3 or 4 Children | 0 (0.0%) | 0 (0.0%) |
| 5 or more Children | 0 (0.0%) | 0 (0.0%) |
| Total | 0 (0.0%) | 10 (18.9%) |
Employment Characteristics in Bell Buckle
Employment by Class of Employer in Bell Buckle
Among the 380 employed individuals in Bell Buckle, private company employees (251 | 66.0%), self-employed (not incorporated) (39 | 10.3%), and not-for-profit organizations (34 | 8.9%) make up the most common classes of employment.
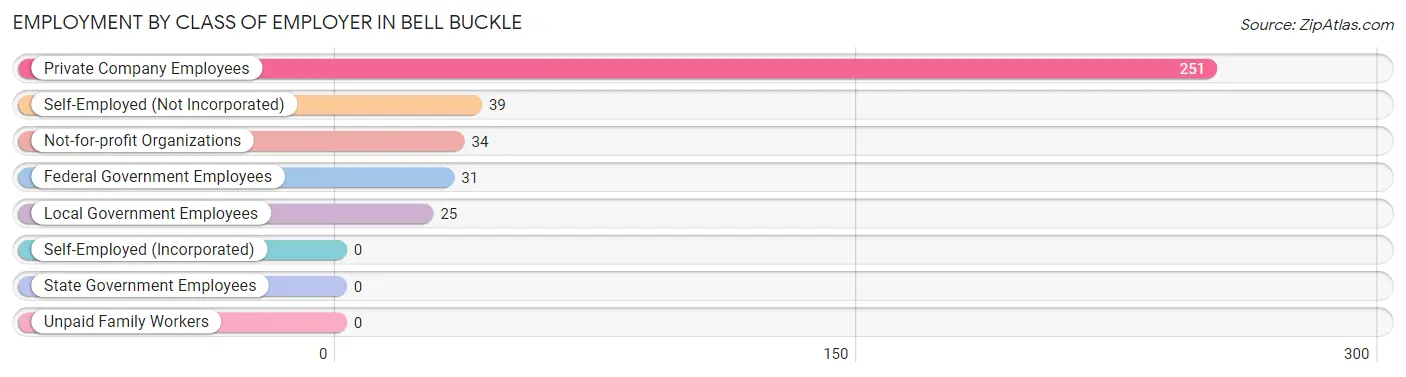
| Employer Class | # Employees | % Employees |
| Private Company Employees | 251 | 66.0% |
| Self-Employed (Incorporated) | 0 | 0.0% |
| Self-Employed (Not Incorporated) | 39 | 10.3% |
| Not-for-profit Organizations | 34 | 8.9% |
| Local Government Employees | 25 | 6.6% |
| State Government Employees | 0 | 0.0% |
| Federal Government Employees | 31 | 8.2% |
| Unpaid Family Workers | 0 | 0.0% |
| Total | 380 | 100.0% |
Employment Status by Age in Bell Buckle
According to the labor force statistics for Bell Buckle, out of the total population over 16 years of age (497), 79.3% or 394 individuals are in the labor force, with 2.8% or 11 of them unemployed. The age group with the highest labor force participation rate is 30 to 34 years, with 100.0% or 57 individuals in the labor force. Within the labor force, the 65 to 74 years age range has the highest percentage of unemployed individuals, with 17.6% or 3 of them being unemployed.
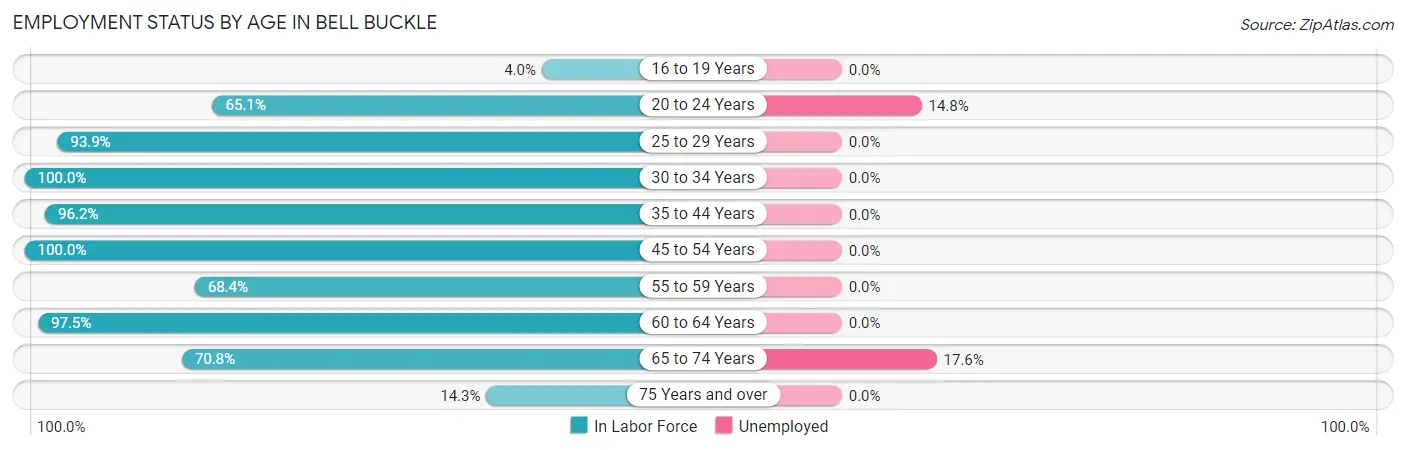
| Age Bracket | In Labor Force | Unemployed |
| 16 to 19 Years | 1 (4.0%) | 0 (0.0%) |
| 20 to 24 Years | 54 (65.1%) | 8 (14.8%) |
| 25 to 29 Years | 62 (93.9%) | 0 (0.0%) |
| 30 to 34 Years | 57 (100.0%) | 0 (0.0%) |
| 35 to 44 Years | 50 (96.2%) | 0 (0.0%) |
| 45 to 54 Years | 84 (100.0%) | 0 (0.0%) |
| 55 to 59 Years | 26 (68.4%) | 0 (0.0%) |
| 60 to 64 Years | 39 (97.5%) | 0 (0.0%) |
| 65 to 74 Years | 17 (70.8%) | 3 (17.6%) |
| 75 Years and over | 4 (14.3%) | 0 (0.0%) |
| Total | 394 (79.3%) | 11 (2.8%) |
Employment Status by Educational Attainment in Bell Buckle
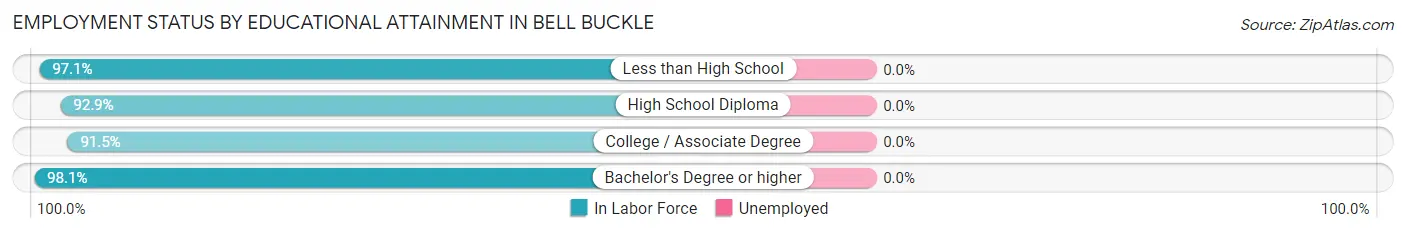
| Educational Attainment | In Labor Force | Unemployed |
| Less than High School | 33 (97.1%) | 0 (0.0%) |
| High School Diploma | 65 (92.9%) | 0 (0.0%) |
| College / Associate Degree | 118 (91.5%) | 0 (0.0%) |
| Bachelor's Degree or higher | 102 (98.1%) | 0 (0.0%) |
| Total | 318 (94.4%) | 0 (0.0%) |
Employment Occupations by Sex in Bell Buckle
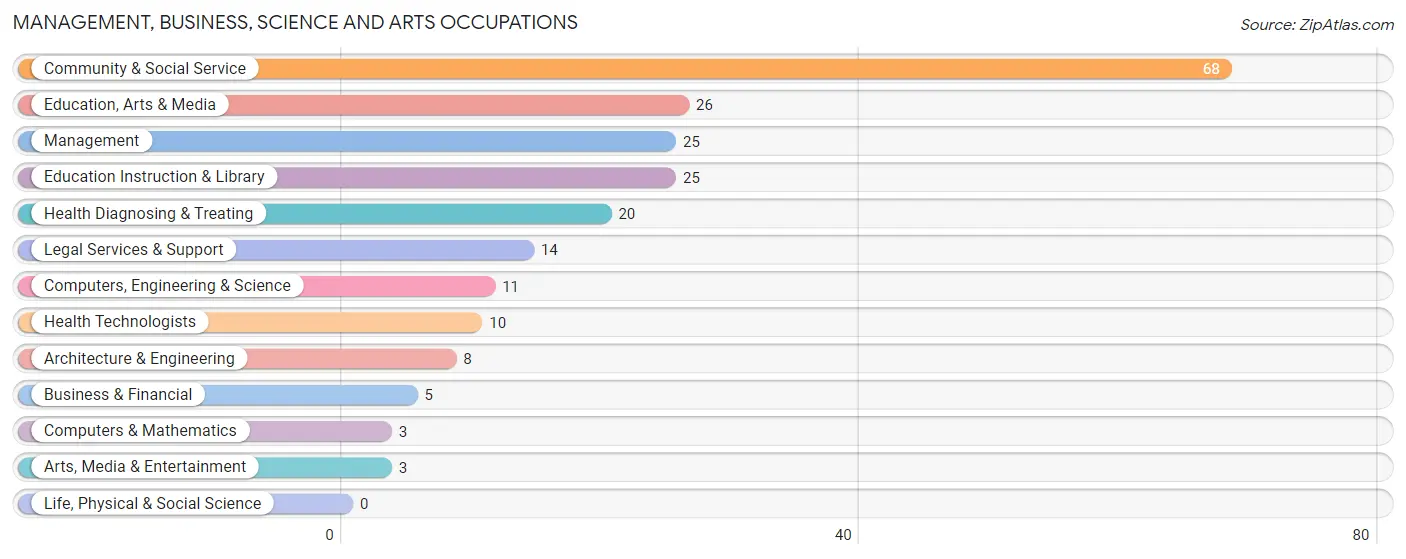
Management, Business, Science and Arts Occupations
The most common Management, Business, Science and Arts occupations in Bell Buckle are Community & Social Service (68 | 17.7%), Education, Arts & Media (26 | 6.8%), Management (25 | 6.5%), Education Instruction & Library (25 | 6.5%), and Health Diagnosing & Treating (20 | 5.2%).
Management, Business, Science and Arts Occupations by Sex
Within the Management, Business, Science and Arts occupations in Bell Buckle, the most male-oriented occupations are Education, Arts & Media (88.5%), Business & Financial (80.0%), and Community & Social Service (52.9%), while the most female-oriented occupations are Computers & Mathematics (100.0%), Legal Services & Support (100.0%), and Arts, Media & Entertainment (100.0%).

| Occupation | Male | Female |
| Management | 7 (28.0%) | 18 (72.0%) |
| Business & Financial | 4 (80.0%) | 1 (20.0%) |
| Computers, Engineering & Science | 3 (27.3%) | 8 (72.7%) |
| Computers & Mathematics | 0 (0.0%) | 3 (100.0%) |
| Architecture & Engineering | 3 (37.5%) | 5 (62.5%) |
| Life, Physical & Social Science | 0 (0.0%) | 0 (0.0%) |
| Community & Social Service | 36 (52.9%) | 32 (47.1%) |
| Education, Arts & Media | 23 (88.5%) | 3 (11.5%) |
| Legal Services & Support | 0 (0.0%) | 14 (100.0%) |
| Education Instruction & Library | 13 (52.0%) | 12 (48.0%) |
| Arts, Media & Entertainment | 0 (0.0%) | 3 (100.0%) |
| Health Diagnosing & Treating | 2 (10.0%) | 18 (90.0%) |
| Health Technologists | 1 (10.0%) | 9 (90.0%) |
| Total (Category) | 52 (40.3%) | 77 (59.7%) |
| Total (Overall) | 214 (55.9%) | 169 (44.1%) |
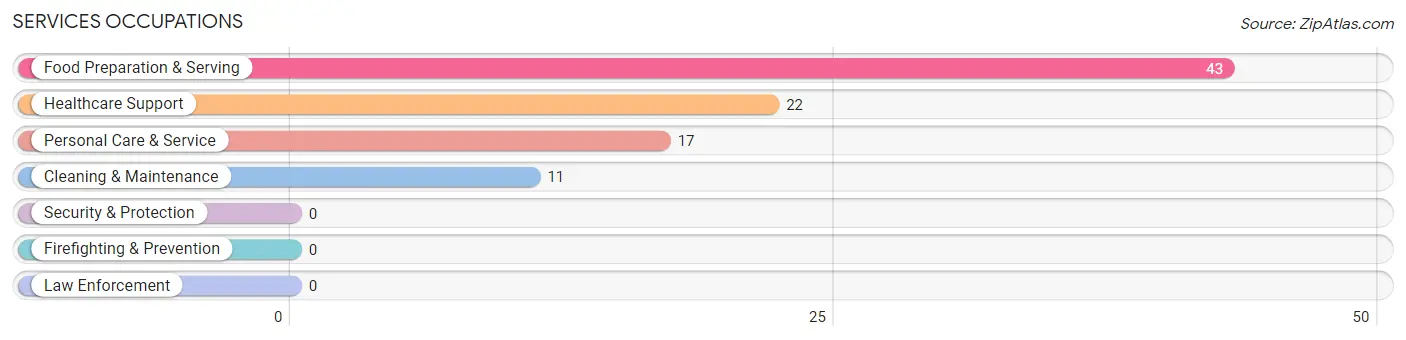
Services Occupations
The most common Services occupations in Bell Buckle are Food Preparation & Serving (43 | 11.2%), Healthcare Support (22 | 5.7%), Personal Care & Service (17 | 4.4%), and Cleaning & Maintenance (11 | 2.9%).
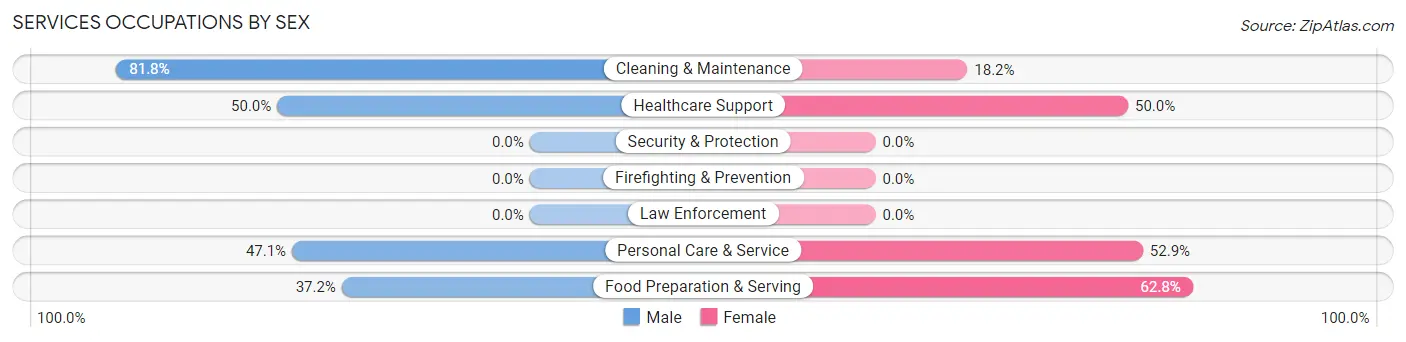
Services Occupations by Sex
Within the Services occupations in Bell Buckle, the most male-oriented occupations are Cleaning & Maintenance (81.8%), Healthcare Support (50.0%), and Personal Care & Service (47.1%), while the most female-oriented occupations are Food Preparation & Serving (62.8%), Personal Care & Service (52.9%), and Healthcare Support (50.0%).
| Occupation | Male | Female |
| Healthcare Support | 11 (50.0%) | 11 (50.0%) |
| Security & Protection | 0 (0.0%) | 0 (0.0%) |
| Firefighting & Prevention | 0 (0.0%) | 0 (0.0%) |
| Law Enforcement | 0 (0.0%) | 0 (0.0%) |
| Food Preparation & Serving | 16 (37.2%) | 27 (62.8%) |
| Cleaning & Maintenance | 9 (81.8%) | 2 (18.2%) |
| Personal Care & Service | 8 (47.1%) | 9 (52.9%) |
| Total (Category) | 44 (47.3%) | 49 (52.7%) |
| Total (Overall) | 214 (55.9%) | 169 (44.1%) |
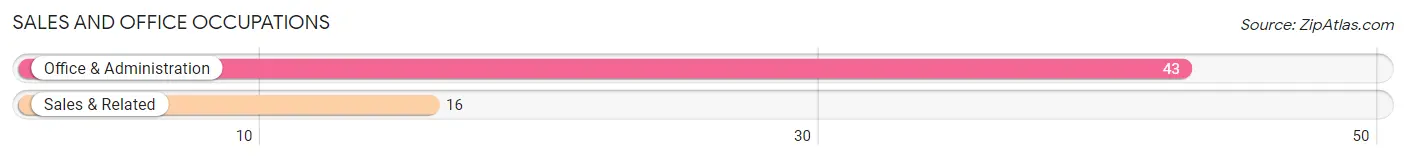
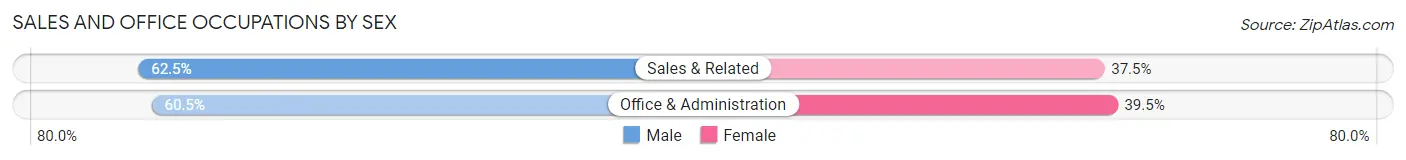
Sales and Office Occupations
The most common Sales and Office occupations in Bell Buckle are Office & Administration (43 | 11.2%), and Sales & Related (16 | 4.2%).
Sales and Office Occupations by Sex
| Occupation | Male | Female |
| Sales & Related | 10 (62.5%) | 6 (37.5%) |
| Office & Administration | 26 (60.5%) | 17 (39.5%) |
| Total (Category) | 36 (61.0%) | 23 (39.0%) |
| Total (Overall) | 214 (55.9%) | 169 (44.1%) |
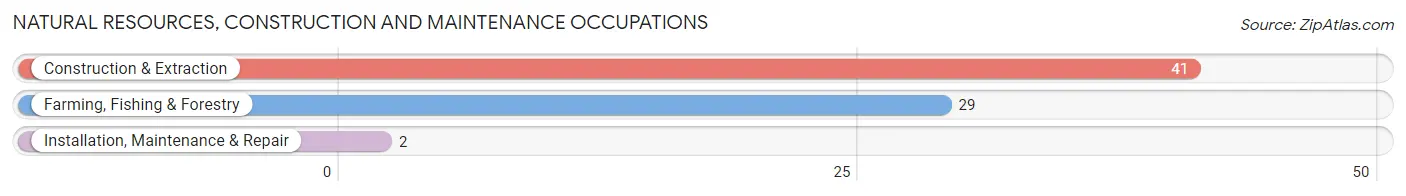
Natural Resources, Construction and Maintenance Occupations
The most common Natural Resources, Construction and Maintenance occupations in Bell Buckle are Construction & Extraction (41 | 10.7%), Farming, Fishing & Forestry (29 | 7.6%), and Installation, Maintenance & Repair (2 | 0.5%).
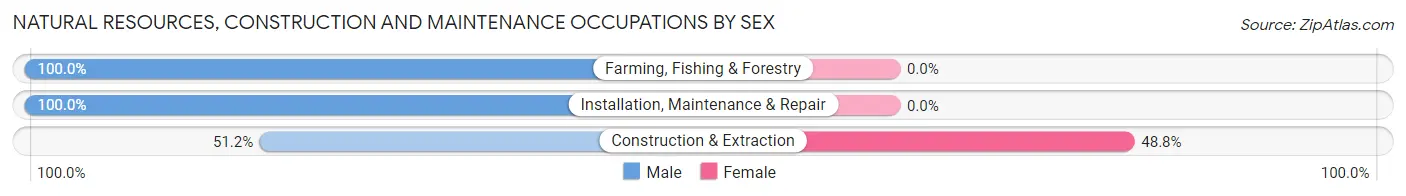
Natural Resources, Construction and Maintenance Occupations by Sex
| Occupation | Male | Female |
| Farming, Fishing & Forestry | 29 (100.0%) | 0 (0.0%) |
| Construction & Extraction | 21 (51.2%) | 20 (48.8%) |
| Installation, Maintenance & Repair | 2 (100.0%) | 0 (0.0%) |
| Total (Category) | 52 (72.2%) | 20 (27.8%) |
| Total (Overall) | 214 (55.9%) | 169 (44.1%) |
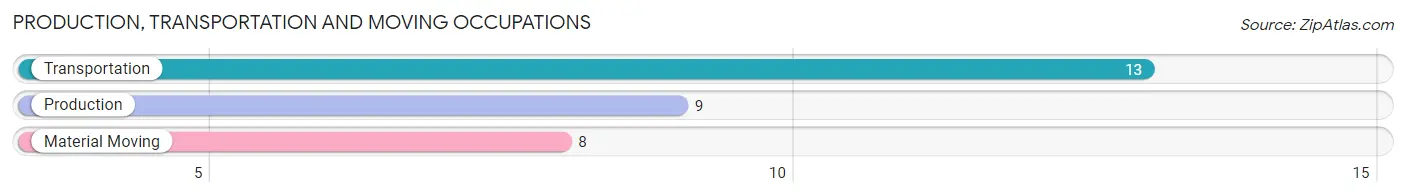
Production, Transportation and Moving Occupations
The most common Production, Transportation and Moving occupations in Bell Buckle are Transportation (13 | 3.4%), Production (9 | 2.4%), and Material Moving (8 | 2.1%).
Production, Transportation and Moving Occupations by Sex
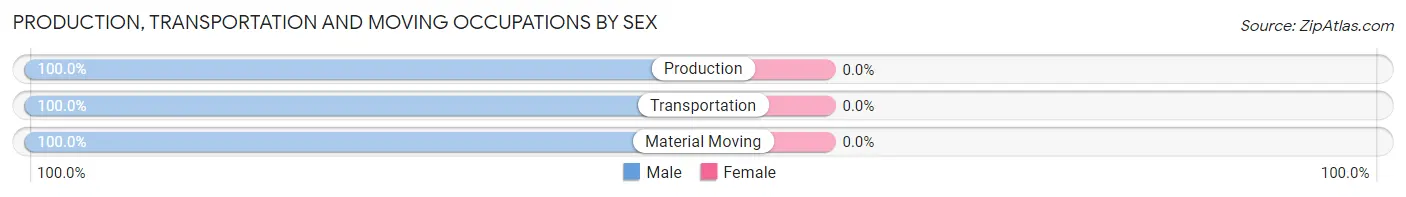
| Occupation | Male | Female |
| Production | 9 (100.0%) | 0 (0.0%) |
| Transportation | 13 (100.0%) | 0 (0.0%) |
| Material Moving | 8 (100.0%) | 0 (0.0%) |
| Total (Category) | 30 (100.0%) | 0 (0.0%) |
| Total (Overall) | 214 (55.9%) | 169 (44.1%) |
Employment Industries by Sex in Bell Buckle
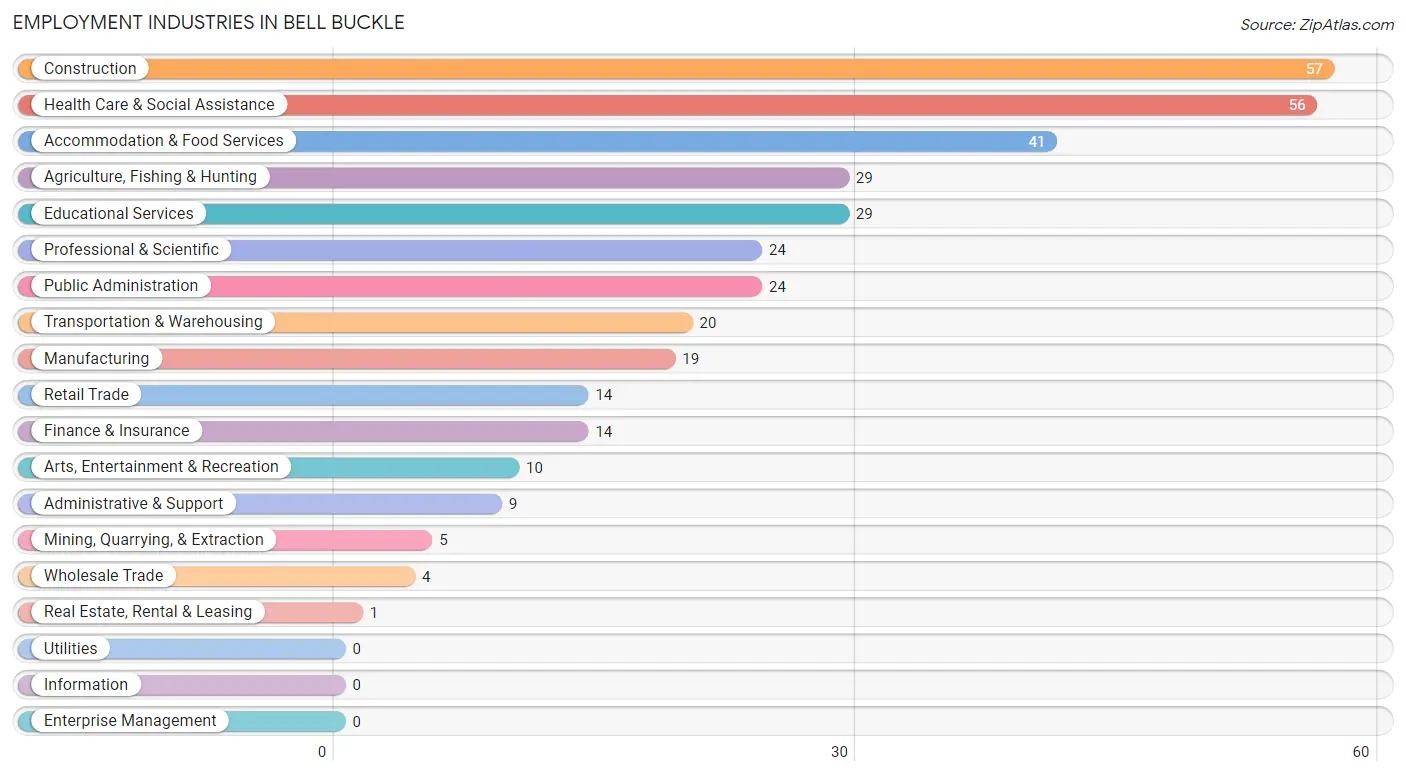
Employment Industries in Bell Buckle
The major employment industries in Bell Buckle include Construction (57 | 14.9%), Health Care & Social Assistance (56 | 14.6%), Accommodation & Food Services (41 | 10.7%), Agriculture, Fishing & Hunting (29 | 7.6%), and Educational Services (29 | 7.6%).
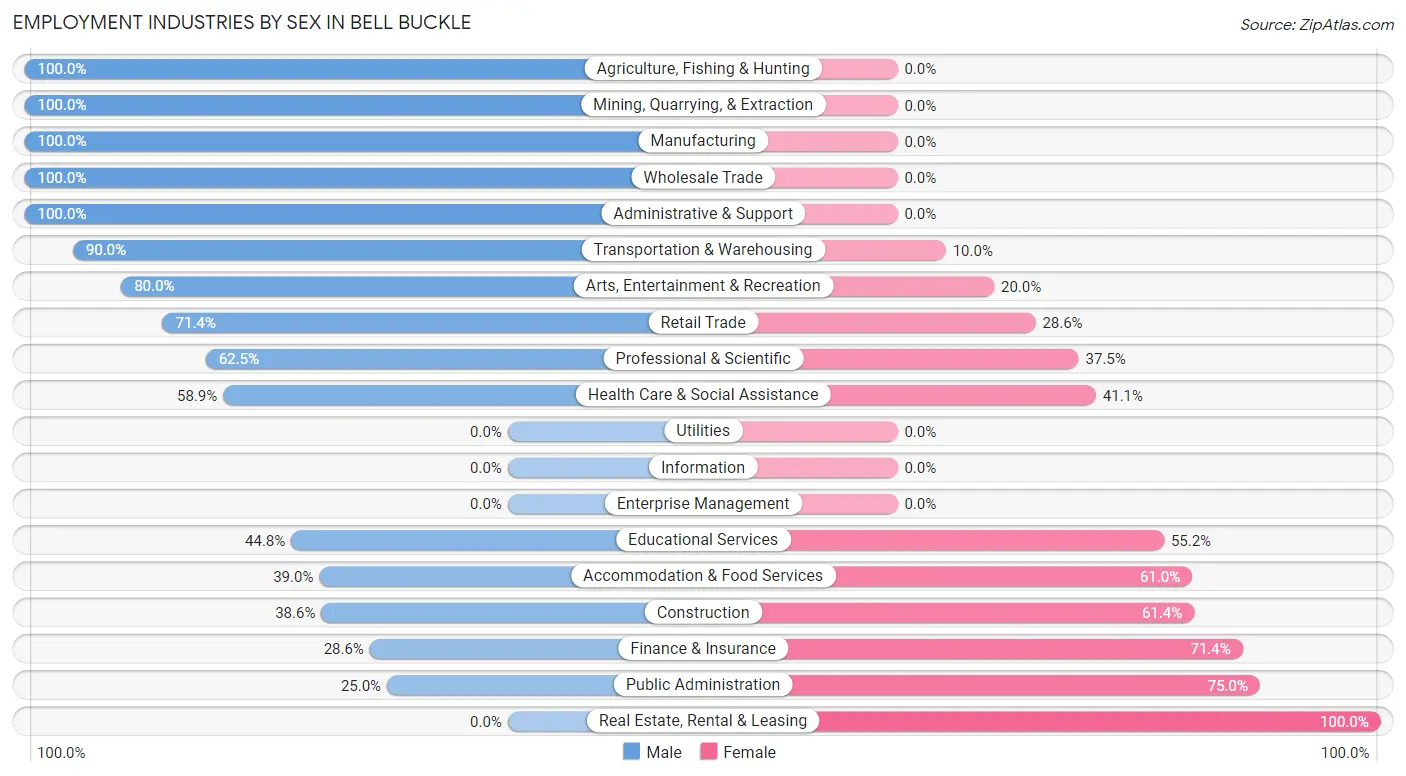
Employment Industries by Sex in Bell Buckle
The Bell Buckle industries that see more men than women are Agriculture, Fishing & Hunting (100.0%), Mining, Quarrying, & Extraction (100.0%), and Manufacturing (100.0%), whereas the industries that tend to have a higher number of women are Real Estate, Rental & Leasing (100.0%), Public Administration (75.0%), and Finance & Insurance (71.4%).
| Industry | Male | Female |
| Agriculture, Fishing & Hunting | 29 (100.0%) | 0 (0.0%) |
| Mining, Quarrying, & Extraction | 5 (100.0%) | 0 (0.0%) |
| Construction | 22 (38.6%) | 35 (61.4%) |
| Manufacturing | 19 (100.0%) | 0 (0.0%) |
| Wholesale Trade | 4 (100.0%) | 0 (0.0%) |
| Retail Trade | 10 (71.4%) | 4 (28.6%) |
| Transportation & Warehousing | 18 (90.0%) | 2 (10.0%) |
| Utilities | 0 (0.0%) | 0 (0.0%) |
| Information | 0 (0.0%) | 0 (0.0%) |
| Finance & Insurance | 4 (28.6%) | 10 (71.4%) |
| Real Estate, Rental & Leasing | 0 (0.0%) | 1 (100.0%) |
| Professional & Scientific | 15 (62.5%) | 9 (37.5%) |
| Enterprise Management | 0 (0.0%) | 0 (0.0%) |
| Administrative & Support | 9 (100.0%) | 0 (0.0%) |
| Educational Services | 13 (44.8%) | 16 (55.2%) |
| Health Care & Social Assistance | 33 (58.9%) | 23 (41.1%) |
| Arts, Entertainment & Recreation | 8 (80.0%) | 2 (20.0%) |
| Accommodation & Food Services | 16 (39.0%) | 25 (61.0%) |
| Public Administration | 6 (25.0%) | 18 (75.0%) |
| Total | 214 (55.9%) | 169 (44.1%) |
Education in Bell Buckle
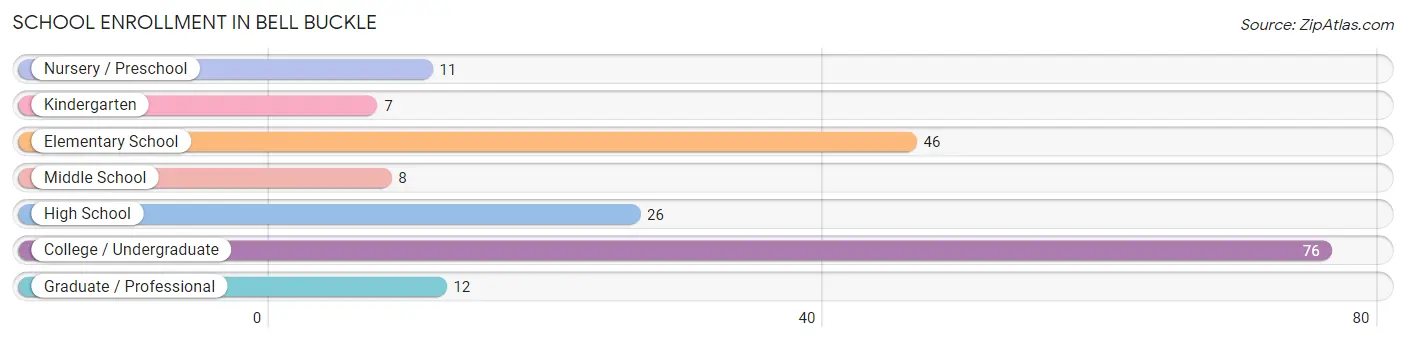
School Enrollment in Bell Buckle
The most common levels of schooling among the 186 students in Bell Buckle are college / undergraduate (76 | 40.9%), elementary school (46 | 24.7%), and high school (26 | 14.0%).
| School Level | # Students | % Students |
| Nursery / Preschool | 11 | 5.9% |
| Kindergarten | 7 | 3.8% |
| Elementary School | 46 | 24.7% |
| Middle School | 8 | 4.3% |
| High School | 26 | 14.0% |
| College / Undergraduate | 76 | 40.9% |
| Graduate / Professional | 12 | 6.5% |
| Total | 186 | 100.0% |
School Enrollment by Age by Funding Source in Bell Buckle
Out of a total of 186 students who are enrolled in schools in Bell Buckle, 67 (36.0%) attend a private institution, while the remaining 119 (64.0%) are enrolled in public schools. The age group of 18 to 19 year olds has the highest likelihood of being enrolled in private schools, with 12 (80.0% in the age bracket) enrolled. Conversely, the age group of 3 to 4 year olds has the lowest likelihood of being enrolled in a private school, with 11 (100.0% in the age bracket) attending a public institution.
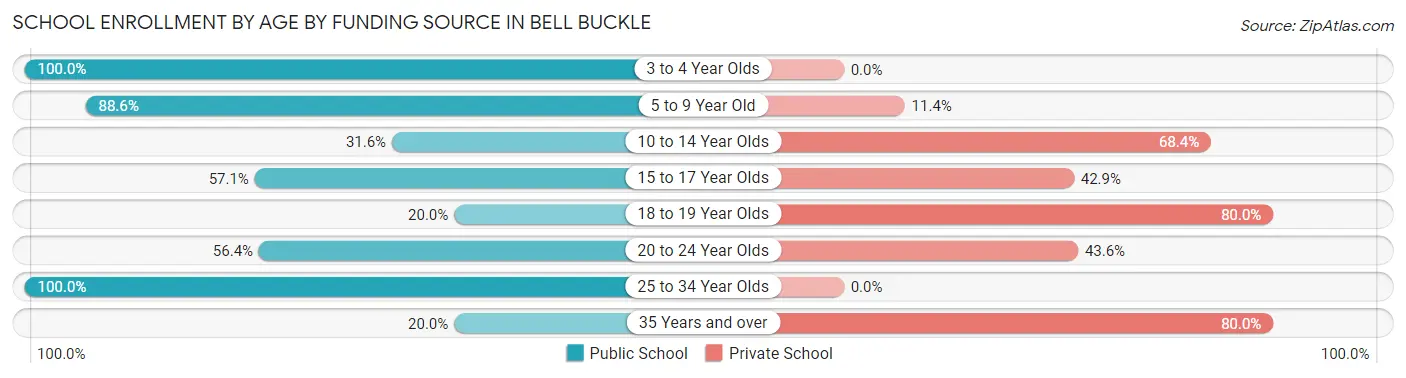
| Age Bracket | Public School | Private School |
| 3 to 4 Year Olds | 11 (100.0%) | 0 (0.0%) |
| 5 to 9 Year Old | 39 (88.6%) | 5 (11.4%) |
| 10 to 14 Year Olds | 6 (31.6%) | 13 (68.4%) |
| 15 to 17 Year Olds | 12 (57.1%) | 9 (42.9%) |
| 18 to 19 Year Olds | 3 (20.0%) | 12 (80.0%) |
| 20 to 24 Year Olds | 31 (56.4%) | 24 (43.6%) |
| 25 to 34 Year Olds | 16 (100.0%) | 0 (0.0%) |
| 35 Years and over | 1 (20.0%) | 4 (80.0%) |
| Total | 119 (64.0%) | 67 (36.0%) |
Educational Attainment by Field of Study in Bell Buckle
Visual & performing arts (24 | 18.0%), liberal arts & history (20 | 15.0%), communications (16 | 12.0%), business (14 | 10.5%), and literature & languages (14 | 10.5%) are the most common fields of study among 133 individuals in Bell Buckle who have obtained a bachelor's degree or higher.
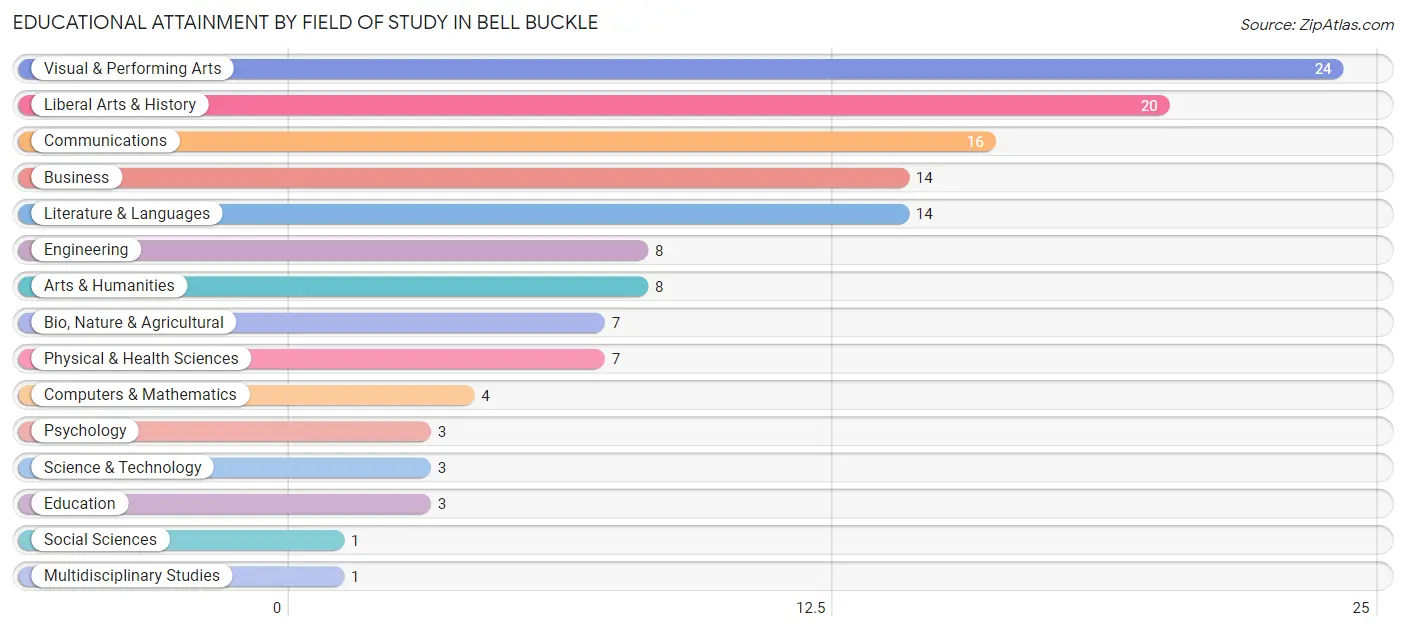
| Field of Study | # Graduates | % Graduates |
| Computers & Mathematics | 4 | 3.0% |
| Bio, Nature & Agricultural | 7 | 5.3% |
| Physical & Health Sciences | 7 | 5.3% |
| Psychology | 3 | 2.3% |
| Social Sciences | 1 | 0.7% |
| Engineering | 8 | 6.0% |
| Multidisciplinary Studies | 1 | 0.7% |
| Science & Technology | 3 | 2.3% |
| Business | 14 | 10.5% |
| Education | 3 | 2.3% |
| Literature & Languages | 14 | 10.5% |
| Liberal Arts & History | 20 | 15.0% |
| Visual & Performing Arts | 24 | 18.0% |
| Communications | 16 | 12.0% |
| Arts & Humanities | 8 | 6.0% |
| Total | 133 | 100.0% |
Transportation & Commute in Bell Buckle
Vehicle Availability by Sex in Bell Buckle
The most prevalent vehicle ownership categories in Bell Buckle are males with 2 vehicles (67, accounting for 43.5%) and females with 2 vehicles (66, making up 40.6%).
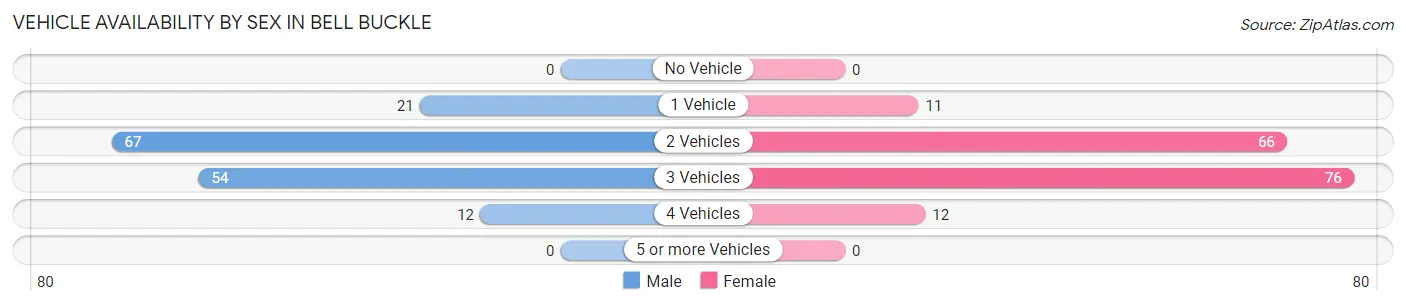
| Vehicles Available | Male | Female |
| No Vehicle | 0 (0.0%) | 0 (0.0%) |
| 1 Vehicle | 21 (13.6%) | 11 (6.7%) |
| 2 Vehicles | 67 (43.5%) | 66 (40.0%) |
| 3 Vehicles | 54 (35.1%) | 76 (46.1%) |
| 4 Vehicles | 12 (7.8%) | 12 (7.3%) |
| 5 or more Vehicles | 0 (0.0%) | 0 (0.0%) |
| Total | 154 (100.0%) | 165 (100.0%) |
Commute Time in Bell Buckle
The most frequently occuring commute durations in Bell Buckle are 20 to 24 minutes (77 commuters, 22.7%), 5 to 9 minutes (70 commuters, 20.6%), and 45 to 59 minutes (44 commuters, 12.9%).
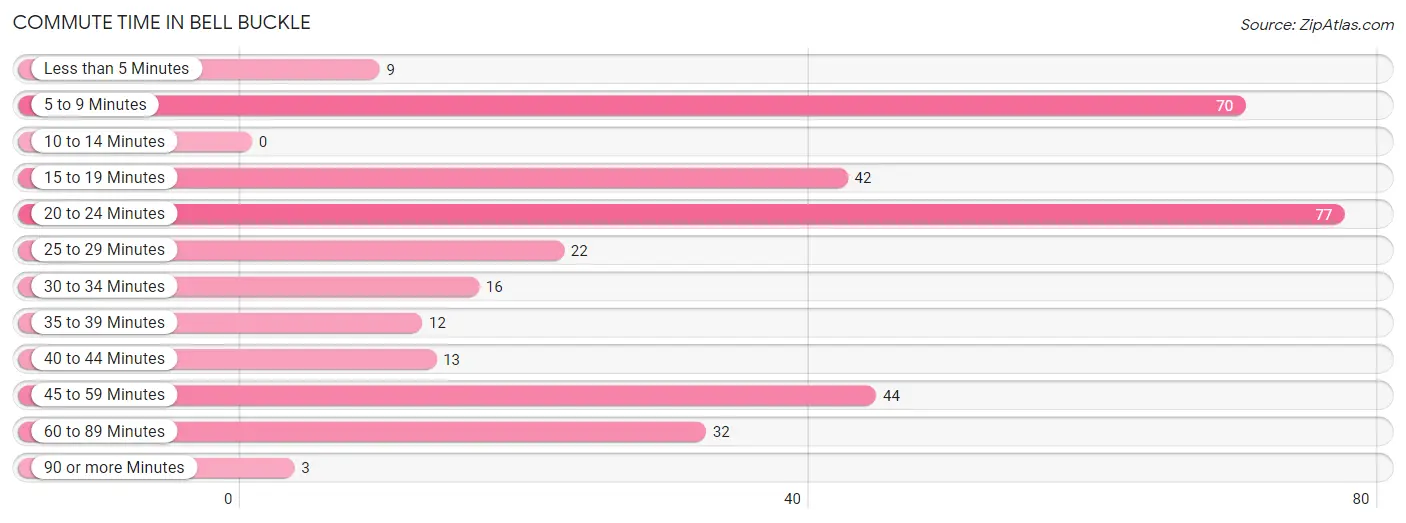
| Commute Time | # Commuters | % Commuters |
| Less than 5 Minutes | 9 | 2.6% |
| 5 to 9 Minutes | 70 | 20.6% |
| 10 to 14 Minutes | 0 | 0.0% |
| 15 to 19 Minutes | 42 | 12.3% |
| 20 to 24 Minutes | 77 | 22.7% |
| 25 to 29 Minutes | 22 | 6.5% |
| 30 to 34 Minutes | 16 | 4.7% |
| 35 to 39 Minutes | 12 | 3.5% |
| 40 to 44 Minutes | 13 | 3.8% |
| 45 to 59 Minutes | 44 | 12.9% |
| 60 to 89 Minutes | 32 | 9.4% |
| 90 or more Minutes | 3 | 0.9% |
Commute Time by Sex in Bell Buckle
The most common commute times in Bell Buckle are 20 to 24 minutes (56 commuters, 29.0%) for males and 15 to 19 minutes (38 commuters, 25.9%) for females.
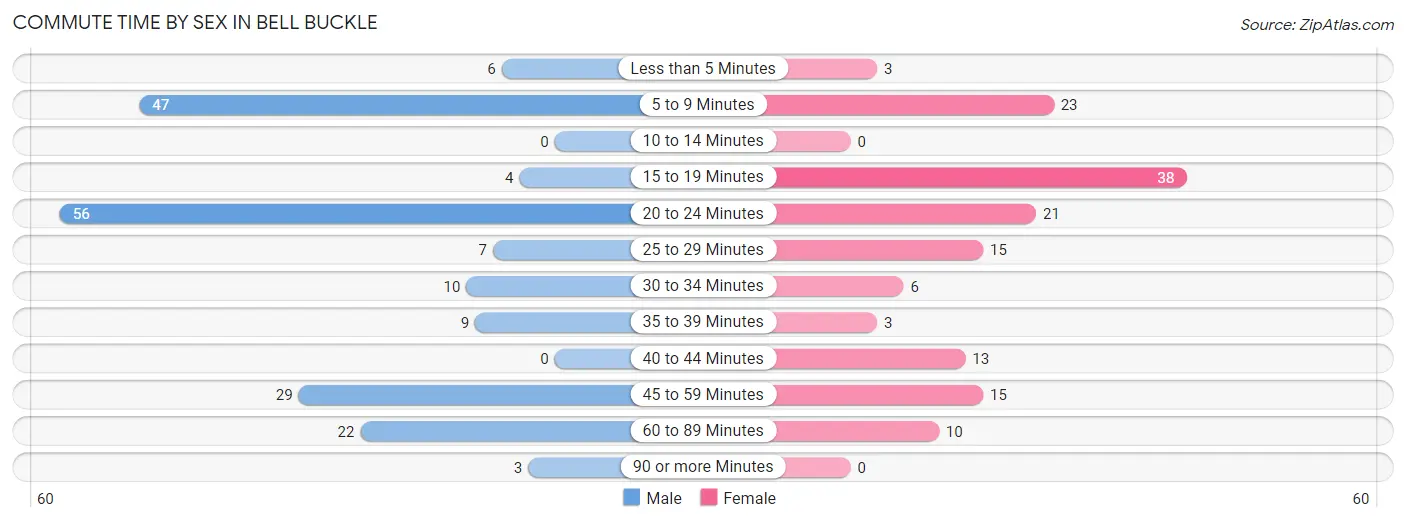
| Commute Time | Male | Female |
| Less than 5 Minutes | 6 (3.1%) | 3 (2.0%) |
| 5 to 9 Minutes | 47 (24.3%) | 23 (15.7%) |
| 10 to 14 Minutes | 0 (0.0%) | 0 (0.0%) |
| 15 to 19 Minutes | 4 (2.1%) | 38 (25.9%) |
| 20 to 24 Minutes | 56 (29.0%) | 21 (14.3%) |
| 25 to 29 Minutes | 7 (3.6%) | 15 (10.2%) |
| 30 to 34 Minutes | 10 (5.2%) | 6 (4.1%) |
| 35 to 39 Minutes | 9 (4.7%) | 3 (2.0%) |
| 40 to 44 Minutes | 0 (0.0%) | 13 (8.8%) |
| 45 to 59 Minutes | 29 (15.0%) | 15 (10.2%) |
| 60 to 89 Minutes | 22 (11.4%) | 10 (6.8%) |
| 90 or more Minutes | 3 (1.5%) | 0 (0.0%) |
Time of Departure to Work by Sex in Bell Buckle
The most frequent times of departure to work in Bell Buckle are 6:00 AM to 6:29 AM (41, 21.2%) for males and 6:00 AM to 6:29 AM (25, 17.0%) for females.
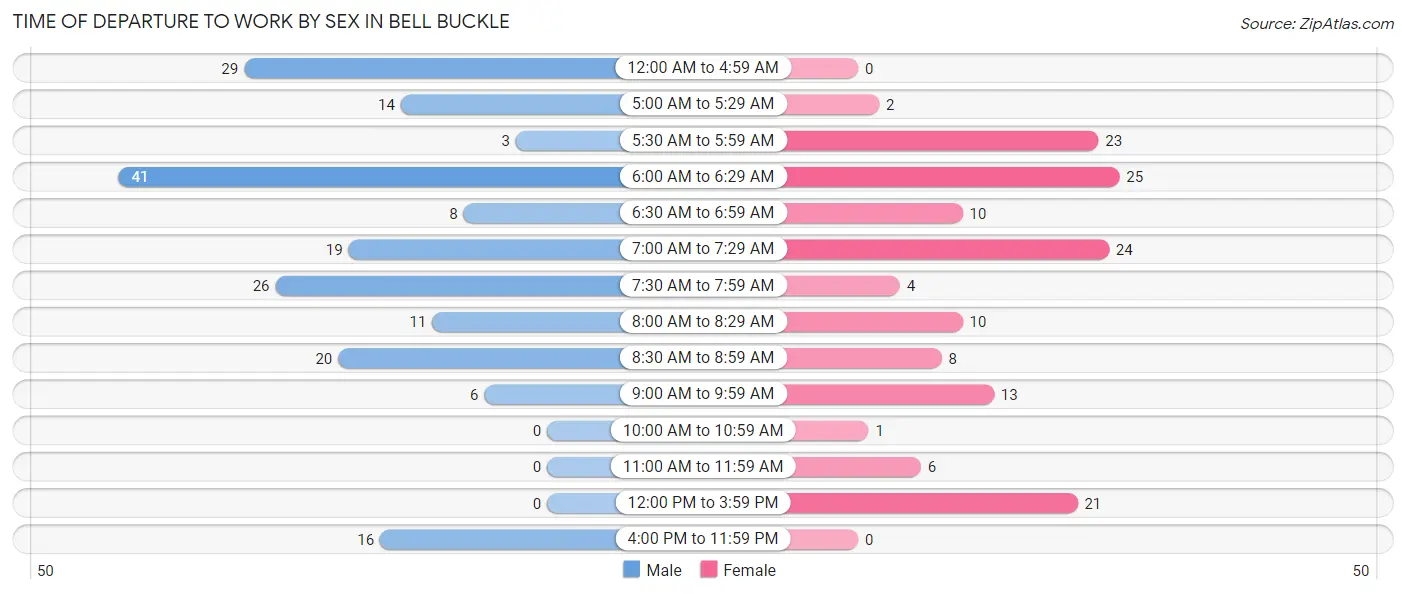
| Time of Departure | Male | Female |
| 12:00 AM to 4:59 AM | 29 (15.0%) | 0 (0.0%) |
| 5:00 AM to 5:29 AM | 14 (7.2%) | 2 (1.4%) |
| 5:30 AM to 5:59 AM | 3 (1.5%) | 23 (15.7%) |
| 6:00 AM to 6:29 AM | 41 (21.2%) | 25 (17.0%) |
| 6:30 AM to 6:59 AM | 8 (4.2%) | 10 (6.8%) |
| 7:00 AM to 7:29 AM | 19 (9.8%) | 24 (16.3%) |
| 7:30 AM to 7:59 AM | 26 (13.5%) | 4 (2.7%) |
| 8:00 AM to 8:29 AM | 11 (5.7%) | 10 (6.8%) |
| 8:30 AM to 8:59 AM | 20 (10.4%) | 8 (5.4%) |
| 9:00 AM to 9:59 AM | 6 (3.1%) | 13 (8.8%) |
| 10:00 AM to 10:59 AM | 0 (0.0%) | 1 (0.7%) |
| 11:00 AM to 11:59 AM | 0 (0.0%) | 6 (4.1%) |
| 12:00 PM to 3:59 PM | 0 (0.0%) | 21 (14.3%) |
| 4:00 PM to 11:59 PM | 16 (8.3%) | 0 (0.0%) |
| Total | 193 (100.0%) | 147 (100.0%) |
Housing Occupancy in Bell Buckle
Occupancy by Ownership in Bell Buckle
Of the total 202 dwellings in Bell Buckle, owner-occupied units account for 156 (77.2%), while renter-occupied units make up 46 (22.8%).
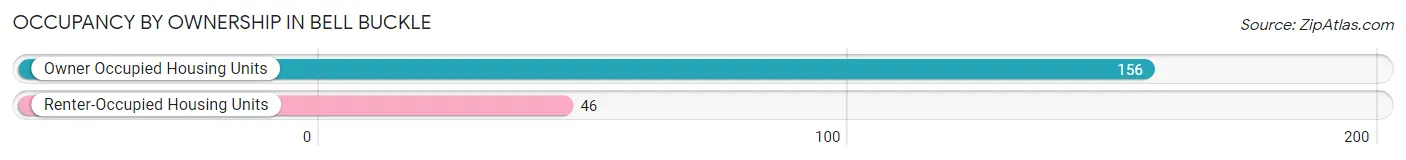
| Occupancy | # Housing Units | % Housing Units |
| Owner Occupied Housing Units | 156 | 77.2% |
| Renter-Occupied Housing Units | 46 | 22.8% |
| Total Occupied Housing Units | 202 | 100.0% |
Occupancy by Household Size in Bell Buckle
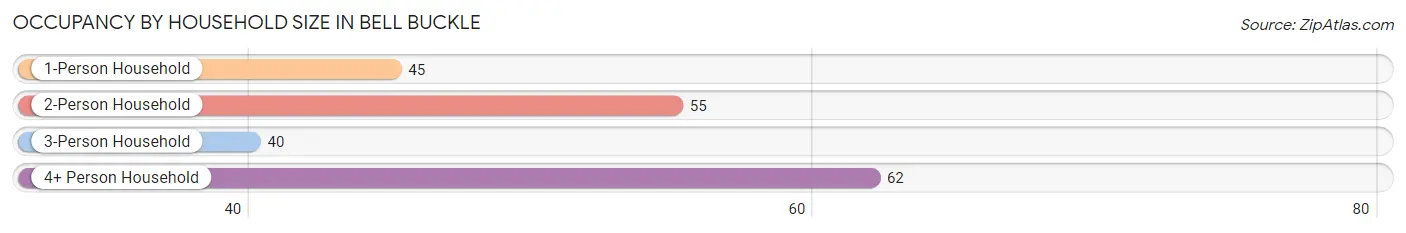
| Household Size | # Housing Units | % Housing Units |
| 1-Person Household | 45 | 22.3% |
| 2-Person Household | 55 | 27.2% |
| 3-Person Household | 40 | 19.8% |
| 4+ Person Household | 62 | 30.7% |
| Total Housing Units | 202 | 100.0% |
Occupancy by Ownership by Household Size in Bell Buckle
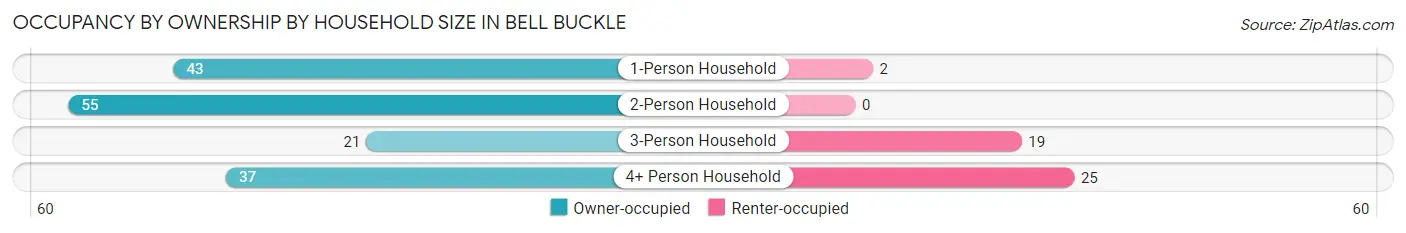
| Household Size | Owner-occupied | Renter-occupied |
| 1-Person Household | 43 (95.6%) | 2 (4.4%) |
| 2-Person Household | 55 (100.0%) | 0 (0.0%) |
| 3-Person Household | 21 (52.5%) | 19 (47.5%) |
| 4+ Person Household | 37 (59.7%) | 25 (40.3%) |
| Total Housing Units | 156 (77.2%) | 46 (22.8%) |
Occupancy by Educational Attainment in Bell Buckle
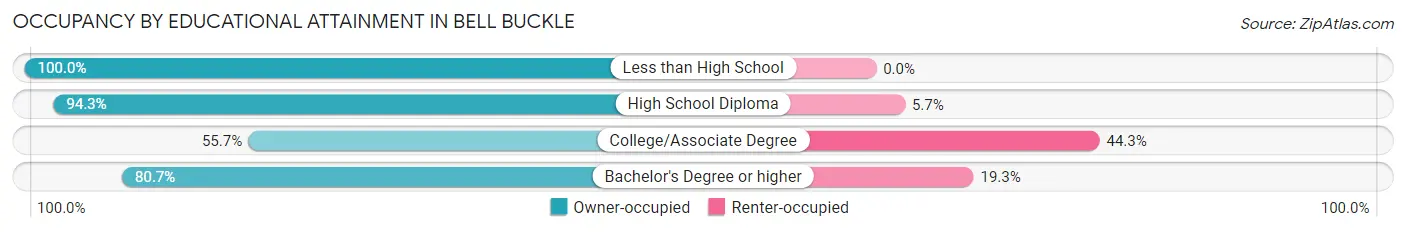
| Household Size | Owner-occupied | Renter-occupied |
| Less than High School | 5 (100.0%) | 0 (0.0%) |
| High School Diploma | 66 (94.3%) | 4 (5.7%) |
| College/Associate Degree | 39 (55.7%) | 31 (44.3%) |
| Bachelor's Degree or higher | 46 (80.7%) | 11 (19.3%) |
Occupancy by Age of Householder in Bell Buckle
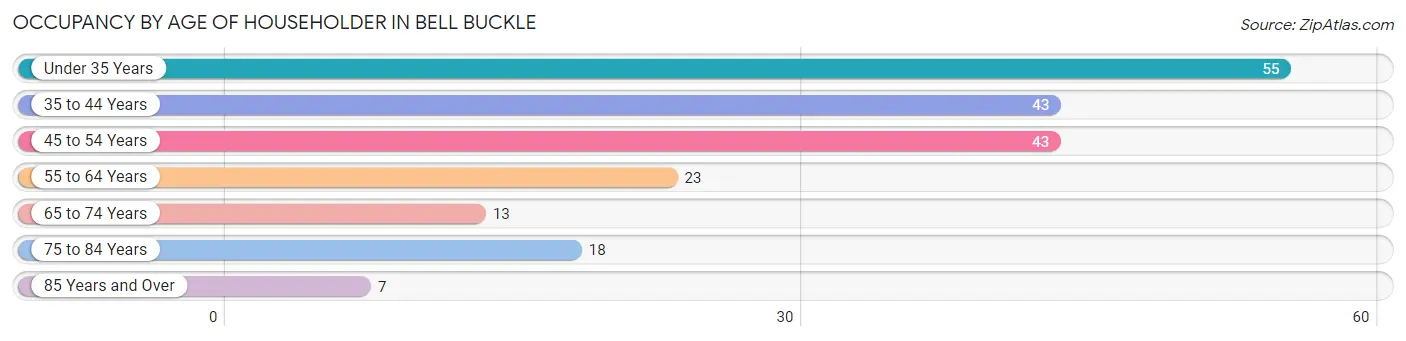
| Age Bracket | # Households | % Households |
| Under 35 Years | 55 | 27.2% |
| 35 to 44 Years | 43 | 21.3% |
| 45 to 54 Years | 43 | 21.3% |
| 55 to 64 Years | 23 | 11.4% |
| 65 to 74 Years | 13 | 6.4% |
| 75 to 84 Years | 18 | 8.9% |
| 85 Years and Over | 7 | 3.5% |
| Total | 202 | 100.0% |
Housing Finances in Bell Buckle
Median Income by Occupancy in Bell Buckle
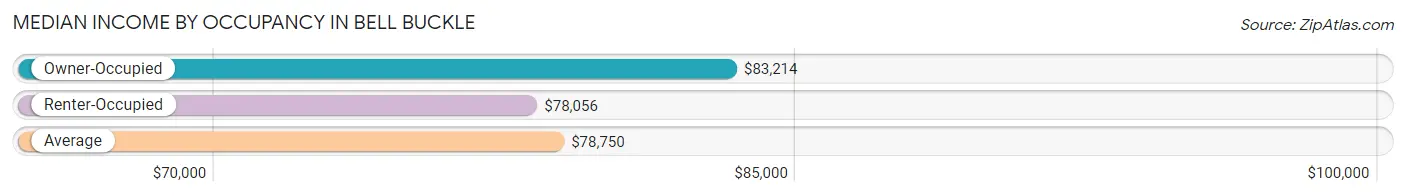
| Occupancy Type | # Households | Median Income |
| Owner-Occupied | 156 (77.2%) | $83,214 |
| Renter-Occupied | 46 (22.8%) | $78,056 |
| Average | 202 (100.0%) | $78,750 |
Occupancy by Householder Income Bracket in Bell Buckle
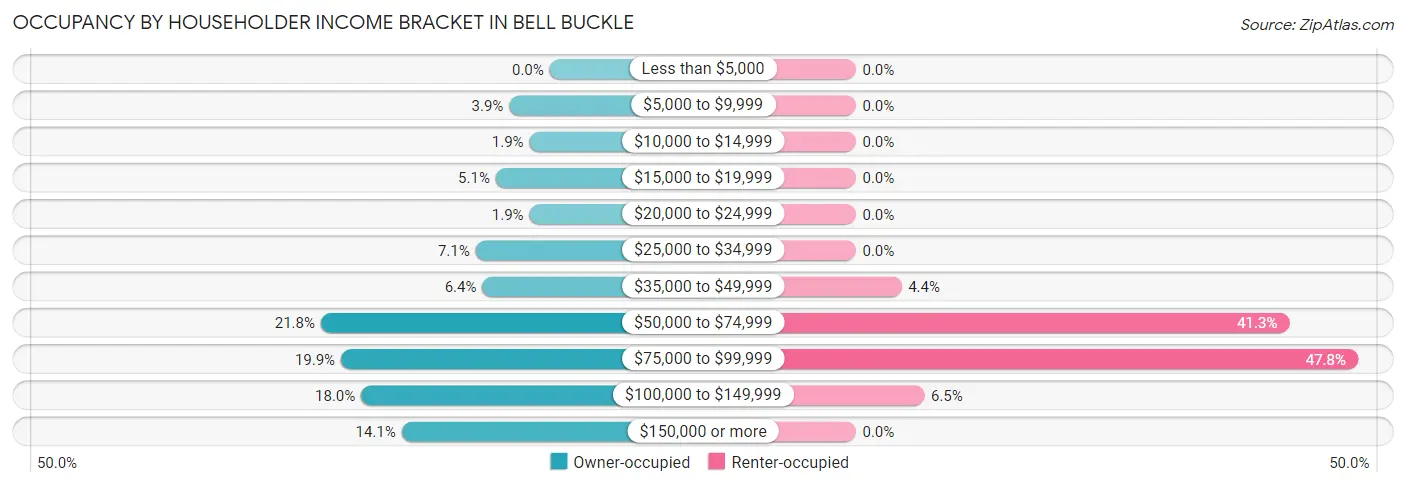
| Income Bracket | Owner-occupied | Renter-occupied |
| Less than $5,000 | 0 (0.0%) | 0 (0.0%) |
| $5,000 to $9,999 | 6 (3.8%) | 0 (0.0%) |
| $10,000 to $14,999 | 3 (1.9%) | 0 (0.0%) |
| $15,000 to $19,999 | 8 (5.1%) | 0 (0.0%) |
| $20,000 to $24,999 | 3 (1.9%) | 0 (0.0%) |
| $25,000 to $34,999 | 11 (7.0%) | 0 (0.0%) |
| $35,000 to $49,999 | 10 (6.4%) | 2 (4.3%) |
| $50,000 to $74,999 | 34 (21.8%) | 19 (41.3%) |
| $75,000 to $99,999 | 31 (19.9%) | 22 (47.8%) |
| $100,000 to $149,999 | 28 (17.9%) | 3 (6.5%) |
| $150,000 or more | 22 (14.1%) | 0 (0.0%) |
| Total | 156 (100.0%) | 46 (100.0%) |
Monthly Housing Cost Tiers in Bell Buckle
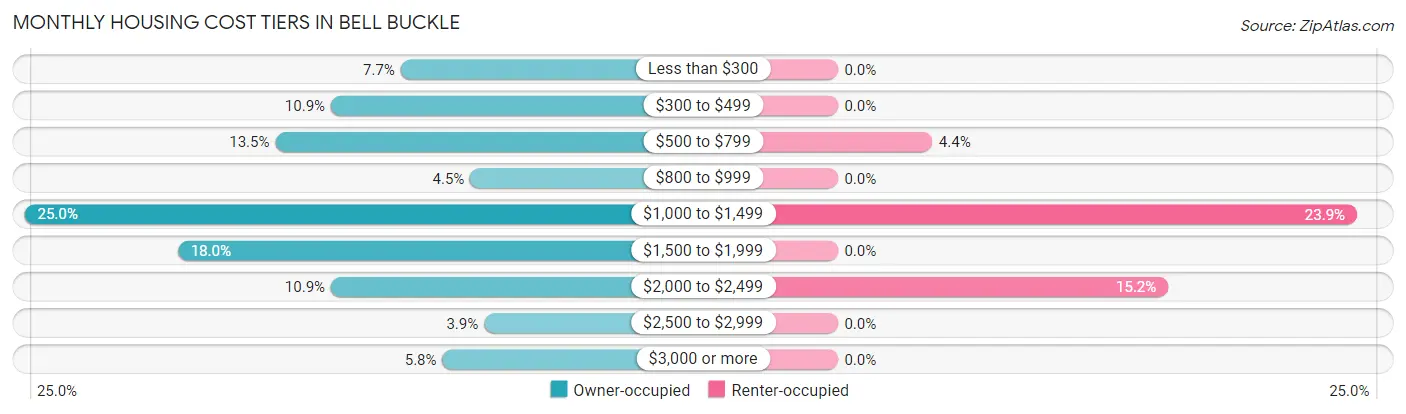
| Monthly Cost | Owner-occupied | Renter-occupied |
| Less than $300 | 12 (7.7%) | 0 (0.0%) |
| $300 to $499 | 17 (10.9%) | 0 (0.0%) |
| $500 to $799 | 21 (13.5%) | 2 (4.3%) |
| $800 to $999 | 7 (4.5%) | 0 (0.0%) |
| $1,000 to $1,499 | 39 (25.0%) | 11 (23.9%) |
| $1,500 to $1,999 | 28 (17.9%) | 0 (0.0%) |
| $2,000 to $2,499 | 17 (10.9%) | 7 (15.2%) |
| $2,500 to $2,999 | 6 (3.8%) | 0 (0.0%) |
| $3,000 or more | 9 (5.8%) | 0 (0.0%) |
| Total | 156 (100.0%) | 46 (100.0%) |
Physical Housing Characteristics in Bell Buckle
Housing Structures in Bell Buckle
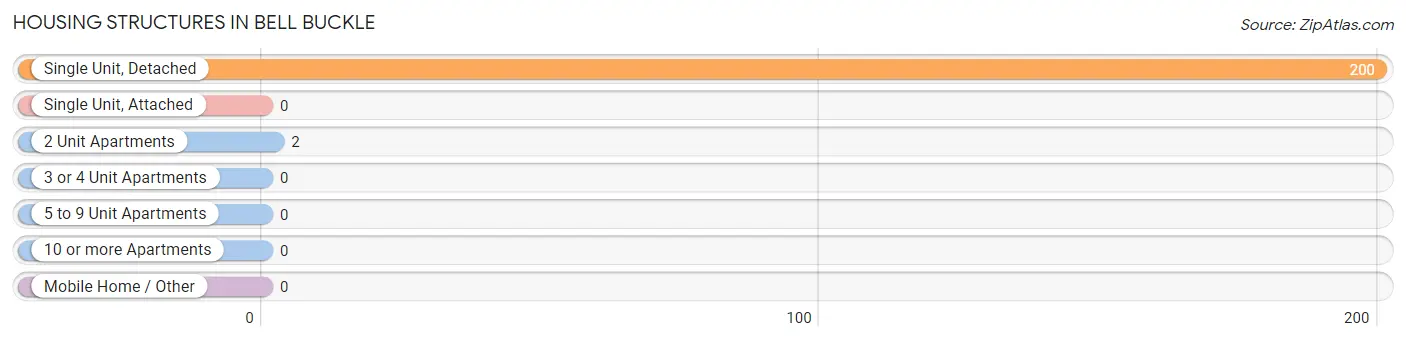
| Structure Type | # Housing Units | % Housing Units |
| Single Unit, Detached | 200 | 99.0% |
| Single Unit, Attached | 0 | 0.0% |
| 2 Unit Apartments | 2 | 1.0% |
| 3 or 4 Unit Apartments | 0 | 0.0% |
| 5 to 9 Unit Apartments | 0 | 0.0% |
| 10 or more Apartments | 0 | 0.0% |
| Mobile Home / Other | 0 | 0.0% |
| Total | 202 | 100.0% |
Housing Structures by Occupancy in Bell Buckle
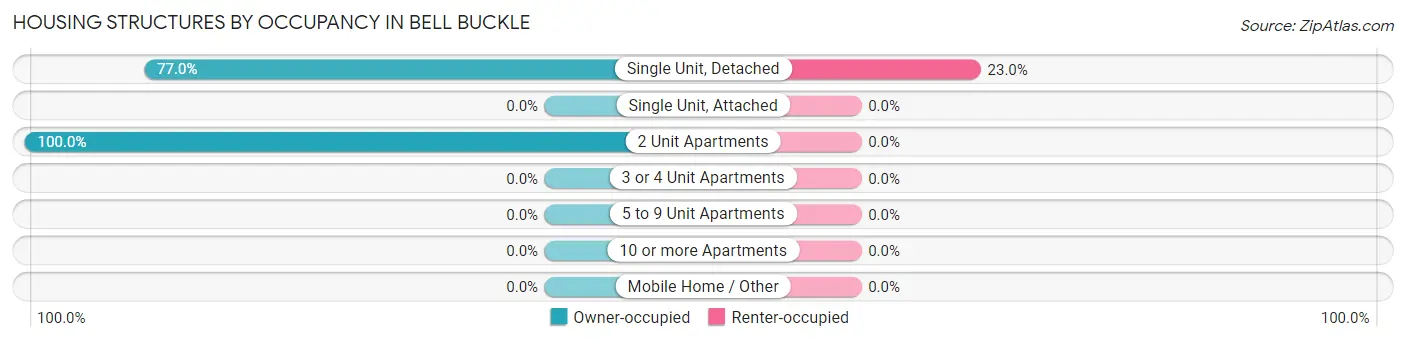
| Structure Type | Owner-occupied | Renter-occupied |
| Single Unit, Detached | 154 (77.0%) | 46 (23.0%) |
| Single Unit, Attached | 0 (0.0%) | 0 (0.0%) |
| 2 Unit Apartments | 2 (100.0%) | 0 (0.0%) |
| 3 or 4 Unit Apartments | 0 (0.0%) | 0 (0.0%) |
| 5 to 9 Unit Apartments | 0 (0.0%) | 0 (0.0%) |
| 10 or more Apartments | 0 (0.0%) | 0 (0.0%) |
| Mobile Home / Other | 0 (0.0%) | 0 (0.0%) |
| Total | 156 (77.2%) | 46 (22.8%) |
Housing Structures by Number of Rooms in Bell Buckle
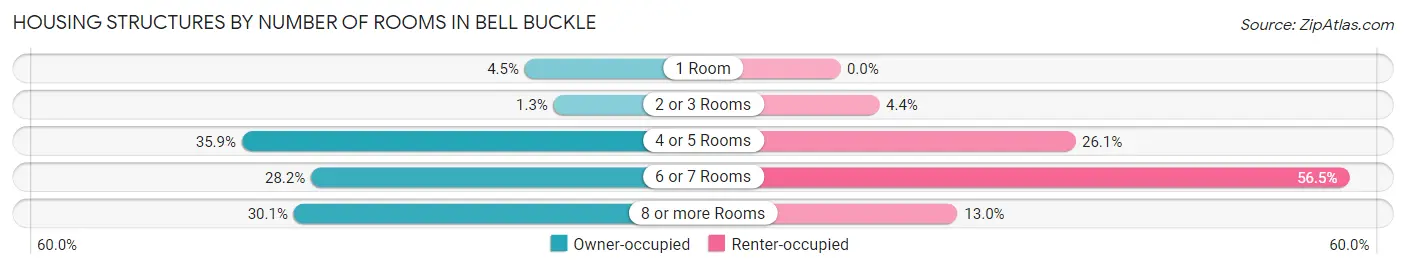
| Number of Rooms | Owner-occupied | Renter-occupied |
| 1 Room | 7 (4.5%) | 0 (0.0%) |
| 2 or 3 Rooms | 2 (1.3%) | 2 (4.3%) |
| 4 or 5 Rooms | 56 (35.9%) | 12 (26.1%) |
| 6 or 7 Rooms | 44 (28.2%) | 26 (56.5%) |
| 8 or more Rooms | 47 (30.1%) | 6 (13.0%) |
| Total | 156 (100.0%) | 46 (100.0%) |
Housing Structure by Heating Type in Bell Buckle
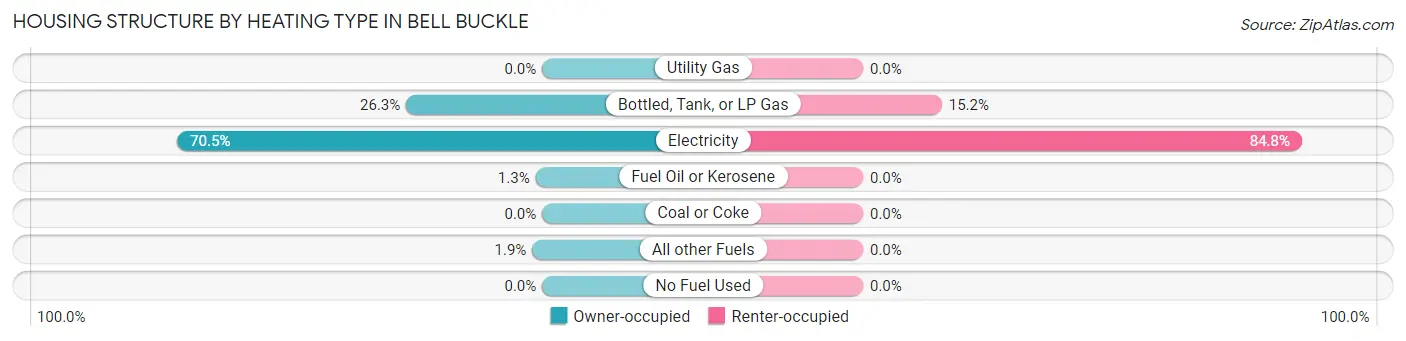
| Heating Type | Owner-occupied | Renter-occupied |
| Utility Gas | 0 (0.0%) | 0 (0.0%) |
| Bottled, Tank, or LP Gas | 41 (26.3%) | 7 (15.2%) |
| Electricity | 110 (70.5%) | 39 (84.8%) |
| Fuel Oil or Kerosene | 2 (1.3%) | 0 (0.0%) |
| Coal or Coke | 0 (0.0%) | 0 (0.0%) |
| All other Fuels | 3 (1.9%) | 0 (0.0%) |
| No Fuel Used | 0 (0.0%) | 0 (0.0%) |
| Total | 156 (100.0%) | 46 (100.0%) |
Household Vehicle Usage in Bell Buckle
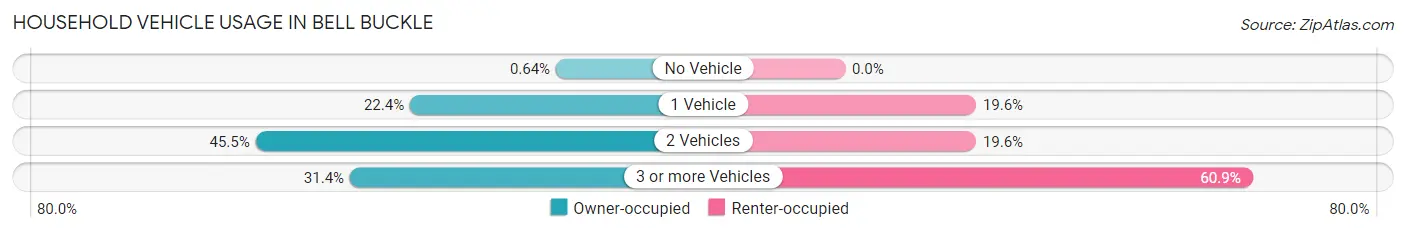
| Vehicles per Household | Owner-occupied | Renter-occupied |
| No Vehicle | 1 (0.6%) | 0 (0.0%) |
| 1 Vehicle | 35 (22.4%) | 9 (19.6%) |
| 2 Vehicles | 71 (45.5%) | 9 (19.6%) |
| 3 or more Vehicles | 49 (31.4%) | 28 (60.9%) |
| Total | 156 (100.0%) | 46 (100.0%) |
Real Estate & Mortgages in Bell Buckle
Real Estate and Mortgage Overview in Bell Buckle
| Characteristic | Without Mortgage | With Mortgage |
| Housing Units | 57 | 99 |
| Median Property Value | $211,700 | $269,400 |
| Median Household Income | $55,625 | $18 |
| Monthly Housing Costs | $507 | $7 |
| Real Estate Taxes | $1,226 | $3 |
Property Value by Mortgage Status in Bell Buckle
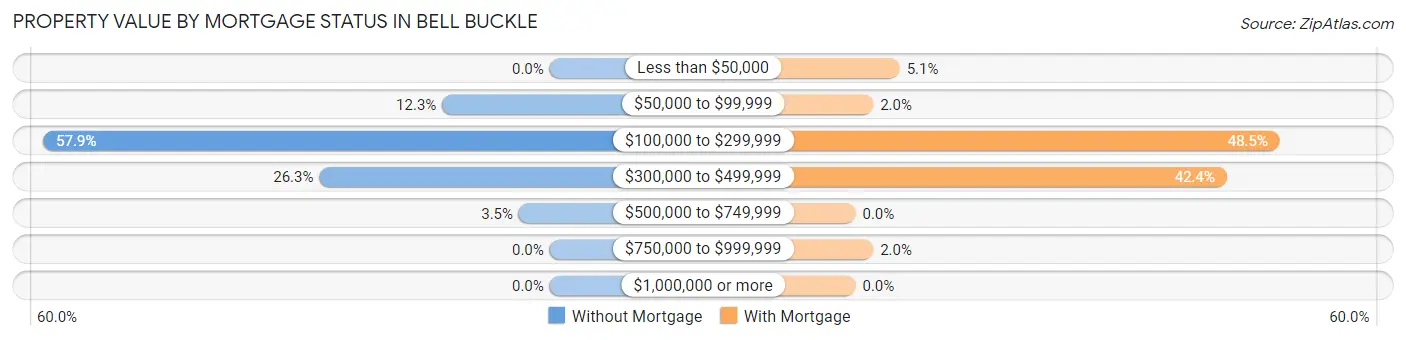
| Property Value | Without Mortgage | With Mortgage |
| Less than $50,000 | 0 (0.0%) | 5 (5.1%) |
| $50,000 to $99,999 | 7 (12.3%) | 2 (2.0%) |
| $100,000 to $299,999 | 33 (57.9%) | 48 (48.5%) |
| $300,000 to $499,999 | 15 (26.3%) | 42 (42.4%) |
| $500,000 to $749,999 | 2 (3.5%) | 0 (0.0%) |
| $750,000 to $999,999 | 0 (0.0%) | 2 (2.0%) |
| $1,000,000 or more | 0 (0.0%) | 0 (0.0%) |
| Total | 57 (100.0%) | 99 (100.0%) |
Household Income by Mortgage Status in Bell Buckle
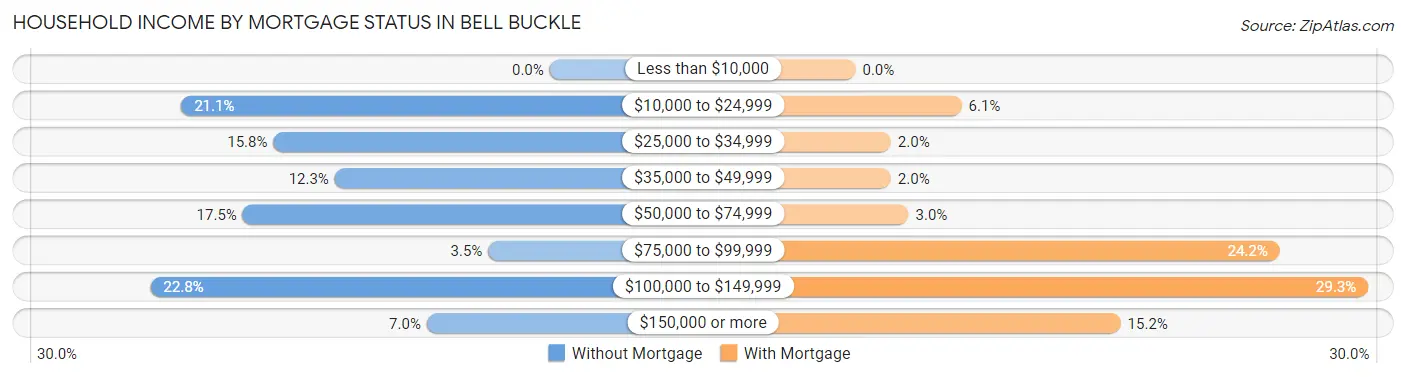
| Household Income | Without Mortgage | With Mortgage |
| Less than $10,000 | 0 (0.0%) | 0 (0.0%) |
| $10,000 to $24,999 | 12 (21.0%) | 6 (6.1%) |
| $25,000 to $34,999 | 9 (15.8%) | 2 (2.0%) |
| $35,000 to $49,999 | 7 (12.3%) | 2 (2.0%) |
| $50,000 to $74,999 | 10 (17.5%) | 3 (3.0%) |
| $75,000 to $99,999 | 2 (3.5%) | 24 (24.2%) |
| $100,000 to $149,999 | 13 (22.8%) | 29 (29.3%) |
| $150,000 or more | 4 (7.0%) | 15 (15.1%) |
| Total | 57 (100.0%) | 99 (100.0%) |
Property Value to Household Income Ratio in Bell Buckle
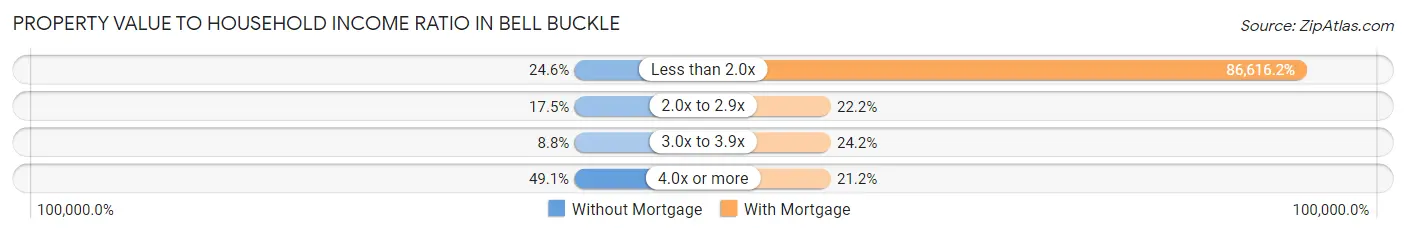
| Value-to-Income Ratio | Without Mortgage | With Mortgage |
| Less than 2.0x | 14 (24.6%) | 85,750 (86,616.2%) |
| 2.0x to 2.9x | 10 (17.5%) | 22 (22.2%) |
| 3.0x to 3.9x | 5 (8.8%) | 24 (24.2%) |
| 4.0x or more | 28 (49.1%) | 21 (21.2%) |
| Total | 57 (100.0%) | 99 (100.0%) |
Real Estate Taxes by Mortgage Status in Bell Buckle
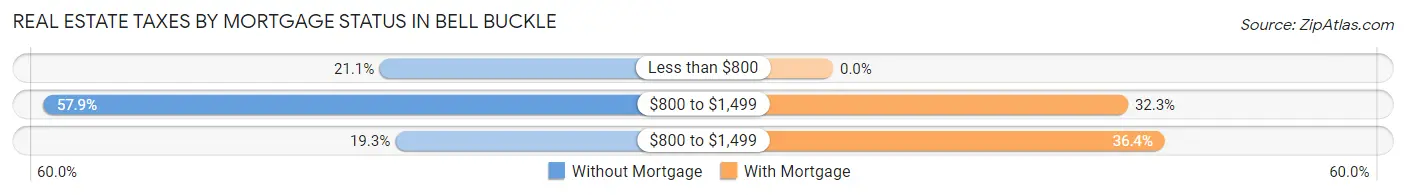
| Property Taxes | Without Mortgage | With Mortgage |
| Less than $800 | 12 (21.0%) | 0 (0.0%) |
| $800 to $1,499 | 33 (57.9%) | 32 (32.3%) |
| $800 to $1,499 | 11 (19.3%) | 36 (36.4%) |
| Total | 57 (100.0%) | 99 (100.0%) |
Health & Disability in Bell Buckle
Health Insurance Coverage by Age in Bell Buckle
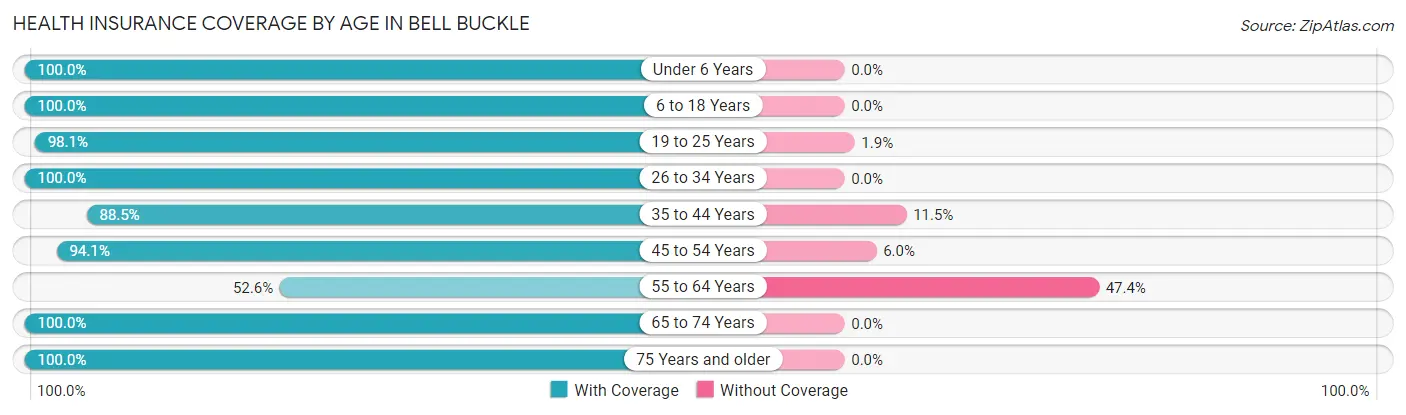
| Age Bracket | With Coverage | Without Coverage |
| Under 6 Years | 55 (100.0%) | 0 (0.0%) |
| 6 to 18 Years | 94 (100.0%) | 0 (0.0%) |
| 19 to 25 Years | 104 (98.1%) | 2 (1.9%) |
| 26 to 34 Years | 100 (100.0%) | 0 (0.0%) |
| 35 to 44 Years | 46 (88.5%) | 6 (11.5%) |
| 45 to 54 Years | 79 (94.1%) | 5 (5.9%) |
| 55 to 64 Years | 41 (52.6%) | 37 (47.4%) |
| 65 to 74 Years | 24 (100.0%) | 0 (0.0%) |
| 75 Years and older | 28 (100.0%) | 0 (0.0%) |
| Total | 571 (91.9%) | 50 (8.1%) |
Health Insurance Coverage by Citizenship Status in Bell Buckle
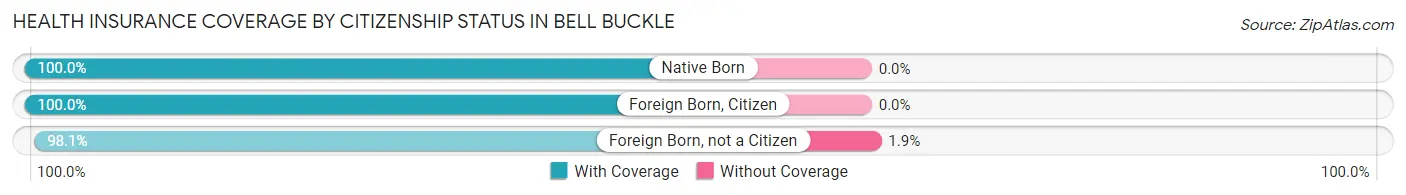
| Citizenship Status | With Coverage | Without Coverage |
| Native Born | 55 (100.0%) | 0 (0.0%) |
| Foreign Born, Citizen | 94 (100.0%) | 0 (0.0%) |
| Foreign Born, not a Citizen | 104 (98.1%) | 2 (1.9%) |
Health Insurance Coverage by Household Income in Bell Buckle
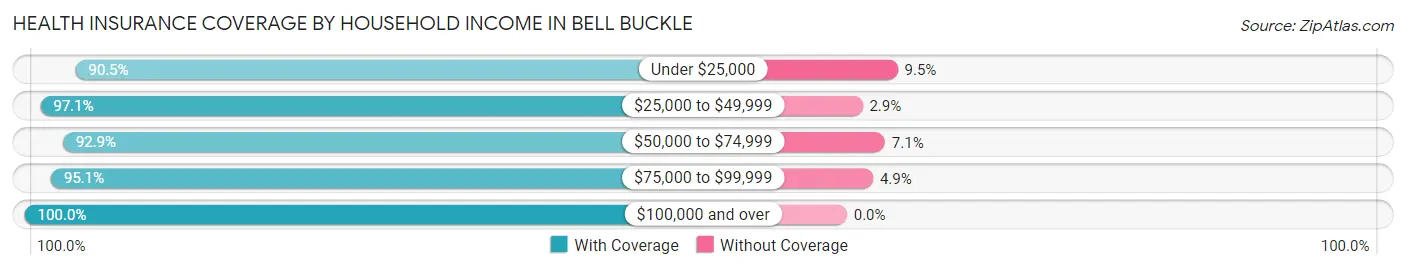
| Household Income | With Coverage | Without Coverage |
| Under $25,000 | 19 (90.5%) | 2 (9.5%) |
| $25,000 to $49,999 | 33 (97.1%) | 1 (2.9%) |
| $50,000 to $74,999 | 130 (92.9%) | 10 (7.1%) |
| $75,000 to $99,999 | 155 (95.1%) | 8 (4.9%) |
| $100,000 and over | 183 (100.0%) | 0 (0.0%) |
Public vs Private Health Insurance Coverage by Age in Bell Buckle
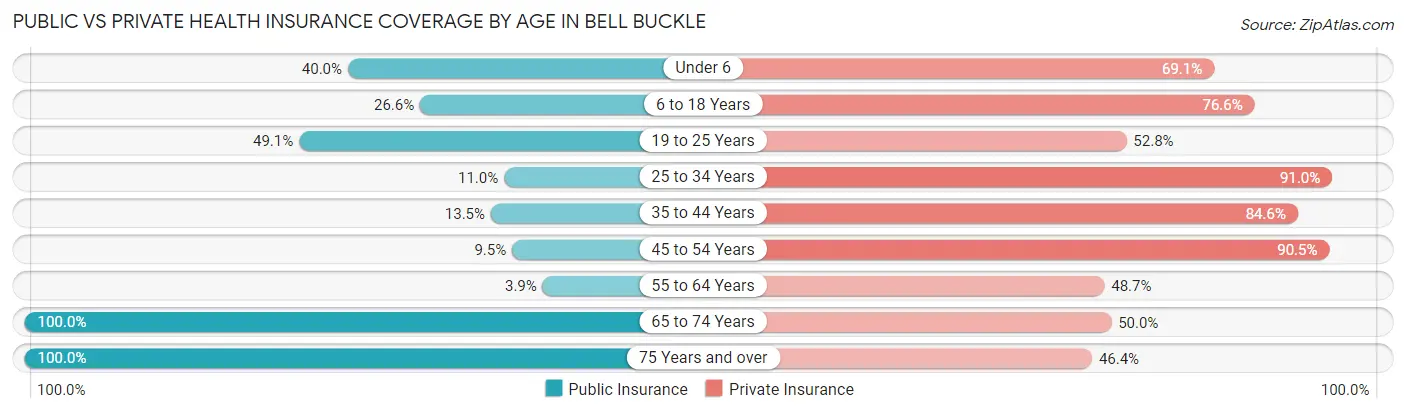
| Age Bracket | Public Insurance | Private Insurance |
| Under 6 | 22 (40.0%) | 38 (69.1%) |
| 6 to 18 Years | 25 (26.6%) | 72 (76.6%) |
| 19 to 25 Years | 52 (49.1%) | 56 (52.8%) |
| 25 to 34 Years | 11 (11.0%) | 91 (91.0%) |
| 35 to 44 Years | 7 (13.5%) | 44 (84.6%) |
| 45 to 54 Years | 8 (9.5%) | 76 (90.5%) |
| 55 to 64 Years | 3 (3.8%) | 38 (48.7%) |
| 65 to 74 Years | 24 (100.0%) | 12 (50.0%) |
| 75 Years and over | 28 (100.0%) | 13 (46.4%) |
| Total | 180 (29.0%) | 440 (70.9%) |
Disability Status by Sex by Age in Bell Buckle
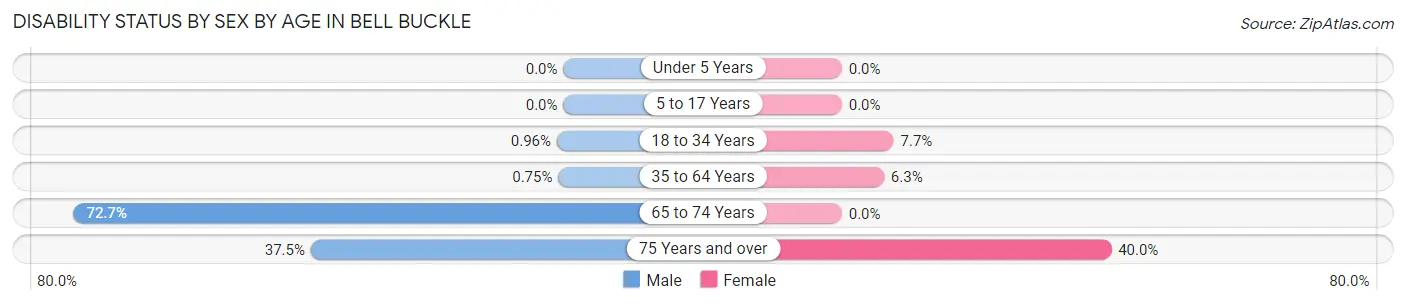
| Age Bracket | Male | Female |
| Under 5 Years | 0 (0.0%) | 0 (0.0%) |
| 5 to 17 Years | 0 (0.0%) | 0 (0.0%) |
| 18 to 34 Years | 1 (1.0%) | 9 (7.7%) |
| 35 to 64 Years | 1 (0.7%) | 5 (6.2%) |
| 65 to 74 Years | 8 (72.7%) | 0 (0.0%) |
| 75 Years and over | 3 (37.5%) | 8 (40.0%) |
Disability Class by Sex by Age in Bell Buckle
Disability Class: Hearing Difficulty
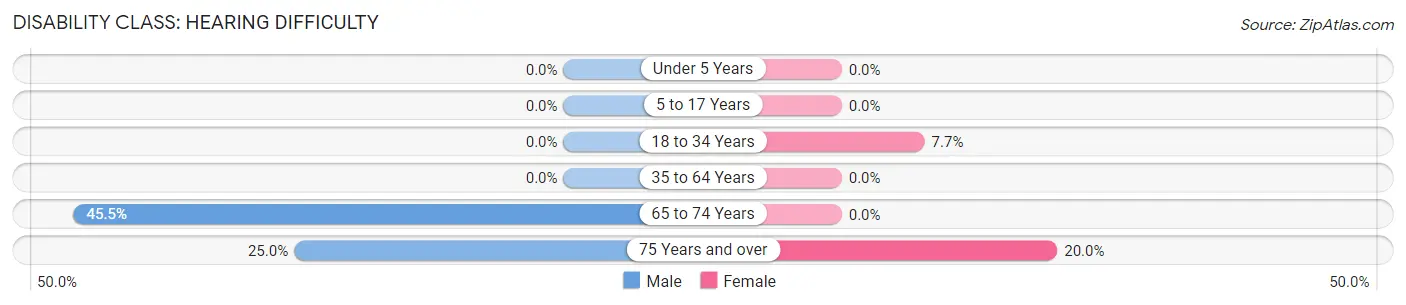
| Age Bracket | Male | Female |
| Under 5 Years | 0 (0.0%) | 0 (0.0%) |
| 5 to 17 Years | 0 (0.0%) | 0 (0.0%) |
| 18 to 34 Years | 0 (0.0%) | 9 (7.7%) |
| 35 to 64 Years | 0 (0.0%) | 0 (0.0%) |
| 65 to 74 Years | 5 (45.5%) | 0 (0.0%) |
| 75 Years and over | 2 (25.0%) | 4 (20.0%) |
Disability Class: Vision Difficulty
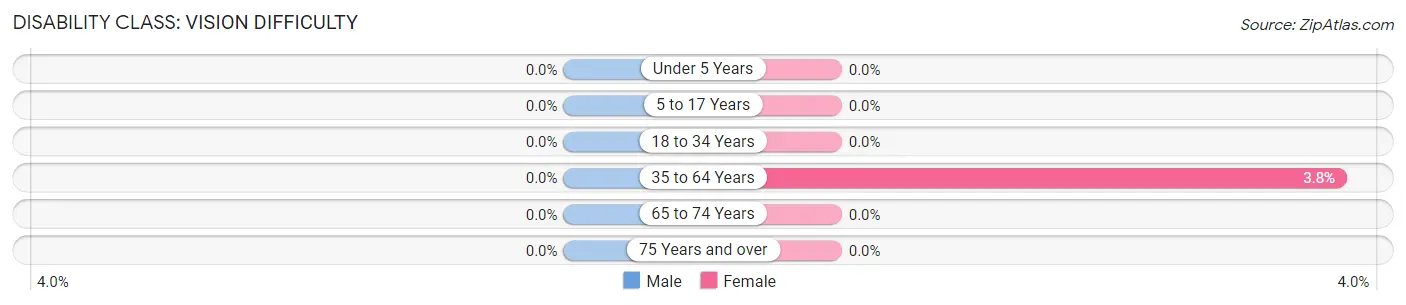
| Age Bracket | Male | Female |
| Under 5 Years | 0 (0.0%) | 0 (0.0%) |
| 5 to 17 Years | 0 (0.0%) | 0 (0.0%) |
| 18 to 34 Years | 0 (0.0%) | 0 (0.0%) |
| 35 to 64 Years | 0 (0.0%) | 3 (3.7%) |
| 65 to 74 Years | 0 (0.0%) | 0 (0.0%) |
| 75 Years and over | 0 (0.0%) | 0 (0.0%) |
Disability Class: Cognitive Difficulty
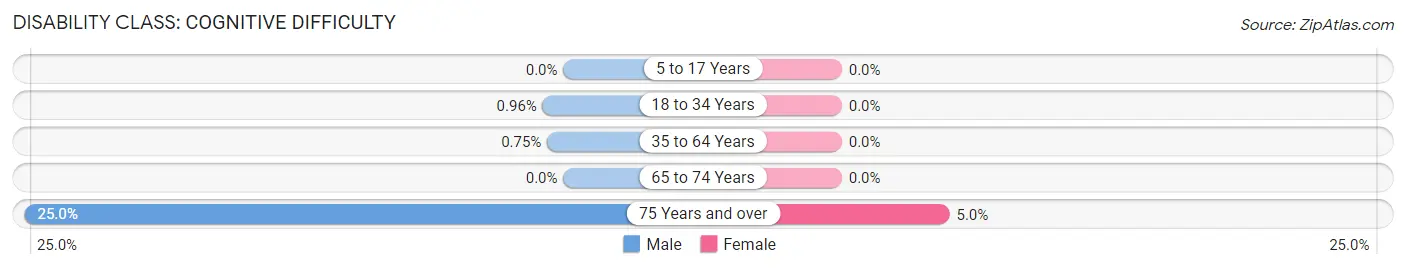
| Age Bracket | Male | Female |
| 5 to 17 Years | 0 (0.0%) | 0 (0.0%) |
| 18 to 34 Years | 1 (1.0%) | 0 (0.0%) |
| 35 to 64 Years | 1 (0.7%) | 0 (0.0%) |
| 65 to 74 Years | 0 (0.0%) | 0 (0.0%) |
| 75 Years and over | 2 (25.0%) | 1 (5.0%) |
Disability Class: Ambulatory Difficulty
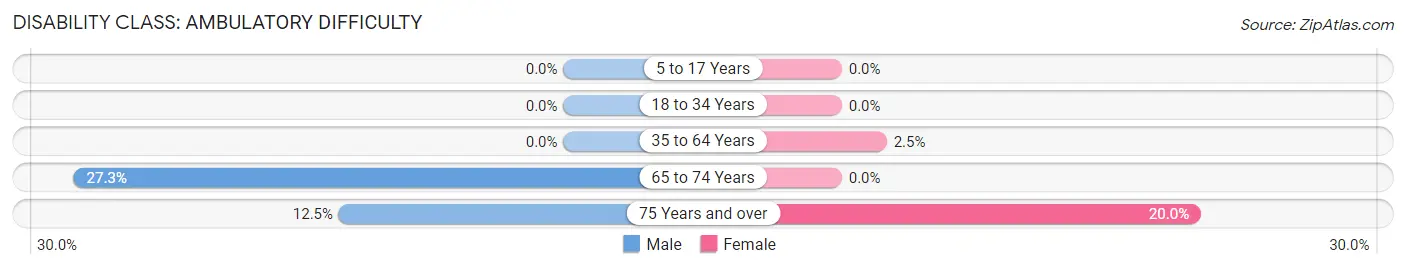
| Age Bracket | Male | Female |
| 5 to 17 Years | 0 (0.0%) | 0 (0.0%) |
| 18 to 34 Years | 0 (0.0%) | 0 (0.0%) |
| 35 to 64 Years | 0 (0.0%) | 2 (2.5%) |
| 65 to 74 Years | 3 (27.3%) | 0 (0.0%) |
| 75 Years and over | 1 (12.5%) | 4 (20.0%) |
Disability Class: Self-Care Difficulty
| Age Bracket | Male | Female |
| 5 to 17 Years | 0 (0.0%) | 0 (0.0%) |
| 18 to 34 Years | 0 (0.0%) | 0 (0.0%) |
| 35 to 64 Years | 0 (0.0%) | 0 (0.0%) |
| 65 to 74 Years | 0 (0.0%) | 0 (0.0%) |
| 75 Years and over | 0 (0.0%) | 0 (0.0%) |
Technology Access in Bell Buckle
Computing Device Access in Bell Buckle
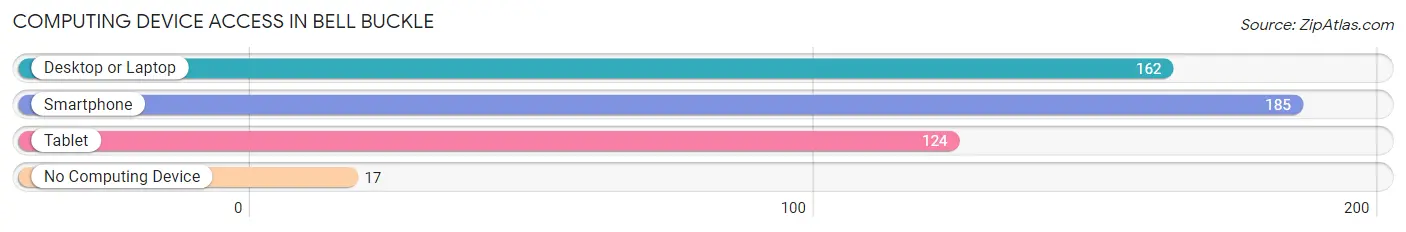
| Device Type | # Households | % Households |
| Desktop or Laptop | 162 | 80.2% |
| Smartphone | 185 | 91.6% |
| Tablet | 124 | 61.4% |
| No Computing Device | 17 | 8.4% |
| Total | 202 | 100.0% |
Internet Access in Bell Buckle
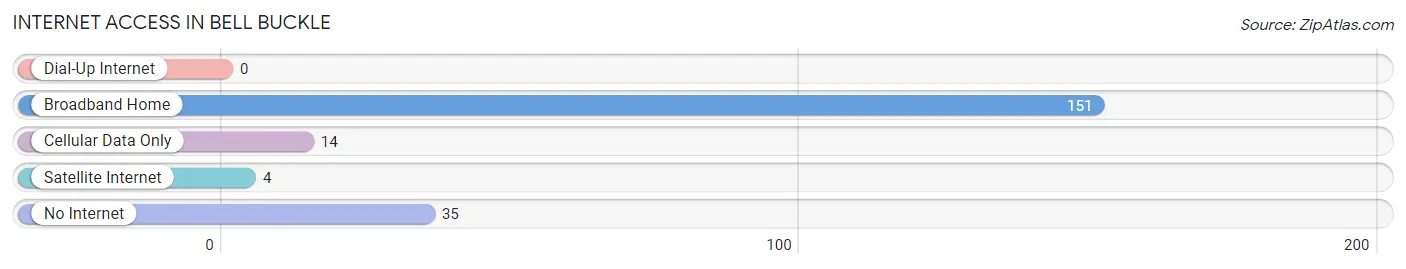
| Internet Type | # Households | % Households |
| Dial-Up Internet | 0 | 0.0% |
| Broadband Home | 151 | 74.8% |
| Cellular Data Only | 14 | 6.9% |
| Satellite Internet | 4 | 2.0% |
| No Internet | 35 | 17.3% |
| Total | 202 | 100.0% |
Bell Buckle Summary
History
The small town of Bell Buckle, Tennessee is located in the south-central part of the state, about an hour south of Nashville. It is part of the greater Nashville metropolitan area and is situated in the rolling hills of the Highland Rim. The town was founded in 1852 by William Bell, who named it after a nearby creek. The creek was named after a large rock that resembled a buckle, which was located near the creek.
The town was originally a farming community, but it soon became a center for the production of leather goods. The town was home to several tanneries, which produced leather for shoes, saddles, and other items. The town also had several mills, which produced flour, cornmeal, and other grains.
In the late 19th century, the town began to grow and prosper. The railroad arrived in 1887, and the town was incorporated in 1889. The town was home to several businesses, including a bank, a hotel, a newspaper, and a variety of stores.
In the early 20th century, the town continued to grow and prosper. The town was home to several churches, a library, and a variety of businesses. The town was also home to a number of schools, including a high school.
In the mid-20th century, the town began to decline. The tanneries and mills closed, and the railroad stopped running. The town was no longer a center of commerce, and many of the businesses closed. The population of the town began to decline, and by the late 20th century, the town was a small, quiet community.
Geography
Bell Buckle is located in the south-central part of Tennessee, about an hour south of Nashville. It is situated in the rolling hills of the Highland Rim. The town is located on the banks of the Duck River, which flows through the town. The town is surrounded by several small towns and rural areas.
The town has a total area of 1.2 square miles, all of which is land. The town is located at an elevation of 645 feet above sea level. The climate in the area is humid subtropical, with hot summers and mild winters.
Economy
The economy of Bell Buckle is largely based on agriculture and tourism. The town is home to several farms, which produce a variety of crops, including corn, soybeans, and wheat. The town is also home to several wineries, which produce a variety of wines.
The town is also home to several small businesses, including restaurants, antique stores, and gift shops. The town is also home to several bed and breakfasts, which attract tourists from around the region.
Demographics
As of the 2010 census, the population of Bell Buckle was 545. The population density was 454.3 people per square mile. The racial makeup of the town was 97.3% White, 0.7% African American, 0.2% Native American, 0.2% Asian, 0.2% from other races, and 1.4% from two or more races. Hispanic or Latino of any race were 0.7% of the population.
The median income for a household in the town was $37,500, and the median income for a family was $45,000. The per capita income for the town was $19,000. About 10.3% of families and 12.3% of the population were below the poverty line, including 16.7% of those under age 18 and 8.3% of those age 65 or over.
Common Questions
What is the Total Population of Bell Buckle?
Total Population of Bell Buckle is 621.
What is the Total Male Population of Bell Buckle?
Total Male Population of Bell Buckle is 321.
What is the Total Female Population of Bell Buckle?
Total Female Population of Bell Buckle is 300.
What is the Ratio of Males per 100 Females in Bell Buckle?
There are 107.00 Males per 100 Females in Bell Buckle.
What is the Ratio of Females per 100 Males in Bell Buckle?
There are 93.46 Females per 100 Males in Bell Buckle.
What is the Median Population Age in Bell Buckle?
Median Population Age in Bell Buckle is 31.4 Years.
What is the Average Family Size in Bell Buckle
Average Family Size in Bell Buckle is 3.0 People.
What is the Average Household Size in Bell Buckle
Average Household Size in Bell Buckle is 2.7 People.
What is Per Capita Income in Bell Buckle?
Per Capita income in Bell Buckle is $32,628.
What is the Median Family Income in Bell Buckle?
Median Family Income in Bell Buckle is $85,500.
What is the Median Household income in Bell Buckle?
Median Household Income in Bell Buckle is $78,750.
What is Income or Wage Gap in Bell Buckle?
Income or Wage Gap in Bell Buckle is 23.1%.
Women in Bell Buckle earn 76.9 cents for every dollar earned by a man.
What is Inequality or Gini Index in Bell Buckle?
Inequality or Gini Index in Bell Buckle is 0.35.
How Large is the Labor Force in Bell Buckle?
There are 394 People in the Labor Forcein in Bell Buckle.
What is the Percentage of People in the Labor Force in Bell Buckle?
79.3% of People are in the Labor Force in Bell Buckle.
What is the Unemployment Rate in Bell Buckle?
Unemployment Rate in Bell Buckle is 2.8%.