Red Bank, TN
Red Bank Map
Red Bank Overview
11,919
TOTAL POPULATION
5,695
MALE POPULATION
6,224
FEMALE POPULATION
91.50
MALES / 100 FEMALES
109.29
FEMALES / 100 MALES
37.4
MEDIAN AGE
2.7
AVG FAMILY SIZE
2.1
AVG HOUSEHOLD SIZE
$41,102
PER CAPITA INCOME
$81,577
AVG FAMILY INCOME
$59,027
AVG HOUSEHOLD INCOME
26.8%
WAGE / INCOME GAP [ % ]
73.2¢/ $1
WAGE / INCOME GAP [ $ ]
$12,194
FAMILY INCOME DEFICIT
0.47
INEQUALITY / GINI INDEX
7,387
LABOR FORCE [ PEOPLE ]
71.7%
PERCENT IN LABOR FORCE
3.4%
UNEMPLOYMENT RATE
Red Bank Area Codes
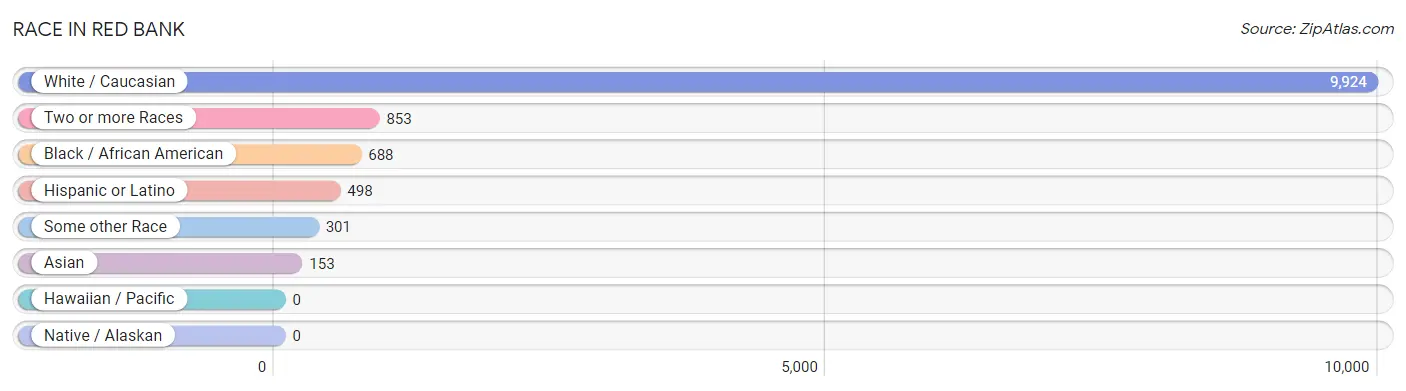
Race in Red Bank
The most populous races in Red Bank are White / Caucasian (9,924 | 83.3%), Two or more Races (853 | 7.2%), and Black / African American (688 | 5.8%).
| Race | # Population | % Population |
| Asian | 153 | 1.3% |
| Black / African American | 688 | 5.8% |
| Hawaiian / Pacific | 0 | 0.0% |
| Hispanic or Latino | 498 | 4.2% |
| Native / Alaskan | 0 | 0.0% |
| White / Caucasian | 9,924 | 83.3% |
| Two or more Races | 853 | 7.2% |
| Some other Race | 301 | 2.5% |
| Total | 11,919 | 100.0% |
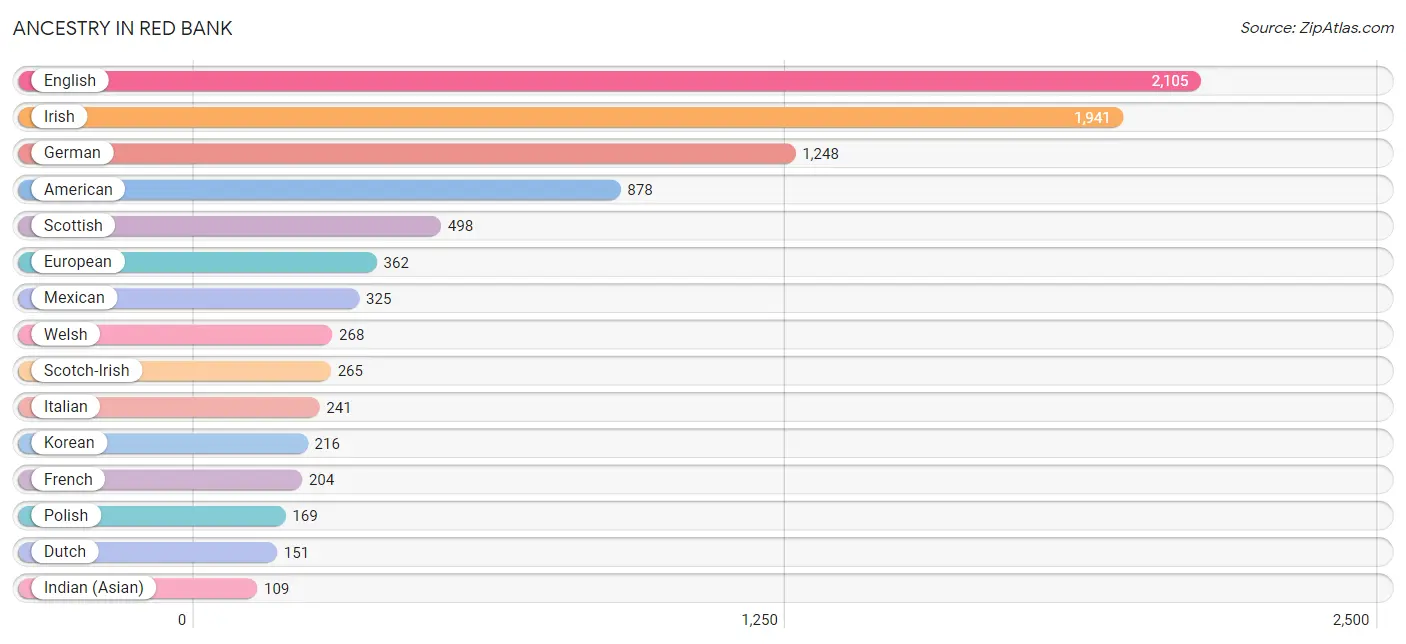
Ancestry in Red Bank
The most populous ancestries reported in Red Bank are English (2,105 | 17.7%), Irish (1,941 | 16.3%), German (1,248 | 10.5%), American (878 | 7.4%), and Scottish (498 | 4.2%), together accounting for 56.0% of all Red Bank residents.
| Ancestry | # Population | % Population |
| African | 31 | 0.3% |
| American | 878 | 7.4% |
| Arab | 23 | 0.2% |
| Austrian | 14 | 0.1% |
| Bhutanese | 82 | 0.7% |
| British | 93 | 0.8% |
| Burmese | 4 | 0.0% |
| Cambodian | 58 | 0.5% |
| Canadian | 20 | 0.2% |
| Central American | 43 | 0.4% |
| Cherokee | 13 | 0.1% |
| Croatian | 26 | 0.2% |
| Cuban | 61 | 0.5% |
| Czech | 32 | 0.3% |
| Danish | 19 | 0.2% |
| Dominican | 2 | 0.0% |
| Dutch | 151 | 1.3% |
| English | 2,105 | 17.7% |
| European | 362 | 3.0% |
| French | 204 | 1.7% |
| French American Indian | 3 | 0.0% |
| German | 1,248 | 10.5% |
| Honduran | 29 | 0.2% |
| Hungarian | 33 | 0.3% |
| Indian (Asian) | 109 | 0.9% |
| Iranian | 56 | 0.5% |
| Irish | 1,941 | 16.3% |
| Italian | 241 | 2.0% |
| Korean | 216 | 1.8% |
| Lebanese | 10 | 0.1% |
| Mexican | 325 | 2.7% |
| Nicaraguan | 14 | 0.1% |
| Northern European | 73 | 0.6% |
| Norwegian | 28 | 0.2% |
| Paraguayan | 3 | 0.0% |
| Pennsylvania German | 9 | 0.1% |
| Polish | 169 | 1.4% |
| Portuguese | 31 | 0.3% |
| Puerto Rican | 59 | 0.5% |
| Romanian | 23 | 0.2% |
| Russian | 5 | 0.0% |
| Scotch-Irish | 265 | 2.2% |
| Scottish | 498 | 4.2% |
| Slovak | 12 | 0.1% |
| Slovene | 27 | 0.2% |
| South American | 3 | 0.0% |
| Spanish | 5 | 0.0% |
| Subsaharan African | 50 | 0.4% |
| Sudanese | 19 | 0.2% |
| Swedish | 85 | 0.7% |
| Swiss | 21 | 0.2% |
| Syrian | 10 | 0.1% |
| Ukrainian | 16 | 0.1% |
| Welsh | 268 | 2.2% | View All 54 Rows |
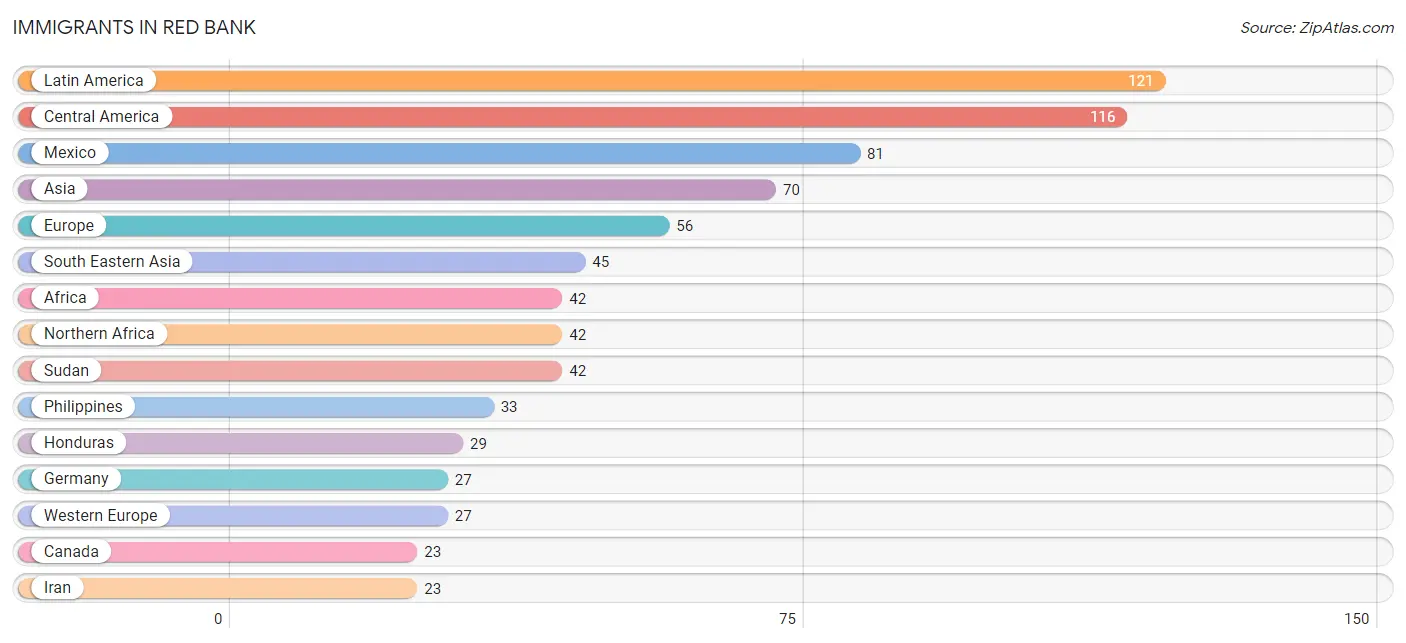
Immigrants in Red Bank
The most numerous immigrant groups reported in Red Bank came from Latin America (121 | 1.0%), Central America (116 | 1.0%), Mexico (81 | 0.7%), Asia (70 | 0.6%), and Europe (56 | 0.5%), together accounting for 3.7% of all Red Bank residents.
| Immigration Origin | # Population | % Population |
| Africa | 42 | 0.4% |
| Asia | 70 | 0.6% |
| Cambodia | 5 | 0.0% |
| Canada | 23 | 0.2% |
| Caribbean | 2 | 0.0% |
| Central America | 116 | 1.0% |
| Dominican Republic | 2 | 0.0% |
| Eastern Asia | 2 | 0.0% |
| Eastern Europe | 22 | 0.2% |
| El Salvador | 6 | 0.1% |
| England | 7 | 0.1% |
| Europe | 56 | 0.5% |
| Germany | 27 | 0.2% |
| Honduras | 29 | 0.2% |
| Iran | 23 | 0.2% |
| Japan | 2 | 0.0% |
| Latin America | 121 | 1.0% |
| Malaysia | 7 | 0.1% |
| Mexico | 81 | 0.7% |
| Northern Africa | 42 | 0.4% |
| Northern Europe | 7 | 0.1% |
| Philippines | 33 | 0.3% |
| Poland | 10 | 0.1% |
| Romania | 12 | 0.1% |
| South America | 3 | 0.0% |
| South Central Asia | 23 | 0.2% |
| South Eastern Asia | 45 | 0.4% |
| Sudan | 42 | 0.4% |
| Western Europe | 27 | 0.2% | View All 29 Rows |
Sex and Age in Red Bank
Sex and Age in Red Bank
The most populous age groups in Red Bank are 25 to 29 Years (712 | 12.5%) for men and 30 to 34 Years (673 | 10.8%) for women.
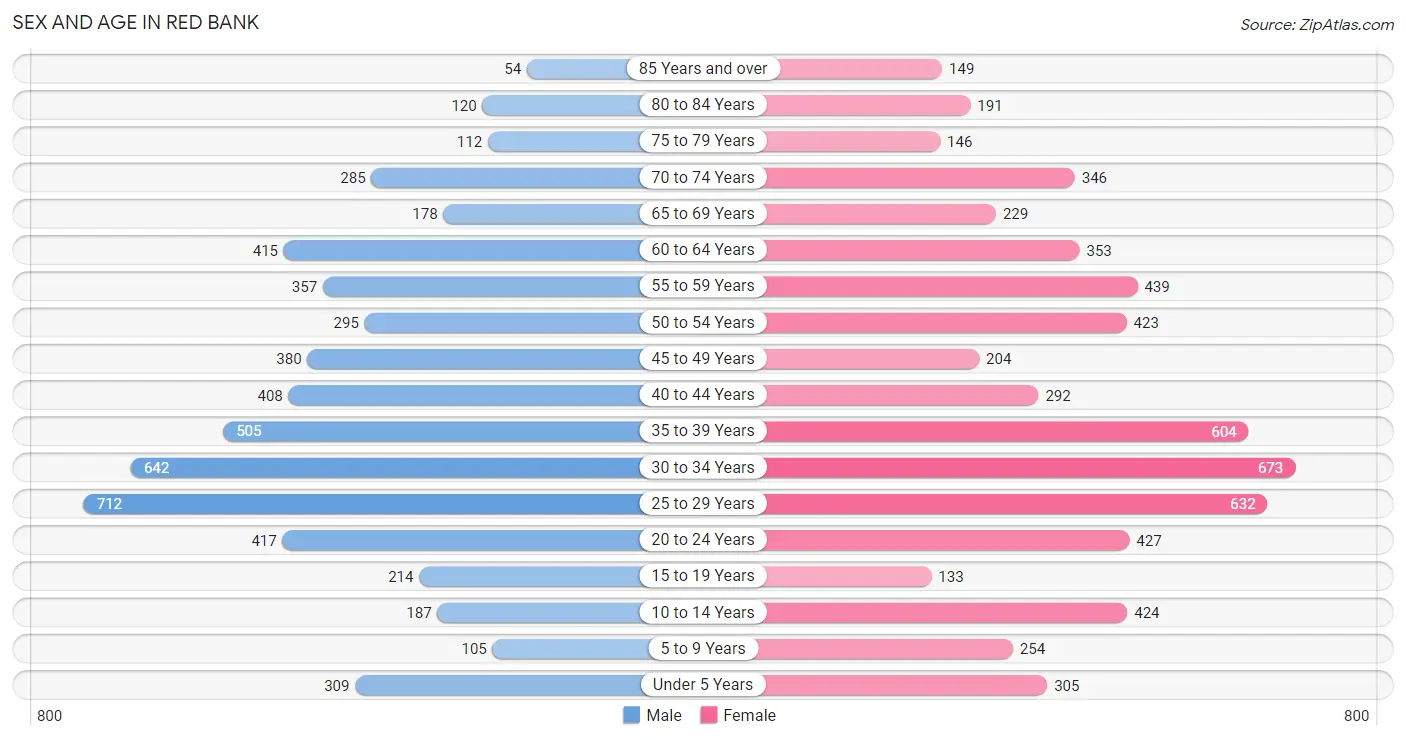
| Age Bracket | Male | Female |
| Under 5 Years | 309 (5.4%) | 305 (4.9%) |
| 5 to 9 Years | 105 (1.8%) | 254 (4.1%) |
| 10 to 14 Years | 187 (3.3%) | 424 (6.8%) |
| 15 to 19 Years | 214 (3.8%) | 133 (2.1%) |
| 20 to 24 Years | 417 (7.3%) | 427 (6.9%) |
| 25 to 29 Years | 712 (12.5%) | 632 (10.2%) |
| 30 to 34 Years | 642 (11.3%) | 673 (10.8%) |
| 35 to 39 Years | 505 (8.9%) | 604 (9.7%) |
| 40 to 44 Years | 408 (7.2%) | 292 (4.7%) |
| 45 to 49 Years | 380 (6.7%) | 204 (3.3%) |
| 50 to 54 Years | 295 (5.2%) | 423 (6.8%) |
| 55 to 59 Years | 357 (6.3%) | 439 (7.0%) |
| 60 to 64 Years | 415 (7.3%) | 353 (5.7%) |
| 65 to 69 Years | 178 (3.1%) | 229 (3.7%) |
| 70 to 74 Years | 285 (5.0%) | 346 (5.6%) |
| 75 to 79 Years | 112 (2.0%) | 146 (2.4%) |
| 80 to 84 Years | 120 (2.1%) | 191 (3.1%) |
| 85 Years and over | 54 (0.9%) | 149 (2.4%) |
| Total | 5,695 (100.0%) | 6,224 (100.0%) |
Families and Households in Red Bank
Median Family Size in Red Bank
The median family size in Red Bank is 2.70 persons per family, with married-couple families (1,913 | 68.2%) accounting for the largest median family size of 2.79 persons per family. On the other hand, single female/mother families (627 | 22.4%) represent the smallest median family size with 2.46 persons per family.
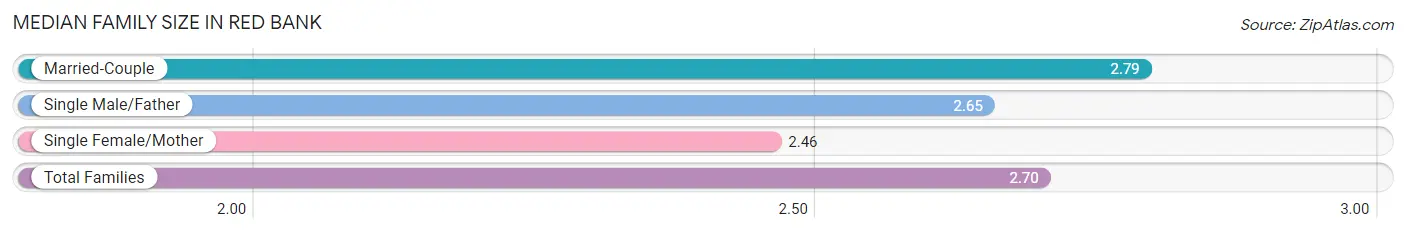
| Family Type | # Families | Family Size |
| Married-Couple | 1,913 (68.2%) | 2.79 |
| Single Male/Father | 263 (9.4%) | 2.65 |
| Single Female/Mother | 627 (22.4%) | 2.46 |
| Total Families | 2,803 (100.0%) | 2.70 |
Median Household Size in Red Bank
The median household size in Red Bank is 2.07 persons per household, with single male/father households (263 | 4.6%) accounting for the largest median household size of 3.17 persons per household. non-family households (2,947 | 51.2%) represent the smallest median household size with 1.38 persons per household.
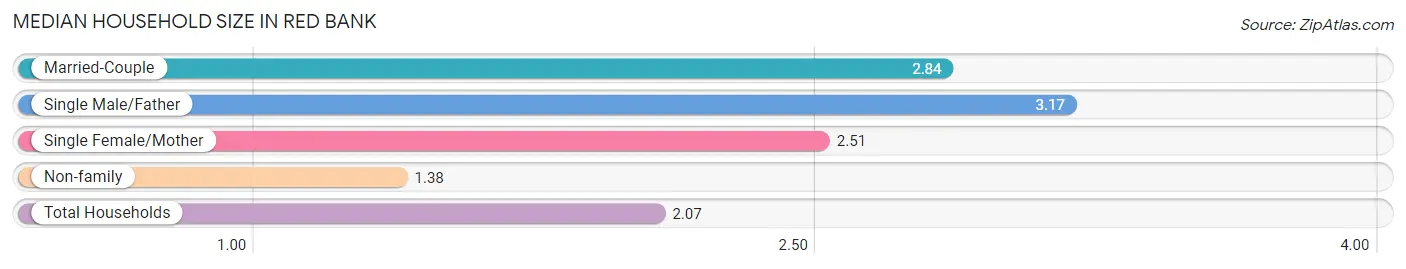
| Household Type | # Households | Household Size |
| Married-Couple | 1,913 (33.3%) | 2.84 |
| Single Male/Father | 263 (4.6%) | 3.17 |
| Single Female/Mother | 627 (10.9%) | 2.51 |
| Non-family | 2,947 (51.2%) | 1.38 |
| Total Households | 5,750 (100.0%) | 2.07 |
Household Size by Marriage Status in Red Bank
Out of a total of 5,750 households in Red Bank, 2,803 (48.7%) are family households, while 2,947 (51.2%) are nonfamily households. The most numerous type of family households are 2-person households, comprising 1,638, and the most common type of nonfamily households are 1-person households, comprising 2,249.
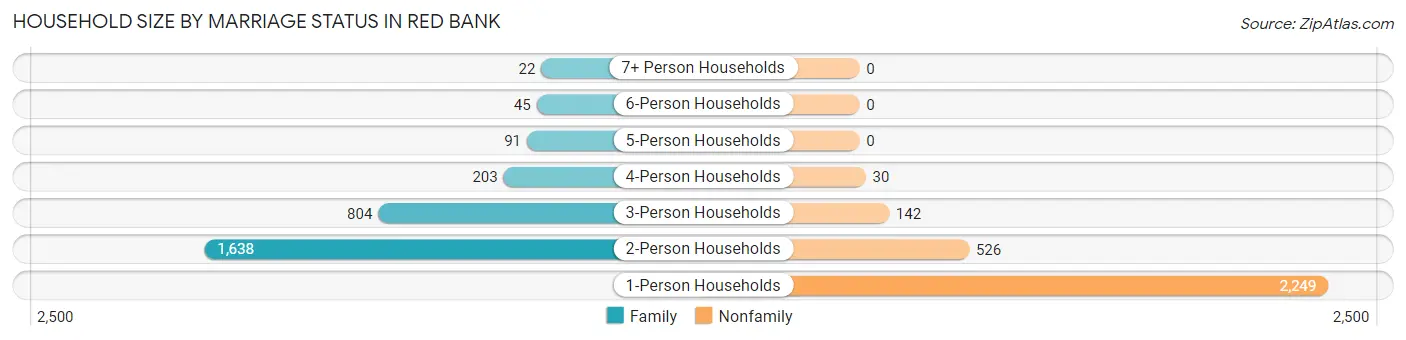
| Household Size | Family Households | Nonfamily Households |
| 1-Person Households | - | 2,249 (39.1%) |
| 2-Person Households | 1,638 (28.5%) | 526 (9.1%) |
| 3-Person Households | 804 (14.0%) | 142 (2.5%) |
| 4-Person Households | 203 (3.5%) | 30 (0.5%) |
| 5-Person Households | 91 (1.6%) | 0 (0.0%) |
| 6-Person Households | 45 (0.8%) | 0 (0.0%) |
| 7+ Person Households | 22 (0.4%) | 0 (0.0%) |
| Total | 2,803 (48.7%) | 2,947 (51.2%) |
Female Fertility in Red Bank
Fertility by Age in Red Bank
Average fertility rate in Red Bank is 33.0 births per 1,000 women. Women in the age bracket of 20 to 34 years have the highest fertility rate with 38.0 births per 1,000 women. Women in the age bracket of 20 to 34 years acount for 64.7% of all women with births.
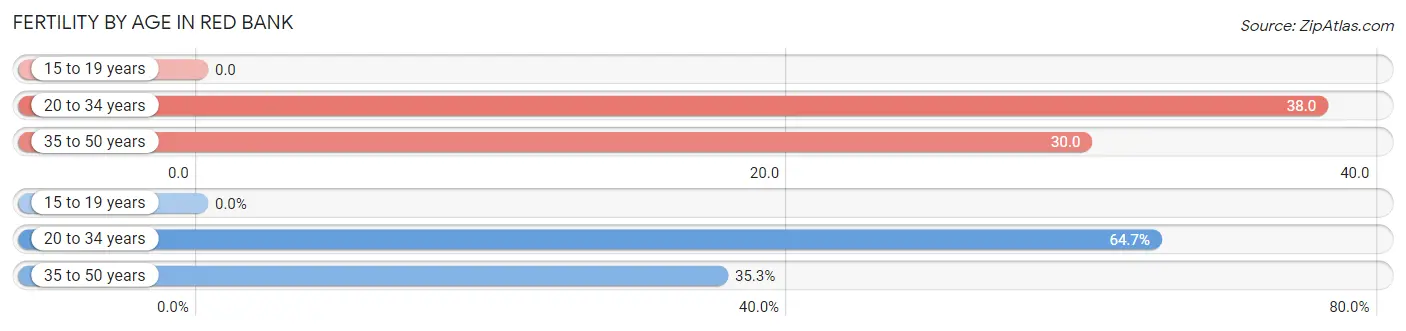
| Age Bracket | Women with Births | Births / 1,000 Women |
| 15 to 19 years | 0 (0.0%) | 0.0 |
| 20 to 34 years | 66 (64.7%) | 38.0 |
| 35 to 50 years | 36 (35.3%) | 30.0 |
| Total | 102 (100.0%) | 33.0 |
Fertility by Age by Marriage Status in Red Bank
96.1% of women with births (102) in Red Bank are married. The highest percentage of unmarried women with births falls into 20 to 34 years age bracket with 6.1% of them unmarried at the time of birth, while the lowest percentage of unmarried women with births belong to 35 to 50 years age bracket with 0.0% of them unmarried.
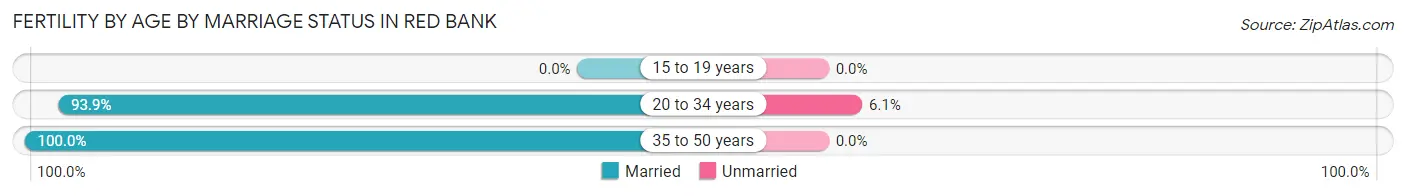
| Age Bracket | Married | Unmarried |
| 15 to 19 years | 0 (0.0%) | 0 (0.0%) |
| 20 to 34 years | 62 (93.9%) | 4 (6.1%) |
| 35 to 50 years | 36 (100.0%) | 0 (0.0%) |
| Total | 98 (96.1%) | 4 (3.9%) |
Fertility by Education in Red Bank
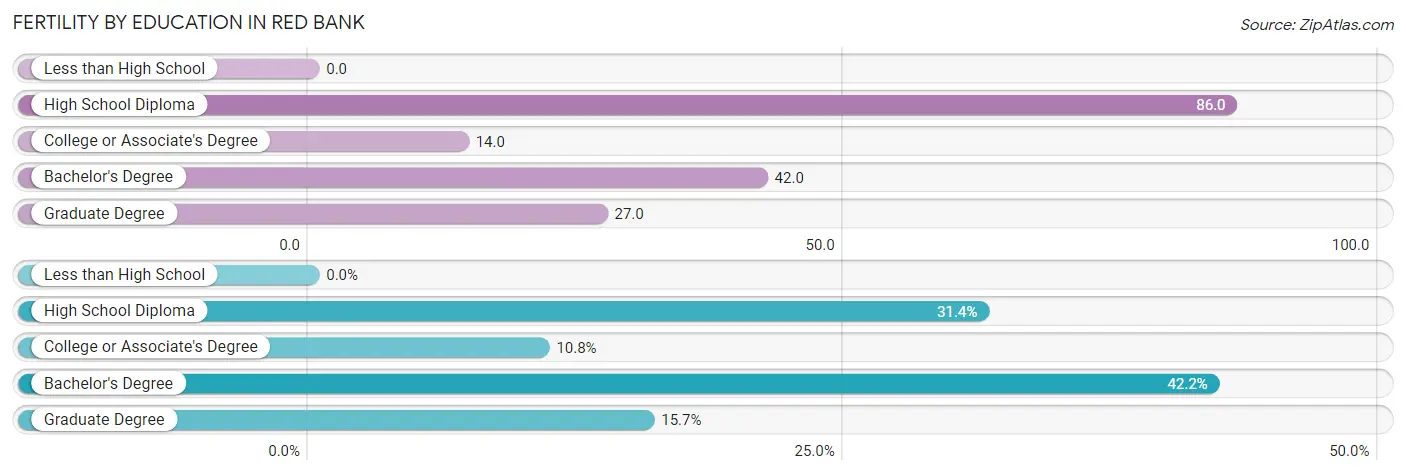
| Educational Attainment | Women with Births | Births / 1,000 Women |
| Less than High School | 0 (0.0%) | 0.0 |
| High School Diploma | 32 (31.4%) | 86.0 |
| College or Associate's Degree | 11 (10.8%) | 14.0 |
| Bachelor's Degree | 43 (42.2%) | 42.0 |
| Graduate Degree | 16 (15.7%) | 27.0 |
| Total | 102 (100.0%) | 33.0 |
Fertility by Education by Marriage Status in Red Bank
3.9% of women with births in Red Bank are unmarried. Women with the educational attainment of college or associate's degree are most likely to be married with 100.0% of them married at childbirth, while women with the educational attainment of high school diploma are least likely to be married with 12.5% of them unmarried at childbirth.
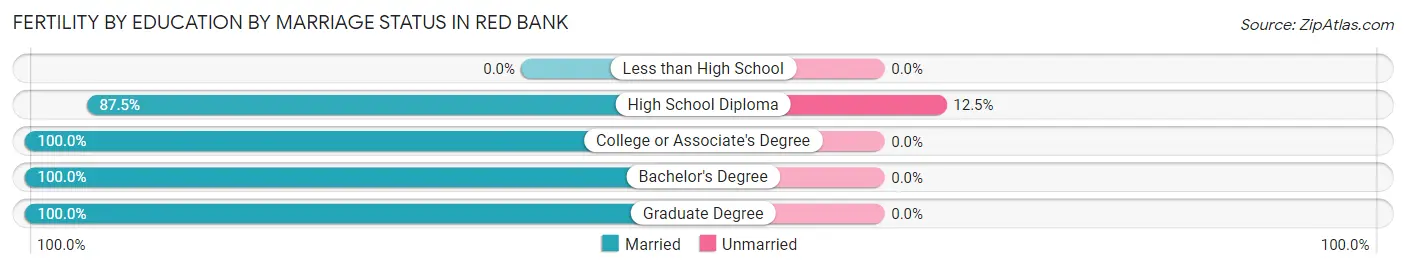
| Educational Attainment | Married | Unmarried |
| Less than High School | 0 (0.0%) | 0 (0.0%) |
| High School Diploma | 28 (87.5%) | 4 (12.5%) |
| College or Associate's Degree | 11 (100.0%) | 0 (0.0%) |
| Bachelor's Degree | 43 (100.0%) | 0 (0.0%) |
| Graduate Degree | 16 (100.0%) | 0 (0.0%) |
| Total | 98 (96.1%) | 4 (3.9%) |
Income in Red Bank
Income Overview in Red Bank
Per Capita Income in Red Bank is $41,102, while median incomes of families and households are $81,577 and $59,027 respectively.
| Characteristic | Number | Measure |
| Per Capita Income | 11,919 | $41,102 |
| Median Family Income | 2,803 | $81,577 |
| Mean Family Income | 2,803 | $101,990 |
| Median Household Income | 5,750 | $59,027 |
| Mean Household Income | 5,750 | $81,173 |
| Income Deficit | 2,803 | $12,194 |
| Wage / Income Gap (%) | 11,919 | 26.79% |
| Wage / Income Gap ($) | 11,919 | 73.21¢ per $1 |
| Gini / Inequality Index | 11,919 | 0.47 |
Earnings by Sex in Red Bank
Average Earnings in Red Bank are $38,041, $45,580 for men and $33,367 for women, a difference of 26.8%.
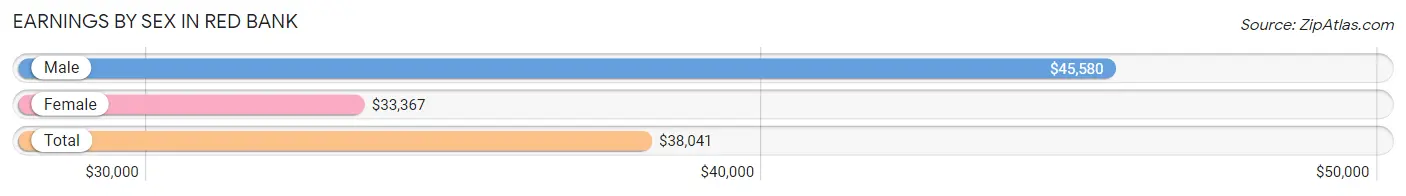
| Sex | Number | Average Earnings |
| Male | 3,955 (51.3%) | $45,580 |
| Female | 3,748 (48.7%) | $33,367 |
| Total | 7,703 (100.0%) | $38,041 |
Earnings by Sex by Income Bracket in Red Bank
The most common earnings brackets in Red Bank are $75,000 to $99,999 for men (485 | 12.3%) and $30,000 to $34,999 for women (379 | 10.1%).
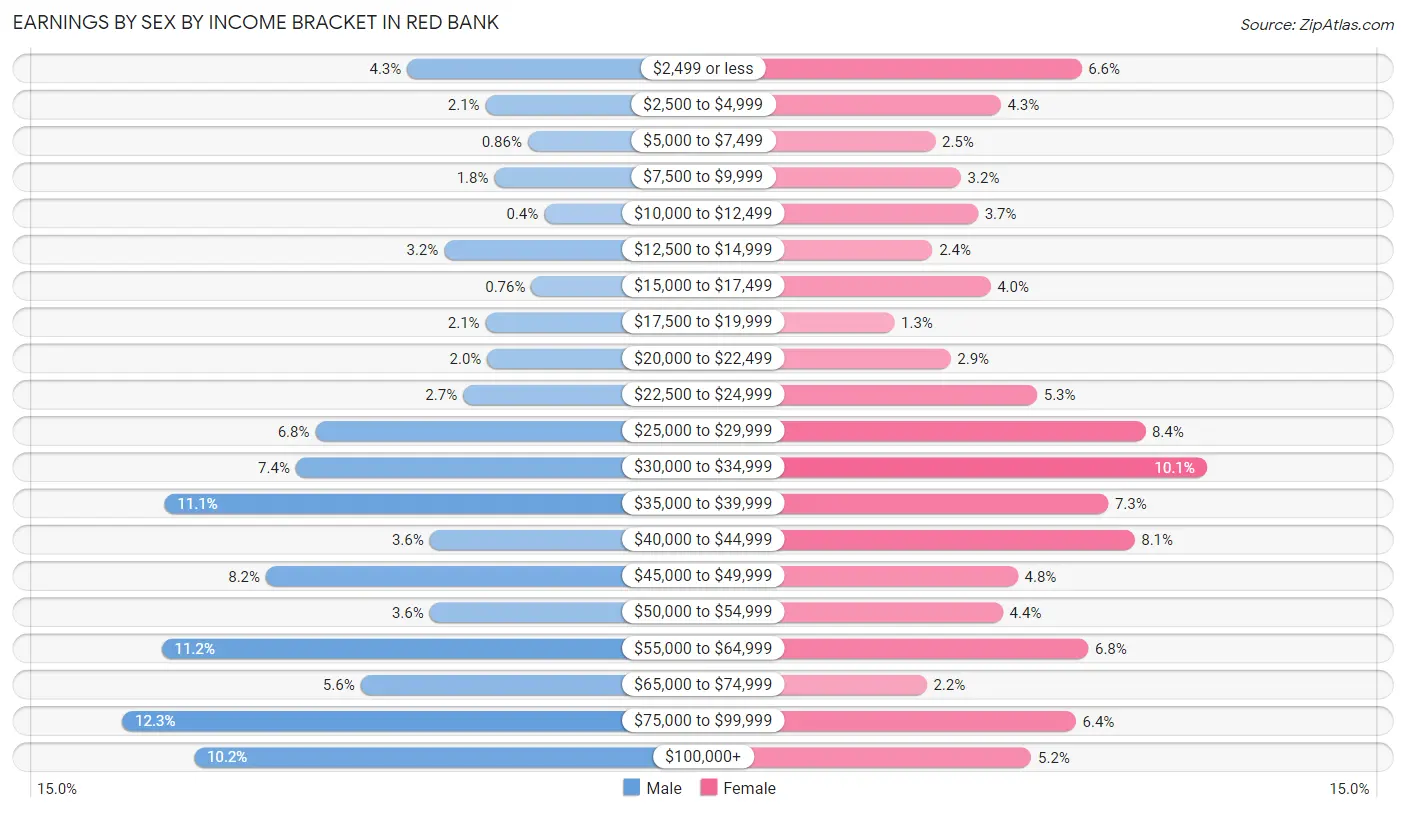
| Income | Male | Female |
| $2,499 or less | 168 (4.3%) | 247 (6.6%) |
| $2,500 to $4,999 | 81 (2.1%) | 162 (4.3%) |
| $5,000 to $7,499 | 34 (0.9%) | 93 (2.5%) |
| $7,500 to $9,999 | 71 (1.8%) | 120 (3.2%) |
| $10,000 to $12,499 | 16 (0.4%) | 138 (3.7%) |
| $12,500 to $14,999 | 127 (3.2%) | 90 (2.4%) |
| $15,000 to $17,499 | 30 (0.8%) | 151 (4.0%) |
| $17,500 to $19,999 | 81 (2.1%) | 50 (1.3%) |
| $20,000 to $22,499 | 79 (2.0%) | 109 (2.9%) |
| $22,500 to $24,999 | 106 (2.7%) | 200 (5.3%) |
| $25,000 to $29,999 | 270 (6.8%) | 314 (8.4%) |
| $30,000 to $34,999 | 292 (7.4%) | 379 (10.1%) |
| $35,000 to $39,999 | 438 (11.1%) | 275 (7.3%) |
| $40,000 to $44,999 | 143 (3.6%) | 303 (8.1%) |
| $45,000 to $49,999 | 325 (8.2%) | 180 (4.8%) |
| $50,000 to $54,999 | 143 (3.6%) | 164 (4.4%) |
| $55,000 to $64,999 | 441 (11.2%) | 254 (6.8%) |
| $65,000 to $74,999 | 220 (5.6%) | 84 (2.2%) |
| $75,000 to $99,999 | 485 (12.3%) | 241 (6.4%) |
| $100,000+ | 405 (10.2%) | 194 (5.2%) |
| Total | 3,955 (100.0%) | 3,748 (100.0%) |
Earnings by Sex by Educational Attainment in Red Bank
Average earnings in Red Bank are $48,948 for men and $34,709 for women, a difference of 29.1%. Men with an educational attainment of graduate degree enjoy the highest average annual earnings of $68,750, while those with less than high school education earn the least with $38,646. Women with an educational attainment of graduate degree earn the most with the average annual earnings of $56,577, while those with less than high school education have the smallest earnings of $16,585.
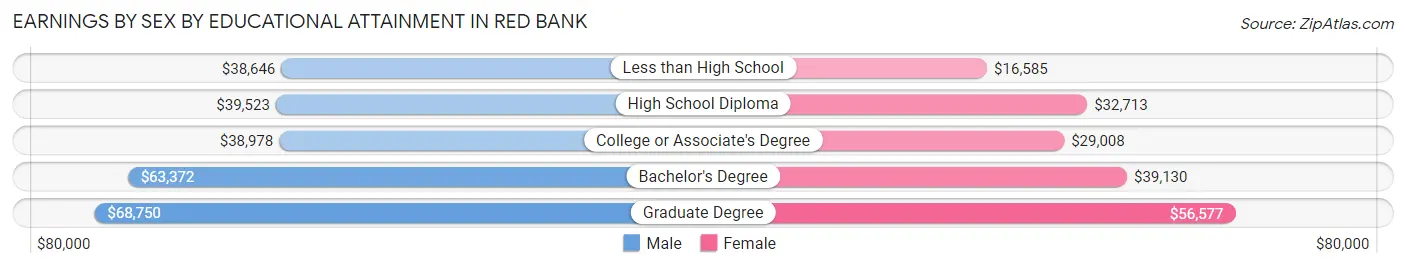
| Educational Attainment | Male Income | Female Income |
| Less than High School | $38,646 | $16,585 |
| High School Diploma | $39,523 | $32,713 |
| College or Associate's Degree | $38,978 | $29,008 |
| Bachelor's Degree | $63,372 | $39,130 |
| Graduate Degree | $68,750 | $56,577 |
| Total | $48,948 | $34,709 |
Family Income in Red Bank
Family Income Brackets in Red Bank
According to the Red Bank family income data, there are 580 families falling into the $100,000 to $149,999 income range, which is the most common income bracket and makes up 20.7% of all families. Conversely, the $10,000 to $14,999 income bracket is the least frequent group with only 17 families (0.6%) belonging to this category.
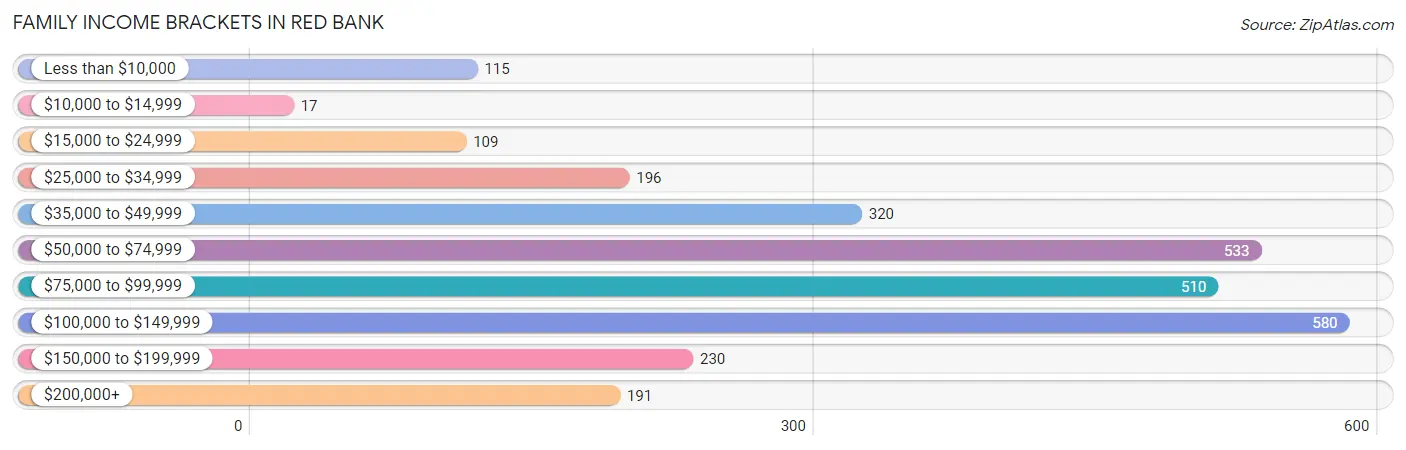
| Income Bracket | # Families | % Families |
| Less than $10,000 | 115 | 4.1% |
| $10,000 to $14,999 | 17 | 0.6% |
| $15,000 to $24,999 | 109 | 3.9% |
| $25,000 to $34,999 | 196 | 7.0% |
| $35,000 to $49,999 | 320 | 11.4% |
| $50,000 to $74,999 | 533 | 19.0% |
| $75,000 to $99,999 | 510 | 18.2% |
| $100,000 to $149,999 | 580 | 20.7% |
| $150,000 to $199,999 | 230 | 8.2% |
| $200,000+ | 191 | 6.8% |
Family Income by Famaliy Size in Red Bank
5-person families (42 | 1.5%) account for the highest median family income in Red Bank with $130,217 per family, while 2-person families (1,744 | 62.2%) have the highest median income of $40,804 per family member.

| Income Bracket | # Families | Median Income |
| 2-Person Families | 1,744 (62.2%) | $81,607 |
| 3-Person Families | 719 (25.7%) | $71,307 |
| 4-Person Families | 236 (8.4%) | $107,333 |
| 5-Person Families | 42 (1.5%) | $130,217 |
| 6-Person Families | 40 (1.4%) | $0 |
| 7+ Person Families | 22 (0.8%) | $0 |
| Total | 2,803 (100.0%) | $81,577 |
Family Income by Number of Earners in Red Bank
The median family income in Red Bank is $81,577, with families comprising 3+ earners (201) having the highest median family income of $180,515, while families with no earners (428) have the lowest median family income of $43,750, accounting for 7.2% and 15.3% of families, respectively.
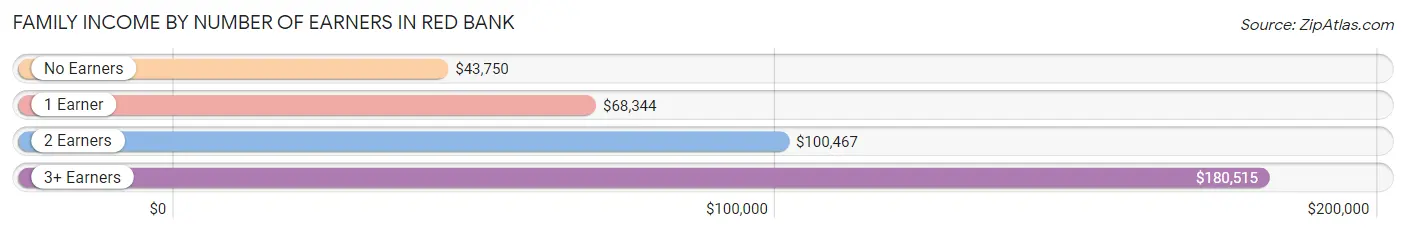
| Number of Earners | # Families | Median Income |
| No Earners | 428 (15.3%) | $43,750 |
| 1 Earner | 973 (34.7%) | $68,344 |
| 2 Earners | 1,201 (42.8%) | $100,467 |
| 3+ Earners | 201 (7.2%) | $180,515 |
| Total | 2,803 (100.0%) | $81,577 |
Household Income in Red Bank
Household Income Brackets in Red Bank
With 1,144 households falling in the category, the $50,000 to $74,999 income range is the most frequent in Red Bank, accounting for 19.9% of all households. In contrast, only 253 households (4.4%) fall into the less than $10,000 income bracket, making it the least populous group.
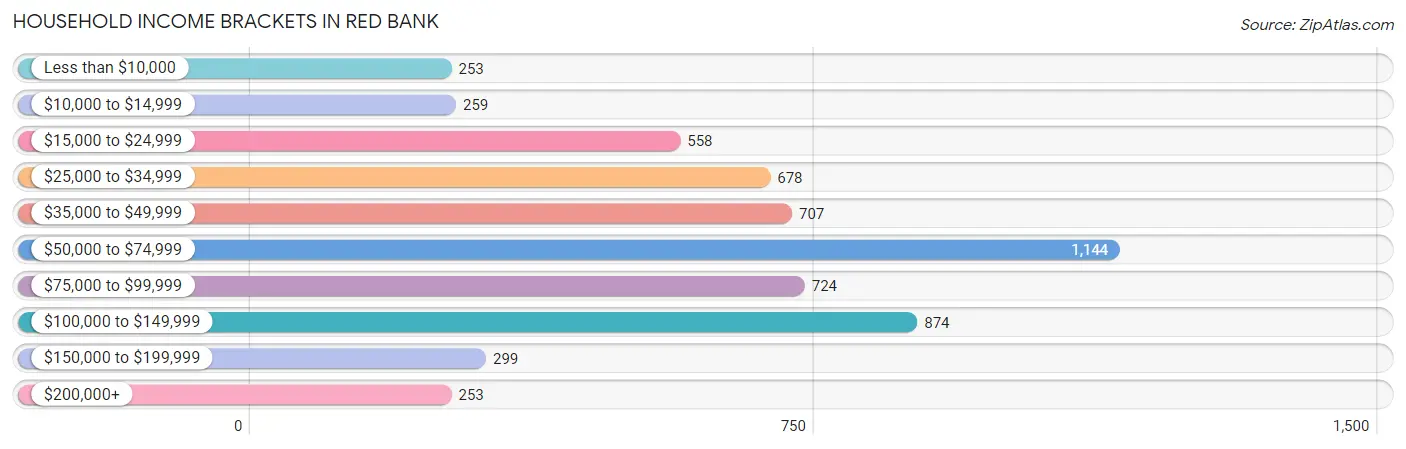
| Income Bracket | # Households | % Households |
| Less than $10,000 | 253 | 4.4% |
| $10,000 to $14,999 | 259 | 4.5% |
| $15,000 to $24,999 | 558 | 9.7% |
| $25,000 to $34,999 | 678 | 11.8% |
| $35,000 to $49,999 | 707 | 12.3% |
| $50,000 to $74,999 | 1,144 | 19.9% |
| $75,000 to $99,999 | 724 | 12.6% |
| $100,000 to $149,999 | 874 | 15.2% |
| $150,000 to $199,999 | 299 | 5.2% |
| $200,000+ | 253 | 4.4% |
Household Income by Householder Age in Red Bank
The median household income in Red Bank is $59,027, with the highest median household income of $67,318 found in the 45 to 64 years age bracket for the primary householder. A total of 1,782 households (31.0%) fall into this category. Meanwhile, the 15 to 24 years age bracket for the primary householder has the lowest median household income of $24,719, with 327 households (5.7%) in this group.
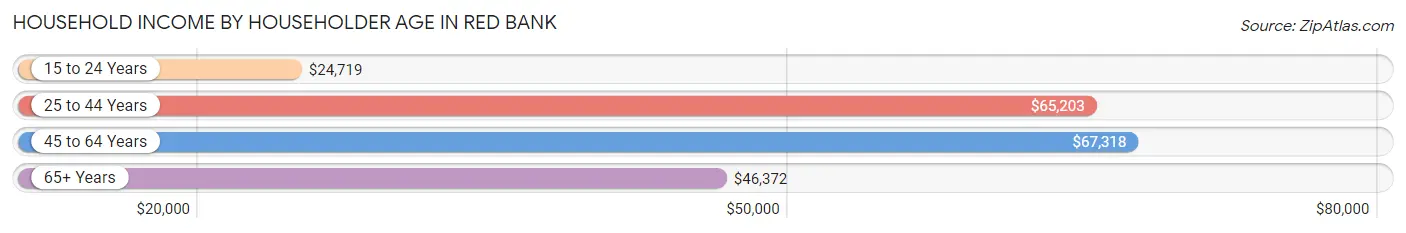
| Income Bracket | # Households | Median Income |
| 15 to 24 Years | 327 (5.7%) | $24,719 |
| 25 to 44 Years | 2,424 (42.2%) | $65,203 |
| 45 to 64 Years | 1,782 (31.0%) | $67,318 |
| 65+ Years | 1,217 (21.2%) | $46,372 |
| Total | 5,750 (100.0%) | $59,027 |
Poverty in Red Bank
Income Below Poverty by Sex and Age in Red Bank
With 9.6% poverty level for males and 15.6% for females among the residents of Red Bank, 15 year old males and 6 to 11 year old females are the most vulnerable to poverty, with 23 males (71.9%) and 134 females (41.9%) in their respective age groups living below the poverty level.
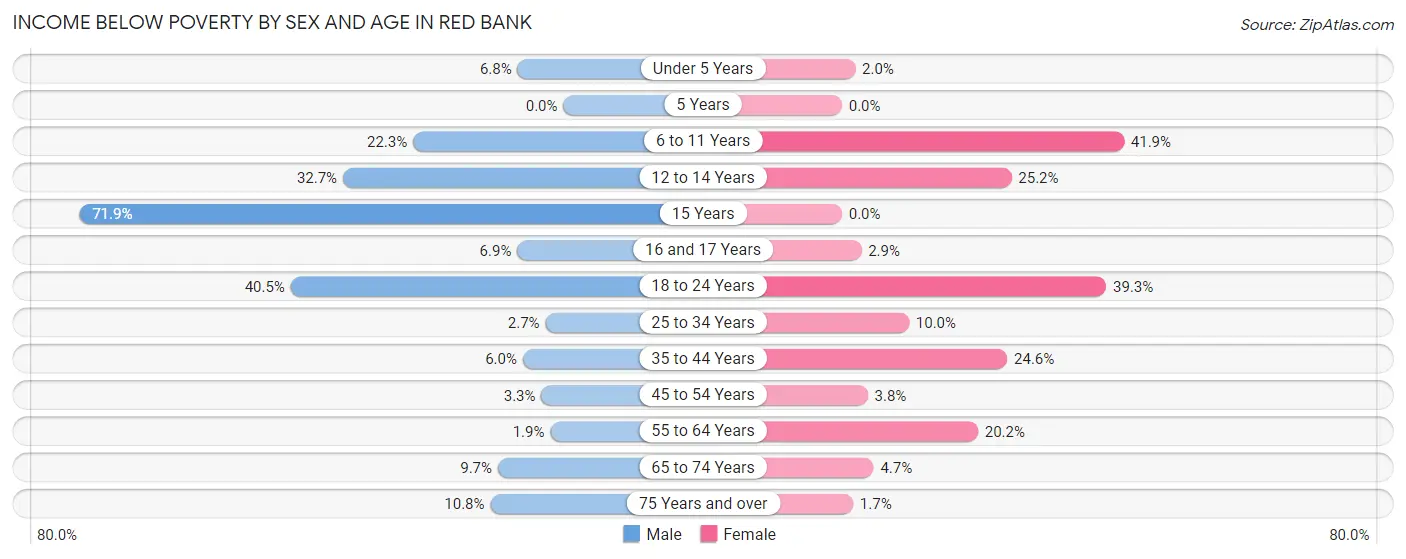
| Age Bracket | Male | Female |
| Under 5 Years | 21 (6.8%) | 6 (2.0%) |
| 5 Years | 0 (0.0%) | 0 (0.0%) |
| 6 to 11 Years | 25 (22.3%) | 134 (41.9%) |
| 12 to 14 Years | 54 (32.7%) | 71 (25.2%) |
| 15 Years | 23 (71.9%) | 0 (0.0%) |
| 16 and 17 Years | 5 (6.9%) | 3 (2.9%) |
| 18 to 24 Years | 213 (40.5%) | 179 (39.3%) |
| 25 to 34 Years | 36 (2.7%) | 130 (10.0%) |
| 35 to 44 Years | 55 (6.0%) | 220 (24.5%) |
| 45 to 54 Years | 22 (3.3%) | 24 (3.8%) |
| 55 to 64 Years | 15 (1.9%) | 160 (20.2%) |
| 65 to 74 Years | 45 (9.7%) | 27 (4.7%) |
| 75 Years and over | 31 (10.8%) | 8 (1.7%) |
| Total | 545 (9.6%) | 962 (15.6%) |
Income Above Poverty by Sex and Age in Red Bank
According to the poverty statistics in Red Bank, males aged 5 years and females aged 5 years are the age groups that are most secure financially, with 100.0% of males and 100.0% of females in these age groups living above the poverty line.
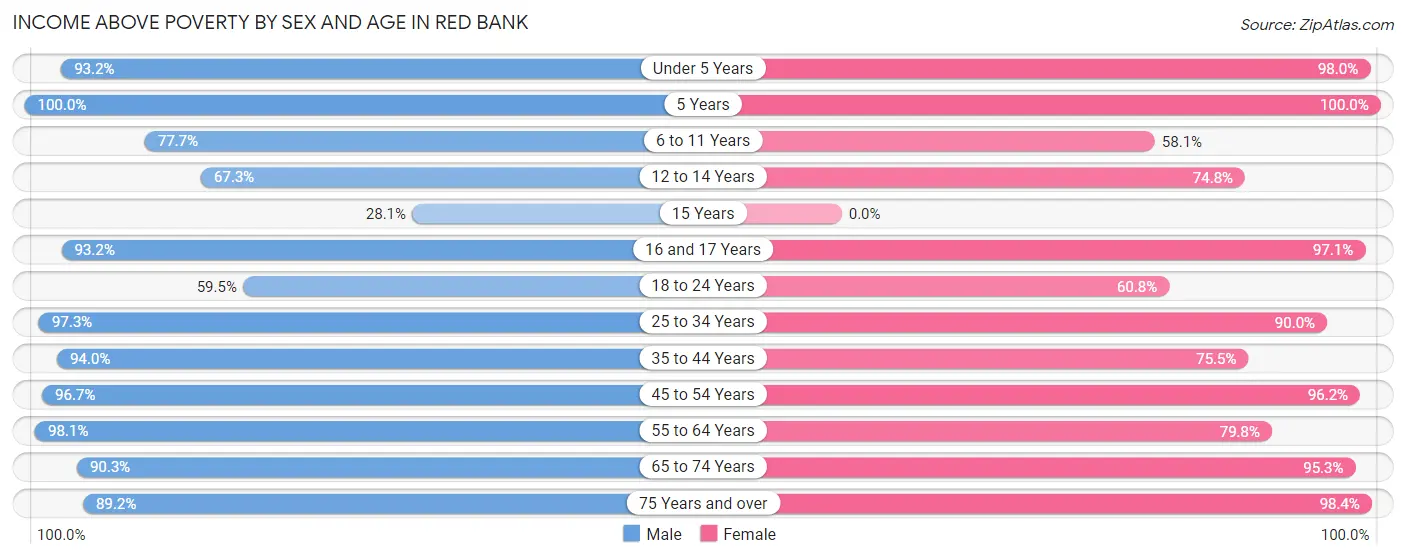
| Age Bracket | Male | Female |
| Under 5 Years | 288 (93.2%) | 299 (98.0%) |
| 5 Years | 15 (100.0%) | 16 (100.0%) |
| 6 to 11 Years | 87 (77.7%) | 186 (58.1%) |
| 12 to 14 Years | 111 (67.3%) | 211 (74.8%) |
| 15 Years | 9 (28.1%) | 0 (0.0%) |
| 16 and 17 Years | 68 (93.1%) | 101 (97.1%) |
| 18 to 24 Years | 313 (59.5%) | 277 (60.8%) |
| 25 to 34 Years | 1,318 (97.3%) | 1,175 (90.0%) |
| 35 to 44 Years | 858 (94.0%) | 676 (75.4%) |
| 45 to 54 Years | 653 (96.7%) | 603 (96.2%) |
| 55 to 64 Years | 757 (98.1%) | 632 (79.8%) |
| 65 to 74 Years | 418 (90.3%) | 548 (95.3%) |
| 75 Years and over | 255 (89.2%) | 478 (98.4%) |
| Total | 5,150 (90.4%) | 5,202 (84.4%) |
Income Below Poverty Among Married-Couple Families in Red Bank
The poverty statistics for married-couple families in Red Bank show that 2.2% or 42 of the total 1,913 families live below the poverty line. Families with no children have the highest poverty rate of 3.2%, comprising of 42 families. On the other hand, families with 1 or 2 children have the lowest poverty rate of 0.0%, which includes 0 families.
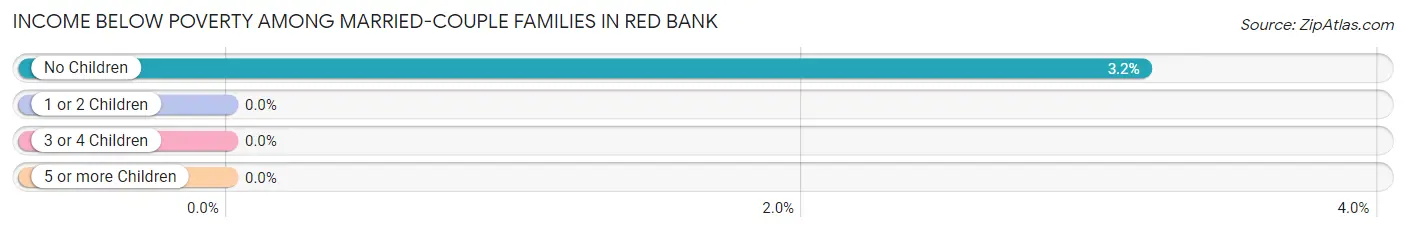
| Children | Above Poverty | Below Poverty |
| No Children | 1,277 (96.8%) | 42 (3.2%) |
| 1 or 2 Children | 518 (100.0%) | 0 (0.0%) |
| 3 or 4 Children | 76 (100.0%) | 0 (0.0%) |
| 5 or more Children | 0 (0.0%) | 0 (0.0%) |
| Total | 1,871 (97.8%) | 42 (2.2%) |
Income Below Poverty Among Single-Parent Households in Red Bank
According to the poverty data in Red Bank, 8.4% or 22 single-father households and 26.6% or 167 single-mother households are living below the poverty line. Among single-father households, those with 3 or 4 children have the highest poverty rate, with 6 households (100.0%) experiencing poverty. Likewise, among single-mother households, those with 1 or 2 children have the highest poverty rate, with 167 households (42.4%) falling below the poverty line.
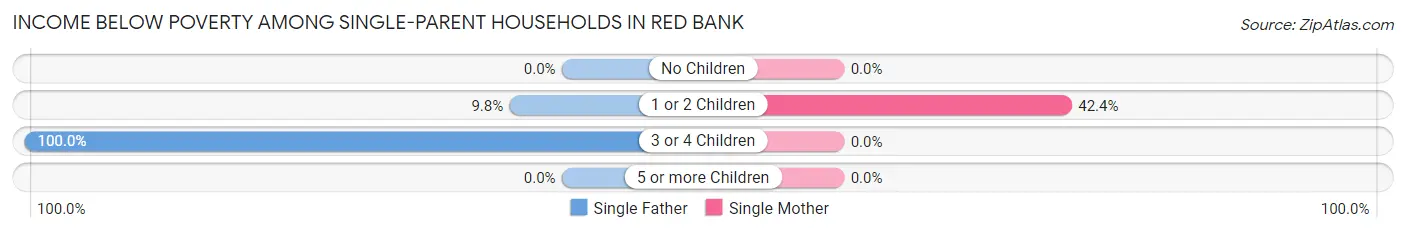
| Children | Single Father | Single Mother |
| No Children | 0 (0.0%) | 0 (0.0%) |
| 1 or 2 Children | 16 (9.8%) | 167 (42.4%) |
| 3 or 4 Children | 6 (100.0%) | 0 (0.0%) |
| 5 or more Children | 0 (0.0%) | 0 (0.0%) |
| Total | 22 (8.4%) | 167 (26.6%) |
Income Below Poverty Among Married-Couple vs Single-Parent Households in Red Bank
The poverty data for Red Bank shows that 42 of the married-couple family households (2.2%) and 189 of the single-parent households (21.2%) are living below the poverty level. Within the married-couple family households, those with no children have the highest poverty rate, with 42 households (3.2%) falling below the poverty line. Among the single-parent households, those with 3 or 4 children have the highest poverty rate, with 6 household (100.0%) living below poverty.
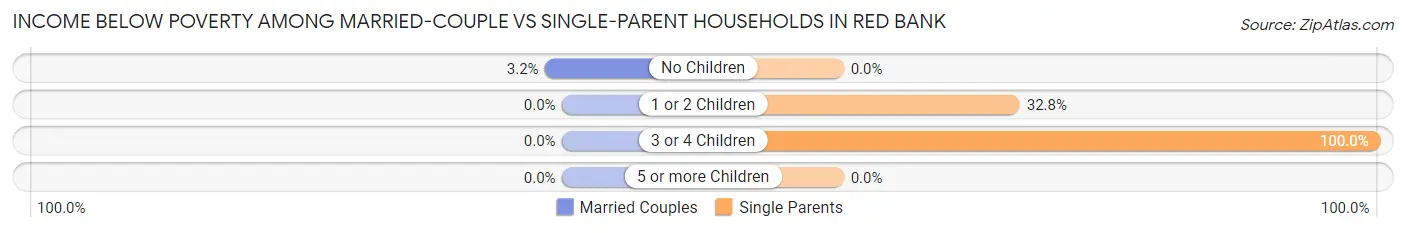
| Children | Married-Couple Families | Single-Parent Households |
| No Children | 42 (3.2%) | 0 (0.0%) |
| 1 or 2 Children | 0 (0.0%) | 183 (32.8%) |
| 3 or 4 Children | 0 (0.0%) | 6 (100.0%) |
| 5 or more Children | 0 (0.0%) | 0 (0.0%) |
| Total | 42 (2.2%) | 189 (21.2%) |
Employment Characteristics in Red Bank
Employment by Class of Employer in Red Bank
Among the 6,961 employed individuals in Red Bank, private company employees (4,847 | 69.6%), not-for-profit organizations (694 | 10.0%), and local government employees (461 | 6.6%) make up the most common classes of employment.
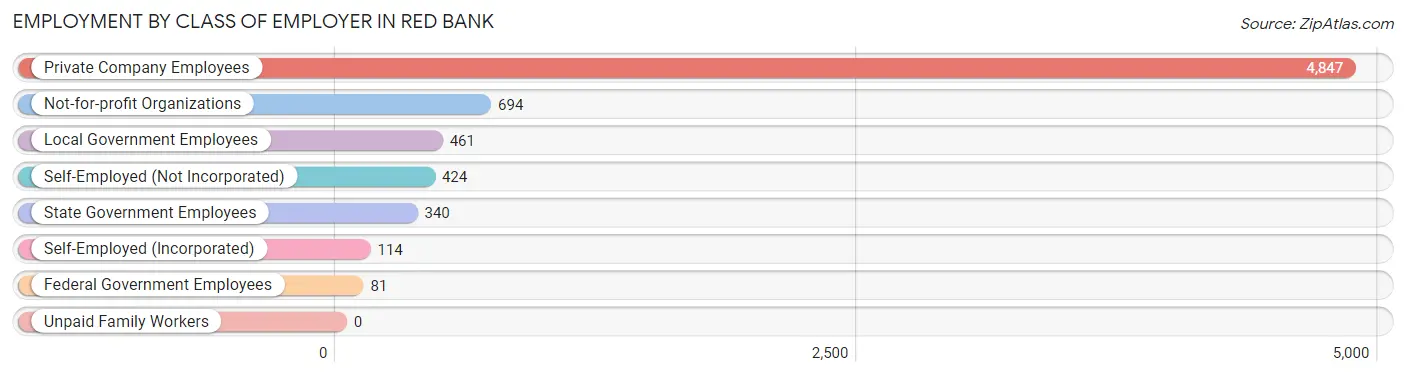
| Employer Class | # Employees | % Employees |
| Private Company Employees | 4,847 | 69.6% |
| Self-Employed (Incorporated) | 114 | 1.6% |
| Self-Employed (Not Incorporated) | 424 | 6.1% |
| Not-for-profit Organizations | 694 | 10.0% |
| Local Government Employees | 461 | 6.6% |
| State Government Employees | 340 | 4.9% |
| Federal Government Employees | 81 | 1.2% |
| Unpaid Family Workers | 0 | 0.0% |
| Total | 6,961 | 100.0% |
Employment Status by Age in Red Bank
According to the labor force statistics for Red Bank, out of the total population over 16 years of age (10,303), 71.7% or 7,387 individuals are in the labor force, with 3.4% or 251 of them unemployed. The age group with the highest labor force participation rate is 25 to 29 years, with 95.1% or 1,278 individuals in the labor force. Within the labor force, the 60 to 64 years age range has the highest percentage of unemployed individuals, with 11.2% or 55 of them being unemployed.
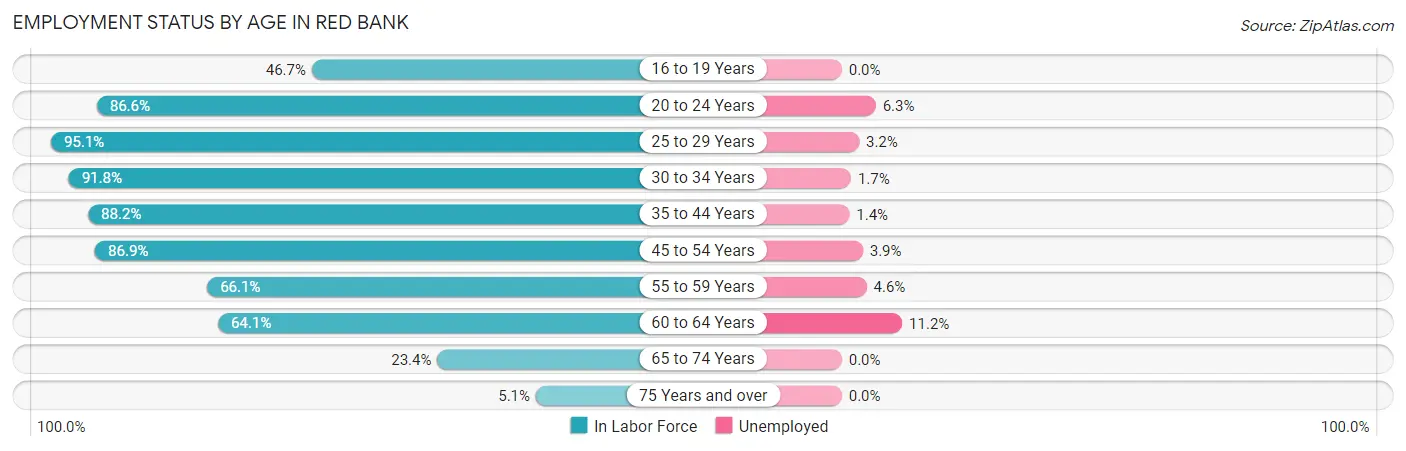
| Age Bracket | In Labor Force | Unemployed |
| 16 to 19 Years | 147 (46.7%) | 0 (0.0%) |
| 20 to 24 Years | 731 (86.6%) | 46 (6.3%) |
| 25 to 29 Years | 1,278 (95.1%) | 41 (3.2%) |
| 30 to 34 Years | 1,207 (91.8%) | 21 (1.7%) |
| 35 to 44 Years | 1,596 (88.2%) | 22 (1.4%) |
| 45 to 54 Years | 1,131 (86.9%) | 44 (3.9%) |
| 55 to 59 Years | 526 (66.1%) | 24 (4.6%) |
| 60 to 64 Years | 492 (64.1%) | 55 (11.2%) |
| 65 to 74 Years | 243 (23.4%) | 0 (0.0%) |
| 75 Years and over | 39 (5.1%) | 0 (0.0%) |
| Total | 7,387 (71.7%) | 251 (3.4%) |
Employment Status by Educational Attainment in Red Bank
According to labor force statistics for Red Bank, 84.9% of individuals (6,227) out of the total population between 25 and 64 years of age (7,334) are in the labor force, with 3.3% or 205 of them being unemployed. The group with the highest labor force participation rate are those with the educational attainment of bachelor's degree or higher, with 92.4% or 2,927 individuals in the labor force. Within the labor force, individuals with college / associate degree education have the highest percentage of unemployment, with 4.2% or 78 of them being unemployed.
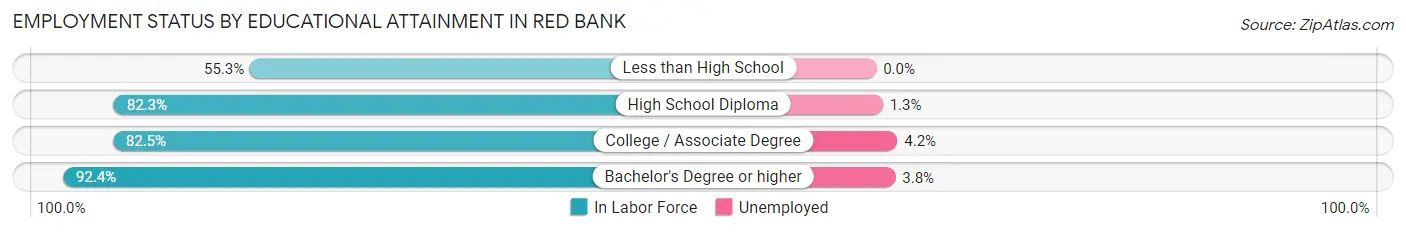
| Educational Attainment | In Labor Force | Unemployed |
| Less than High School | 270 (55.3%) | 0 (0.0%) |
| High School Diploma | 1,165 (82.3%) | 18 (1.3%) |
| College / Associate Degree | 1,866 (82.5%) | 95 (4.2%) |
| Bachelor's Degree or higher | 2,927 (92.4%) | 120 (3.8%) |
| Total | 6,227 (84.9%) | 242 (3.3%) |
Employment Occupations by Sex in Red Bank
Management, Business, Science and Arts Occupations
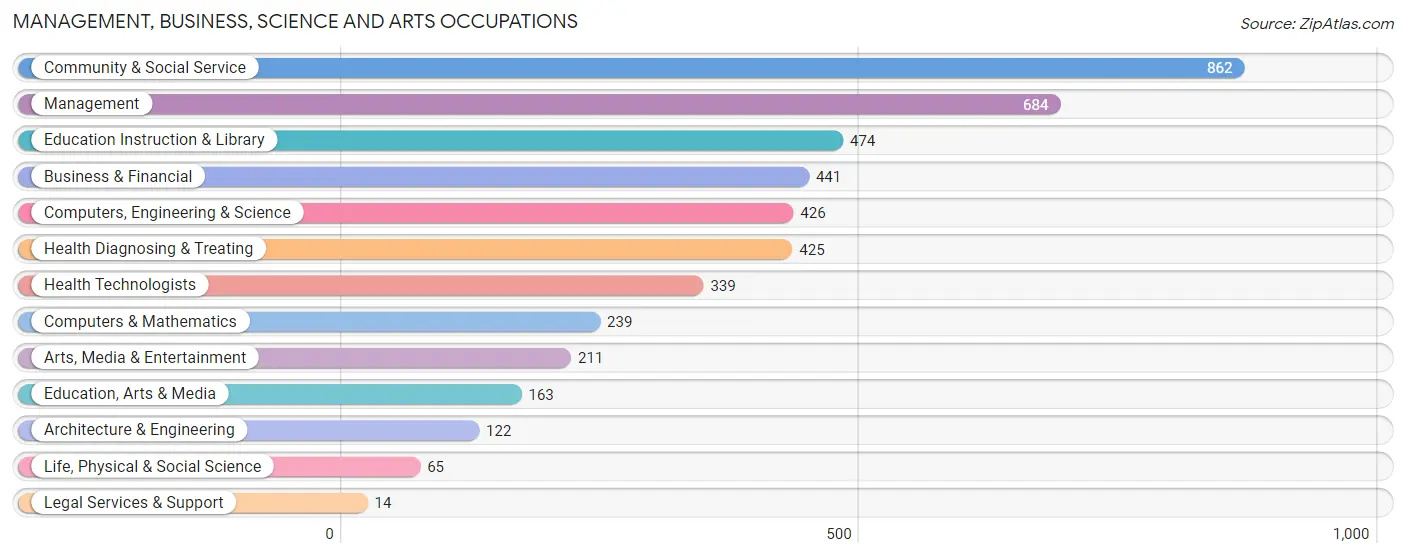
The most common Management, Business, Science and Arts occupations in Red Bank are Community & Social Service (862 | 12.1%), Management (684 | 9.6%), Education Instruction & Library (474 | 6.7%), Business & Financial (441 | 6.2%), and Computers, Engineering & Science (426 | 6.0%).
Management, Business, Science and Arts Occupations by Sex
Within the Management, Business, Science and Arts occupations in Red Bank, the most male-oriented occupations are Architecture & Engineering (86.9%), Computers & Mathematics (83.7%), and Computers, Engineering & Science (83.6%), while the most female-oriented occupations are Legal Services & Support (100.0%), Education Instruction & Library (82.1%), and Health Diagnosing & Treating (75.1%).
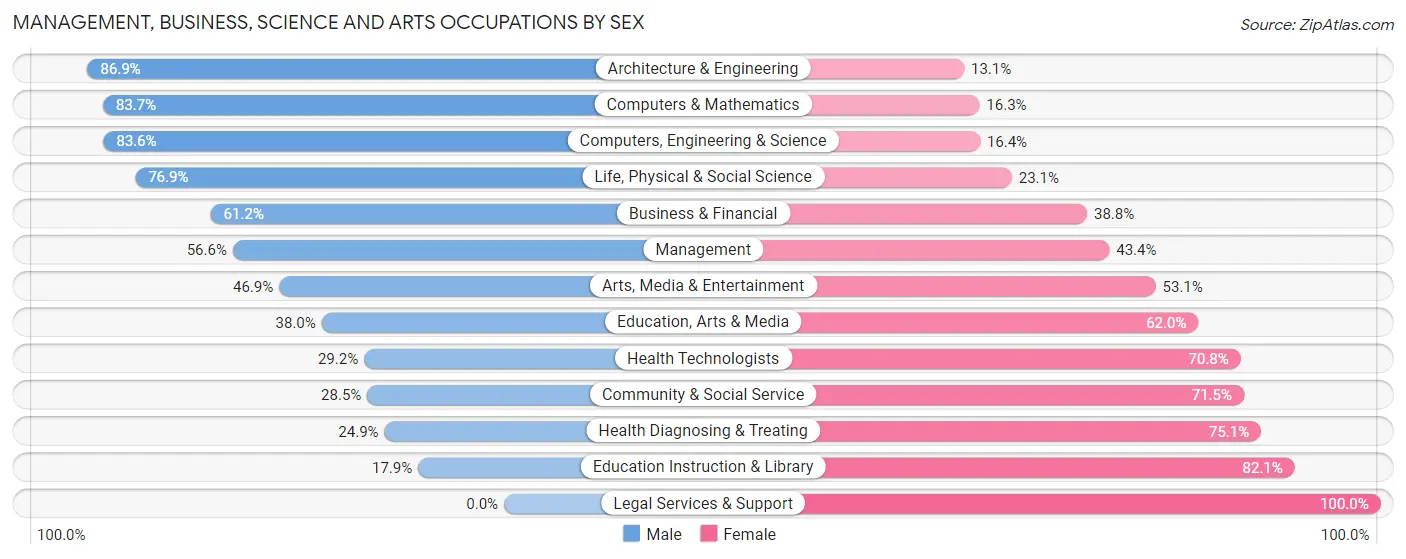
| Occupation | Male | Female |
| Management | 387 (56.6%) | 297 (43.4%) |
| Business & Financial | 270 (61.2%) | 171 (38.8%) |
| Computers, Engineering & Science | 356 (83.6%) | 70 (16.4%) |
| Computers & Mathematics | 200 (83.7%) | 39 (16.3%) |
| Architecture & Engineering | 106 (86.9%) | 16 (13.1%) |
| Life, Physical & Social Science | 50 (76.9%) | 15 (23.1%) |
| Community & Social Service | 246 (28.5%) | 616 (71.5%) |
| Education, Arts & Media | 62 (38.0%) | 101 (62.0%) |
| Legal Services & Support | 0 (0.0%) | 14 (100.0%) |
| Education Instruction & Library | 85 (17.9%) | 389 (82.1%) |
| Arts, Media & Entertainment | 99 (46.9%) | 112 (53.1%) |
| Health Diagnosing & Treating | 106 (24.9%) | 319 (75.1%) |
| Health Technologists | 99 (29.2%) | 240 (70.8%) |
| Total (Category) | 1,365 (48.1%) | 1,473 (51.9%) |
| Total (Overall) | 3,664 (51.4%) | 3,461 (48.6%) |
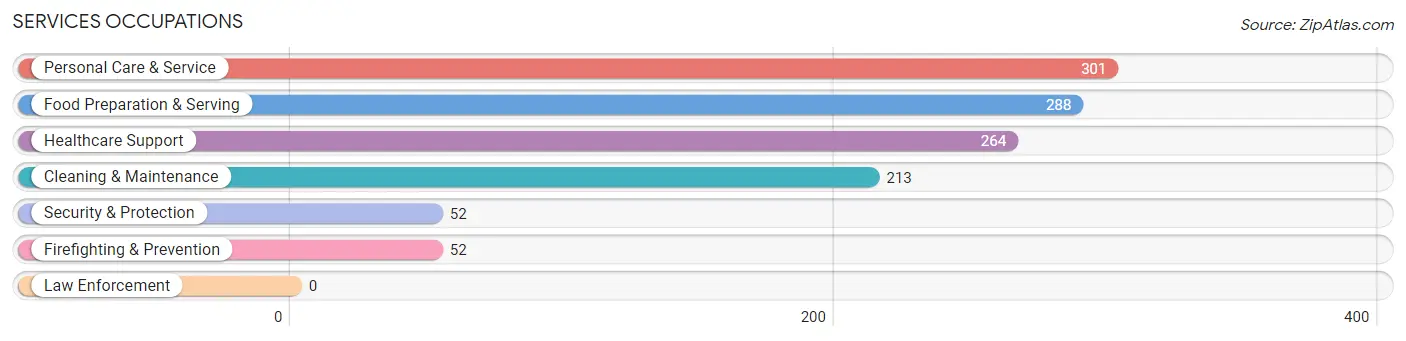
Services Occupations
The most common Services occupations in Red Bank are Personal Care & Service (301 | 4.2%), Food Preparation & Serving (288 | 4.0%), Healthcare Support (264 | 3.7%), Cleaning & Maintenance (213 | 3.0%), and Security & Protection (52 | 0.7%).
Services Occupations by Sex
Within the Services occupations in Red Bank, the most male-oriented occupations are Security & Protection (88.5%), Firefighting & Prevention (88.5%), and Cleaning & Maintenance (48.8%), while the most female-oriented occupations are Healthcare Support (86.7%), Personal Care & Service (66.1%), and Food Preparation & Serving (51.4%).
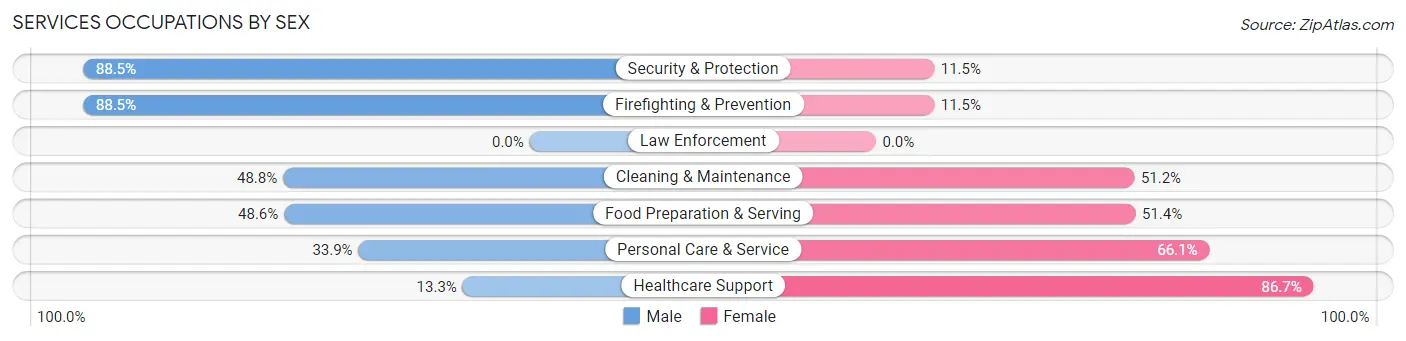
| Occupation | Male | Female |
| Healthcare Support | 35 (13.3%) | 229 (86.7%) |
| Security & Protection | 46 (88.5%) | 6 (11.5%) |
| Firefighting & Prevention | 46 (88.5%) | 6 (11.5%) |
| Law Enforcement | 0 (0.0%) | 0 (0.0%) |
| Food Preparation & Serving | 140 (48.6%) | 148 (51.4%) |
| Cleaning & Maintenance | 104 (48.8%) | 109 (51.2%) |
| Personal Care & Service | 102 (33.9%) | 199 (66.1%) |
| Total (Category) | 427 (38.2%) | 691 (61.8%) |
| Total (Overall) | 3,664 (51.4%) | 3,461 (48.6%) |
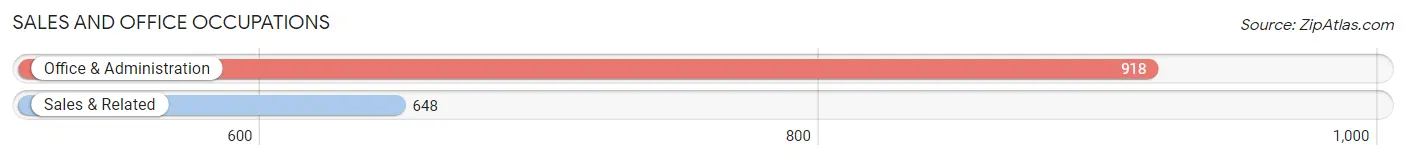
Sales and Office Occupations
The most common Sales and Office occupations in Red Bank are Office & Administration (918 | 12.9%), and Sales & Related (648 | 9.1%).
Sales and Office Occupations by Sex
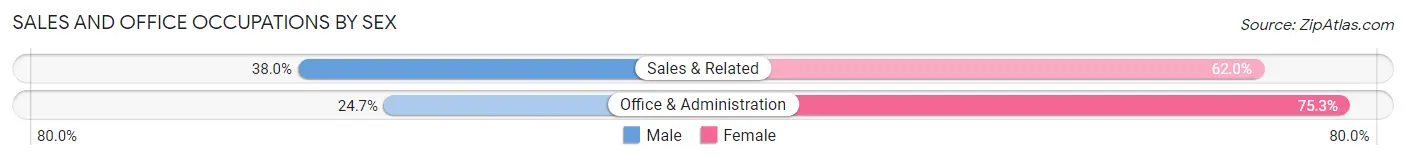
| Occupation | Male | Female |
| Sales & Related | 246 (38.0%) | 402 (62.0%) |
| Office & Administration | 227 (24.7%) | 691 (75.3%) |
| Total (Category) | 473 (30.2%) | 1,093 (69.8%) |
| Total (Overall) | 3,664 (51.4%) | 3,461 (48.6%) |
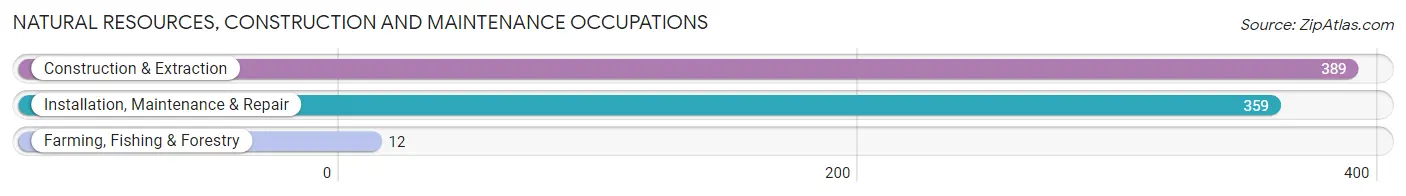
Natural Resources, Construction and Maintenance Occupations
The most common Natural Resources, Construction and Maintenance occupations in Red Bank are Construction & Extraction (389 | 5.5%), Installation, Maintenance & Repair (359 | 5.0%), and Farming, Fishing & Forestry (12 | 0.2%).
Natural Resources, Construction and Maintenance Occupations by Sex
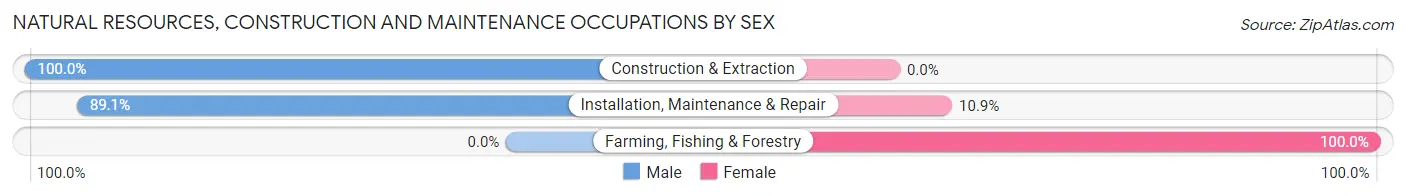
| Occupation | Male | Female |
| Farming, Fishing & Forestry | 0 (0.0%) | 12 (100.0%) |
| Construction & Extraction | 389 (100.0%) | 0 (0.0%) |
| Installation, Maintenance & Repair | 320 (89.1%) | 39 (10.9%) |
| Total (Category) | 709 (93.3%) | 51 (6.7%) |
| Total (Overall) | 3,664 (51.4%) | 3,461 (48.6%) |
Production, Transportation and Moving Occupations
The most common Production, Transportation and Moving occupations in Red Bank are Production (343 | 4.8%), Transportation (259 | 3.6%), and Material Moving (241 | 3.4%).
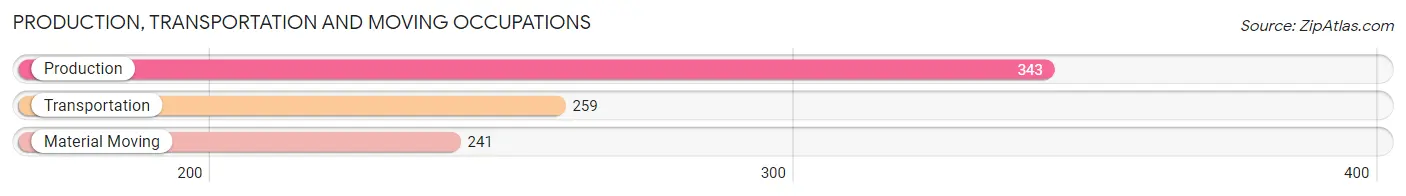
Production, Transportation and Moving Occupations by Sex
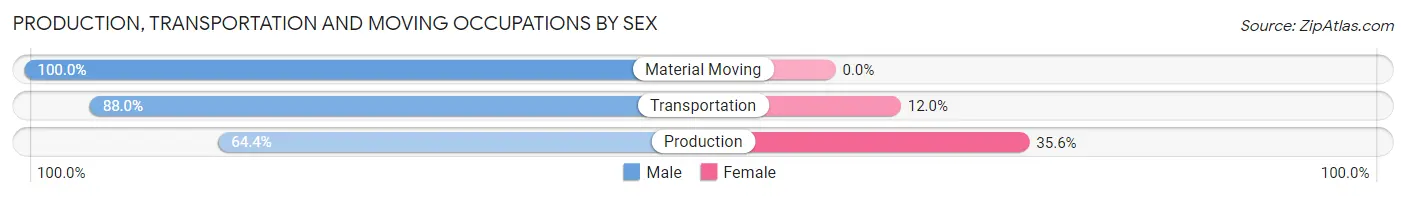
| Occupation | Male | Female |
| Production | 221 (64.4%) | 122 (35.6%) |
| Transportation | 228 (88.0%) | 31 (12.0%) |
| Material Moving | 241 (100.0%) | 0 (0.0%) |
| Total (Category) | 690 (81.9%) | 153 (18.1%) |
| Total (Overall) | 3,664 (51.4%) | 3,461 (48.6%) |
Employment Industries by Sex in Red Bank
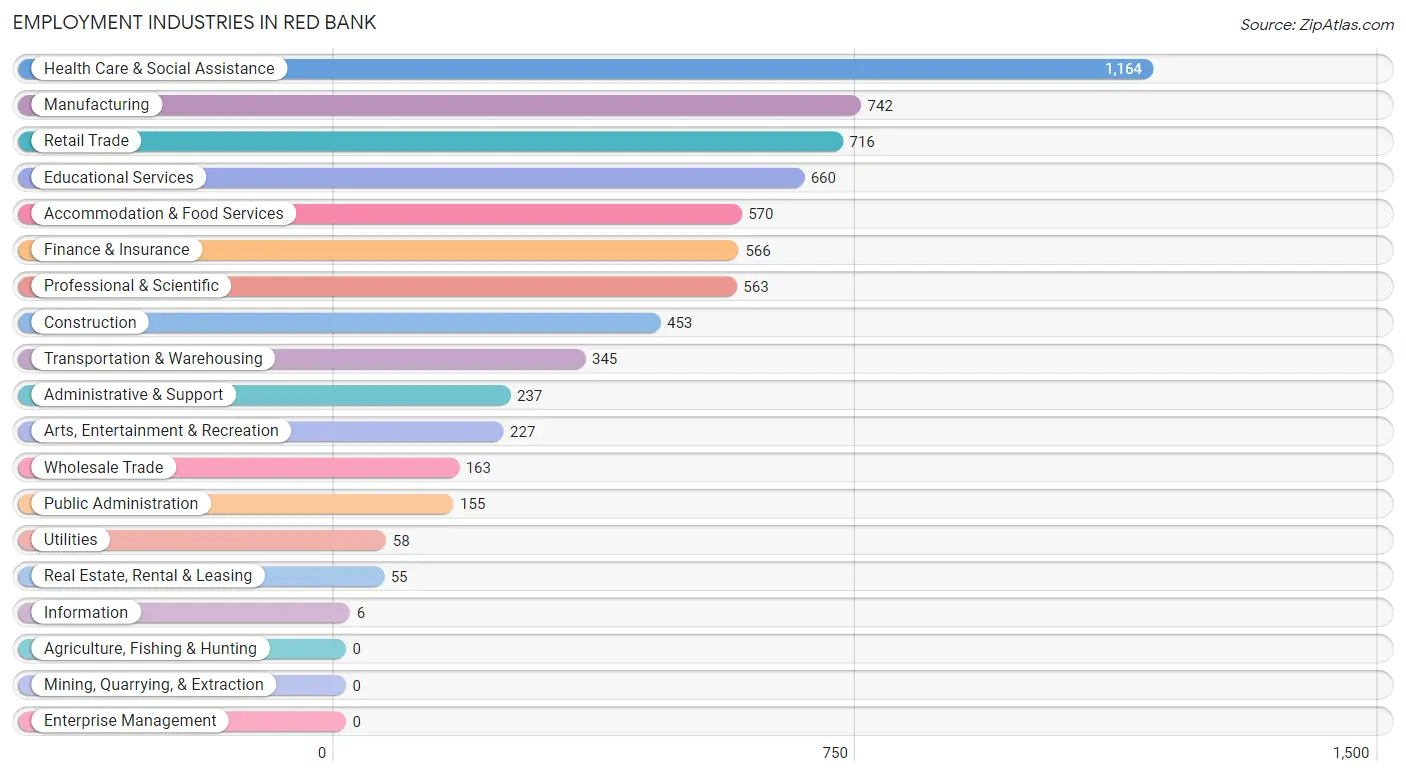
Employment Industries in Red Bank
The major employment industries in Red Bank include Health Care & Social Assistance (1,164 | 16.3%), Manufacturing (742 | 10.4%), Retail Trade (716 | 10.1%), Educational Services (660 | 9.3%), and Accommodation & Food Services (570 | 8.0%).
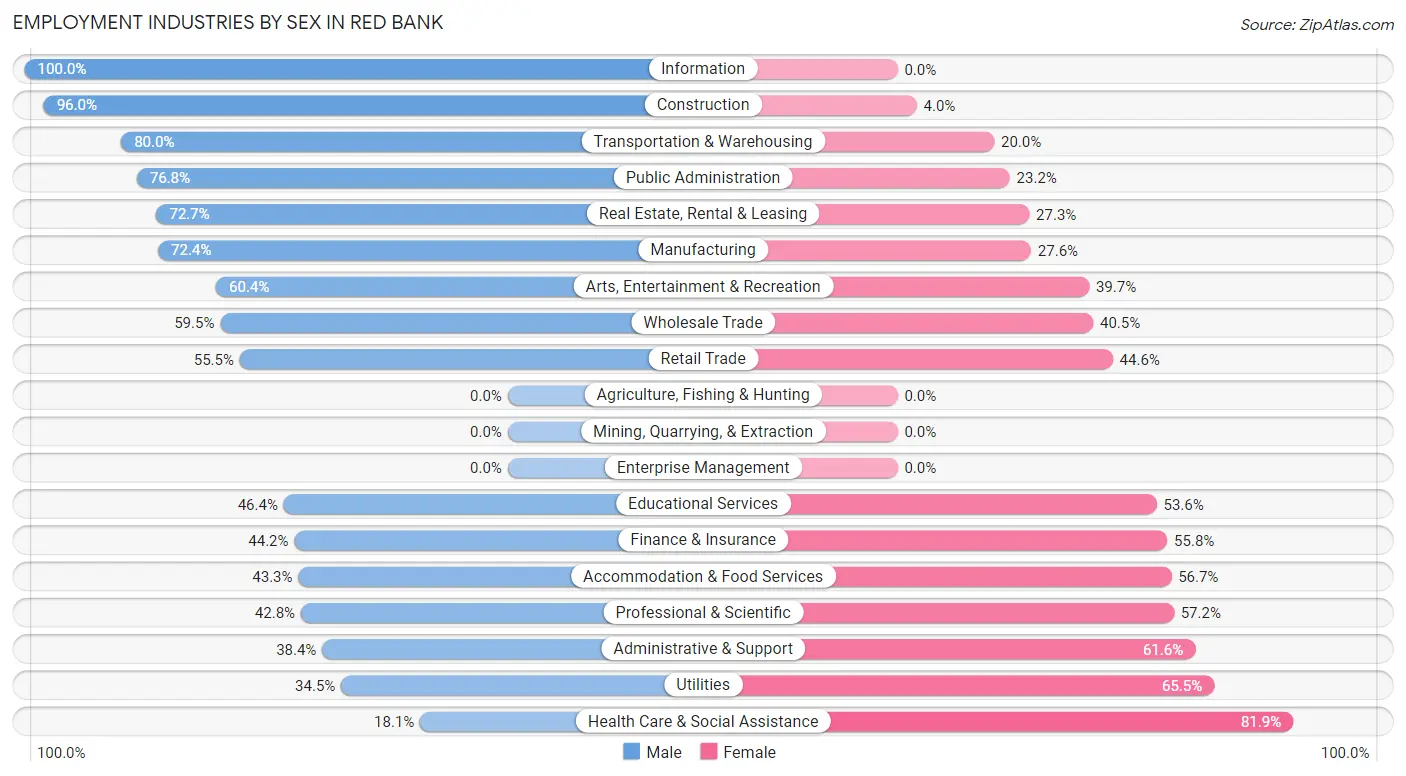
Employment Industries by Sex in Red Bank
The Red Bank industries that see more men than women are Information (100.0%), Construction (96.0%), and Transportation & Warehousing (80.0%), whereas the industries that tend to have a higher number of women are Health Care & Social Assistance (81.9%), Utilities (65.5%), and Administrative & Support (61.6%).
| Industry | Male | Female |
| Agriculture, Fishing & Hunting | 0 (0.0%) | 0 (0.0%) |
| Mining, Quarrying, & Extraction | 0 (0.0%) | 0 (0.0%) |
| Construction | 435 (96.0%) | 18 (4.0%) |
| Manufacturing | 537 (72.4%) | 205 (27.6%) |
| Wholesale Trade | 97 (59.5%) | 66 (40.5%) |
| Retail Trade | 397 (55.4%) | 319 (44.6%) |
| Transportation & Warehousing | 276 (80.0%) | 69 (20.0%) |
| Utilities | 20 (34.5%) | 38 (65.5%) |
| Information | 6 (100.0%) | 0 (0.0%) |
| Finance & Insurance | 250 (44.2%) | 316 (55.8%) |
| Real Estate, Rental & Leasing | 40 (72.7%) | 15 (27.3%) |
| Professional & Scientific | 241 (42.8%) | 322 (57.2%) |
| Enterprise Management | 0 (0.0%) | 0 (0.0%) |
| Administrative & Support | 91 (38.4%) | 146 (61.6%) |
| Educational Services | 306 (46.4%) | 354 (53.6%) |
| Health Care & Social Assistance | 211 (18.1%) | 953 (81.9%) |
| Arts, Entertainment & Recreation | 137 (60.4%) | 90 (39.7%) |
| Accommodation & Food Services | 247 (43.3%) | 323 (56.7%) |
| Public Administration | 119 (76.8%) | 36 (23.2%) |
| Total | 3,664 (51.4%) | 3,461 (48.6%) |
Education in Red Bank
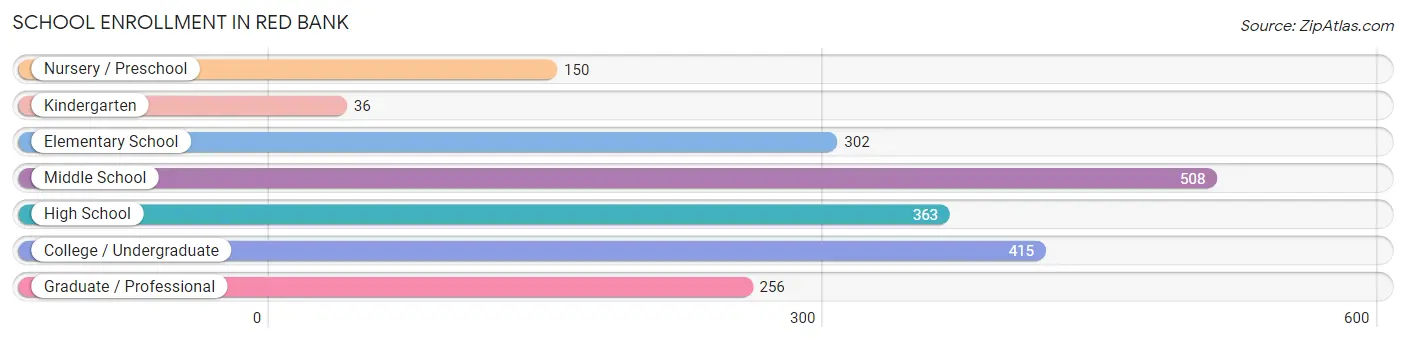
School Enrollment in Red Bank
The most common levels of schooling among the 2,030 students in Red Bank are middle school (508 | 25.0%), college / undergraduate (415 | 20.4%), and high school (363 | 17.9%).
| School Level | # Students | % Students |
| Nursery / Preschool | 150 | 7.4% |
| Kindergarten | 36 | 1.8% |
| Elementary School | 302 | 14.9% |
| Middle School | 508 | 25.0% |
| High School | 363 | 17.9% |
| College / Undergraduate | 415 | 20.4% |
| Graduate / Professional | 256 | 12.6% |
| Total | 2,030 | 100.0% |
School Enrollment by Age by Funding Source in Red Bank
Out of a total of 2,030 students who are enrolled in schools in Red Bank, 678 (33.4%) attend a private institution, while the remaining 1,352 (66.6%) are enrolled in public schools. The age group of 3 to 4 year olds has the highest likelihood of being enrolled in private schools, with 77 (57.0% in the age bracket) enrolled. Conversely, the age group of 18 to 19 year olds has the lowest likelihood of being enrolled in a private school, with 101 (100.0% in the age bracket) attending a public institution.
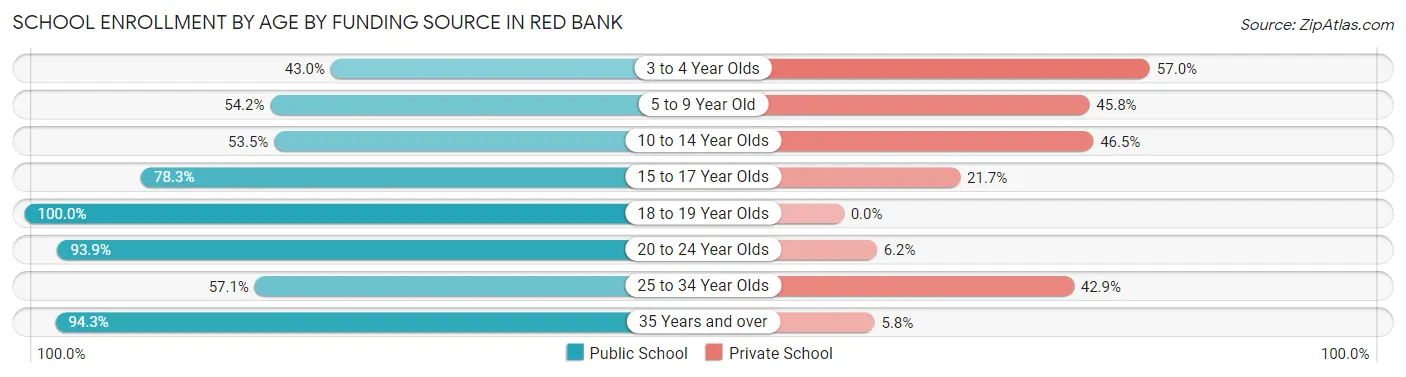
| Age Bracket | Public School | Private School |
| 3 to 4 Year Olds | 58 (43.0%) | 77 (57.0%) |
| 5 to 9 Year Old | 186 (54.2%) | 157 (45.8%) |
| 10 to 14 Year Olds | 327 (53.5%) | 284 (46.5%) |
| 15 to 17 Year Olds | 148 (78.3%) | 41 (21.7%) |
| 18 to 19 Year Olds | 101 (100.0%) | 0 (0.0%) |
| 20 to 24 Year Olds | 244 (93.9%) | 16 (6.1%) |
| 25 to 34 Year Olds | 124 (57.1%) | 93 (42.9%) |
| 35 Years and over | 164 (94.3%) | 10 (5.8%) |
| Total | 1,352 (66.6%) | 678 (33.4%) |
Educational Attainment by Field of Study in Red Bank
Business (609 | 15.3%), visual & performing arts (508 | 12.8%), science & technology (445 | 11.2%), bio, nature & agricultural (322 | 8.1%), and arts & humanities (315 | 7.9%) are the most common fields of study among 3,970 individuals in Red Bank who have obtained a bachelor's degree or higher.
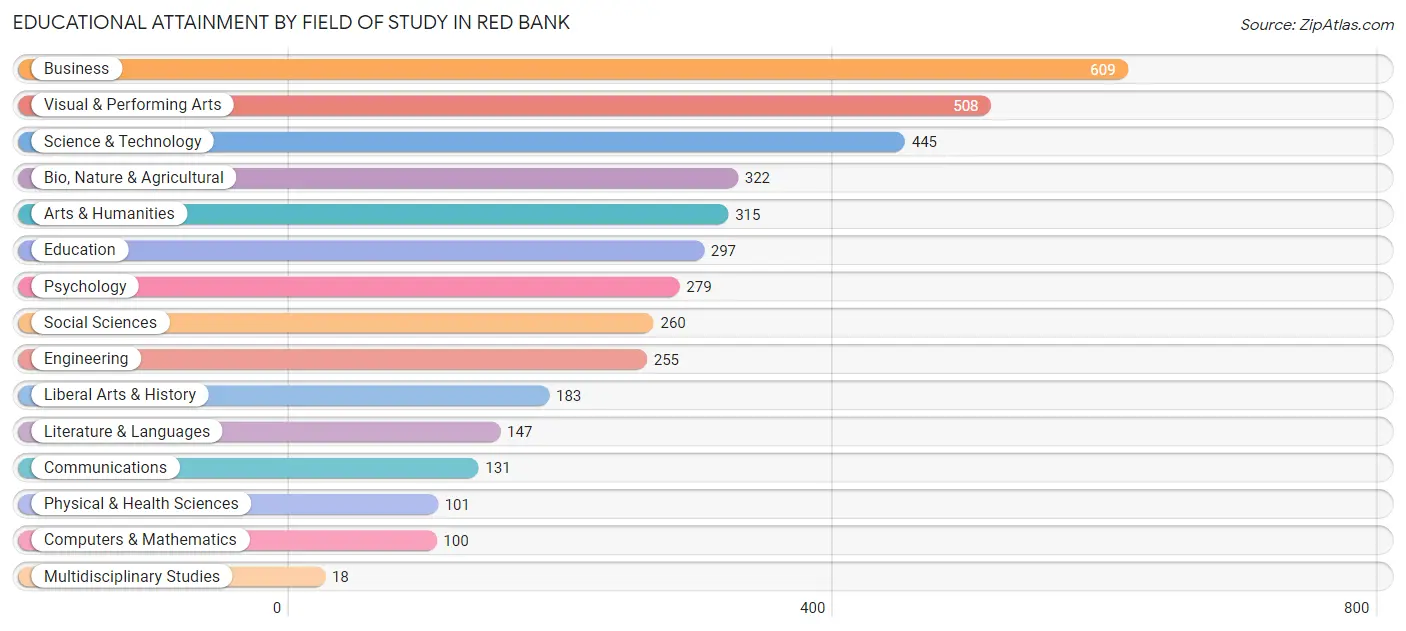
| Field of Study | # Graduates | % Graduates |
| Computers & Mathematics | 100 | 2.5% |
| Bio, Nature & Agricultural | 322 | 8.1% |
| Physical & Health Sciences | 101 | 2.5% |
| Psychology | 279 | 7.0% |
| Social Sciences | 260 | 6.6% |
| Engineering | 255 | 6.4% |
| Multidisciplinary Studies | 18 | 0.4% |
| Science & Technology | 445 | 11.2% |
| Business | 609 | 15.3% |
| Education | 297 | 7.5% |
| Literature & Languages | 147 | 3.7% |
| Liberal Arts & History | 183 | 4.6% |
| Visual & Performing Arts | 508 | 12.8% |
| Communications | 131 | 3.3% |
| Arts & Humanities | 315 | 7.9% |
| Total | 3,970 | 100.0% |
Transportation & Commute in Red Bank
Vehicle Availability by Sex in Red Bank
The most prevalent vehicle ownership categories in Red Bank are males with 2 vehicles (1,451, accounting for 40.2%) and females with 2 vehicles (1,425, making up 43.3%).
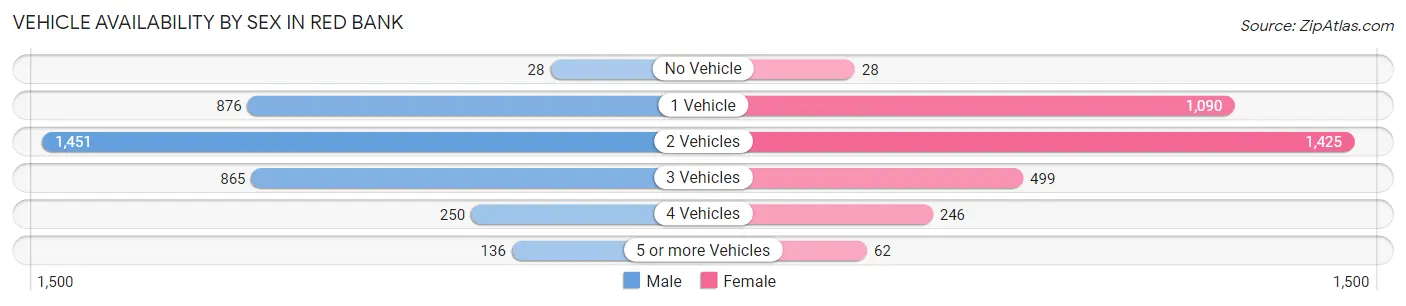
| Vehicles Available | Male | Female |
| No Vehicle | 28 (0.8%) | 28 (0.8%) |
| 1 Vehicle | 876 (24.3%) | 1,090 (32.5%) |
| 2 Vehicles | 1,451 (40.2%) | 1,425 (42.5%) |
| 3 Vehicles | 865 (24.0%) | 499 (14.9%) |
| 4 Vehicles | 250 (6.9%) | 246 (7.3%) |
| 5 or more Vehicles | 136 (3.8%) | 62 (1.8%) |
| Total | 3,606 (100.0%) | 3,350 (100.0%) |
Commute Time in Red Bank
The most frequently occuring commute durations in Red Bank are 15 to 19 minutes (1,490 commuters, 23.9%), 10 to 14 minutes (1,270 commuters, 20.4%), and 20 to 24 minutes (1,258 commuters, 20.2%).
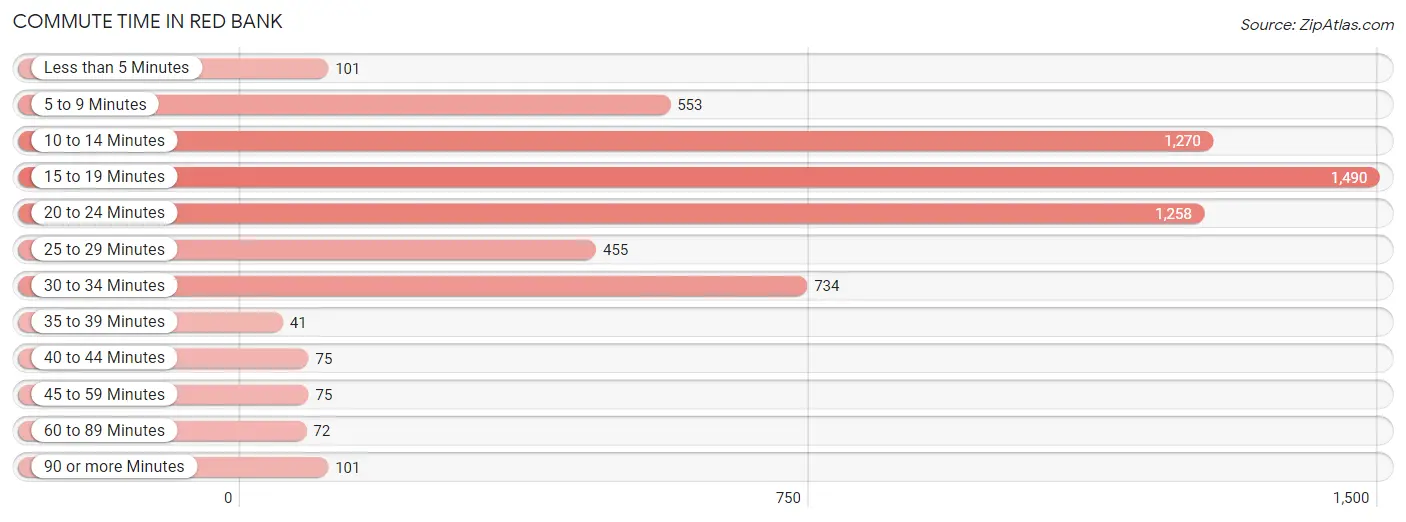
| Commute Time | # Commuters | % Commuters |
| Less than 5 Minutes | 101 | 1.6% |
| 5 to 9 Minutes | 553 | 8.9% |
| 10 to 14 Minutes | 1,270 | 20.4% |
| 15 to 19 Minutes | 1,490 | 23.9% |
| 20 to 24 Minutes | 1,258 | 20.2% |
| 25 to 29 Minutes | 455 | 7.3% |
| 30 to 34 Minutes | 734 | 11.8% |
| 35 to 39 Minutes | 41 | 0.7% |
| 40 to 44 Minutes | 75 | 1.2% |
| 45 to 59 Minutes | 75 | 1.2% |
| 60 to 89 Minutes | 72 | 1.2% |
| 90 or more Minutes | 101 | 1.6% |
Commute Time by Sex in Red Bank
The most common commute times in Red Bank are 10 to 14 minutes (766 commuters, 23.3%) for males and 15 to 19 minutes (778 commuters, 26.5%) for females.
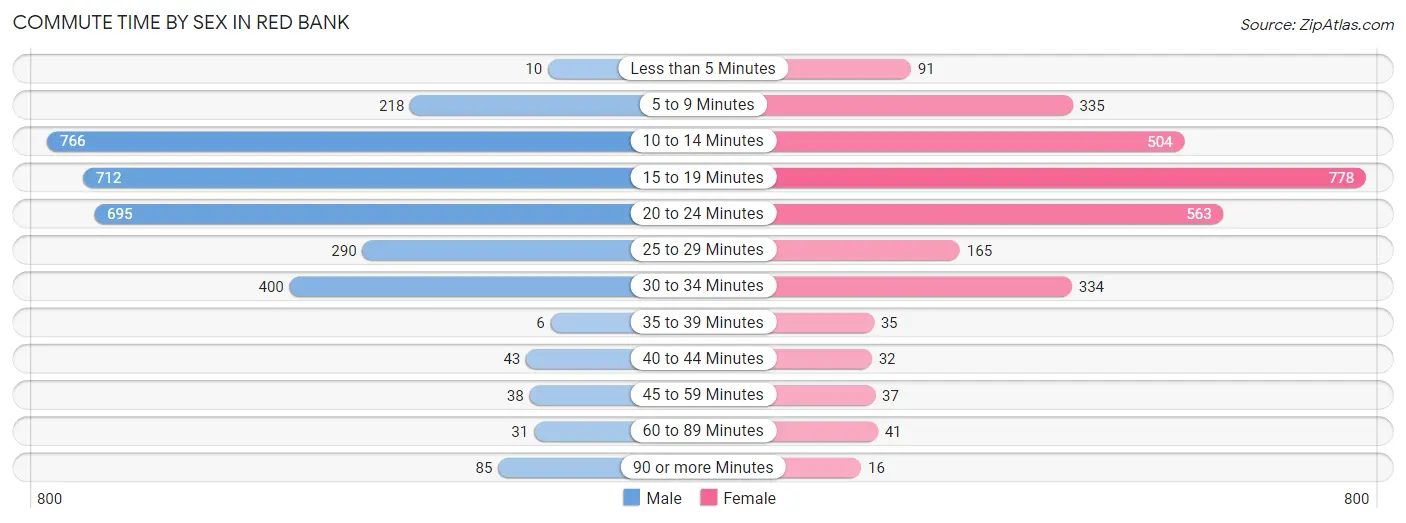
| Commute Time | Male | Female |
| Less than 5 Minutes | 10 (0.3%) | 91 (3.1%) |
| 5 to 9 Minutes | 218 (6.6%) | 335 (11.4%) |
| 10 to 14 Minutes | 766 (23.3%) | 504 (17.2%) |
| 15 to 19 Minutes | 712 (21.6%) | 778 (26.5%) |
| 20 to 24 Minutes | 695 (21.1%) | 563 (19.2%) |
| 25 to 29 Minutes | 290 (8.8%) | 165 (5.6%) |
| 30 to 34 Minutes | 400 (12.1%) | 334 (11.4%) |
| 35 to 39 Minutes | 6 (0.2%) | 35 (1.2%) |
| 40 to 44 Minutes | 43 (1.3%) | 32 (1.1%) |
| 45 to 59 Minutes | 38 (1.1%) | 37 (1.3%) |
| 60 to 89 Minutes | 31 (0.9%) | 41 (1.4%) |
| 90 or more Minutes | 85 (2.6%) | 16 (0.5%) |
Time of Departure to Work by Sex in Red Bank
The most frequent times of departure to work in Red Bank are 7:30 AM to 7:59 AM (571, 17.3%) for males and 7:00 AM to 7:29 AM (475, 16.2%) for females.
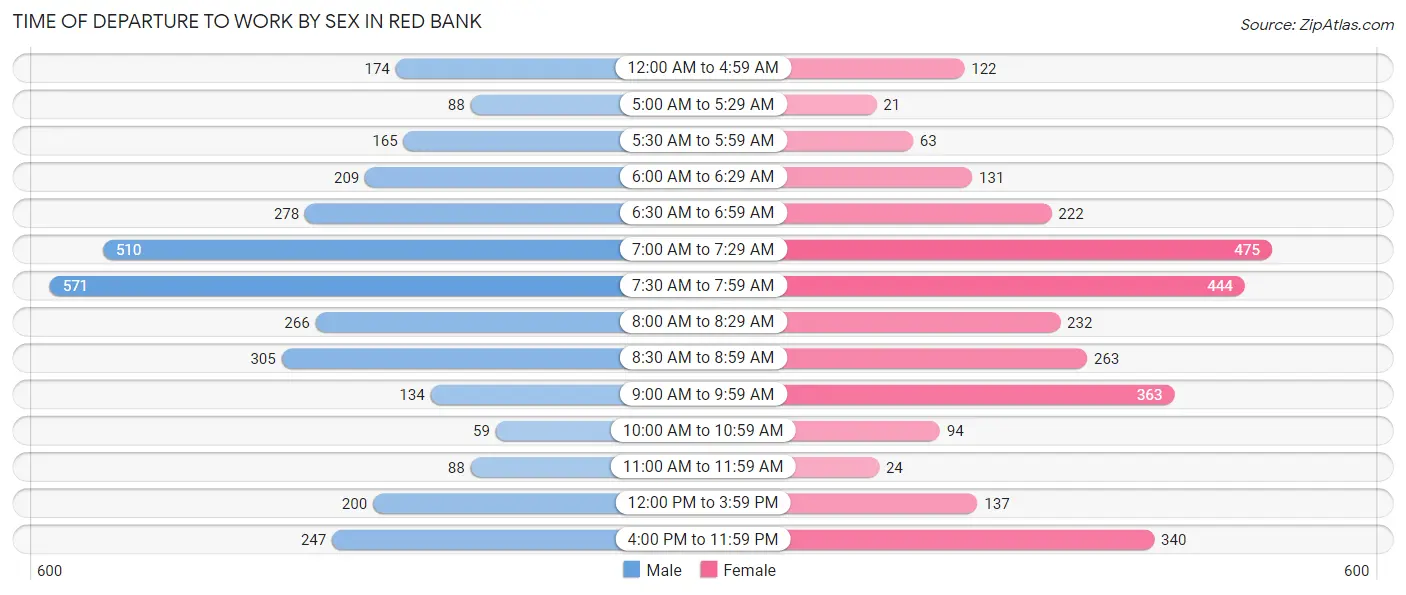
| Time of Departure | Male | Female |
| 12:00 AM to 4:59 AM | 174 (5.3%) | 122 (4.2%) |
| 5:00 AM to 5:29 AM | 88 (2.7%) | 21 (0.7%) |
| 5:30 AM to 5:59 AM | 165 (5.0%) | 63 (2.1%) |
| 6:00 AM to 6:29 AM | 209 (6.3%) | 131 (4.5%) |
| 6:30 AM to 6:59 AM | 278 (8.4%) | 222 (7.6%) |
| 7:00 AM to 7:29 AM | 510 (15.5%) | 475 (16.2%) |
| 7:30 AM to 7:59 AM | 571 (17.3%) | 444 (15.1%) |
| 8:00 AM to 8:29 AM | 266 (8.1%) | 232 (7.9%) |
| 8:30 AM to 8:59 AM | 305 (9.3%) | 263 (9.0%) |
| 9:00 AM to 9:59 AM | 134 (4.1%) | 363 (12.4%) |
| 10:00 AM to 10:59 AM | 59 (1.8%) | 94 (3.2%) |
| 11:00 AM to 11:59 AM | 88 (2.7%) | 24 (0.8%) |
| 12:00 PM to 3:59 PM | 200 (6.1%) | 137 (4.7%) |
| 4:00 PM to 11:59 PM | 247 (7.5%) | 340 (11.6%) |
| Total | 3,294 (100.0%) | 2,931 (100.0%) |
Housing Occupancy in Red Bank
Occupancy by Ownership in Red Bank
Of the total 5,750 dwellings in Red Bank, owner-occupied units account for 3,259 (56.7%), while renter-occupied units make up 2,491 (43.3%).
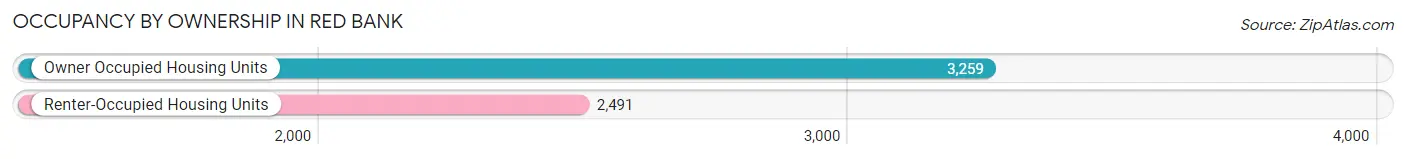
| Occupancy | # Housing Units | % Housing Units |
| Owner Occupied Housing Units | 3,259 | 56.7% |
| Renter-Occupied Housing Units | 2,491 | 43.3% |
| Total Occupied Housing Units | 5,750 | 100.0% |
Occupancy by Household Size in Red Bank
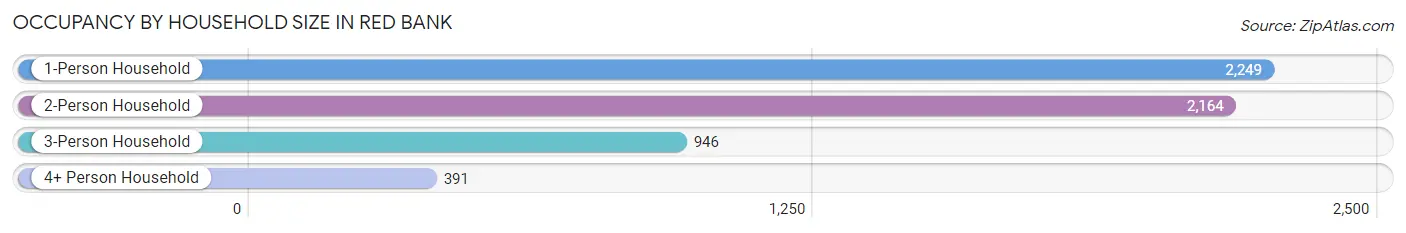
| Household Size | # Housing Units | % Housing Units |
| 1-Person Household | 2,249 | 39.1% |
| 2-Person Household | 2,164 | 37.6% |
| 3-Person Household | 946 | 16.5% |
| 4+ Person Household | 391 | 6.8% |
| Total Housing Units | 5,750 | 100.0% |
Occupancy by Ownership by Household Size in Red Bank
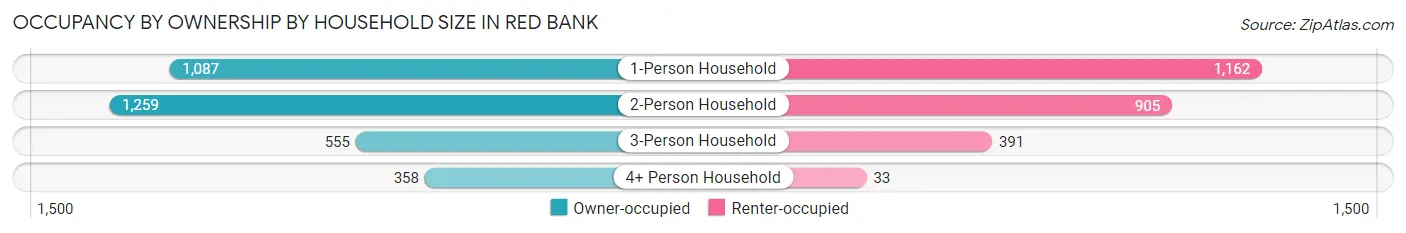
| Household Size | Owner-occupied | Renter-occupied |
| 1-Person Household | 1,087 (48.3%) | 1,162 (51.7%) |
| 2-Person Household | 1,259 (58.2%) | 905 (41.8%) |
| 3-Person Household | 555 (58.7%) | 391 (41.3%) |
| 4+ Person Household | 358 (91.6%) | 33 (8.4%) |
| Total Housing Units | 3,259 (56.7%) | 2,491 (43.3%) |
Occupancy by Educational Attainment in Red Bank
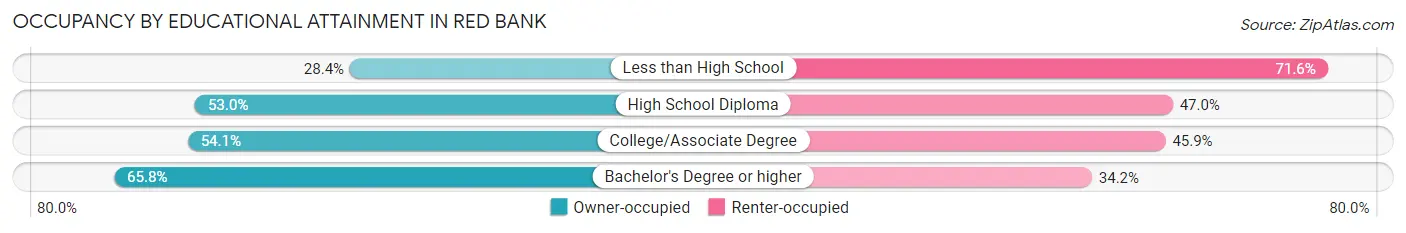
| Household Size | Owner-occupied | Renter-occupied |
| Less than High School | 117 (28.4%) | 295 (71.6%) |
| High School Diploma | 597 (53.0%) | 530 (47.0%) |
| College/Associate Degree | 1,045 (54.1%) | 886 (45.9%) |
| Bachelor's Degree or higher | 1,500 (65.8%) | 780 (34.2%) |
Occupancy by Age of Householder in Red Bank
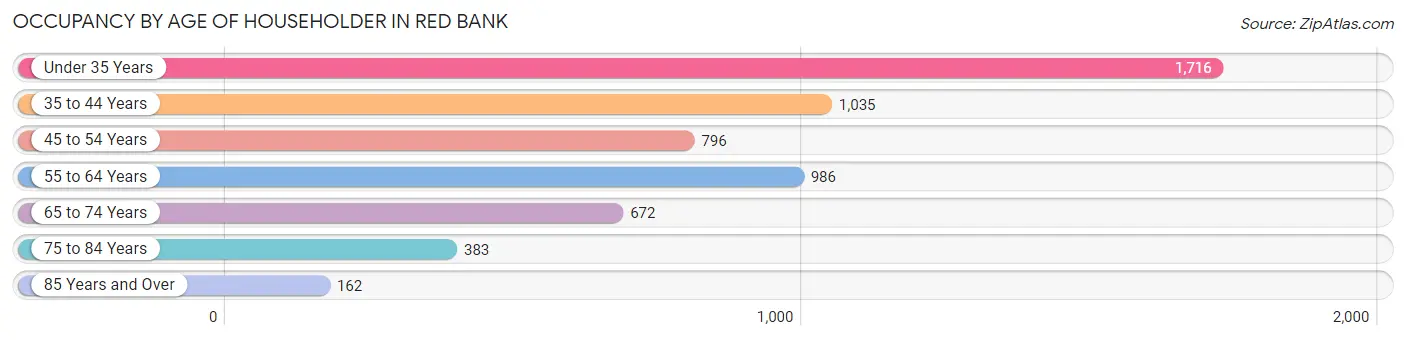
| Age Bracket | # Households | % Households |
| Under 35 Years | 1,716 | 29.8% |
| 35 to 44 Years | 1,035 | 18.0% |
| 45 to 54 Years | 796 | 13.8% |
| 55 to 64 Years | 986 | 17.2% |
| 65 to 74 Years | 672 | 11.7% |
| 75 to 84 Years | 383 | 6.7% |
| 85 Years and Over | 162 | 2.8% |
| Total | 5,750 | 100.0% |
Housing Finances in Red Bank
Median Income by Occupancy in Red Bank
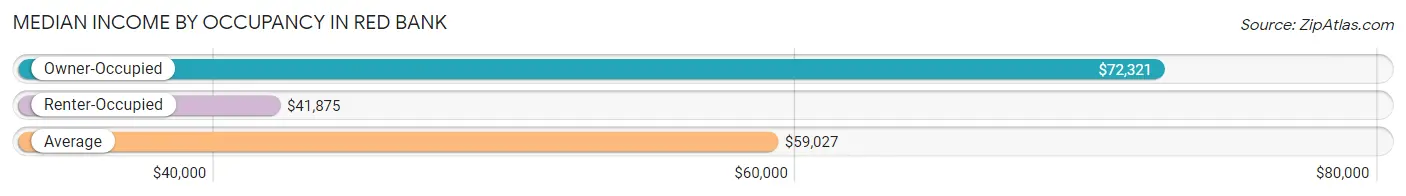
| Occupancy Type | # Households | Median Income |
| Owner-Occupied | 3,259 (56.7%) | $72,321 |
| Renter-Occupied | 2,491 (43.3%) | $41,875 |
| Average | 5,750 (100.0%) | $59,027 |
Occupancy by Householder Income Bracket in Red Bank
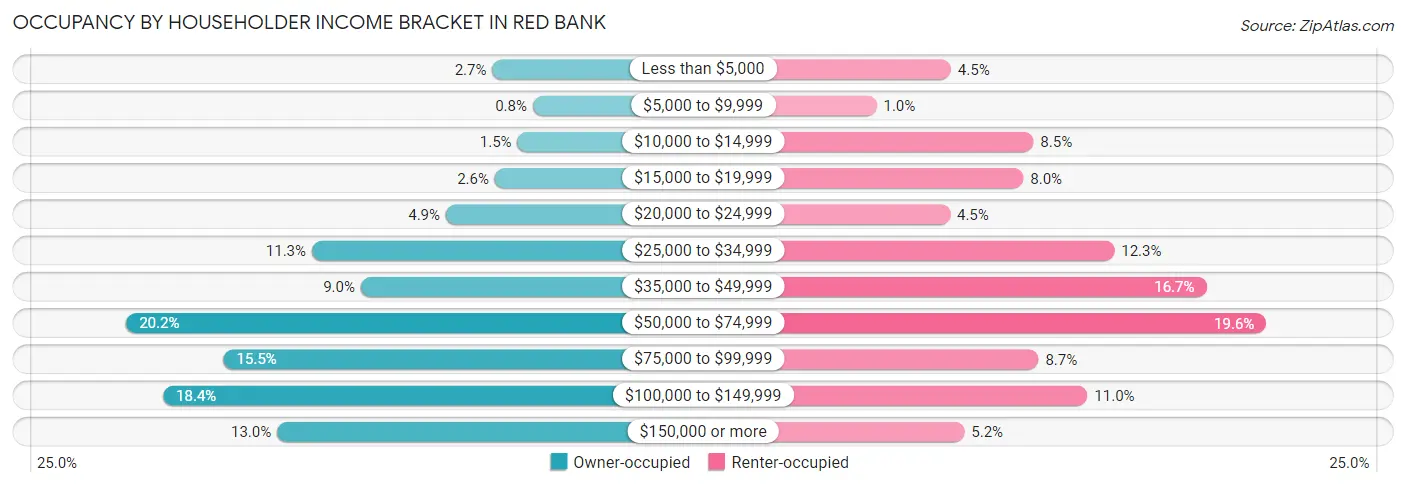
| Income Bracket | Owner-occupied | Renter-occupied |
| Less than $5,000 | 89 (2.7%) | 113 (4.5%) |
| $5,000 to $9,999 | 26 (0.8%) | 25 (1.0%) |
| $10,000 to $14,999 | 50 (1.5%) | 211 (8.5%) |
| $15,000 to $19,999 | 85 (2.6%) | 199 (8.0%) |
| $20,000 to $24,999 | 161 (4.9%) | 112 (4.5%) |
| $25,000 to $34,999 | 369 (11.3%) | 307 (12.3%) |
| $35,000 to $49,999 | 293 (9.0%) | 416 (16.7%) |
| $50,000 to $74,999 | 657 (20.2%) | 487 (19.6%) |
| $75,000 to $99,999 | 506 (15.5%) | 217 (8.7%) |
| $100,000 to $149,999 | 600 (18.4%) | 275 (11.0%) |
| $150,000 or more | 423 (13.0%) | 129 (5.2%) |
| Total | 3,259 (100.0%) | 2,491 (100.0%) |
Monthly Housing Cost Tiers in Red Bank
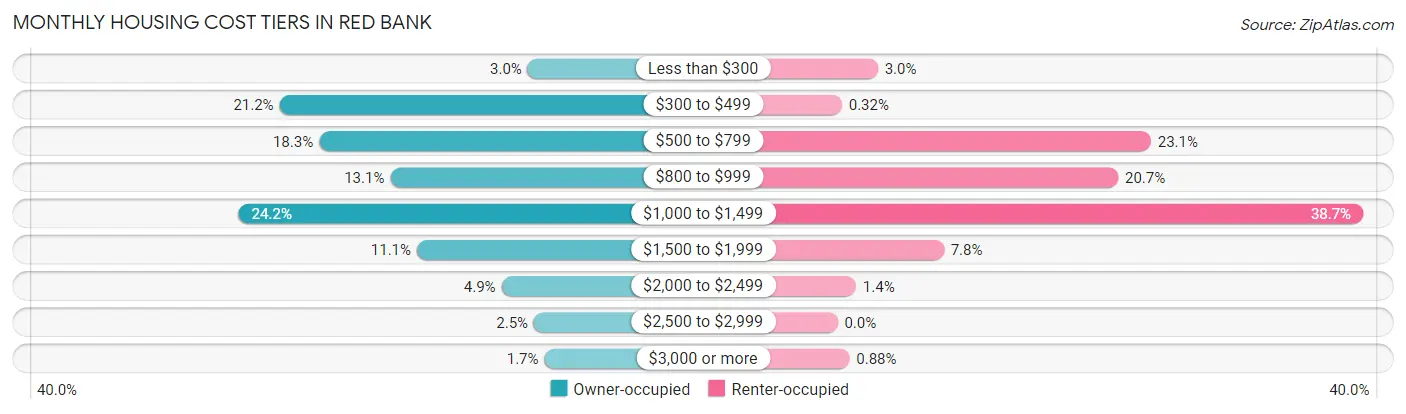
| Monthly Cost | Owner-occupied | Renter-occupied |
| Less than $300 | 96 (2.9%) | 74 (3.0%) |
| $300 to $499 | 692 (21.2%) | 8 (0.3%) |
| $500 to $799 | 597 (18.3%) | 575 (23.1%) |
| $800 to $999 | 426 (13.1%) | 515 (20.7%) |
| $1,000 to $1,499 | 790 (24.2%) | 964 (38.7%) |
| $1,500 to $1,999 | 362 (11.1%) | 195 (7.8%) |
| $2,000 to $2,499 | 159 (4.9%) | 34 (1.4%) |
| $2,500 to $2,999 | 81 (2.5%) | 0 (0.0%) |
| $3,000 or more | 56 (1.7%) | 22 (0.9%) |
| Total | 3,259 (100.0%) | 2,491 (100.0%) |
Physical Housing Characteristics in Red Bank
Housing Structures in Red Bank
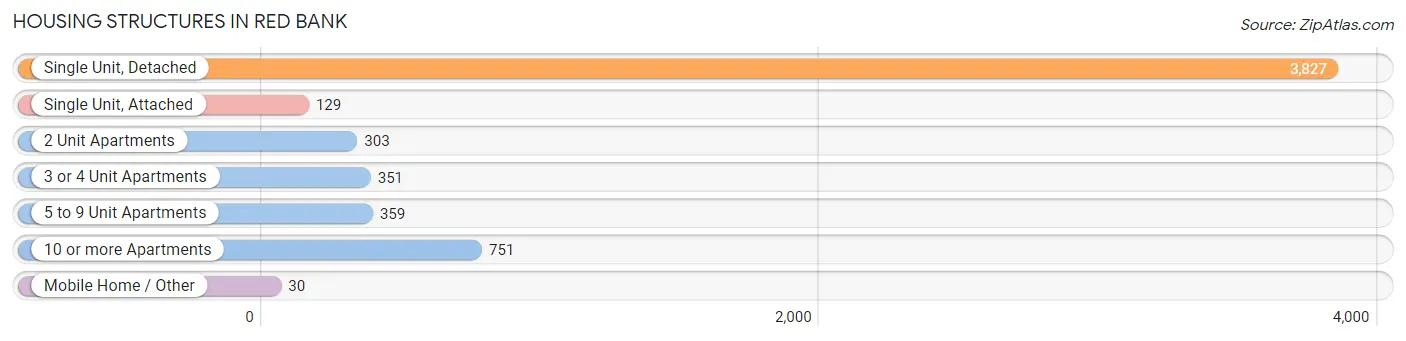
| Structure Type | # Housing Units | % Housing Units |
| Single Unit, Detached | 3,827 | 66.6% |
| Single Unit, Attached | 129 | 2.2% |
| 2 Unit Apartments | 303 | 5.3% |
| 3 or 4 Unit Apartments | 351 | 6.1% |
| 5 to 9 Unit Apartments | 359 | 6.2% |
| 10 or more Apartments | 751 | 13.1% |
| Mobile Home / Other | 30 | 0.5% |
| Total | 5,750 | 100.0% |
Housing Structures by Occupancy in Red Bank
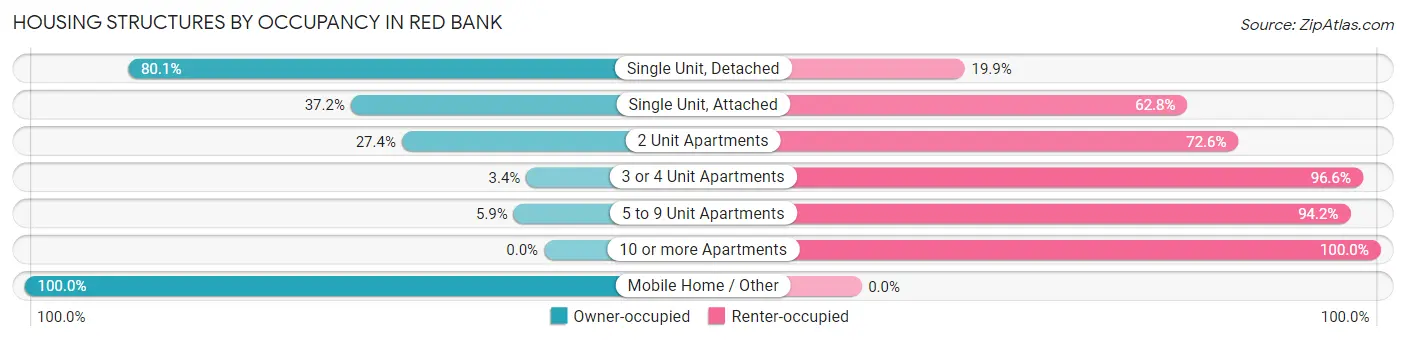
| Structure Type | Owner-occupied | Renter-occupied |
| Single Unit, Detached | 3,065 (80.1%) | 762 (19.9%) |
| Single Unit, Attached | 48 (37.2%) | 81 (62.8%) |
| 2 Unit Apartments | 83 (27.4%) | 220 (72.6%) |
| 3 or 4 Unit Apartments | 12 (3.4%) | 339 (96.6%) |
| 5 to 9 Unit Apartments | 21 (5.9%) | 338 (94.2%) |
| 10 or more Apartments | 0 (0.0%) | 751 (100.0%) |
| Mobile Home / Other | 30 (100.0%) | 0 (0.0%) |
| Total | 3,259 (56.7%) | 2,491 (43.3%) |
Housing Structures by Number of Rooms in Red Bank
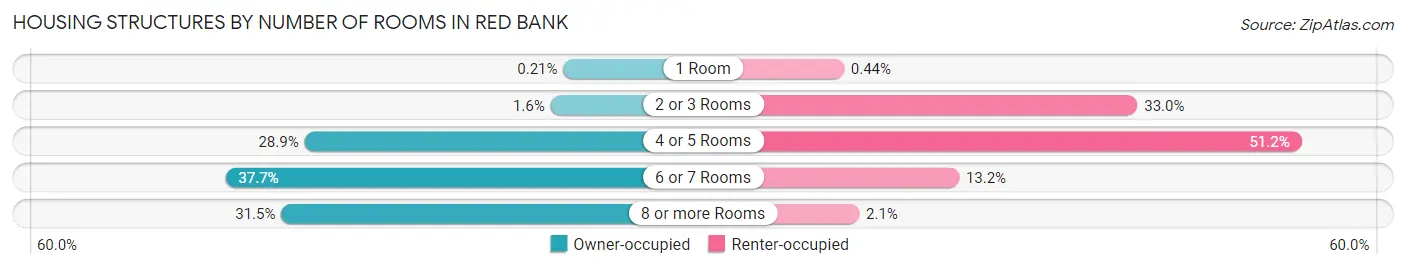
| Number of Rooms | Owner-occupied | Renter-occupied |
| 1 Room | 7 (0.2%) | 11 (0.4%) |
| 2 or 3 Rooms | 53 (1.6%) | 822 (33.0%) |
| 4 or 5 Rooms | 943 (28.9%) | 1,276 (51.2%) |
| 6 or 7 Rooms | 1,229 (37.7%) | 329 (13.2%) |
| 8 or more Rooms | 1,027 (31.5%) | 53 (2.1%) |
| Total | 3,259 (100.0%) | 2,491 (100.0%) |
Housing Structure by Heating Type in Red Bank
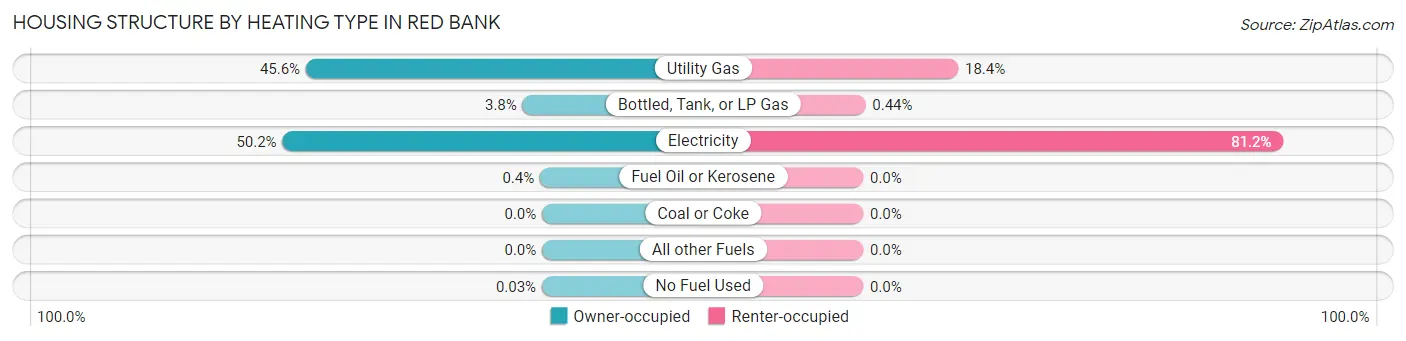
| Heating Type | Owner-occupied | Renter-occupied |
| Utility Gas | 1,487 (45.6%) | 457 (18.3%) |
| Bottled, Tank, or LP Gas | 123 (3.8%) | 11 (0.4%) |
| Electricity | 1,635 (50.2%) | 2,023 (81.2%) |
| Fuel Oil or Kerosene | 13 (0.4%) | 0 (0.0%) |
| Coal or Coke | 0 (0.0%) | 0 (0.0%) |
| All other Fuels | 0 (0.0%) | 0 (0.0%) |
| No Fuel Used | 1 (0.0%) | 0 (0.0%) |
| Total | 3,259 (100.0%) | 2,491 (100.0%) |
Household Vehicle Usage in Red Bank
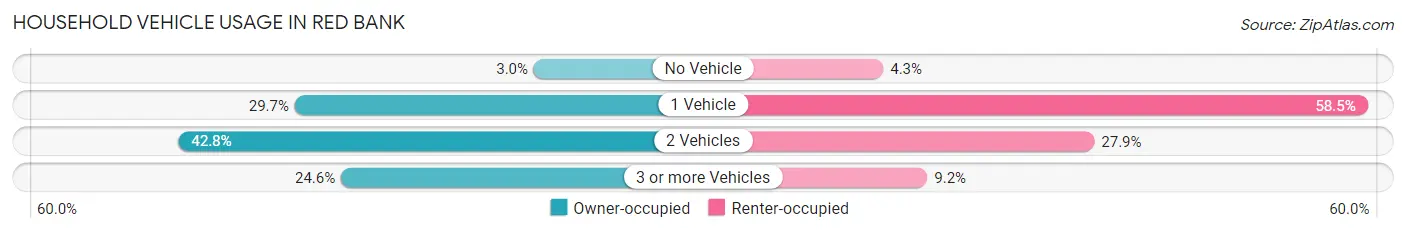
| Vehicles per Household | Owner-occupied | Renter-occupied |
| No Vehicle | 96 (2.9%) | 107 (4.3%) |
| 1 Vehicle | 969 (29.7%) | 1,458 (58.5%) |
| 2 Vehicles | 1,394 (42.8%) | 696 (27.9%) |
| 3 or more Vehicles | 800 (24.5%) | 230 (9.2%) |
| Total | 3,259 (100.0%) | 2,491 (100.0%) |
Real Estate & Mortgages in Red Bank
Real Estate and Mortgage Overview in Red Bank
| Characteristic | Without Mortgage | With Mortgage |
| Housing Units | 1,317 | 1,942 |
| Median Property Value | $213,400 | $227,500 |
| Median Household Income | $49,250 | $328 |
| Monthly Housing Costs | $478 | $56 |
| Real Estate Taxes | $1,780 | $67 |
Property Value by Mortgage Status in Red Bank
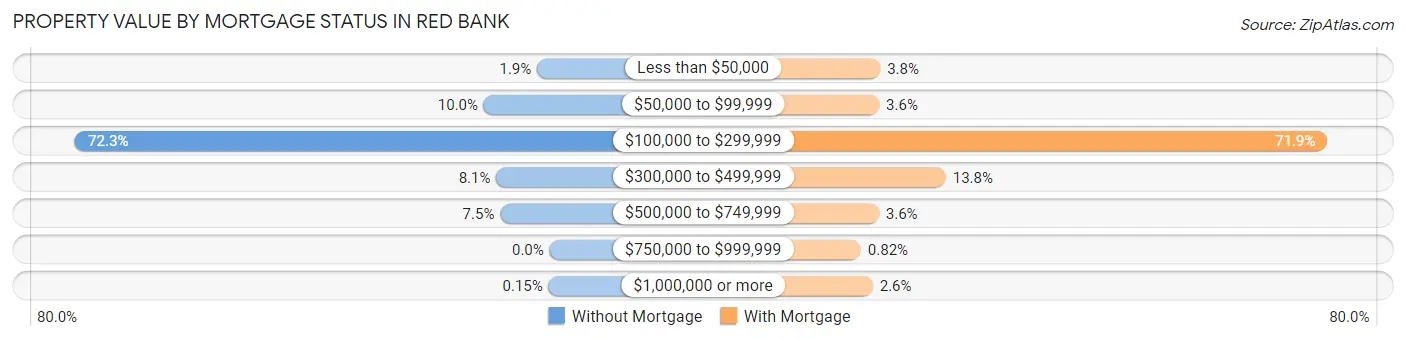
| Property Value | Without Mortgage | With Mortgage |
| Less than $50,000 | 25 (1.9%) | 73 (3.8%) |
| $50,000 to $99,999 | 132 (10.0%) | 70 (3.6%) |
| $100,000 to $299,999 | 952 (72.3%) | 1,396 (71.9%) |
| $300,000 to $499,999 | 107 (8.1%) | 267 (13.8%) |
| $500,000 to $749,999 | 99 (7.5%) | 69 (3.5%) |
| $750,000 to $999,999 | 0 (0.0%) | 16 (0.8%) |
| $1,000,000 or more | 2 (0.2%) | 51 (2.6%) |
| Total | 1,317 (100.0%) | 1,942 (100.0%) |
Household Income by Mortgage Status in Red Bank
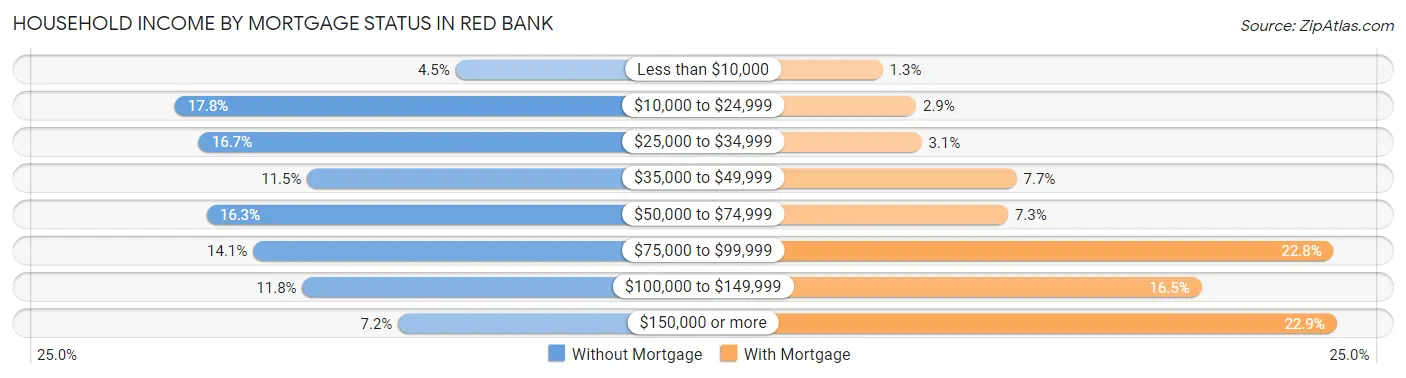
| Household Income | Without Mortgage | With Mortgage |
| Less than $10,000 | 59 (4.5%) | 25 (1.3%) |
| $10,000 to $24,999 | 235 (17.8%) | 56 (2.9%) |
| $25,000 to $34,999 | 220 (16.7%) | 61 (3.1%) |
| $35,000 to $49,999 | 152 (11.5%) | 149 (7.7%) |
| $50,000 to $74,999 | 215 (16.3%) | 141 (7.3%) |
| $75,000 to $99,999 | 186 (14.1%) | 442 (22.8%) |
| $100,000 to $149,999 | 155 (11.8%) | 320 (16.5%) |
| $150,000 or more | 95 (7.2%) | 445 (22.9%) |
| Total | 1,317 (100.0%) | 1,942 (100.0%) |
Property Value to Household Income Ratio in Red Bank
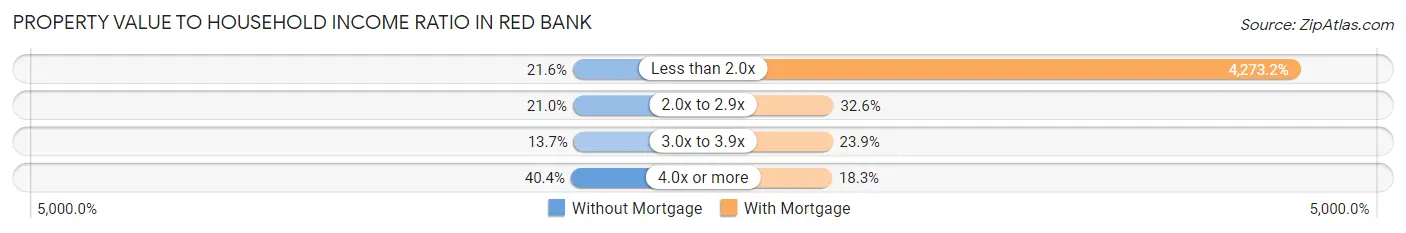
| Value-to-Income Ratio | Without Mortgage | With Mortgage |
| Less than 2.0x | 284 (21.6%) | 82,985 (4,273.2%) |
| 2.0x to 2.9x | 277 (21.0%) | 633 (32.6%) |
| 3.0x to 3.9x | 180 (13.7%) | 465 (23.9%) |
| 4.0x or more | 532 (40.4%) | 356 (18.3%) |
| Total | 1,317 (100.0%) | 1,942 (100.0%) |
Real Estate Taxes by Mortgage Status in Red Bank
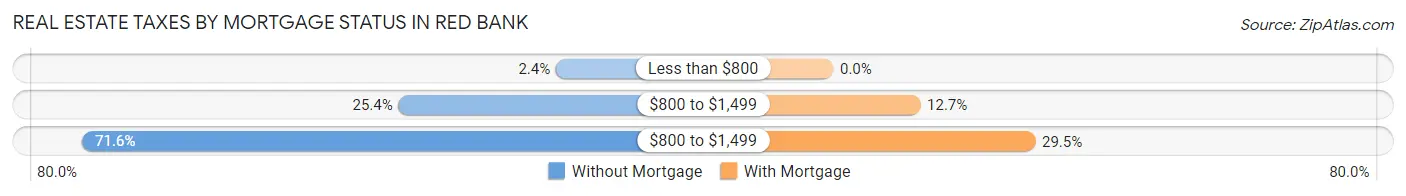
| Property Taxes | Without Mortgage | With Mortgage |
| Less than $800 | 31 (2.4%) | 0 (0.0%) |
| $800 to $1,499 | 334 (25.4%) | 247 (12.7%) |
| $800 to $1,499 | 943 (71.6%) | 573 (29.5%) |
| Total | 1,317 (100.0%) | 1,942 (100.0%) |
Health & Disability in Red Bank
Health Insurance Coverage by Age in Red Bank
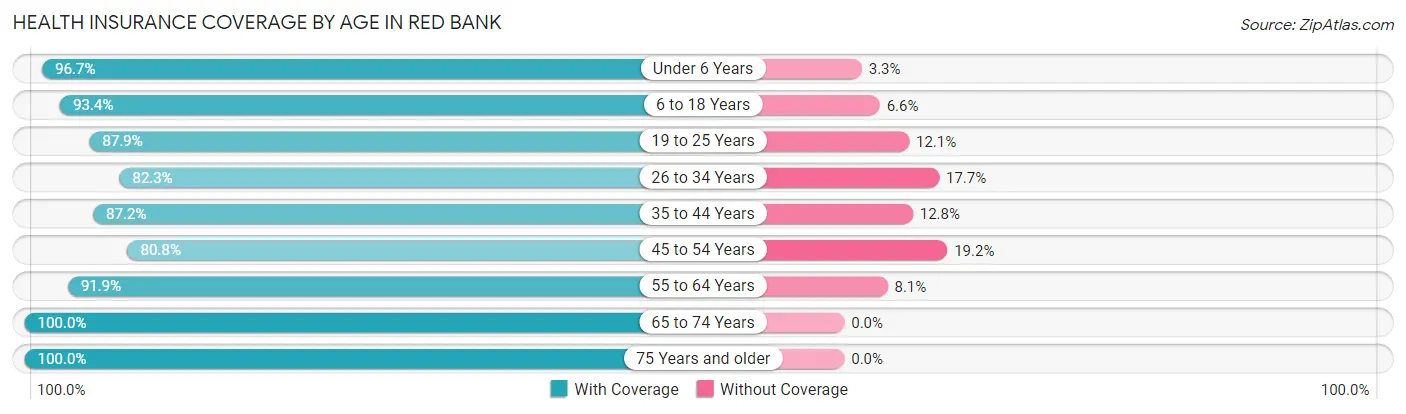
| Age Bracket | With Coverage | Without Coverage |
| Under 6 Years | 624 (96.7%) | 21 (3.3%) |
| 6 to 18 Years | 1,160 (93.4%) | 82 (6.6%) |
| 19 to 25 Years | 983 (87.9%) | 135 (12.1%) |
| 26 to 34 Years | 1,989 (82.3%) | 427 (17.7%) |
| 35 to 44 Years | 1,578 (87.2%) | 231 (12.8%) |
| 45 to 54 Years | 1,052 (80.8%) | 250 (19.2%) |
| 55 to 64 Years | 1,438 (91.9%) | 126 (8.1%) |
| 65 to 74 Years | 1,038 (100.0%) | 0 (0.0%) |
| 75 Years and older | 772 (100.0%) | 0 (0.0%) |
| Total | 10,634 (89.3%) | 1,272 (10.7%) |
Health Insurance Coverage by Citizenship Status in Red Bank
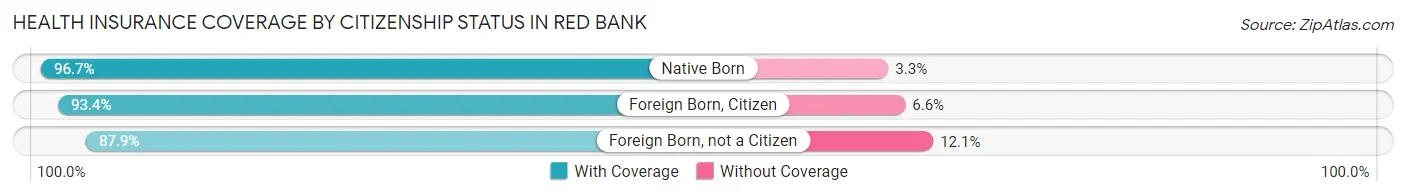
| Citizenship Status | With Coverage | Without Coverage |
| Native Born | 624 (96.7%) | 21 (3.3%) |
| Foreign Born, Citizen | 1,160 (93.4%) | 82 (6.6%) |
| Foreign Born, not a Citizen | 983 (87.9%) | 135 (12.1%) |
Health Insurance Coverage by Household Income in Red Bank
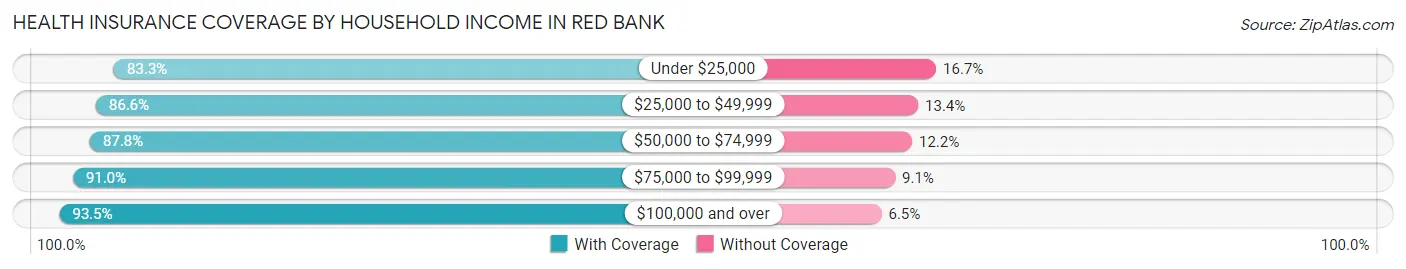
| Household Income | With Coverage | Without Coverage |
| Under $25,000 | 1,338 (83.3%) | 269 (16.7%) |
| $25,000 to $49,999 | 1,810 (86.6%) | 279 (13.4%) |
| $50,000 to $74,999 | 2,253 (87.8%) | 314 (12.2%) |
| $75,000 to $99,999 | 1,437 (90.9%) | 143 (9.0%) |
| $100,000 and over | 3,776 (93.5%) | 263 (6.5%) |
Public vs Private Health Insurance Coverage by Age in Red Bank
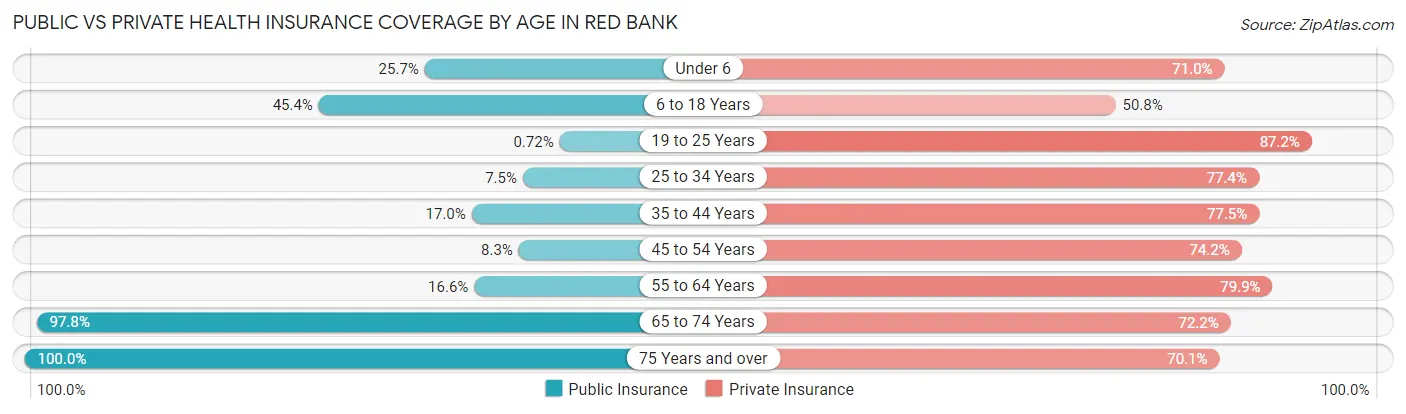
| Age Bracket | Public Insurance | Private Insurance |
| Under 6 | 166 (25.7%) | 458 (71.0%) |
| 6 to 18 Years | 564 (45.4%) | 631 (50.8%) |
| 19 to 25 Years | 8 (0.7%) | 975 (87.2%) |
| 25 to 34 Years | 182 (7.5%) | 1,870 (77.4%) |
| 35 to 44 Years | 308 (17.0%) | 1,401 (77.4%) |
| 45 to 54 Years | 108 (8.3%) | 966 (74.2%) |
| 55 to 64 Years | 259 (16.6%) | 1,250 (79.9%) |
| 65 to 74 Years | 1,015 (97.8%) | 749 (72.2%) |
| 75 Years and over | 772 (100.0%) | 541 (70.1%) |
| Total | 3,382 (28.4%) | 8,841 (74.3%) |
Disability Status by Sex by Age in Red Bank
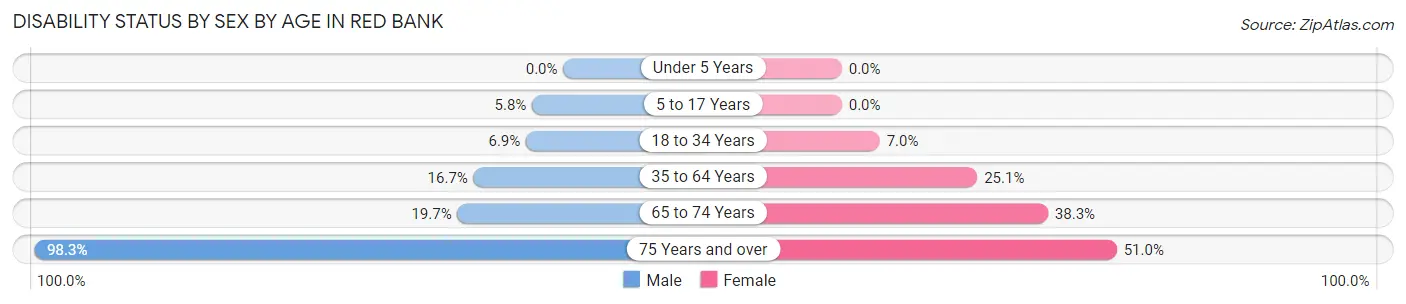
| Age Bracket | Male | Female |
| Under 5 Years | 0 (0.0%) | 0 (0.0%) |
| 5 to 17 Years | 23 (5.8%) | 0 (0.0%) |
| 18 to 34 Years | 129 (6.9%) | 124 (7.0%) |
| 35 to 64 Years | 393 (16.7%) | 582 (25.1%) |
| 65 to 74 Years | 91 (19.7%) | 220 (38.3%) |
| 75 Years and over | 281 (98.3%) | 248 (51.0%) |
Disability Class by Sex by Age in Red Bank
Disability Class: Hearing Difficulty
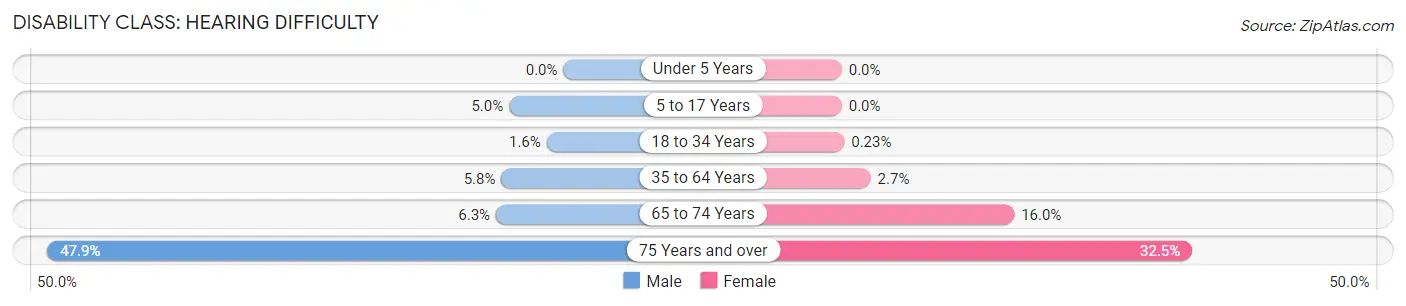
| Age Bracket | Male | Female |
| Under 5 Years | 0 (0.0%) | 0 (0.0%) |
| 5 to 17 Years | 20 (5.0%) | 0 (0.0%) |
| 18 to 34 Years | 29 (1.5%) | 4 (0.2%) |
| 35 to 64 Years | 136 (5.8%) | 62 (2.7%) |
| 65 to 74 Years | 29 (6.3%) | 92 (16.0%) |
| 75 Years and over | 137 (47.9%) | 158 (32.5%) |
Disability Class: Vision Difficulty
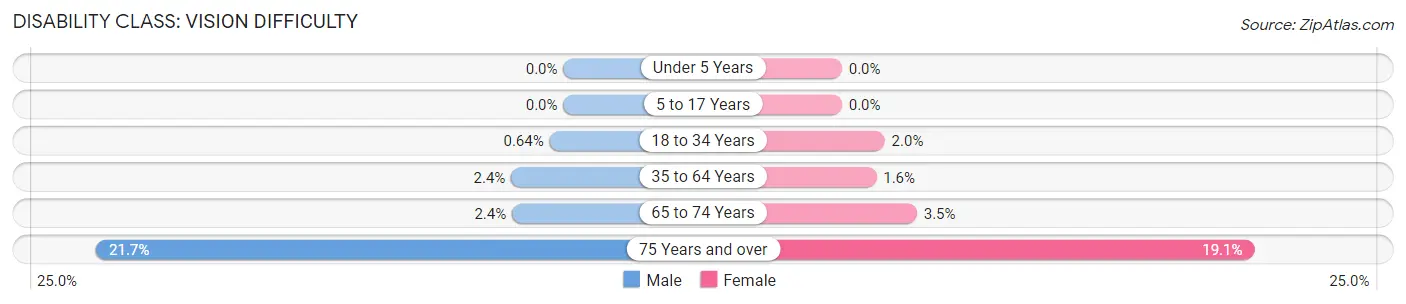
| Age Bracket | Male | Female |
| Under 5 Years | 0 (0.0%) | 0 (0.0%) |
| 5 to 17 Years | 0 (0.0%) | 0 (0.0%) |
| 18 to 34 Years | 12 (0.6%) | 35 (2.0%) |
| 35 to 64 Years | 57 (2.4%) | 37 (1.6%) |
| 65 to 74 Years | 11 (2.4%) | 20 (3.5%) |
| 75 Years and over | 62 (21.7%) | 93 (19.1%) |
Disability Class: Cognitive Difficulty
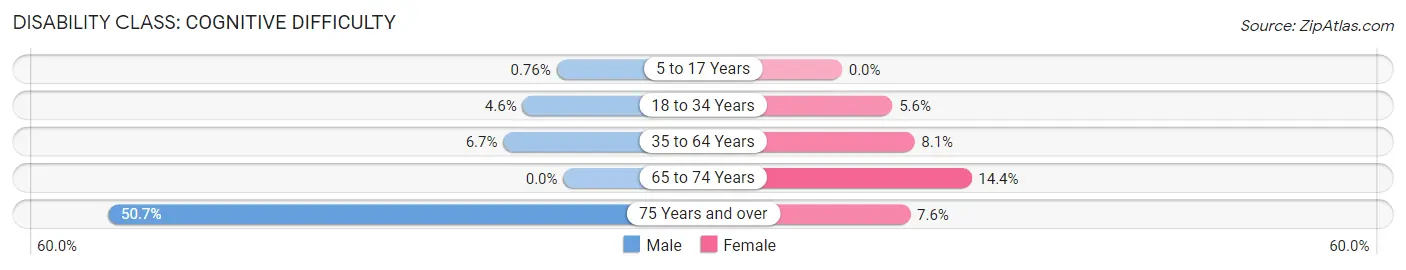
| Age Bracket | Male | Female |
| 5 to 17 Years | 3 (0.8%) | 0 (0.0%) |
| 18 to 34 Years | 85 (4.5%) | 99 (5.6%) |
| 35 to 64 Years | 158 (6.7%) | 187 (8.1%) |
| 65 to 74 Years | 0 (0.0%) | 83 (14.4%) |
| 75 Years and over | 145 (50.7%) | 37 (7.6%) |
Disability Class: Ambulatory Difficulty
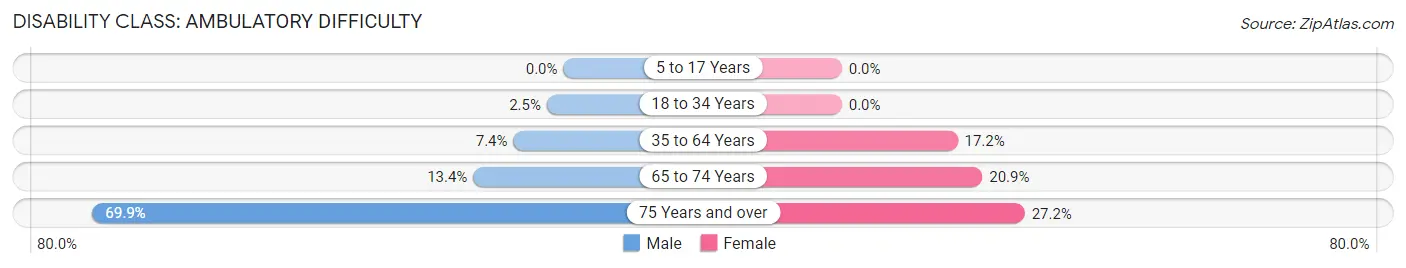
| Age Bracket | Male | Female |
| 5 to 17 Years | 0 (0.0%) | 0 (0.0%) |
| 18 to 34 Years | 46 (2.5%) | 0 (0.0%) |
| 35 to 64 Years | 175 (7.4%) | 398 (17.2%) |
| 65 to 74 Years | 62 (13.4%) | 120 (20.9%) |
| 75 Years and over | 200 (69.9%) | 132 (27.2%) |
Disability Class: Self-Care Difficulty
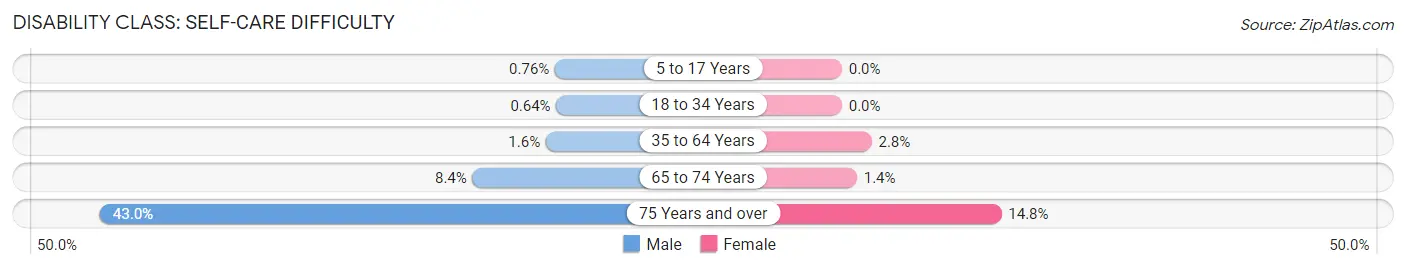
| Age Bracket | Male | Female |
| 5 to 17 Years | 3 (0.8%) | 0 (0.0%) |
| 18 to 34 Years | 12 (0.6%) | 0 (0.0%) |
| 35 to 64 Years | 38 (1.6%) | 64 (2.8%) |
| 65 to 74 Years | 39 (8.4%) | 8 (1.4%) |
| 75 Years and over | 123 (43.0%) | 72 (14.8%) |
Technology Access in Red Bank
Computing Device Access in Red Bank
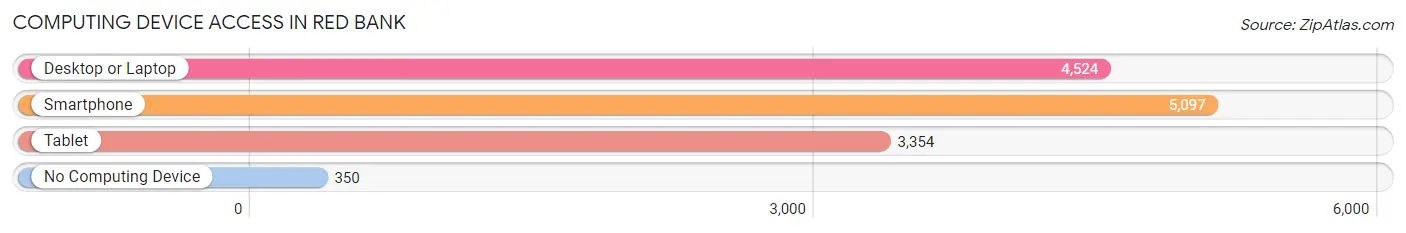
| Device Type | # Households | % Households |
| Desktop or Laptop | 4,524 | 78.7% |
| Smartphone | 5,097 | 88.6% |
| Tablet | 3,354 | 58.3% |
| No Computing Device | 350 | 6.1% |
| Total | 5,750 | 100.0% |
Internet Access in Red Bank
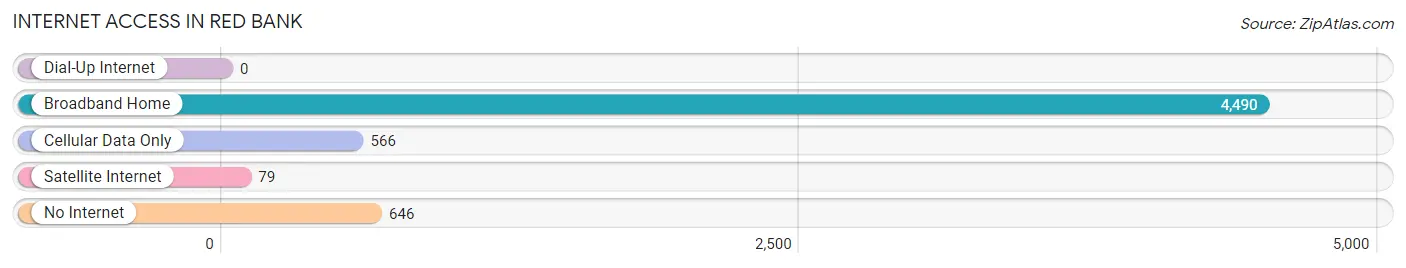
| Internet Type | # Households | % Households |
| Dial-Up Internet | 0 | 0.0% |
| Broadband Home | 4,490 | 78.1% |
| Cellular Data Only | 566 | 9.8% |
| Satellite Internet | 79 | 1.4% |
| No Internet | 646 | 11.2% |
| Total | 5,750 | 100.0% |
Red Bank Summary
Introduction
Red Bank, Tennessee is a small town located in Hamilton County, Tennessee. It is situated on the Tennessee River and is part of the Chattanooga metropolitan area. The town has a population of approximately 10,000 people and is known for its small-town charm and friendly atmosphere. Red Bank is home to a variety of businesses, including restaurants, retail stores, and professional services. The town is also home to several parks and recreational areas, making it a great place to live and visit.
History
Red Bank was founded in 1839 by a group of settlers from North Carolina. The town was originally named Red Bank because of the red clay soil in the area. The town was incorporated in 1845 and was the first town in Hamilton County to be incorporated.
The town grew rapidly in the late 19th century, and by the early 20th century, it had become a thriving community. The town was home to several businesses, including a cotton mill, a sawmill, and a gristmill. The town also had a railroad station, which connected it to Chattanooga and other nearby towns.
In the late 20th century, Red Bank experienced a period of decline. The cotton mill and other businesses closed, and the population began to decline. However, in recent years, the town has experienced a resurgence. New businesses have opened, and the population has grown.
Geography
Red Bank is located in Hamilton County, Tennessee. It is situated on the Tennessee River and is part of the Chattanooga metropolitan area. The town is located approximately 10 miles from downtown Chattanooga and is bordered by the cities of East Ridge and Signal Mountain.
The town has a total area of 4.2 square miles, all of which is land. The terrain is mostly flat, with some rolling hills. The town is located in a temperate climate, with hot summers and mild winters.
Economy
Red Bank has a diverse economy, with a variety of businesses and industries. The town is home to several restaurants, retail stores, and professional services. The town is also home to several manufacturing companies, including a steel mill and a paper mill.
The town is also home to several parks and recreational areas, including the Red Bank Greenway, which is a popular destination for hikers and cyclists. The town is also home to several festivals and events throughout the year, including the Red Bank Riverfest and the Red Bank Arts Festival.
Demographics
As of the 2010 census, Red Bank had a population of 10,297 people. The population is predominantly white (90.2%), with small percentages of African American (4.3%), Hispanic (2.2%), and Asian (1.3%) residents. The median household income is $45,945, and the median age is 37.
Conclusion
Red Bank, Tennessee is a small town located in Hamilton County, Tennessee. It is situated on the Tennessee River and is part of the Chattanooga metropolitan area. The town has a population of approximately 10,000 people and is known for its small-town charm and friendly atmosphere. Red Bank is home to a variety of businesses, including restaurants, retail stores, and professional services. The town is also home to several parks and recreational areas, making it a great place to live and visit. The town has a diverse economy, with a variety of businesses and industries. The population is predominantly white, with small percentages of African American, Hispanic, and Asian residents. Red Bank is a great place to live and visit, and it is sure to continue to grow and thrive in the years to come.
Common Questions
What is the Total Population of Red Bank?
Total Population of Red Bank is 11,919.
What is the Total Male Population of Red Bank?
Total Male Population of Red Bank is 5,695.
What is the Total Female Population of Red Bank?
Total Female Population of Red Bank is 6,224.
What is the Ratio of Males per 100 Females in Red Bank?
There are 91.50 Males per 100 Females in Red Bank.
What is the Ratio of Females per 100 Males in Red Bank?
There are 109.29 Females per 100 Males in Red Bank.
What is the Median Population Age in Red Bank?
Median Population Age in Red Bank is 37.4 Years.
What is the Average Family Size in Red Bank
Average Family Size in Red Bank is 2.7 People.
What is the Average Household Size in Red Bank
Average Household Size in Red Bank is 2.1 People.
What is Per Capita Income in Red Bank?
Per Capita income in Red Bank is $41,102.
What is the Median Family Income in Red Bank?
Median Family Income in Red Bank is $81,577.
What is the Median Household income in Red Bank?
Median Household Income in Red Bank is $59,027.
What is Income or Wage Gap in Red Bank?
Income or Wage Gap in Red Bank is 26.8%.
Women in Red Bank earn 73.2 cents for every dollar earned by a man.
What is Family Income Deficit in Red Bank?
Family Income Deficit in Red Bank is $12,194.
Families that are below poverty line in Red Bank earn $12,194 less on average than the poverty threshold level.
What is Inequality or Gini Index in Red Bank?
Inequality or Gini Index in Red Bank is 0.47.
How Large is the Labor Force in Red Bank?
There are 7,387 People in the Labor Forcein in Red Bank.
What is the Percentage of People in the Labor Force in Red Bank?
71.7% of People are in the Labor Force in Red Bank.
What is the Unemployment Rate in Red Bank?
Unemployment Rate in Red Bank is 3.4%.