Ridgeside, TN
Ridgeside Map
Ridgeside Overview
919
TOTAL POPULATION
514
MALE POPULATION
405
FEMALE POPULATION
126.91
MALES / 100 FEMALES
78.79
FEMALES / 100 MALES
42.2
MEDIAN AGE
3.7
AVG FAMILY SIZE
3.5
AVG HOUSEHOLD SIZE
$59,830
PER CAPITA INCOME
$166,250
AVG FAMILY INCOME
$158,750
AVG HOUSEHOLD INCOME
20.5%
WAGE / INCOME GAP [ % ]
79.5¢/ $1
WAGE / INCOME GAP [ $ ]
$16,189
FAMILY INCOME DEFICIT
0.37
INEQUALITY / GINI INDEX
430
LABOR FORCE [ PEOPLE ]
68.3%
PERCENT IN LABOR FORCE
0.7%
UNEMPLOYMENT RATE
Ridgeside Area Codes
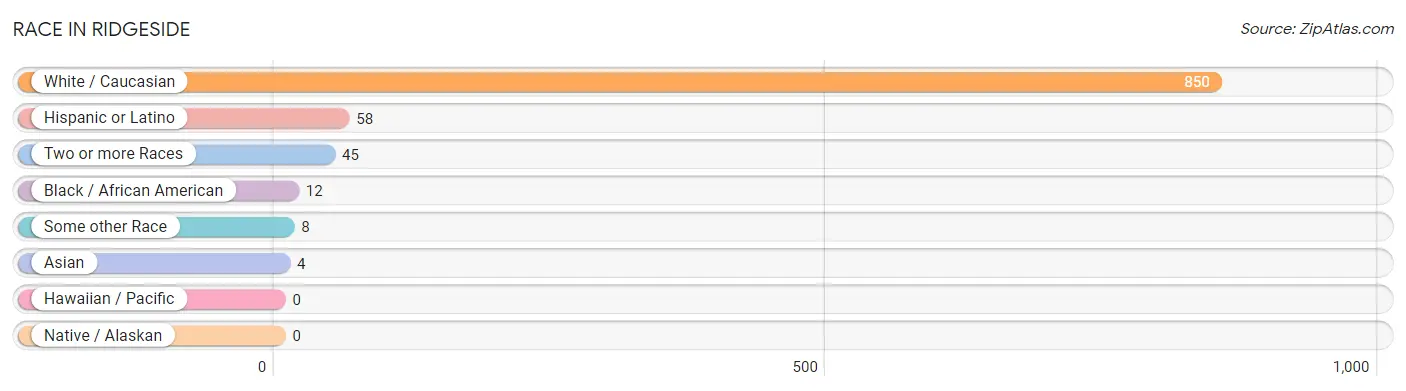
Race in Ridgeside
The most populous races in Ridgeside are White / Caucasian (850 | 92.5%), Hispanic or Latino (58 | 6.3%), and Two or more Races (45 | 4.9%).
| Race | # Population | % Population |
| Asian | 4 | 0.4% |
| Black / African American | 12 | 1.3% |
| Hawaiian / Pacific | 0 | 0.0% |
| Hispanic or Latino | 58 | 6.3% |
| Native / Alaskan | 0 | 0.0% |
| White / Caucasian | 850 | 92.5% |
| Two or more Races | 45 | 4.9% |
| Some other Race | 8 | 0.9% |
| Total | 919 | 100.0% |
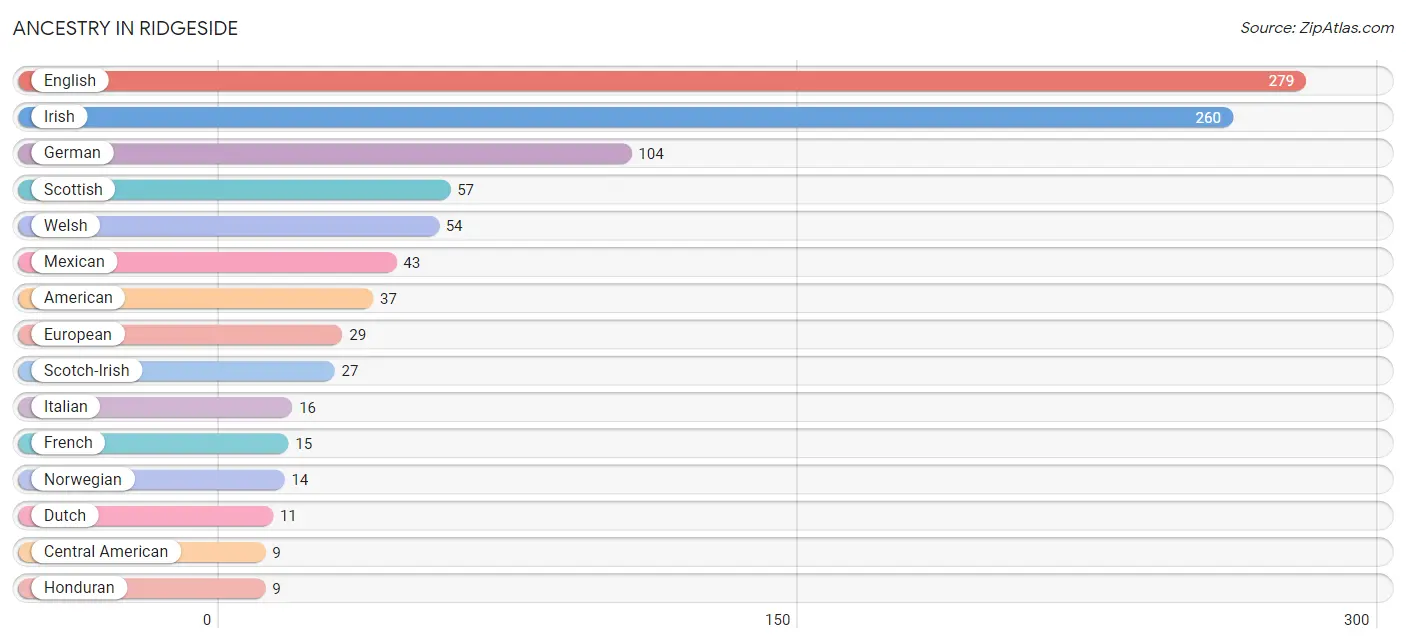
Ancestry in Ridgeside
The most populous ancestries reported in Ridgeside are English (279 | 30.4%), Irish (260 | 28.3%), German (104 | 11.3%), Scottish (57 | 6.2%), and Welsh (54 | 5.9%), together accounting for 82.1% of all Ridgeside residents.
| Ancestry | # Population | % Population |
| American | 37 | 4.0% |
| Central American | 9 | 1.0% |
| Cherokee | 1 | 0.1% |
| Czech | 6 | 0.6% |
| Dutch | 11 | 1.2% |
| English | 279 | 30.4% |
| European | 29 | 3.2% |
| French | 15 | 1.6% |
| German | 104 | 11.3% |
| Honduran | 9 | 1.0% |
| Hungarian | 2 | 0.2% |
| Indian (Asian) | 9 | 1.0% |
| Irish | 260 | 28.3% |
| Italian | 16 | 1.7% |
| Luxembourger | 4 | 0.4% |
| Mexican | 43 | 4.7% |
| Northern European | 1 | 0.1% |
| Norwegian | 14 | 1.5% |
| Polish | 9 | 1.0% |
| Portuguese | 3 | 0.3% |
| Puerto Rican | 3 | 0.3% |
| Romanian | 2 | 0.2% |
| Russian | 5 | 0.5% |
| Scandinavian | 3 | 0.3% |
| Scotch-Irish | 27 | 2.9% |
| Scottish | 57 | 6.2% |
| Serbian | 2 | 0.2% |
| South American | 1 | 0.1% |
| Spanish | 2 | 0.2% |
| Venezuelan | 1 | 0.1% |
| Welsh | 54 | 5.9% | View All 31 Rows |
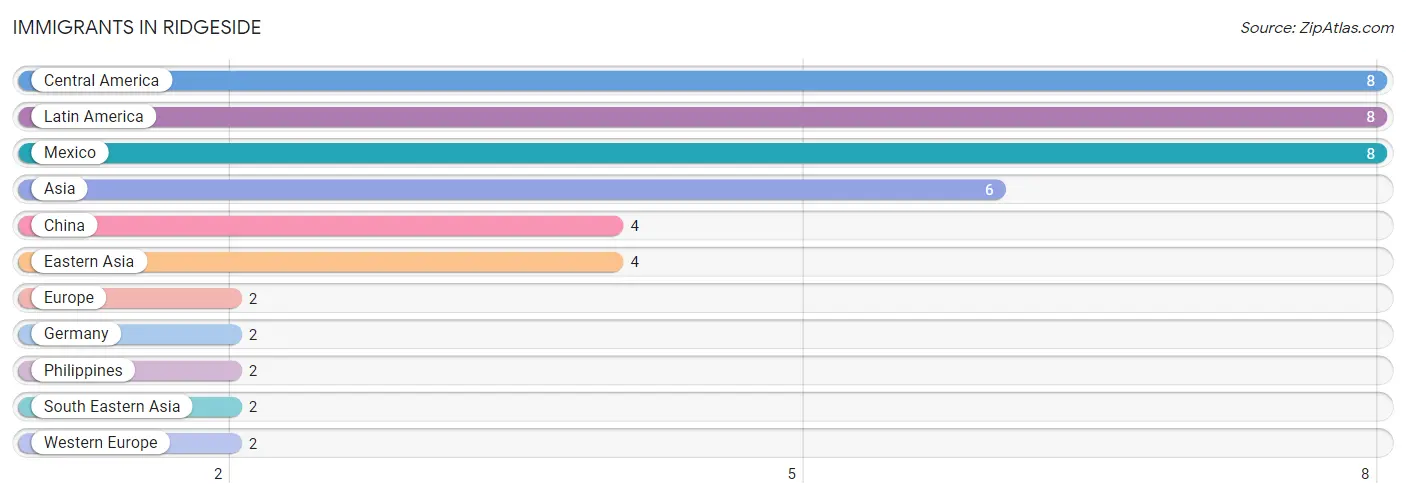
Immigrants in Ridgeside
The most numerous immigrant groups reported in Ridgeside came from Central America (8 | 0.9%), Latin America (8 | 0.9%), Mexico (8 | 0.9%), Asia (6 | 0.6%), and China (4 | 0.4%), together accounting for 3.7% of all Ridgeside residents.
| Immigration Origin | # Population | % Population |
| Asia | 6 | 0.6% |
| Central America | 8 | 0.9% |
| China | 4 | 0.4% |
| Eastern Asia | 4 | 0.4% |
| Europe | 2 | 0.2% |
| Germany | 2 | 0.2% |
| Latin America | 8 | 0.9% |
| Mexico | 8 | 0.9% |
| Philippines | 2 | 0.2% |
| South Eastern Asia | 2 | 0.2% |
| Western Europe | 2 | 0.2% | View All 11 Rows |
Sex and Age in Ridgeside
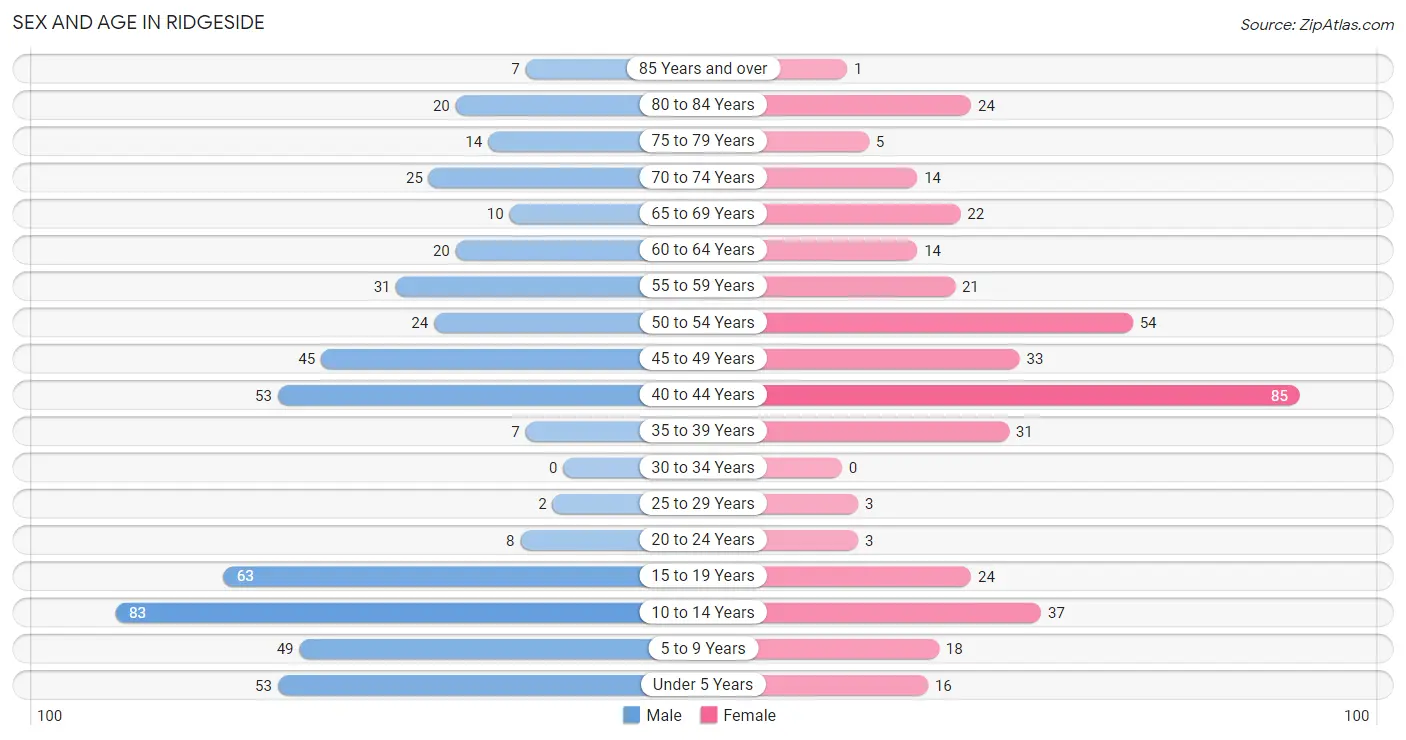
Sex and Age in Ridgeside
The most populous age groups in Ridgeside are 10 to 14 Years (83 | 16.2%) for men and 40 to 44 Years (85 | 21.0%) for women.
| Age Bracket | Male | Female |
| Under 5 Years | 53 (10.3%) | 16 (4.0%) |
| 5 to 9 Years | 49 (9.5%) | 18 (4.4%) |
| 10 to 14 Years | 83 (16.2%) | 37 (9.1%) |
| 15 to 19 Years | 63 (12.3%) | 24 (5.9%) |
| 20 to 24 Years | 8 (1.6%) | 3 (0.7%) |
| 25 to 29 Years | 2 (0.4%) | 3 (0.7%) |
| 30 to 34 Years | 0 (0.0%) | 0 (0.0%) |
| 35 to 39 Years | 7 (1.4%) | 31 (7.6%) |
| 40 to 44 Years | 53 (10.3%) | 85 (21.0%) |
| 45 to 49 Years | 45 (8.7%) | 33 (8.2%) |
| 50 to 54 Years | 24 (4.7%) | 54 (13.3%) |
| 55 to 59 Years | 31 (6.0%) | 21 (5.2%) |
| 60 to 64 Years | 20 (3.9%) | 14 (3.5%) |
| 65 to 69 Years | 10 (1.9%) | 22 (5.4%) |
| 70 to 74 Years | 25 (4.9%) | 14 (3.5%) |
| 75 to 79 Years | 14 (2.7%) | 5 (1.2%) |
| 80 to 84 Years | 20 (3.9%) | 24 (5.9%) |
| 85 Years and over | 7 (1.4%) | 1 (0.3%) |
| Total | 514 (100.0%) | 405 (100.0%) |
Families and Households in Ridgeside
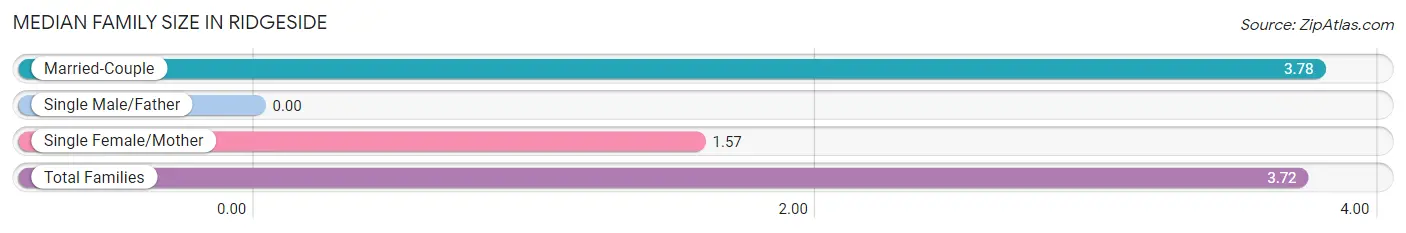
Median Family Size in Ridgeside
| Family Type | # Families | Family Size |
| Married-Couple | 234 (97.1%) | 3.78 |
| Single Male/Father | 0 (0.0%) | - |
| Single Female/Mother | 7 (2.9%) | 1.57 |
| Total Families | 241 (100.0%) | 3.72 |
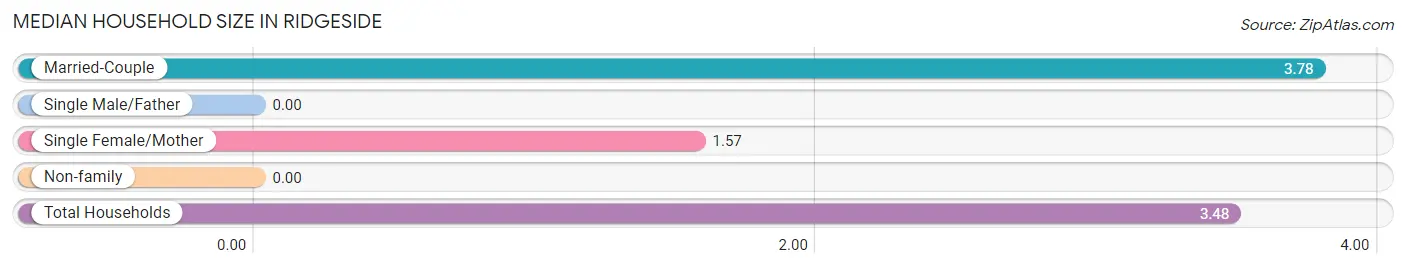
Median Household Size in Ridgeside
| Household Type | # Households | Household Size |
| Married-Couple | 234 (88.6%) | 3.78 |
| Single Male/Father | 0 (0.0%) | - |
| Single Female/Mother | 7 (2.6%) | 1.57 |
| Non-family | 23 (8.7%) | - |
| Total Households | 264 (100.0%) | 3.48 |
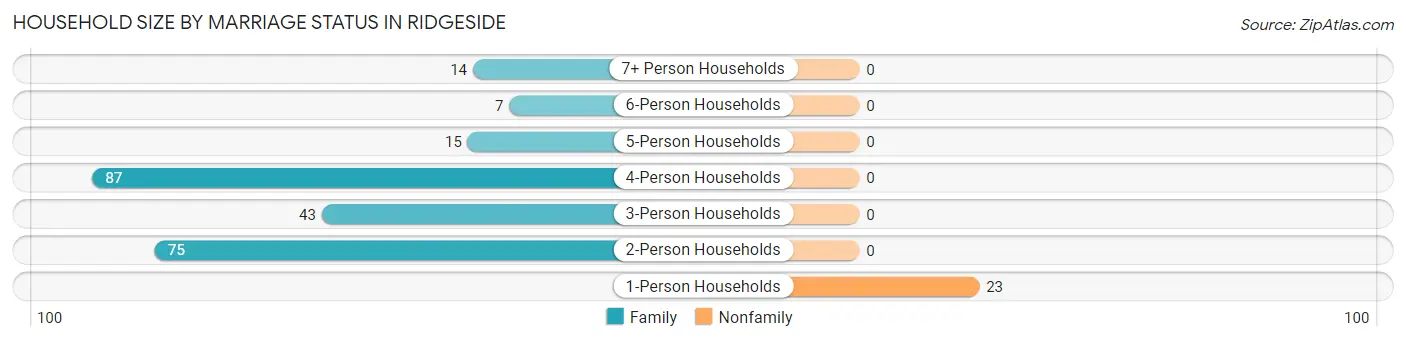
Household Size by Marriage Status in Ridgeside
Out of a total of 264 households in Ridgeside, 241 (91.3%) are family households, while 23 (8.7%) are nonfamily households. The most numerous type of family households are 4-person households, comprising 87, and the most common type of nonfamily households are 1-person households, comprising 23.
| Household Size | Family Households | Nonfamily Households |
| 1-Person Households | - | 23 (8.7%) |
| 2-Person Households | 75 (28.4%) | 0 (0.0%) |
| 3-Person Households | 43 (16.3%) | 0 (0.0%) |
| 4-Person Households | 87 (33.0%) | 0 (0.0%) |
| 5-Person Households | 15 (5.7%) | 0 (0.0%) |
| 6-Person Households | 7 (2.6%) | 0 (0.0%) |
| 7+ Person Households | 14 (5.3%) | 0 (0.0%) |
| Total | 241 (91.3%) | 23 (8.7%) |
Female Fertility in Ridgeside
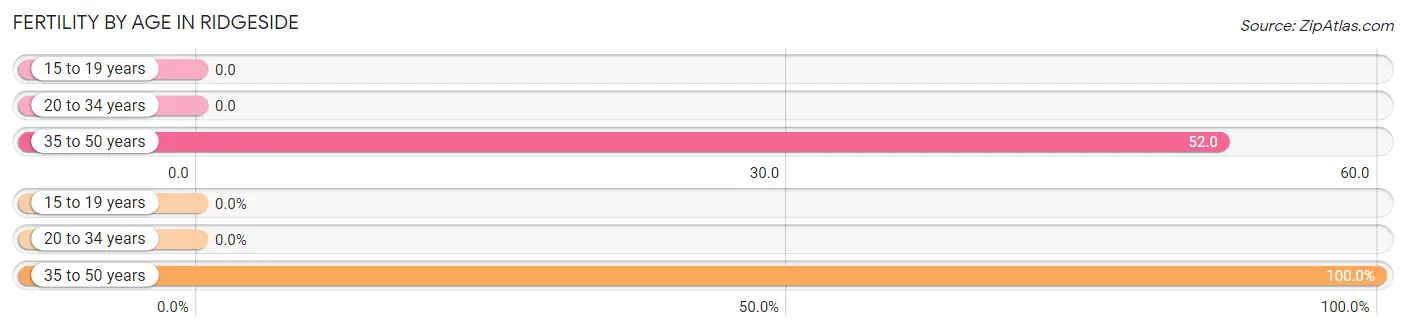
Fertility by Age in Ridgeside
Average fertility rate in Ridgeside is 44.0 births per 1,000 women. Women in the age bracket of 35 to 50 years have the highest fertility rate with 52.0 births per 1,000 women. Women in the age bracket of 35 to 50 years acount for 100.0% of all women with births.
| Age Bracket | Women with Births | Births / 1,000 Women |
| 15 to 19 years | 0 (0.0%) | 0.0 |
| 20 to 34 years | 0 (0.0%) | 0.0 |
| 35 to 50 years | 8 (100.0%) | 52.0 |
| Total | 8 (100.0%) | 44.0 |
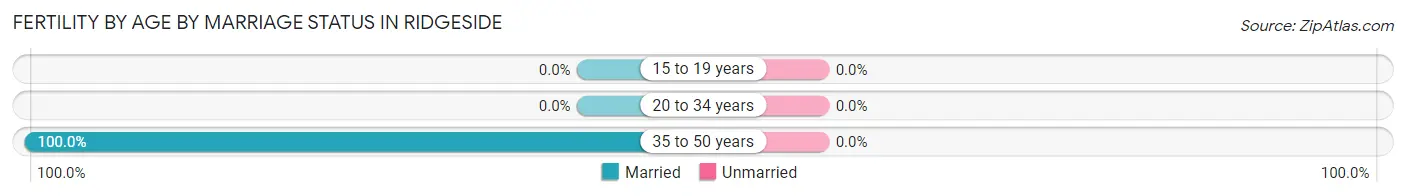
Fertility by Age by Marriage Status in Ridgeside
| Age Bracket | Married | Unmarried |
| 15 to 19 years | 0 (0.0%) | 0 (0.0%) |
| 20 to 34 years | 0 (0.0%) | 0 (0.0%) |
| 35 to 50 years | 8 (100.0%) | 0 (0.0%) |
| Total | 8 (100.0%) | 0 (0.0%) |
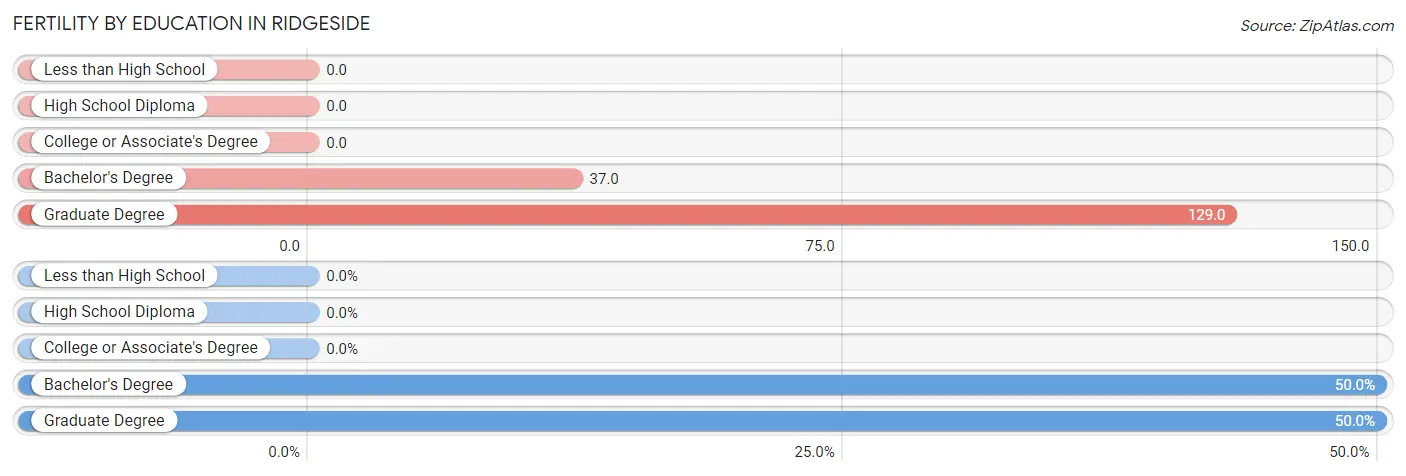
Fertility by Education in Ridgeside
| Educational Attainment | Women with Births | Births / 1,000 Women |
| Less than High School | 0 (0.0%) | 0.0 |
| High School Diploma | 0 (0.0%) | 0.0 |
| College or Associate's Degree | 0 (0.0%) | 0.0 |
| Bachelor's Degree | 4 (50.0%) | 37.0 |
| Graduate Degree | 4 (50.0%) | 129.0 |
| Total | 8 (100.0%) | 44.0 |
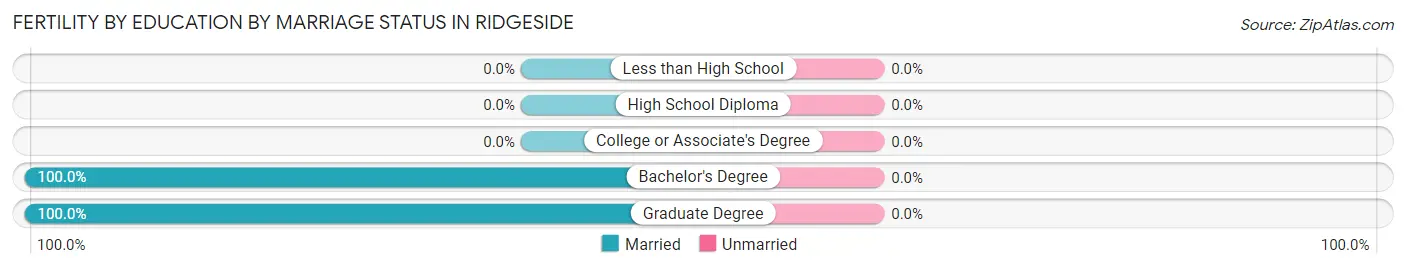
Fertility by Education by Marriage Status in Ridgeside
| Educational Attainment | Married | Unmarried |
| Less than High School | 0 (0.0%) | 0 (0.0%) |
| High School Diploma | 0 (0.0%) | 0 (0.0%) |
| College or Associate's Degree | 0 (0.0%) | 0 (0.0%) |
| Bachelor's Degree | 4 (100.0%) | 0 (0.0%) |
| Graduate Degree | 4 (100.0%) | 0 (0.0%) |
| Total | 8 (100.0%) | 0 (0.0%) |
Income in Ridgeside
Income Overview in Ridgeside
Per Capita Income in Ridgeside is $59,830, while median incomes of families and households are $166,250 and $158,750 respectively.
| Characteristic | Number | Measure |
| Per Capita Income | 919 | $59,830 |
| Median Family Income | 241 | $166,250 |
| Mean Family Income | 241 | $198,939 |
| Median Household Income | 264 | $158,750 |
| Mean Household Income | 264 | $189,794 |
| Income Deficit | 241 | $16,189 |
| Wage / Income Gap (%) | 919 | 20.49% |
| Wage / Income Gap ($) | 919 | 79.51¢ per $1 |
| Gini / Inequality Index | 919 | 0.37 |
Earnings by Sex in Ridgeside
Average Earnings in Ridgeside are $56,917, $55,089 for men and $69,286 for women, a difference of 20.5%.
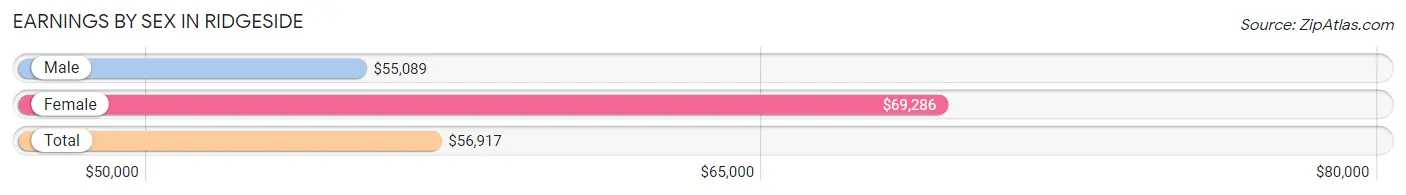
| Sex | Number | Average Earnings |
| Male | 257 (54.6%) | $55,089 |
| Female | 214 (45.4%) | $69,286 |
| Total | 471 (100.0%) | $56,917 |
Earnings by Sex by Income Bracket in Ridgeside
The most common earnings brackets in Ridgeside are $100,000+ for men (63 | 24.5%) and $100,000+ for women (83 | 38.8%).
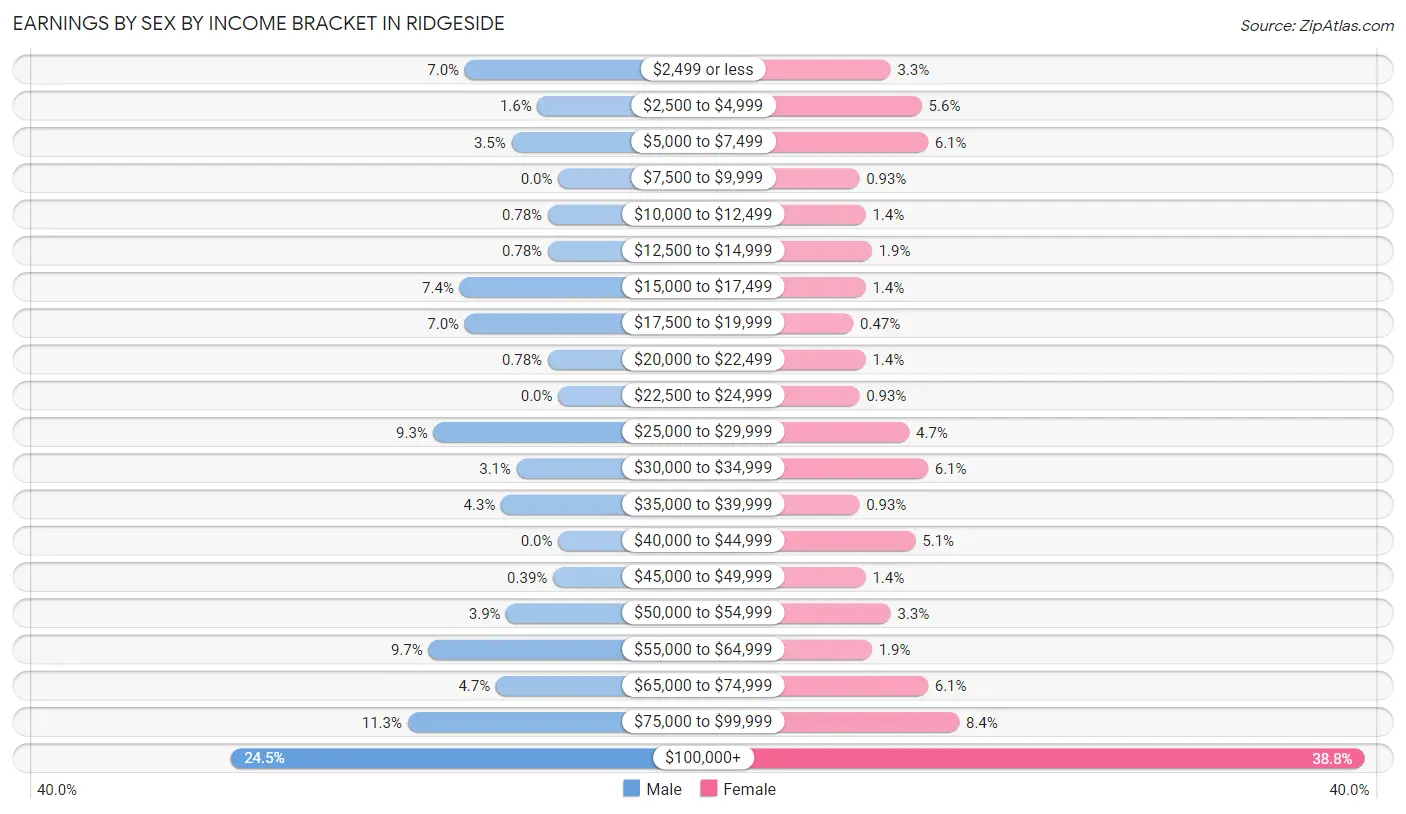
| Income | Male | Female |
| $2,499 or less | 18 (7.0%) | 7 (3.3%) |
| $2,500 to $4,999 | 4 (1.6%) | 12 (5.6%) |
| $5,000 to $7,499 | 9 (3.5%) | 13 (6.1%) |
| $7,500 to $9,999 | 0 (0.0%) | 2 (0.9%) |
| $10,000 to $12,499 | 2 (0.8%) | 3 (1.4%) |
| $12,500 to $14,999 | 2 (0.8%) | 4 (1.9%) |
| $15,000 to $17,499 | 19 (7.4%) | 3 (1.4%) |
| $17,500 to $19,999 | 18 (7.0%) | 1 (0.5%) |
| $20,000 to $22,499 | 2 (0.8%) | 3 (1.4%) |
| $22,500 to $24,999 | 0 (0.0%) | 2 (0.9%) |
| $25,000 to $29,999 | 24 (9.3%) | 10 (4.7%) |
| $30,000 to $34,999 | 8 (3.1%) | 13 (6.1%) |
| $35,000 to $39,999 | 11 (4.3%) | 2 (0.9%) |
| $40,000 to $44,999 | 0 (0.0%) | 11 (5.1%) |
| $45,000 to $49,999 | 1 (0.4%) | 3 (1.4%) |
| $50,000 to $54,999 | 10 (3.9%) | 7 (3.3%) |
| $55,000 to $64,999 | 25 (9.7%) | 4 (1.9%) |
| $65,000 to $74,999 | 12 (4.7%) | 13 (6.1%) |
| $75,000 to $99,999 | 29 (11.3%) | 18 (8.4%) |
| $100,000+ | 63 (24.5%) | 83 (38.8%) |
| Total | 257 (100.0%) | 214 (100.0%) |
Earnings by Sex by Educational Attainment in Ridgeside
Average earnings in Ridgeside are $57,232 for men and $74,688 for women, a difference of 23.4%. Men with an educational attainment of bachelor's degree enjoy the highest average annual earnings of $90,500, while those with high school diploma education earn the least with $18,681. Women with an educational attainment of graduate degree earn the most with the average annual earnings of $77,500, while those with college or associate's degree education have the smallest earnings of $21,667.
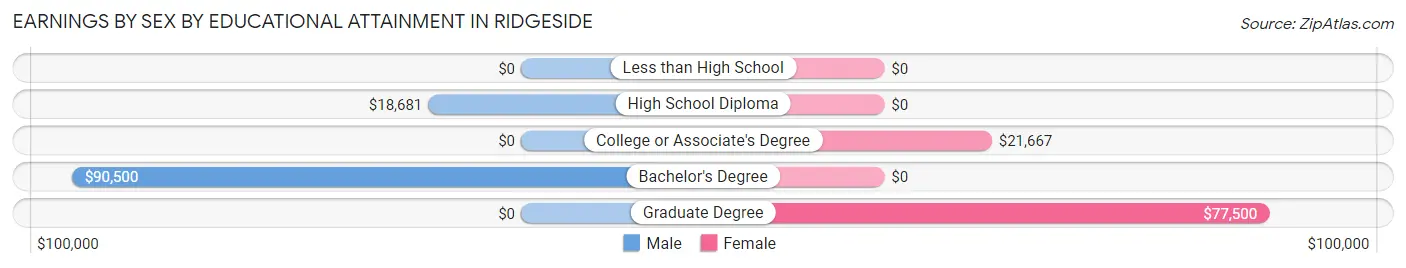
| Educational Attainment | Male Income | Female Income |
| Less than High School | - | - |
| High School Diploma | $18,681 | $0 |
| College or Associate's Degree | - | - |
| Bachelor's Degree | $90,500 | $0 |
| Graduate Degree | - | - |
| Total | $57,232 | $74,688 |
Family Income in Ridgeside
Family Income Brackets in Ridgeside
According to the Ridgeside family income data, there are 89 families falling into the $200,000+ income range, which is the most common income bracket and makes up 36.9% of all families.
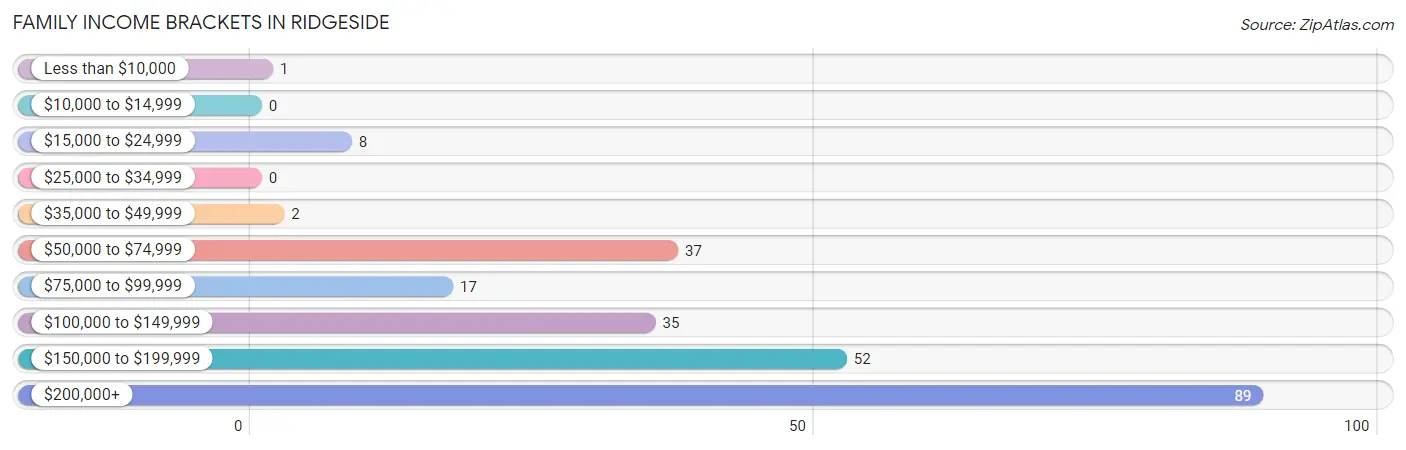
| Income Bracket | # Families | % Families |
| Less than $10,000 | 1 | 0.4% |
| $10,000 to $14,999 | 0 | 0.0% |
| $15,000 to $24,999 | 8 | 3.3% |
| $25,000 to $34,999 | 0 | 0.0% |
| $35,000 to $49,999 | 2 | 0.8% |
| $50,000 to $74,999 | 37 | 15.4% |
| $75,000 to $99,999 | 17 | 7.1% |
| $100,000 to $149,999 | 35 | 14.5% |
| $150,000 to $199,999 | 52 | 21.6% |
| $200,000+ | 89 | 36.9% |
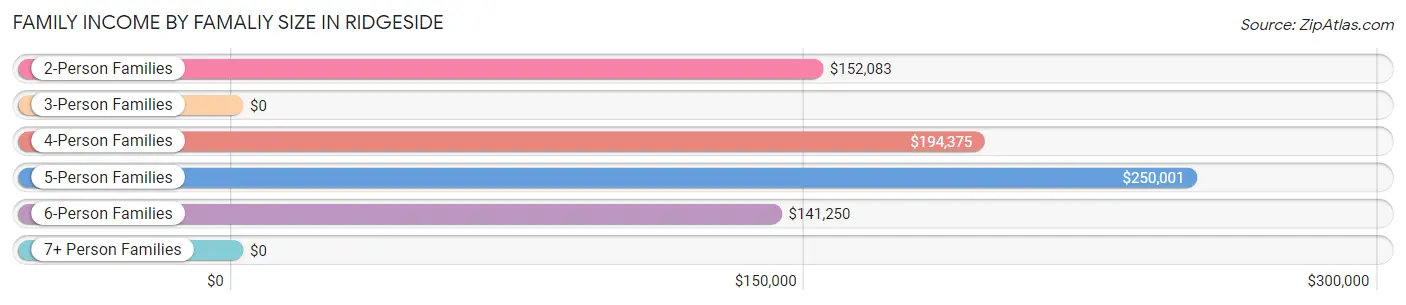
Family Income by Famaliy Size in Ridgeside
5-person families (15 | 6.2%) account for the highest median family income in Ridgeside with $250,001 per family, while 2-person families (75 | 31.1%) have the highest median income of $76,042 per family member.
| Income Bracket | # Families | Median Income |
| 2-Person Families | 75 (31.1%) | $152,083 |
| 3-Person Families | 43 (17.8%) | $0 |
| 4-Person Families | 87 (36.1%) | $194,375 |
| 5-Person Families | 15 (6.2%) | $250,001 |
| 6-Person Families | 7 (2.9%) | $141,250 |
| 7+ Person Families | 14 (5.8%) | $0 |
| Total | 241 (100.0%) | $166,250 |
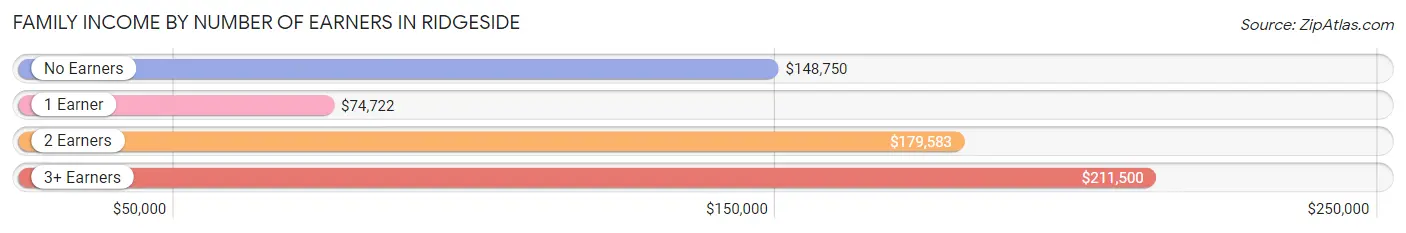
Family Income by Number of Earners in Ridgeside
The median family income in Ridgeside is $166,250, with families comprising 3+ earners (34) having the highest median family income of $211,500, while families with 1 earner (62) have the lowest median family income of $74,722, accounting for 14.1% and 25.7% of families, respectively.
| Number of Earners | # Families | Median Income |
| No Earners | 10 (4.2%) | $148,750 |
| 1 Earner | 62 (25.7%) | $74,722 |
| 2 Earners | 135 (56.0%) | $179,583 |
| 3+ Earners | 34 (14.1%) | $211,500 |
| Total | 241 (100.0%) | $166,250 |
Household Income in Ridgeside
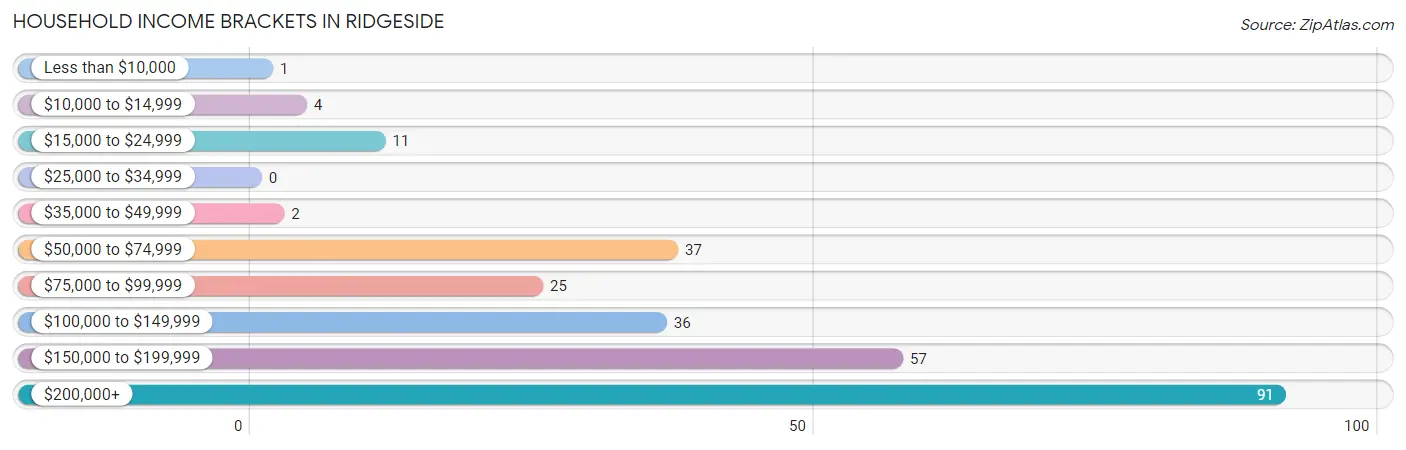
Household Income Brackets in Ridgeside
With 91 households falling in the category, the $200,000+ income range is the most frequent in Ridgeside, accounting for 34.5% of all households.
| Income Bracket | # Households | % Households |
| Less than $10,000 | 1 | 0.4% |
| $10,000 to $14,999 | 4 | 1.5% |
| $15,000 to $24,999 | 11 | 4.2% |
| $25,000 to $34,999 | 0 | 0.0% |
| $35,000 to $49,999 | 2 | 0.8% |
| $50,000 to $74,999 | 37 | 14.0% |
| $75,000 to $99,999 | 25 | 9.5% |
| $100,000 to $149,999 | 36 | 13.6% |
| $150,000 to $199,999 | 57 | 21.6% |
| $200,000+ | 91 | 34.5% |
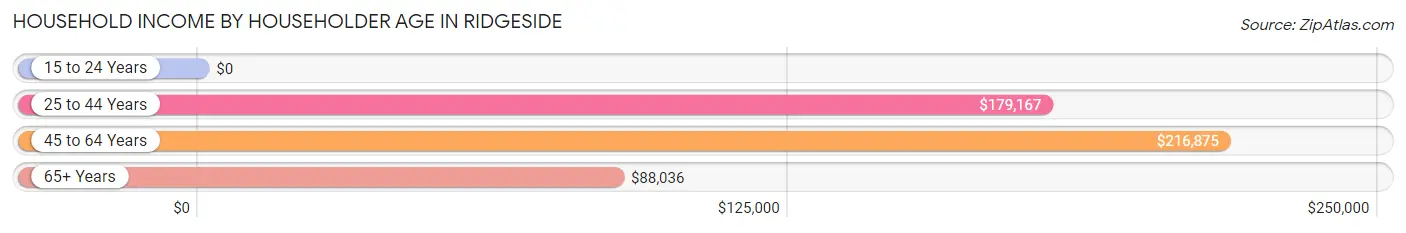
Household Income by Householder Age in Ridgeside
The median household income in Ridgeside is $158,750, with the highest median household income of $216,875 found in the 45 to 64 years age bracket for the primary householder. A total of 121 households (45.8%) fall into this category.
| Income Bracket | # Households | Median Income |
| 15 to 24 Years | 0 (0.0%) | $0 |
| 25 to 44 Years | 66 (25.0%) | $179,167 |
| 45 to 64 Years | 121 (45.8%) | $216,875 |
| 65+ Years | 77 (29.2%) | $88,036 |
| Total | 264 (100.0%) | $158,750 |
Poverty in Ridgeside
Income Below Poverty by Sex and Age in Ridgeside
With 3.9% poverty level for males and 7.9% for females among the residents of Ridgeside, 6 to 11 year old males and 16 and 17 year old females are the most vulnerable to poverty, with 11 males (12.6%) and 5 females (45.5%) in their respective age groups living below the poverty level.
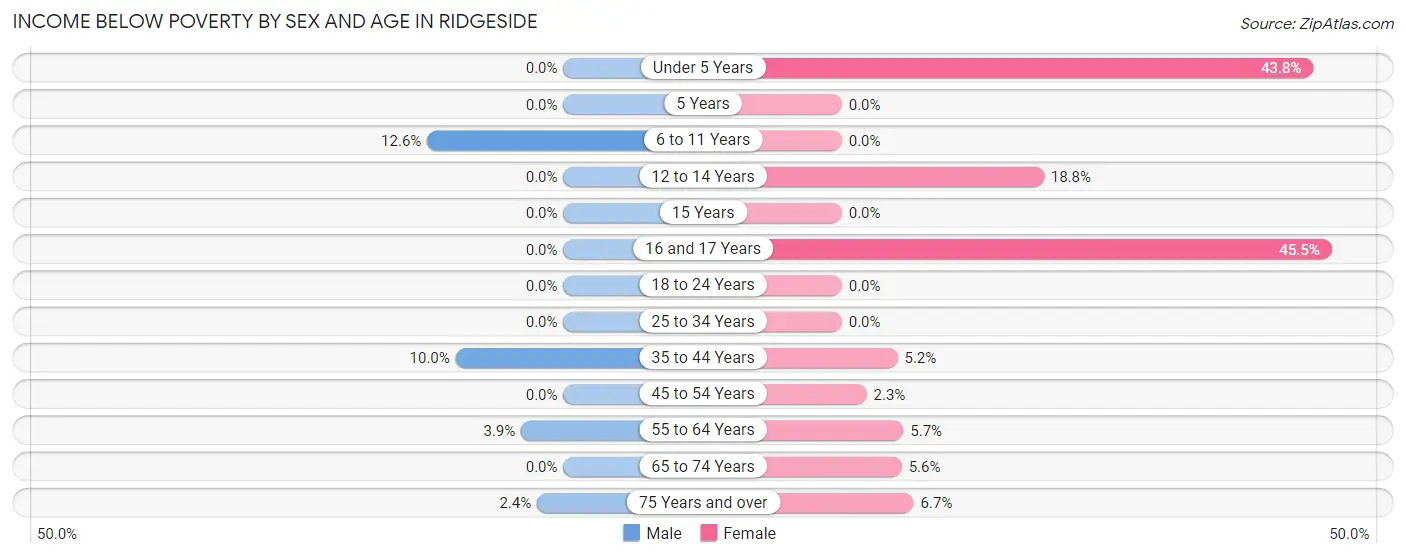
| Age Bracket | Male | Female |
| Under 5 Years | 0 (0.0%) | 7 (43.8%) |
| 5 Years | 0 (0.0%) | 0 (0.0%) |
| 6 to 11 Years | 11 (12.6%) | 0 (0.0%) |
| 12 to 14 Years | 0 (0.0%) | 6 (18.8%) |
| 15 Years | 0 (0.0%) | 0 (0.0%) |
| 16 and 17 Years | 0 (0.0%) | 5 (45.5%) |
| 18 to 24 Years | 0 (0.0%) | 0 (0.0%) |
| 25 to 34 Years | 0 (0.0%) | 0 (0.0%) |
| 35 to 44 Years | 6 (10.0%) | 6 (5.2%) |
| 45 to 54 Years | 0 (0.0%) | 2 (2.3%) |
| 55 to 64 Years | 2 (3.9%) | 2 (5.7%) |
| 65 to 74 Years | 0 (0.0%) | 2 (5.6%) |
| 75 Years and over | 1 (2.4%) | 2 (6.7%) |
| Total | 20 (3.9%) | 32 (7.9%) |
Income Above Poverty by Sex and Age in Ridgeside
According to the poverty statistics in Ridgeside, males aged under 5 years and females aged 5 years are the age groups that are most secure financially, with 100.0% of males and 100.0% of females in these age groups living above the poverty line.
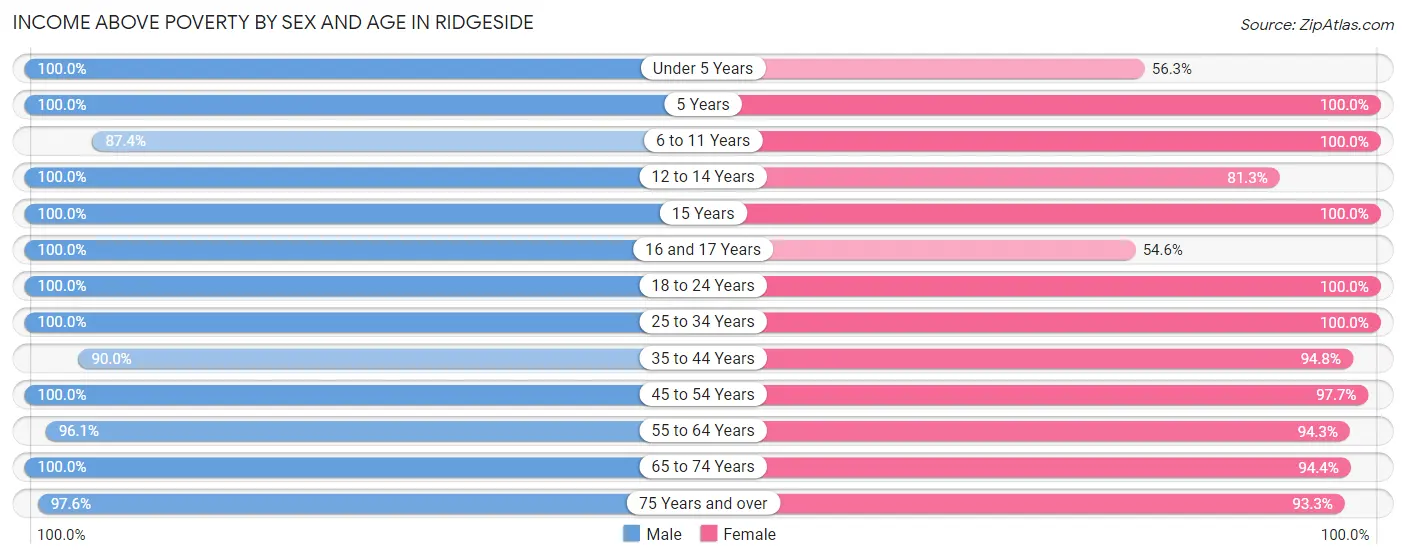
| Age Bracket | Male | Female |
| Under 5 Years | 53 (100.0%) | 9 (56.2%) |
| 5 Years | 6 (100.0%) | 4 (100.0%) |
| 6 to 11 Years | 76 (87.4%) | 19 (100.0%) |
| 12 to 14 Years | 39 (100.0%) | 26 (81.2%) |
| 15 Years | 25 (100.0%) | 8 (100.0%) |
| 16 and 17 Years | 36 (100.0%) | 6 (54.5%) |
| 18 to 24 Years | 10 (100.0%) | 8 (100.0%) |
| 25 to 34 Years | 2 (100.0%) | 3 (100.0%) |
| 35 to 44 Years | 54 (90.0%) | 110 (94.8%) |
| 45 to 54 Years | 69 (100.0%) | 85 (97.7%) |
| 55 to 64 Years | 49 (96.1%) | 33 (94.3%) |
| 65 to 74 Years | 35 (100.0%) | 34 (94.4%) |
| 75 Years and over | 40 (97.6%) | 28 (93.3%) |
| Total | 494 (96.1%) | 373 (92.1%) |
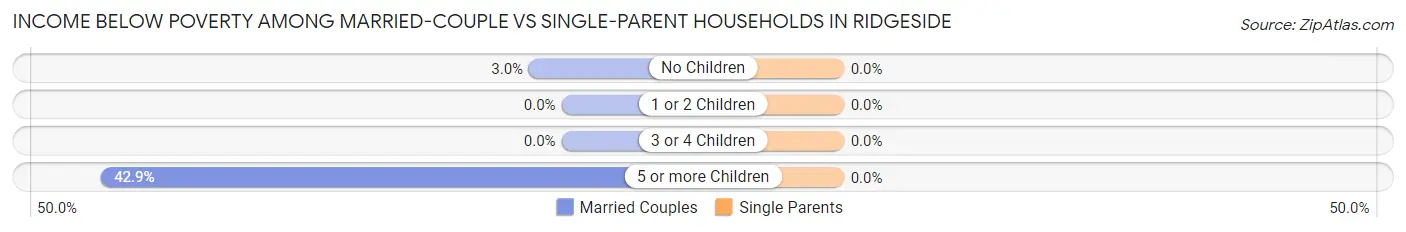
Income Below Poverty Among Married-Couple Families in Ridgeside
The poverty statistics for married-couple families in Ridgeside show that 3.8% or 9 of the total 234 families live below the poverty line. Families with 5 or more children have the highest poverty rate of 42.9%, comprising of 6 families. On the other hand, families with 1 or 2 children have the lowest poverty rate of 0.0%, which includes 0 families.
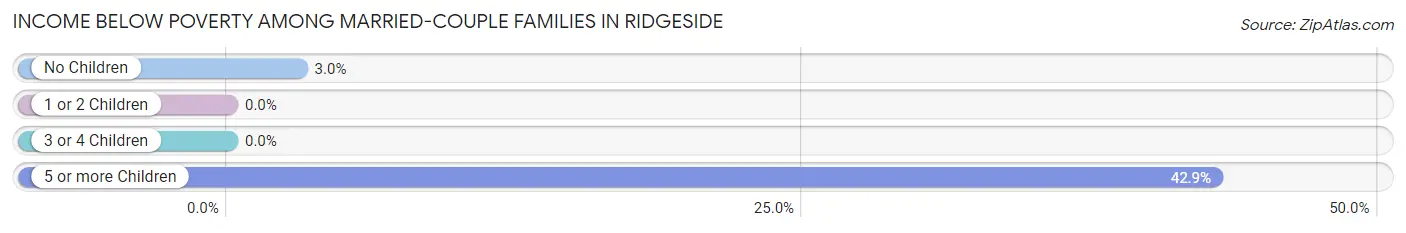
| Children | Above Poverty | Below Poverty |
| No Children | 96 (97.0%) | 3 (3.0%) |
| 1 or 2 Children | 103 (100.0%) | 0 (0.0%) |
| 3 or 4 Children | 18 (100.0%) | 0 (0.0%) |
| 5 or more Children | 8 (57.1%) | 6 (42.9%) |
| Total | 225 (96.2%) | 9 (3.8%) |
Income Below Poverty Among Single-Parent Households in Ridgeside
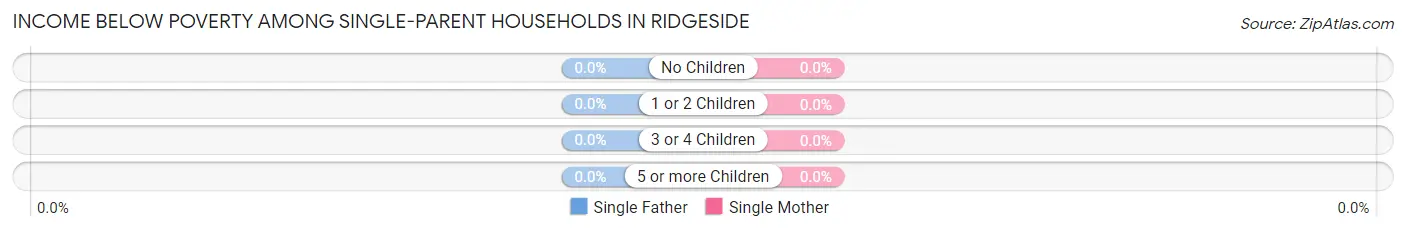
| Children | Single Father | Single Mother |
| No Children | 0 (0.0%) | 0 (0.0%) |
| 1 or 2 Children | 0 (0.0%) | 0 (0.0%) |
| 3 or 4 Children | 0 (0.0%) | 0 (0.0%) |
| 5 or more Children | 0 (0.0%) | 0 (0.0%) |
| Total | 0 (0.0%) | 0 (0.0%) |
Income Below Poverty Among Married-Couple vs Single-Parent Households in Ridgeside
| Children | Married-Couple Families | Single-Parent Households |
| No Children | 3 (3.0%) | 0 (0.0%) |
| 1 or 2 Children | 0 (0.0%) | 0 (0.0%) |
| 3 or 4 Children | 0 (0.0%) | 0 (0.0%) |
| 5 or more Children | 6 (42.9%) | 0 (0.0%) |
| Total | 9 (3.8%) | 0 (0.0%) |
Employment Characteristics in Ridgeside
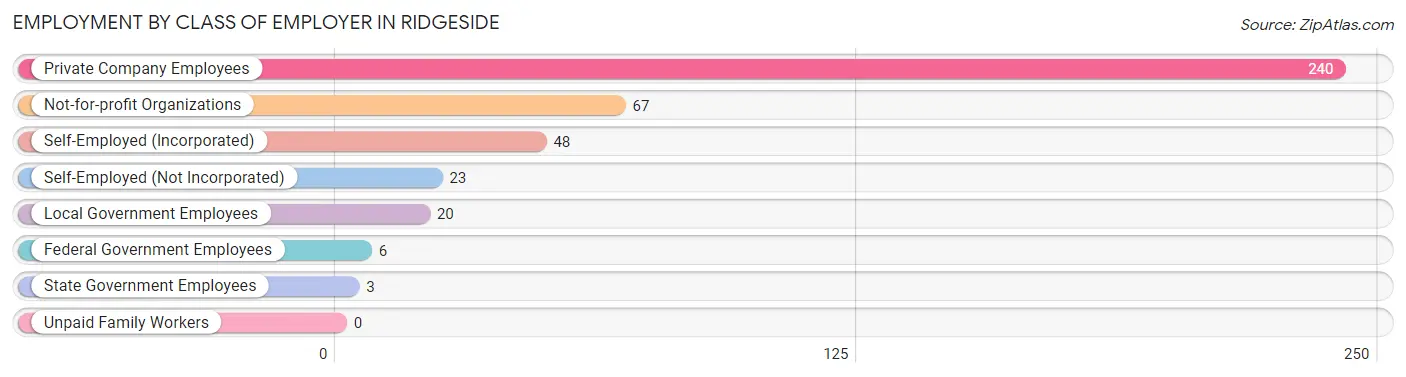
Employment by Class of Employer in Ridgeside
Among the 407 employed individuals in Ridgeside, private company employees (240 | 59.0%), not-for-profit organizations (67 | 16.5%), and self-employed (incorporated) (48 | 11.8%) make up the most common classes of employment.
| Employer Class | # Employees | % Employees |
| Private Company Employees | 240 | 59.0% |
| Self-Employed (Incorporated) | 48 | 11.8% |
| Self-Employed (Not Incorporated) | 23 | 5.7% |
| Not-for-profit Organizations | 67 | 16.5% |
| Local Government Employees | 20 | 4.9% |
| State Government Employees | 3 | 0.7% |
| Federal Government Employees | 6 | 1.5% |
| Unpaid Family Workers | 0 | 0.0% |
| Total | 407 | 100.0% |
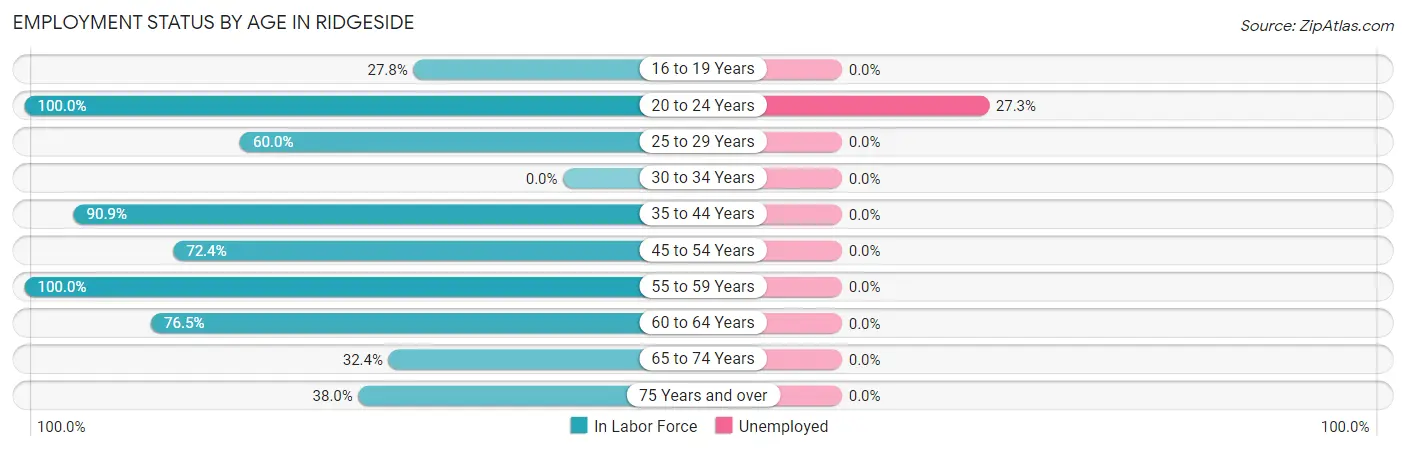
Employment Status by Age in Ridgeside
According to the labor force statistics for Ridgeside, out of the total population over 16 years of age (630), 68.3% or 430 individuals are in the labor force, with 0.7% or 3 of them unemployed. The age group with the highest labor force participation rate is 20 to 24 years, with 100.0% or 11 individuals in the labor force. Within the labor force, the 20 to 24 years age range has the highest percentage of unemployed individuals, with 27.3% or 3 of them being unemployed.
| Age Bracket | In Labor Force | Unemployed |
| 16 to 19 Years | 15 (27.8%) | 0 (0.0%) |
| 20 to 24 Years | 11 (100.0%) | 3 (27.3%) |
| 25 to 29 Years | 3 (60.0%) | 0 (0.0%) |
| 30 to 34 Years | 0 (0.0%) | 0 (0.0%) |
| 35 to 44 Years | 160 (90.9%) | 0 (0.0%) |
| 45 to 54 Years | 113 (72.4%) | 0 (0.0%) |
| 55 to 59 Years | 52 (100.0%) | 0 (0.0%) |
| 60 to 64 Years | 26 (76.5%) | 0 (0.0%) |
| 65 to 74 Years | 23 (32.4%) | 0 (0.0%) |
| 75 Years and over | 27 (38.0%) | 0 (0.0%) |
| Total | 430 (68.3%) | 3 (0.7%) |
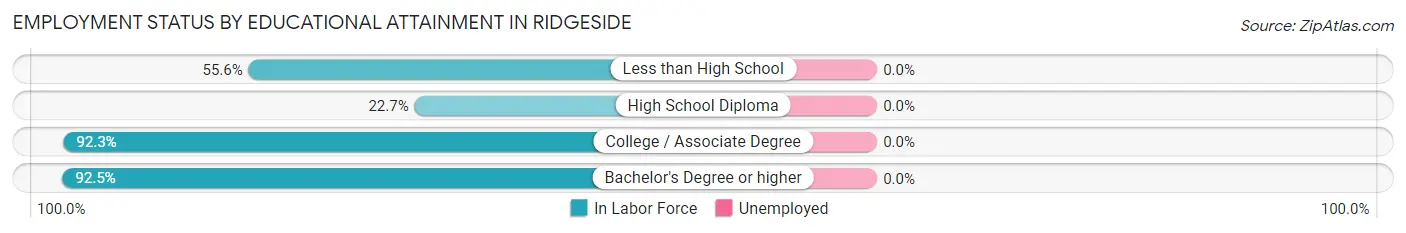
Employment Status by Educational Attainment in Ridgeside
| Educational Attainment | In Labor Force | Unemployed |
| Less than High School | 10 (55.6%) | 0 (0.0%) |
| High School Diploma | 10 (22.7%) | 0 (0.0%) |
| College / Associate Degree | 24 (92.3%) | 0 (0.0%) |
| Bachelor's Degree or higher | 310 (92.5%) | 0 (0.0%) |
| Total | 354 (83.7%) | 0 (0.0%) |
Employment Occupations by Sex in Ridgeside
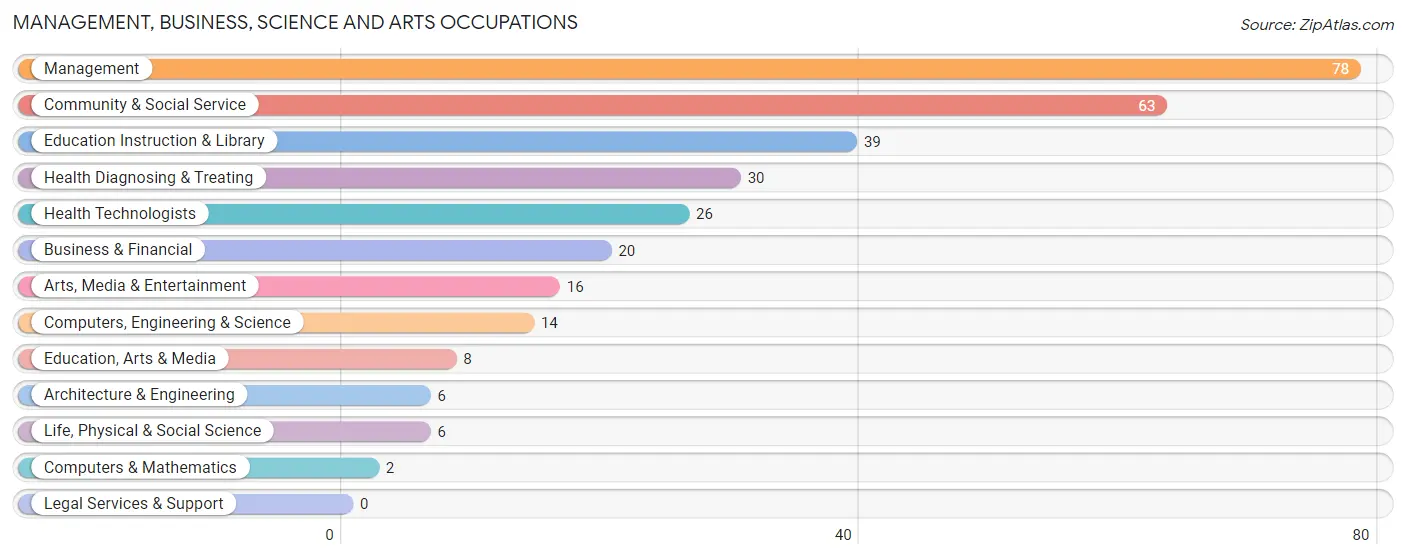
Management, Business, Science and Arts Occupations
The most common Management, Business, Science and Arts occupations in Ridgeside are Management (78 | 18.3%), Community & Social Service (63 | 14.8%), Education Instruction & Library (39 | 9.2%), Health Diagnosing & Treating (30 | 7.1%), and Health Technologists (26 | 6.1%).
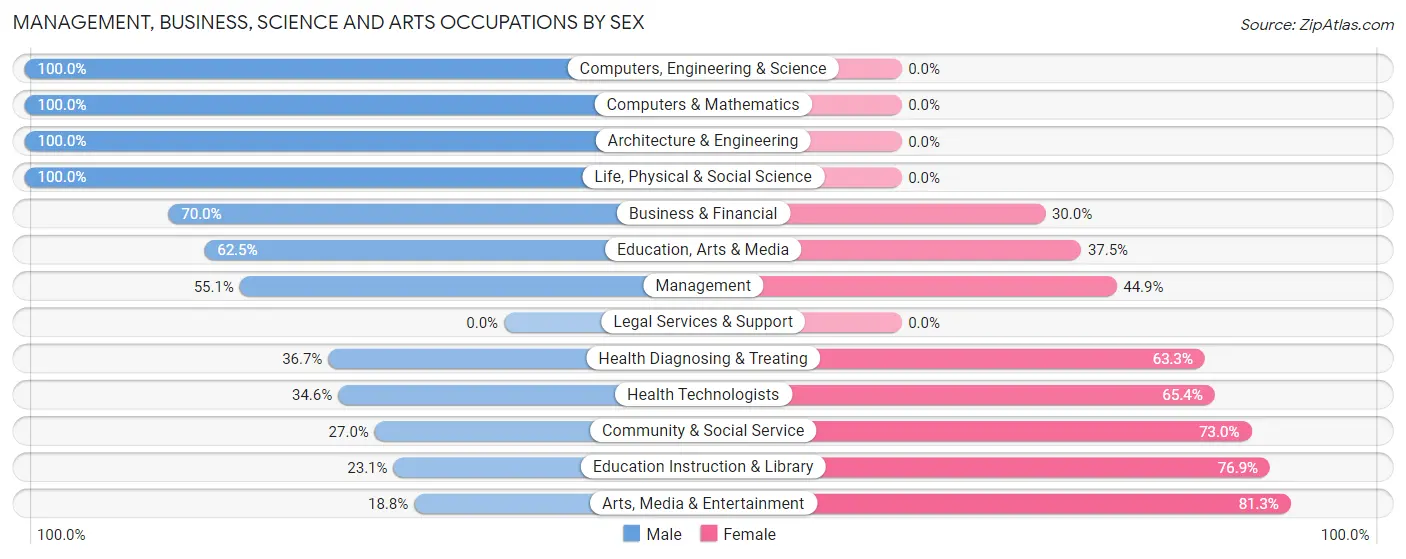
Management, Business, Science and Arts Occupations by Sex
Within the Management, Business, Science and Arts occupations in Ridgeside, the most male-oriented occupations are Computers, Engineering & Science (100.0%), Computers & Mathematics (100.0%), and Architecture & Engineering (100.0%), while the most female-oriented occupations are Arts, Media & Entertainment (81.2%), Education Instruction & Library (76.9%), and Community & Social Service (73.0%).
| Occupation | Male | Female |
| Management | 43 (55.1%) | 35 (44.9%) |
| Business & Financial | 14 (70.0%) | 6 (30.0%) |
| Computers, Engineering & Science | 14 (100.0%) | 0 (0.0%) |
| Computers & Mathematics | 2 (100.0%) | 0 (0.0%) |
| Architecture & Engineering | 6 (100.0%) | 0 (0.0%) |
| Life, Physical & Social Science | 6 (100.0%) | 0 (0.0%) |
| Community & Social Service | 17 (27.0%) | 46 (73.0%) |
| Education, Arts & Media | 5 (62.5%) | 3 (37.5%) |
| Legal Services & Support | 0 (0.0%) | 0 (0.0%) |
| Education Instruction & Library | 9 (23.1%) | 30 (76.9%) |
| Arts, Media & Entertainment | 3 (18.8%) | 13 (81.2%) |
| Health Diagnosing & Treating | 11 (36.7%) | 19 (63.3%) |
| Health Technologists | 9 (34.6%) | 17 (65.4%) |
| Total (Category) | 99 (48.3%) | 106 (51.7%) |
| Total (Overall) | 228 (53.6%) | 197 (46.4%) |
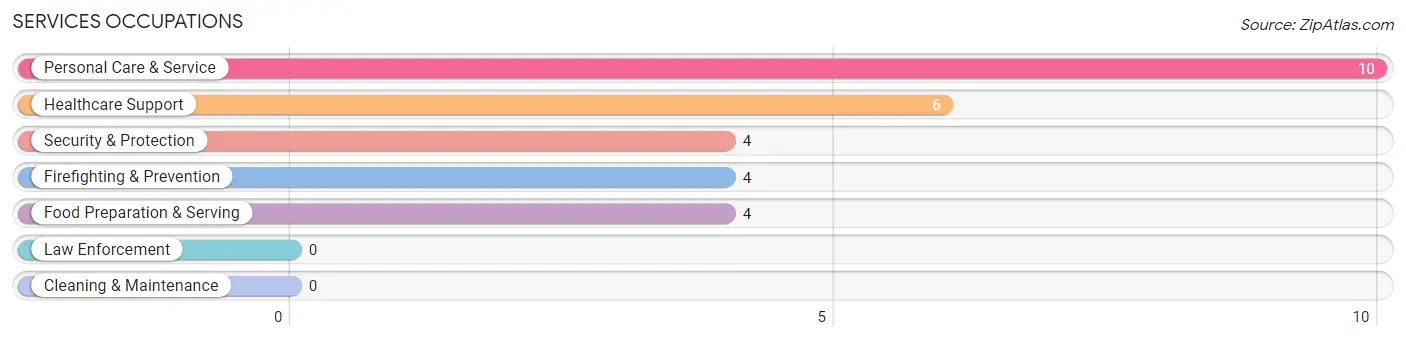
Services Occupations
The most common Services occupations in Ridgeside are Personal Care & Service (10 | 2.4%), Healthcare Support (6 | 1.4%), Security & Protection (4 | 0.9%), Firefighting & Prevention (4 | 0.9%), and Food Preparation & Serving (4 | 0.9%).
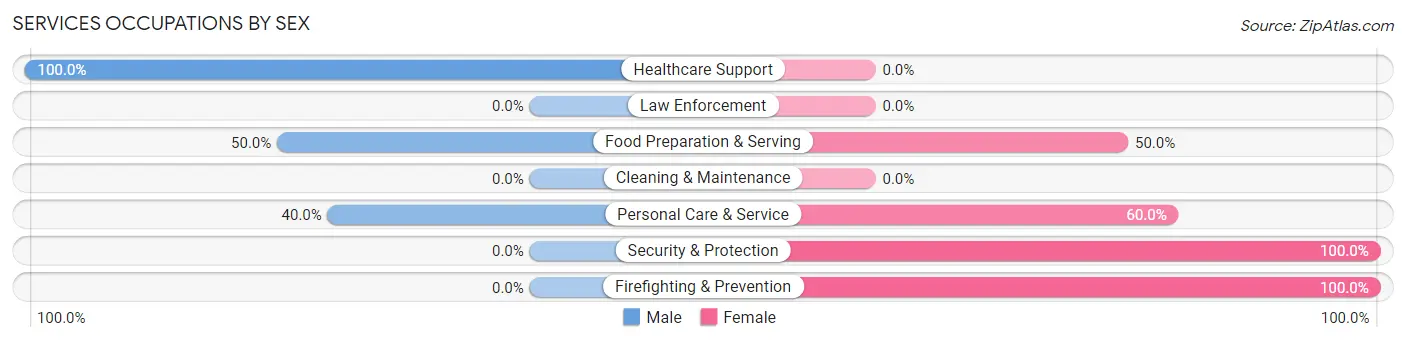
Services Occupations by Sex
Within the Services occupations in Ridgeside, the most male-oriented occupations are Healthcare Support (100.0%), Food Preparation & Serving (50.0%), and Personal Care & Service (40.0%), while the most female-oriented occupations are Security & Protection (100.0%), Firefighting & Prevention (100.0%), and Personal Care & Service (60.0%).
| Occupation | Male | Female |
| Healthcare Support | 6 (100.0%) | 0 (0.0%) |
| Security & Protection | 0 (0.0%) | 4 (100.0%) |
| Firefighting & Prevention | 0 (0.0%) | 4 (100.0%) |
| Law Enforcement | 0 (0.0%) | 0 (0.0%) |
| Food Preparation & Serving | 2 (50.0%) | 2 (50.0%) |
| Cleaning & Maintenance | 0 (0.0%) | 0 (0.0%) |
| Personal Care & Service | 4 (40.0%) | 6 (60.0%) |
| Total (Category) | 12 (50.0%) | 12 (50.0%) |
| Total (Overall) | 228 (53.6%) | 197 (46.4%) |
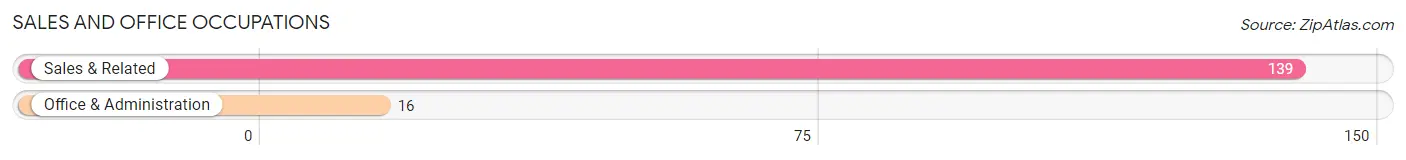
Sales and Office Occupations
The most common Sales and Office occupations in Ridgeside are Sales & Related (139 | 32.7%), and Office & Administration (16 | 3.8%).
Sales and Office Occupations by Sex
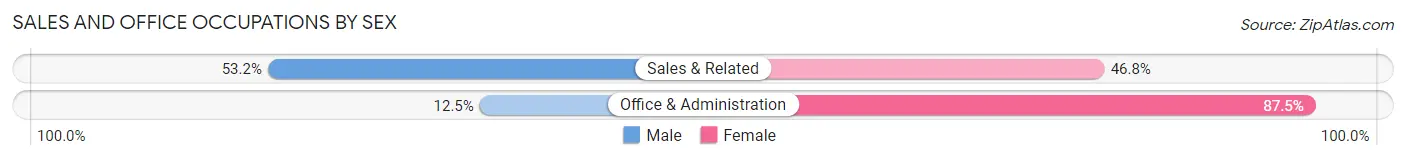
| Occupation | Male | Female |
| Sales & Related | 74 (53.2%) | 65 (46.8%) |
| Office & Administration | 2 (12.5%) | 14 (87.5%) |
| Total (Category) | 76 (49.0%) | 79 (51.0%) |
| Total (Overall) | 228 (53.6%) | 197 (46.4%) |
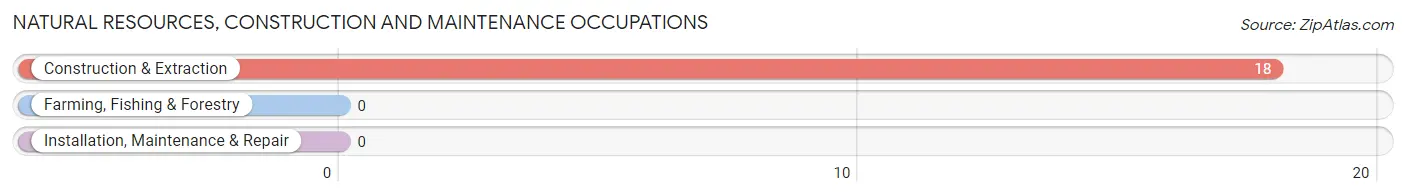
Natural Resources, Construction and Maintenance Occupations
The most common Natural Resources, Construction and Maintenance occupations in Ridgeside are , and Construction & Extraction (18 | 4.2%).
Natural Resources, Construction and Maintenance Occupations by Sex
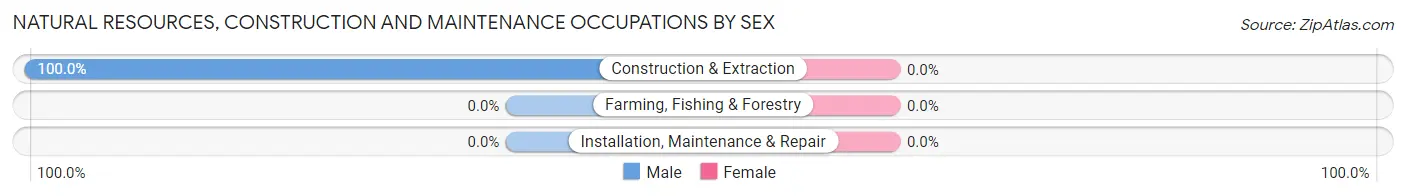
| Occupation | Male | Female |
| Farming, Fishing & Forestry | 0 (0.0%) | 0 (0.0%) |
| Construction & Extraction | 18 (100.0%) | 0 (0.0%) |
| Installation, Maintenance & Repair | 0 (0.0%) | 0 (0.0%) |
| Total (Category) | 18 (100.0%) | 0 (0.0%) |
| Total (Overall) | 228 (53.6%) | 197 (46.4%) |
Production, Transportation and Moving Occupations
The most common Production, Transportation and Moving occupations in Ridgeside are Production (10 | 2.4%), Transportation (9 | 2.1%), and Material Moving (4 | 0.9%).
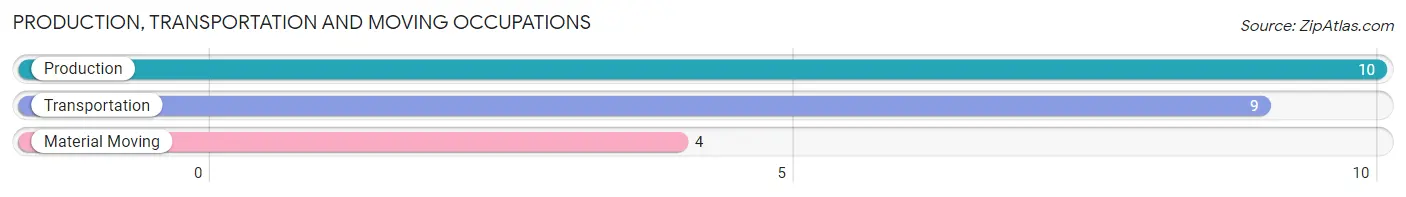
Production, Transportation and Moving Occupations by Sex
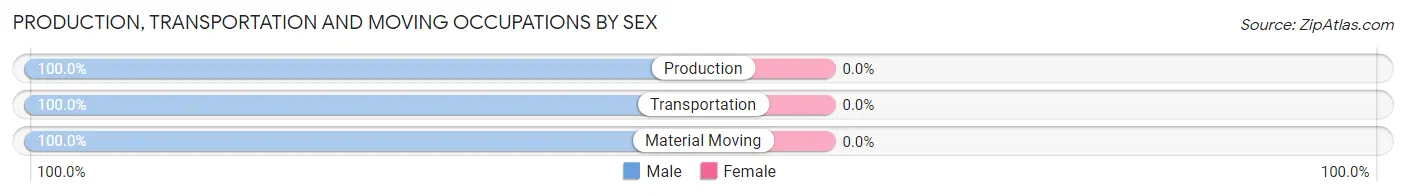
| Occupation | Male | Female |
| Production | 10 (100.0%) | 0 (0.0%) |
| Transportation | 9 (100.0%) | 0 (0.0%) |
| Material Moving | 4 (100.0%) | 0 (0.0%) |
| Total (Category) | 23 (100.0%) | 0 (0.0%) |
| Total (Overall) | 228 (53.6%) | 197 (46.4%) |
Employment Industries by Sex in Ridgeside
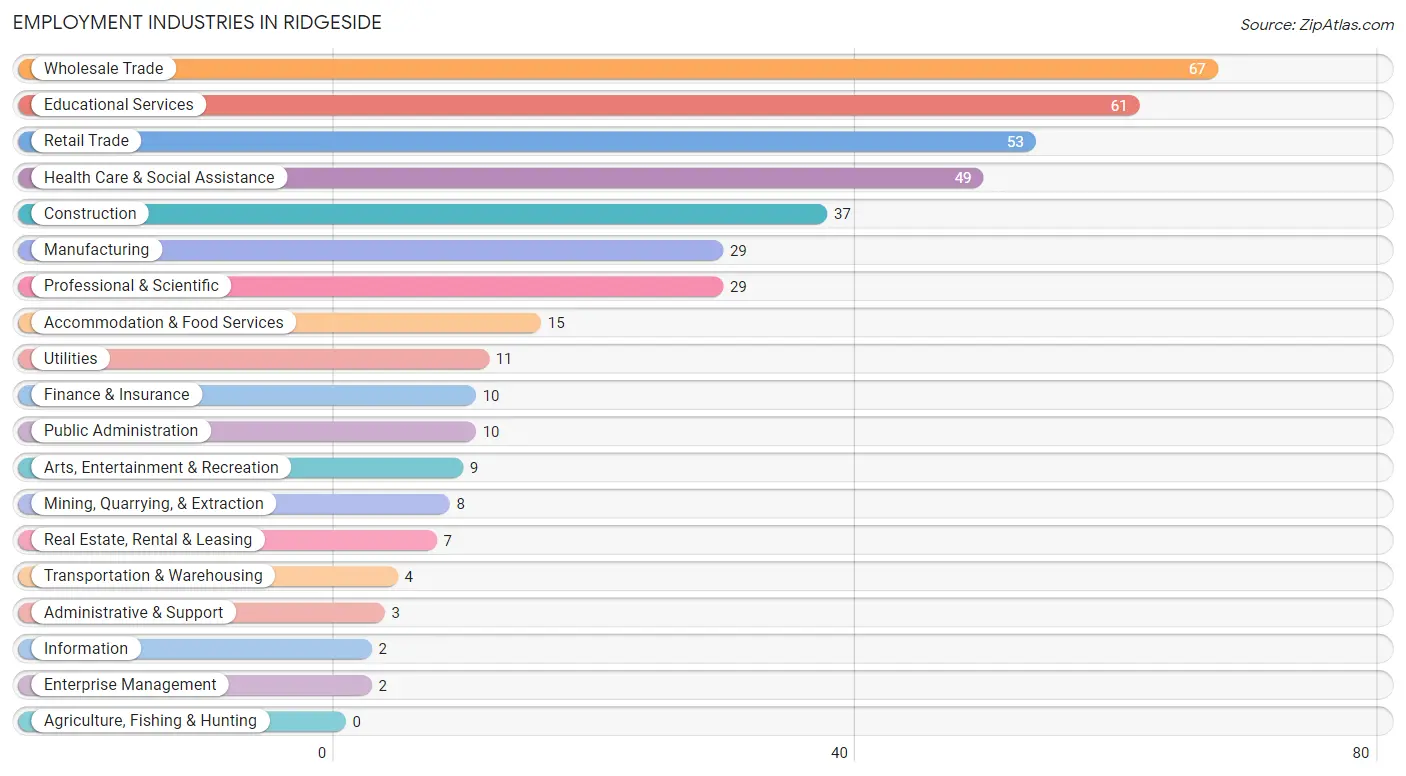
Employment Industries in Ridgeside
The major employment industries in Ridgeside include Wholesale Trade (67 | 15.8%), Educational Services (61 | 14.3%), Retail Trade (53 | 12.5%), Health Care & Social Assistance (49 | 11.5%), and Construction (37 | 8.7%).
Employment Industries by Sex in Ridgeside
The Ridgeside industries that see more men than women are Mining, Quarrying, & Extraction (100.0%), Transportation & Warehousing (100.0%), and Real Estate, Rental & Leasing (100.0%), whereas the industries that tend to have a higher number of women are Information (100.0%), Arts, Entertainment & Recreation (100.0%), and Professional & Scientific (72.4%).
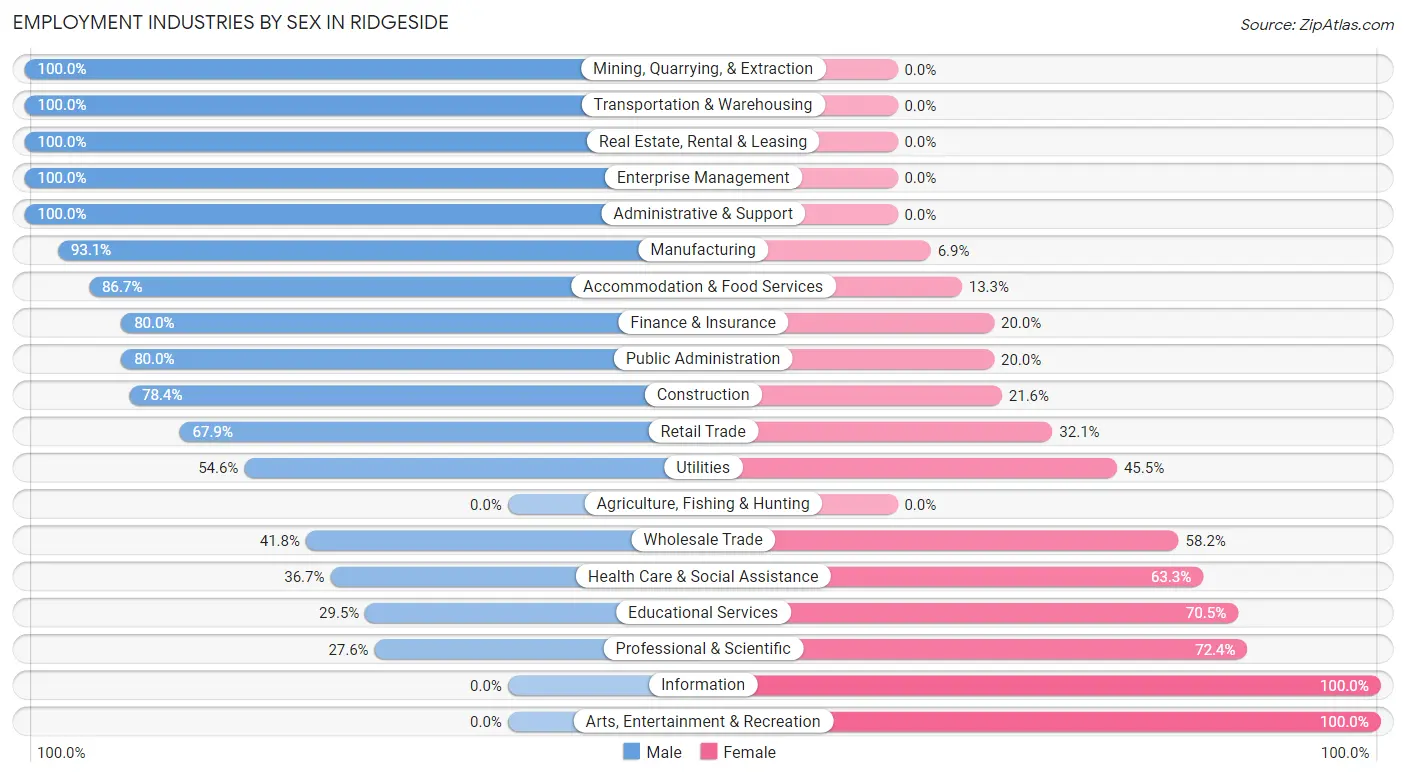
| Industry | Male | Female |
| Agriculture, Fishing & Hunting | 0 (0.0%) | 0 (0.0%) |
| Mining, Quarrying, & Extraction | 8 (100.0%) | 0 (0.0%) |
| Construction | 29 (78.4%) | 8 (21.6%) |
| Manufacturing | 27 (93.1%) | 2 (6.9%) |
| Wholesale Trade | 28 (41.8%) | 39 (58.2%) |
| Retail Trade | 36 (67.9%) | 17 (32.1%) |
| Transportation & Warehousing | 4 (100.0%) | 0 (0.0%) |
| Utilities | 6 (54.5%) | 5 (45.5%) |
| Information | 0 (0.0%) | 2 (100.0%) |
| Finance & Insurance | 8 (80.0%) | 2 (20.0%) |
| Real Estate, Rental & Leasing | 7 (100.0%) | 0 (0.0%) |
| Professional & Scientific | 8 (27.6%) | 21 (72.4%) |
| Enterprise Management | 2 (100.0%) | 0 (0.0%) |
| Administrative & Support | 3 (100.0%) | 0 (0.0%) |
| Educational Services | 18 (29.5%) | 43 (70.5%) |
| Health Care & Social Assistance | 18 (36.7%) | 31 (63.3%) |
| Arts, Entertainment & Recreation | 0 (0.0%) | 9 (100.0%) |
| Accommodation & Food Services | 13 (86.7%) | 2 (13.3%) |
| Public Administration | 8 (80.0%) | 2 (20.0%) |
| Total | 228 (53.6%) | 197 (46.4%) |
Education in Ridgeside
School Enrollment in Ridgeside
The most common levels of schooling among the 340 students in Ridgeside are high school (103 | 30.3%), middle school (86 | 25.3%), and elementary school (70 | 20.6%).
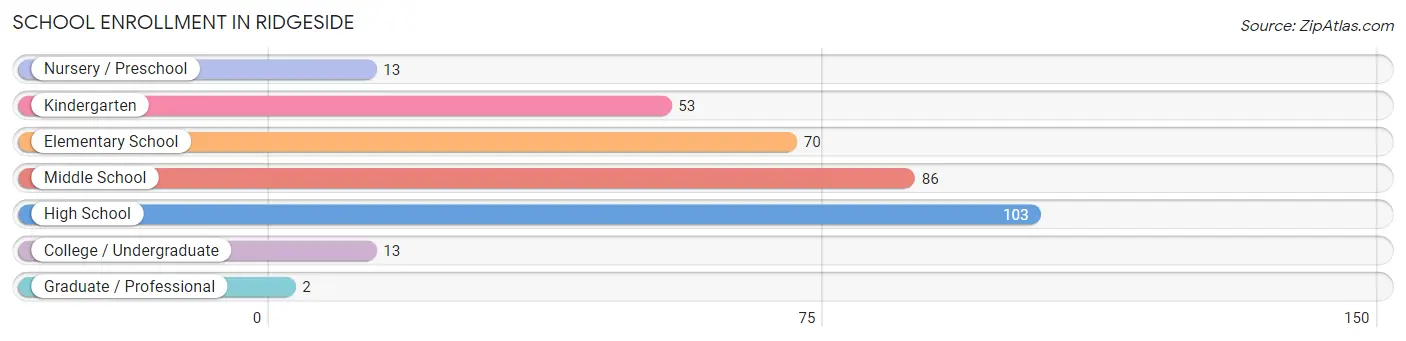
| School Level | # Students | % Students |
| Nursery / Preschool | 13 | 3.8% |
| Kindergarten | 53 | 15.6% |
| Elementary School | 70 | 20.6% |
| Middle School | 86 | 25.3% |
| High School | 103 | 30.3% |
| College / Undergraduate | 13 | 3.8% |
| Graduate / Professional | 2 | 0.6% |
| Total | 340 | 100.0% |
School Enrollment by Age by Funding Source in Ridgeside
Out of a total of 340 students who are enrolled in schools in Ridgeside, 249 (73.2%) attend a private institution, while the remaining 91 (26.8%) are enrolled in public schools. The age group of 15 to 17 year olds has the highest likelihood of being enrolled in private schools, with 77 (96.3% in the age bracket) enrolled. Conversely, the age group of 18 to 19 year olds has the lowest likelihood of being enrolled in a private school, with 5 (100.0% in the age bracket) attending a public institution.
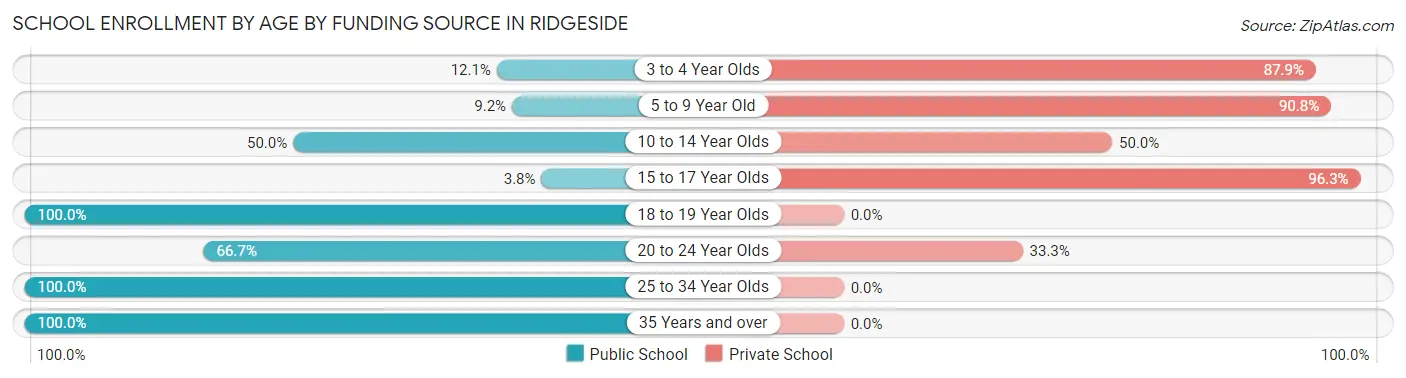
| Age Bracket | Public School | Private School |
| 3 to 4 Year Olds | 7 (12.1%) | 51 (87.9%) |
| 5 to 9 Year Old | 6 (9.2%) | 59 (90.8%) |
| 10 to 14 Year Olds | 59 (50.0%) | 59 (50.0%) |
| 15 to 17 Year Olds | 3 (3.7%) | 77 (96.3%) |
| 18 to 19 Year Olds | 5 (100.0%) | 0 (0.0%) |
| 20 to 24 Year Olds | 6 (66.7%) | 3 (33.3%) |
| 25 to 34 Year Olds | 3 (100.0%) | 0 (0.0%) |
| 35 Years and over | 2 (100.0%) | 0 (0.0%) |
| Total | 91 (26.8%) | 249 (73.2%) |
Educational Attainment by Field of Study in Ridgeside
Business (81 | 17.9%), science & technology (57 | 12.6%), education (47 | 10.4%), communications (45 | 9.9%), and literature & languages (39 | 8.6%) are the most common fields of study among 453 individuals in Ridgeside who have obtained a bachelor's degree or higher.
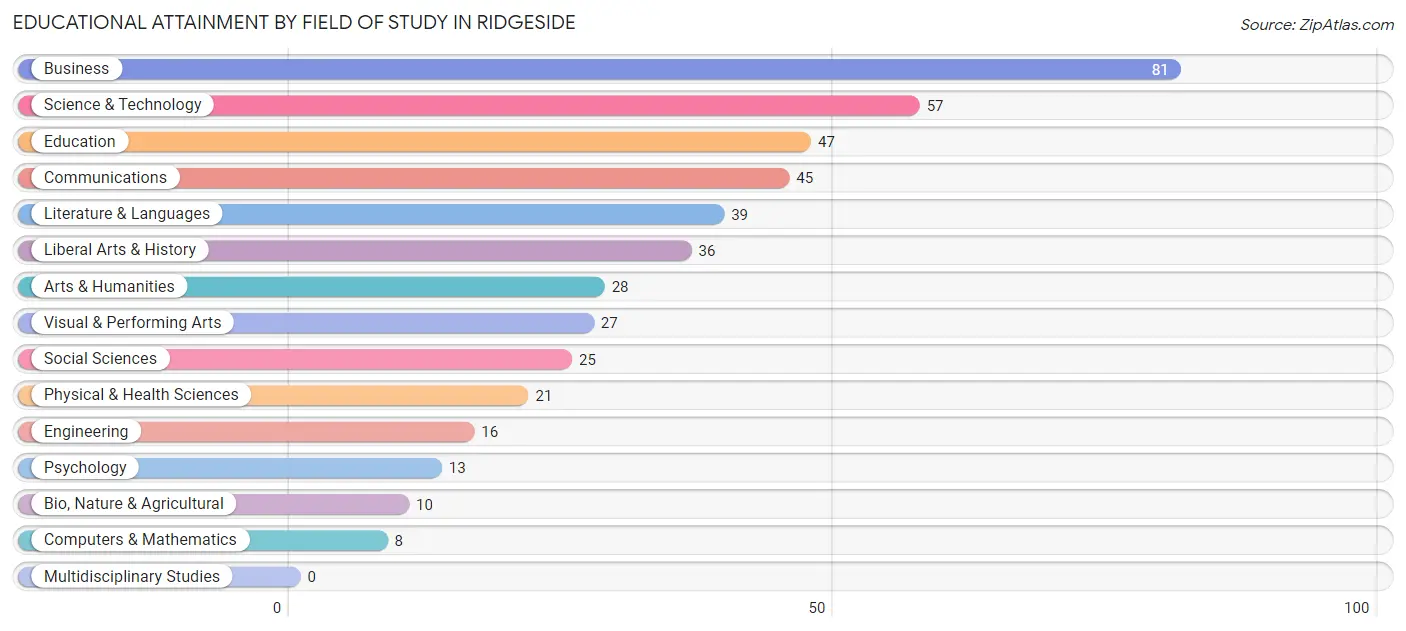
| Field of Study | # Graduates | % Graduates |
| Computers & Mathematics | 8 | 1.8% |
| Bio, Nature & Agricultural | 10 | 2.2% |
| Physical & Health Sciences | 21 | 4.6% |
| Psychology | 13 | 2.9% |
| Social Sciences | 25 | 5.5% |
| Engineering | 16 | 3.5% |
| Multidisciplinary Studies | 0 | 0.0% |
| Science & Technology | 57 | 12.6% |
| Business | 81 | 17.9% |
| Education | 47 | 10.4% |
| Literature & Languages | 39 | 8.6% |
| Liberal Arts & History | 36 | 8.0% |
| Visual & Performing Arts | 27 | 6.0% |
| Communications | 45 | 9.9% |
| Arts & Humanities | 28 | 6.2% |
| Total | 453 | 100.0% |
Transportation & Commute in Ridgeside
Vehicle Availability by Sex in Ridgeside
The most prevalent vehicle ownership categories in Ridgeside are males with 2 vehicles (119, accounting for 56.1%) and females with 2 vehicles (119, making up 61.0%).
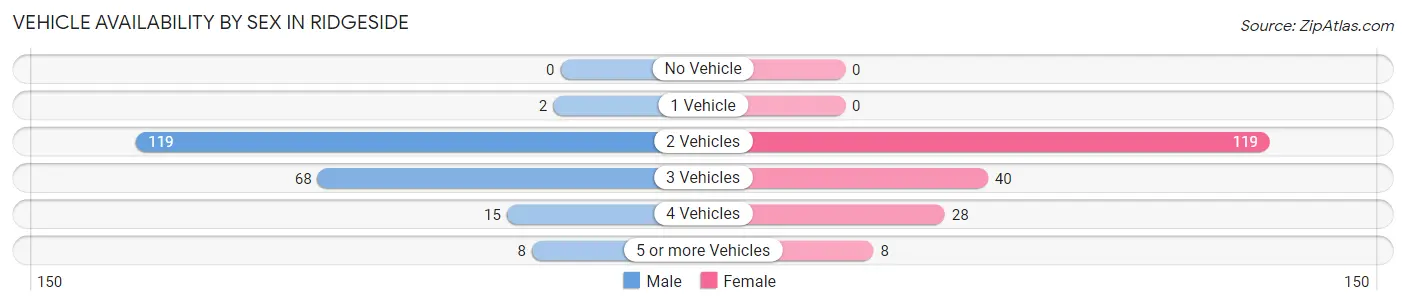
| Vehicles Available | Male | Female |
| No Vehicle | 0 (0.0%) | 0 (0.0%) |
| 1 Vehicle | 2 (0.9%) | 0 (0.0%) |
| 2 Vehicles | 119 (56.1%) | 119 (61.0%) |
| 3 Vehicles | 68 (32.1%) | 40 (20.5%) |
| 4 Vehicles | 15 (7.1%) | 28 (14.4%) |
| 5 or more Vehicles | 8 (3.8%) | 8 (4.1%) |
| Total | 212 (100.0%) | 195 (100.0%) |
Commute Time in Ridgeside
The most frequently occuring commute durations in Ridgeside are 15 to 19 minutes (92 commuters, 29.0%), 10 to 14 minutes (91 commuters, 28.7%), and 5 to 9 minutes (54 commuters, 17.0%).
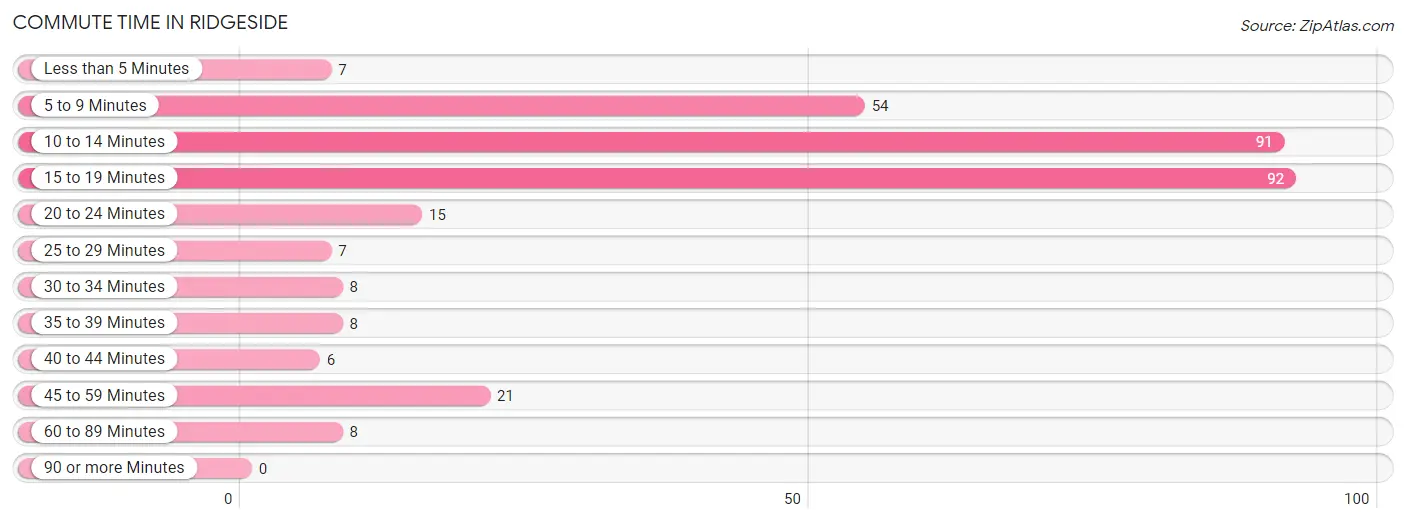
| Commute Time | # Commuters | % Commuters |
| Less than 5 Minutes | 7 | 2.2% |
| 5 to 9 Minutes | 54 | 17.0% |
| 10 to 14 Minutes | 91 | 28.7% |
| 15 to 19 Minutes | 92 | 29.0% |
| 20 to 24 Minutes | 15 | 4.7% |
| 25 to 29 Minutes | 7 | 2.2% |
| 30 to 34 Minutes | 8 | 2.5% |
| 35 to 39 Minutes | 8 | 2.5% |
| 40 to 44 Minutes | 6 | 1.9% |
| 45 to 59 Minutes | 21 | 6.6% |
| 60 to 89 Minutes | 8 | 2.5% |
| 90 or more Minutes | 0 | 0.0% |
Commute Time by Sex in Ridgeside
The most common commute times in Ridgeside are 15 to 19 minutes (56 commuters, 30.3%) for males and 10 to 14 minutes (50 commuters, 37.9%) for females.
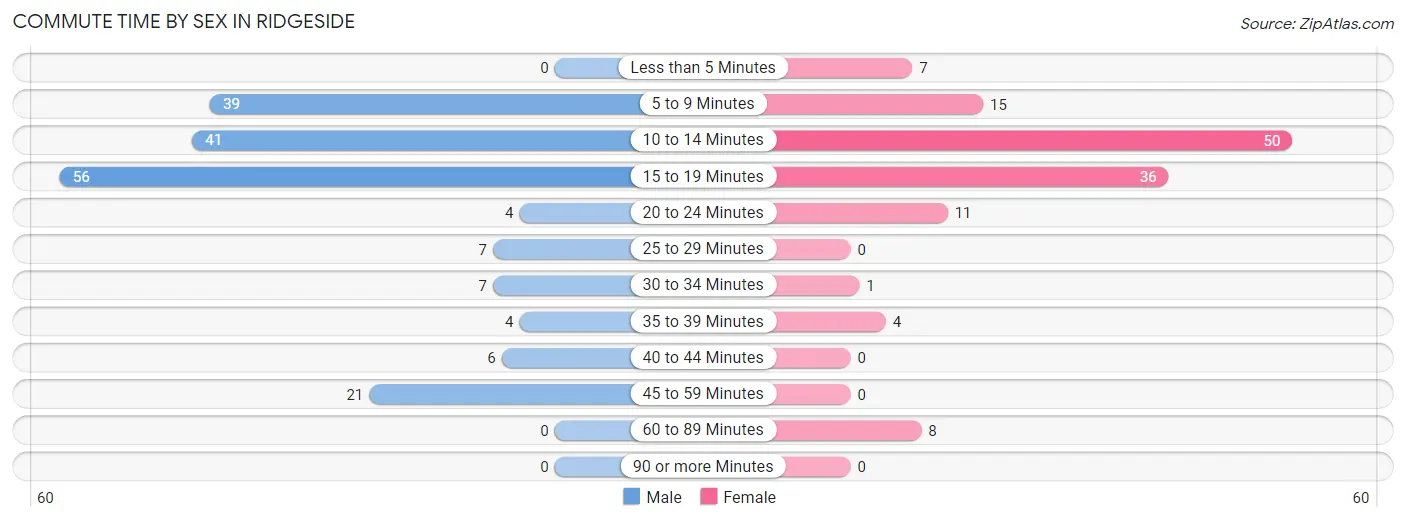
| Commute Time | Male | Female |
| Less than 5 Minutes | 0 (0.0%) | 7 (5.3%) |
| 5 to 9 Minutes | 39 (21.1%) | 15 (11.4%) |
| 10 to 14 Minutes | 41 (22.2%) | 50 (37.9%) |
| 15 to 19 Minutes | 56 (30.3%) | 36 (27.3%) |
| 20 to 24 Minutes | 4 (2.2%) | 11 (8.3%) |
| 25 to 29 Minutes | 7 (3.8%) | 0 (0.0%) |
| 30 to 34 Minutes | 7 (3.8%) | 1 (0.8%) |
| 35 to 39 Minutes | 4 (2.2%) | 4 (3.0%) |
| 40 to 44 Minutes | 6 (3.2%) | 0 (0.0%) |
| 45 to 59 Minutes | 21 (11.4%) | 0 (0.0%) |
| 60 to 89 Minutes | 0 (0.0%) | 8 (6.1%) |
| 90 or more Minutes | 0 (0.0%) | 0 (0.0%) |
Time of Departure to Work by Sex in Ridgeside
The most frequent times of departure to work in Ridgeside are 8:00 AM to 8:29 AM (40, 21.6%) for males and 7:30 AM to 7:59 AM (36, 27.3%) for females.
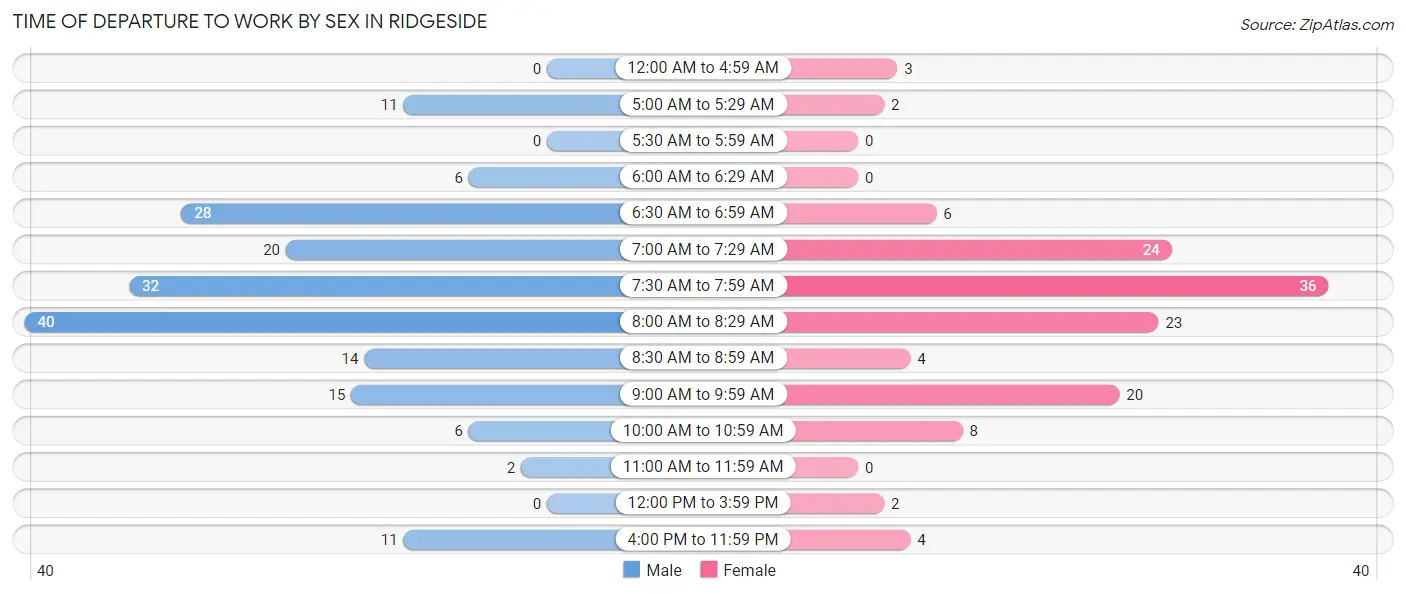
| Time of Departure | Male | Female |
| 12:00 AM to 4:59 AM | 0 (0.0%) | 3 (2.3%) |
| 5:00 AM to 5:29 AM | 11 (5.9%) | 2 (1.5%) |
| 5:30 AM to 5:59 AM | 0 (0.0%) | 0 (0.0%) |
| 6:00 AM to 6:29 AM | 6 (3.2%) | 0 (0.0%) |
| 6:30 AM to 6:59 AM | 28 (15.1%) | 6 (4.5%) |
| 7:00 AM to 7:29 AM | 20 (10.8%) | 24 (18.2%) |
| 7:30 AM to 7:59 AM | 32 (17.3%) | 36 (27.3%) |
| 8:00 AM to 8:29 AM | 40 (21.6%) | 23 (17.4%) |
| 8:30 AM to 8:59 AM | 14 (7.6%) | 4 (3.0%) |
| 9:00 AM to 9:59 AM | 15 (8.1%) | 20 (15.1%) |
| 10:00 AM to 10:59 AM | 6 (3.2%) | 8 (6.1%) |
| 11:00 AM to 11:59 AM | 2 (1.1%) | 0 (0.0%) |
| 12:00 PM to 3:59 PM | 0 (0.0%) | 2 (1.5%) |
| 4:00 PM to 11:59 PM | 11 (5.9%) | 4 (3.0%) |
| Total | 185 (100.0%) | 132 (100.0%) |
Housing Occupancy in Ridgeside
Occupancy by Ownership in Ridgeside
Of the total 264 dwellings in Ridgeside, owner-occupied units account for 232 (87.9%), while renter-occupied units make up 32 (12.1%).
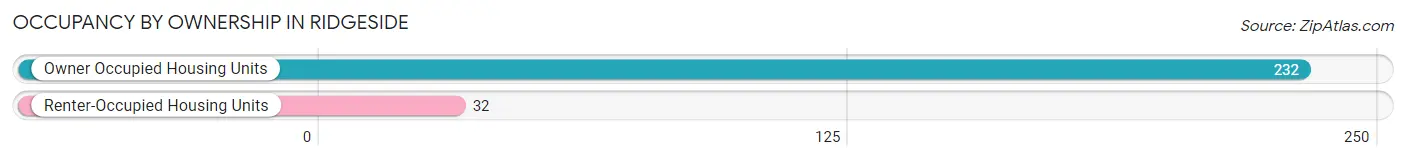
| Occupancy | # Housing Units | % Housing Units |
| Owner Occupied Housing Units | 232 | 87.9% |
| Renter-Occupied Housing Units | 32 | 12.1% |
| Total Occupied Housing Units | 264 | 100.0% |
Occupancy by Household Size in Ridgeside
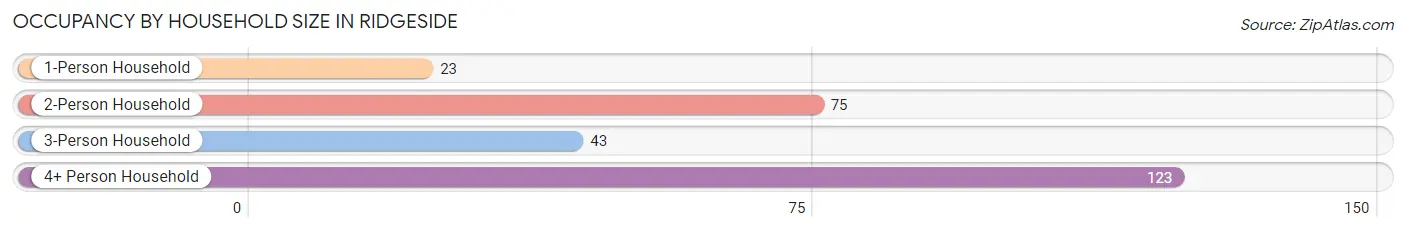
| Household Size | # Housing Units | % Housing Units |
| 1-Person Household | 23 | 8.7% |
| 2-Person Household | 75 | 28.4% |
| 3-Person Household | 43 | 16.3% |
| 4+ Person Household | 123 | 46.6% |
| Total Housing Units | 264 | 100.0% |
Occupancy by Ownership by Household Size in Ridgeside
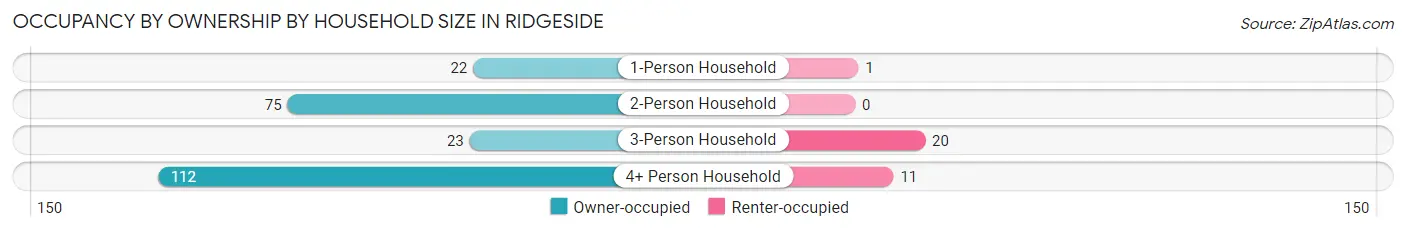
| Household Size | Owner-occupied | Renter-occupied |
| 1-Person Household | 22 (95.7%) | 1 (4.3%) |
| 2-Person Household | 75 (100.0%) | 0 (0.0%) |
| 3-Person Household | 23 (53.5%) | 20 (46.5%) |
| 4+ Person Household | 112 (91.1%) | 11 (8.9%) |
| Total Housing Units | 232 (87.9%) | 32 (12.1%) |
Occupancy by Educational Attainment in Ridgeside
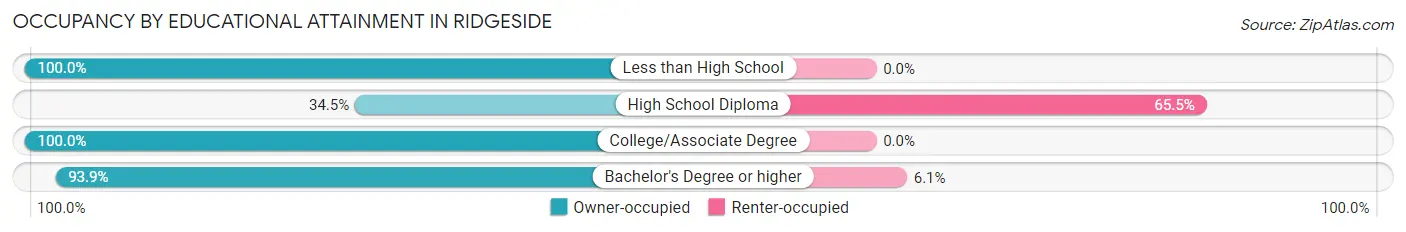
| Household Size | Owner-occupied | Renter-occupied |
| Less than High School | 8 (100.0%) | 0 (0.0%) |
| High School Diploma | 10 (34.5%) | 19 (65.5%) |
| College/Associate Degree | 13 (100.0%) | 0 (0.0%) |
| Bachelor's Degree or higher | 201 (93.9%) | 13 (6.1%) |
Occupancy by Age of Householder in Ridgeside
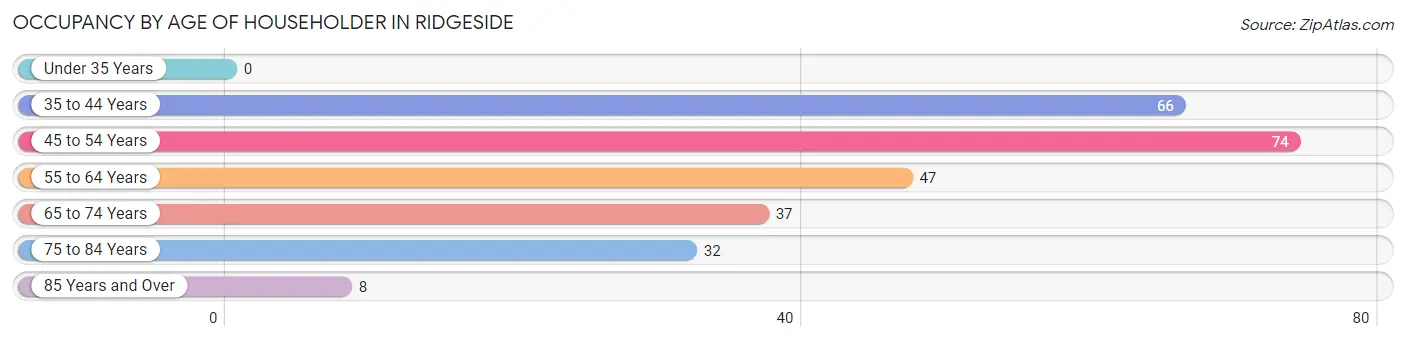
| Age Bracket | # Households | % Households |
| Under 35 Years | 0 | 0.0% |
| 35 to 44 Years | 66 | 25.0% |
| 45 to 54 Years | 74 | 28.0% |
| 55 to 64 Years | 47 | 17.8% |
| 65 to 74 Years | 37 | 14.0% |
| 75 to 84 Years | 32 | 12.1% |
| 85 Years and Over | 8 | 3.0% |
| Total | 264 | 100.0% |
Housing Finances in Ridgeside
Median Income by Occupancy in Ridgeside
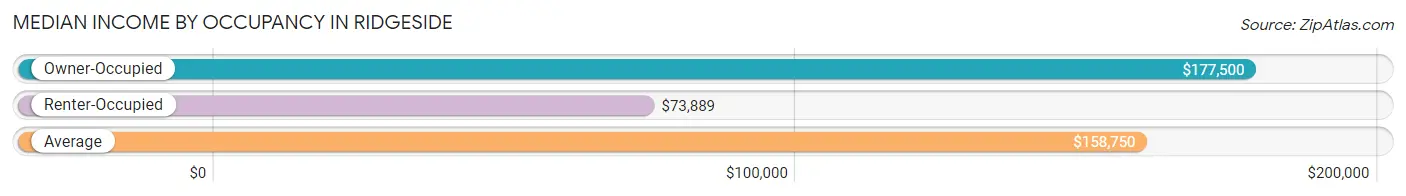
| Occupancy Type | # Households | Median Income |
| Owner-Occupied | 232 (87.9%) | $177,500 |
| Renter-Occupied | 32 (12.1%) | $73,889 |
| Average | 264 (100.0%) | $158,750 |
Occupancy by Householder Income Bracket in Ridgeside
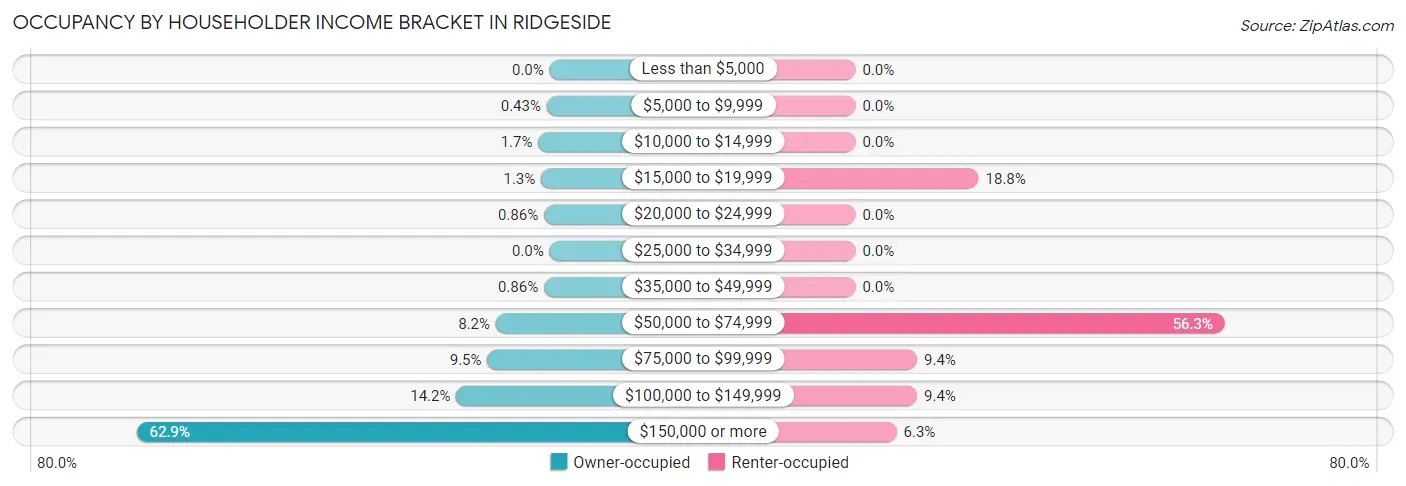
| Income Bracket | Owner-occupied | Renter-occupied |
| Less than $5,000 | 0 (0.0%) | 0 (0.0%) |
| $5,000 to $9,999 | 1 (0.4%) | 0 (0.0%) |
| $10,000 to $14,999 | 4 (1.7%) | 0 (0.0%) |
| $15,000 to $19,999 | 3 (1.3%) | 6 (18.8%) |
| $20,000 to $24,999 | 2 (0.9%) | 0 (0.0%) |
| $25,000 to $34,999 | 0 (0.0%) | 0 (0.0%) |
| $35,000 to $49,999 | 2 (0.9%) | 0 (0.0%) |
| $50,000 to $74,999 | 19 (8.2%) | 18 (56.2%) |
| $75,000 to $99,999 | 22 (9.5%) | 3 (9.4%) |
| $100,000 to $149,999 | 33 (14.2%) | 3 (9.4%) |
| $150,000 or more | 146 (62.9%) | 2 (6.2%) |
| Total | 232 (100.0%) | 32 (100.0%) |
Monthly Housing Cost Tiers in Ridgeside
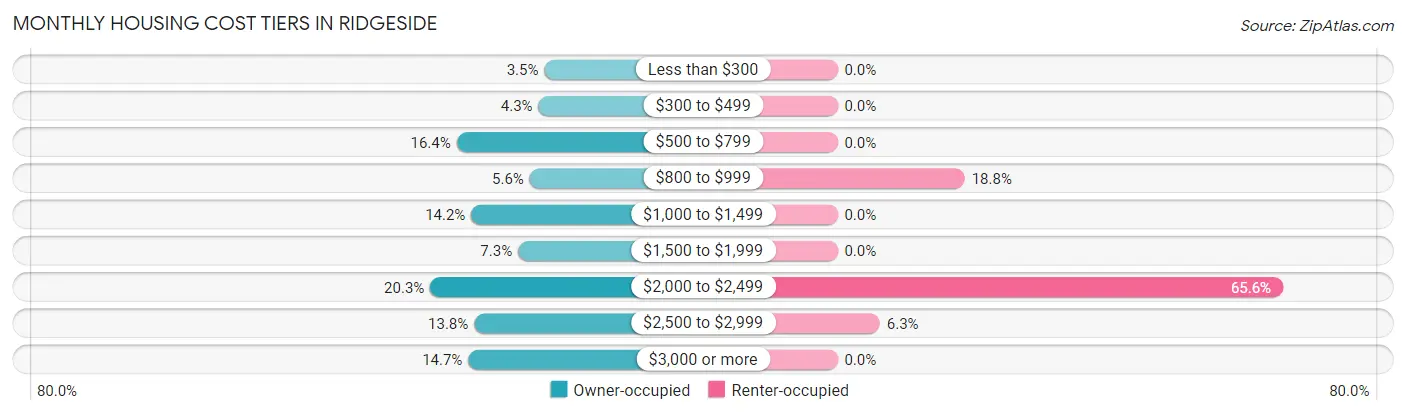
| Monthly Cost | Owner-occupied | Renter-occupied |
| Less than $300 | 8 (3.5%) | 0 (0.0%) |
| $300 to $499 | 10 (4.3%) | 0 (0.0%) |
| $500 to $799 | 38 (16.4%) | 0 (0.0%) |
| $800 to $999 | 13 (5.6%) | 6 (18.8%) |
| $1,000 to $1,499 | 33 (14.2%) | 0 (0.0%) |
| $1,500 to $1,999 | 17 (7.3%) | 0 (0.0%) |
| $2,000 to $2,499 | 47 (20.3%) | 21 (65.6%) |
| $2,500 to $2,999 | 32 (13.8%) | 2 (6.2%) |
| $3,000 or more | 34 (14.7%) | 0 (0.0%) |
| Total | 232 (100.0%) | 32 (100.0%) |
Physical Housing Characteristics in Ridgeside
Housing Structures in Ridgeside
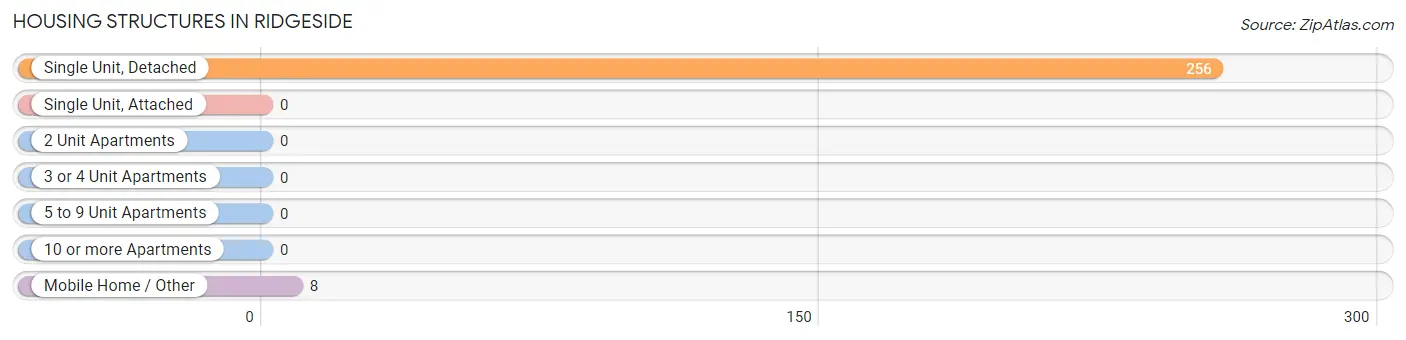
| Structure Type | # Housing Units | % Housing Units |
| Single Unit, Detached | 256 | 97.0% |
| Single Unit, Attached | 0 | 0.0% |
| 2 Unit Apartments | 0 | 0.0% |
| 3 or 4 Unit Apartments | 0 | 0.0% |
| 5 to 9 Unit Apartments | 0 | 0.0% |
| 10 or more Apartments | 0 | 0.0% |
| Mobile Home / Other | 8 | 3.0% |
| Total | 264 | 100.0% |
Housing Structures by Occupancy in Ridgeside
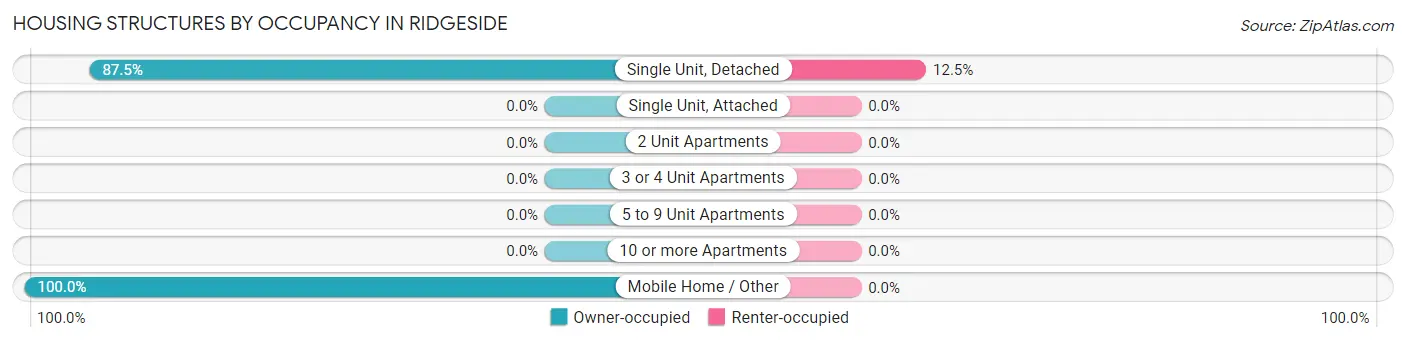
| Structure Type | Owner-occupied | Renter-occupied |
| Single Unit, Detached | 224 (87.5%) | 32 (12.5%) |
| Single Unit, Attached | 0 (0.0%) | 0 (0.0%) |
| 2 Unit Apartments | 0 (0.0%) | 0 (0.0%) |
| 3 or 4 Unit Apartments | 0 (0.0%) | 0 (0.0%) |
| 5 to 9 Unit Apartments | 0 (0.0%) | 0 (0.0%) |
| 10 or more Apartments | 0 (0.0%) | 0 (0.0%) |
| Mobile Home / Other | 8 (100.0%) | 0 (0.0%) |
| Total | 232 (87.9%) | 32 (12.1%) |
Housing Structures by Number of Rooms in Ridgeside
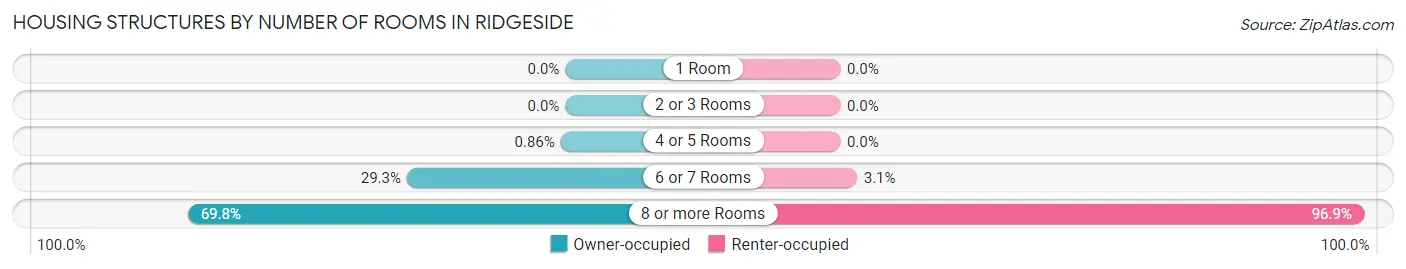
| Number of Rooms | Owner-occupied | Renter-occupied |
| 1 Room | 0 (0.0%) | 0 (0.0%) |
| 2 or 3 Rooms | 0 (0.0%) | 0 (0.0%) |
| 4 or 5 Rooms | 2 (0.9%) | 0 (0.0%) |
| 6 or 7 Rooms | 68 (29.3%) | 1 (3.1%) |
| 8 or more Rooms | 162 (69.8%) | 31 (96.9%) |
| Total | 232 (100.0%) | 32 (100.0%) |
Housing Structure by Heating Type in Ridgeside
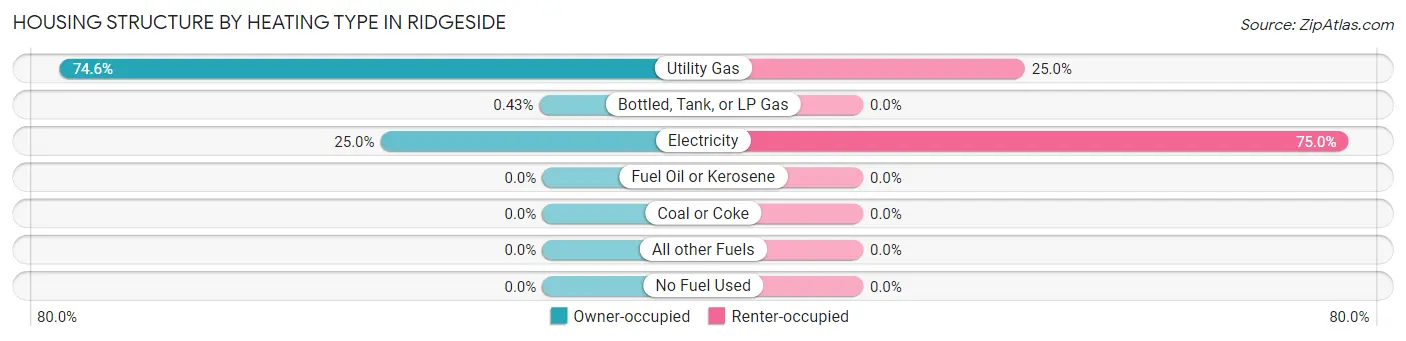
| Heating Type | Owner-occupied | Renter-occupied |
| Utility Gas | 173 (74.6%) | 8 (25.0%) |
| Bottled, Tank, or LP Gas | 1 (0.4%) | 0 (0.0%) |
| Electricity | 58 (25.0%) | 24 (75.0%) |
| Fuel Oil or Kerosene | 0 (0.0%) | 0 (0.0%) |
| Coal or Coke | 0 (0.0%) | 0 (0.0%) |
| All other Fuels | 0 (0.0%) | 0 (0.0%) |
| No Fuel Used | 0 (0.0%) | 0 (0.0%) |
| Total | 232 (100.0%) | 32 (100.0%) |
Household Vehicle Usage in Ridgeside
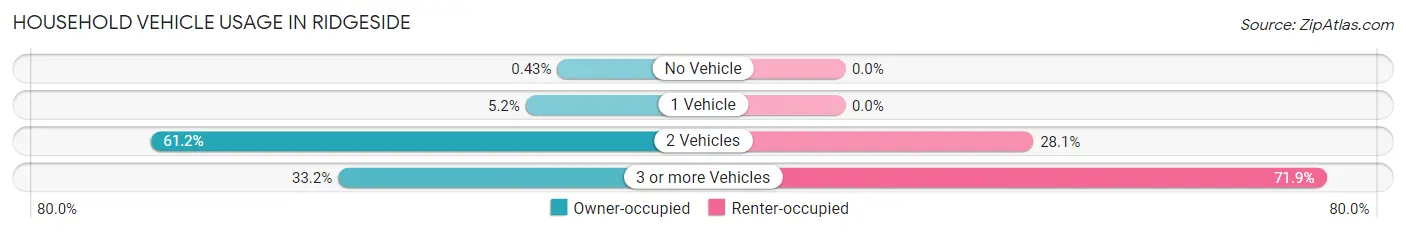
| Vehicles per Household | Owner-occupied | Renter-occupied |
| No Vehicle | 1 (0.4%) | 0 (0.0%) |
| 1 Vehicle | 12 (5.2%) | 0 (0.0%) |
| 2 Vehicles | 142 (61.2%) | 9 (28.1%) |
| 3 or more Vehicles | 77 (33.2%) | 23 (71.9%) |
| Total | 232 (100.0%) | 32 (100.0%) |
Real Estate & Mortgages in Ridgeside
Real Estate and Mortgage Overview in Ridgeside
| Characteristic | Without Mortgage | With Mortgage |
| Housing Units | 74 | 158 |
| Median Property Value | $384,200 | $458,800 |
| Median Household Income | $126,389 | $118 |
| Monthly Housing Costs | $670 | $34 |
| Real Estate Taxes | $3,316 | $0 |
Property Value by Mortgage Status in Ridgeside
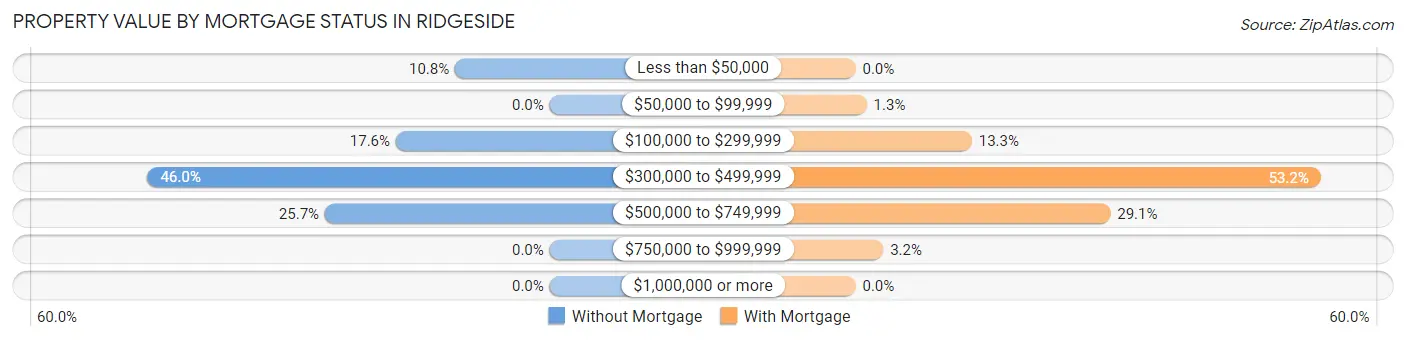
| Property Value | Without Mortgage | With Mortgage |
| Less than $50,000 | 8 (10.8%) | 0 (0.0%) |
| $50,000 to $99,999 | 0 (0.0%) | 2 (1.3%) |
| $100,000 to $299,999 | 13 (17.6%) | 21 (13.3%) |
| $300,000 to $499,999 | 34 (46.0%) | 84 (53.2%) |
| $500,000 to $749,999 | 19 (25.7%) | 46 (29.1%) |
| $750,000 to $999,999 | 0 (0.0%) | 5 (3.2%) |
| $1,000,000 or more | 0 (0.0%) | 0 (0.0%) |
| Total | 74 (100.0%) | 158 (100.0%) |
Household Income by Mortgage Status in Ridgeside
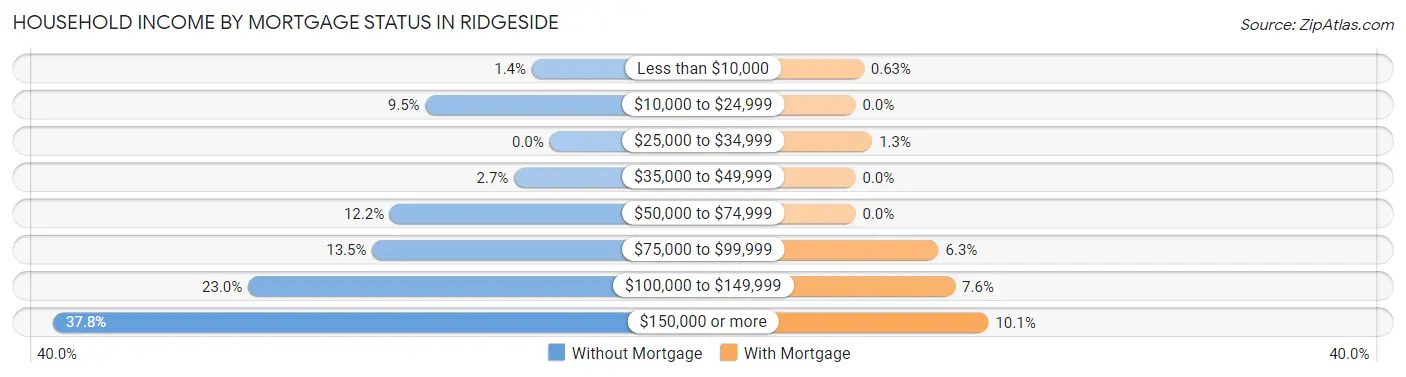
| Household Income | Without Mortgage | With Mortgage |
| Less than $10,000 | 1 (1.3%) | 1 (0.6%) |
| $10,000 to $24,999 | 7 (9.5%) | 0 (0.0%) |
| $25,000 to $34,999 | 0 (0.0%) | 2 (1.3%) |
| $35,000 to $49,999 | 2 (2.7%) | 0 (0.0%) |
| $50,000 to $74,999 | 9 (12.2%) | 0 (0.0%) |
| $75,000 to $99,999 | 10 (13.5%) | 10 (6.3%) |
| $100,000 to $149,999 | 17 (23.0%) | 12 (7.6%) |
| $150,000 or more | 28 (37.8%) | 16 (10.1%) |
| Total | 74 (100.0%) | 158 (100.0%) |
Property Value to Household Income Ratio in Ridgeside
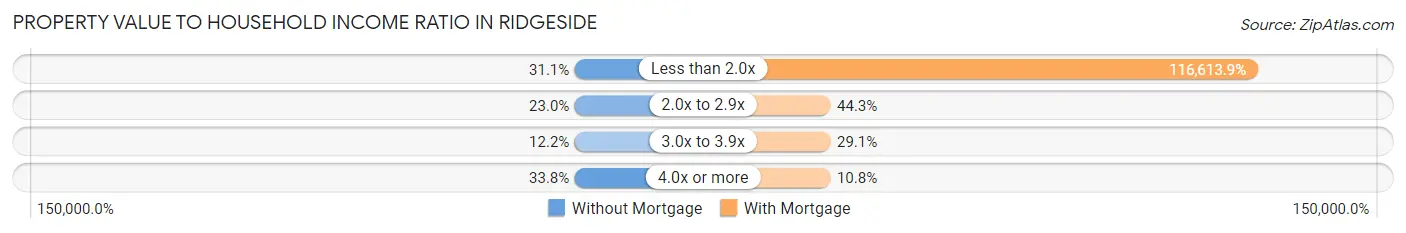
| Value-to-Income Ratio | Without Mortgage | With Mortgage |
| Less than 2.0x | 23 (31.1%) | 184,250 (116,613.9%) |
| 2.0x to 2.9x | 17 (23.0%) | 70 (44.3%) |
| 3.0x to 3.9x | 9 (12.2%) | 46 (29.1%) |
| 4.0x or more | 25 (33.8%) | 17 (10.8%) |
| Total | 74 (100.0%) | 158 (100.0%) |
Real Estate Taxes by Mortgage Status in Ridgeside
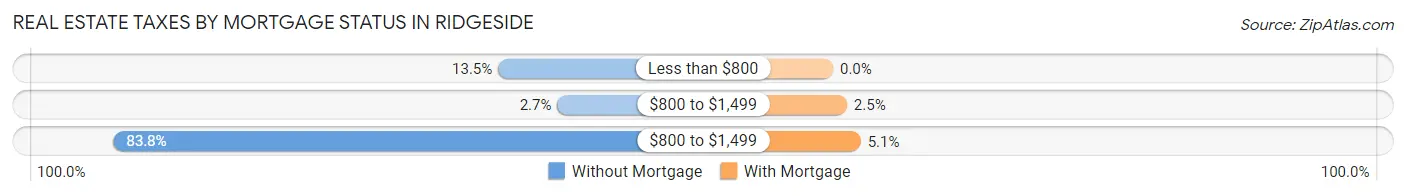
| Property Taxes | Without Mortgage | With Mortgage |
| Less than $800 | 10 (13.5%) | 0 (0.0%) |
| $800 to $1,499 | 2 (2.7%) | 4 (2.5%) |
| $800 to $1,499 | 62 (83.8%) | 8 (5.1%) |
| Total | 74 (100.0%) | 158 (100.0%) |
Health & Disability in Ridgeside
Health Insurance Coverage by Age in Ridgeside
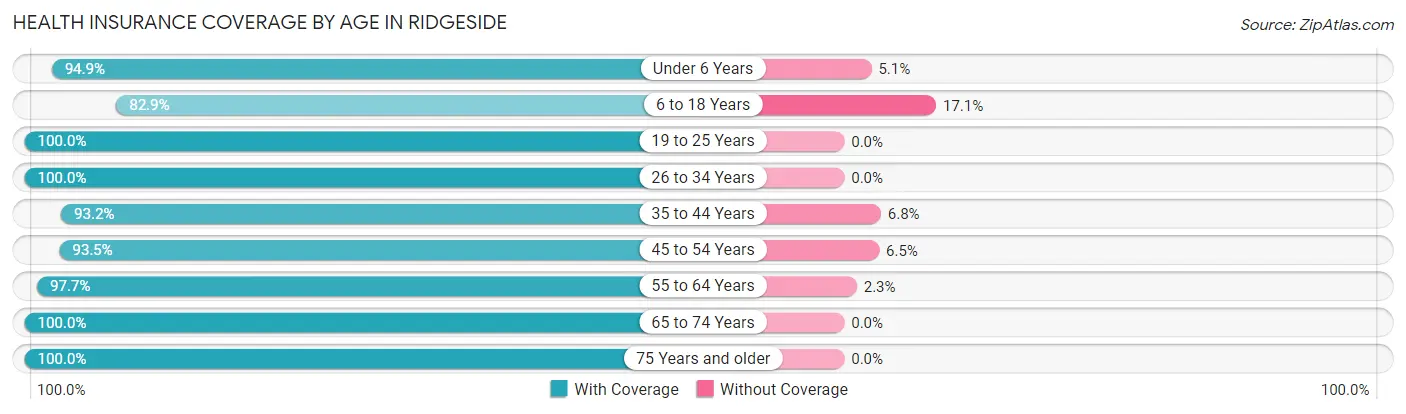
| Age Bracket | With Coverage | Without Coverage |
| Under 6 Years | 75 (94.9%) | 4 (5.1%) |
| 6 to 18 Years | 218 (82.9%) | 45 (17.1%) |
| 19 to 25 Years | 12 (100.0%) | 0 (0.0%) |
| 26 to 34 Years | 5 (100.0%) | 0 (0.0%) |
| 35 to 44 Years | 164 (93.2%) | 12 (6.8%) |
| 45 to 54 Years | 144 (93.5%) | 10 (6.5%) |
| 55 to 64 Years | 84 (97.7%) | 2 (2.3%) |
| 65 to 74 Years | 71 (100.0%) | 0 (0.0%) |
| 75 Years and older | 71 (100.0%) | 0 (0.0%) |
| Total | 844 (92.0%) | 73 (8.0%) |
Health Insurance Coverage by Citizenship Status in Ridgeside
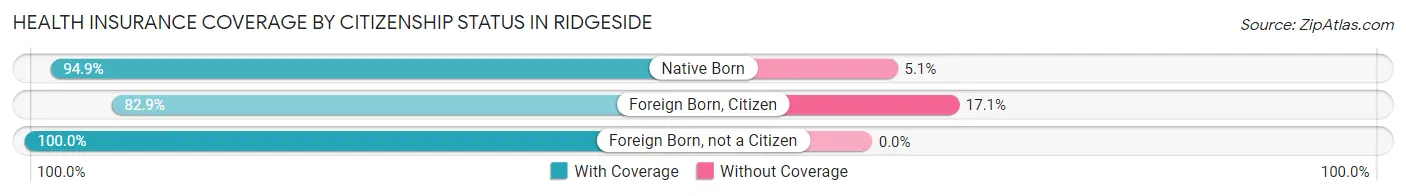
| Citizenship Status | With Coverage | Without Coverage |
| Native Born | 75 (94.9%) | 4 (5.1%) |
| Foreign Born, Citizen | 218 (82.9%) | 45 (17.1%) |
| Foreign Born, not a Citizen | 12 (100.0%) | 0 (0.0%) |
Health Insurance Coverage by Household Income in Ridgeside
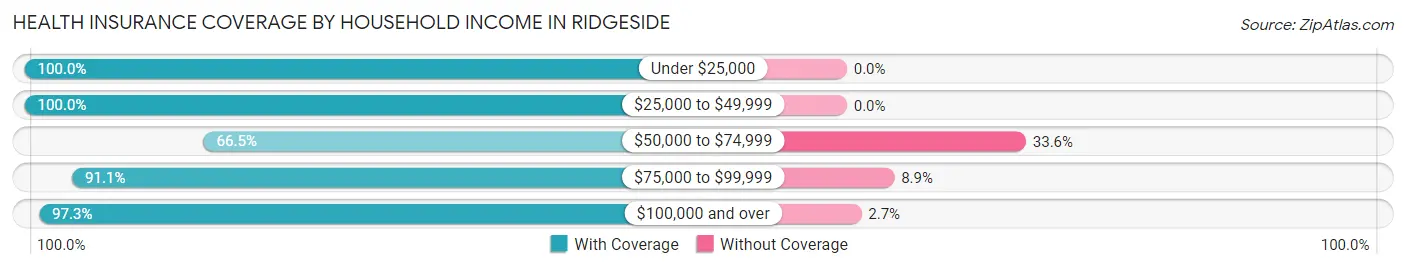
| Household Income | With Coverage | Without Coverage |
| Under $25,000 | 55 (100.0%) | 0 (0.0%) |
| $25,000 to $49,999 | 3 (100.0%) | 0 (0.0%) |
| $50,000 to $74,999 | 101 (66.4%) | 51 (33.6%) |
| $75,000 to $99,999 | 41 (91.1%) | 4 (8.9%) |
| $100,000 and over | 644 (97.3%) | 18 (2.7%) |
Public vs Private Health Insurance Coverage by Age in Ridgeside
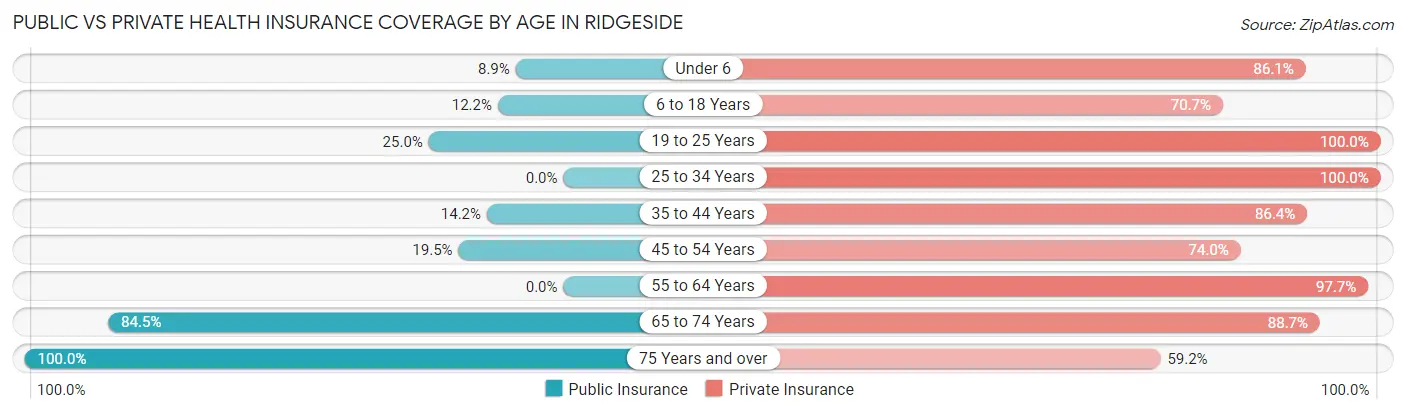
| Age Bracket | Public Insurance | Private Insurance |
| Under 6 | 7 (8.9%) | 68 (86.1%) |
| 6 to 18 Years | 32 (12.2%) | 186 (70.7%) |
| 19 to 25 Years | 3 (25.0%) | 12 (100.0%) |
| 25 to 34 Years | 0 (0.0%) | 5 (100.0%) |
| 35 to 44 Years | 25 (14.2%) | 152 (86.4%) |
| 45 to 54 Years | 30 (19.5%) | 114 (74.0%) |
| 55 to 64 Years | 0 (0.0%) | 84 (97.7%) |
| 65 to 74 Years | 60 (84.5%) | 63 (88.7%) |
| 75 Years and over | 71 (100.0%) | 42 (59.2%) |
| Total | 228 (24.9%) | 726 (79.2%) |
Disability Status by Sex by Age in Ridgeside
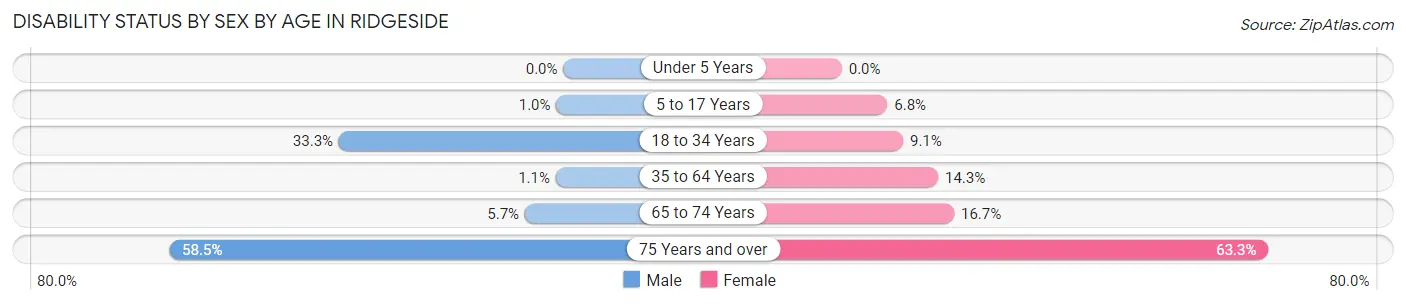
| Age Bracket | Male | Female |
| Under 5 Years | 0 (0.0%) | 0 (0.0%) |
| 5 to 17 Years | 2 (1.0%) | 5 (6.8%) |
| 18 to 34 Years | 4 (33.3%) | 1 (9.1%) |
| 35 to 64 Years | 2 (1.1%) | 34 (14.3%) |
| 65 to 74 Years | 2 (5.7%) | 6 (16.7%) |
| 75 Years and over | 24 (58.5%) | 19 (63.3%) |
Disability Class by Sex by Age in Ridgeside
Disability Class: Hearing Difficulty
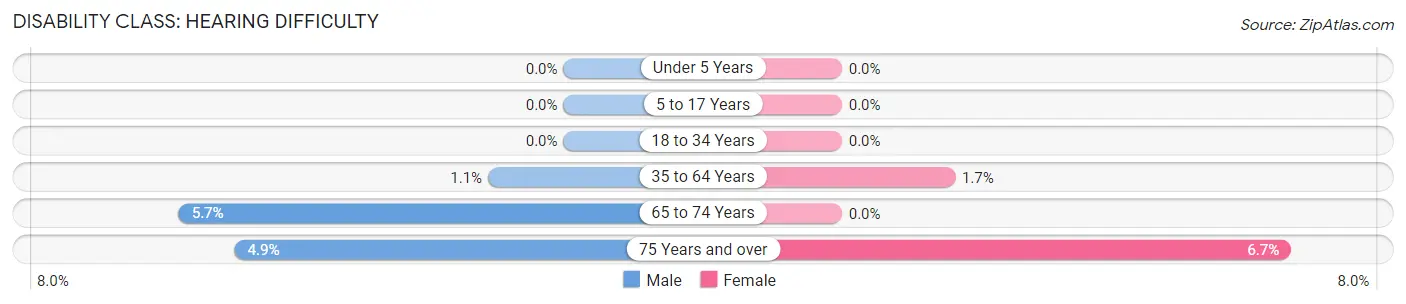
| Age Bracket | Male | Female |
| Under 5 Years | 0 (0.0%) | 0 (0.0%) |
| 5 to 17 Years | 0 (0.0%) | 0 (0.0%) |
| 18 to 34 Years | 0 (0.0%) | 0 (0.0%) |
| 35 to 64 Years | 2 (1.1%) | 4 (1.7%) |
| 65 to 74 Years | 2 (5.7%) | 0 (0.0%) |
| 75 Years and over | 2 (4.9%) | 2 (6.7%) |
Disability Class: Vision Difficulty
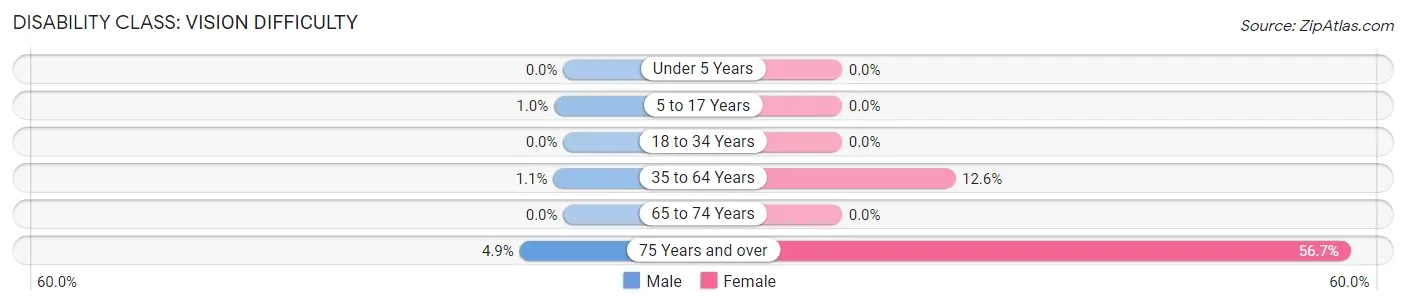
| Age Bracket | Male | Female |
| Under 5 Years | 0 (0.0%) | 0 (0.0%) |
| 5 to 17 Years | 2 (1.0%) | 0 (0.0%) |
| 18 to 34 Years | 0 (0.0%) | 0 (0.0%) |
| 35 to 64 Years | 2 (1.1%) | 30 (12.6%) |
| 65 to 74 Years | 0 (0.0%) | 0 (0.0%) |
| 75 Years and over | 2 (4.9%) | 17 (56.7%) |
Disability Class: Cognitive Difficulty
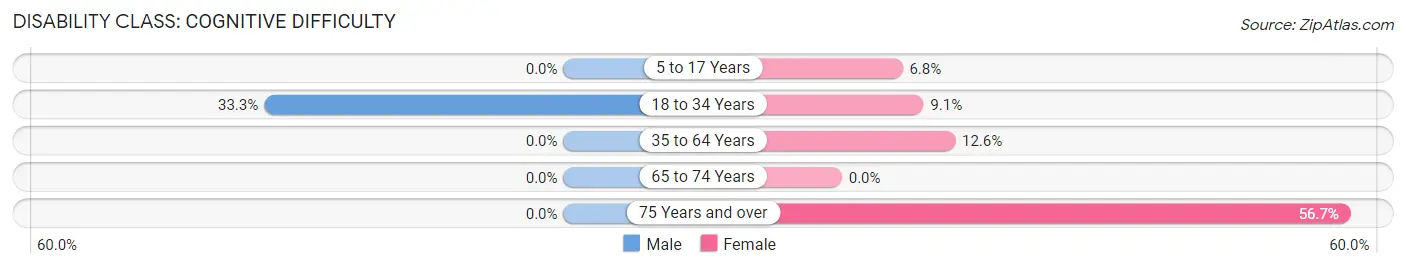
| Age Bracket | Male | Female |
| 5 to 17 Years | 0 (0.0%) | 5 (6.8%) |
| 18 to 34 Years | 4 (33.3%) | 1 (9.1%) |
| 35 to 64 Years | 0 (0.0%) | 30 (12.6%) |
| 65 to 74 Years | 0 (0.0%) | 0 (0.0%) |
| 75 Years and over | 0 (0.0%) | 17 (56.7%) |
Disability Class: Ambulatory Difficulty
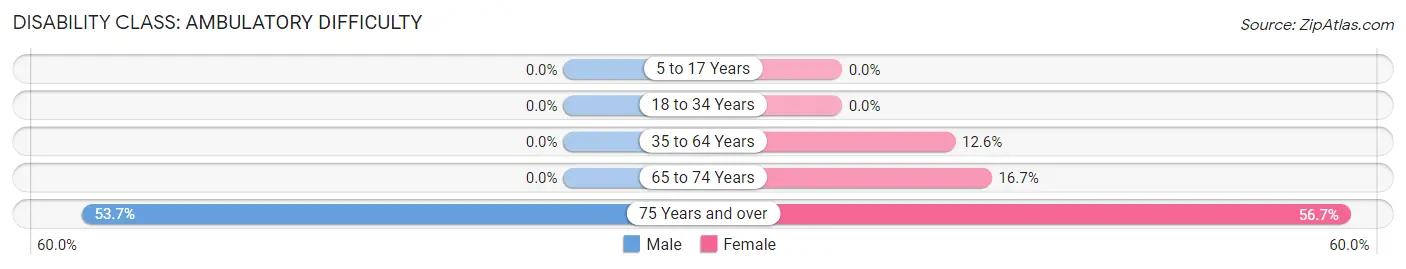
| Age Bracket | Male | Female |
| 5 to 17 Years | 0 (0.0%) | 0 (0.0%) |
| 18 to 34 Years | 0 (0.0%) | 0 (0.0%) |
| 35 to 64 Years | 0 (0.0%) | 30 (12.6%) |
| 65 to 74 Years | 0 (0.0%) | 6 (16.7%) |
| 75 Years and over | 22 (53.7%) | 17 (56.7%) |
Disability Class: Self-Care Difficulty
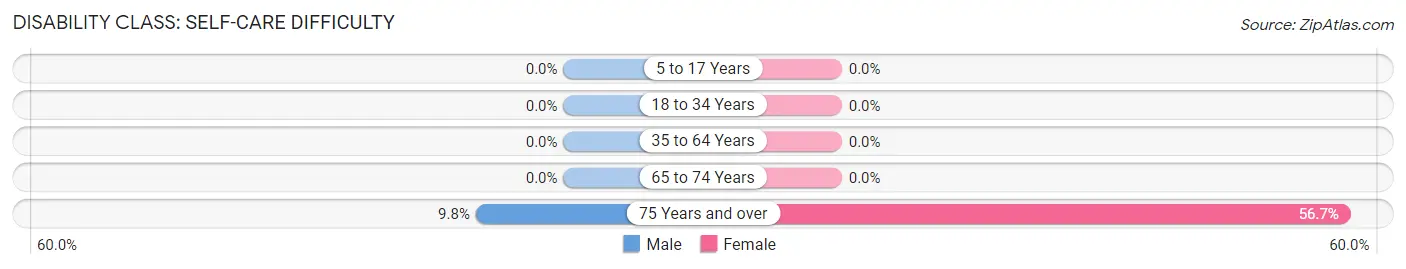
| Age Bracket | Male | Female |
| 5 to 17 Years | 0 (0.0%) | 0 (0.0%) |
| 18 to 34 Years | 0 (0.0%) | 0 (0.0%) |
| 35 to 64 Years | 0 (0.0%) | 0 (0.0%) |
| 65 to 74 Years | 0 (0.0%) | 0 (0.0%) |
| 75 Years and over | 4 (9.8%) | 17 (56.7%) |
Technology Access in Ridgeside
Computing Device Access in Ridgeside
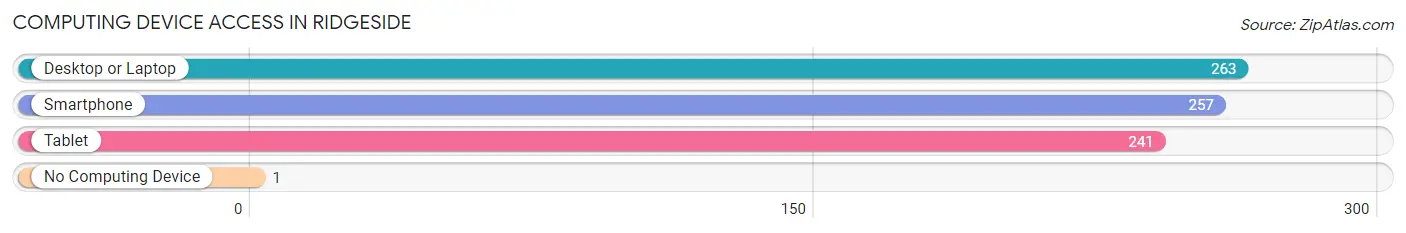
| Device Type | # Households | % Households |
| Desktop or Laptop | 263 | 99.6% |
| Smartphone | 257 | 97.4% |
| Tablet | 241 | 91.3% |
| No Computing Device | 1 | 0.4% |
| Total | 264 | 100.0% |
Internet Access in Ridgeside
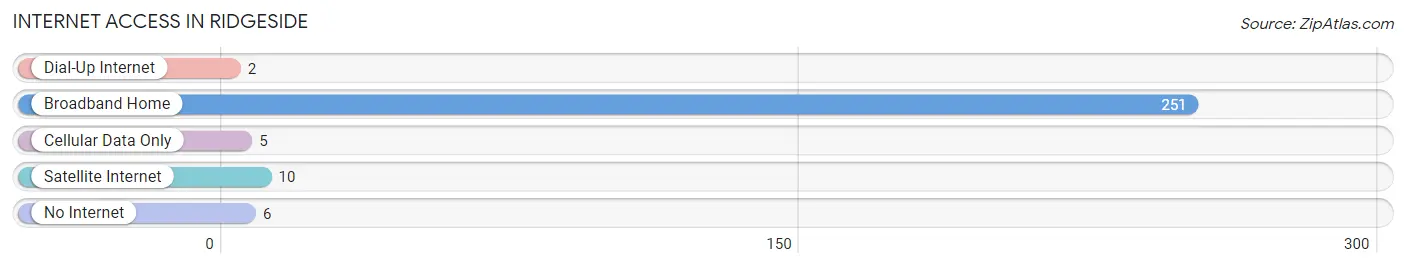
| Internet Type | # Households | % Households |
| Dial-Up Internet | 2 | 0.8% |
| Broadband Home | 251 | 95.1% |
| Cellular Data Only | 5 | 1.9% |
| Satellite Internet | 10 | 3.8% |
| No Internet | 6 | 2.3% |
| Total | 264 | 100.0% |
Ridgeside Summary
Ridgeside is a small city located in Hamilton County, Tennessee. It is situated on the banks of the Tennessee River, just north of Chattanooga. The city has a population of approximately 8,000 people and is part of the Chattanooga metropolitan area.
History
Ridgeside was founded in 1819 by a group of settlers from North Carolina. The settlers were looking for a place to settle and start a new life. The area was originally known as “Ridge’s Side”, named after the ridge that ran along the Tennessee River. The settlers built a small community and began to farm the land.
In 1838, the city was officially incorporated as Ridgeside. The city grew slowly over the years, but it was not until the late 19th century that it began to experience significant growth. This was due to the development of the railroad, which connected Ridgeside to Chattanooga and other cities in the region.
The city continued to grow throughout the 20th century, and by the year 2000, it had a population of 8,000 people.
Geography
Ridgeside is located in Hamilton County, Tennessee, on the banks of the Tennessee River. The city is situated in a valley, surrounded by hills and mountains. The city is located approximately 20 miles north of Chattanooga and is part of the Chattanooga metropolitan area.
The city has a total area of 4.2 square miles, of which 0.2 square miles is water. The city is located at an elevation of 830 feet above sea level.
Economy
Ridgeside’s economy is largely based on manufacturing and retail. The city is home to several manufacturing companies, including a paper mill, a furniture factory, and a plastics plant. The city also has a number of retail stores, including a grocery store, a hardware store, and a variety of other shops.
The city also has a number of small businesses including restaurants bars and other services
Demographics
As of the 2010 census, the population of Ridgeside was 8,000 people. The racial makeup of the city was 79.2% White, 15.2% African American, 0.3% Native American, 0.7% Asian, 0.1% Pacific Islander, and 4.5% from other races. Hispanic or Latino of any race were 2.2% of the population.
The median income for a household in the city was $37,917, and the median income for a family was $45,917. The per capita income for the city was $20,917. About 11.2% of families and 14.2% of the population were below the poverty line, including 19.2% of those under age 18 and 8.2% of those age 65 or over.
Ridgeside is a small city with a rich history and a diverse population. The city has a strong economy and is home to a variety of businesses and services. The city is also home to a number of parks and recreational areas, making it a great place to live and visit.
Common Questions
What is the Total Population of Ridgeside?
Total Population of Ridgeside is 919.
What is the Total Male Population of Ridgeside?
Total Male Population of Ridgeside is 514.
What is the Total Female Population of Ridgeside?
Total Female Population of Ridgeside is 405.
What is the Ratio of Males per 100 Females in Ridgeside?
There are 126.91 Males per 100 Females in Ridgeside.
What is the Ratio of Females per 100 Males in Ridgeside?
There are 78.79 Females per 100 Males in Ridgeside.
What is the Median Population Age in Ridgeside?
Median Population Age in Ridgeside is 42.2 Years.
What is the Average Family Size in Ridgeside
Average Family Size in Ridgeside is 3.7 People.
What is the Average Household Size in Ridgeside
Average Household Size in Ridgeside is 3.5 People.
What is Per Capita Income in Ridgeside?
Per Capita income in Ridgeside is $59,830.
What is the Median Family Income in Ridgeside?
Median Family Income in Ridgeside is $166,250.
What is the Median Household income in Ridgeside?
Median Household Income in Ridgeside is $158,750.
What is Income or Wage Gap in Ridgeside?
Income or Wage Gap in Ridgeside is 20.5%.
Women in Ridgeside earn 79.5 cents for every dollar earned by a man.
What is Family Income Deficit in Ridgeside?
Family Income Deficit in Ridgeside is $16,189.
Families that are below poverty line in Ridgeside earn $16,189 less on average than the poverty threshold level.
What is Inequality or Gini Index in Ridgeside?
Inequality or Gini Index in Ridgeside is 0.37.
How Large is the Labor Force in Ridgeside?
There are 430 People in the Labor Forcein in Ridgeside.
What is the Percentage of People in the Labor Force in Ridgeside?
68.3% of People are in the Labor Force in Ridgeside.
What is the Unemployment Rate in Ridgeside?
Unemployment Rate in Ridgeside is 0.7%.