Cities with the Lowest Costs of Housing as Percentage of Income in Tennessee
RELATED REPORTS & OPTIONS
Lowest Housing Costs / Income
Tennessee
Compare Cities
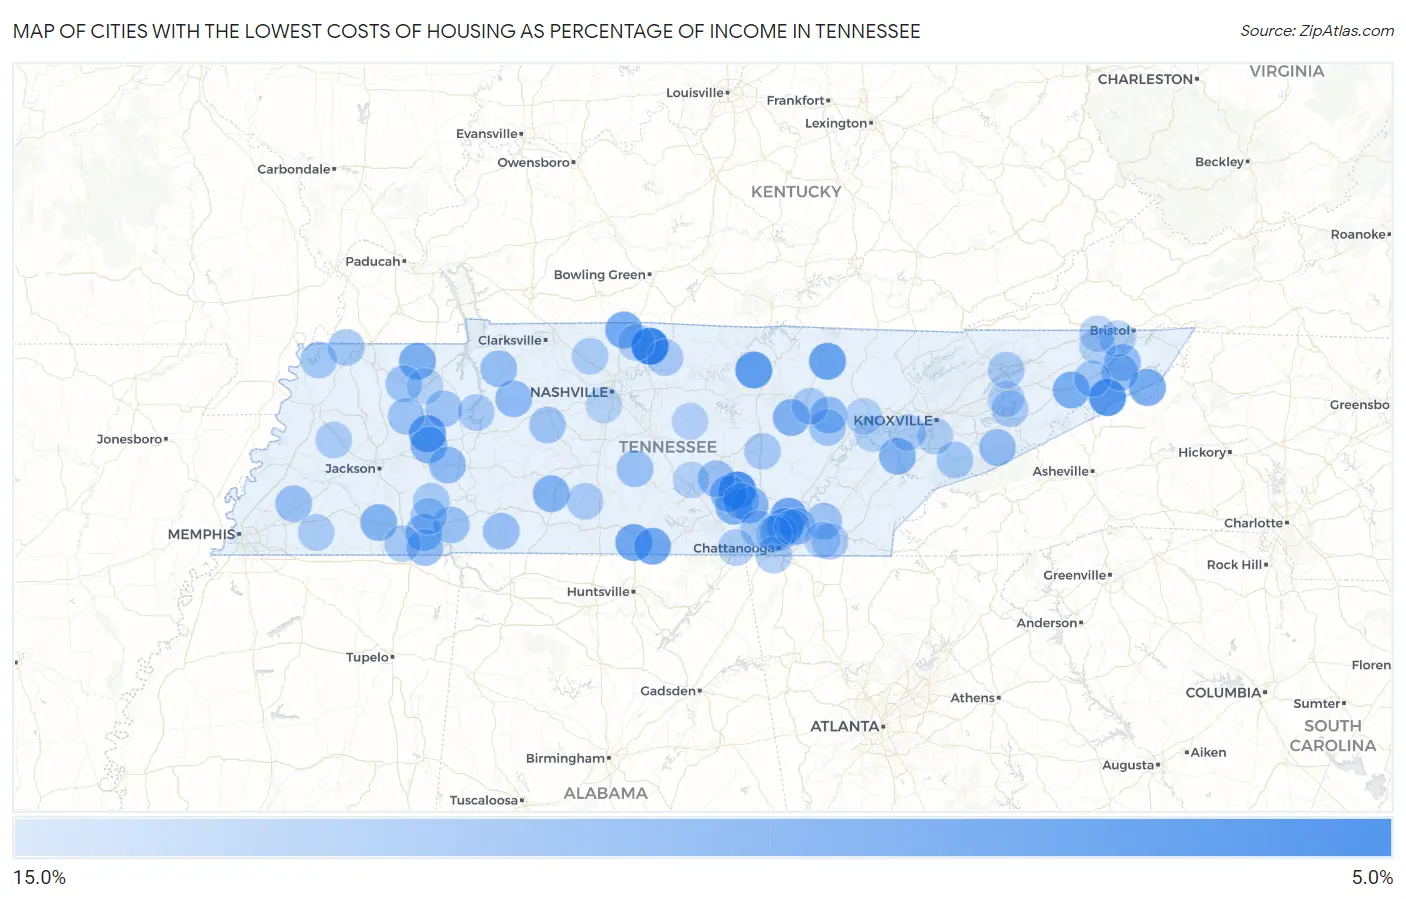
Map of Cities with the Lowest Costs of Housing as Percentage of Income in Tennessee
15.0%
0.0%
Cities with the Lowest Costs of Housing as Percentage of Income in Tennessee
| City | Housing Costs / Income | vs State | vs National | |
| 1. | Graball | 5.3% | 18.8%(-13.5)#1 | 20.4%(-15.1)#100 |
| 2. | Delano | 6.1% | 18.8%(-12.7)#2 | 20.4%(-14.3)#180 |
| 3. | Pinson | 6.1% | 18.8%(-12.7)#3 | 20.4%(-14.2)#184 |
| 4. | Huron | 6.6% | 18.8%(-12.2)#4 | 20.4%(-13.7)#268 |
| 5. | Beersheba Springs | 6.8% | 18.8%(-12.0)#5 | 20.4%(-13.5)#299 |
| 6. | Banner Hill | 7.5% | 18.8%(-11.4)#6 | 20.4%(-12.9)#428 |
| 7. | Big Rock | 7.5% | 18.8%(-11.3)#7 | 20.4%(-12.9)#436 |
| 8. | Dodson Branch | 8.3% | 18.8%(-10.5)#8 | 20.4%(-12.1)#655 |
| 9. | Clarksburg | 8.7% | 18.8%(-10.1)#9 | 20.4%(-11.7)#790 |
| 10. | Allardt | 9.1% | 18.8%(-9.77)#10 | 20.4%(-11.3)#917 |
| 11. | Park City | 9.4% | 18.8%(-9.41)#11 | 20.4%(-10.9)#1,097 |
| 12. | Flintville | 9.4% | 18.8%(-9.41)#12 | 20.4%(-10.9)#1,099 |
| 13. | Mowbray Mountain | 9.5% | 18.8%(-9.33)#13 | 20.4%(-10.9)#1,135 |
| 14. | Falling Water | 9.7% | 18.8%(-9.13)#14 | 20.4%(-10.7)#1,242 |
| 15. | Orlinda | 9.8% | 18.8%(-9.08)#15 | 20.4%(-10.6)#1,264 |
| 16. | Hampton | 9.8% | 18.8%(-9.03)#16 | 20.4%(-10.6)#1,306 |
| 17. | Roan Mountain | 10.0% | 18.8%(-8.83)#17 | 20.4%(-10.4)#1,416 |
| 18. | Embreeville | 10.3% | 18.8%(-8.55)#18 | 20.4%(-10.1)#1,575 |
| 19. | Tusculum | 10.3% | 18.8%(-8.52)#19 | 20.4%(-10.1)#1,592 |
| 20. | Cottage Grove | 10.4% | 18.8%(-8.46)#20 | 20.4%(-10.00)#1,635 |
| 21. | Counce | 10.4% | 18.8%(-8.39)#21 | 20.4%(-9.93)#1,685 |
| 22. | Pleasant Hill | 10.7% | 18.8%(-8.10)#22 | 20.4%(-9.64)#1,892 |
| 23. | Coalmont | 10.7% | 18.8%(-8.10)#23 | 20.4%(-9.64)#1,894 |
| 24. | Summertown | 10.9% | 18.8%(-7.97)#24 | 20.4%(-9.52)#1,990 |
| 25. | Palmer | 11.0% | 18.8%(-7.84)#25 | 20.4%(-9.38)#2,089 |
| 26. | Rarity Bay | 11.0% | 18.8%(-7.83)#26 | 20.4%(-9.38)#2,097 |
| 27. | Hornsby | 11.0% | 18.8%(-7.80)#27 | 20.4%(-9.34)#2,118 |
| 28. | Tellico Village | 11.0% | 18.8%(-7.79)#28 | 20.4%(-9.33)#2,127 |
| 29. | Parker S Crossroads | 11.1% | 18.8%(-7.77)#29 | 20.4%(-9.31)#2,145 |
| 30. | Altamont | 11.2% | 18.8%(-7.67)#30 | 20.4%(-9.21)#2,210 |
| 31. | Lenox | 11.4% | 18.8%(-7.45)#31 | 20.4%(-8.99)#2,409 |
| 32. | Stantonville | 11.5% | 18.8%(-7.31)#32 | 20.4%(-8.86)#2,532 |
| 33. | Fairfield Glade | 11.7% | 18.8%(-7.08)#33 | 20.4%(-8.63)#2,764 |
| 34. | Darden | 11.7% | 18.8%(-7.08)#34 | 20.4%(-8.63)#2,765 |
| 35. | Mcewen | 11.8% | 18.8%(-7.08)#35 | 20.4%(-8.62)#2,770 |
| 36. | Watauga | 11.9% | 18.8%(-6.92)#36 | 20.4%(-8.46)#2,944 |
| 37. | Strawberry Plains | 12.0% | 18.8%(-6.79)#37 | 20.4%(-8.33)#3,070 |
| 38. | Michie | 12.1% | 18.8%(-6.70)#38 | 20.4%(-8.24)#3,161 |
| 39. | Pittman Center | 12.2% | 18.8%(-6.66)#39 | 20.4%(-8.20)#3,219 |
| 40. | Tennessee Ridge | 12.2% | 18.8%(-6.62)#40 | 20.4%(-8.16)#3,262 |
| 41. | Walden | 12.3% | 18.8%(-6.57)#41 | 20.4%(-8.11)#3,315 |
| 42. | Braden | 12.3% | 18.8%(-6.49)#42 | 20.4%(-8.03)#3,404 |
| 43. | Collinwood | 12.4% | 18.8%(-6.46)#43 | 20.4%(-8.00)#3,440 |
| 44. | Viola | 12.4% | 18.8%(-6.40)#44 | 20.4%(-7.94)#3,503 |
| 45. | Pine Crest | 12.5% | 18.8%(-6.35)#45 | 20.4%(-7.89)#3,567 |
| 46. | Unionville | 12.5% | 18.8%(-6.29)#46 | 20.4%(-7.83)#3,641 |
| 47. | Olivet | 12.6% | 18.8%(-6.27)#47 | 20.4%(-7.81)#3,666 |
| 48. | Gleason | 12.7% | 18.8%(-6.18)#48 | 20.4%(-7.72)#3,780 |
| 49. | Gruetli Laager | 12.7% | 18.8%(-6.12)#49 | 20.4%(-7.66)#3,840 |
| 50. | Oak Grove Cdp Washington County | 12.7% | 18.8%(-6.10)#50 | 20.4%(-7.64)#3,862 |
| 51. | Bruceton | 12.8% | 18.8%(-6.07)#51 | 20.4%(-7.62)#3,892 |
| 52. | Bon Air | 12.8% | 18.8%(-6.05)#52 | 20.4%(-7.59)#3,927 |
| 53. | Hopewell | 12.8% | 18.8%(-6.03)#53 | 20.4%(-7.57)#3,957 |
| 54. | Lyles | 12.8% | 18.8%(-6.02)#54 | 20.4%(-7.56)#3,968 |
| 55. | Mclemoresville | 12.9% | 18.8%(-5.95)#55 | 20.4%(-7.49)#4,054 |
| 56. | Mayland | 13.0% | 18.8%(-5.79)#56 | 20.4%(-7.34)#4,236 |
| 57. | Telford | 13.0% | 18.8%(-5.79)#57 | 20.4%(-7.33)#4,238 |
| 58. | Crab Orchard | 13.1% | 18.8%(-5.78)#58 | 20.4%(-7.32)#4,260 |
| 59. | Townsend | 13.1% | 18.8%(-5.71)#59 | 20.4%(-7.26)#4,346 |
| 60. | Woodland Mills | 13.2% | 18.8%(-5.66)#60 | 20.4%(-7.20)#4,421 |
| 61. | Powells Crossroads | 13.2% | 18.8%(-5.65)#61 | 20.4%(-7.20)#4,422 |
| 62. | Lakesite | 13.4% | 18.8%(-5.43)#62 | 20.4%(-6.97)#4,755 |
| 63. | Samburg | 13.4% | 18.8%(-5.42)#63 | 20.4%(-6.96)#4,768 |
| 64. | Milledgeville | 13.4% | 18.8%(-5.40)#64 | 20.4%(-6.94)#4,795 |
| 65. | Adamsville | 13.5% | 18.8%(-5.37)#65 | 20.4%(-6.91)#4,837 |
| 66. | Ramer | 13.5% | 18.8%(-5.35)#66 | 20.4%(-6.89)#4,866 |
| 67. | Lookout Mountain | 13.5% | 18.8%(-5.31)#67 | 20.4%(-6.85)#4,929 |
| 68. | Spencer | 13.5% | 18.8%(-5.30)#68 | 20.4%(-6.84)#4,944 |
| 69. | New Johnsonville | 13.6% | 18.8%(-5.28)#69 | 20.4%(-6.82)#4,971 |
| 70. | Bean Station | 13.6% | 18.8%(-5.24)#70 | 20.4%(-6.78)#5,040 |
| 71. | Lynnville | 13.6% | 18.8%(-5.21)#71 | 20.4%(-6.75)#5,090 |
| 72. | Bowman | 13.6% | 18.8%(-5.20)#72 | 20.4%(-6.74)#5,108 |
| 73. | Castalian Springs | 13.6% | 18.8%(-5.19)#73 | 20.4%(-6.73)#5,113 |
| 74. | Wildwood Lake | 13.7% | 18.8%(-5.15)#74 | 20.4%(-6.70)#5,165 |
| 75. | Baneberry | 13.7% | 18.8%(-5.15)#75 | 20.4%(-6.70)#5,167 |
| 76. | Williston | 13.7% | 18.8%(-5.10)#76 | 20.4%(-6.64)#5,262 |
| 77. | Farragut | 13.8% | 18.8%(-5.05)#77 | 20.4%(-6.59)#5,329 |
| 78. | Coopertown | 13.9% | 18.8%(-4.97)#78 | 20.4%(-6.51)#5,453 |
| 79. | Kimball | 13.9% | 18.8%(-4.97)#79 | 20.4%(-6.51)#5,461 |
| 80. | Maury City | 13.9% | 18.8%(-4.95)#80 | 20.4%(-6.49)#5,483 |
| 81. | New Deal | 14.0% | 18.8%(-4.88)#81 | 20.4%(-6.42)#5,600 |
| 82. | Finley | 14.0% | 18.8%(-4.85)#82 | 20.4%(-6.39)#5,634 |
| 83. | Rockford | 14.1% | 18.8%(-4.74)#83 | 20.4%(-6.28)#5,825 |
| 84. | White Pine | 14.1% | 18.8%(-4.72)#84 | 20.4%(-6.26)#5,871 |
| 85. | Signal Mountain | 14.1% | 18.8%(-4.69)#85 | 20.4%(-6.23)#5,925 |
| 86. | Blountville | 14.2% | 18.8%(-4.68)#86 | 20.4%(-6.22)#5,954 |
| 87. | Farner | 14.2% | 18.8%(-4.64)#87 | 20.4%(-6.18)#6,018 |
| 88. | Colonial Heights | 14.2% | 18.8%(-4.63)#88 | 20.4%(-6.17)#6,040 |
| 89. | Middle Valley | 14.2% | 18.8%(-4.63)#89 | 20.4%(-6.17)#6,049 |
| 90. | Bloomingdale | 14.2% | 18.8%(-4.60)#90 | 20.4%(-6.14)#6,094 |
| 91. | South Cleveland | 14.3% | 18.8%(-4.58)#91 | 20.4%(-6.12)#6,118 |
| 92. | Auburntown | 14.3% | 18.8%(-4.51)#92 | 20.4%(-6.05)#6,234 |
| 93. | Oakdale | 14.3% | 18.8%(-4.50)#93 | 20.4%(-6.04)#6,244 |
| 94. | New Union | 14.3% | 18.8%(-4.49)#94 | 20.4%(-6.04)#6,263 |
| 95. | Orebank | 14.4% | 18.8%(-4.40)#95 | 20.4%(-5.94)#6,420 |
| 96. | Kingston | 14.5% | 18.8%(-4.37)#96 | 20.4%(-5.92)#6,468 |
| 97. | Forest Hills | 14.5% | 18.8%(-4.35)#97 | 20.4%(-5.89)#6,514 |
| 98. | Lynchburg | 14.5% | 18.8%(-4.31)#98 | 20.4%(-5.85)#6,566 |
| 99. | Henry | 14.6% | 18.8%(-4.26)#99 | 20.4%(-5.80)#6,646 |
| 100. | Biltmore | 14.6% | 18.8%(-4.25)#100 | 20.4%(-5.79)#6,660 |
Common Questions
What are the Top 10 Cities with the Lowest Costs of Housing as Percentage of Income in Tennessee?
Top 10 Cities with the Lowest Costs of Housing as Percentage of Income in Tennessee are:
#1
5.3%
#2
6.8%
#3
7.5%
#4
8.3%
#5
8.7%
#6
9.1%
#7
9.4%
#8
9.4%
#9
9.5%
#10
9.7%
What city has the Lowest Costs of Housing as Percentage of Income in Tennessee?
Graball has the Lowest Costs of Housing as Percentage of Income in Tennessee with 5.3%.
What is the Average Housing Costs as Percentage of Income in the State of Tennessee?
Average Housing Costs as Percentage of Income in Tennessee is 18.8%.
What is the Average Housing Costs as Percentage of Income in the United States?
Average Housing Costs as Percentage of Income in the United States is 20.4%.