Cities with the Most Immigrants from Eastern Asia in Tennessee
RELATED REPORTS & OPTIONS
Eastern Asia
Tennessee
Compare Cities
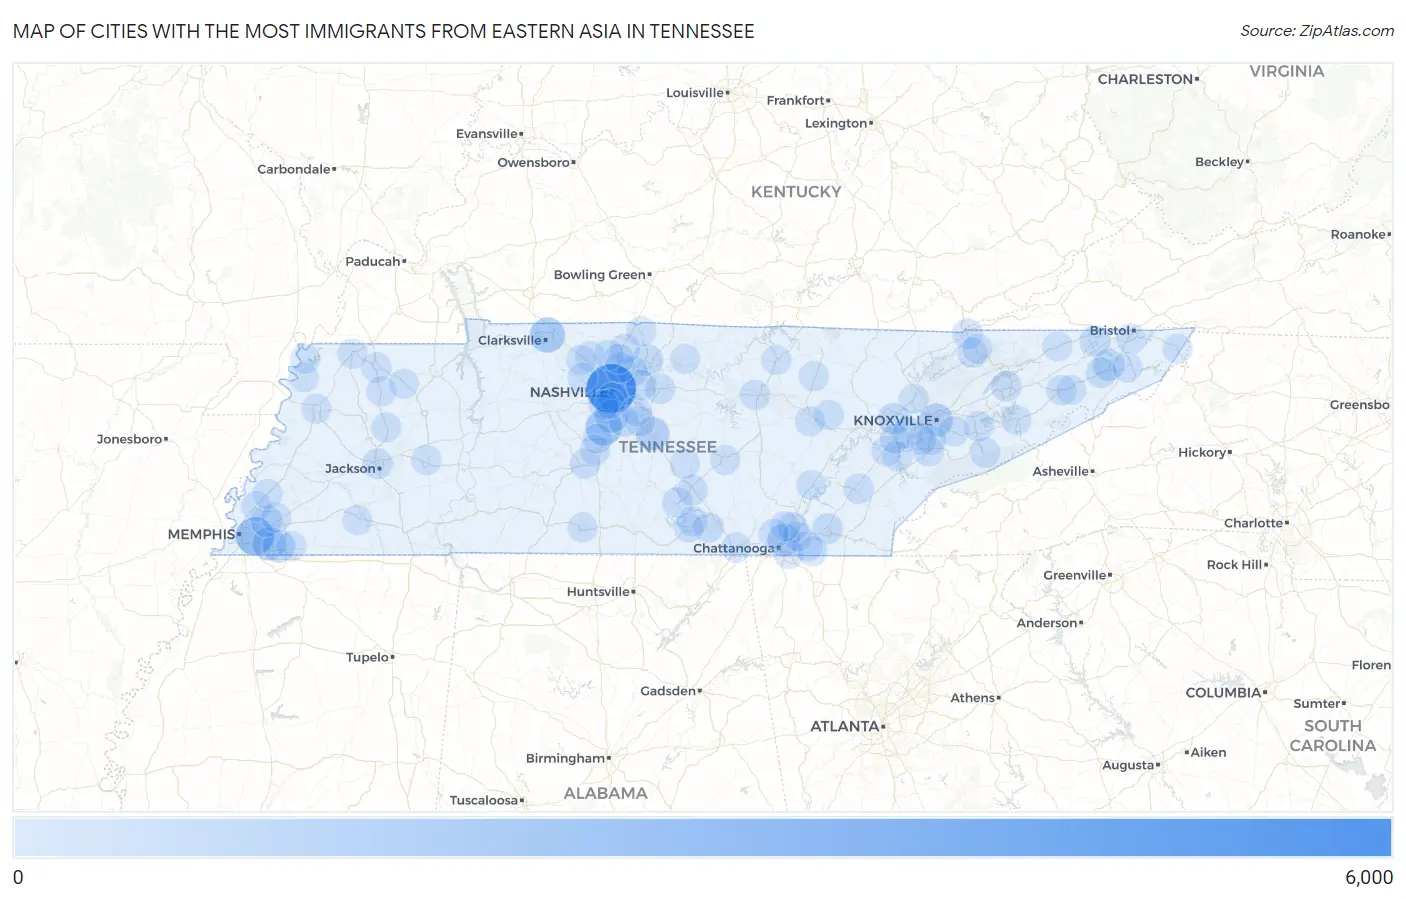
Map of Cities with the Most Immigrants from Eastern Asia in Tennessee
0
6,000
Cities with the Most Immigrants from Eastern Asia in Tennessee
| City | Eastern Asia | vs State | vs National | |
| 1. | Nashville | 5,085 | 26,659(19.07%)#1 | 4,223,726(0.12%)#109 |
| 2. | Memphis | 2,037 | 26,659(7.64%)#2 | 4,223,726(0.05%)#280 |
| 3. | Franklin | 1,529 | 26,659(5.74%)#3 | 4,223,726(0.04%)#365 |
| 4. | Clarksville | 1,246 | 26,659(4.67%)#4 | 4,223,726(0.03%)#459 |
| 5. | Murfreesboro | 855 | 26,659(3.21%)#5 | 4,223,726(0.02%)#611 |
| 6. | Brentwood | 833 | 26,659(3.12%)#6 | 4,223,726(0.02%)#625 |
| 7. | Knoxville | 811 | 26,659(3.04%)#7 | 4,223,726(0.02%)#636 |
| 8. | Germantown | 768 | 26,659(2.88%)#8 | 4,223,726(0.02%)#663 |
| 9. | Chattanooga | 678 | 26,659(2.54%)#9 | 4,223,726(0.02%)#732 |
| 10. | Collierville | 633 | 26,659(2.37%)#10 | 4,223,726(0.01%)#784 |
| 11. | Johnson City | 421 | 26,659(1.58%)#11 | 4,223,726(0.01%)#1,076 |
| 12. | Oak Ridge | 378 | 26,659(1.42%)#12 | 4,223,726(0.01%)#1,165 |
| 13. | Bartlett | 360 | 26,659(1.35%)#13 | 4,223,726(0.01%)#1,219 |
| 14. | Gallatin | 359 | 26,659(1.35%)#14 | 4,223,726(0.01%)#1,225 |
| 15. | Farragut | 300 | 26,659(1.13%)#15 | 4,223,726(0.01%)#1,392 |
| 16. | Kingsport | 245 | 26,659(0.92%)#16 | 4,223,726(0.01%)#1,598 |
| 17. | Cleveland | 244 | 26,659(0.92%)#17 | 4,223,726(0.01%)#1,602 |
| 18. | Jonesborough | 225 | 26,659(0.84%)#18 | 4,223,726(0.01%)#1,697 |
| 19. | Hendersonville | 171 | 26,659(0.64%)#19 | 4,223,726(0.00%)#2,021 |
| 20. | Jackson | 154 | 26,659(0.58%)#20 | 4,223,726(0.00%)#2,158 |
| 21. | Morristown | 142 | 26,659(0.53%)#21 | 4,223,726(0.00%)#2,270 |
| 22. | Manchester | 140 | 26,659(0.53%)#22 | 4,223,726(0.00%)#2,294 |
| 23. | Tullahoma | 139 | 26,659(0.52%)#23 | 4,223,726(0.00%)#2,303 |
| 24. | Mount Juliet | 138 | 26,659(0.52%)#24 | 4,223,726(0.00%)#2,311 |
| 25. | Maryville | 135 | 26,659(0.51%)#25 | 4,223,726(0.00%)#2,343 |
| 26. | Middle Valley | 119 | 26,659(0.45%)#26 | 4,223,726(0.00%)#2,501 |
| 27. | Smyrna | 108 | 26,659(0.41%)#27 | 4,223,726(0.00%)#2,636 |
| 28. | Seymour | 108 | 26,659(0.41%)#28 | 4,223,726(0.00%)#2,640 |
| 29. | Lebanon | 97 | 26,659(0.36%)#29 | 4,223,726(0.00%)#2,795 |
| 30. | White House | 90 | 26,659(0.34%)#30 | 4,223,726(0.00%)#2,920 |
| 31. | Collegedale | 89 | 26,659(0.33%)#31 | 4,223,726(0.00%)#2,938 |
| 32. | Nolensville | 87 | 26,659(0.33%)#32 | 4,223,726(0.00%)#2,981 |
| 33. | Athens | 87 | 26,659(0.33%)#33 | 4,223,726(0.00%)#2,982 |
| 34. | Columbia | 82 | 26,659(0.31%)#34 | 4,223,726(0.00%)#3,055 |
| 35. | Cookeville | 80 | 26,659(0.30%)#35 | 4,223,726(0.00%)#3,096 |
| 36. | Goodlettsville | 79 | 26,659(0.30%)#36 | 4,223,726(0.00%)#3,127 |
| 37. | Martin | 74 | 26,659(0.28%)#37 | 4,223,726(0.00%)#3,228 |
| 38. | Spring Hill | 66 | 26,659(0.25%)#38 | 4,223,726(0.00%)#3,423 |
| 39. | Sevierville | 63 | 26,659(0.24%)#39 | 4,223,726(0.00%)#3,506 |
| 40. | Gatlinburg | 61 | 26,659(0.23%)#40 | 4,223,726(0.00%)#3,569 |
| 41. | Oak Grove Cdp Washington County | 57 | 26,659(0.21%)#41 | 4,223,726(0.00%)#3,682 |
| 42. | Harrogate | 57 | 26,659(0.21%)#42 | 4,223,726(0.00%)#3,683 |
| 43. | Tellico Village | 56 | 26,659(0.21%)#43 | 4,223,726(0.00%)#3,711 |
| 44. | Millington | 53 | 26,659(0.20%)#44 | 4,223,726(0.00%)#3,802 |
| 45. | Sewanee | 50 | 26,659(0.19%)#45 | 4,223,726(0.00%)#3,932 |
| 46. | Greenbrier | 44 | 26,659(0.17%)#46 | 4,223,726(0.00%)#4,141 |
| 47. | Greeneville | 43 | 26,659(0.16%)#47 | 4,223,726(0.00%)#4,164 |
| 48. | Fairfield Glade | 43 | 26,659(0.16%)#48 | 4,223,726(0.00%)#4,175 |
| 49. | Berry Hill | 42 | 26,659(0.16%)#49 | 4,223,726(0.00%)#4,229 |
| 50. | Elizabethton | 39 | 26,659(0.15%)#50 | 4,223,726(0.00%)#4,339 |
| 51. | Portland | 38 | 26,659(0.14%)#51 | 4,223,726(0.00%)#4,374 |
| 52. | Oak Hill | 38 | 26,659(0.14%)#52 | 4,223,726(0.00%)#4,395 |
| 53. | Lexington | 35 | 26,659(0.13%)#53 | 4,223,726(0.00%)#4,540 |
| 54. | La Vergne | 34 | 26,659(0.13%)#54 | 4,223,726(0.00%)#4,570 |
| 55. | Dyersburg | 34 | 26,659(0.13%)#55 | 4,223,726(0.00%)#4,583 |
| 56. | Grimsley | 34 | 26,659(0.13%)#56 | 4,223,726(0.00%)#4,619 |
| 57. | Crossville | 33 | 26,659(0.12%)#57 | 4,223,726(0.00%)#4,638 |
| 58. | Decherd | 31 | 26,659(0.12%)#58 | 4,223,726(0.00%)#4,772 |
| 59. | Lakewood Park | 30 | 26,659(0.11%)#59 | 4,223,726(0.00%)#4,854 |
| 60. | East Ridge | 29 | 26,659(0.11%)#60 | 4,223,726(0.00%)#4,867 |
| 61. | Harrison | 28 | 26,659(0.11%)#61 | 4,223,726(0.00%)#4,958 |
| 62. | Lakeland | 27 | 26,659(0.10%)#62 | 4,223,726(0.00%)#5,013 |
| 63. | Atoka | 27 | 26,659(0.10%)#63 | 4,223,726(0.00%)#5,020 |
| 64. | Coopertown | 24 | 26,659(0.09%)#64 | 4,223,726(0.00%)#5,238 |
| 65. | Dayton | 23 | 26,659(0.09%)#65 | 4,223,726(0.00%)#5,301 |
| 66. | Loudon | 23 | 26,659(0.09%)#66 | 4,223,726(0.00%)#5,305 |
| 67. | Forest Hills | 22 | 26,659(0.08%)#67 | 4,223,726(0.00%)#5,391 |
| 68. | Greenfield | 22 | 26,659(0.08%)#68 | 4,223,726(0.00%)#5,408 |
| 69. | Winchester | 21 | 26,659(0.08%)#69 | 4,223,726(0.00%)#5,445 |
| 70. | Lenoir City | 19 | 26,659(0.07%)#70 | 4,223,726(0.00%)#5,610 |
| 71. | Bristol | 17 | 26,659(0.06%)#71 | 4,223,726(0.00%)#5,781 |
| 72. | Pleasant View | 17 | 26,659(0.06%)#72 | 4,223,726(0.00%)#5,821 |
| 73. | Apison | 17 | 26,659(0.06%)#73 | 4,223,726(0.00%)#5,830 |
| 74. | Livingston | 17 | 26,659(0.06%)#74 | 4,223,726(0.00%)#5,835 |
| 75. | Piperton | 17 | 26,659(0.06%)#75 | 4,223,726(0.00%)#5,858 |
| 76. | Ashland City | 16 | 26,659(0.06%)#76 | 4,223,726(0.00%)#5,939 |
| 77. | Alcoa | 15 | 26,659(0.06%)#77 | 4,223,726(0.00%)#6,027 |
| 78. | New Tazewell | 15 | 26,659(0.06%)#78 | 4,223,726(0.00%)#6,099 |
| 79. | Thompson S Station | 14 | 26,659(0.05%)#79 | 4,223,726(0.00%)#6,178 |
| 80. | Mountain City | 14 | 26,659(0.05%)#80 | 4,223,726(0.00%)#6,228 |
| 81. | Ridgely | 14 | 26,659(0.05%)#81 | 4,223,726(0.00%)#6,238 |
| 82. | Gleason | 14 | 26,659(0.05%)#82 | 4,223,726(0.00%)#6,257 |
| 83. | Clinton | 13 | 26,659(0.05%)#83 | 4,223,726(0.00%)#6,296 |
| 84. | Tusculum | 13 | 26,659(0.05%)#84 | 4,223,726(0.00%)#6,350 |
| 85. | Falling Water | 12 | 26,659(0.05%)#85 | 4,223,726(0.00%)#6,512 |
| 86. | Kimball | 11 | 26,659(0.04%)#86 | 4,223,726(0.00%)#6,659 |
| 87. | Hartsville Trousdale County | 10 | 26,659(0.04%)#87 | 4,223,726(0.00%)#6,709 |
| 88. | Pulaski | 10 | 26,659(0.04%)#88 | 4,223,726(0.00%)#6,724 |
| 89. | Milan | 10 | 26,659(0.04%)#89 | 4,223,726(0.00%)#6,725 |
| 90. | Newport | 10 | 26,659(0.04%)#90 | 4,223,726(0.00%)#6,733 |
| 91. | Bolivar | 10 | 26,659(0.04%)#91 | 4,223,726(0.00%)#6,751 |
| 92. | Louisville | 10 | 26,659(0.04%)#92 | 4,223,726(0.00%)#6,753 |
| 93. | Tiptonville | 10 | 26,659(0.04%)#93 | 4,223,726(0.00%)#6,766 |
| 94. | Powell | 9 | 26,659(0.03%)#94 | 4,223,726(0.00%)#6,875 |
| 95. | Mcminnville | 9 | 26,659(0.03%)#95 | 4,223,726(0.00%)#6,876 |
| 96. | Signal Mountain | 9 | 26,659(0.03%)#96 | 4,223,726(0.00%)#6,893 |
| 97. | Surgoinsville | 9 | 26,659(0.03%)#97 | 4,223,726(0.00%)#6,959 |
| 98. | Tazewell | 9 | 26,659(0.03%)#98 | 4,223,726(0.00%)#6,964 |
| 99. | Union City | 8 | 26,659(0.03%)#99 | 4,223,726(0.00%)#7,065 |
| 100. | Millersville | 8 | 26,659(0.03%)#100 | 4,223,726(0.00%)#7,086 |
Common Questions
What are the Top 10 Cities with the Most Immigrants from Eastern Asia in Tennessee?
Top 10 Cities with the Most Immigrants from Eastern Asia in Tennessee are:
#1
5,085
#2
2,037
#3
1,529
#4
1,246
#5
855
#6
833
#7
811
#8
768
#9
678
#10
633
What city has the Most Immigrants from Eastern Asia in Tennessee?
Nashville has the Most Immigrants from Eastern Asia in Tennessee with 5,085.
What is the Total Immigrants from Eastern Asia in the State of Tennessee?
Total Immigrants from Eastern Asia in Tennessee is 26,659.
What is the Total Immigrants from Eastern Asia in the United States?
Total Immigrants from Eastern Asia in the United States is 4,223,726.