Algood, TN
Algood Map
Algood Overview
3,944
TOTAL POPULATION
1,706
MALE POPULATION
2,238
FEMALE POPULATION
76.23
MALES / 100 FEMALES
131.18
FEMALES / 100 MALES
39.7
MEDIAN AGE
2.6
AVG FAMILY SIZE
2.2
AVG HOUSEHOLD SIZE
$21,595
PER CAPITA INCOME
$39,568
AVG FAMILY INCOME
$38,792
AVG HOUSEHOLD INCOME
31.0%
WAGE / INCOME GAP [ % ]
69.0¢/ $1
WAGE / INCOME GAP [ $ ]
0.43
INEQUALITY / GINI INDEX
1,955
LABOR FORCE [ PEOPLE ]
64.0%
PERCENT IN LABOR FORCE
0.9%
UNEMPLOYMENT RATE
Algood Area Codes
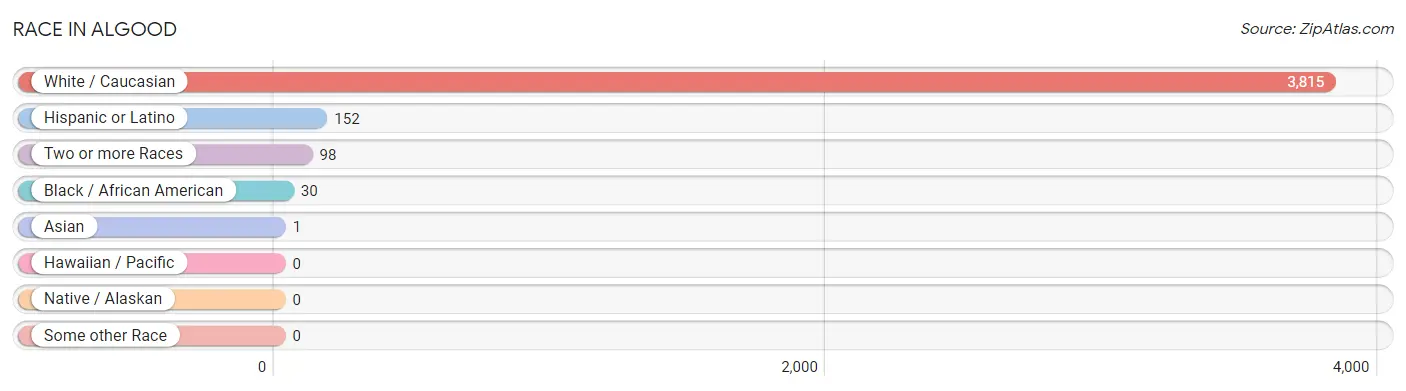
Race in Algood
The most populous races in Algood are White / Caucasian (3,815 | 96.7%), Hispanic or Latino (152 | 3.8%), and Two or more Races (98 | 2.5%).
| Race | # Population | % Population |
| Asian | 1 | 0.0% |
| Black / African American | 30 | 0.8% |
| Hawaiian / Pacific | 0 | 0.0% |
| Hispanic or Latino | 152 | 3.8% |
| Native / Alaskan | 0 | 0.0% |
| White / Caucasian | 3,815 | 96.7% |
| Two or more Races | 98 | 2.5% |
| Some other Race | 0 | 0.0% |
| Total | 3,944 | 100.0% |
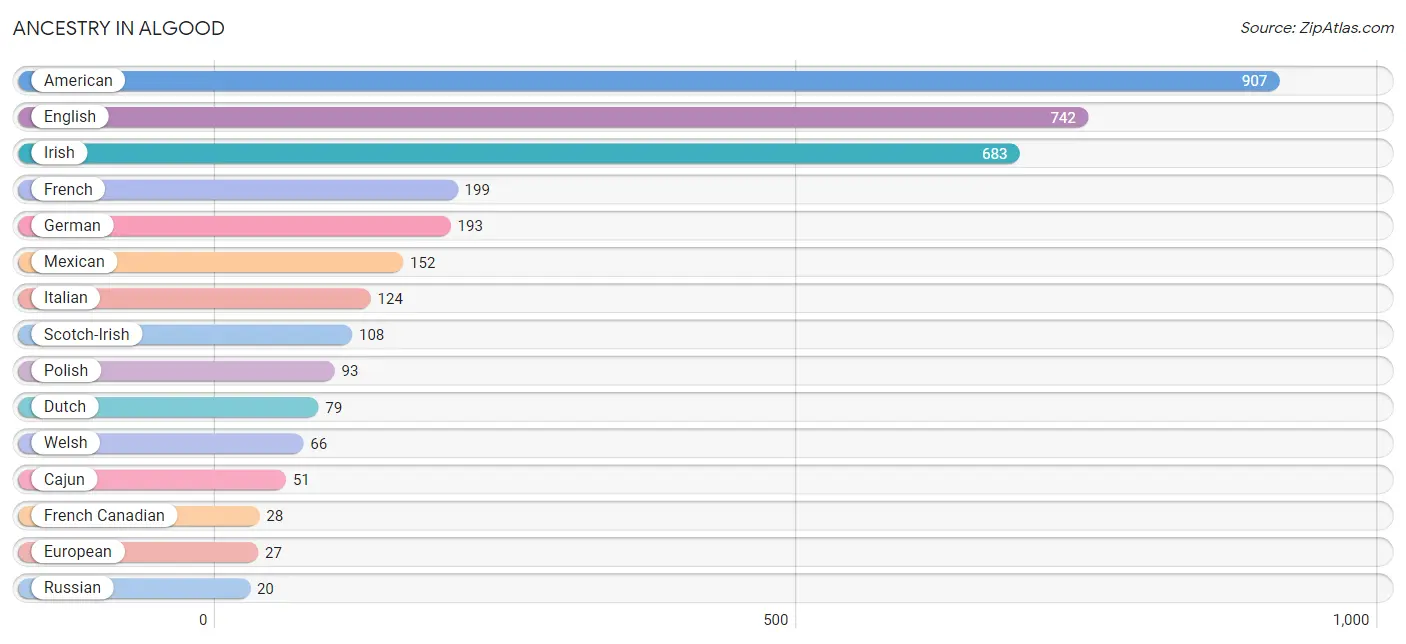
Ancestry in Algood
The most populous ancestries reported in Algood are American (907 | 23.0%), English (742 | 18.8%), Irish (683 | 17.3%), French (199 | 5.1%), and German (193 | 4.9%), together accounting for 69.1% of all Algood residents.
| Ancestry | # Population | % Population |
| American | 907 | 23.0% |
| Burmese | 1 | 0.0% |
| Cajun | 51 | 1.3% |
| Dutch | 79 | 2.0% |
| English | 742 | 18.8% |
| European | 27 | 0.7% |
| French | 199 | 5.1% |
| French Canadian | 28 | 0.7% |
| German | 193 | 4.9% |
| Irish | 683 | 17.3% |
| Italian | 124 | 3.1% |
| Mexican | 152 | 3.8% |
| Polish | 93 | 2.4% |
| Russian | 20 | 0.5% |
| Scotch-Irish | 108 | 2.7% |
| Welsh | 66 | 1.7% | View All 16 Rows |
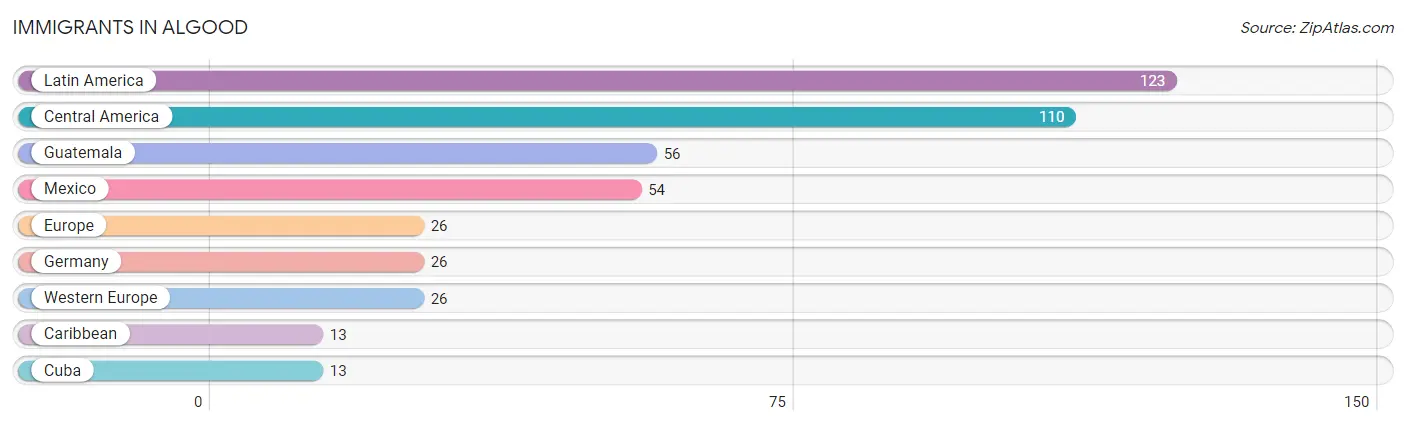
Immigrants in Algood
The most numerous immigrant groups reported in Algood came from Latin America (123 | 3.1%), Central America (110 | 2.8%), Guatemala (56 | 1.4%), Mexico (54 | 1.4%), and Europe (26 | 0.7%), together accounting for 9.4% of all Algood residents.
| Immigration Origin | # Population | % Population |
| Caribbean | 13 | 0.3% |
| Central America | 110 | 2.8% |
| Cuba | 13 | 0.3% |
| Europe | 26 | 0.7% |
| Germany | 26 | 0.7% |
| Guatemala | 56 | 1.4% |
| Latin America | 123 | 3.1% |
| Mexico | 54 | 1.4% |
| Western Europe | 26 | 0.7% | View All 9 Rows |
Sex and Age in Algood
Sex and Age in Algood
The most populous age groups in Algood are 10 to 14 Years (295 | 17.3%) for men and 5 to 9 Years (269 | 12.0%) for women.

| Age Bracket | Male | Female |
| Under 5 Years | 33 (1.9%) | 37 (1.7%) |
| 5 to 9 Years | 0 (0.0%) | 269 (12.0%) |
| 10 to 14 Years | 295 (17.3%) | 191 (8.5%) |
| 15 to 19 Years | 137 (8.0%) | 130 (5.8%) |
| 20 to 24 Years | 195 (11.4%) | 61 (2.7%) |
| 25 to 29 Years | 77 (4.5%) | 28 (1.3%) |
| 30 to 34 Years | 239 (14.0%) | 100 (4.5%) |
| 35 to 39 Years | 29 (1.7%) | 192 (8.6%) |
| 40 to 44 Years | 0 (0.0%) | 172 (7.7%) |
| 45 to 49 Years | 146 (8.6%) | 166 (7.4%) |
| 50 to 54 Years | 12 (0.7%) | 145 (6.5%) |
| 55 to 59 Years | 109 (6.4%) | 91 (4.1%) |
| 60 to 64 Years | 108 (6.3%) | 249 (11.1%) |
| 65 to 69 Years | 139 (8.2%) | 48 (2.1%) |
| 70 to 74 Years | 78 (4.6%) | 125 (5.6%) |
| 75 to 79 Years | 28 (1.6%) | 51 (2.3%) |
| 80 to 84 Years | 20 (1.2%) | 122 (5.4%) |
| 85 Years and over | 61 (3.6%) | 61 (2.7%) |
| Total | 1,706 (100.0%) | 2,238 (100.0%) |
Families and Households in Algood
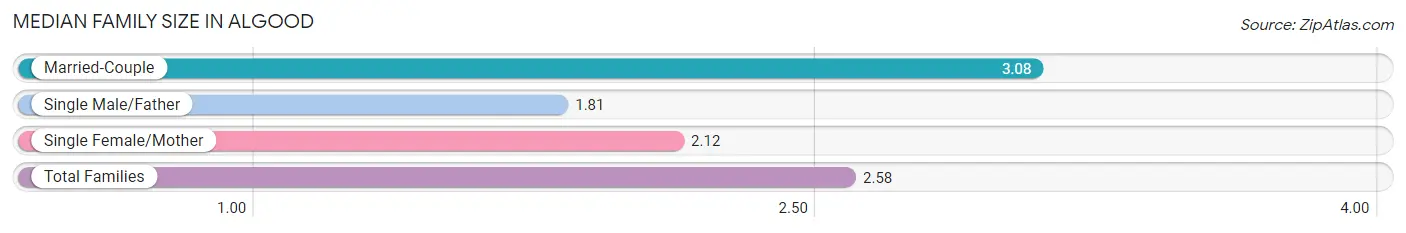
Median Family Size in Algood
The median family size in Algood is 2.58 persons per family, with married-couple families (589 | 49.8%) accounting for the largest median family size of 3.08 persons per family. On the other hand, single male/father families (75 | 6.4%) represent the smallest median family size with 1.81 persons per family.
| Family Type | # Families | Family Size |
| Married-Couple | 589 (49.8%) | 3.08 |
| Single Male/Father | 75 (6.4%) | 1.81 |
| Single Female/Mother | 518 (43.8%) | 2.12 |
| Total Families | 1,182 (100.0%) | 2.58 |
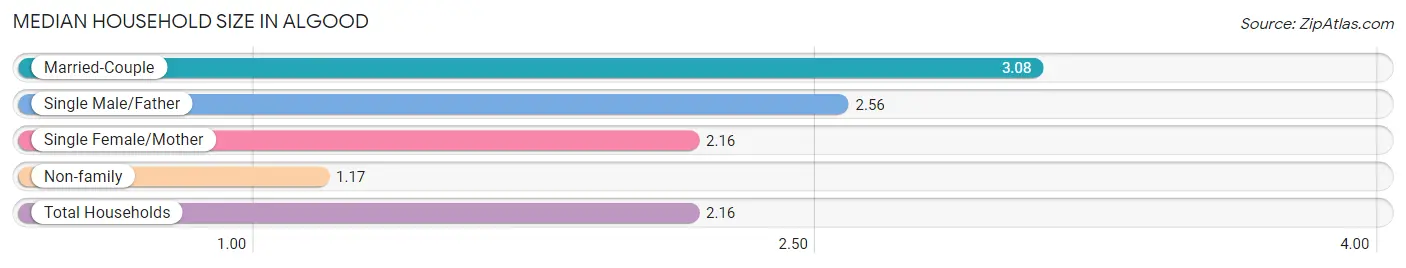
Median Household Size in Algood
The median household size in Algood is 2.16 persons per household, with married-couple households (589 | 33.6%) accounting for the largest median household size of 3.08 persons per household. non-family households (570 | 32.5%) represent the smallest median household size with 1.17 persons per household.
| Household Type | # Households | Household Size |
| Married-Couple | 589 (33.6%) | 3.08 |
| Single Male/Father | 75 (4.3%) | 2.56 |
| Single Female/Mother | 518 (29.6%) | 2.16 |
| Non-family | 570 (32.5%) | 1.17 |
| Total Households | 1,752 (100.0%) | 2.16 |
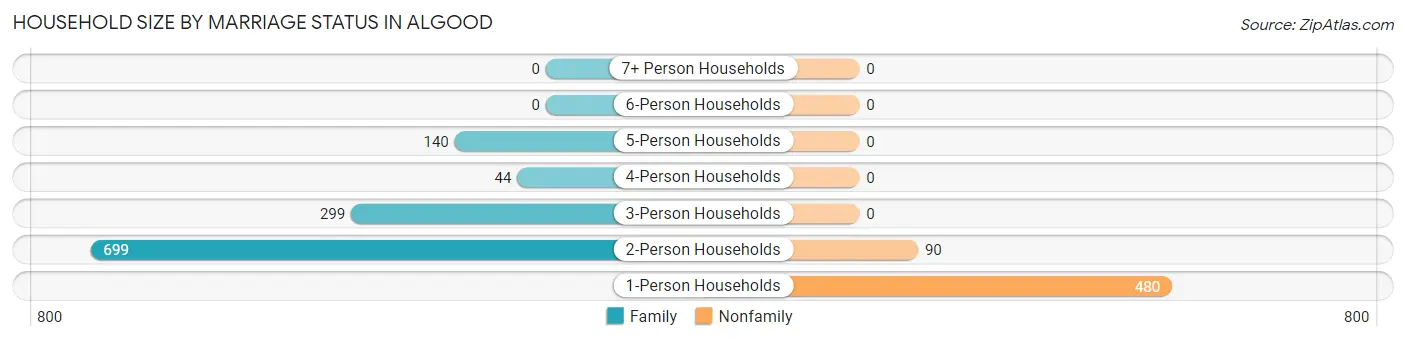
Household Size by Marriage Status in Algood
Out of a total of 1,752 households in Algood, 1,182 (67.5%) are family households, while 570 (32.5%) are nonfamily households. The most numerous type of family households are 2-person households, comprising 699, and the most common type of nonfamily households are 1-person households, comprising 480.
| Household Size | Family Households | Nonfamily Households |
| 1-Person Households | - | 480 (27.4%) |
| 2-Person Households | 699 (39.9%) | 90 (5.1%) |
| 3-Person Households | 299 (17.1%) | 0 (0.0%) |
| 4-Person Households | 44 (2.5%) | 0 (0.0%) |
| 5-Person Households | 140 (8.0%) | 0 (0.0%) |
| 6-Person Households | 0 (0.0%) | 0 (0.0%) |
| 7+ Person Households | 0 (0.0%) | 0 (0.0%) |
| Total | 1,182 (67.5%) | 570 (32.5%) |
Female Fertility in Algood
Fertility by Age in Algood
| Age Bracket | Women with Births | Births / 1,000 Women |
| 15 to 19 years | 0 (0.0%) | 0.0 |
| 20 to 34 years | 0 (0.0%) | 0.0 |
| 35 to 50 years | 0 (0.0%) | 0.0 |
| Total | 0 (0.0%) | 0.0 |
Fertility by Age by Marriage Status in Algood
| Age Bracket | Married | Unmarried |
| 15 to 19 years | 0 (0.0%) | 0 (0.0%) |
| 20 to 34 years | 0 (0.0%) | 0 (0.0%) |
| 35 to 50 years | 0 (0.0%) | 0 (0.0%) |
| Total | 0 (0.0%) | 0 (0.0%) |
Fertility by Education in Algood
| Educational Attainment | Women with Births | Births / 1,000 Women |
| Less than High School | 0 (0.0%) | 0.0 |
| High School Diploma | 0 (0.0%) | 0.0 |
| College or Associate's Degree | 0 (0.0%) | 0.0 |
| Bachelor's Degree | 0 (0.0%) | 0.0 |
| Graduate Degree | 0 (0.0%) | 0.0 |
| Total | 0 (0.0%) | 0.0 |
Fertility by Education by Marriage Status in Algood
| Educational Attainment | Married | Unmarried |
| Less than High School | 0 (0.0%) | 0 (0.0%) |
| High School Diploma | 0 (0.0%) | 0 (0.0%) |
| College or Associate's Degree | 0 (0.0%) | 0 (0.0%) |
| Bachelor's Degree | 0 (0.0%) | 0 (0.0%) |
| Graduate Degree | 0 (0.0%) | 0 (0.0%) |
| Total | 0 (0.0%) | 0 (0.0%) |
Income in Algood
Income Overview in Algood
Per Capita Income in Algood is $21,595, while median incomes of families and households are $39,568 and $38,792 respectively.
| Characteristic | Number | Measure |
| Per Capita Income | 3,944 | $21,595 |
| Median Family Income | 1,182 | $39,568 |
| Mean Family Income | 1,182 | $53,907 |
| Median Household Income | 1,752 | $38,792 |
| Mean Household Income | 1,752 | $45,598 |
| Income Deficit | 1,182 | $0 |
| Wage / Income Gap (%) | 3,944 | 31.03% |
| Wage / Income Gap ($) | 3,944 | 68.97¢ per $1 |
| Gini / Inequality Index | 3,944 | 0.43 |
Earnings by Sex in Algood
Average Earnings in Algood are $31,946, $38,662 for men and $26,664 for women, a difference of 31.0%.
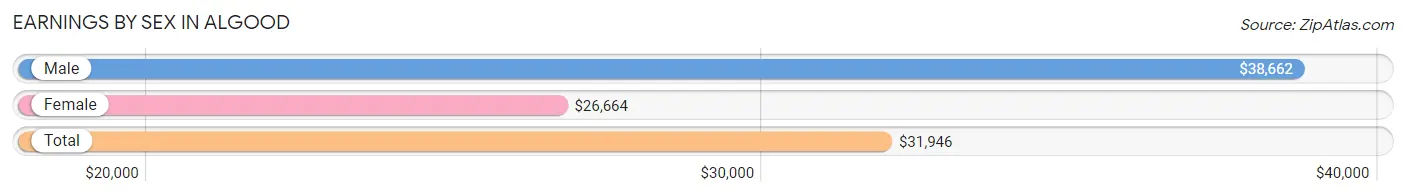
| Sex | Number | Average Earnings |
| Male | 910 (45.6%) | $38,662 |
| Female | 1,087 (54.4%) | $26,664 |
| Total | 1,997 (100.0%) | $31,946 |
Earnings by Sex by Income Bracket in Algood
The most common earnings brackets in Algood are $35,000 to $39,999 for men (170 | 18.7%) and $5,000 to $7,499 for women (197 | 18.1%).
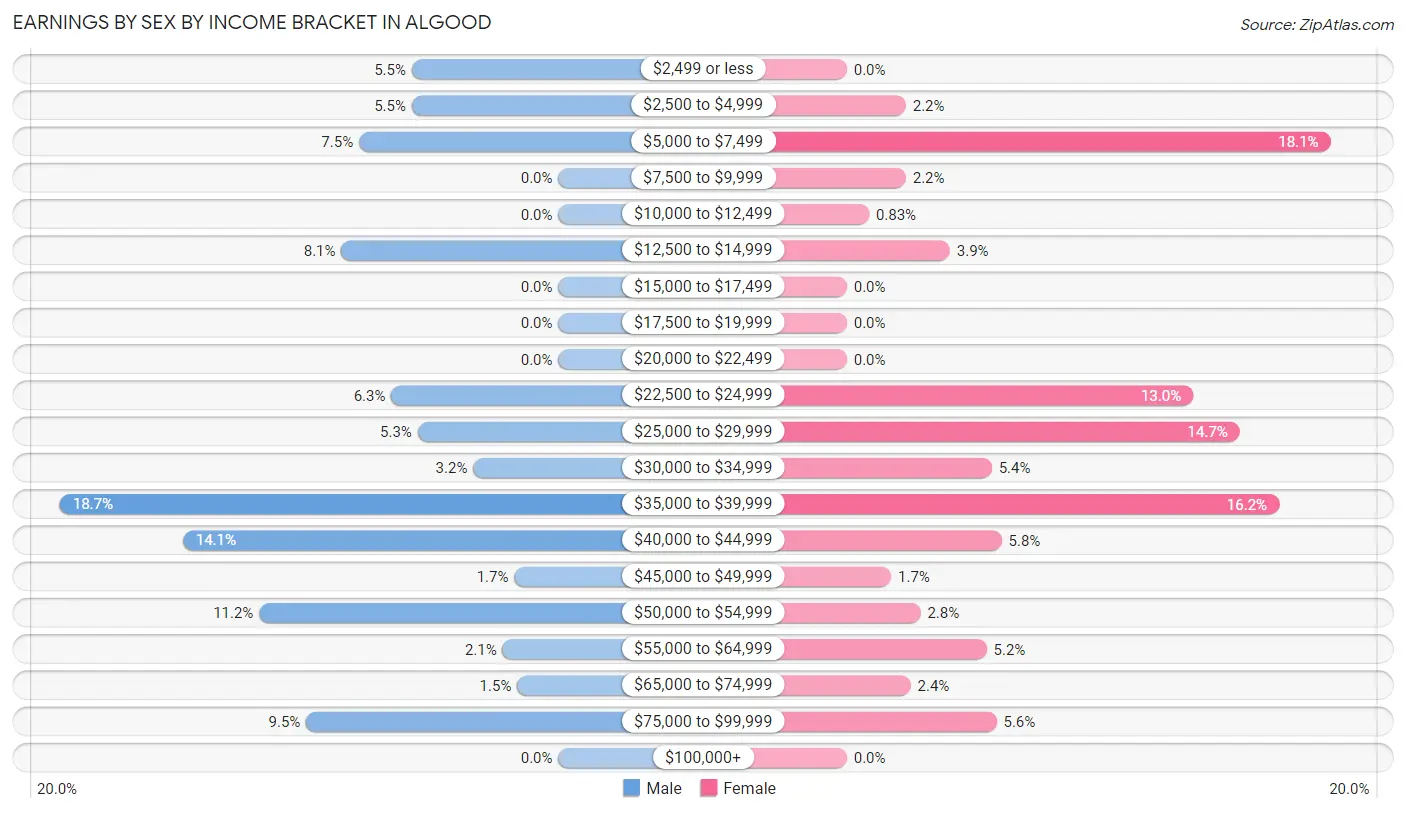
| Income | Male | Female |
| $2,499 or less | 50 (5.5%) | 0 (0.0%) |
| $2,500 to $4,999 | 50 (5.5%) | 24 (2.2%) |
| $5,000 to $7,499 | 68 (7.5%) | 197 (18.1%) |
| $7,500 to $9,999 | 0 (0.0%) | 24 (2.2%) |
| $10,000 to $12,499 | 0 (0.0%) | 9 (0.8%) |
| $12,500 to $14,999 | 74 (8.1%) | 42 (3.9%) |
| $15,000 to $17,499 | 0 (0.0%) | 0 (0.0%) |
| $17,500 to $19,999 | 0 (0.0%) | 0 (0.0%) |
| $20,000 to $22,499 | 0 (0.0%) | 0 (0.0%) |
| $22,500 to $24,999 | 57 (6.3%) | 141 (13.0%) |
| $25,000 to $29,999 | 48 (5.3%) | 160 (14.7%) |
| $30,000 to $34,999 | 29 (3.2%) | 59 (5.4%) |
| $35,000 to $39,999 | 170 (18.7%) | 176 (16.2%) |
| $40,000 to $44,999 | 128 (14.1%) | 63 (5.8%) |
| $45,000 to $49,999 | 15 (1.7%) | 18 (1.7%) |
| $50,000 to $54,999 | 102 (11.2%) | 30 (2.8%) |
| $55,000 to $64,999 | 19 (2.1%) | 57 (5.2%) |
| $65,000 to $74,999 | 14 (1.5%) | 26 (2.4%) |
| $75,000 to $99,999 | 86 (9.5%) | 61 (5.6%) |
| $100,000+ | 0 (0.0%) | 0 (0.0%) |
| Total | 910 (100.0%) | 1,087 (100.0%) |
Earnings by Sex by Educational Attainment in Algood
Average earnings in Algood are $39,522 for men and $31,402 for women, a difference of 20.5%. Men with an educational attainment of bachelor's degree enjoy the highest average annual earnings of $56,053, while those with college or associate's degree education earn the least with $29,063. Women with an educational attainment of bachelor's degree earn the most with the average annual earnings of $56,371, while those with college or associate's degree education have the smallest earnings of $35,833.
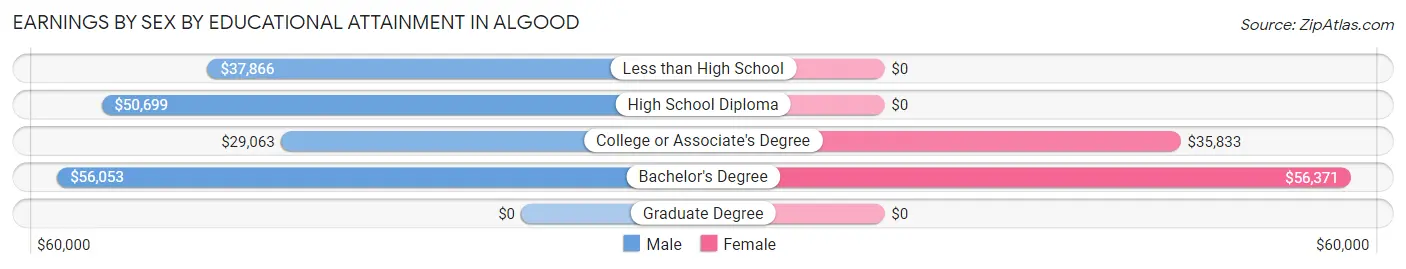
| Educational Attainment | Male Income | Female Income |
| Less than High School | $37,866 | $0 |
| High School Diploma | $50,699 | $0 |
| College or Associate's Degree | $29,063 | $35,833 |
| Bachelor's Degree | $56,053 | $56,371 |
| Graduate Degree | - | - |
| Total | $39,522 | $31,402 |
Family Income in Algood
Family Income Brackets in Algood
According to the Algood family income data, there are 348 families falling into the $35,000 to $49,999 income range, which is the most common income bracket and makes up 29.4% of all families.
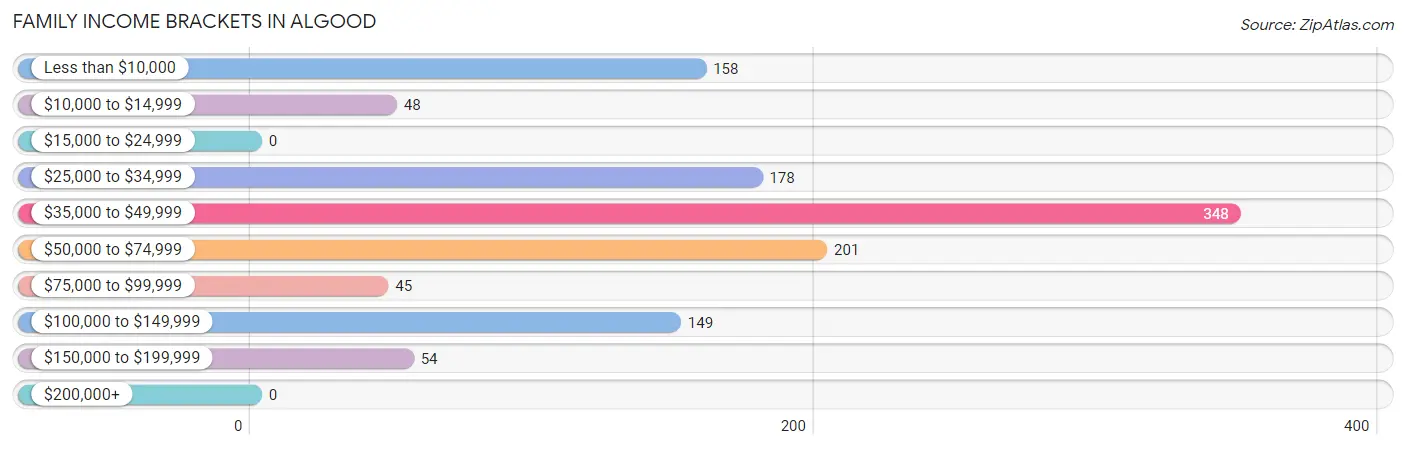
| Income Bracket | # Families | % Families |
| Less than $10,000 | 158 | 13.4% |
| $10,000 to $14,999 | 48 | 4.1% |
| $15,000 to $24,999 | 0 | 0.0% |
| $25,000 to $34,999 | 178 | 15.1% |
| $35,000 to $49,999 | 348 | 29.4% |
| $50,000 to $74,999 | 201 | 17.0% |
| $75,000 to $99,999 | 45 | 3.8% |
| $100,000 to $149,999 | 149 | 12.6% |
| $150,000 to $199,999 | 54 | 4.6% |
| $200,000+ | 0 | 0.0% |
Family Income by Famaliy Size in Algood
2-person families (741 | 62.7%) account for the highest median family income in Algood with $37,993 per family, while 2-person families (741 | 62.7%) have the highest median income of $18,996 per family member.
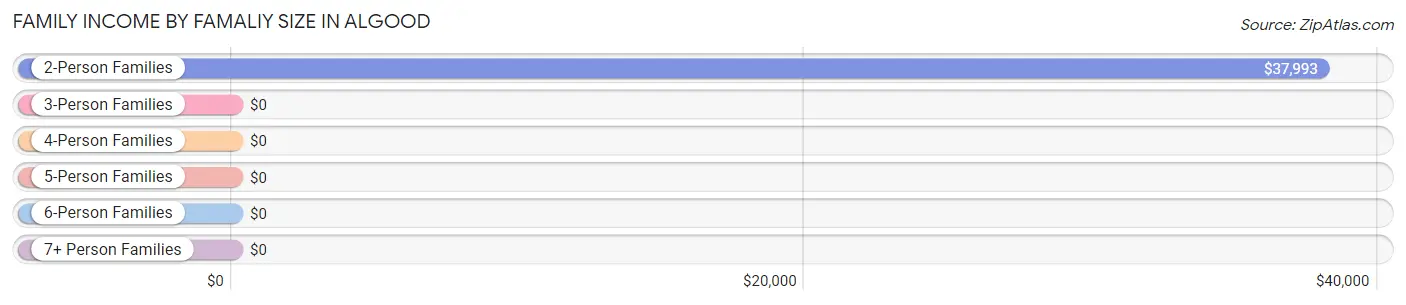
| Income Bracket | # Families | Median Income |
| 2-Person Families | 741 (62.7%) | $37,993 |
| 3-Person Families | 270 (22.8%) | $0 |
| 4-Person Families | 31 (2.6%) | $0 |
| 5-Person Families | 140 (11.8%) | $0 |
| 6-Person Families | 0 (0.0%) | $0 |
| 7+ Person Families | 0 (0.0%) | $0 |
| Total | 1,182 (100.0%) | $39,568 |
Family Income by Number of Earners in Algood
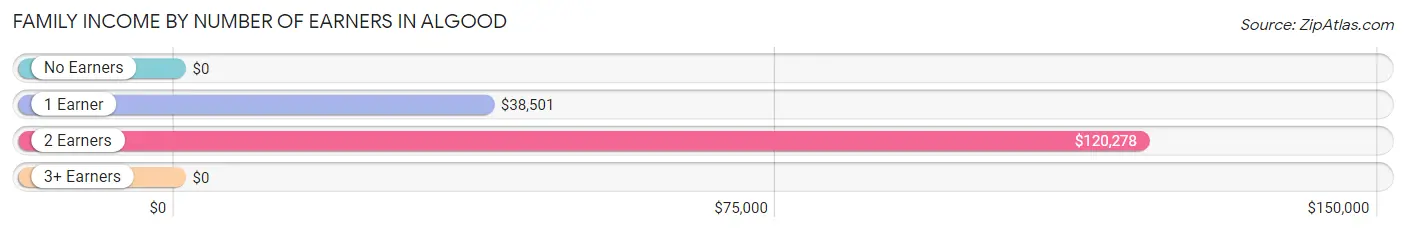
| Number of Earners | # Families | Median Income |
| No Earners | 149 (12.6%) | $0 |
| 1 Earner | 641 (54.2%) | $38,501 |
| 2 Earners | 302 (25.6%) | $120,278 |
| 3+ Earners | 90 (7.6%) | $0 |
| Total | 1,182 (100.0%) | $39,568 |
Household Income in Algood
Household Income Brackets in Algood
With 482 households falling in the category, the $35,000 to $49,999 income range is the most frequent in Algood, accounting for 27.5% of all households.
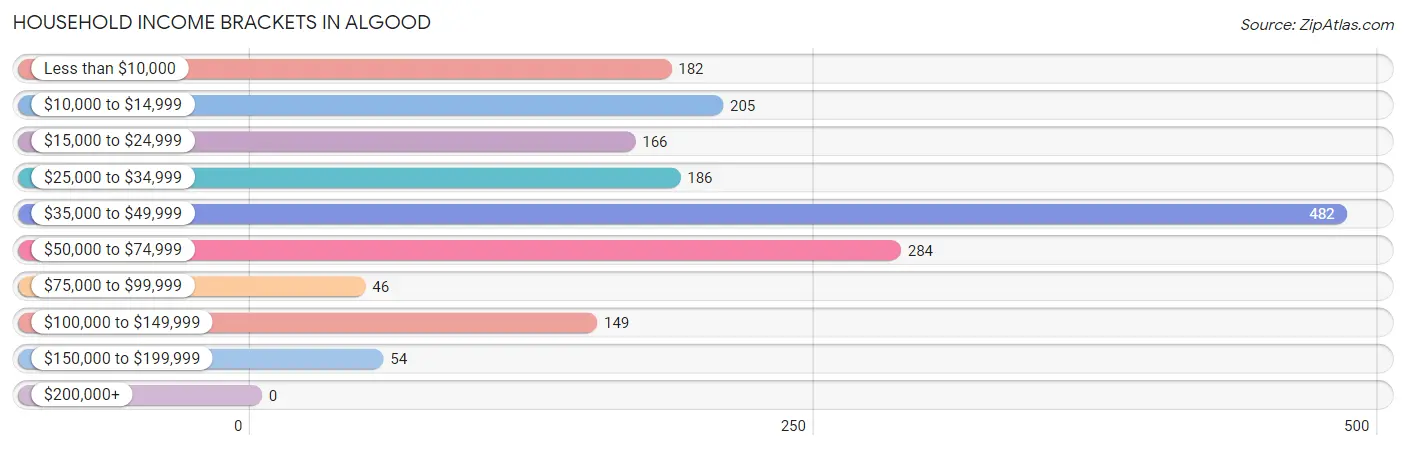
| Income Bracket | # Households | % Households |
| Less than $10,000 | 182 | 10.4% |
| $10,000 to $14,999 | 205 | 11.7% |
| $15,000 to $24,999 | 166 | 9.5% |
| $25,000 to $34,999 | 186 | 10.6% |
| $35,000 to $49,999 | 482 | 27.5% |
| $50,000 to $74,999 | 284 | 16.2% |
| $75,000 to $99,999 | 46 | 2.6% |
| $100,000 to $149,999 | 149 | 8.5% |
| $150,000 to $199,999 | 54 | 3.1% |
| $200,000+ | 0 | 0.0% |
Household Income by Householder Age in Algood
The median household income in Algood is $38,792, with the highest median household income of $40,750 found in the 65+ years age bracket for the primary householder. A total of 474 households (27.1%) fall into this category. Meanwhile, the 15 to 24 years age bracket for the primary householder has the lowest median household income of $0, with 193 households (11.0%) in this group.
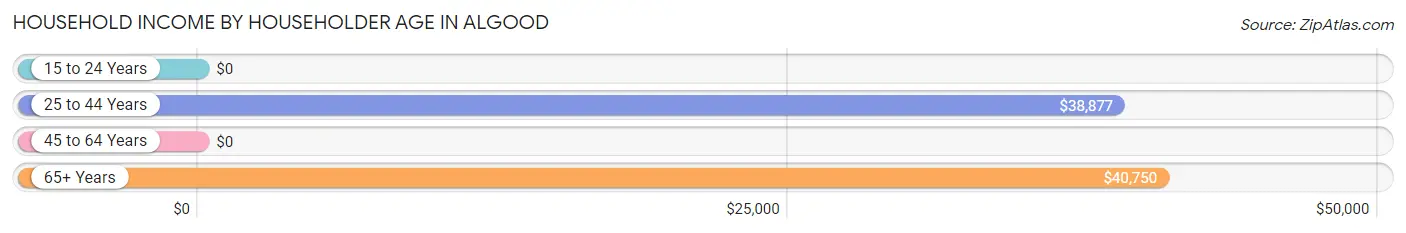
| Income Bracket | # Households | Median Income |
| 15 to 24 Years | 193 (11.0%) | $0 |
| 25 to 44 Years | 564 (32.2%) | $38,877 |
| 45 to 64 Years | 521 (29.7%) | $0 |
| 65+ Years | 474 (27.1%) | $40,750 |
| Total | 1,752 (100.0%) | $38,792 |
Poverty in Algood
Income Below Poverty by Sex and Age in Algood
With 16.0% poverty level for males and 21.5% for females among the residents of Algood, 35 to 44 year old males and under 5 year old females are the most vulnerable to poverty, with 29 males (100.0%) and 37 females (100.0%) in their respective age groups living below the poverty level.
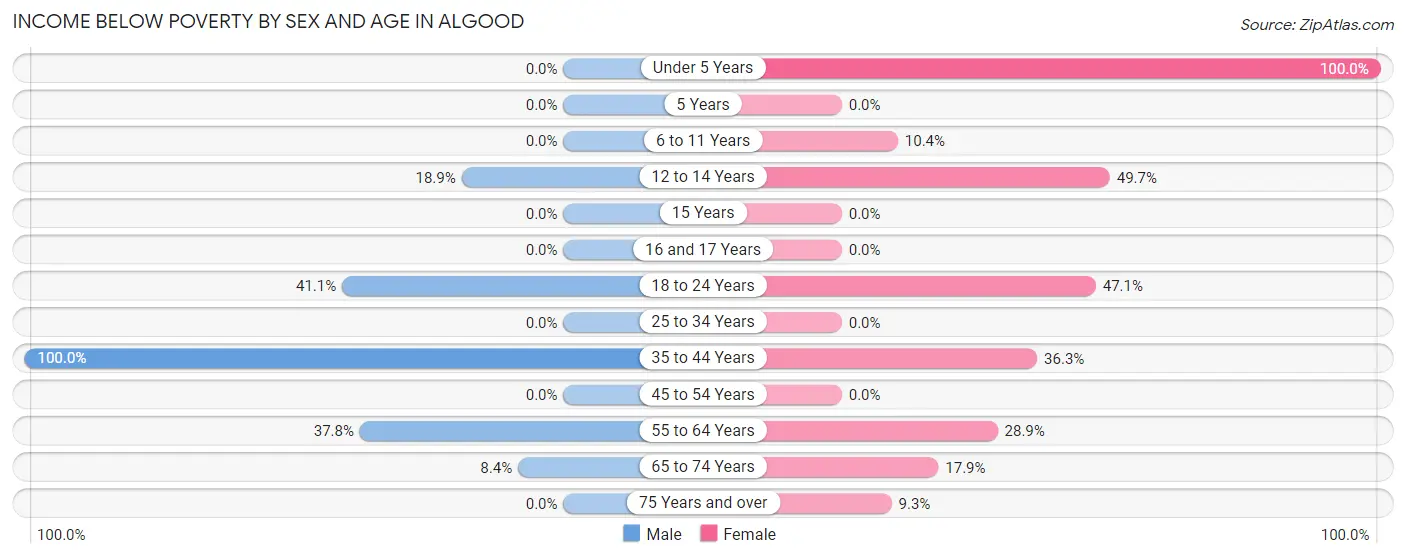
| Age Bracket | Male | Female |
| Under 5 Years | 0 (0.0%) | 37 (100.0%) |
| 5 Years | 0 (0.0%) | 0 (0.0%) |
| 6 to 11 Years | 0 (0.0%) | 28 (10.4%) |
| 12 to 14 Years | 34 (18.9%) | 95 (49.7%) |
| 15 Years | 0 (0.0%) | 0 (0.0%) |
| 16 and 17 Years | 0 (0.0%) | 0 (0.0%) |
| 18 to 24 Years | 99 (41.1%) | 33 (47.1%) |
| 25 to 34 Years | 0 (0.0%) | 0 (0.0%) |
| 35 to 44 Years | 29 (100.0%) | 132 (36.3%) |
| 45 to 54 Years | 0 (0.0%) | 0 (0.0%) |
| 55 to 64 Years | 82 (37.8%) | 94 (28.9%) |
| 65 to 74 Years | 17 (8.4%) | 31 (17.9%) |
| 75 Years and over | 0 (0.0%) | 16 (9.2%) |
| Total | 261 (16.0%) | 466 (21.5%) |
Income Above Poverty by Sex and Age in Algood
According to the poverty statistics in Algood, males aged under 5 years and females aged 16 and 17 years are the age groups that are most secure financially, with 100.0% of males and 100.0% of females in these age groups living above the poverty line.
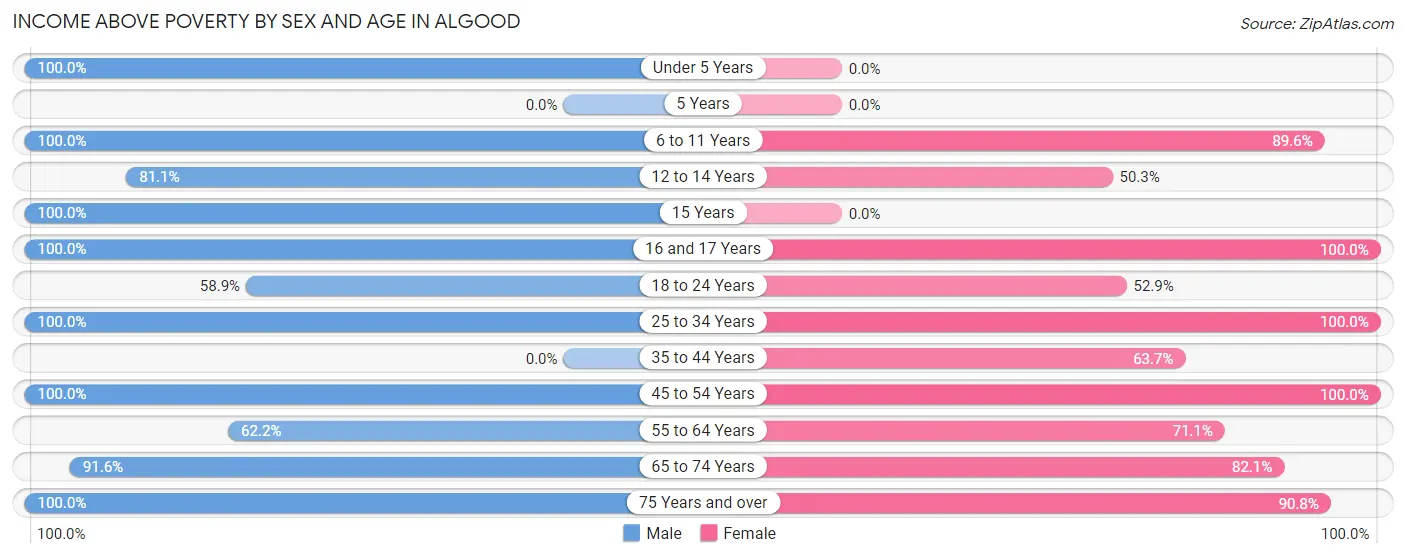
| Age Bracket | Male | Female |
| Under 5 Years | 33 (100.0%) | 0 (0.0%) |
| 5 Years | 0 (0.0%) | 0 (0.0%) |
| 6 to 11 Years | 115 (100.0%) | 241 (89.6%) |
| 12 to 14 Years | 146 (81.1%) | 96 (50.3%) |
| 15 Years | 64 (100.0%) | 0 (0.0%) |
| 16 and 17 Years | 27 (100.0%) | 121 (100.0%) |
| 18 to 24 Years | 142 (58.9%) | 37 (52.9%) |
| 25 to 34 Years | 316 (100.0%) | 128 (100.0%) |
| 35 to 44 Years | 0 (0.0%) | 232 (63.7%) |
| 45 to 54 Years | 158 (100.0%) | 311 (100.0%) |
| 55 to 64 Years | 135 (62.2%) | 231 (71.1%) |
| 65 to 74 Years | 185 (91.6%) | 142 (82.1%) |
| 75 Years and over | 46 (100.0%) | 157 (90.7%) |
| Total | 1,367 (84.0%) | 1,696 (78.4%) |
Income Below Poverty Among Married-Couple Families in Algood
The poverty statistics for married-couple families in Algood show that 3.1% or 18 of the total 589 families live below the poverty line. Families with no children have the highest poverty rate of 5.9%, comprising of 18 families. On the other hand, families with 1 or 2 children have the lowest poverty rate of 0.0%, which includes 0 families.
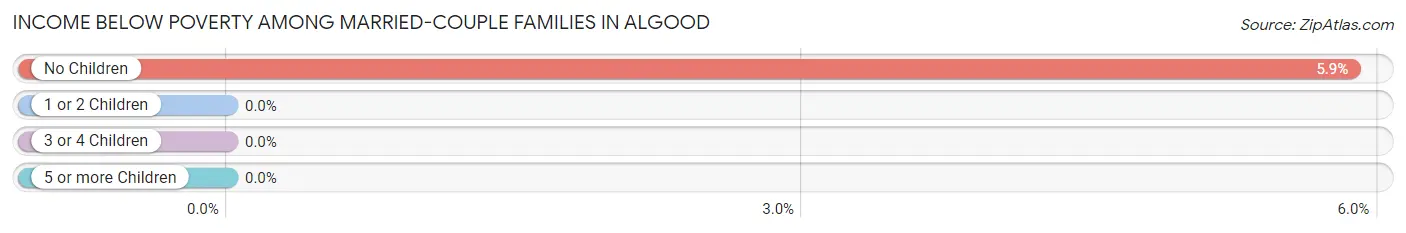
| Children | Above Poverty | Below Poverty |
| No Children | 289 (94.1%) | 18 (5.9%) |
| 1 or 2 Children | 142 (100.0%) | 0 (0.0%) |
| 3 or 4 Children | 140 (100.0%) | 0 (0.0%) |
| 5 or more Children | 0 (0.0%) | 0 (0.0%) |
| Total | 571 (96.9%) | 18 (3.1%) |
Income Below Poverty Among Single-Parent Households in Algood
According to the poverty data in Algood, 34.7% or 26 single-father households and 31.3% or 162 single-mother households are living below the poverty line. Among single-father households, those with 1 or 2 children have the highest poverty rate, with 26 households (100.0%) experiencing poverty. Likewise, among single-mother households, those with 1 or 2 children have the highest poverty rate, with 162 households (38.8%) falling below the poverty line.
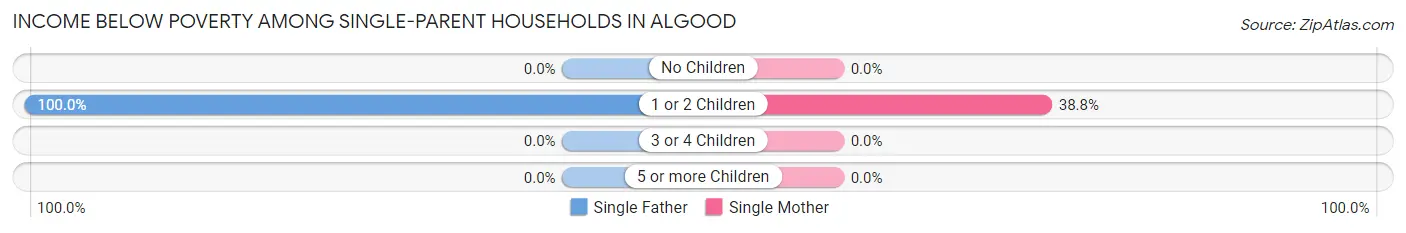
| Children | Single Father | Single Mother |
| No Children | 0 (0.0%) | 0 (0.0%) |
| 1 or 2 Children | 26 (100.0%) | 162 (38.8%) |
| 3 or 4 Children | 0 (0.0%) | 0 (0.0%) |
| 5 or more Children | 0 (0.0%) | 0 (0.0%) |
| Total | 26 (34.7%) | 162 (31.3%) |
Income Below Poverty Among Married-Couple vs Single-Parent Households in Algood
The poverty data for Algood shows that 18 of the married-couple family households (3.1%) and 188 of the single-parent households (31.7%) are living below the poverty level. Within the married-couple family households, those with no children have the highest poverty rate, with 18 households (5.9%) falling below the poverty line. Among the single-parent households, those with 1 or 2 children have the highest poverty rate, with 188 household (42.3%) living below poverty.
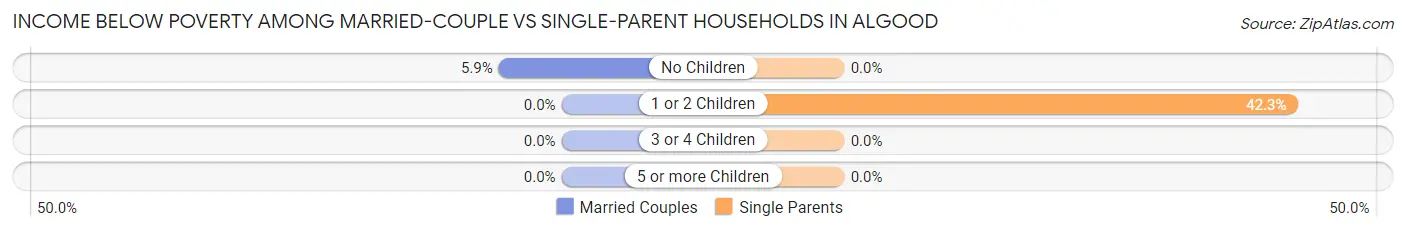
| Children | Married-Couple Families | Single-Parent Households |
| No Children | 18 (5.9%) | 0 (0.0%) |
| 1 or 2 Children | 0 (0.0%) | 188 (42.3%) |
| 3 or 4 Children | 0 (0.0%) | 0 (0.0%) |
| 5 or more Children | 0 (0.0%) | 0 (0.0%) |
| Total | 18 (3.1%) | 188 (31.7%) |
Employment Characteristics in Algood
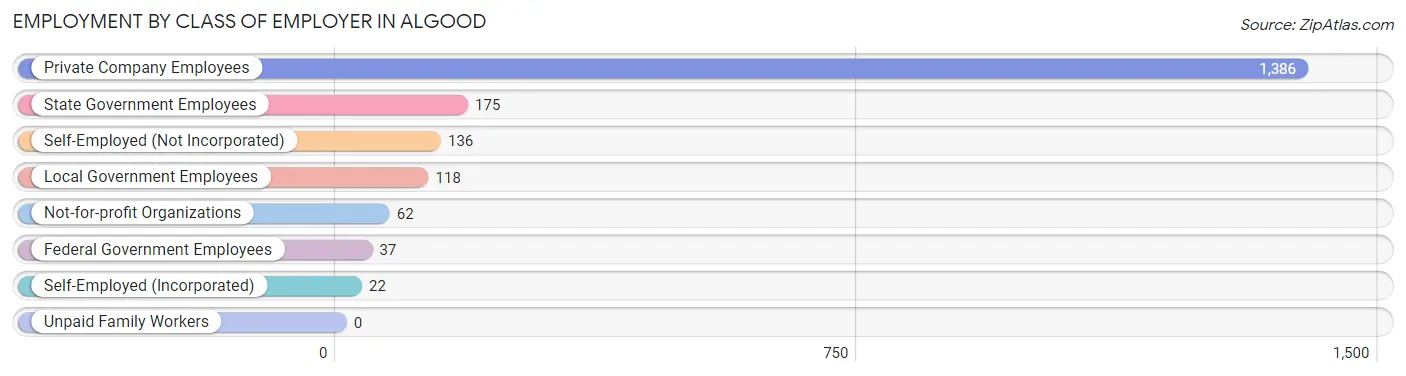
Employment by Class of Employer in Algood
Among the 1,936 employed individuals in Algood, private company employees (1,386 | 71.6%), state government employees (175 | 9.0%), and self-employed (not incorporated) (136 | 7.0%) make up the most common classes of employment.
| Employer Class | # Employees | % Employees |
| Private Company Employees | 1,386 | 71.6% |
| Self-Employed (Incorporated) | 22 | 1.1% |
| Self-Employed (Not Incorporated) | 136 | 7.0% |
| Not-for-profit Organizations | 62 | 3.2% |
| Local Government Employees | 118 | 6.1% |
| State Government Employees | 175 | 9.0% |
| Federal Government Employees | 37 | 1.9% |
| Unpaid Family Workers | 0 | 0.0% |
| Total | 1,936 | 100.0% |
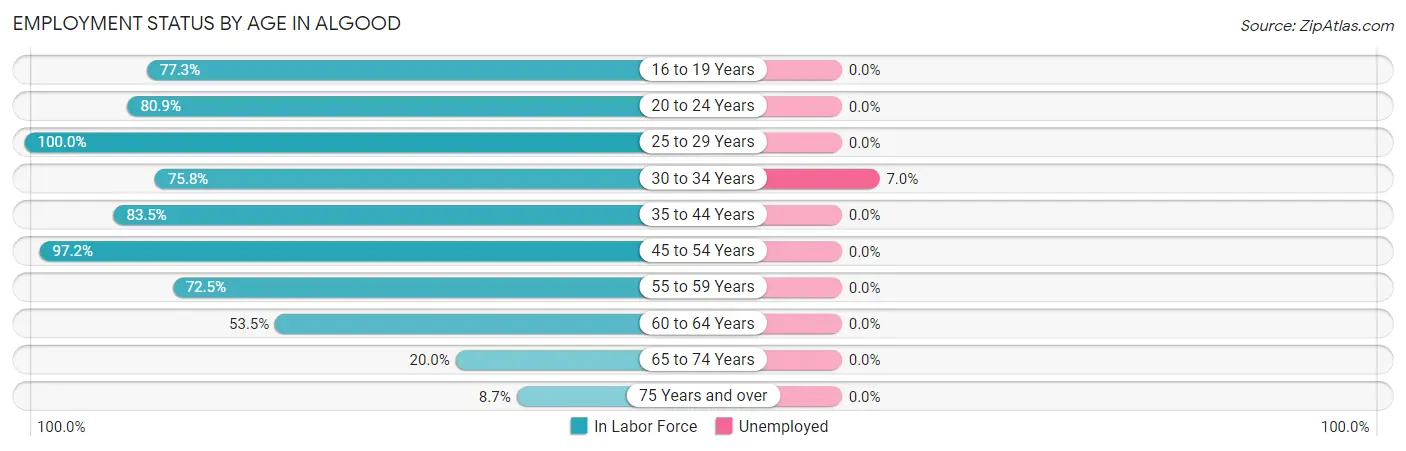
Employment Status by Age in Algood
According to the labor force statistics for Algood, out of the total population over 16 years of age (3,055), 64.0% or 1,955 individuals are in the labor force, with 0.9% or 18 of them unemployed. The age group with the highest labor force participation rate is 25 to 29 years, with 100.0% or 105 individuals in the labor force. Within the labor force, the 30 to 34 years age range has the highest percentage of unemployed individuals, with 7.0% or 18 of them being unemployed.
| Age Bracket | In Labor Force | Unemployed |
| 16 to 19 Years | 157 (77.3%) | 0 (0.0%) |
| 20 to 24 Years | 207 (80.9%) | 0 (0.0%) |
| 25 to 29 Years | 105 (100.0%) | 0 (0.0%) |
| 30 to 34 Years | 257 (75.8%) | 18 (7.0%) |
| 35 to 44 Years | 328 (83.5%) | 0 (0.0%) |
| 45 to 54 Years | 456 (97.2%) | 0 (0.0%) |
| 55 to 59 Years | 145 (72.5%) | 0 (0.0%) |
| 60 to 64 Years | 191 (53.5%) | 0 (0.0%) |
| 65 to 74 Years | 78 (20.0%) | 0 (0.0%) |
| 75 Years and over | 30 (8.7%) | 0 (0.0%) |
| Total | 1,955 (64.0%) | 18 (0.9%) |
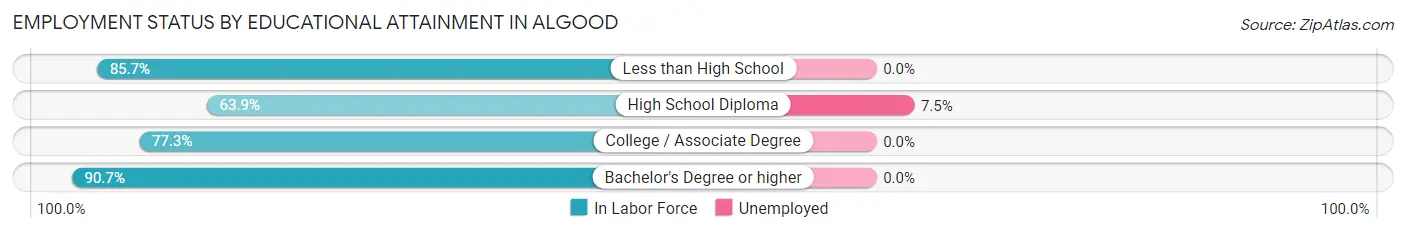
Employment Status by Educational Attainment in Algood
According to labor force statistics for Algood, 79.5% of individuals (1,481) out of the total population between 25 and 64 years of age (1,863) are in the labor force, with 1.2% or 18 of them being unemployed. The group with the highest labor force participation rate are those with the educational attainment of bachelor's degree or higher, with 90.7% or 412 individuals in the labor force. Within the labor force, individuals with high school diploma education have the highest percentage of unemployment, with 7.5% or 18 of them being unemployed.
| Educational Attainment | In Labor Force | Unemployed |
| Less than High School | 312 (85.7%) | 0 (0.0%) |
| High School Diploma | 239 (63.9%) | 28 (7.5%) |
| College / Associate Degree | 519 (77.3%) | 0 (0.0%) |
| Bachelor's Degree or higher | 412 (90.7%) | 0 (0.0%) |
| Total | 1,481 (79.5%) | 22 (1.2%) |
Employment Occupations by Sex in Algood
Management, Business, Science and Arts Occupations
The most common Management, Business, Science and Arts occupations in Algood are Community & Social Service (298 | 15.4%), Education Instruction & Library (218 | 11.3%), Business & Financial (184 | 9.5%), Health Diagnosing & Treating (145 | 7.5%), and Health Technologists (81 | 4.2%).
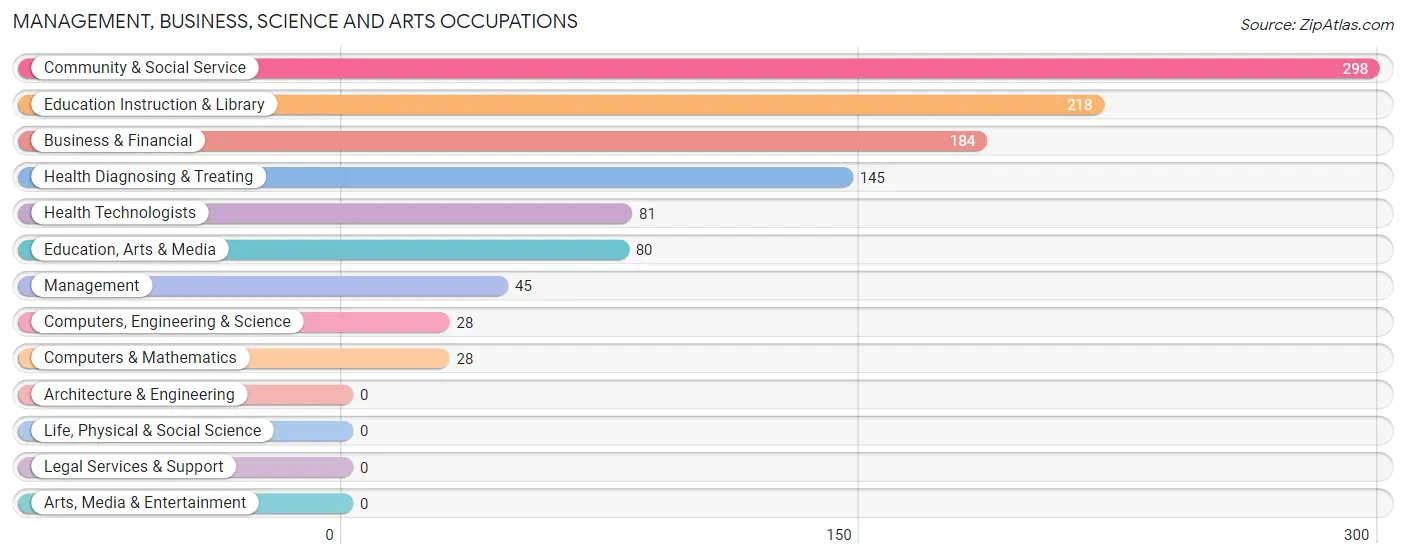
Management, Business, Science and Arts Occupations by Sex
Within the Management, Business, Science and Arts occupations in Algood, the most male-oriented occupations are Computers, Engineering & Science (100.0%), Computers & Mathematics (100.0%), and Education Instruction & Library (50.0%), while the most female-oriented occupations are Health Technologists (100.0%), Health Diagnosing & Treating (79.3%), and Business & Financial (64.1%).
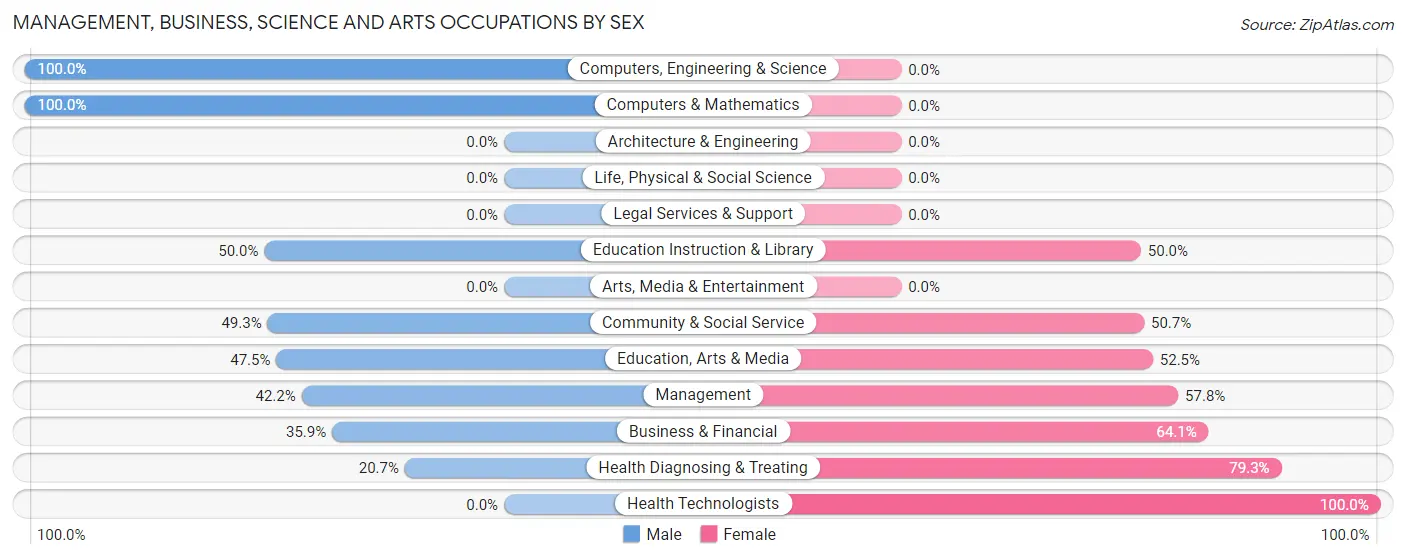
| Occupation | Male | Female |
| Management | 19 (42.2%) | 26 (57.8%) |
| Business & Financial | 66 (35.9%) | 118 (64.1%) |
| Computers, Engineering & Science | 28 (100.0%) | 0 (0.0%) |
| Computers & Mathematics | 28 (100.0%) | 0 (0.0%) |
| Architecture & Engineering | 0 (0.0%) | 0 (0.0%) |
| Life, Physical & Social Science | 0 (0.0%) | 0 (0.0%) |
| Community & Social Service | 147 (49.3%) | 151 (50.7%) |
| Education, Arts & Media | 38 (47.5%) | 42 (52.5%) |
| Legal Services & Support | 0 (0.0%) | 0 (0.0%) |
| Education Instruction & Library | 109 (50.0%) | 109 (50.0%) |
| Arts, Media & Entertainment | 0 (0.0%) | 0 (0.0%) |
| Health Diagnosing & Treating | 30 (20.7%) | 115 (79.3%) |
| Health Technologists | 0 (0.0%) | 81 (100.0%) |
| Total (Category) | 290 (41.4%) | 410 (58.6%) |
| Total (Overall) | 873 (45.1%) | 1,063 (54.9%) |
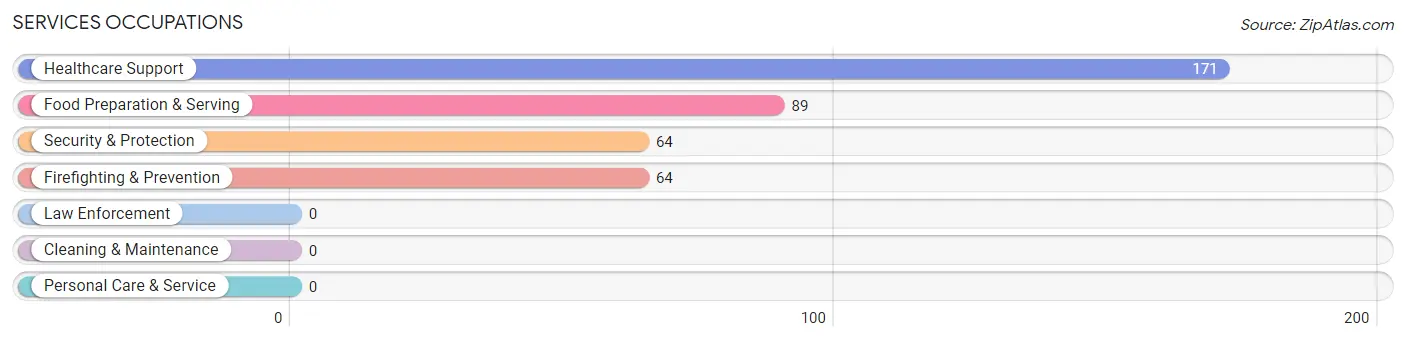
Services Occupations
The most common Services occupations in Algood are Healthcare Support (171 | 8.8%), Food Preparation & Serving (89 | 4.6%), Security & Protection (64 | 3.3%), and Firefighting & Prevention (64 | 3.3%).
Services Occupations by Sex
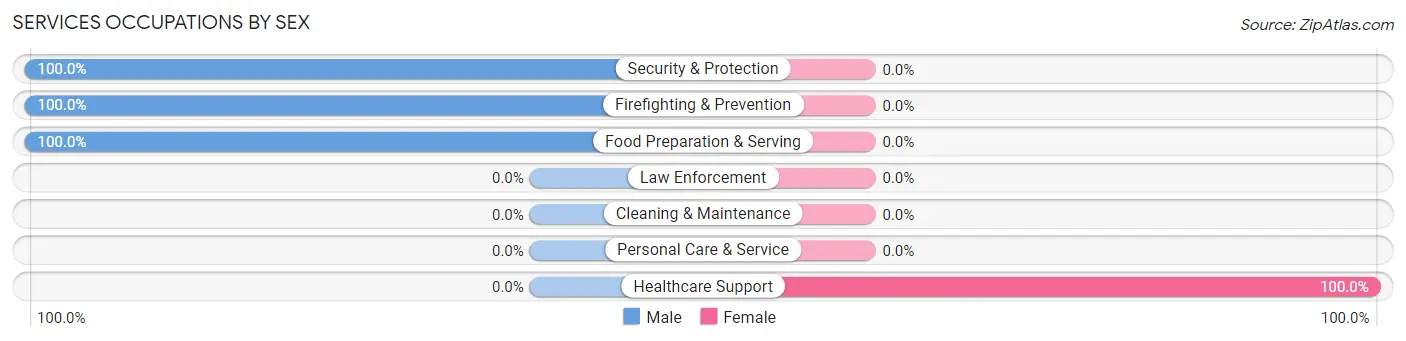
| Occupation | Male | Female |
| Healthcare Support | 0 (0.0%) | 171 (100.0%) |
| Security & Protection | 64 (100.0%) | 0 (0.0%) |
| Firefighting & Prevention | 64 (100.0%) | 0 (0.0%) |
| Law Enforcement | 0 (0.0%) | 0 (0.0%) |
| Food Preparation & Serving | 89 (100.0%) | 0 (0.0%) |
| Cleaning & Maintenance | 0 (0.0%) | 0 (0.0%) |
| Personal Care & Service | 0 (0.0%) | 0 (0.0%) |
| Total (Category) | 153 (47.2%) | 171 (52.8%) |
| Total (Overall) | 873 (45.1%) | 1,063 (54.9%) |
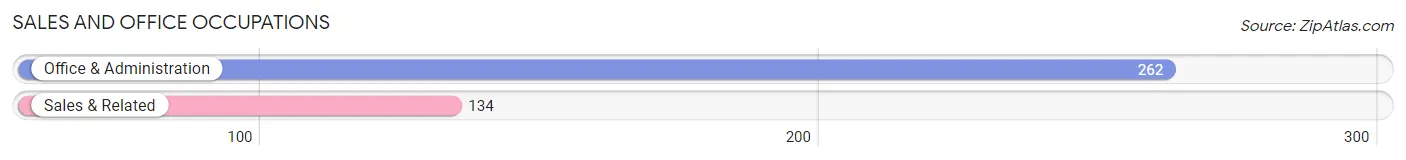
Sales and Office Occupations
The most common Sales and Office occupations in Algood are Office & Administration (262 | 13.5%), and Sales & Related (134 | 6.9%).
Sales and Office Occupations by Sex
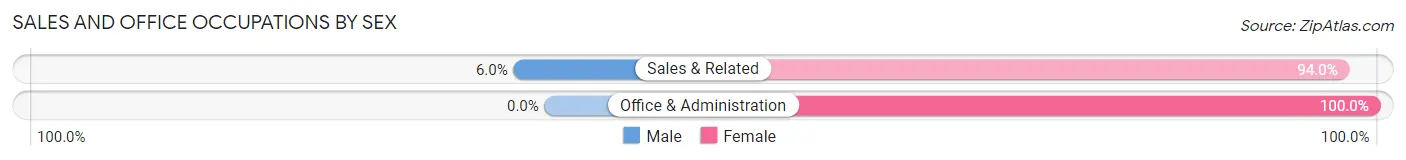
| Occupation | Male | Female |
| Sales & Related | 8 (6.0%) | 126 (94.0%) |
| Office & Administration | 0 (0.0%) | 262 (100.0%) |
| Total (Category) | 8 (2.0%) | 388 (98.0%) |
| Total (Overall) | 873 (45.1%) | 1,063 (54.9%) |
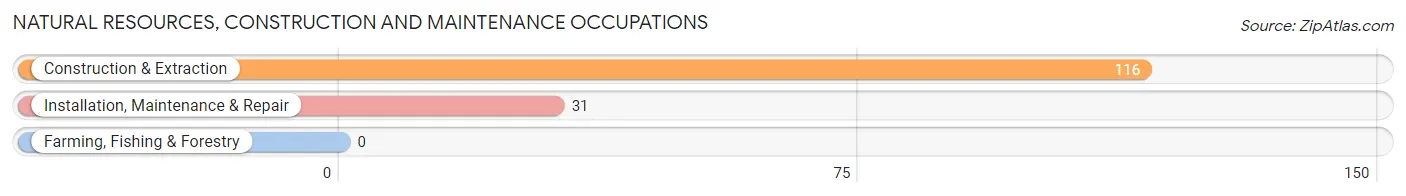
Natural Resources, Construction and Maintenance Occupations
The most common Natural Resources, Construction and Maintenance occupations in Algood are Construction & Extraction (116 | 6.0%), and Installation, Maintenance & Repair (31 | 1.6%).
Natural Resources, Construction and Maintenance Occupations by Sex
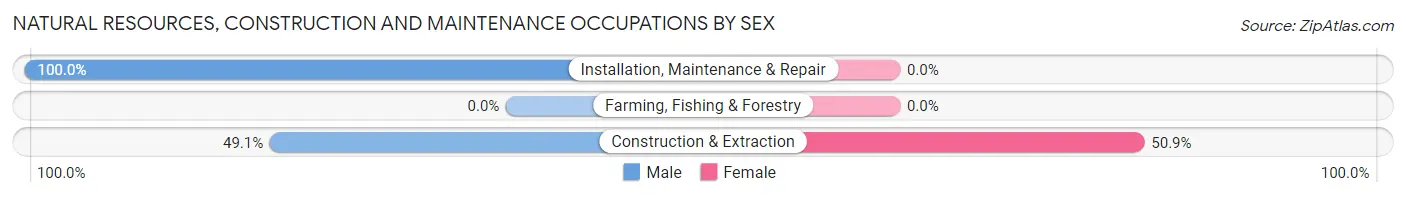
| Occupation | Male | Female |
| Farming, Fishing & Forestry | 0 (0.0%) | 0 (0.0%) |
| Construction & Extraction | 57 (49.1%) | 59 (50.9%) |
| Installation, Maintenance & Repair | 31 (100.0%) | 0 (0.0%) |
| Total (Category) | 88 (59.9%) | 59 (40.1%) |
| Total (Overall) | 873 (45.1%) | 1,063 (54.9%) |
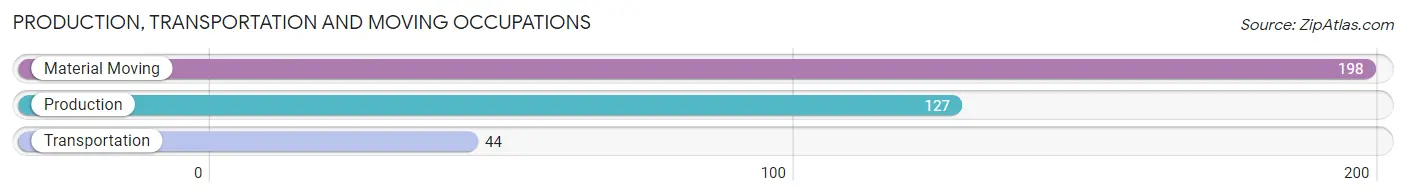
Production, Transportation and Moving Occupations
The most common Production, Transportation and Moving occupations in Algood are Material Moving (198 | 10.2%), Production (127 | 6.6%), and Transportation (44 | 2.3%).
Production, Transportation and Moving Occupations by Sex
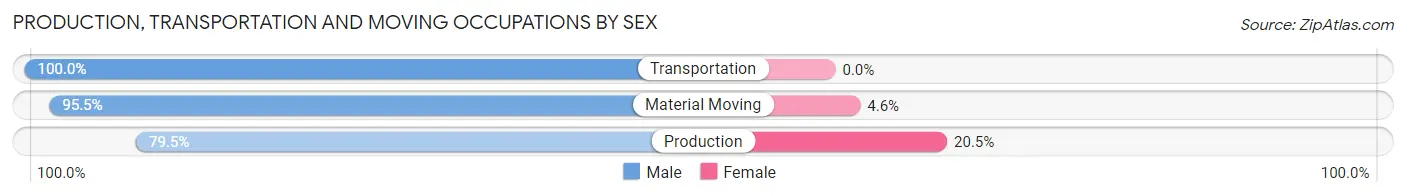
| Occupation | Male | Female |
| Production | 101 (79.5%) | 26 (20.5%) |
| Transportation | 44 (100.0%) | 0 (0.0%) |
| Material Moving | 189 (95.5%) | 9 (4.5%) |
| Total (Category) | 334 (90.5%) | 35 (9.5%) |
| Total (Overall) | 873 (45.1%) | 1,063 (54.9%) |
Employment Industries by Sex in Algood
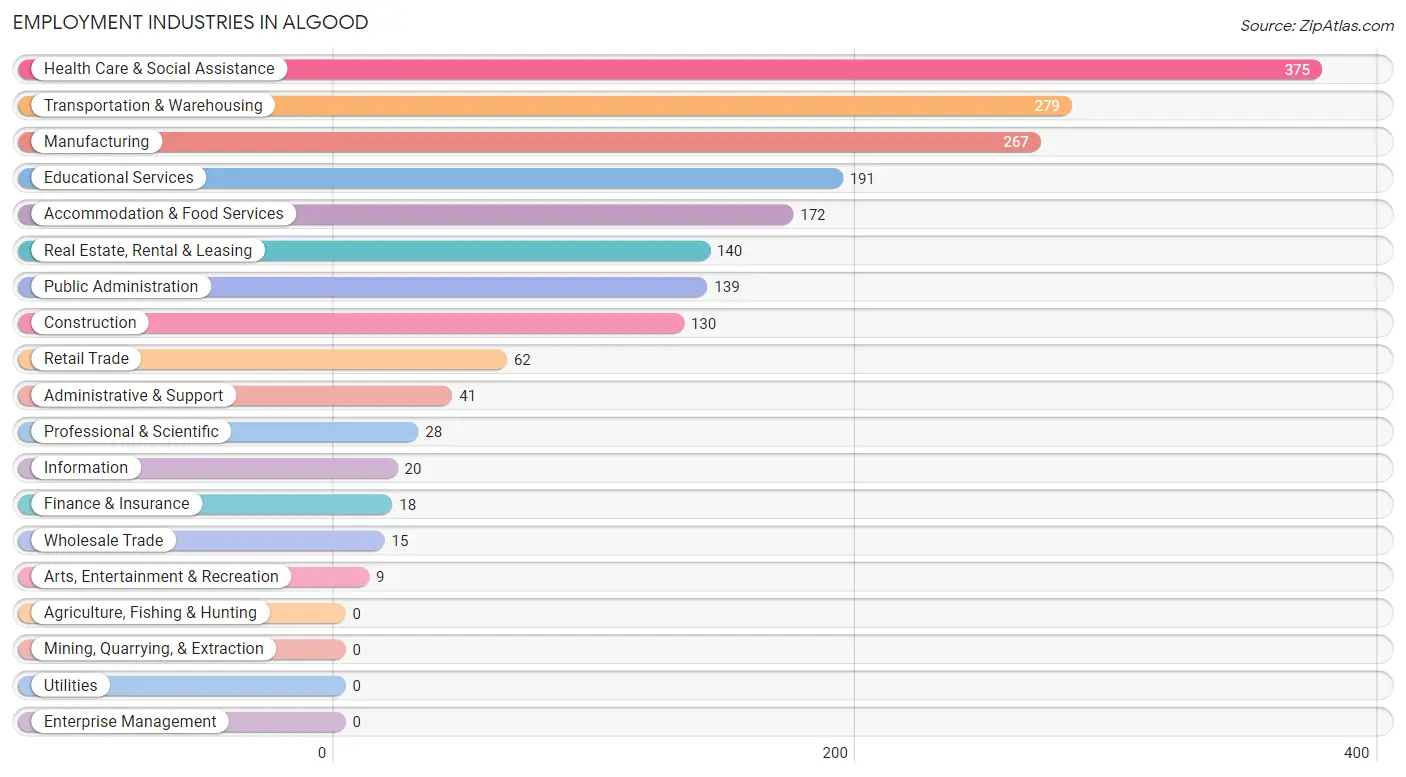
Employment Industries in Algood
The major employment industries in Algood include Health Care & Social Assistance (375 | 19.4%), Transportation & Warehousing (279 | 14.4%), Manufacturing (267 | 13.8%), Educational Services (191 | 9.9%), and Accommodation & Food Services (172 | 8.9%).
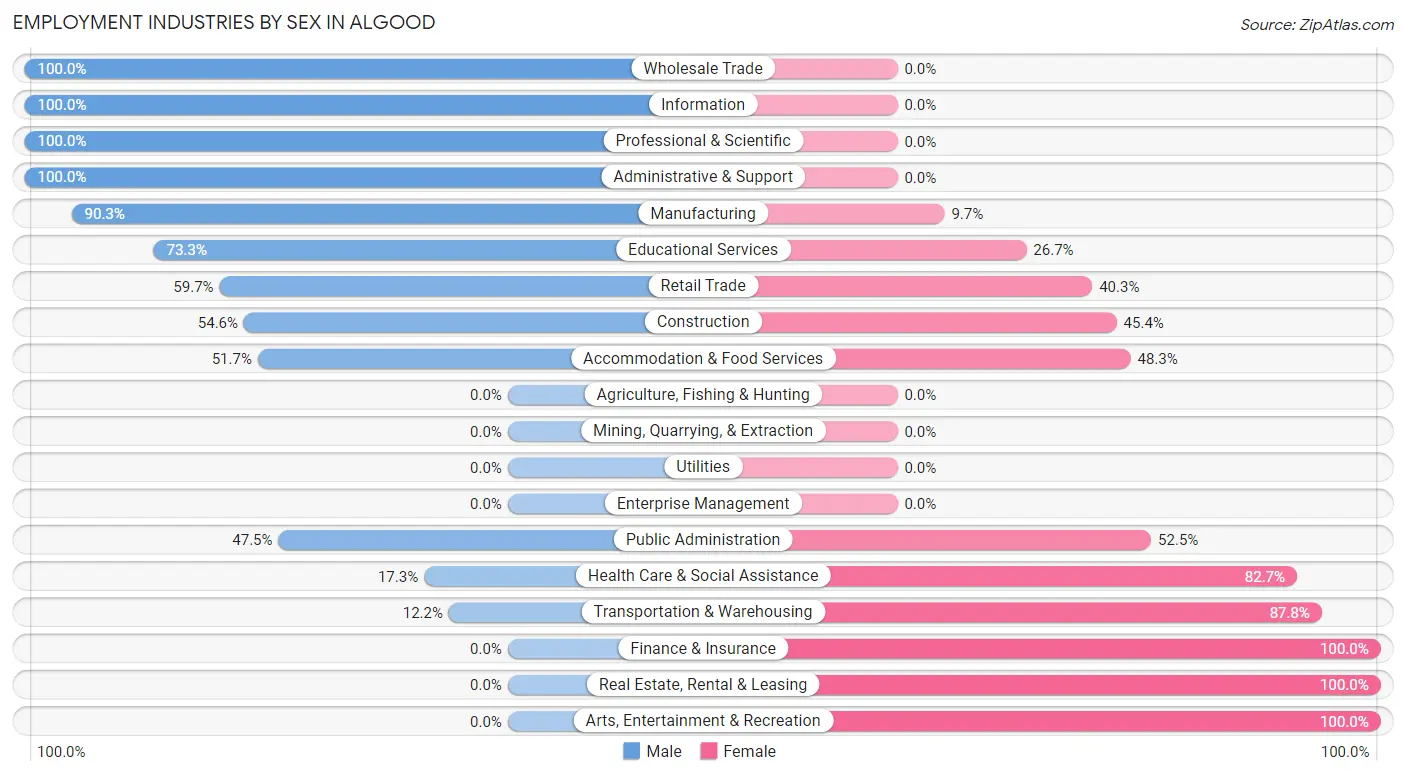
Employment Industries by Sex in Algood
The Algood industries that see more men than women are Wholesale Trade (100.0%), Information (100.0%), and Professional & Scientific (100.0%), whereas the industries that tend to have a higher number of women are Finance & Insurance (100.0%), Real Estate, Rental & Leasing (100.0%), and Arts, Entertainment & Recreation (100.0%).
| Industry | Male | Female |
| Agriculture, Fishing & Hunting | 0 (0.0%) | 0 (0.0%) |
| Mining, Quarrying, & Extraction | 0 (0.0%) | 0 (0.0%) |
| Construction | 71 (54.6%) | 59 (45.4%) |
| Manufacturing | 241 (90.3%) | 26 (9.7%) |
| Wholesale Trade | 15 (100.0%) | 0 (0.0%) |
| Retail Trade | 37 (59.7%) | 25 (40.3%) |
| Transportation & Warehousing | 34 (12.2%) | 245 (87.8%) |
| Utilities | 0 (0.0%) | 0 (0.0%) |
| Information | 20 (100.0%) | 0 (0.0%) |
| Finance & Insurance | 0 (0.0%) | 18 (100.0%) |
| Real Estate, Rental & Leasing | 0 (0.0%) | 140 (100.0%) |
| Professional & Scientific | 28 (100.0%) | 0 (0.0%) |
| Enterprise Management | 0 (0.0%) | 0 (0.0%) |
| Administrative & Support | 41 (100.0%) | 0 (0.0%) |
| Educational Services | 140 (73.3%) | 51 (26.7%) |
| Health Care & Social Assistance | 65 (17.3%) | 310 (82.7%) |
| Arts, Entertainment & Recreation | 0 (0.0%) | 9 (100.0%) |
| Accommodation & Food Services | 89 (51.7%) | 83 (48.3%) |
| Public Administration | 66 (47.5%) | 73 (52.5%) |
| Total | 873 (45.1%) | 1,063 (54.9%) |
Education in Algood
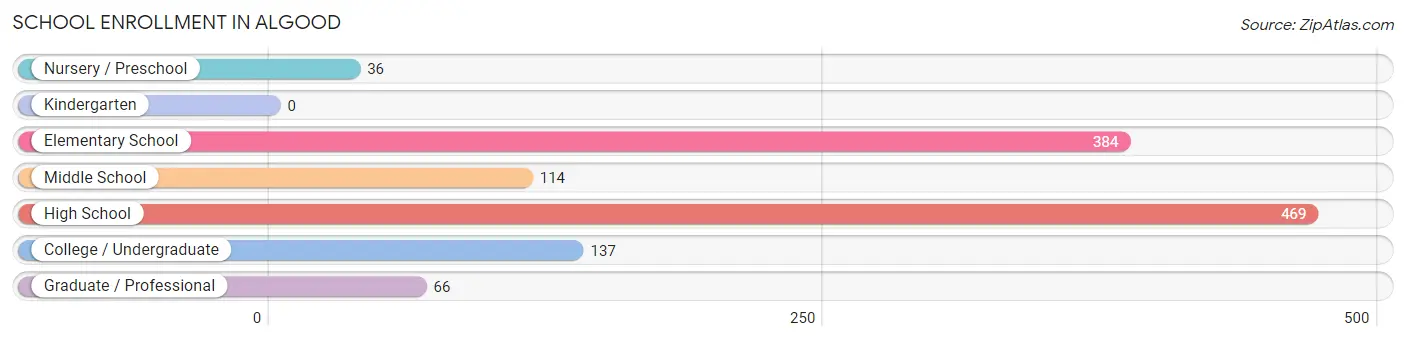
School Enrollment in Algood
The most common levels of schooling among the 1,206 students in Algood are high school (469 | 38.9%), elementary school (384 | 31.8%), and college / undergraduate (137 | 11.4%).
| School Level | # Students | % Students |
| Nursery / Preschool | 36 | 3.0% |
| Kindergarten | 0 | 0.0% |
| Elementary School | 384 | 31.8% |
| Middle School | 114 | 9.5% |
| High School | 469 | 38.9% |
| College / Undergraduate | 137 | 11.4% |
| Graduate / Professional | 66 | 5.5% |
| Total | 1,206 | 100.0% |
School Enrollment by Age by Funding Source in Algood
Out of a total of 1,206 students who are enrolled in schools in Algood, 146 (12.1%) attend a private institution, while the remaining 1,060 (87.9%) are enrolled in public schools. The age group of 5 to 9 year old has the highest likelihood of being enrolled in private schools, with 146 (54.3% in the age bracket) enrolled. Conversely, the age group of 3 to 4 year olds has the lowest likelihood of being enrolled in a private school, with 36 (100.0% in the age bracket) attending a public institution.
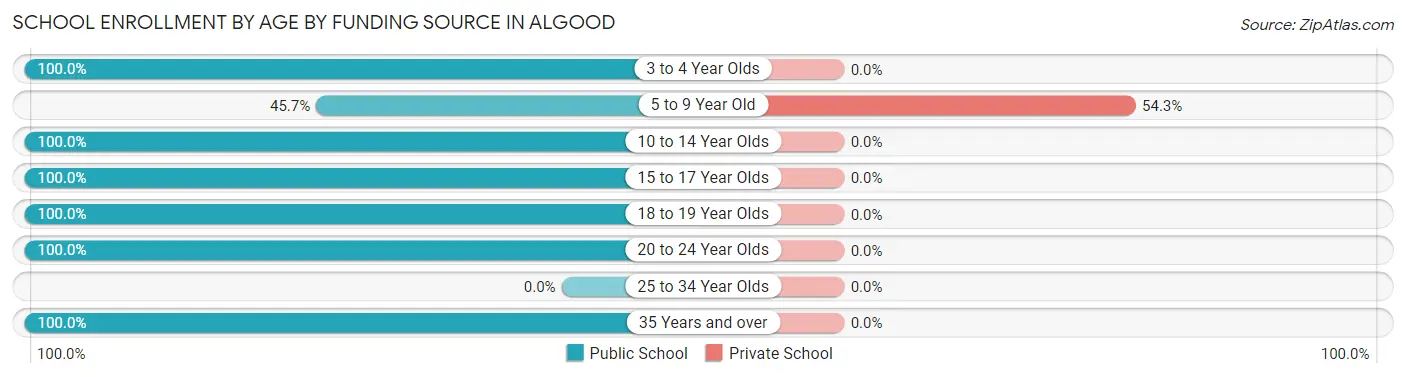
| Age Bracket | Public School | Private School |
| 3 to 4 Year Olds | 36 (100.0%) | 0 (0.0%) |
| 5 to 9 Year Old | 123 (45.7%) | 146 (54.3%) |
| 10 to 14 Year Olds | 486 (100.0%) | 0 (0.0%) |
| 15 to 17 Year Olds | 212 (100.0%) | 0 (0.0%) |
| 18 to 19 Year Olds | 39 (100.0%) | 0 (0.0%) |
| 20 to 24 Year Olds | 139 (100.0%) | 0 (0.0%) |
| 25 to 34 Year Olds | 0 (0.0%) | 0 (0.0%) |
| 35 Years and over | 25 (100.0%) | 0 (0.0%) |
| Total | 1,060 (87.9%) | 146 (12.1%) |
Educational Attainment by Field of Study in Algood
Education (136 | 19.8%), science & technology (126 | 18.3%), business (107 | 15.6%), communications (73 | 10.6%), and literature & languages (64 | 9.3%) are the most common fields of study among 687 individuals in Algood who have obtained a bachelor's degree or higher.
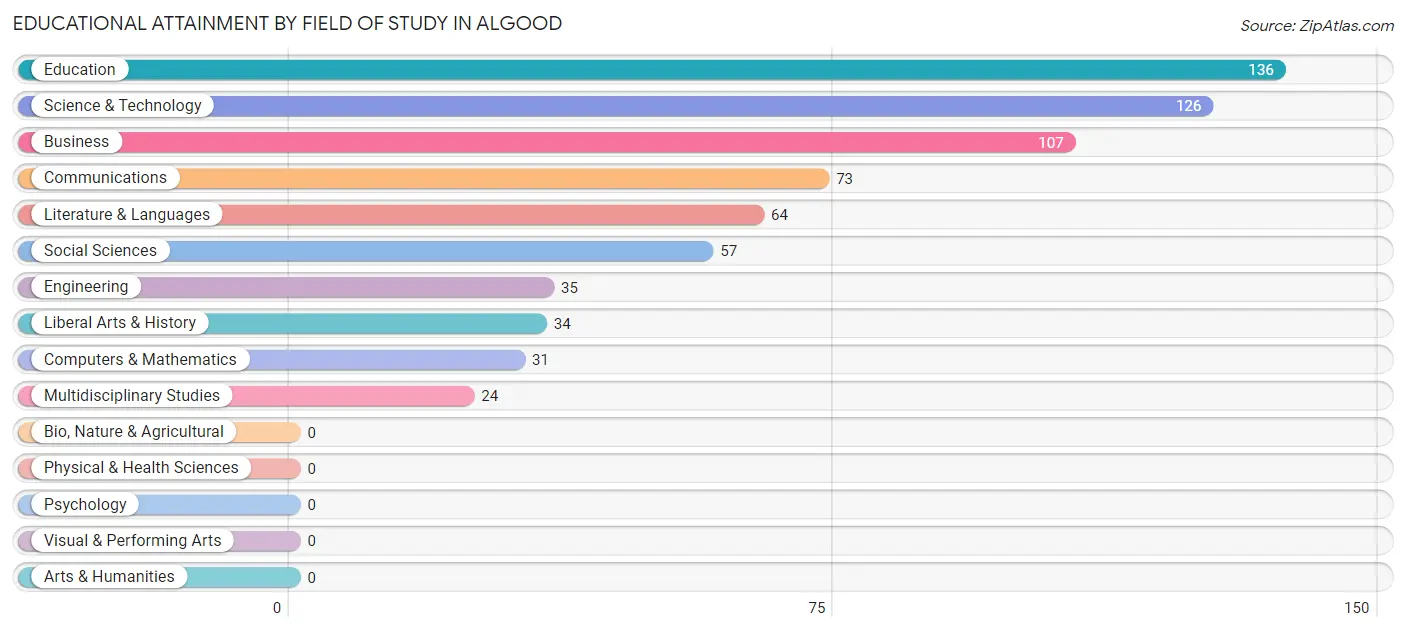
| Field of Study | # Graduates | % Graduates |
| Computers & Mathematics | 31 | 4.5% |
| Bio, Nature & Agricultural | 0 | 0.0% |
| Physical & Health Sciences | 0 | 0.0% |
| Psychology | 0 | 0.0% |
| Social Sciences | 57 | 8.3% |
| Engineering | 35 | 5.1% |
| Multidisciplinary Studies | 24 | 3.5% |
| Science & Technology | 126 | 18.3% |
| Business | 107 | 15.6% |
| Education | 136 | 19.8% |
| Literature & Languages | 64 | 9.3% |
| Liberal Arts & History | 34 | 5.0% |
| Visual & Performing Arts | 0 | 0.0% |
| Communications | 73 | 10.6% |
| Arts & Humanities | 0 | 0.0% |
| Total | 687 | 100.0% |
Transportation & Commute in Algood
Vehicle Availability by Sex in Algood
The most prevalent vehicle ownership categories in Algood are males with 3 vehicles (399, accounting for 45.7%) and females with 3 vehicles (308, making up 37.5%).
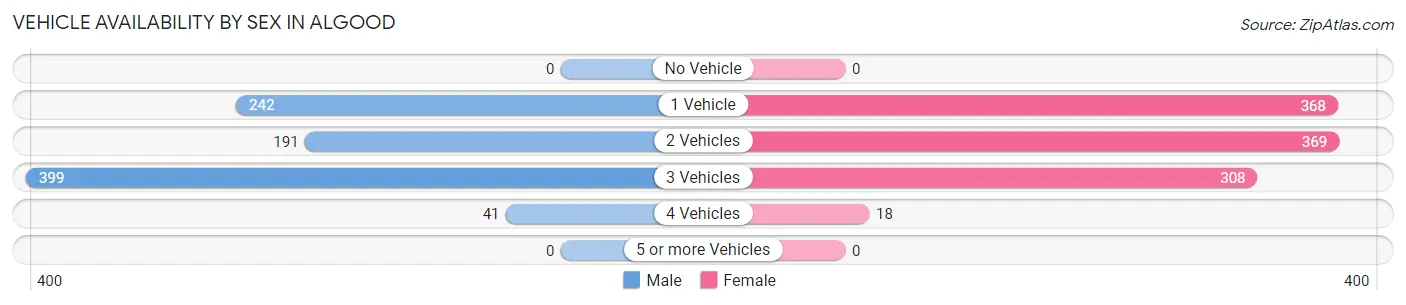
| Vehicles Available | Male | Female |
| No Vehicle | 0 (0.0%) | 0 (0.0%) |
| 1 Vehicle | 242 (27.7%) | 368 (34.6%) |
| 2 Vehicles | 191 (21.9%) | 369 (34.7%) |
| 3 Vehicles | 399 (45.7%) | 308 (29.0%) |
| 4 Vehicles | 41 (4.7%) | 18 (1.7%) |
| 5 or more Vehicles | 0 (0.0%) | 0 (0.0%) |
| Total | 873 (100.0%) | 1,063 (100.0%) |
Commute Time in Algood
The most frequently occuring commute durations in Algood are 15 to 19 minutes (592 commuters, 33.6%), 10 to 14 minutes (494 commuters, 28.1%), and 30 to 34 minutes (160 commuters, 9.1%).

| Commute Time | # Commuters | % Commuters |
| Less than 5 Minutes | 125 | 7.1% |
| 5 to 9 Minutes | 125 | 7.1% |
| 10 to 14 Minutes | 494 | 28.1% |
| 15 to 19 Minutes | 592 | 33.6% |
| 20 to 24 Minutes | 55 | 3.1% |
| 25 to 29 Minutes | 51 | 2.9% |
| 30 to 34 Minutes | 160 | 9.1% |
| 35 to 39 Minutes | 0 | 0.0% |
| 40 to 44 Minutes | 0 | 0.0% |
| 45 to 59 Minutes | 0 | 0.0% |
| 60 to 89 Minutes | 98 | 5.6% |
| 90 or more Minutes | 61 | 3.5% |
Commute Time by Sex in Algood
The most common commute times in Algood are 15 to 19 minutes (299 commuters, 34.3%) for males and 15 to 19 minutes (293 commuters, 33.0%) for females.
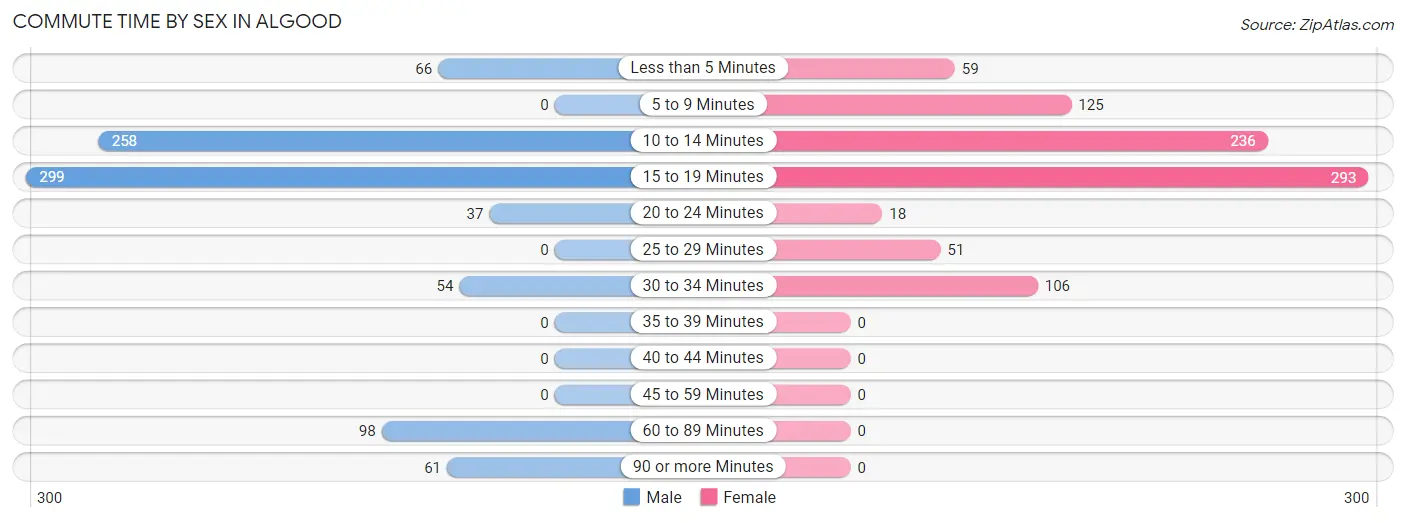
| Commute Time | Male | Female |
| Less than 5 Minutes | 66 (7.6%) | 59 (6.6%) |
| 5 to 9 Minutes | 0 (0.0%) | 125 (14.1%) |
| 10 to 14 Minutes | 258 (29.5%) | 236 (26.6%) |
| 15 to 19 Minutes | 299 (34.3%) | 293 (33.0%) |
| 20 to 24 Minutes | 37 (4.2%) | 18 (2.0%) |
| 25 to 29 Minutes | 0 (0.0%) | 51 (5.7%) |
| 30 to 34 Minutes | 54 (6.2%) | 106 (11.9%) |
| 35 to 39 Minutes | 0 (0.0%) | 0 (0.0%) |
| 40 to 44 Minutes | 0 (0.0%) | 0 (0.0%) |
| 45 to 59 Minutes | 0 (0.0%) | 0 (0.0%) |
| 60 to 89 Minutes | 98 (11.2%) | 0 (0.0%) |
| 90 or more Minutes | 61 (7.0%) | 0 (0.0%) |
Time of Departure to Work by Sex in Algood
The most frequent times of departure to work in Algood are 5:30 AM to 5:59 AM (236, 27.0%) for males and 6:30 AM to 6:59 AM (216, 24.3%) for females.
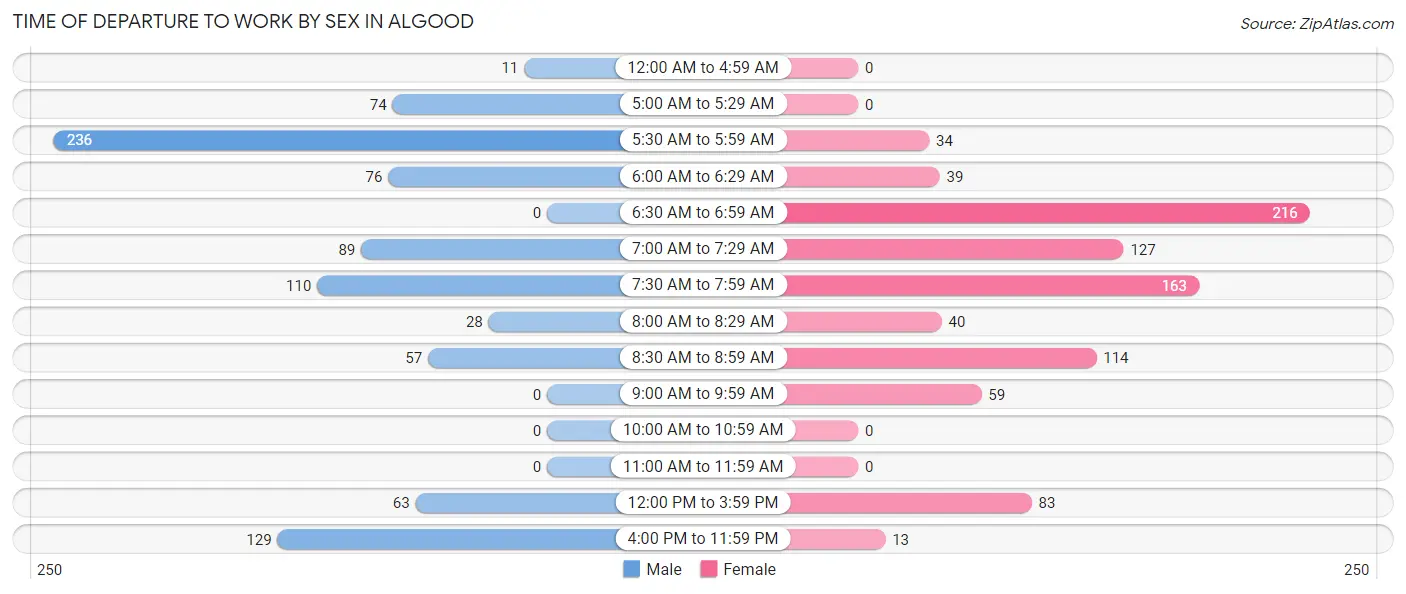
| Time of Departure | Male | Female |
| 12:00 AM to 4:59 AM | 11 (1.3%) | 0 (0.0%) |
| 5:00 AM to 5:29 AM | 74 (8.5%) | 0 (0.0%) |
| 5:30 AM to 5:59 AM | 236 (27.0%) | 34 (3.8%) |
| 6:00 AM to 6:29 AM | 76 (8.7%) | 39 (4.4%) |
| 6:30 AM to 6:59 AM | 0 (0.0%) | 216 (24.3%) |
| 7:00 AM to 7:29 AM | 89 (10.2%) | 127 (14.3%) |
| 7:30 AM to 7:59 AM | 110 (12.6%) | 163 (18.4%) |
| 8:00 AM to 8:29 AM | 28 (3.2%) | 40 (4.5%) |
| 8:30 AM to 8:59 AM | 57 (6.5%) | 114 (12.8%) |
| 9:00 AM to 9:59 AM | 0 (0.0%) | 59 (6.6%) |
| 10:00 AM to 10:59 AM | 0 (0.0%) | 0 (0.0%) |
| 11:00 AM to 11:59 AM | 0 (0.0%) | 0 (0.0%) |
| 12:00 PM to 3:59 PM | 63 (7.2%) | 83 (9.3%) |
| 4:00 PM to 11:59 PM | 129 (14.8%) | 13 (1.5%) |
| Total | 873 (100.0%) | 888 (100.0%) |
Housing Occupancy in Algood
Occupancy by Ownership in Algood
Of the total 1,752 dwellings in Algood, owner-occupied units account for 786 (44.9%), while renter-occupied units make up 966 (55.1%).
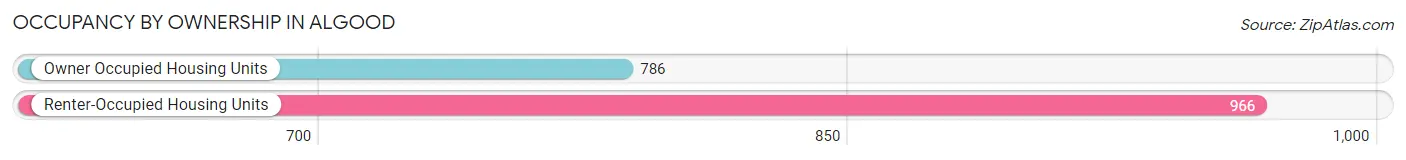
| Occupancy | # Housing Units | % Housing Units |
| Owner Occupied Housing Units | 786 | 44.9% |
| Renter-Occupied Housing Units | 966 | 55.1% |
| Total Occupied Housing Units | 1,752 | 100.0% |
Occupancy by Household Size in Algood
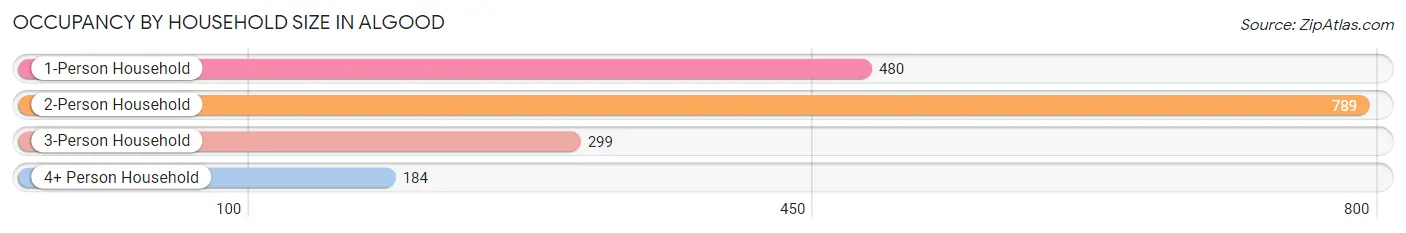
| Household Size | # Housing Units | % Housing Units |
| 1-Person Household | 480 | 27.4% |
| 2-Person Household | 789 | 45.0% |
| 3-Person Household | 299 | 17.1% |
| 4+ Person Household | 184 | 10.5% |
| Total Housing Units | 1,752 | 100.0% |
Occupancy by Ownership by Household Size in Algood
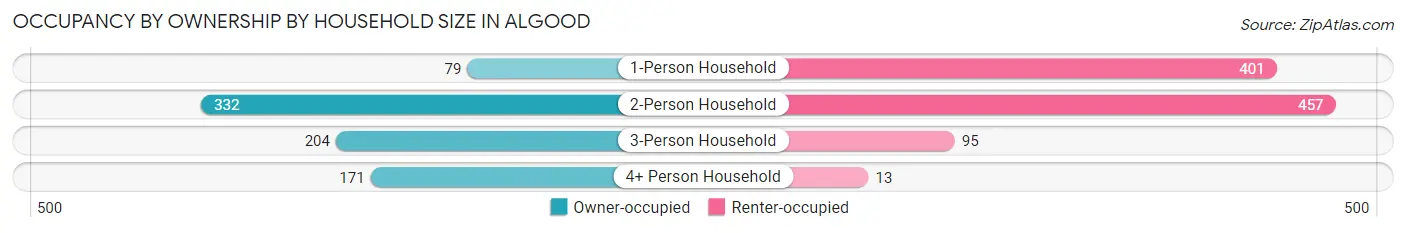
| Household Size | Owner-occupied | Renter-occupied |
| 1-Person Household | 79 (16.5%) | 401 (83.5%) |
| 2-Person Household | 332 (42.1%) | 457 (57.9%) |
| 3-Person Household | 204 (68.2%) | 95 (31.8%) |
| 4+ Person Household | 171 (92.9%) | 13 (7.1%) |
| Total Housing Units | 786 (44.9%) | 966 (55.1%) |
Occupancy by Educational Attainment in Algood
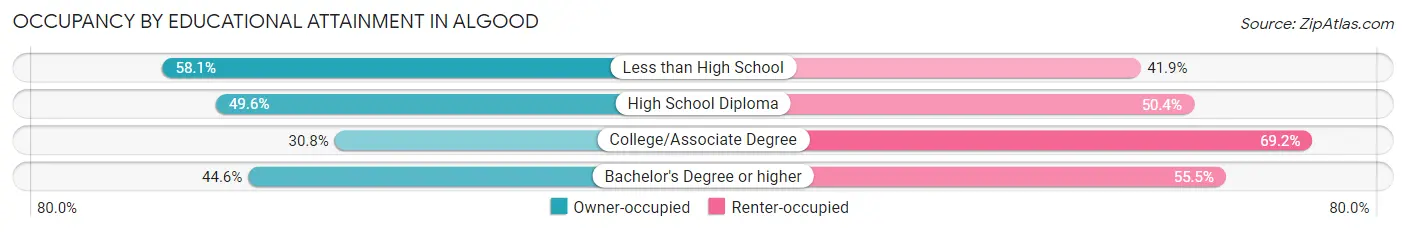
| Household Size | Owner-occupied | Renter-occupied |
| Less than High School | 154 (58.1%) | 111 (41.9%) |
| High School Diploma | 275 (49.6%) | 279 (50.4%) |
| College/Associate Degree | 132 (30.8%) | 296 (69.2%) |
| Bachelor's Degree or higher | 225 (44.6%) | 280 (55.4%) |
Occupancy by Age of Householder in Algood
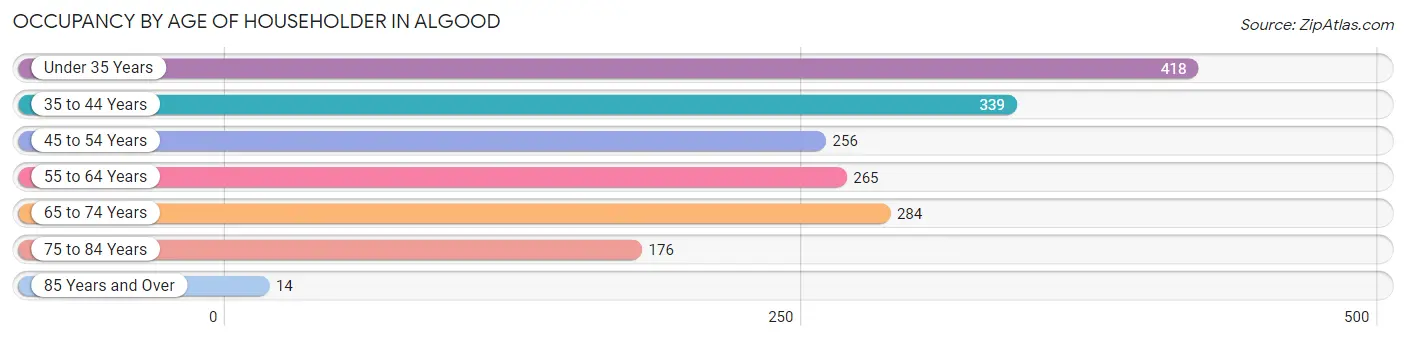
| Age Bracket | # Households | % Households |
| Under 35 Years | 418 | 23.9% |
| 35 to 44 Years | 339 | 19.4% |
| 45 to 54 Years | 256 | 14.6% |
| 55 to 64 Years | 265 | 15.1% |
| 65 to 74 Years | 284 | 16.2% |
| 75 to 84 Years | 176 | 10.1% |
| 85 Years and Over | 14 | 0.8% |
| Total | 1,752 | 100.0% |
Housing Finances in Algood
Median Income by Occupancy in Algood
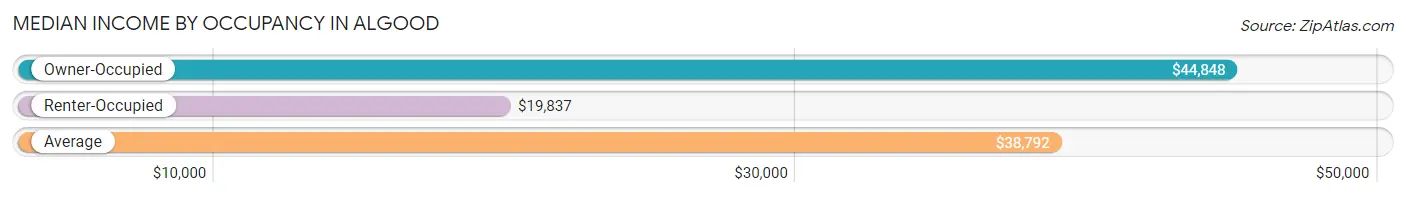
| Occupancy Type | # Households | Median Income |
| Owner-Occupied | 786 (44.9%) | $44,848 |
| Renter-Occupied | 966 (55.1%) | $19,837 |
| Average | 1,752 (100.0%) | $38,792 |
Occupancy by Householder Income Bracket in Algood
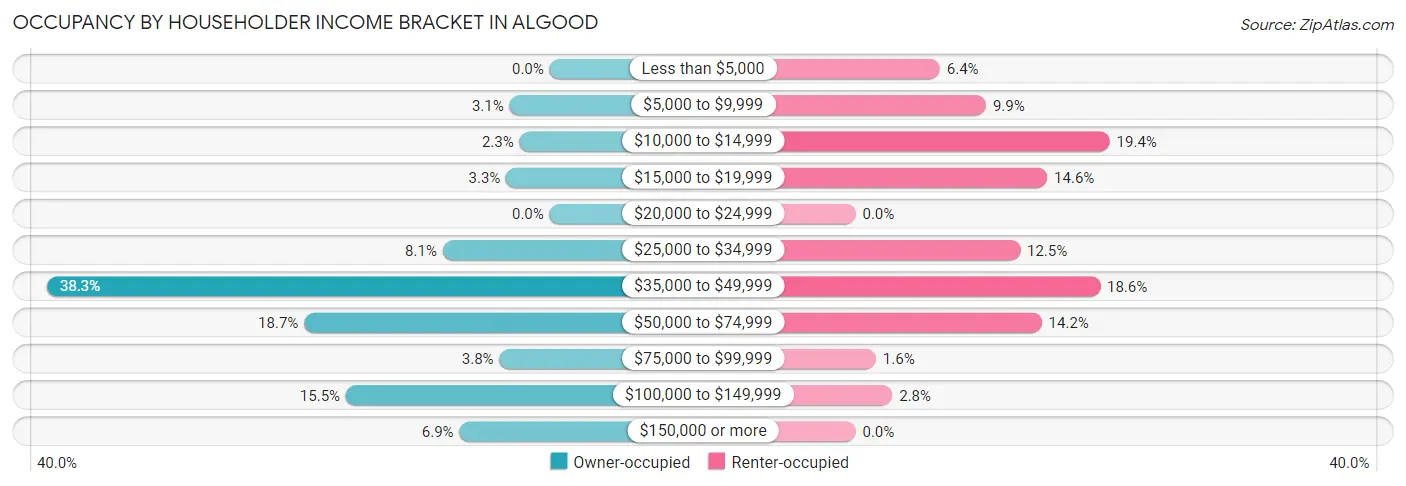
| Income Bracket | Owner-occupied | Renter-occupied |
| Less than $5,000 | 0 (0.0%) | 62 (6.4%) |
| $5,000 to $9,999 | 24 (3.0%) | 96 (9.9%) |
| $10,000 to $14,999 | 18 (2.3%) | 187 (19.4%) |
| $15,000 to $19,999 | 26 (3.3%) | 141 (14.6%) |
| $20,000 to $24,999 | 0 (0.0%) | 0 (0.0%) |
| $25,000 to $34,999 | 64 (8.1%) | 121 (12.5%) |
| $35,000 to $49,999 | 301 (38.3%) | 180 (18.6%) |
| $50,000 to $74,999 | 147 (18.7%) | 137 (14.2%) |
| $75,000 to $99,999 | 30 (3.8%) | 15 (1.5%) |
| $100,000 to $149,999 | 122 (15.5%) | 27 (2.8%) |
| $150,000 or more | 54 (6.9%) | 0 (0.0%) |
| Total | 786 (100.0%) | 966 (100.0%) |
Monthly Housing Cost Tiers in Algood
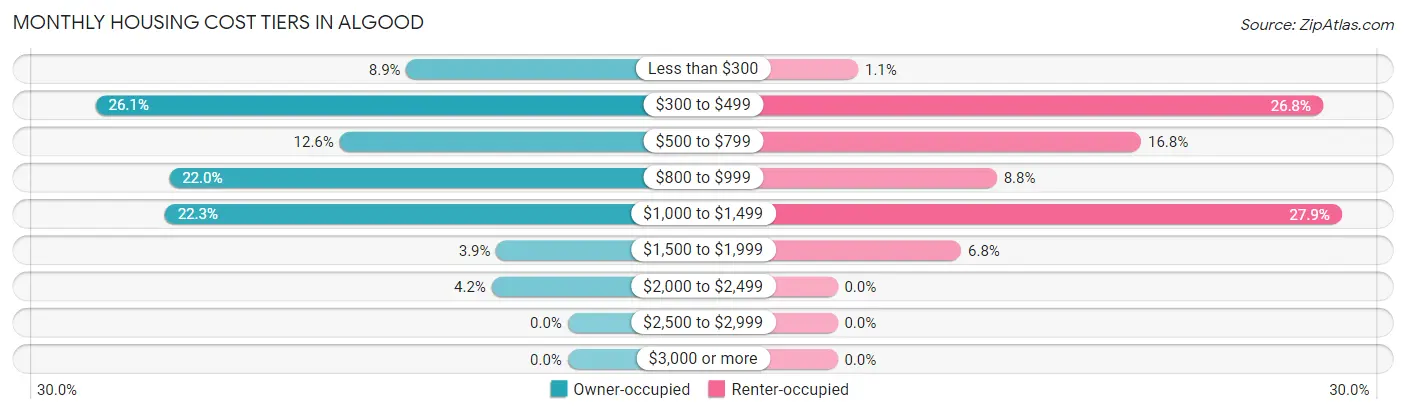
| Monthly Cost | Owner-occupied | Renter-occupied |
| Less than $300 | 70 (8.9%) | 11 (1.1%) |
| $300 to $499 | 205 (26.1%) | 259 (26.8%) |
| $500 to $799 | 99 (12.6%) | 162 (16.8%) |
| $800 to $999 | 173 (22.0%) | 85 (8.8%) |
| $1,000 to $1,499 | 175 (22.3%) | 269 (27.9%) |
| $1,500 to $1,999 | 31 (3.9%) | 66 (6.8%) |
| $2,000 to $2,499 | 33 (4.2%) | 0 (0.0%) |
| $2,500 to $2,999 | 0 (0.0%) | 0 (0.0%) |
| $3,000 or more | 0 (0.0%) | 0 (0.0%) |
| Total | 786 (100.0%) | 966 (100.0%) |
Physical Housing Characteristics in Algood
Housing Structures in Algood
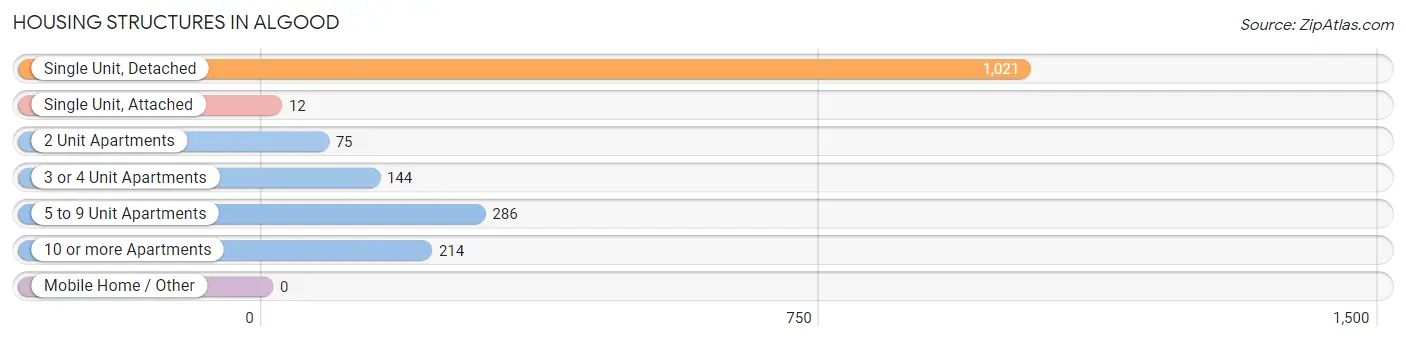
| Structure Type | # Housing Units | % Housing Units |
| Single Unit, Detached | 1,021 | 58.3% |
| Single Unit, Attached | 12 | 0.7% |
| 2 Unit Apartments | 75 | 4.3% |
| 3 or 4 Unit Apartments | 144 | 8.2% |
| 5 to 9 Unit Apartments | 286 | 16.3% |
| 10 or more Apartments | 214 | 12.2% |
| Mobile Home / Other | 0 | 0.0% |
| Total | 1,752 | 100.0% |
Housing Structures by Occupancy in Algood
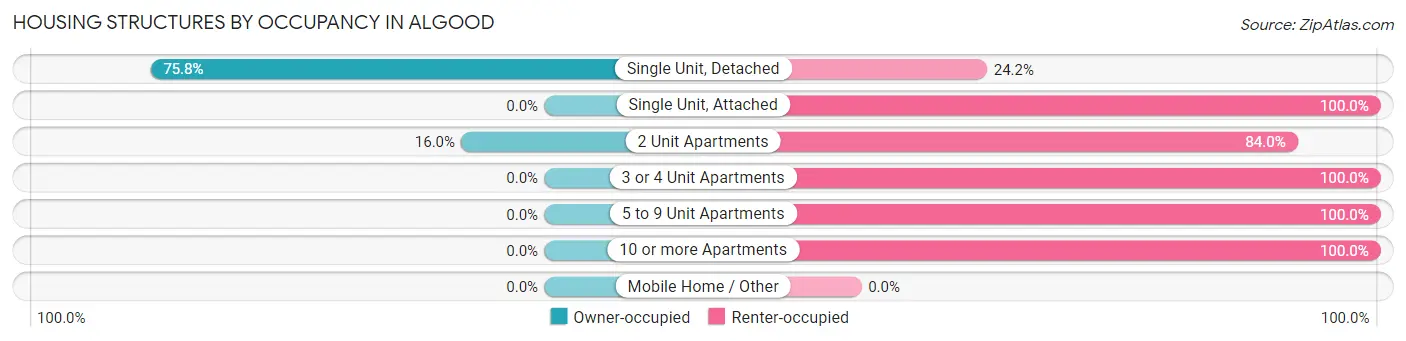
| Structure Type | Owner-occupied | Renter-occupied |
| Single Unit, Detached | 774 (75.8%) | 247 (24.2%) |
| Single Unit, Attached | 0 (0.0%) | 12 (100.0%) |
| 2 Unit Apartments | 12 (16.0%) | 63 (84.0%) |
| 3 or 4 Unit Apartments | 0 (0.0%) | 144 (100.0%) |
| 5 to 9 Unit Apartments | 0 (0.0%) | 286 (100.0%) |
| 10 or more Apartments | 0 (0.0%) | 214 (100.0%) |
| Mobile Home / Other | 0 (0.0%) | 0 (0.0%) |
| Total | 786 (44.9%) | 966 (55.1%) |
Housing Structures by Number of Rooms in Algood
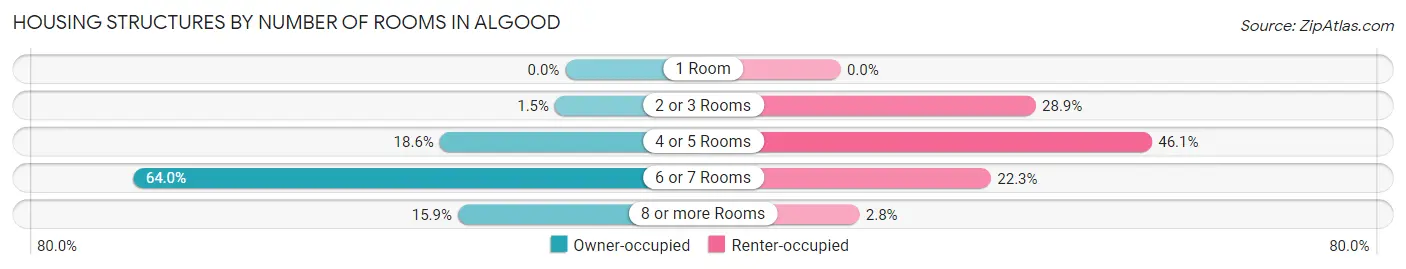
| Number of Rooms | Owner-occupied | Renter-occupied |
| 1 Room | 0 (0.0%) | 0 (0.0%) |
| 2 or 3 Rooms | 12 (1.5%) | 279 (28.9%) |
| 4 or 5 Rooms | 146 (18.6%) | 445 (46.1%) |
| 6 or 7 Rooms | 503 (64.0%) | 215 (22.3%) |
| 8 or more Rooms | 125 (15.9%) | 27 (2.8%) |
| Total | 786 (100.0%) | 966 (100.0%) |
Housing Structure by Heating Type in Algood
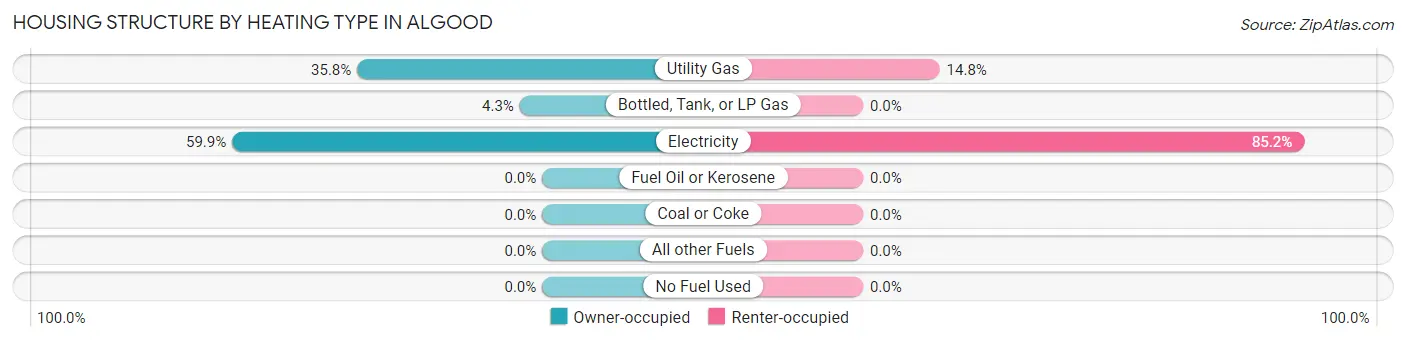
| Heating Type | Owner-occupied | Renter-occupied |
| Utility Gas | 281 (35.7%) | 143 (14.8%) |
| Bottled, Tank, or LP Gas | 34 (4.3%) | 0 (0.0%) |
| Electricity | 471 (59.9%) | 823 (85.2%) |
| Fuel Oil or Kerosene | 0 (0.0%) | 0 (0.0%) |
| Coal or Coke | 0 (0.0%) | 0 (0.0%) |
| All other Fuels | 0 (0.0%) | 0 (0.0%) |
| No Fuel Used | 0 (0.0%) | 0 (0.0%) |
| Total | 786 (100.0%) | 966 (100.0%) |
Household Vehicle Usage in Algood
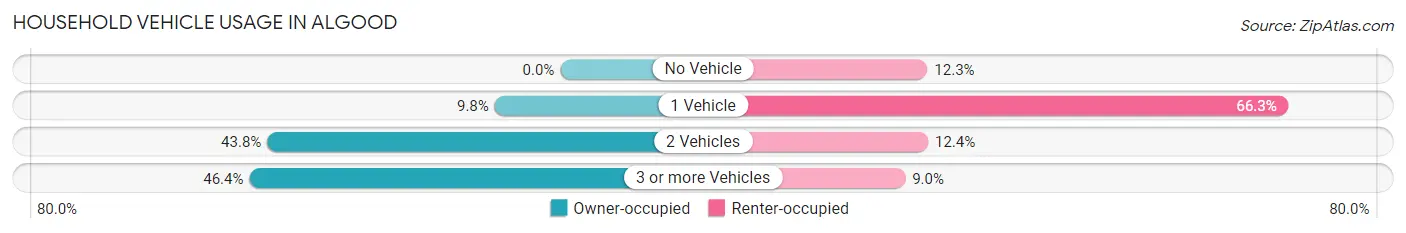
| Vehicles per Household | Owner-occupied | Renter-occupied |
| No Vehicle | 0 (0.0%) | 119 (12.3%) |
| 1 Vehicle | 77 (9.8%) | 640 (66.2%) |
| 2 Vehicles | 344 (43.8%) | 120 (12.4%) |
| 3 or more Vehicles | 365 (46.4%) | 87 (9.0%) |
| Total | 786 (100.0%) | 966 (100.0%) |
Real Estate & Mortgages in Algood
Real Estate and Mortgage Overview in Algood
| Characteristic | Without Mortgage | With Mortgage |
| Housing Units | 352 | 434 |
| Median Property Value | $148,400 | $148,800 |
| Median Household Income | $55,655 | $34 |
| Monthly Housing Costs | $363 | $0 |
| Real Estate Taxes | $942 | $0 |
Property Value by Mortgage Status in Algood
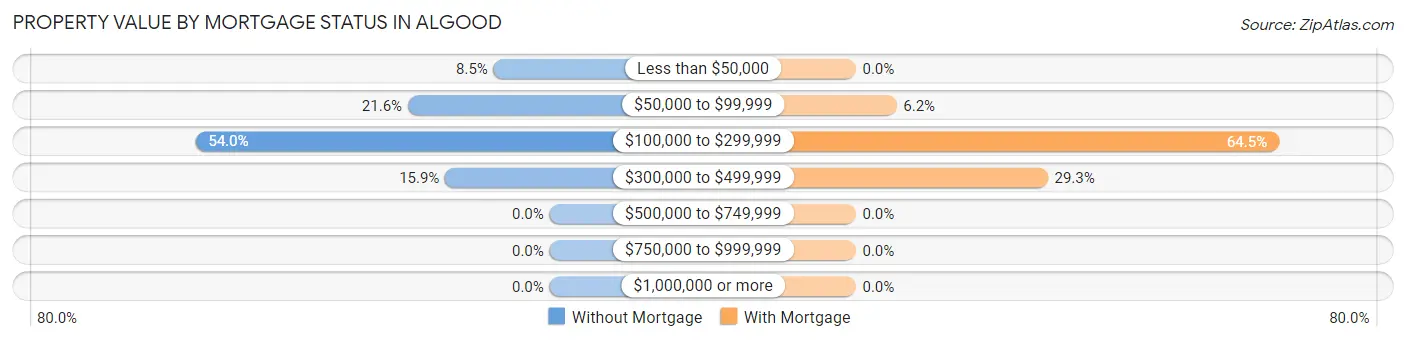
| Property Value | Without Mortgage | With Mortgage |
| Less than $50,000 | 30 (8.5%) | 0 (0.0%) |
| $50,000 to $99,999 | 76 (21.6%) | 27 (6.2%) |
| $100,000 to $299,999 | 190 (54.0%) | 280 (64.5%) |
| $300,000 to $499,999 | 56 (15.9%) | 127 (29.3%) |
| $500,000 to $749,999 | 0 (0.0%) | 0 (0.0%) |
| $750,000 to $999,999 | 0 (0.0%) | 0 (0.0%) |
| $1,000,000 or more | 0 (0.0%) | 0 (0.0%) |
| Total | 352 (100.0%) | 434 (100.0%) |
Household Income by Mortgage Status in Algood
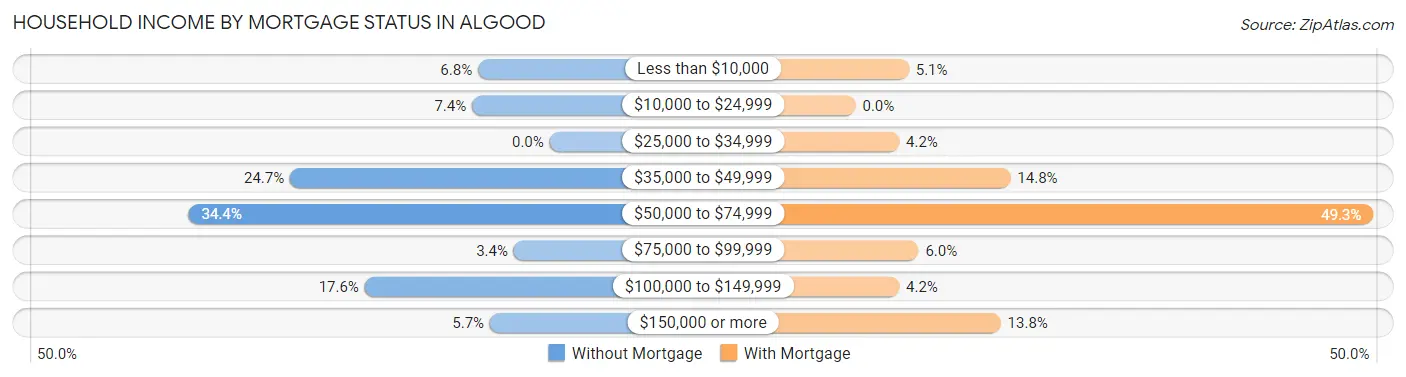
| Household Income | Without Mortgage | With Mortgage |
| Less than $10,000 | 24 (6.8%) | 22 (5.1%) |
| $10,000 to $24,999 | 26 (7.4%) | 0 (0.0%) |
| $25,000 to $34,999 | 0 (0.0%) | 18 (4.2%) |
| $35,000 to $49,999 | 87 (24.7%) | 64 (14.7%) |
| $50,000 to $74,999 | 121 (34.4%) | 214 (49.3%) |
| $75,000 to $99,999 | 12 (3.4%) | 26 (6.0%) |
| $100,000 to $149,999 | 62 (17.6%) | 18 (4.2%) |
| $150,000 or more | 20 (5.7%) | 60 (13.8%) |
| Total | 352 (100.0%) | 434 (100.0%) |
Property Value to Household Income Ratio in Algood
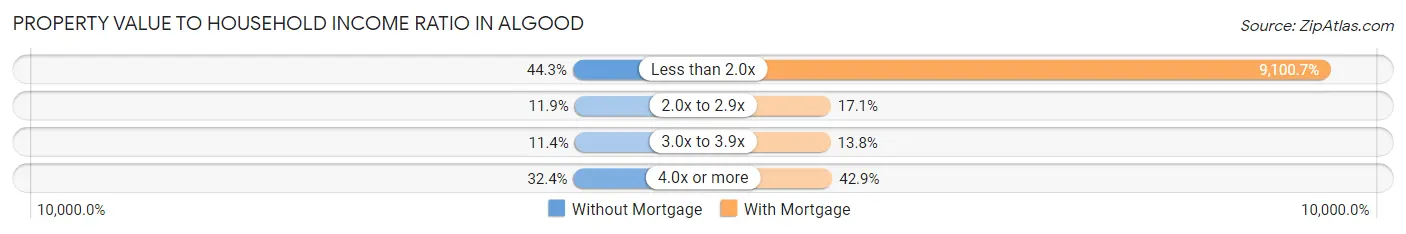
| Value-to-Income Ratio | Without Mortgage | With Mortgage |
| Less than 2.0x | 156 (44.3%) | 39,497 (9,100.7%) |
| 2.0x to 2.9x | 42 (11.9%) | 74 (17.1%) |
| 3.0x to 3.9x | 40 (11.4%) | 60 (13.8%) |
| 4.0x or more | 114 (32.4%) | 186 (42.9%) |
| Total | 352 (100.0%) | 434 (100.0%) |
Real Estate Taxes by Mortgage Status in Algood
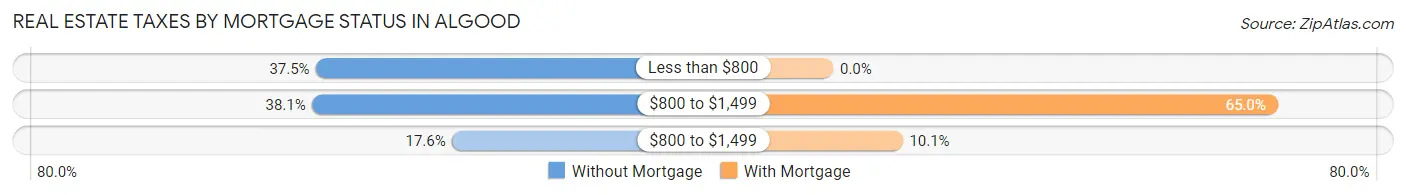
| Property Taxes | Without Mortgage | With Mortgage |
| Less than $800 | 132 (37.5%) | 0 (0.0%) |
| $800 to $1,499 | 134 (38.1%) | 282 (65.0%) |
| $800 to $1,499 | 62 (17.6%) | 44 (10.1%) |
| Total | 352 (100.0%) | 434 (100.0%) |
Health & Disability in Algood
Health Insurance Coverage by Age in Algood
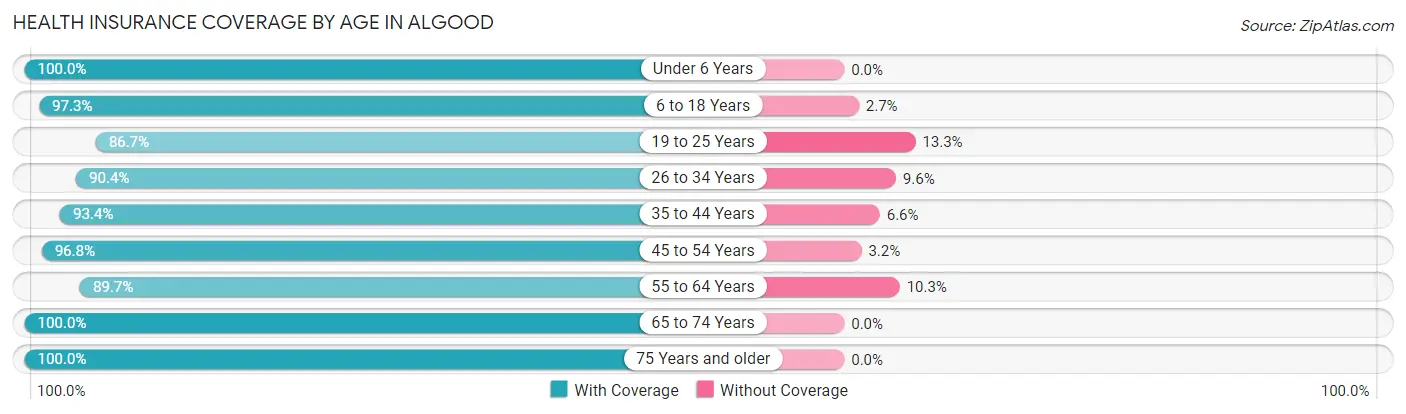
| Age Bracket | With Coverage | Without Coverage |
| Under 6 Years | 70 (100.0%) | 0 (0.0%) |
| 6 to 18 Years | 970 (97.3%) | 27 (2.7%) |
| 19 to 25 Years | 268 (86.7%) | 41 (13.3%) |
| 26 to 34 Years | 376 (90.4%) | 40 (9.6%) |
| 35 to 44 Years | 367 (93.4%) | 26 (6.6%) |
| 45 to 54 Years | 454 (96.8%) | 15 (3.2%) |
| 55 to 64 Years | 486 (89.7%) | 56 (10.3%) |
| 65 to 74 Years | 375 (100.0%) | 0 (0.0%) |
| 75 Years and older | 219 (100.0%) | 0 (0.0%) |
| Total | 3,585 (94.6%) | 205 (5.4%) |
Health Insurance Coverage by Citizenship Status in Algood
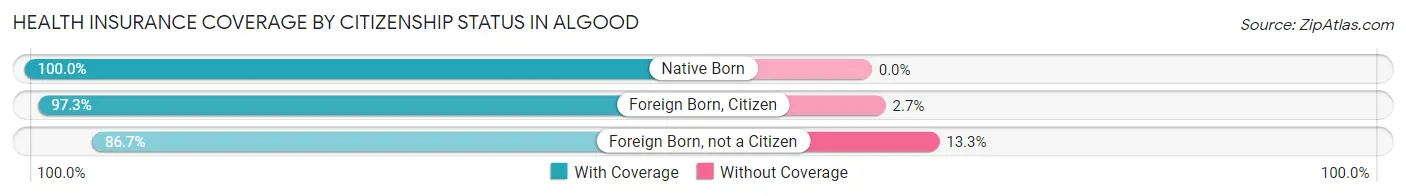
| Citizenship Status | With Coverage | Without Coverage |
| Native Born | 70 (100.0%) | 0 (0.0%) |
| Foreign Born, Citizen | 970 (97.3%) | 27 (2.7%) |
| Foreign Born, not a Citizen | 268 (86.7%) | 41 (13.3%) |
Health Insurance Coverage by Household Income in Algood
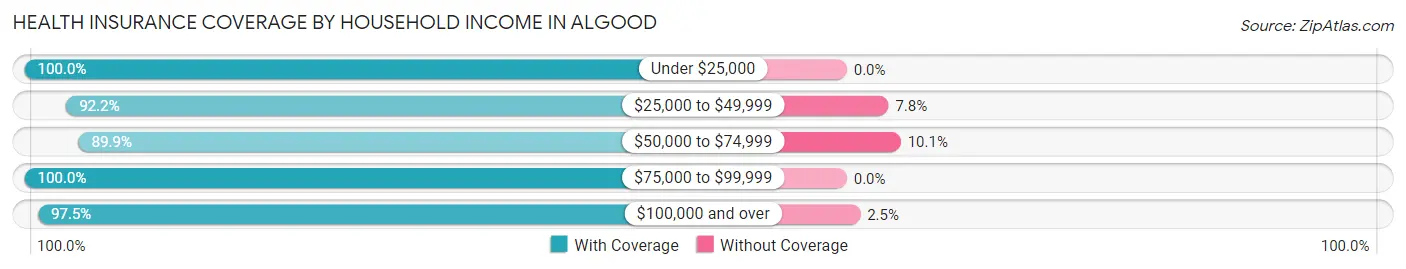
| Household Income | With Coverage | Without Coverage |
| Under $25,000 | 790 (100.0%) | 0 (0.0%) |
| $25,000 to $49,999 | 1,464 (92.2%) | 124 (7.8%) |
| $50,000 to $74,999 | 587 (89.9%) | 66 (10.1%) |
| $75,000 to $99,999 | 161 (100.0%) | 0 (0.0%) |
| $100,000 and over | 583 (97.5%) | 15 (2.5%) |
Public vs Private Health Insurance Coverage by Age in Algood
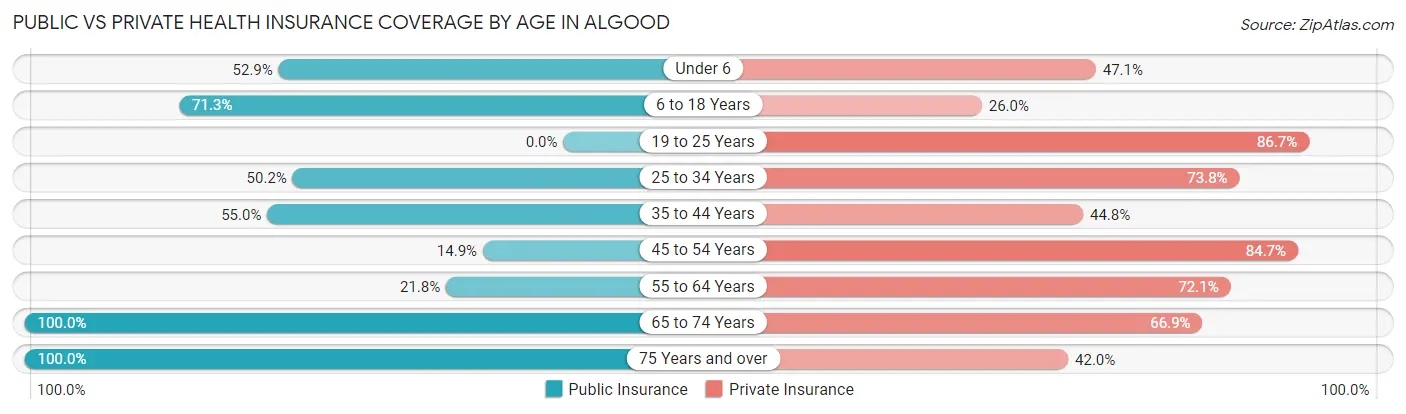
| Age Bracket | Public Insurance | Private Insurance |
| Under 6 | 37 (52.9%) | 33 (47.1%) |
| 6 to 18 Years | 711 (71.3%) | 259 (26.0%) |
| 19 to 25 Years | 0 (0.0%) | 268 (86.7%) |
| 25 to 34 Years | 209 (50.2%) | 307 (73.8%) |
| 35 to 44 Years | 216 (55.0%) | 176 (44.8%) |
| 45 to 54 Years | 70 (14.9%) | 397 (84.7%) |
| 55 to 64 Years | 118 (21.8%) | 391 (72.1%) |
| 65 to 74 Years | 375 (100.0%) | 251 (66.9%) |
| 75 Years and over | 219 (100.0%) | 92 (42.0%) |
| Total | 1,955 (51.6%) | 2,174 (57.4%) |
Disability Status by Sex by Age in Algood
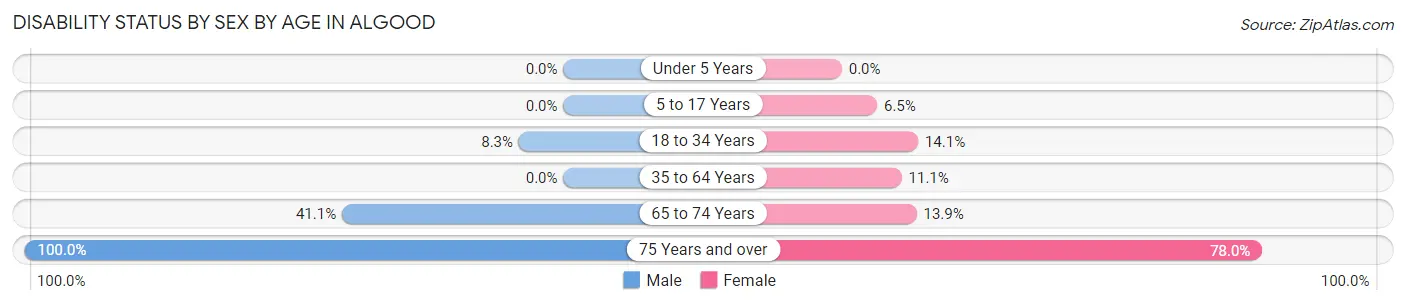
| Age Bracket | Male | Female |
| Under 5 Years | 0 (0.0%) | 0 (0.0%) |
| 5 to 17 Years | 0 (0.0%) | 38 (6.5%) |
| 18 to 34 Years | 46 (8.3%) | 28 (14.1%) |
| 35 to 64 Years | 0 (0.0%) | 111 (11.1%) |
| 65 to 74 Years | 83 (41.1%) | 24 (13.9%) |
| 75 Years and over | 46 (100.0%) | 135 (78.0%) |
Disability Class by Sex by Age in Algood
Disability Class: Hearing Difficulty
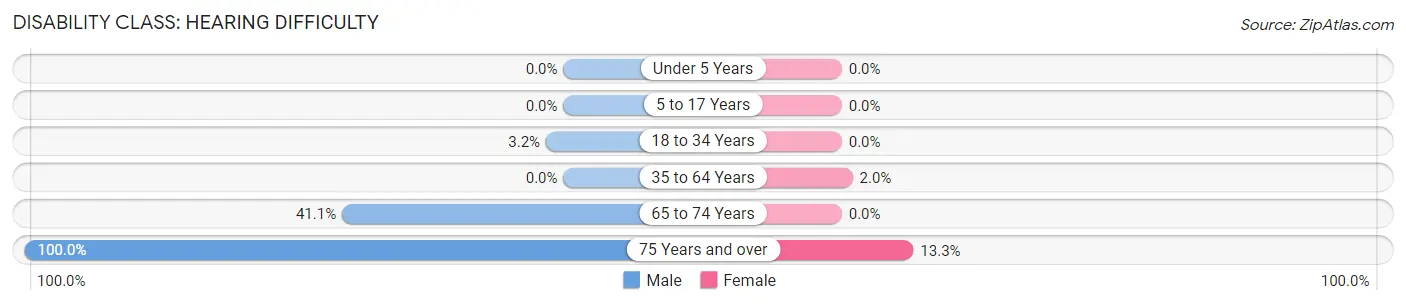
| Age Bracket | Male | Female |
| Under 5 Years | 0 (0.0%) | 0 (0.0%) |
| 5 to 17 Years | 0 (0.0%) | 0 (0.0%) |
| 18 to 34 Years | 18 (3.2%) | 0 (0.0%) |
| 35 to 64 Years | 0 (0.0%) | 20 (2.0%) |
| 65 to 74 Years | 83 (41.1%) | 0 (0.0%) |
| 75 Years and over | 46 (100.0%) | 23 (13.3%) |
Disability Class: Vision Difficulty
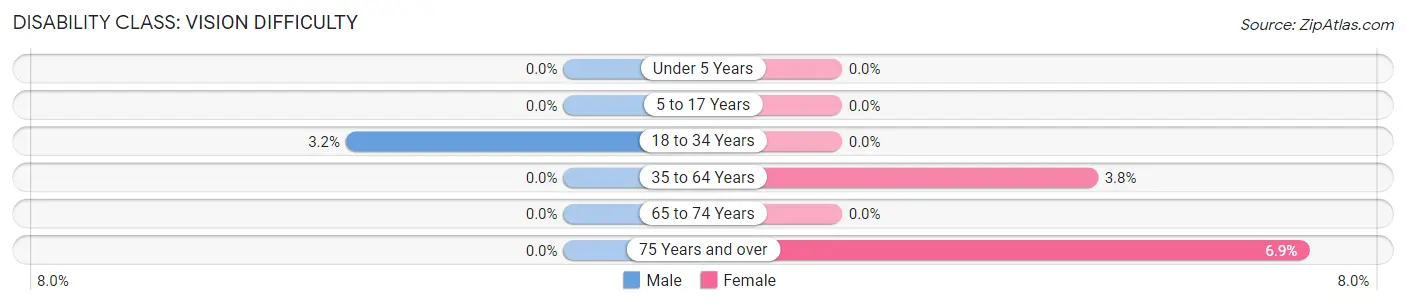
| Age Bracket | Male | Female |
| Under 5 Years | 0 (0.0%) | 0 (0.0%) |
| 5 to 17 Years | 0 (0.0%) | 0 (0.0%) |
| 18 to 34 Years | 18 (3.2%) | 0 (0.0%) |
| 35 to 64 Years | 0 (0.0%) | 38 (3.8%) |
| 65 to 74 Years | 0 (0.0%) | 0 (0.0%) |
| 75 Years and over | 0 (0.0%) | 12 (6.9%) |
Disability Class: Cognitive Difficulty
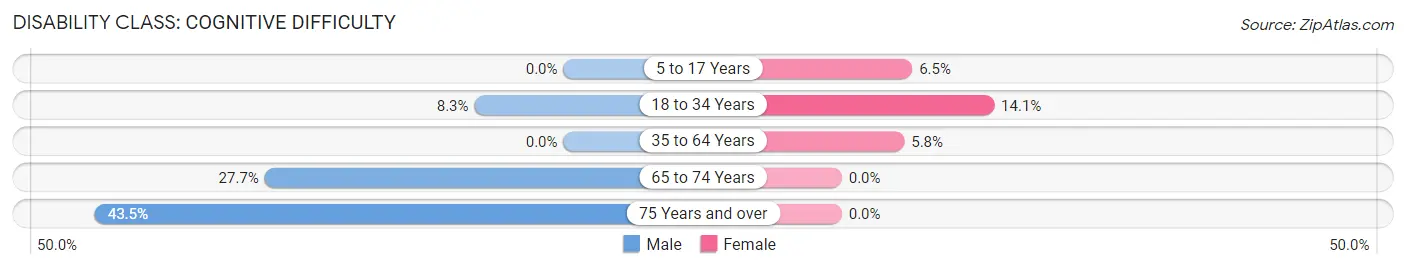
| Age Bracket | Male | Female |
| 5 to 17 Years | 0 (0.0%) | 38 (6.5%) |
| 18 to 34 Years | 46 (8.3%) | 28 (14.1%) |
| 35 to 64 Years | 0 (0.0%) | 58 (5.8%) |
| 65 to 74 Years | 56 (27.7%) | 0 (0.0%) |
| 75 Years and over | 20 (43.5%) | 0 (0.0%) |
Disability Class: Ambulatory Difficulty
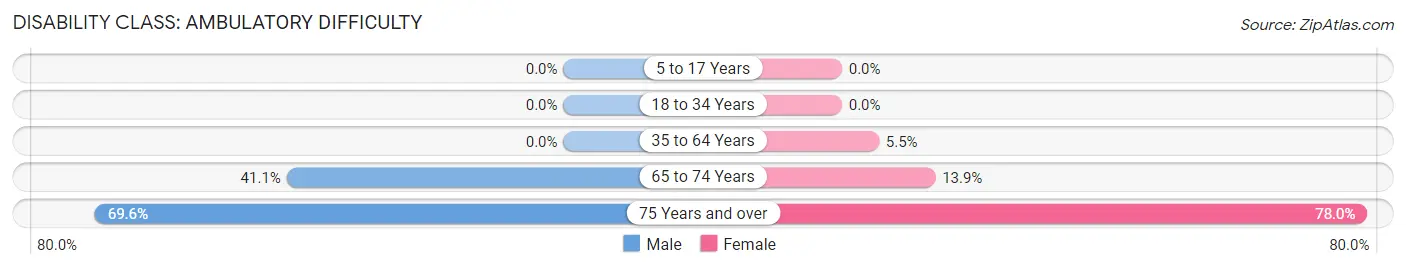
| Age Bracket | Male | Female |
| 5 to 17 Years | 0 (0.0%) | 0 (0.0%) |
| 18 to 34 Years | 0 (0.0%) | 0 (0.0%) |
| 35 to 64 Years | 0 (0.0%) | 55 (5.5%) |
| 65 to 74 Years | 83 (41.1%) | 24 (13.9%) |
| 75 Years and over | 32 (69.6%) | 135 (78.0%) |
Disability Class: Self-Care Difficulty
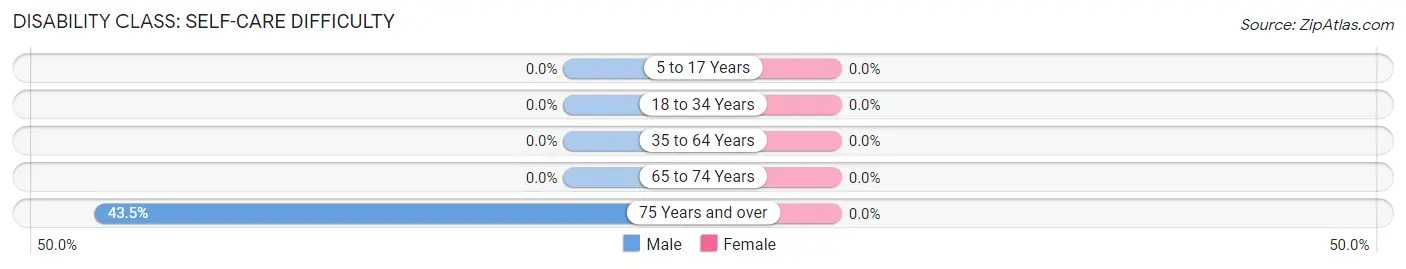
| Age Bracket | Male | Female |
| 5 to 17 Years | 0 (0.0%) | 0 (0.0%) |
| 18 to 34 Years | 0 (0.0%) | 0 (0.0%) |
| 35 to 64 Years | 0 (0.0%) | 0 (0.0%) |
| 65 to 74 Years | 0 (0.0%) | 0 (0.0%) |
| 75 Years and over | 20 (43.5%) | 0 (0.0%) |
Technology Access in Algood
Computing Device Access in Algood
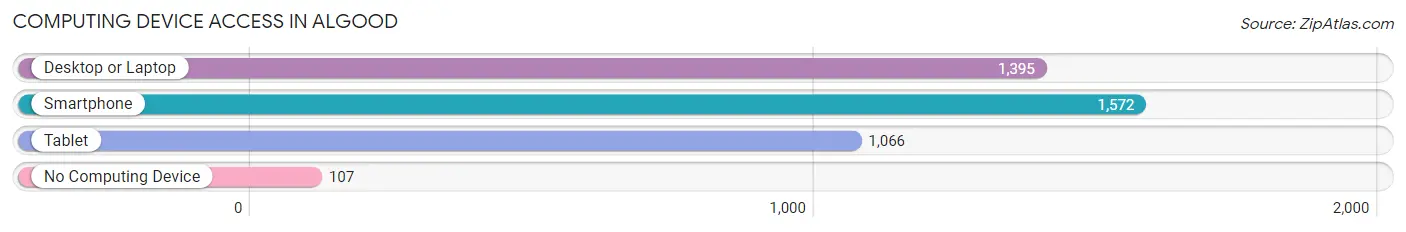
| Device Type | # Households | % Households |
| Desktop or Laptop | 1,395 | 79.6% |
| Smartphone | 1,572 | 89.7% |
| Tablet | 1,066 | 60.8% |
| No Computing Device | 107 | 6.1% |
| Total | 1,752 | 100.0% |
Internet Access in Algood
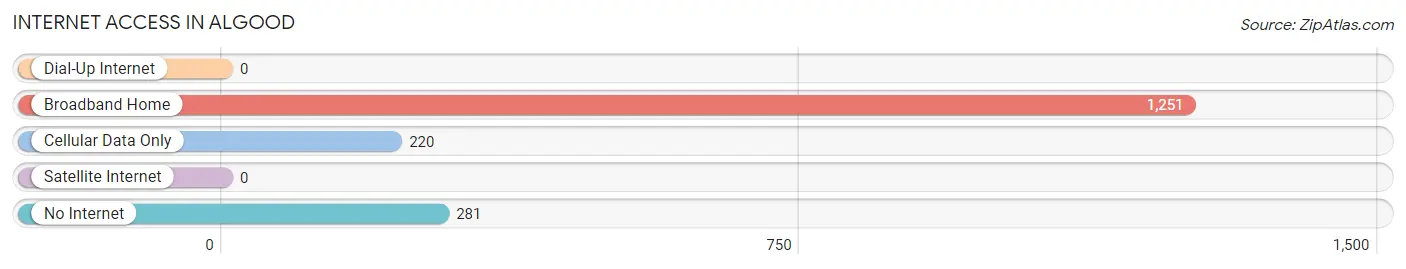
| Internet Type | # Households | % Households |
| Dial-Up Internet | 0 | 0.0% |
| Broadband Home | 1,251 | 71.4% |
| Cellular Data Only | 220 | 12.6% |
| Satellite Internet | 0 | 0.0% |
| No Internet | 281 | 16.0% |
| Total | 1,752 | 100.0% |
Algood Summary
Algood is a small city located in Putnam County, Tennessee. It is situated in the Upper Cumberland region of the state, and is part of the Cookeville, TN Micropolitan Statistical Area. The city has a population of approximately 3,000 people, and is known for its rural charm and friendly atmosphere.
History
Algood was founded in 1887 by a group of settlers from the nearby town of Cookeville. The town was named after the Algood family, who were among the first settlers in the area. The town was originally a farming community, and the main crops grown were corn, wheat, and cotton. In the early 1900s, the town began to grow and develop, and by the 1920s, it had become a thriving commercial center.
In the 1950s, Algood began to experience a period of growth and development. The town was home to several businesses, including a cotton mill, a furniture factory, and a canning factory. The town also had a number of churches, schools, and other amenities.
Geography
Algood is located in the Upper Cumberland region of Tennessee. It is situated in the foothills of the Cumberland Mountains, and is surrounded by rolling hills and lush forests. The city is located approximately 30 miles from Cookeville, and is accessible via Interstate 40.
The climate in Algood is generally mild, with temperatures ranging from the mid-50s in the winter to the mid-80s in the summer. The area receives an average of 45 inches of rain per year, and snowfall is rare.
Economy
Algood’s economy is largely based on agriculture and manufacturing. The town is home to several large farms, which produce a variety of crops, including corn, wheat, and cotton. The town also has a number of manufacturing businesses, including a furniture factory and a canning factory.
In addition to agriculture and manufacturing, Algood is home to a number of small businesses, including restaurants, shops, and other services. The town also has a number of churches, schools, and other amenities.
Demographics
As of the 2010 census, Algood had a population of 3,000 people. The racial makeup of the town was 95.3% White, 1.7% African American, 0.3% Native American, 0.7% Asian, and 1.9% from other races. The median household income was $35,000, and the median age was 38.
Algood is a small, rural town with a friendly atmosphere and a strong sense of community. The town is home to a variety of businesses, churches, schools, and other amenities, and is a great place to live and work.
Common Questions
What is the Total Population of Algood?
Total Population of Algood is 3,944.
What is the Total Male Population of Algood?
Total Male Population of Algood is 1,706.
What is the Total Female Population of Algood?
Total Female Population of Algood is 2,238.
What is the Ratio of Males per 100 Females in Algood?
There are 76.23 Males per 100 Females in Algood.
What is the Ratio of Females per 100 Males in Algood?
There are 131.18 Females per 100 Males in Algood.
What is the Median Population Age in Algood?
Median Population Age in Algood is 39.7 Years.
What is the Average Family Size in Algood
Average Family Size in Algood is 2.6 People.
What is the Average Household Size in Algood
Average Household Size in Algood is 2.2 People.
What is Per Capita Income in Algood?
Per Capita income in Algood is $21,595.
What is the Median Family Income in Algood?
Median Family Income in Algood is $39,568.
What is the Median Household income in Algood?
Median Household Income in Algood is $38,792.
What is Income or Wage Gap in Algood?
Income or Wage Gap in Algood is 31.0%.
Women in Algood earn 69.0 cents for every dollar earned by a man.
What is Inequality or Gini Index in Algood?
Inequality or Gini Index in Algood is 0.43.
How Large is the Labor Force in Algood?
There are 1,955 People in the Labor Forcein in Algood.
What is the Percentage of People in the Labor Force in Algood?
64.0% of People are in the Labor Force in Algood.
What is the Unemployment Rate in Algood?
Unemployment Rate in Algood is 0.9%.