Greeneville, TN
Greeneville Map
Greeneville Overview
15,458
TOTAL POPULATION
7,394
MALE POPULATION
8,064
FEMALE POPULATION
91.69
MALES / 100 FEMALES
109.06
FEMALES / 100 MALES
41.9
MEDIAN AGE
3.2
AVG FAMILY SIZE
2.4
AVG HOUSEHOLD SIZE
$28,314
PER CAPITA INCOME
$61,673
AVG FAMILY INCOME
$46,473
AVG HOUSEHOLD INCOME
6.9%
WAGE / INCOME GAP [ % ]
93.1¢/ $1
WAGE / INCOME GAP [ $ ]
0.51
INEQUALITY / GINI INDEX
6,547
LABOR FORCE [ PEOPLE ]
51.6%
PERCENT IN LABOR FORCE
9.2%
UNEMPLOYMENT RATE
Greeneville Area Codes
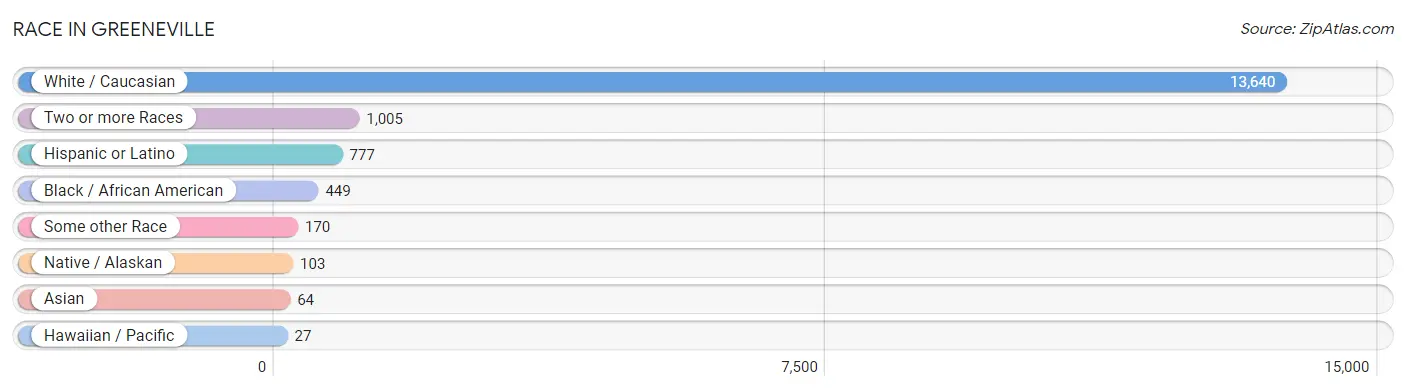
Race in Greeneville
The most populous races in Greeneville are White / Caucasian (13,640 | 88.2%), Two or more Races (1,005 | 6.5%), and Hispanic or Latino (777 | 5.0%).
| Race | # Population | % Population |
| Asian | 64 | 0.4% |
| Black / African American | 449 | 2.9% |
| Hawaiian / Pacific | 27 | 0.2% |
| Hispanic or Latino | 777 | 5.0% |
| Native / Alaskan | 103 | 0.7% |
| White / Caucasian | 13,640 | 88.2% |
| Two or more Races | 1,005 | 6.5% |
| Some other Race | 170 | 1.1% |
| Total | 15,458 | 100.0% |
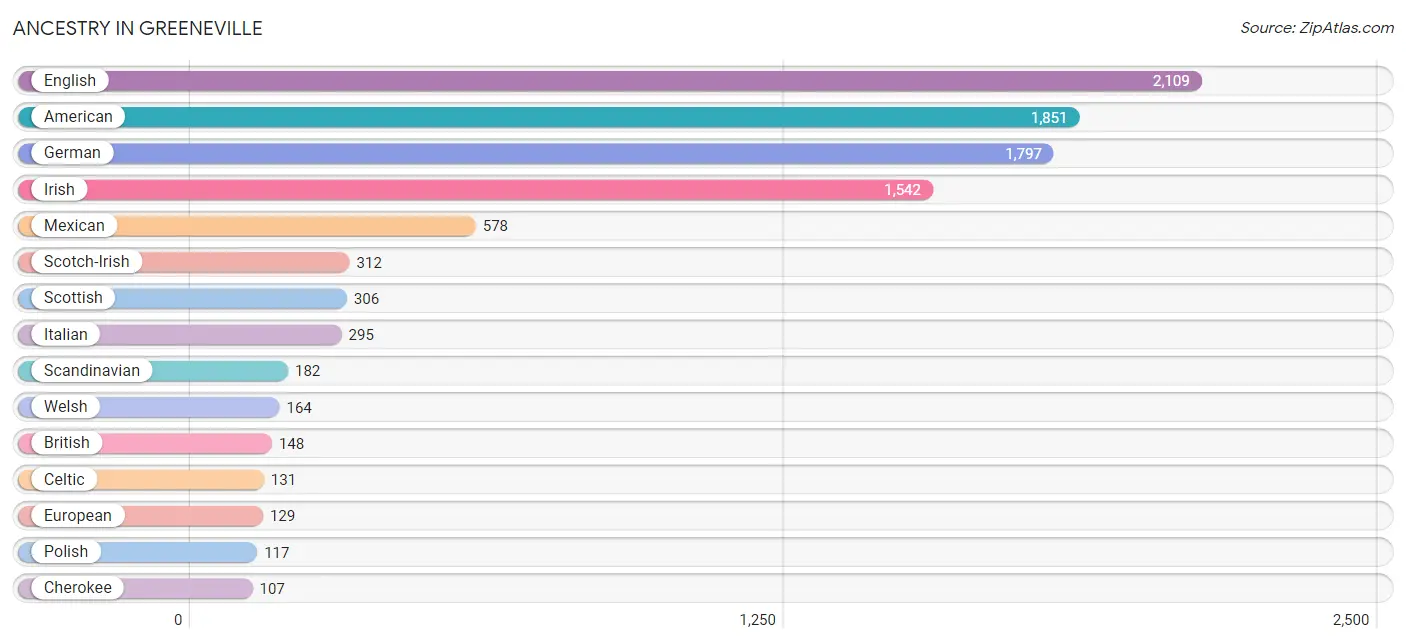
Ancestry in Greeneville
The most populous ancestries reported in Greeneville are English (2,109 | 13.6%), American (1,851 | 12.0%), German (1,797 | 11.6%), Irish (1,542 | 10.0%), and Mexican (578 | 3.7%), together accounting for 51.0% of all Greeneville residents.
| Ancestry | # Population | % Population |
| African | 47 | 0.3% |
| American | 1,851 | 12.0% |
| Apache | 5 | 0.0% |
| Austrian | 15 | 0.1% |
| British | 148 | 1.0% |
| Burmese | 29 | 0.2% |
| Canadian | 17 | 0.1% |
| Celtic | 131 | 0.9% |
| Central American | 36 | 0.2% |
| Central American Indian | 35 | 0.2% |
| Cherokee | 107 | 0.7% |
| Cuban | 26 | 0.2% |
| Czech | 17 | 0.1% |
| Dutch | 82 | 0.5% |
| English | 2,109 | 13.6% |
| Ethiopian | 33 | 0.2% |
| European | 129 | 0.8% |
| Filipino | 10 | 0.1% |
| French | 57 | 0.4% |
| French Canadian | 48 | 0.3% |
| German | 1,797 | 11.6% |
| Greek | 33 | 0.2% |
| Guatemalan | 36 | 0.2% |
| Hungarian | 17 | 0.1% |
| Indian (Asian) | 23 | 0.2% |
| Irish | 1,542 | 10.0% |
| Iroquois | 4 | 0.0% |
| Italian | 295 | 1.9% |
| Jamaican | 47 | 0.3% |
| Korean | 31 | 0.2% |
| Lithuanian | 26 | 0.2% |
| Mexican | 578 | 3.7% |
| Norwegian | 45 | 0.3% |
| Polish | 117 | 0.8% |
| Portuguese | 53 | 0.3% |
| Puerto Rican | 76 | 0.5% |
| Scandinavian | 182 | 1.2% |
| Scotch-Irish | 312 | 2.0% |
| Scottish | 306 | 2.0% |
| Spanish | 15 | 0.1% |
| Sri Lankan | 93 | 0.6% |
| Subsaharan African | 80 | 0.5% |
| Swedish | 20 | 0.1% |
| Ukrainian | 14 | 0.1% |
| Welsh | 164 | 1.1% | View All 45 Rows |
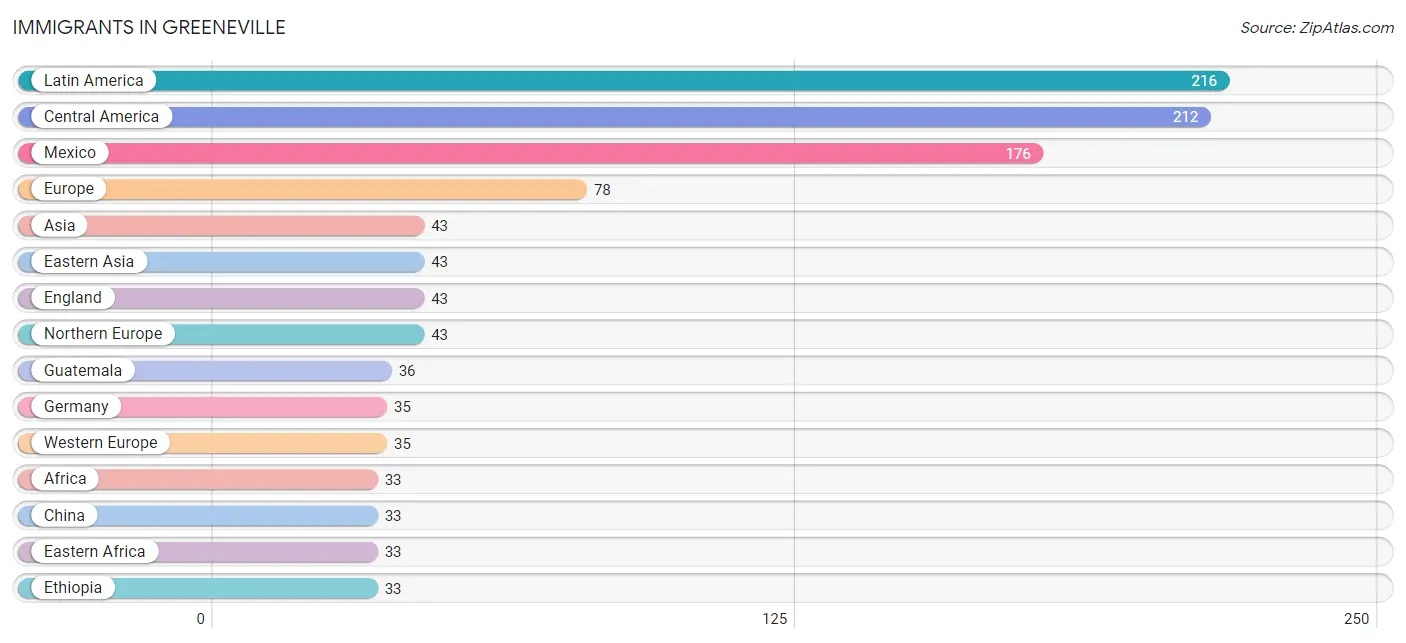
Immigrants in Greeneville
The most numerous immigrant groups reported in Greeneville came from Latin America (216 | 1.4%), Central America (212 | 1.4%), Mexico (176 | 1.1%), Europe (78 | 0.5%), and Asia (43 | 0.3%), together accounting for 4.7% of all Greeneville residents.
| Immigration Origin | # Population | % Population |
| Africa | 33 | 0.2% |
| Asia | 43 | 0.3% |
| Central America | 212 | 1.4% |
| China | 33 | 0.2% |
| Eastern Africa | 33 | 0.2% |
| Eastern Asia | 43 | 0.3% |
| England | 43 | 0.3% |
| Ethiopia | 33 | 0.2% |
| Europe | 78 | 0.5% |
| Germany | 35 | 0.2% |
| Guatemala | 36 | 0.2% |
| Korea | 10 | 0.1% |
| Latin America | 216 | 1.4% |
| Mexico | 176 | 1.1% |
| Northern Europe | 43 | 0.3% |
| South America | 4 | 0.0% |
| Taiwan | 10 | 0.1% |
| Western Europe | 35 | 0.2% | View All 18 Rows |
Sex and Age in Greeneville
Sex and Age in Greeneville
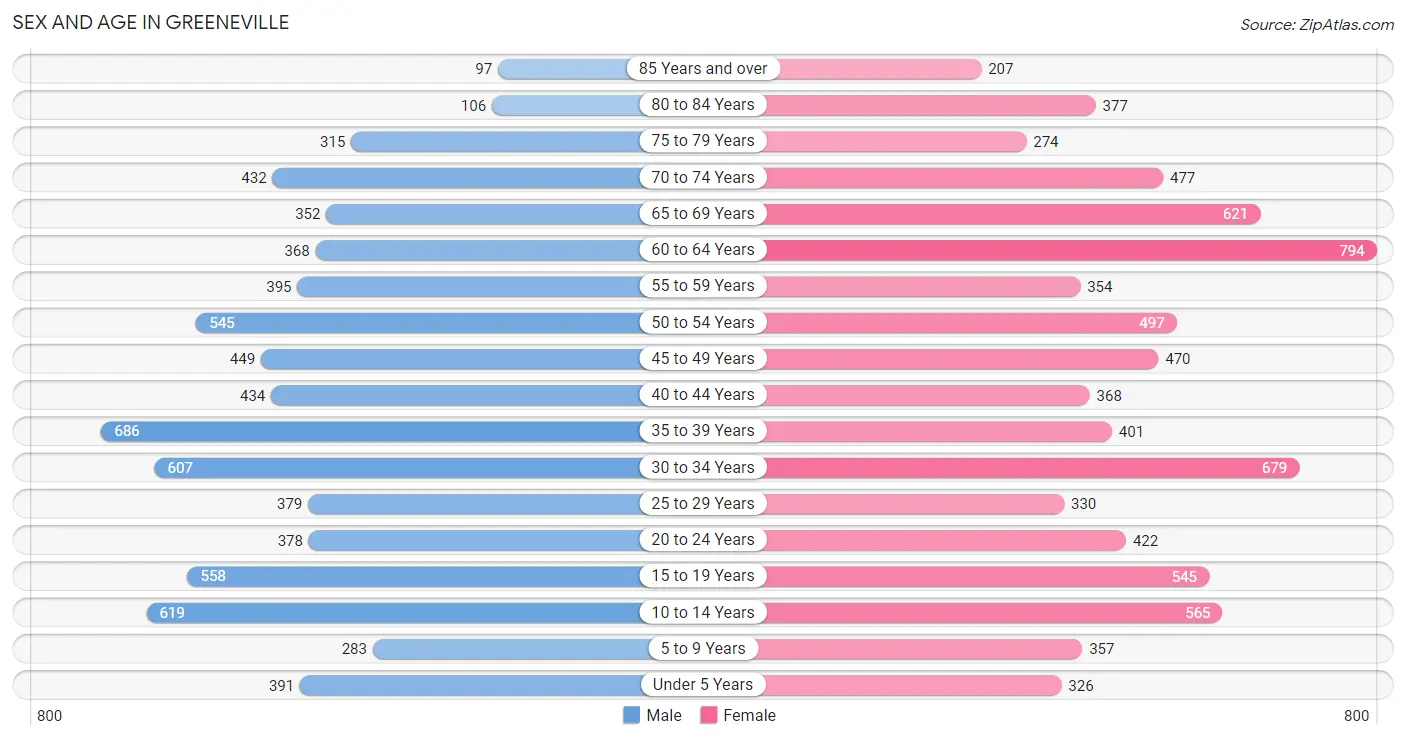
The most populous age groups in Greeneville are 35 to 39 Years (686 | 9.3%) for men and 60 to 64 Years (794 | 9.9%) for women.
| Age Bracket | Male | Female |
| Under 5 Years | 391 (5.3%) | 326 (4.0%) |
| 5 to 9 Years | 283 (3.8%) | 357 (4.4%) |
| 10 to 14 Years | 619 (8.4%) | 565 (7.0%) |
| 15 to 19 Years | 558 (7.5%) | 545 (6.8%) |
| 20 to 24 Years | 378 (5.1%) | 422 (5.2%) |
| 25 to 29 Years | 379 (5.1%) | 330 (4.1%) |
| 30 to 34 Years | 607 (8.2%) | 679 (8.4%) |
| 35 to 39 Years | 686 (9.3%) | 401 (5.0%) |
| 40 to 44 Years | 434 (5.9%) | 368 (4.6%) |
| 45 to 49 Years | 449 (6.1%) | 470 (5.8%) |
| 50 to 54 Years | 545 (7.4%) | 497 (6.2%) |
| 55 to 59 Years | 395 (5.3%) | 354 (4.4%) |
| 60 to 64 Years | 368 (5.0%) | 794 (9.9%) |
| 65 to 69 Years | 352 (4.8%) | 621 (7.7%) |
| 70 to 74 Years | 432 (5.8%) | 477 (5.9%) |
| 75 to 79 Years | 315 (4.3%) | 274 (3.4%) |
| 80 to 84 Years | 106 (1.4%) | 377 (4.7%) |
| 85 Years and over | 97 (1.3%) | 207 (2.6%) |
| Total | 7,394 (100.0%) | 8,064 (100.0%) |
Families and Households in Greeneville
Median Family Size in Greeneville
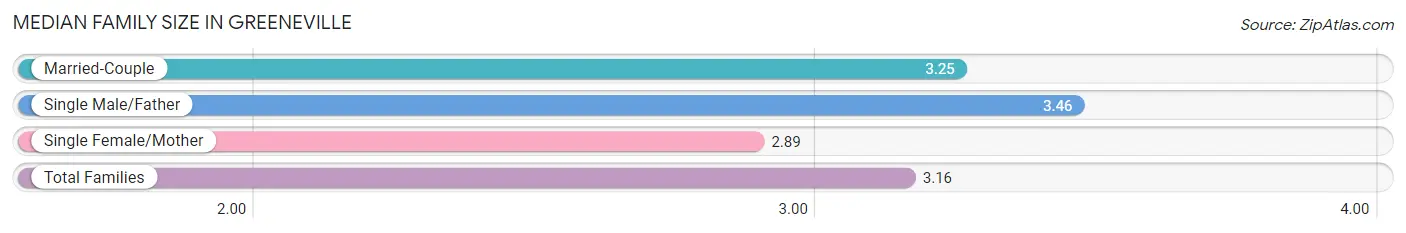
The median family size in Greeneville is 3.16 persons per family, with single male/father families (293 | 8.4%) accounting for the largest median family size of 3.46 persons per family. On the other hand, single female/mother families (1,020 | 29.1%) represent the smallest median family size with 2.89 persons per family.
| Family Type | # Families | Family Size |
| Married-Couple | 2,190 (62.5%) | 3.25 |
| Single Male/Father | 293 (8.4%) | 3.46 |
| Single Female/Mother | 1,020 (29.1%) | 2.89 |
| Total Families | 3,503 (100.0%) | 3.16 |
Median Household Size in Greeneville
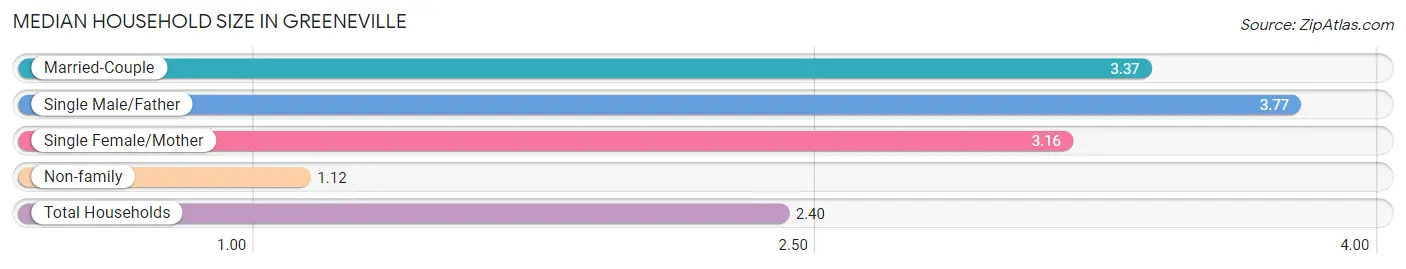
The median household size in Greeneville is 2.40 persons per household, with single male/father households (293 | 4.8%) accounting for the largest median household size of 3.77 persons per household. non-family households (2,573 | 42.3%) represent the smallest median household size with 1.12 persons per household.
| Household Type | # Households | Household Size |
| Married-Couple | 2,190 (36.0%) | 3.37 |
| Single Male/Father | 293 (4.8%) | 3.77 |
| Single Female/Mother | 1,020 (16.8%) | 3.16 |
| Non-family | 2,573 (42.3%) | 1.12 |
| Total Households | 6,076 (100.0%) | 2.40 |
Household Size by Marriage Status in Greeneville
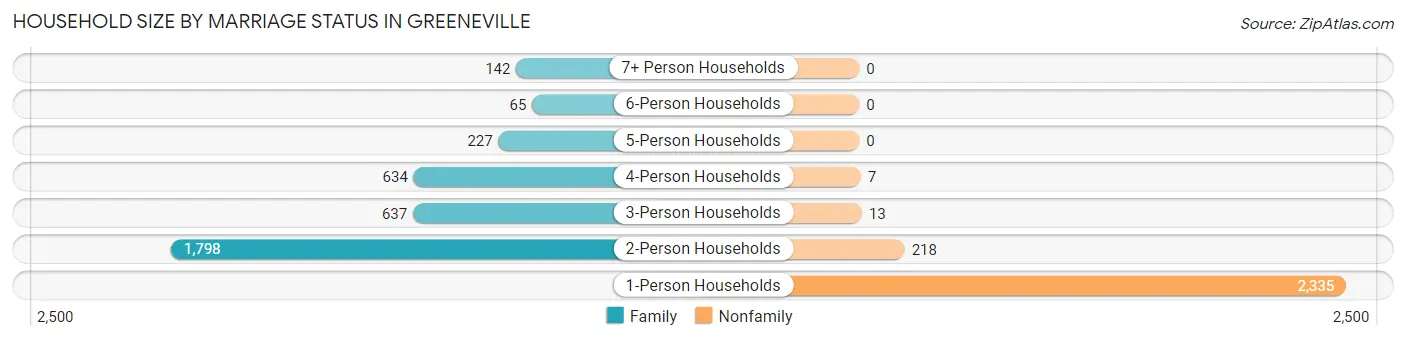
Out of a total of 6,076 households in Greeneville, 3,503 (57.7%) are family households, while 2,573 (42.3%) are nonfamily households. The most numerous type of family households are 2-person households, comprising 1,798, and the most common type of nonfamily households are 1-person households, comprising 2,335.
| Household Size | Family Households | Nonfamily Households |
| 1-Person Households | - | 2,335 (38.4%) |
| 2-Person Households | 1,798 (29.6%) | 218 (3.6%) |
| 3-Person Households | 637 (10.5%) | 13 (0.2%) |
| 4-Person Households | 634 (10.4%) | 7 (0.1%) |
| 5-Person Households | 227 (3.7%) | 0 (0.0%) |
| 6-Person Households | 65 (1.1%) | 0 (0.0%) |
| 7+ Person Households | 142 (2.3%) | 0 (0.0%) |
| Total | 3,503 (57.7%) | 2,573 (42.3%) |
Female Fertility in Greeneville
Fertility by Age in Greeneville
Average fertility rate in Greeneville is 58.0 births per 1,000 women. Women in the age bracket of 15 to 19 years have the highest fertility rate with 147.0 births per 1,000 women. Women in the age bracket of 20 to 34 years acount for 59.2% of all women with births.
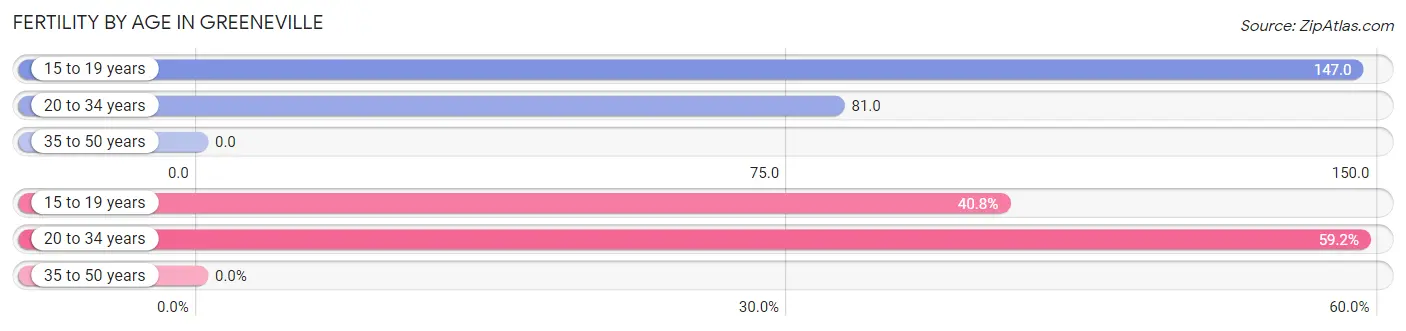
| Age Bracket | Women with Births | Births / 1,000 Women |
| 15 to 19 years | 80 (40.8%) | 147.0 |
| 20 to 34 years | 116 (59.2%) | 81.0 |
| 35 to 50 years | 0 (0.0%) | 0.0 |
| Total | 196 (100.0%) | 58.0 |
Fertility by Age by Marriage Status in Greeneville
43.4% of women with births (196) in Greeneville are married. The highest percentage of unmarried women with births falls into 15 to 19 years age bracket with 100.0% of them unmarried at the time of birth, while the lowest percentage of unmarried women with births belong to 20 to 34 years age bracket with 26.7% of them unmarried.
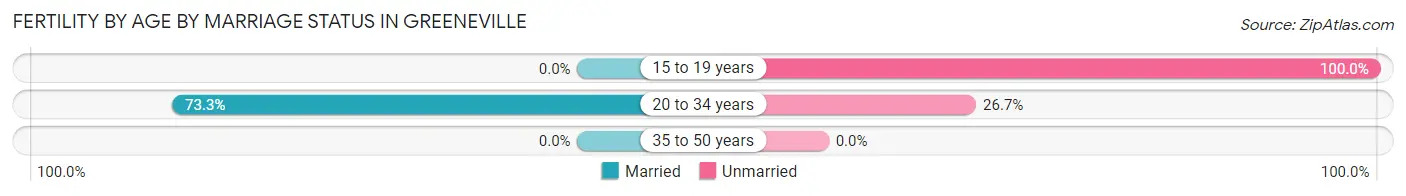
| Age Bracket | Married | Unmarried |
| 15 to 19 years | 0 (0.0%) | 80 (100.0%) |
| 20 to 34 years | 85 (73.3%) | 31 (26.7%) |
| 35 to 50 years | 0 (0.0%) | 0 (0.0%) |
| Total | 85 (43.4%) | 111 (56.6%) |
Fertility by Education in Greeneville
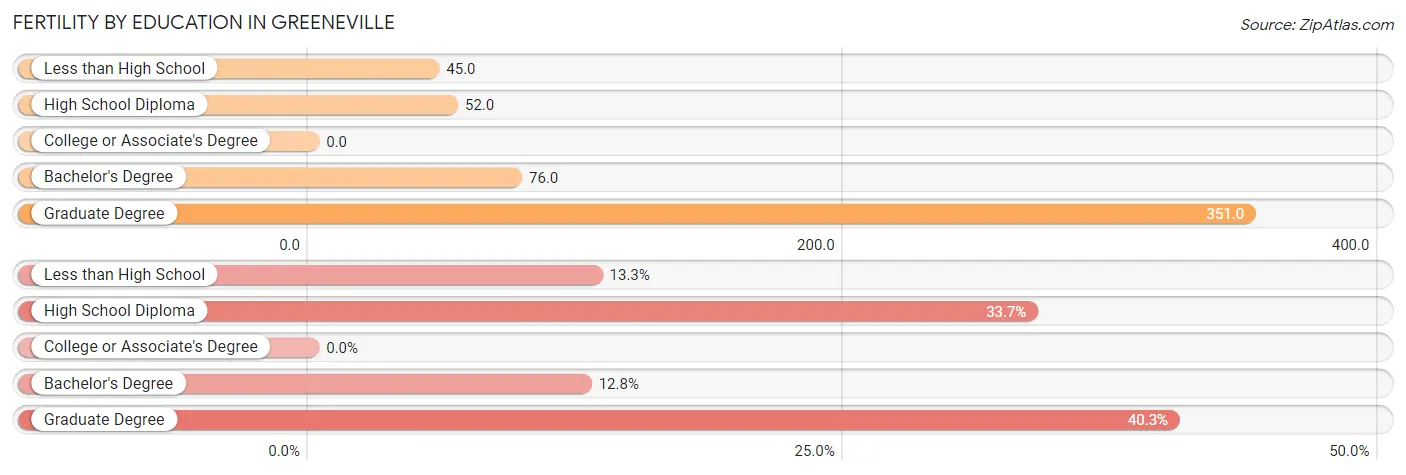
| Educational Attainment | Women with Births | Births / 1,000 Women |
| Less than High School | 26 (13.3%) | 45.0 |
| High School Diploma | 66 (33.7%) | 52.0 |
| College or Associate's Degree | 0 (0.0%) | 0.0 |
| Bachelor's Degree | 25 (12.8%) | 76.0 |
| Graduate Degree | 79 (40.3%) | 351.0 |
| Total | 196 (100.0%) | 58.0 |
Fertility by Education by Marriage Status in Greeneville
56.6% of women with births in Greeneville are unmarried. Women with the educational attainment of graduate degree are most likely to be married with 100.0% of them married at childbirth, while women with the educational attainment of less than high school are least likely to be married with 100.0% of them unmarried at childbirth.
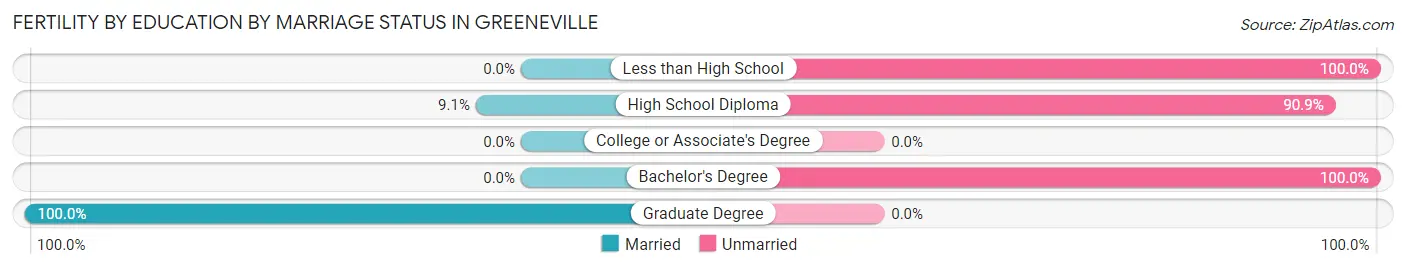
| Educational Attainment | Married | Unmarried |
| Less than High School | 0 (0.0%) | 26 (100.0%) |
| High School Diploma | 6 (9.1%) | 60 (90.9%) |
| College or Associate's Degree | 0 (0.0%) | 0 (0.0%) |
| Bachelor's Degree | 0 (0.0%) | 25 (100.0%) |
| Graduate Degree | 79 (100.0%) | 0 (0.0%) |
| Total | 85 (43.4%) | 111 (56.6%) |
Income in Greeneville
Income Overview in Greeneville
Per Capita Income in Greeneville is $28,314, while median incomes of families and households are $61,673 and $46,473 respectively.
| Characteristic | Number | Measure |
| Per Capita Income | 15,458 | $28,314 |
| Median Family Income | 3,503 | $61,673 |
| Mean Family Income | 3,503 | $88,988 |
| Median Household Income | 6,076 | $46,473 |
| Mean Household Income | 6,076 | $66,910 |
| Income Deficit | 3,503 | $0 |
| Wage / Income Gap (%) | 15,458 | 6.87% |
| Wage / Income Gap ($) | 15,458 | 93.13¢ per $1 |
| Gini / Inequality Index | 15,458 | 0.51 |
Earnings by Sex in Greeneville
Average Earnings in Greeneville are $34,311, $35,509 for men and $33,069 for women, a difference of 6.9%.
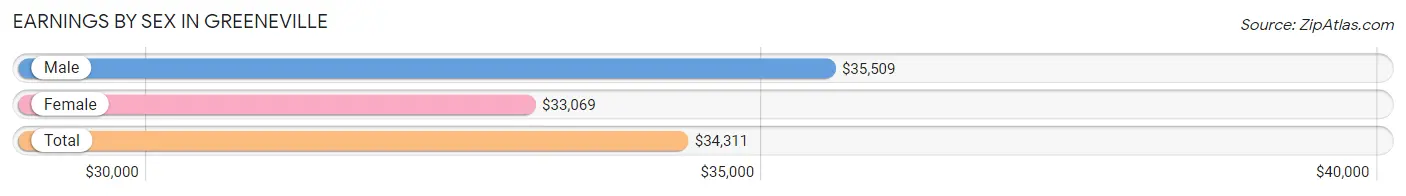
| Sex | Number | Average Earnings |
| Male | 3,677 (52.3%) | $35,509 |
| Female | 3,355 (47.7%) | $33,069 |
| Total | 7,032 (100.0%) | $34,311 |
Earnings by Sex by Income Bracket in Greeneville
The most common earnings brackets in Greeneville are $55,000 to $64,999 for men (392 | 10.7%) and $30,000 to $34,999 for women (376 | 11.2%).
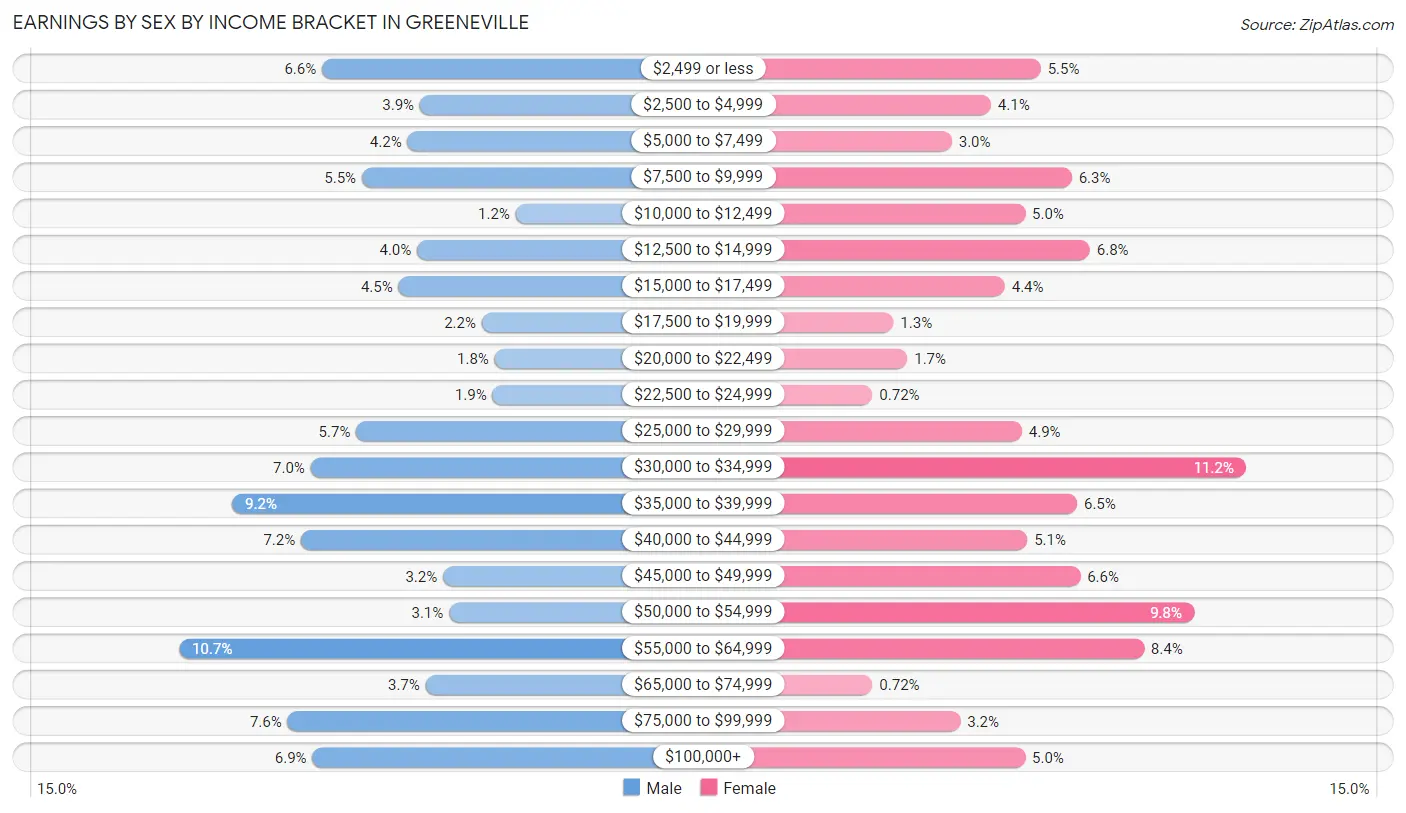
| Income | Male | Female |
| $2,499 or less | 244 (6.6%) | 183 (5.4%) |
| $2,500 to $4,999 | 143 (3.9%) | 136 (4.1%) |
| $5,000 to $7,499 | 156 (4.2%) | 99 (2.9%) |
| $7,500 to $9,999 | 203 (5.5%) | 212 (6.3%) |
| $10,000 to $12,499 | 44 (1.2%) | 168 (5.0%) |
| $12,500 to $14,999 | 146 (4.0%) | 229 (6.8%) |
| $15,000 to $17,499 | 165 (4.5%) | 149 (4.4%) |
| $17,500 to $19,999 | 79 (2.1%) | 44 (1.3%) |
| $20,000 to $22,499 | 66 (1.8%) | 57 (1.7%) |
| $22,500 to $24,999 | 68 (1.8%) | 24 (0.7%) |
| $25,000 to $29,999 | 209 (5.7%) | 165 (4.9%) |
| $30,000 to $34,999 | 256 (7.0%) | 376 (11.2%) |
| $35,000 to $39,999 | 337 (9.2%) | 217 (6.5%) |
| $40,000 to $44,999 | 266 (7.2%) | 170 (5.1%) |
| $45,000 to $49,999 | 119 (3.2%) | 220 (6.6%) |
| $50,000 to $54,999 | 113 (3.1%) | 327 (9.8%) |
| $55,000 to $64,999 | 392 (10.7%) | 280 (8.4%) |
| $65,000 to $74,999 | 137 (3.7%) | 24 (0.7%) |
| $75,000 to $99,999 | 280 (7.6%) | 107 (3.2%) |
| $100,000+ | 254 (6.9%) | 168 (5.0%) |
| Total | 3,677 (100.0%) | 3,355 (100.0%) |
Earnings by Sex by Educational Attainment in Greeneville
Average earnings in Greeneville are $36,918 for men and $37,762 for women, a difference of 2.2%. Men with an educational attainment of graduate degree enjoy the highest average annual earnings of $64,519, while those with high school diploma education earn the least with $29,919. Women with an educational attainment of graduate degree earn the most with the average annual earnings of $103,182, while those with high school diploma education have the smallest earnings of $31,313.
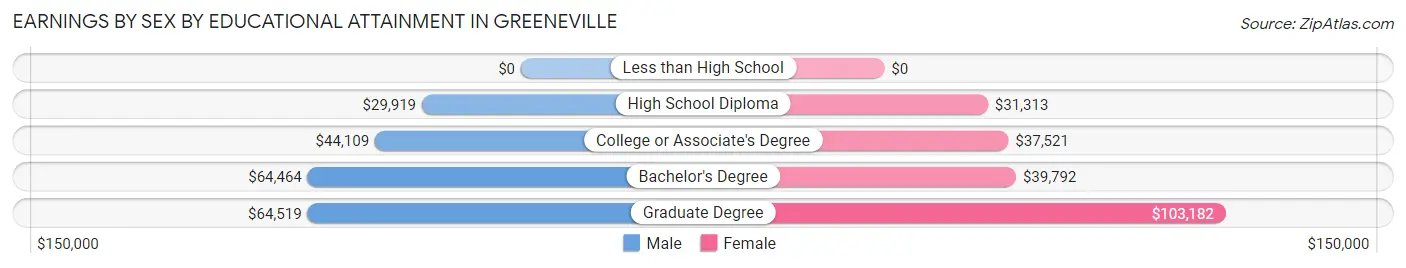
| Educational Attainment | Male Income | Female Income |
| Less than High School | - | - |
| High School Diploma | $29,919 | $31,313 |
| College or Associate's Degree | $44,109 | $37,521 |
| Bachelor's Degree | $64,464 | $39,792 |
| Graduate Degree | $64,519 | $103,182 |
| Total | $36,918 | $37,762 |
Family Income in Greeneville
Family Income Brackets in Greeneville
According to the Greeneville family income data, there are 631 families falling into the $35,000 to $49,999 income range, which is the most common income bracket and makes up 18.0% of all families. Conversely, the $10,000 to $14,999 income bracket is the least frequent group with only 123 families (3.5%) belonging to this category.
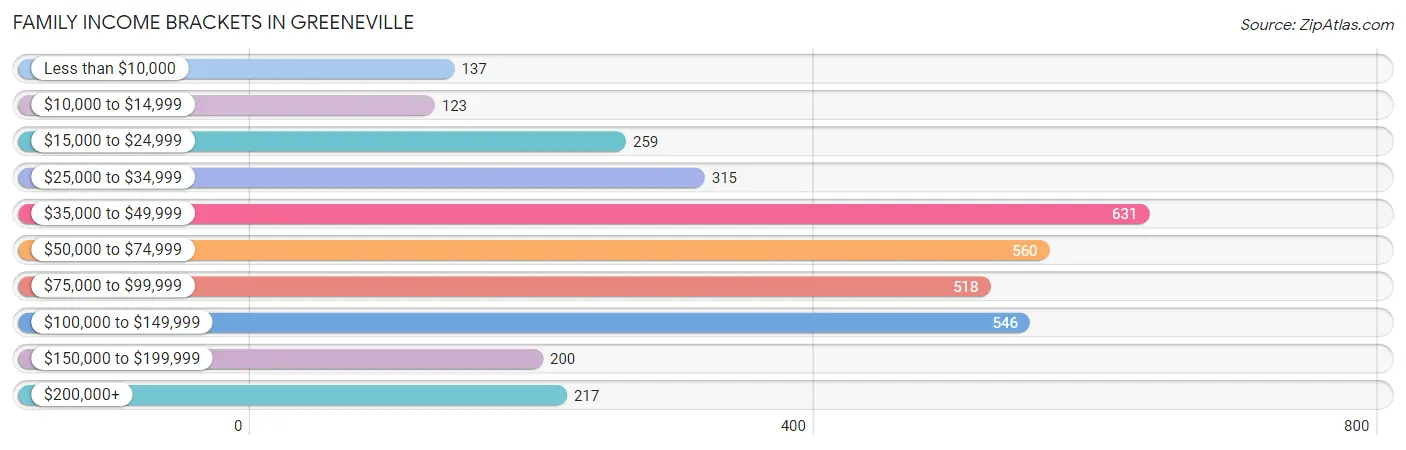
| Income Bracket | # Families | % Families |
| Less than $10,000 | 137 | 3.9% |
| $10,000 to $14,999 | 123 | 3.5% |
| $15,000 to $24,999 | 259 | 7.4% |
| $25,000 to $34,999 | 315 | 9.0% |
| $35,000 to $49,999 | 631 | 18.0% |
| $50,000 to $74,999 | 560 | 16.0% |
| $75,000 to $99,999 | 518 | 14.8% |
| $100,000 to $149,999 | 546 | 15.6% |
| $150,000 to $199,999 | 200 | 5.7% |
| $200,000+ | 217 | 6.2% |
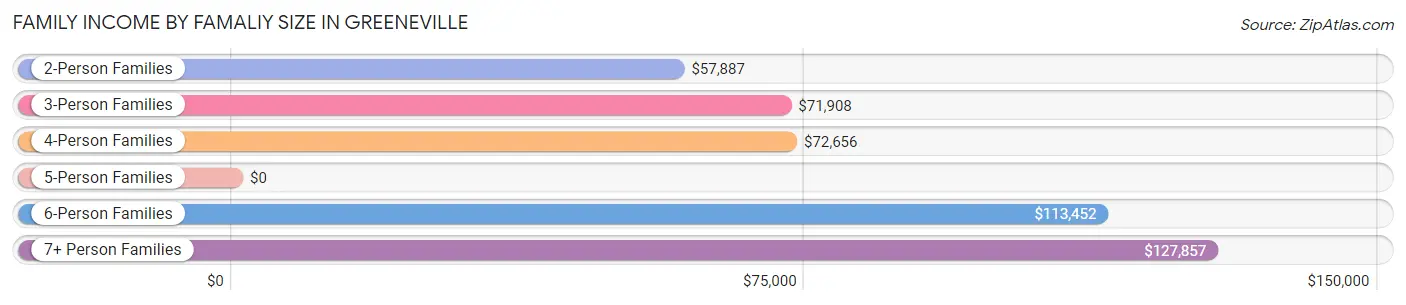
Family Income by Famaliy Size in Greeneville
7+ person families (80 | 2.3%) account for the highest median family income in Greeneville with $127,857 per family, while 2-person families (1,882 | 53.7%) have the highest median income of $28,944 per family member.
| Income Bracket | # Families | Median Income |
| 2-Person Families | 1,882 (53.7%) | $57,887 |
| 3-Person Families | 685 (19.6%) | $71,908 |
| 4-Person Families | 543 (15.5%) | $72,656 |
| 5-Person Families | 227 (6.5%) | $0 |
| 6-Person Families | 86 (2.5%) | $113,452 |
| 7+ Person Families | 80 (2.3%) | $127,857 |
| Total | 3,503 (100.0%) | $61,673 |
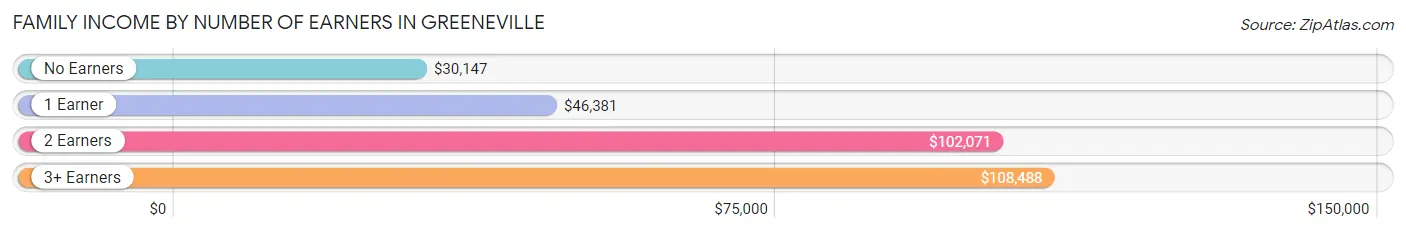
Family Income by Number of Earners in Greeneville
The median family income in Greeneville is $61,673, with families comprising 3+ earners (204) having the highest median family income of $108,488, while families with no earners (680) have the lowest median family income of $30,147, accounting for 5.8% and 19.4% of families, respectively.
| Number of Earners | # Families | Median Income |
| No Earners | 680 (19.4%) | $30,147 |
| 1 Earner | 1,463 (41.8%) | $46,381 |
| 2 Earners | 1,156 (33.0%) | $102,071 |
| 3+ Earners | 204 (5.8%) | $108,488 |
| Total | 3,503 (100.0%) | $61,673 |
Household Income in Greeneville
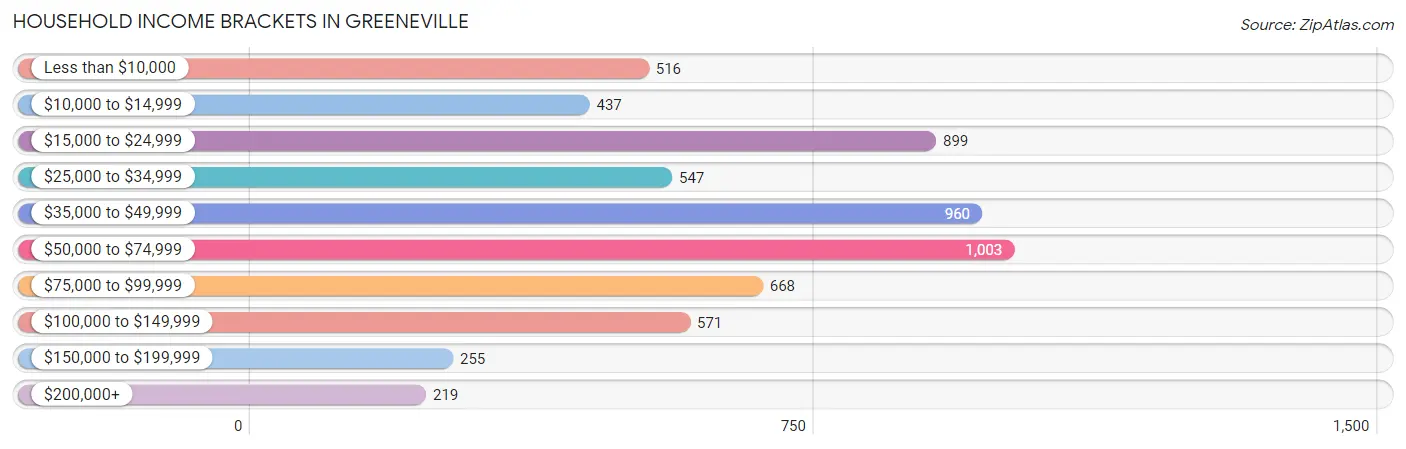
Household Income Brackets in Greeneville
With 1,003 households falling in the category, the $50,000 to $74,999 income range is the most frequent in Greeneville, accounting for 16.5% of all households. In contrast, only 219 households (3.6%) fall into the $200,000+ income bracket, making it the least populous group.
| Income Bracket | # Households | % Households |
| Less than $10,000 | 516 | 8.5% |
| $10,000 to $14,999 | 437 | 7.2% |
| $15,000 to $24,999 | 899 | 14.8% |
| $25,000 to $34,999 | 547 | 9.0% |
| $35,000 to $49,999 | 960 | 15.8% |
| $50,000 to $74,999 | 1,003 | 16.5% |
| $75,000 to $99,999 | 668 | 11.0% |
| $100,000 to $149,999 | 571 | 9.4% |
| $150,000 to $199,999 | 255 | 4.2% |
| $200,000+ | 219 | 3.6% |
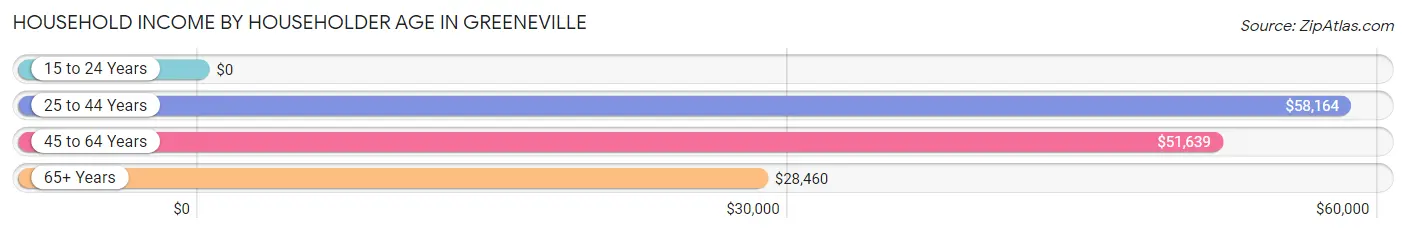
Household Income by Householder Age in Greeneville
The median household income in Greeneville is $46,473, with the highest median household income of $58,164 found in the 25 to 44 years age bracket for the primary householder. A total of 1,572 households (25.9%) fall into this category. Meanwhile, the 15 to 24 years age bracket for the primary householder has the lowest median household income of $0, with 181 households (3.0%) in this group.
| Income Bracket | # Households | Median Income |
| 15 to 24 Years | 181 (3.0%) | $0 |
| 25 to 44 Years | 1,572 (25.9%) | $58,164 |
| 45 to 64 Years | 2,221 (36.5%) | $51,639 |
| 65+ Years | 2,102 (34.6%) | $28,460 |
| Total | 6,076 (100.0%) | $46,473 |
Poverty in Greeneville
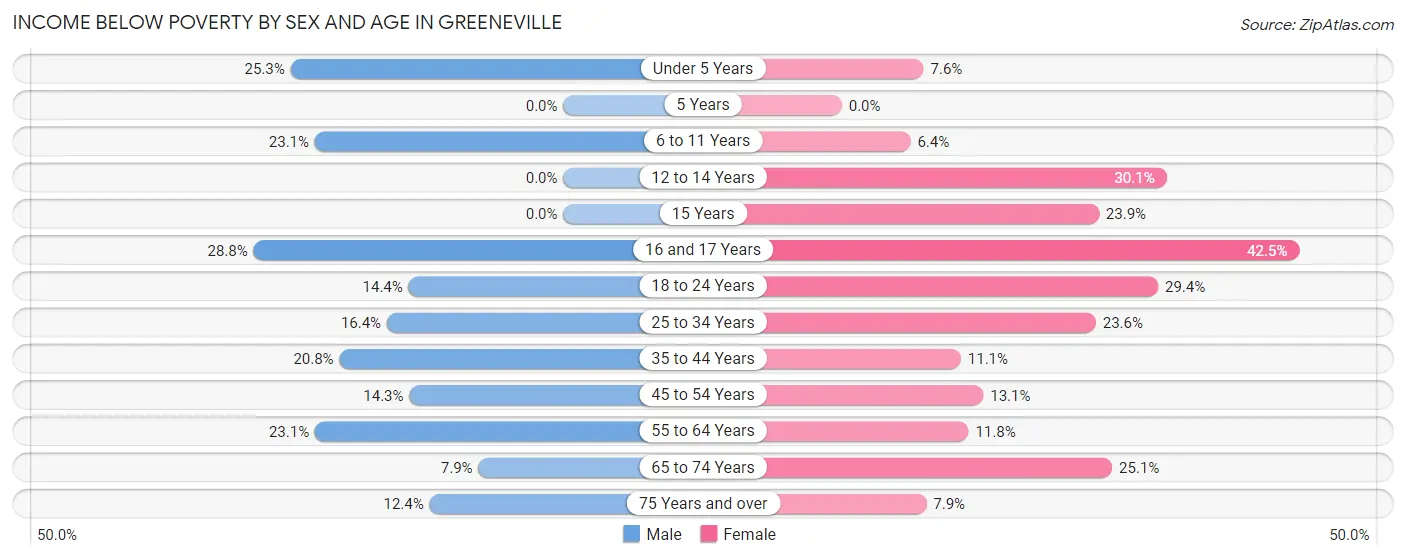
Income Below Poverty by Sex and Age in Greeneville
With 16.4% poverty level for males and 17.5% for females among the residents of Greeneville, 16 and 17 year old males and 16 and 17 year old females are the most vulnerable to poverty, with 94 males (28.7%) and 59 females (42.4%) in their respective age groups living below the poverty level.
| Age Bracket | Male | Female |
| Under 5 Years | 99 (25.3%) | 24 (7.6%) |
| 5 Years | 0 (0.0%) | 0 (0.0%) |
| 6 to 11 Years | 98 (23.1%) | 31 (6.4%) |
| 12 to 14 Years | 0 (0.0%) | 116 (30.1%) |
| 15 Years | 0 (0.0%) | 47 (23.9%) |
| 16 and 17 Years | 94 (28.7%) | 59 (42.4%) |
| 18 to 24 Years | 81 (14.4%) | 177 (29.3%) |
| 25 to 34 Years | 146 (16.4%) | 223 (23.6%) |
| 35 to 44 Years | 219 (20.8%) | 78 (11.1%) |
| 45 to 54 Years | 135 (14.3%) | 127 (13.1%) |
| 55 to 64 Years | 168 (23.1%) | 135 (11.8%) |
| 65 to 74 Years | 58 (7.9%) | 268 (25.1%) |
| 75 Years and over | 56 (12.4%) | 52 (7.9%) |
| Total | 1,154 (16.4%) | 1,337 (17.5%) |
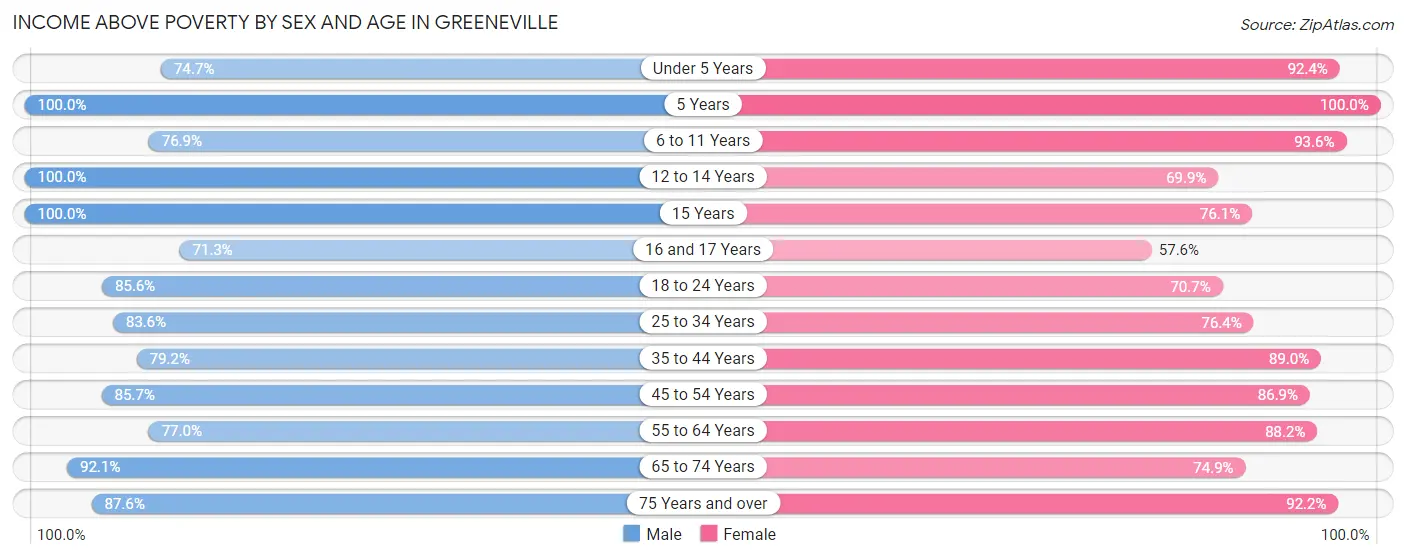
Income Above Poverty by Sex and Age in Greeneville
According to the poverty statistics in Greeneville, males aged 5 years and females aged 5 years are the age groups that are most secure financially, with 100.0% of males and 100.0% of females in these age groups living above the poverty line.
| Age Bracket | Male | Female |
| Under 5 Years | 292 (74.7%) | 292 (92.4%) |
| 5 Years | 76 (100.0%) | 31 (100.0%) |
| 6 to 11 Years | 327 (76.9%) | 456 (93.6%) |
| 12 to 14 Years | 401 (100.0%) | 269 (69.9%) |
| 15 Years | 28 (100.0%) | 150 (76.1%) |
| 16 and 17 Years | 233 (71.3%) | 80 (57.6%) |
| 18 to 24 Years | 483 (85.6%) | 426 (70.7%) |
| 25 to 34 Years | 746 (83.6%) | 723 (76.4%) |
| 35 to 44 Years | 835 (79.2%) | 628 (88.9%) |
| 45 to 54 Years | 810 (85.7%) | 840 (86.9%) |
| 55 to 64 Years | 561 (76.9%) | 1,013 (88.2%) |
| 65 to 74 Years | 678 (92.1%) | 800 (74.9%) |
| 75 Years and over | 395 (87.6%) | 610 (92.1%) |
| Total | 5,865 (83.6%) | 6,318 (82.5%) |
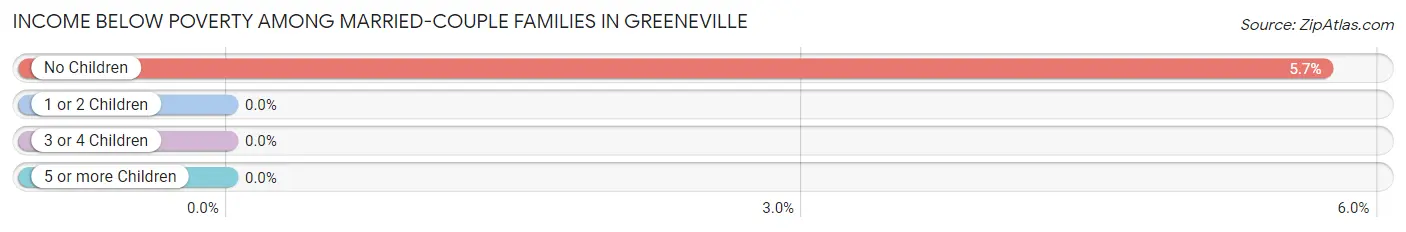
Income Below Poverty Among Married-Couple Families in Greeneville
The poverty statistics for married-couple families in Greeneville show that 3.5% or 76 of the total 2,190 families live below the poverty line. Families with no children have the highest poverty rate of 5.7%, comprising of 76 families. On the other hand, families with 1 or 2 children have the lowest poverty rate of 0.0%, which includes 0 families.
| Children | Above Poverty | Below Poverty |
| No Children | 1,252 (94.3%) | 76 (5.7%) |
| 1 or 2 Children | 561 (100.0%) | 0 (0.0%) |
| 3 or 4 Children | 301 (100.0%) | 0 (0.0%) |
| 5 or more Children | 0 (0.0%) | 0 (0.0%) |
| Total | 2,114 (96.5%) | 76 (3.5%) |
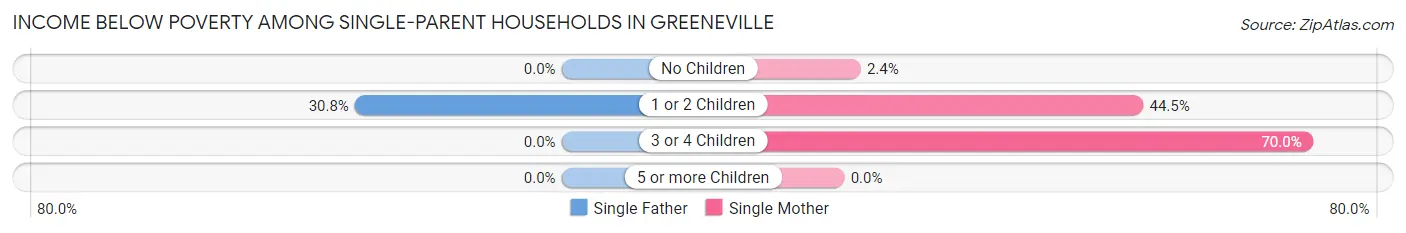
Income Below Poverty Among Single-Parent Households in Greeneville
According to the poverty data in Greeneville, 22.2% or 65 single-father households and 28.6% or 292 single-mother households are living below the poverty line. Among single-father households, those with 1 or 2 children have the highest poverty rate, with 65 households (30.8%) experiencing poverty. Likewise, among single-mother households, those with 3 or 4 children have the highest poverty rate, with 77 households (70.0%) falling below the poverty line.
| Children | Single Father | Single Mother |
| No Children | 0 (0.0%) | 11 (2.4%) |
| 1 or 2 Children | 65 (30.8%) | 204 (44.5%) |
| 3 or 4 Children | 0 (0.0%) | 77 (70.0%) |
| 5 or more Children | 0 (0.0%) | 0 (0.0%) |
| Total | 65 (22.2%) | 292 (28.6%) |
Income Below Poverty Among Married-Couple vs Single-Parent Households in Greeneville
The poverty data for Greeneville shows that 76 of the married-couple family households (3.5%) and 357 of the single-parent households (27.2%) are living below the poverty level. Within the married-couple family households, those with no children have the highest poverty rate, with 76 households (5.7%) falling below the poverty line. Among the single-parent households, those with 3 or 4 children have the highest poverty rate, with 77 household (70.0%) living below poverty.
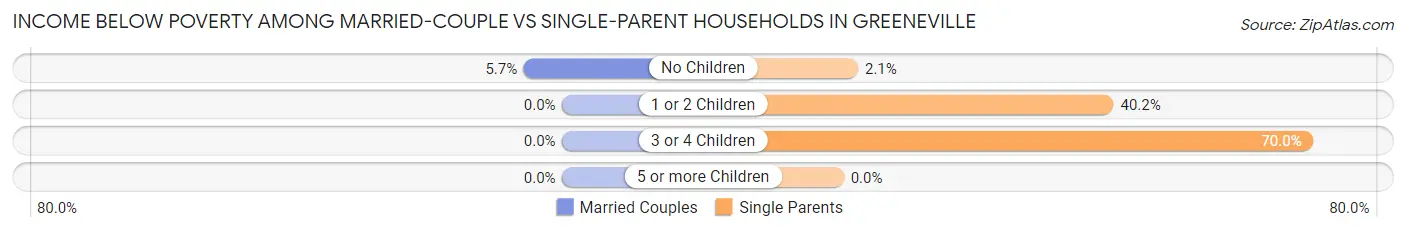
| Children | Married-Couple Families | Single-Parent Households |
| No Children | 76 (5.7%) | 11 (2.1%) |
| 1 or 2 Children | 0 (0.0%) | 269 (40.2%) |
| 3 or 4 Children | 0 (0.0%) | 77 (70.0%) |
| 5 or more Children | 0 (0.0%) | 0 (0.0%) |
| Total | 76 (3.5%) | 357 (27.2%) |
Employment Characteristics in Greeneville
Employment by Class of Employer in Greeneville
Among the 5,801 employed individuals in Greeneville, private company employees (4,242 | 73.1%), not-for-profit organizations (374 | 6.5%), and local government employees (333 | 5.7%) make up the most common classes of employment.
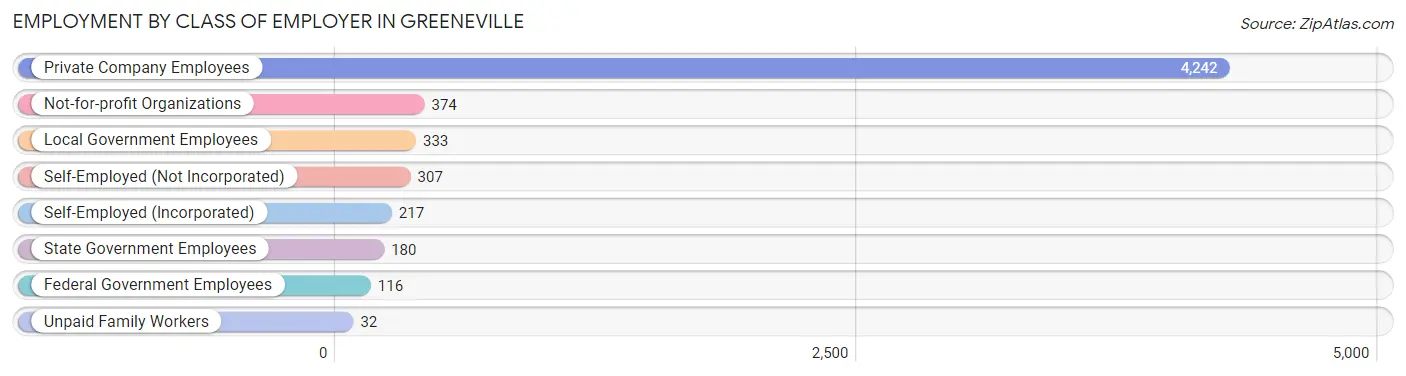
| Employer Class | # Employees | % Employees |
| Private Company Employees | 4,242 | 73.1% |
| Self-Employed (Incorporated) | 217 | 3.7% |
| Self-Employed (Not Incorporated) | 307 | 5.3% |
| Not-for-profit Organizations | 374 | 6.5% |
| Local Government Employees | 333 | 5.7% |
| State Government Employees | 180 | 3.1% |
| Federal Government Employees | 116 | 2.0% |
| Unpaid Family Workers | 32 | 0.5% |
| Total | 5,801 | 100.0% |
Employment Status by Age in Greeneville
According to the labor force statistics for Greeneville, out of the total population over 16 years of age (12,688), 51.6% or 6,547 individuals are in the labor force, with 9.2% or 602 of them unemployed. The age group with the highest labor force participation rate is 25 to 29 years, with 81.8% or 580 individuals in the labor force. Within the labor force, the 30 to 34 years age range has the highest percentage of unemployed individuals, with 25.0% or 239 of them being unemployed.
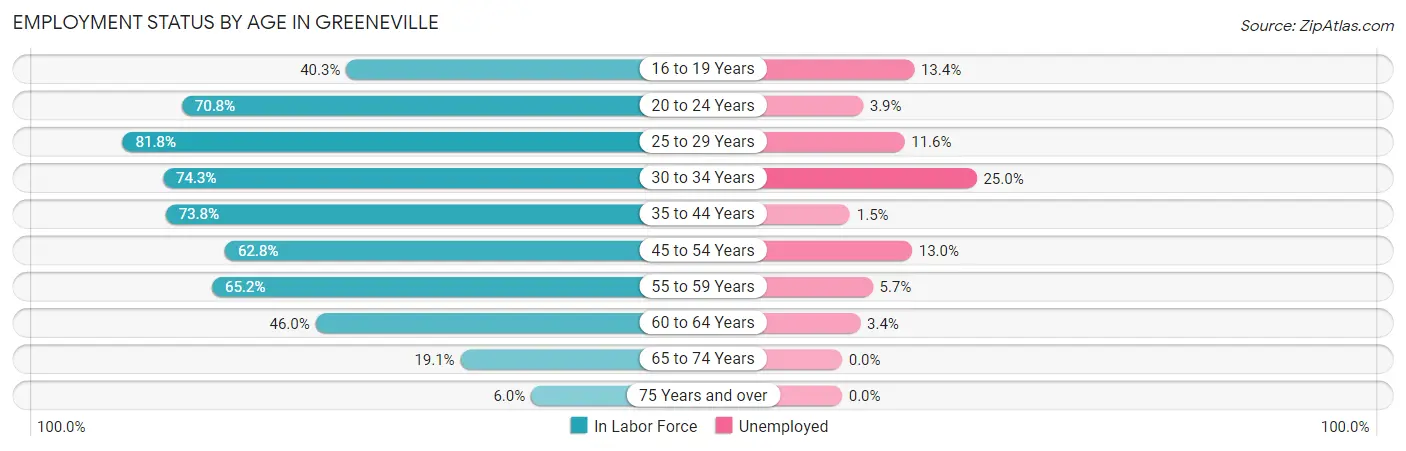
| Age Bracket | In Labor Force | Unemployed |
| 16 to 19 Years | 352 (40.3%) | 47 (13.4%) |
| 20 to 24 Years | 566 (70.8%) | 22 (3.9%) |
| 25 to 29 Years | 580 (81.8%) | 67 (11.6%) |
| 30 to 34 Years | 955 (74.3%) | 239 (25.0%) |
| 35 to 44 Years | 1,394 (73.8%) | 21 (1.5%) |
| 45 to 54 Years | 1,232 (62.8%) | 160 (13.0%) |
| 55 to 59 Years | 488 (65.2%) | 28 (5.7%) |
| 60 to 64 Years | 535 (46.0%) | 18 (3.4%) |
| 65 to 74 Years | 359 (19.1%) | 0 (0.0%) |
| 75 Years and over | 83 (6.0%) | 0 (0.0%) |
| Total | 6,547 (51.6%) | 602 (9.2%) |
Employment Status by Educational Attainment in Greeneville
According to labor force statistics for Greeneville, 66.8% of individuals (5,181) out of the total population between 25 and 64 years of age (7,756) are in the labor force, with 10.3% or 534 of them being unemployed. The group with the highest labor force participation rate are those with the educational attainment of bachelor's degree or higher, with 76.3% or 1,540 individuals in the labor force. Within the labor force, individuals with high school diploma education have the highest percentage of unemployment, with 19.2% or 402 of them being unemployed.
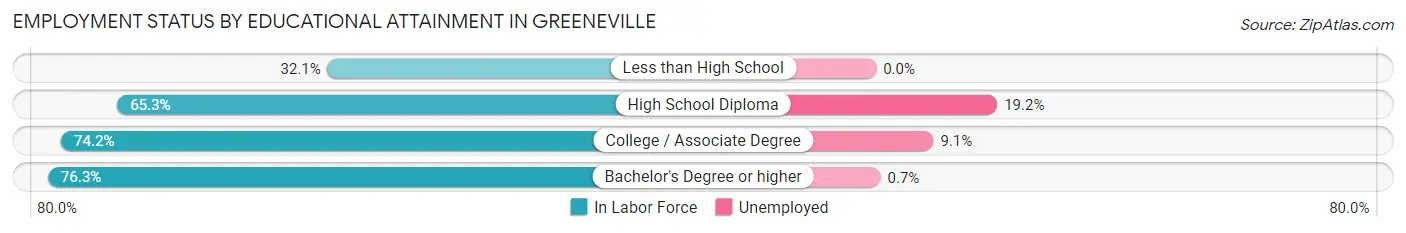
| Educational Attainment | In Labor Force | Unemployed |
| Less than High School | 250 (32.1%) | 0 (0.0%) |
| High School Diploma | 2,092 (65.3%) | 615 (19.2%) |
| College / Associate Degree | 1,301 (74.2%) | 160 (9.1%) |
| Bachelor's Degree or higher | 1,540 (76.3%) | 14 (0.7%) |
| Total | 5,181 (66.8%) | 799 (10.3%) |
Employment Occupations by Sex in Greeneville
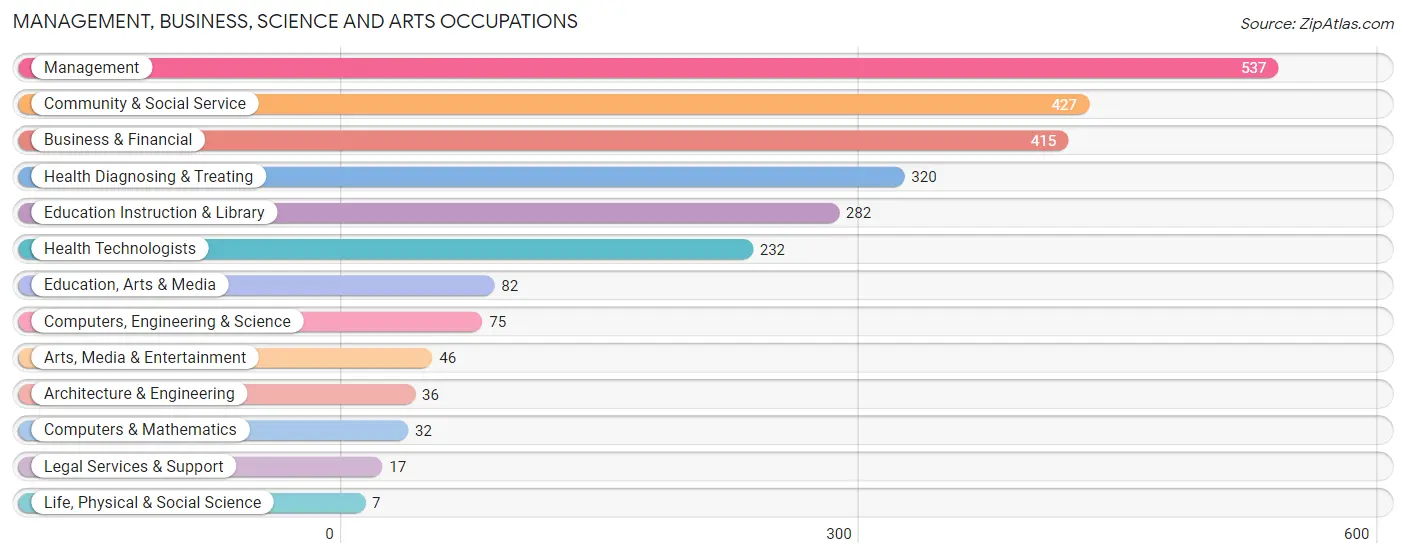
Management, Business, Science and Arts Occupations
The most common Management, Business, Science and Arts occupations in Greeneville are Management (537 | 9.1%), Community & Social Service (427 | 7.2%), Business & Financial (415 | 7.0%), Health Diagnosing & Treating (320 | 5.4%), and Education Instruction & Library (282 | 4.8%).
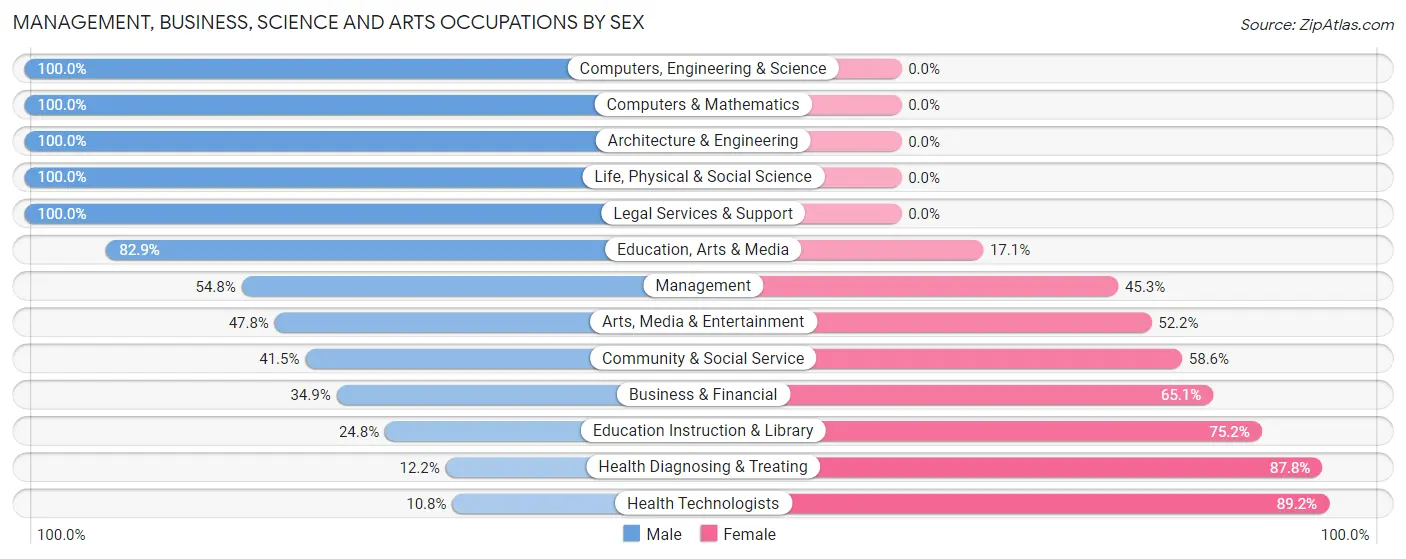
Management, Business, Science and Arts Occupations by Sex
Within the Management, Business, Science and Arts occupations in Greeneville, the most male-oriented occupations are Computers, Engineering & Science (100.0%), Computers & Mathematics (100.0%), and Architecture & Engineering (100.0%), while the most female-oriented occupations are Health Technologists (89.2%), Health Diagnosing & Treating (87.8%), and Education Instruction & Library (75.2%).
| Occupation | Male | Female |
| Management | 294 (54.7%) | 243 (45.3%) |
| Business & Financial | 145 (34.9%) | 270 (65.1%) |
| Computers, Engineering & Science | 75 (100.0%) | 0 (0.0%) |
| Computers & Mathematics | 32 (100.0%) | 0 (0.0%) |
| Architecture & Engineering | 36 (100.0%) | 0 (0.0%) |
| Life, Physical & Social Science | 7 (100.0%) | 0 (0.0%) |
| Community & Social Service | 177 (41.4%) | 250 (58.6%) |
| Education, Arts & Media | 68 (82.9%) | 14 (17.1%) |
| Legal Services & Support | 17 (100.0%) | 0 (0.0%) |
| Education Instruction & Library | 70 (24.8%) | 212 (75.2%) |
| Arts, Media & Entertainment | 22 (47.8%) | 24 (52.2%) |
| Health Diagnosing & Treating | 39 (12.2%) | 281 (87.8%) |
| Health Technologists | 25 (10.8%) | 207 (89.2%) |
| Total (Category) | 730 (41.1%) | 1,044 (58.9%) |
| Total (Overall) | 3,173 (53.5%) | 2,757 (46.5%) |
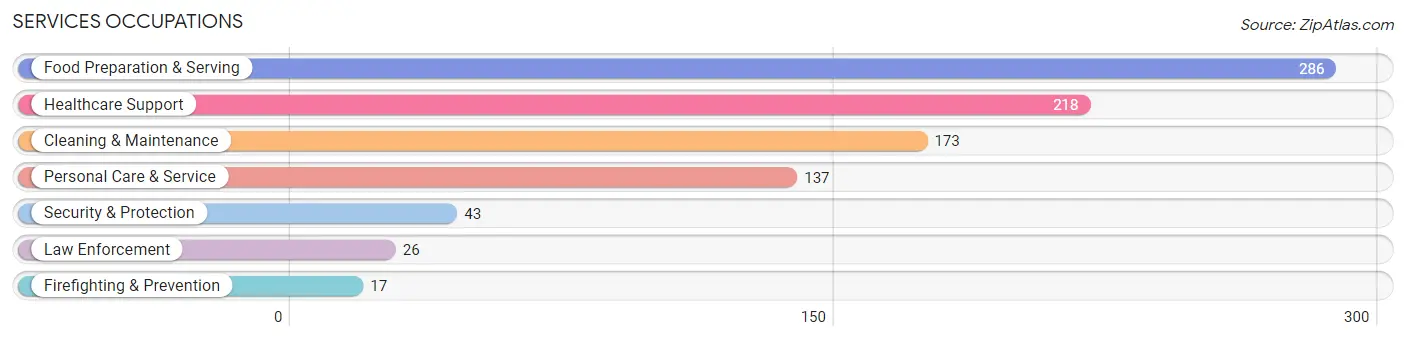
Services Occupations
The most common Services occupations in Greeneville are Food Preparation & Serving (286 | 4.8%), Healthcare Support (218 | 3.7%), Cleaning & Maintenance (173 | 2.9%), Personal Care & Service (137 | 2.3%), and Security & Protection (43 | 0.7%).
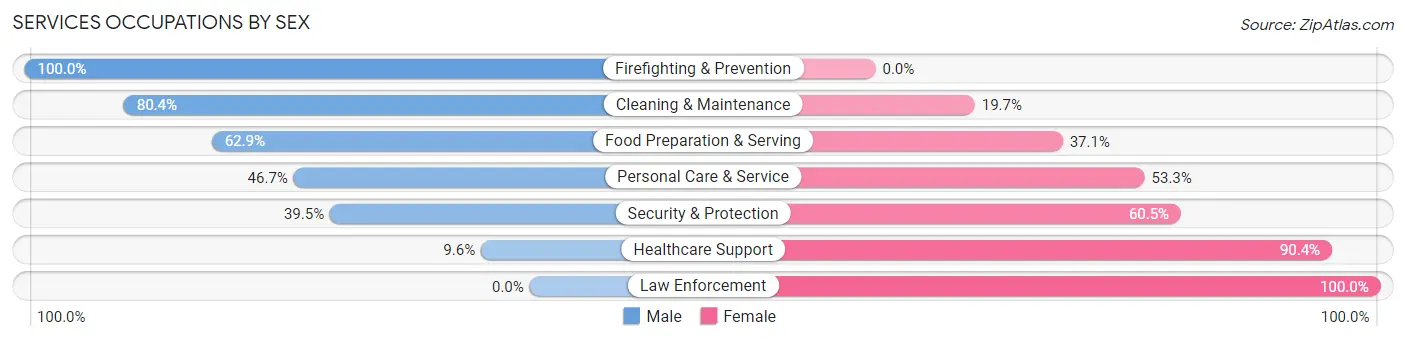
Services Occupations by Sex
Within the Services occupations in Greeneville, the most male-oriented occupations are Firefighting & Prevention (100.0%), Cleaning & Maintenance (80.3%), and Food Preparation & Serving (62.9%), while the most female-oriented occupations are Law Enforcement (100.0%), Healthcare Support (90.4%), and Security & Protection (60.5%).
| Occupation | Male | Female |
| Healthcare Support | 21 (9.6%) | 197 (90.4%) |
| Security & Protection | 17 (39.5%) | 26 (60.5%) |
| Firefighting & Prevention | 17 (100.0%) | 0 (0.0%) |
| Law Enforcement | 0 (0.0%) | 26 (100.0%) |
| Food Preparation & Serving | 180 (62.9%) | 106 (37.1%) |
| Cleaning & Maintenance | 139 (80.3%) | 34 (19.7%) |
| Personal Care & Service | 64 (46.7%) | 73 (53.3%) |
| Total (Category) | 421 (49.1%) | 436 (50.9%) |
| Total (Overall) | 3,173 (53.5%) | 2,757 (46.5%) |
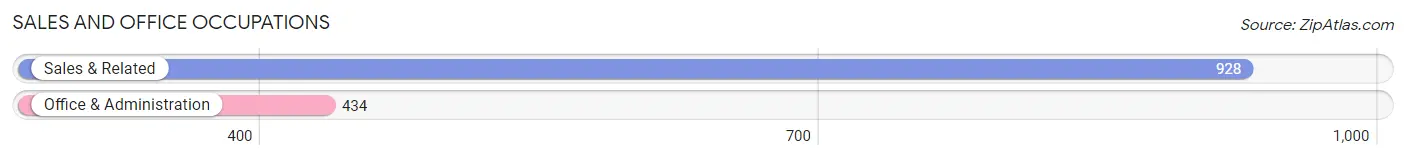
Sales and Office Occupations
The most common Sales and Office occupations in Greeneville are Sales & Related (928 | 15.7%), and Office & Administration (434 | 7.3%).
Sales and Office Occupations by Sex
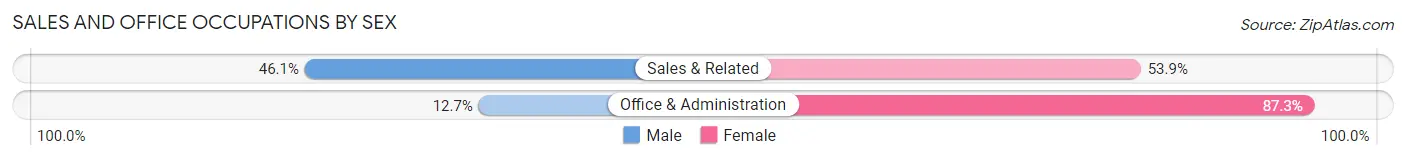
| Occupation | Male | Female |
| Sales & Related | 428 (46.1%) | 500 (53.9%) |
| Office & Administration | 55 (12.7%) | 379 (87.3%) |
| Total (Category) | 483 (35.5%) | 879 (64.5%) |
| Total (Overall) | 3,173 (53.5%) | 2,757 (46.5%) |
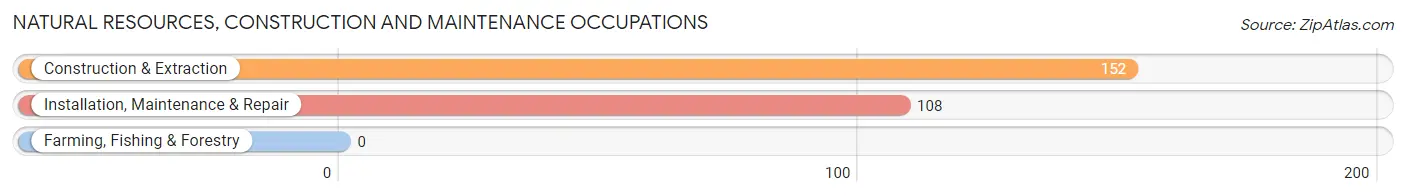
Natural Resources, Construction and Maintenance Occupations
The most common Natural Resources, Construction and Maintenance occupations in Greeneville are Construction & Extraction (152 | 2.6%), and Installation, Maintenance & Repair (108 | 1.8%).
Natural Resources, Construction and Maintenance Occupations by Sex
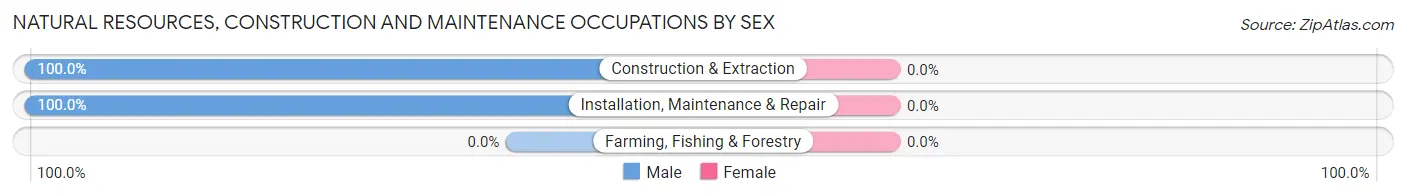
| Occupation | Male | Female |
| Farming, Fishing & Forestry | 0 (0.0%) | 0 (0.0%) |
| Construction & Extraction | 152 (100.0%) | 0 (0.0%) |
| Installation, Maintenance & Repair | 108 (100.0%) | 0 (0.0%) |
| Total (Category) | 260 (100.0%) | 0 (0.0%) |
| Total (Overall) | 3,173 (53.5%) | 2,757 (46.5%) |
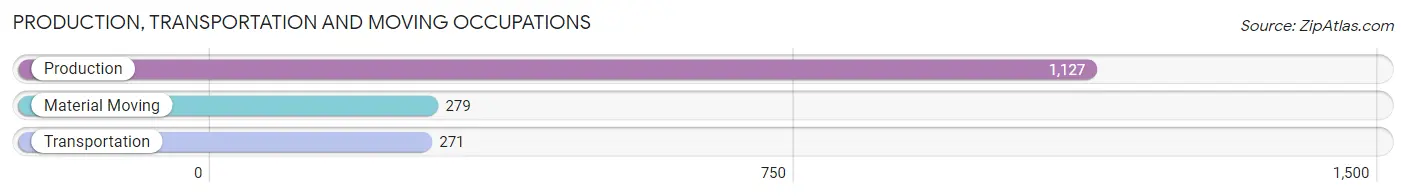
Production, Transportation and Moving Occupations
The most common Production, Transportation and Moving occupations in Greeneville are Production (1,127 | 19.0%), Material Moving (279 | 4.7%), and Transportation (271 | 4.6%).
Production, Transportation and Moving Occupations by Sex
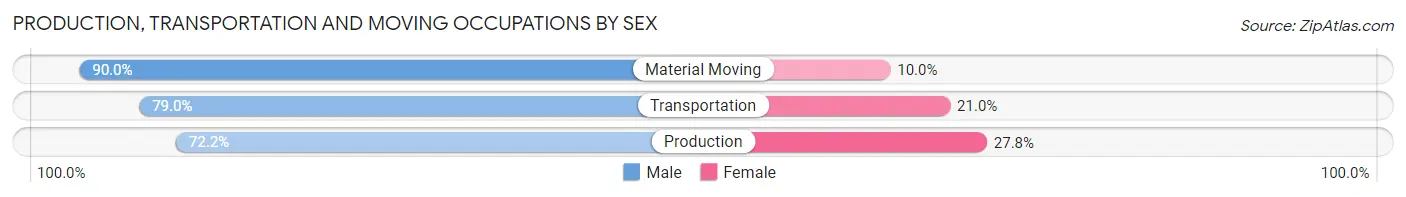
| Occupation | Male | Female |
| Production | 814 (72.2%) | 313 (27.8%) |
| Transportation | 214 (79.0%) | 57 (21.0%) |
| Material Moving | 251 (90.0%) | 28 (10.0%) |
| Total (Category) | 1,279 (76.3%) | 398 (23.7%) |
| Total (Overall) | 3,173 (53.5%) | 2,757 (46.5%) |
Employment Industries by Sex in Greeneville
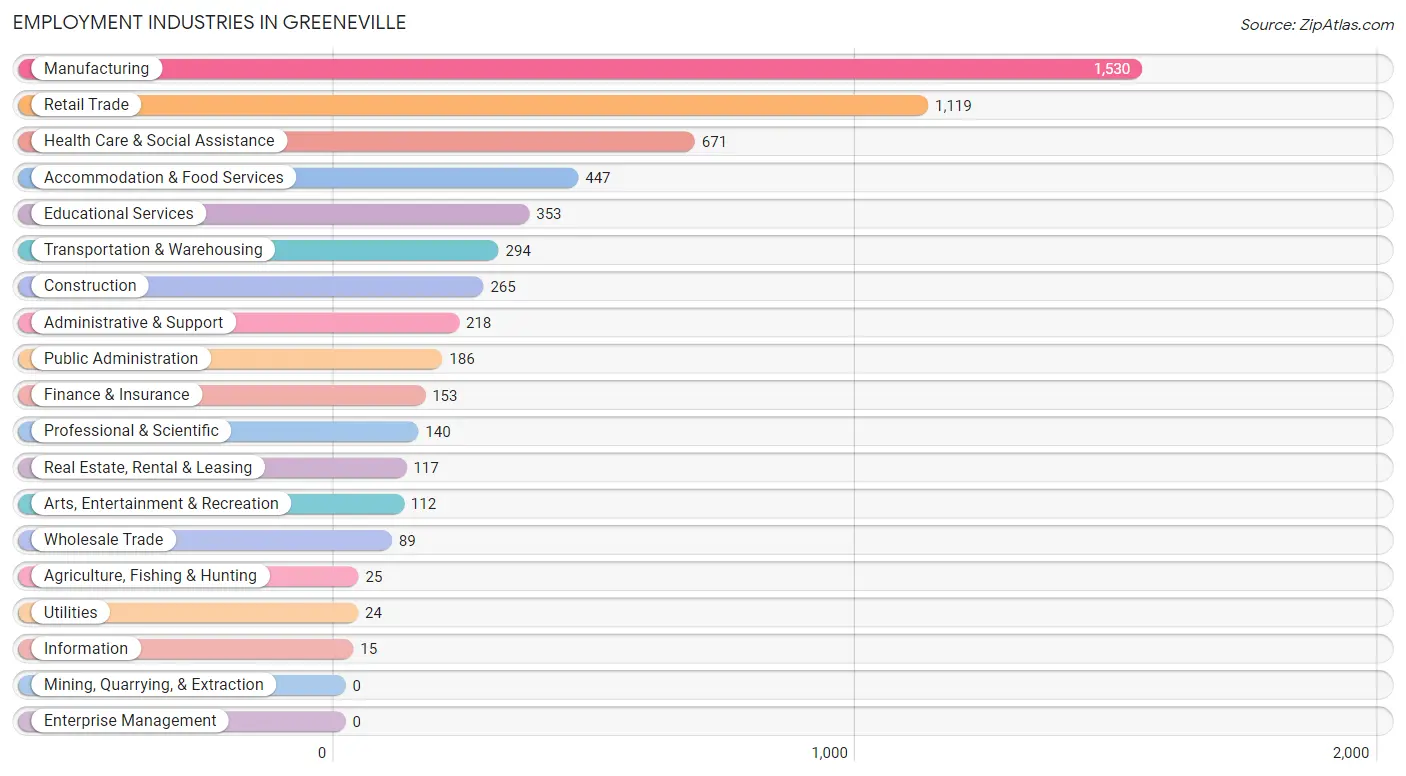
Employment Industries in Greeneville
The major employment industries in Greeneville include Manufacturing (1,530 | 25.8%), Retail Trade (1,119 | 18.9%), Health Care & Social Assistance (671 | 11.3%), Accommodation & Food Services (447 | 7.5%), and Educational Services (353 | 5.9%).
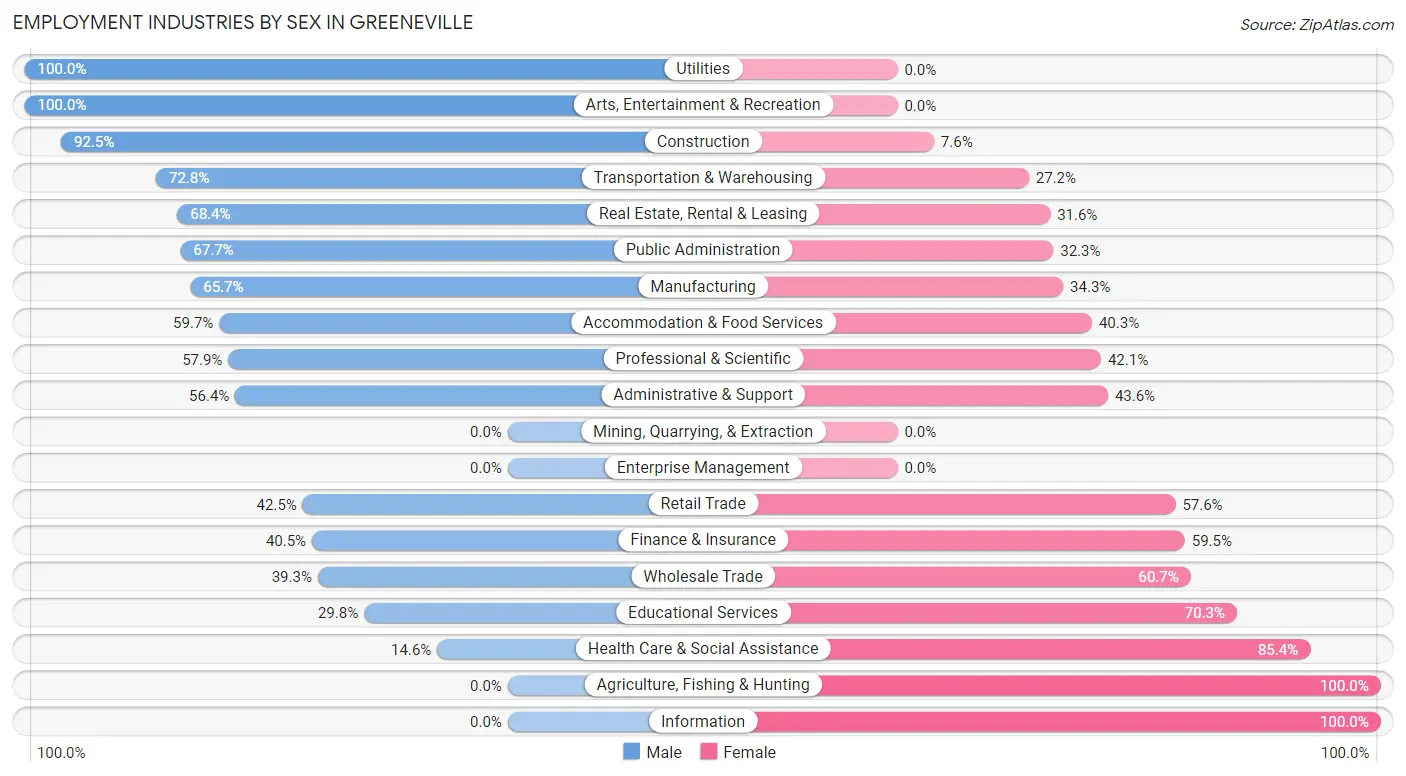
Employment Industries by Sex in Greeneville
The Greeneville industries that see more men than women are Utilities (100.0%), Arts, Entertainment & Recreation (100.0%), and Construction (92.4%), whereas the industries that tend to have a higher number of women are Agriculture, Fishing & Hunting (100.0%), Information (100.0%), and Health Care & Social Assistance (85.4%).
| Industry | Male | Female |
| Agriculture, Fishing & Hunting | 0 (0.0%) | 25 (100.0%) |
| Mining, Quarrying, & Extraction | 0 (0.0%) | 0 (0.0%) |
| Construction | 245 (92.4%) | 20 (7.5%) |
| Manufacturing | 1,005 (65.7%) | 525 (34.3%) |
| Wholesale Trade | 35 (39.3%) | 54 (60.7%) |
| Retail Trade | 475 (42.4%) | 644 (57.6%) |
| Transportation & Warehousing | 214 (72.8%) | 80 (27.2%) |
| Utilities | 24 (100.0%) | 0 (0.0%) |
| Information | 0 (0.0%) | 15 (100.0%) |
| Finance & Insurance | 62 (40.5%) | 91 (59.5%) |
| Real Estate, Rental & Leasing | 80 (68.4%) | 37 (31.6%) |
| Professional & Scientific | 81 (57.9%) | 59 (42.1%) |
| Enterprise Management | 0 (0.0%) | 0 (0.0%) |
| Administrative & Support | 123 (56.4%) | 95 (43.6%) |
| Educational Services | 105 (29.7%) | 248 (70.3%) |
| Health Care & Social Assistance | 98 (14.6%) | 573 (85.4%) |
| Arts, Entertainment & Recreation | 112 (100.0%) | 0 (0.0%) |
| Accommodation & Food Services | 267 (59.7%) | 180 (40.3%) |
| Public Administration | 126 (67.7%) | 60 (32.3%) |
| Total | 3,173 (53.5%) | 2,757 (46.5%) |
Education in Greeneville
School Enrollment in Greeneville
The most common levels of schooling among the 3,083 students in Greeneville are middle school (1,090 | 35.4%), high school (880 | 28.5%), and elementary school (468 | 15.2%).
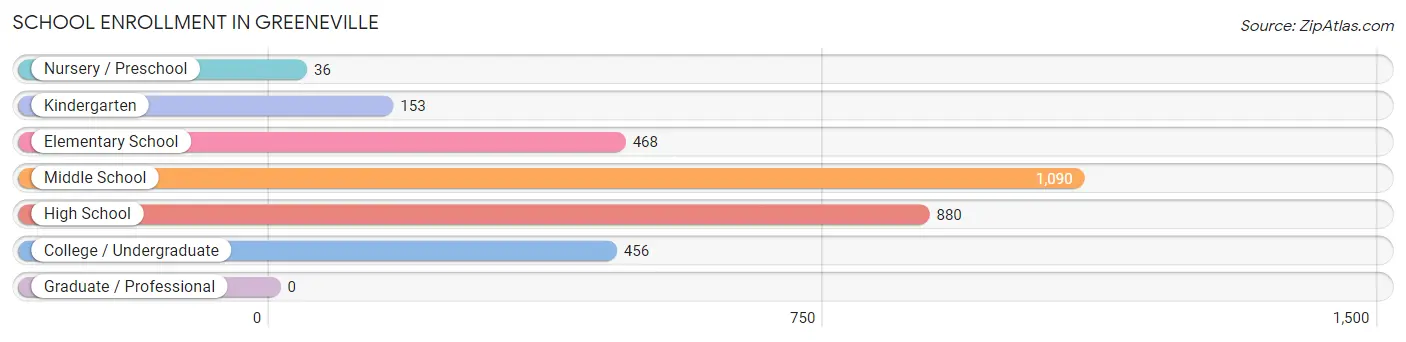
| School Level | # Students | % Students |
| Nursery / Preschool | 36 | 1.2% |
| Kindergarten | 153 | 5.0% |
| Elementary School | 468 | 15.2% |
| Middle School | 1,090 | 35.4% |
| High School | 880 | 28.5% |
| College / Undergraduate | 456 | 14.8% |
| Graduate / Professional | 0 | 0.0% |
| Total | 3,083 | 100.0% |
School Enrollment by Age by Funding Source in Greeneville
Out of a total of 3,083 students who are enrolled in schools in Greeneville, 185 (6.0%) attend a private institution, while the remaining 2,898 (94.0%) are enrolled in public schools. The age group of 20 to 24 year olds has the highest likelihood of being enrolled in private schools, with 64 (37.9% in the age bracket) enrolled. Conversely, the age group of 18 to 19 year olds has the lowest likelihood of being enrolled in a private school, with 183 (100.0% in the age bracket) attending a public institution.
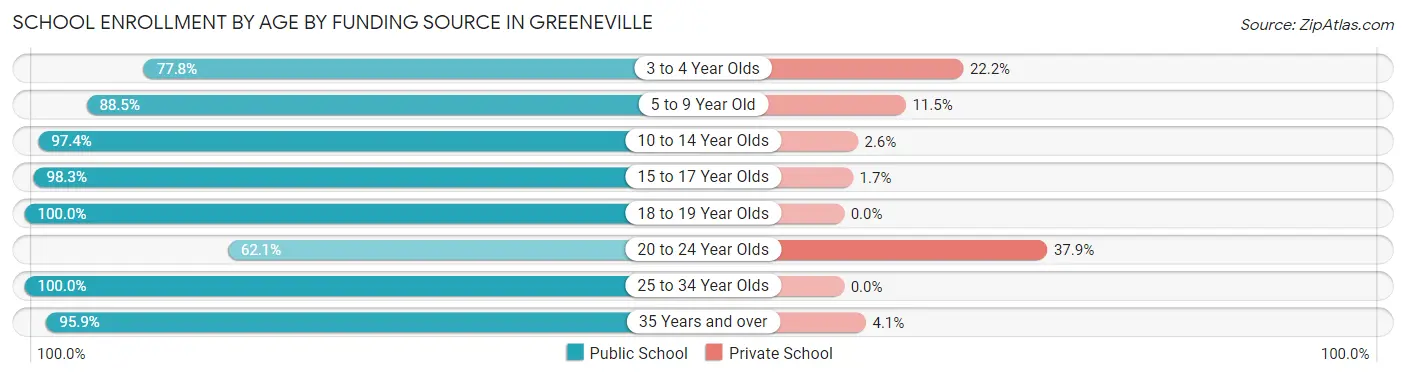
| Age Bracket | Public School | Private School |
| 3 to 4 Year Olds | 28 (77.8%) | 8 (22.2%) |
| 5 to 9 Year Old | 514 (88.5%) | 67 (11.5%) |
| 10 to 14 Year Olds | 1,135 (97.4%) | 30 (2.6%) |
| 15 to 17 Year Olds | 647 (98.3%) | 11 (1.7%) |
| 18 to 19 Year Olds | 183 (100.0%) | 0 (0.0%) |
| 20 to 24 Year Olds | 105 (62.1%) | 64 (37.9%) |
| 25 to 34 Year Olds | 168 (100.0%) | 0 (0.0%) |
| 35 Years and over | 118 (95.9%) | 5 (4.1%) |
| Total | 2,898 (94.0%) | 185 (6.0%) |
Educational Attainment by Field of Study in Greeneville
Business (657 | 24.4%), education (462 | 17.2%), arts & humanities (340 | 12.7%), science & technology (216 | 8.0%), and psychology (155 | 5.8%) are the most common fields of study among 2,687 individuals in Greeneville who have obtained a bachelor's degree or higher.
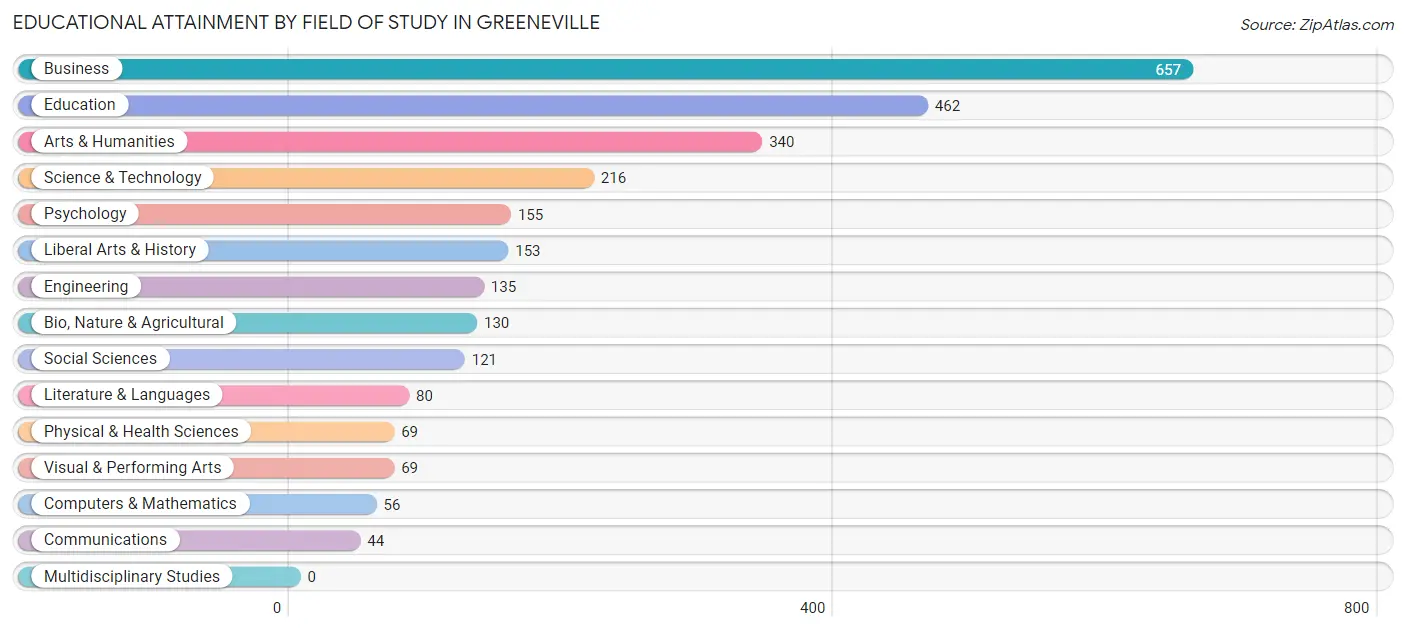
| Field of Study | # Graduates | % Graduates |
| Computers & Mathematics | 56 | 2.1% |
| Bio, Nature & Agricultural | 130 | 4.8% |
| Physical & Health Sciences | 69 | 2.6% |
| Psychology | 155 | 5.8% |
| Social Sciences | 121 | 4.5% |
| Engineering | 135 | 5.0% |
| Multidisciplinary Studies | 0 | 0.0% |
| Science & Technology | 216 | 8.0% |
| Business | 657 | 24.4% |
| Education | 462 | 17.2% |
| Literature & Languages | 80 | 3.0% |
| Liberal Arts & History | 153 | 5.7% |
| Visual & Performing Arts | 69 | 2.6% |
| Communications | 44 | 1.6% |
| Arts & Humanities | 340 | 12.7% |
| Total | 2,687 | 100.0% |
Transportation & Commute in Greeneville
Vehicle Availability by Sex in Greeneville
The most prevalent vehicle ownership categories in Greeneville are males with 2 vehicles (1,544, accounting for 50.3%) and females with 2 vehicles (1,202, making up 56.6%).
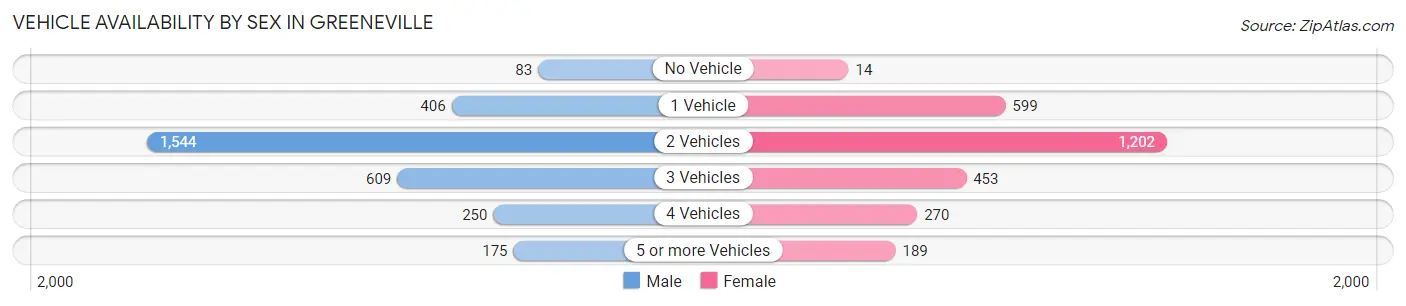
| Vehicles Available | Male | Female |
| No Vehicle | 83 (2.7%) | 14 (0.5%) |
| 1 Vehicle | 406 (13.2%) | 599 (22.0%) |
| 2 Vehicles | 1,544 (50.3%) | 1,202 (44.1%) |
| 3 Vehicles | 609 (19.9%) | 453 (16.6%) |
| 4 Vehicles | 250 (8.2%) | 270 (9.9%) |
| 5 or more Vehicles | 175 (5.7%) | 189 (6.9%) |
| Total | 3,067 (100.0%) | 2,727 (100.0%) |
Commute Time in Greeneville
The most frequently occuring commute durations in Greeneville are 5 to 9 minutes (1,845 commuters, 33.4%), 10 to 14 minutes (1,143 commuters, 20.7%), and 15 to 19 minutes (638 commuters, 11.6%).
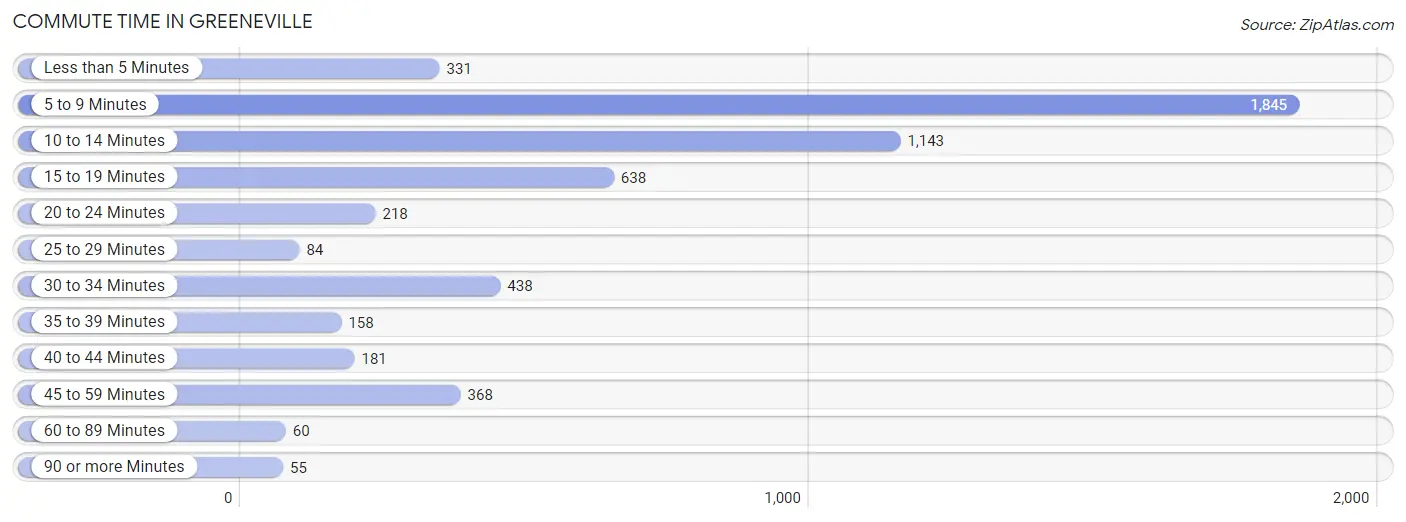
| Commute Time | # Commuters | % Commuters |
| Less than 5 Minutes | 331 | 6.0% |
| 5 to 9 Minutes | 1,845 | 33.4% |
| 10 to 14 Minutes | 1,143 | 20.7% |
| 15 to 19 Minutes | 638 | 11.6% |
| 20 to 24 Minutes | 218 | 4.0% |
| 25 to 29 Minutes | 84 | 1.5% |
| 30 to 34 Minutes | 438 | 7.9% |
| 35 to 39 Minutes | 158 | 2.9% |
| 40 to 44 Minutes | 181 | 3.3% |
| 45 to 59 Minutes | 368 | 6.7% |
| 60 to 89 Minutes | 60 | 1.1% |
| 90 or more Minutes | 55 | 1.0% |
Commute Time by Sex in Greeneville
The most common commute times in Greeneville are 5 to 9 minutes (844 commuters, 28.2%) for males and 5 to 9 minutes (1,001 commuters, 39.7%) for females.
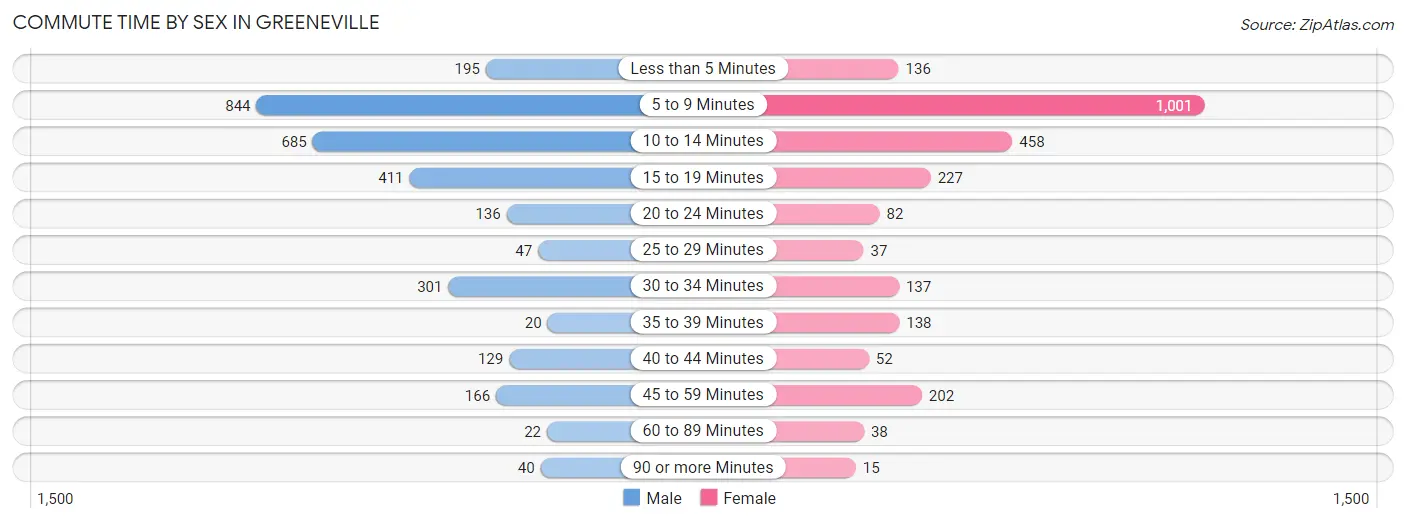
| Commute Time | Male | Female |
| Less than 5 Minutes | 195 (6.5%) | 136 (5.4%) |
| 5 to 9 Minutes | 844 (28.2%) | 1,001 (39.7%) |
| 10 to 14 Minutes | 685 (22.9%) | 458 (18.1%) |
| 15 to 19 Minutes | 411 (13.7%) | 227 (9.0%) |
| 20 to 24 Minutes | 136 (4.5%) | 82 (3.3%) |
| 25 to 29 Minutes | 47 (1.6%) | 37 (1.5%) |
| 30 to 34 Minutes | 301 (10.1%) | 137 (5.4%) |
| 35 to 39 Minutes | 20 (0.7%) | 138 (5.5%) |
| 40 to 44 Minutes | 129 (4.3%) | 52 (2.1%) |
| 45 to 59 Minutes | 166 (5.5%) | 202 (8.0%) |
| 60 to 89 Minutes | 22 (0.7%) | 38 (1.5%) |
| 90 or more Minutes | 40 (1.3%) | 15 (0.6%) |
Time of Departure to Work by Sex in Greeneville
The most frequent times of departure to work in Greeneville are 8:00 AM to 8:29 AM (610, 20.4%) for males and 7:30 AM to 7:59 AM (468, 18.5%) for females.
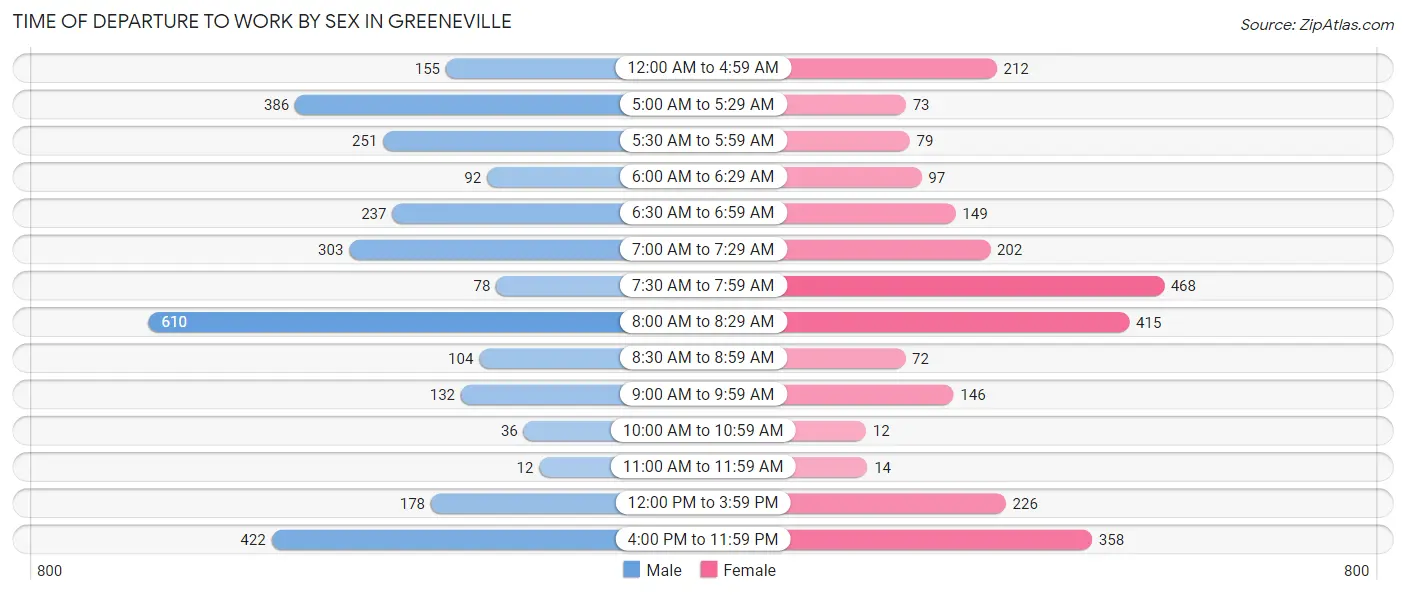
| Time of Departure | Male | Female |
| 12:00 AM to 4:59 AM | 155 (5.2%) | 212 (8.4%) |
| 5:00 AM to 5:29 AM | 386 (12.9%) | 73 (2.9%) |
| 5:30 AM to 5:59 AM | 251 (8.4%) | 79 (3.1%) |
| 6:00 AM to 6:29 AM | 92 (3.1%) | 97 (3.8%) |
| 6:30 AM to 6:59 AM | 237 (7.9%) | 149 (5.9%) |
| 7:00 AM to 7:29 AM | 303 (10.1%) | 202 (8.0%) |
| 7:30 AM to 7:59 AM | 78 (2.6%) | 468 (18.5%) |
| 8:00 AM to 8:29 AM | 610 (20.4%) | 415 (16.5%) |
| 8:30 AM to 8:59 AM | 104 (3.5%) | 72 (2.9%) |
| 9:00 AM to 9:59 AM | 132 (4.4%) | 146 (5.8%) |
| 10:00 AM to 10:59 AM | 36 (1.2%) | 12 (0.5%) |
| 11:00 AM to 11:59 AM | 12 (0.4%) | 14 (0.5%) |
| 12:00 PM to 3:59 PM | 178 (5.9%) | 226 (9.0%) |
| 4:00 PM to 11:59 PM | 422 (14.1%) | 358 (14.2%) |
| Total | 2,996 (100.0%) | 2,523 (100.0%) |
Housing Occupancy in Greeneville
Occupancy by Ownership in Greeneville
Of the total 6,076 dwellings in Greeneville, owner-occupied units account for 3,614 (59.5%), while renter-occupied units make up 2,462 (40.5%).
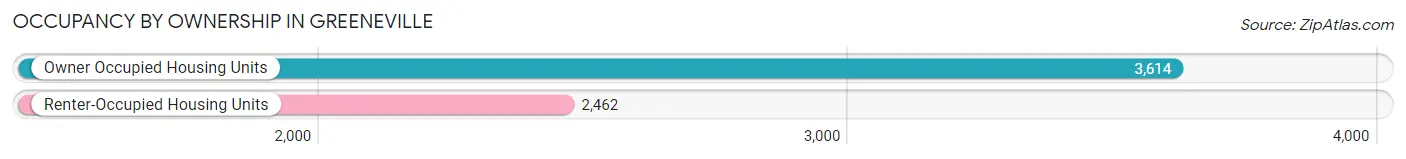
| Occupancy | # Housing Units | % Housing Units |
| Owner Occupied Housing Units | 3,614 | 59.5% |
| Renter-Occupied Housing Units | 2,462 | 40.5% |
| Total Occupied Housing Units | 6,076 | 100.0% |
Occupancy by Household Size in Greeneville
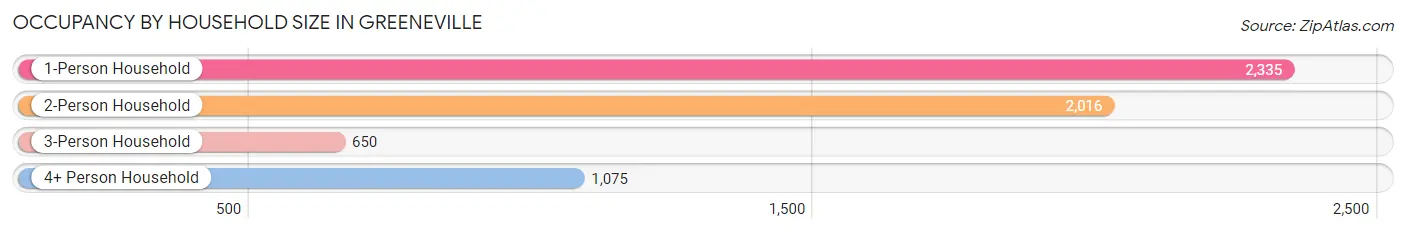
| Household Size | # Housing Units | % Housing Units |
| 1-Person Household | 2,335 | 38.4% |
| 2-Person Household | 2,016 | 33.2% |
| 3-Person Household | 650 | 10.7% |
| 4+ Person Household | 1,075 | 17.7% |
| Total Housing Units | 6,076 | 100.0% |
Occupancy by Ownership by Household Size in Greeneville
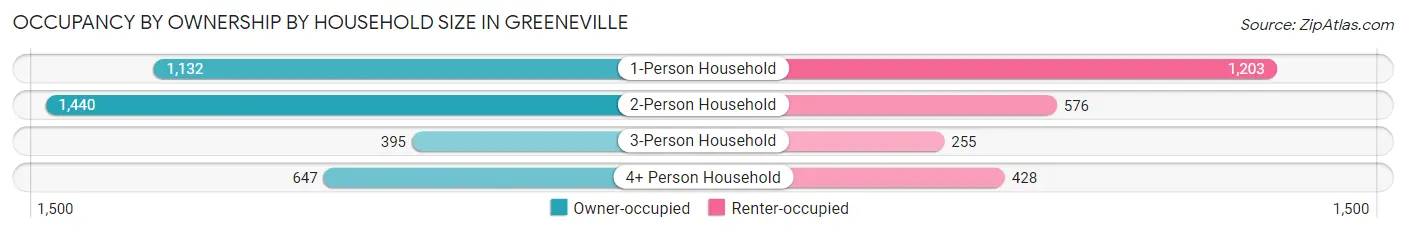
| Household Size | Owner-occupied | Renter-occupied |
| 1-Person Household | 1,132 (48.5%) | 1,203 (51.5%) |
| 2-Person Household | 1,440 (71.4%) | 576 (28.6%) |
| 3-Person Household | 395 (60.8%) | 255 (39.2%) |
| 4+ Person Household | 647 (60.2%) | 428 (39.8%) |
| Total Housing Units | 3,614 (59.5%) | 2,462 (40.5%) |
Occupancy by Educational Attainment in Greeneville
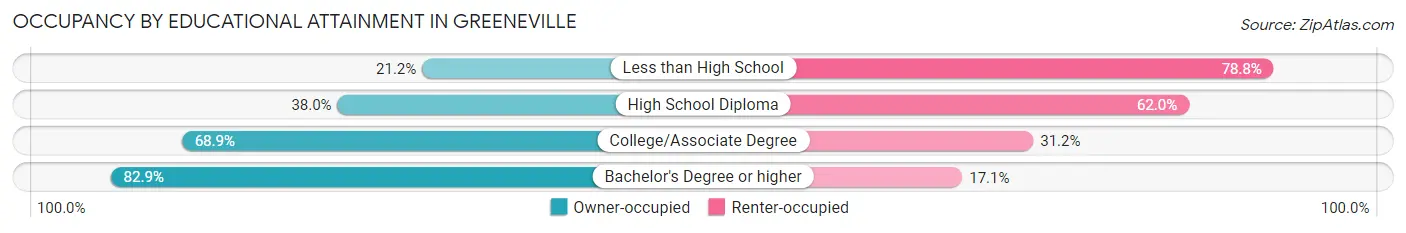
| Household Size | Owner-occupied | Renter-occupied |
| Less than High School | 100 (21.2%) | 372 (78.8%) |
| High School Diploma | 720 (38.0%) | 1,176 (62.0%) |
| College/Associate Degree | 1,375 (68.9%) | 622 (31.1%) |
| Bachelor's Degree or higher | 1,419 (82.9%) | 292 (17.1%) |
Occupancy by Age of Householder in Greeneville
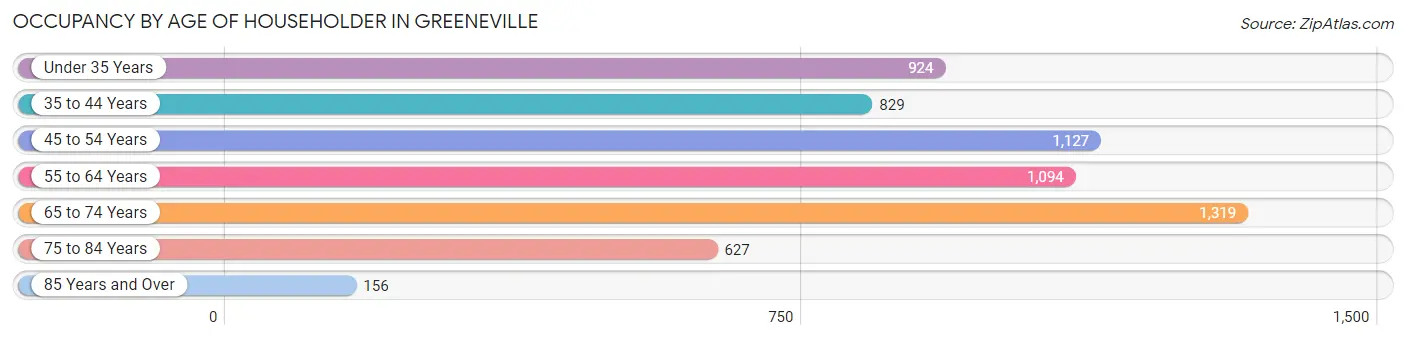
| Age Bracket | # Households | % Households |
| Under 35 Years | 924 | 15.2% |
| 35 to 44 Years | 829 | 13.6% |
| 45 to 54 Years | 1,127 | 18.5% |
| 55 to 64 Years | 1,094 | 18.0% |
| 65 to 74 Years | 1,319 | 21.7% |
| 75 to 84 Years | 627 | 10.3% |
| 85 Years and Over | 156 | 2.6% |
| Total | 6,076 | 100.0% |
Housing Finances in Greeneville
Median Income by Occupancy in Greeneville
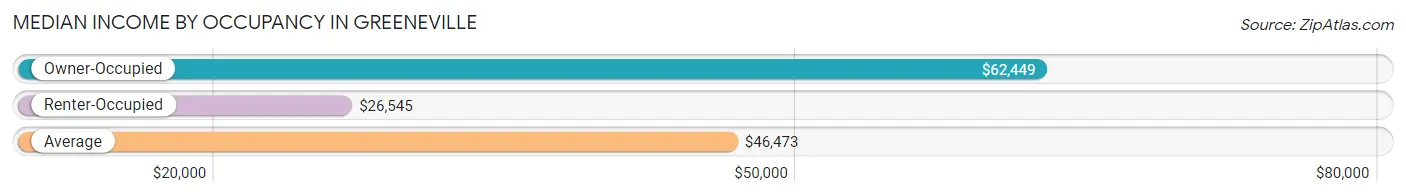
| Occupancy Type | # Households | Median Income |
| Owner-Occupied | 3,614 (59.5%) | $62,449 |
| Renter-Occupied | 2,462 (40.5%) | $26,545 |
| Average | 6,076 (100.0%) | $46,473 |
Occupancy by Householder Income Bracket in Greeneville
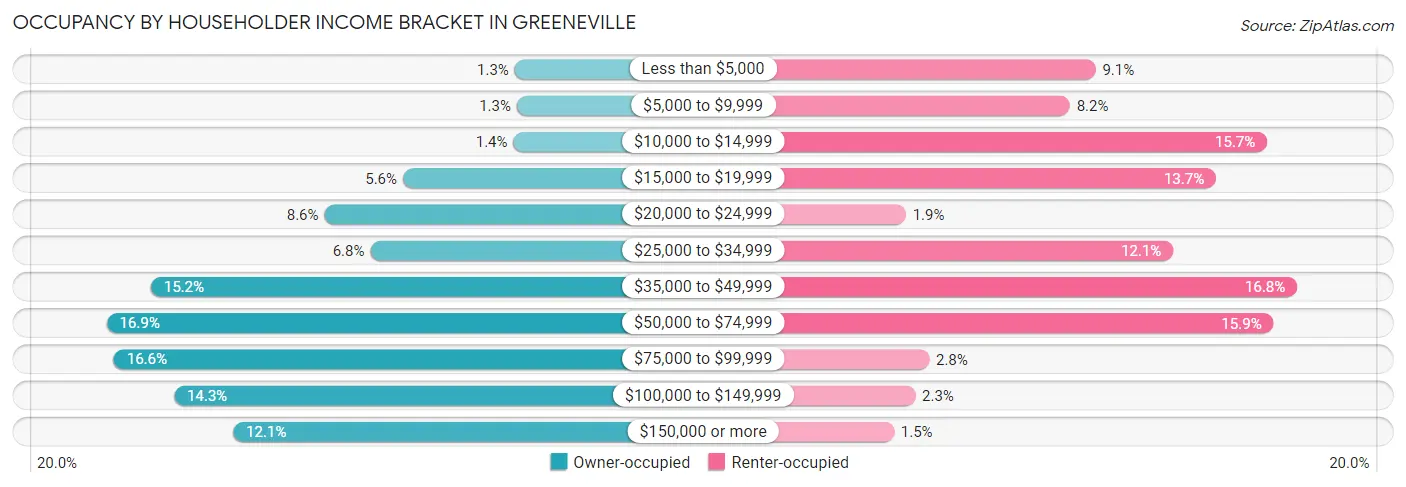
| Income Bracket | Owner-occupied | Renter-occupied |
| Less than $5,000 | 48 (1.3%) | 225 (9.1%) |
| $5,000 to $9,999 | 45 (1.3%) | 201 (8.2%) |
| $10,000 to $14,999 | 50 (1.4%) | 386 (15.7%) |
| $15,000 to $19,999 | 202 (5.6%) | 338 (13.7%) |
| $20,000 to $24,999 | 310 (8.6%) | 47 (1.9%) |
| $25,000 to $34,999 | 247 (6.8%) | 298 (12.1%) |
| $35,000 to $49,999 | 549 (15.2%) | 414 (16.8%) |
| $50,000 to $74,999 | 610 (16.9%) | 392 (15.9%) |
| $75,000 to $99,999 | 600 (16.6%) | 69 (2.8%) |
| $100,000 to $149,999 | 517 (14.3%) | 56 (2.3%) |
| $150,000 or more | 436 (12.1%) | 36 (1.5%) |
| Total | 3,614 (100.0%) | 2,462 (100.0%) |
Monthly Housing Cost Tiers in Greeneville
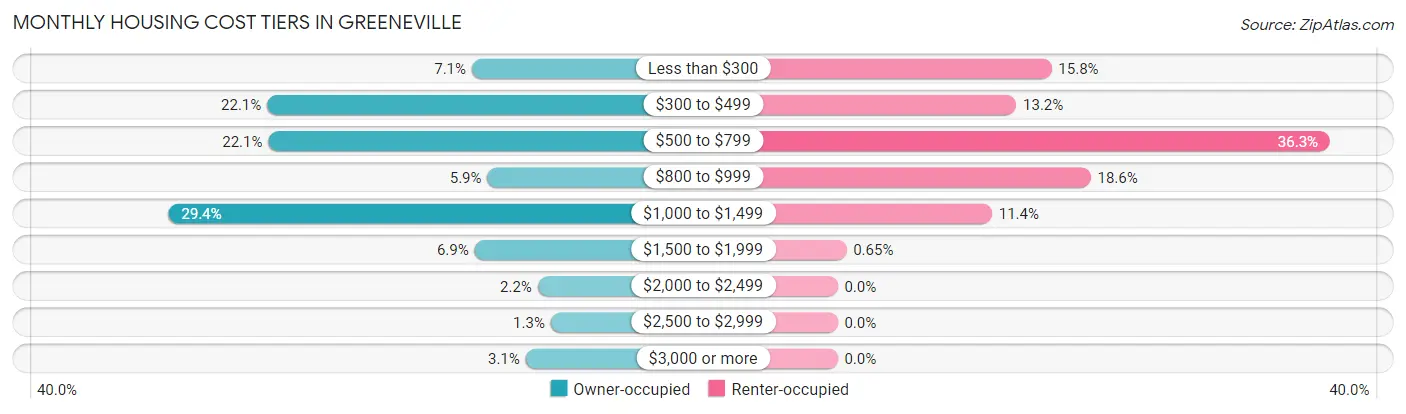
| Monthly Cost | Owner-occupied | Renter-occupied |
| Less than $300 | 255 (7.1%) | 388 (15.8%) |
| $300 to $499 | 800 (22.1%) | 324 (13.2%) |
| $500 to $799 | 797 (22.1%) | 893 (36.3%) |
| $800 to $999 | 214 (5.9%) | 459 (18.6%) |
| $1,000 to $1,499 | 1,063 (29.4%) | 280 (11.4%) |
| $1,500 to $1,999 | 248 (6.9%) | 16 (0.6%) |
| $2,000 to $2,499 | 80 (2.2%) | 0 (0.0%) |
| $2,500 to $2,999 | 45 (1.3%) | 0 (0.0%) |
| $3,000 or more | 112 (3.1%) | 0 (0.0%) |
| Total | 3,614 (100.0%) | 2,462 (100.0%) |
Physical Housing Characteristics in Greeneville
Housing Structures in Greeneville
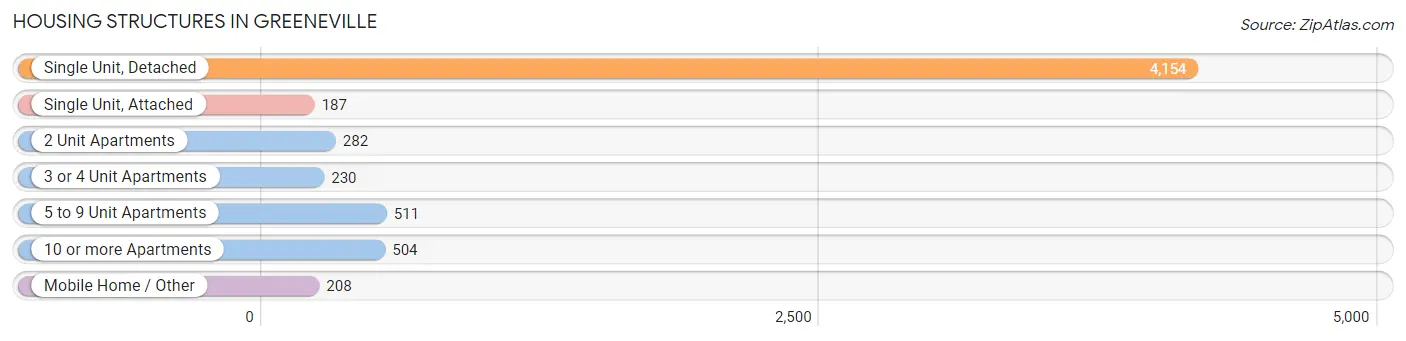
| Structure Type | # Housing Units | % Housing Units |
| Single Unit, Detached | 4,154 | 68.4% |
| Single Unit, Attached | 187 | 3.1% |
| 2 Unit Apartments | 282 | 4.6% |
| 3 or 4 Unit Apartments | 230 | 3.8% |
| 5 to 9 Unit Apartments | 511 | 8.4% |
| 10 or more Apartments | 504 | 8.3% |
| Mobile Home / Other | 208 | 3.4% |
| Total | 6,076 | 100.0% |
Housing Structures by Occupancy in Greeneville
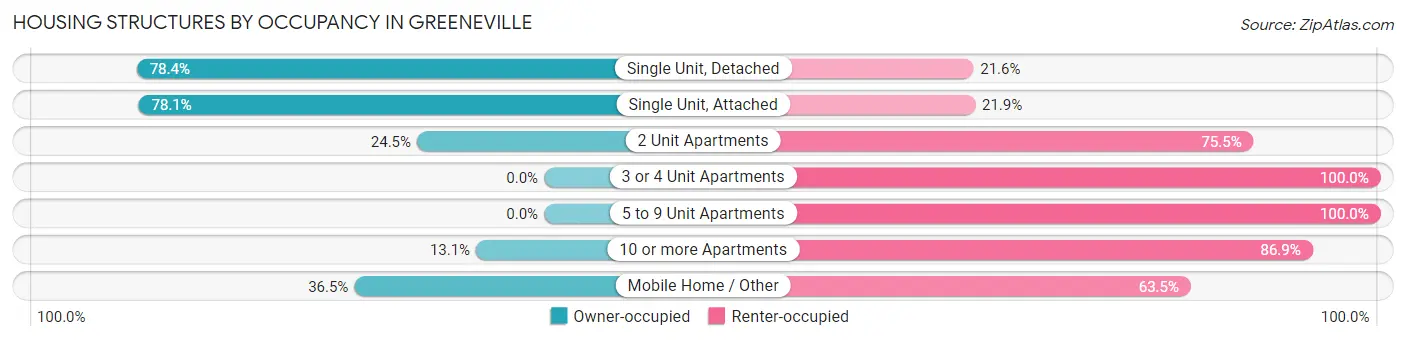
| Structure Type | Owner-occupied | Renter-occupied |
| Single Unit, Detached | 3,257 (78.4%) | 897 (21.6%) |
| Single Unit, Attached | 146 (78.1%) | 41 (21.9%) |
| 2 Unit Apartments | 69 (24.5%) | 213 (75.5%) |
| 3 or 4 Unit Apartments | 0 (0.0%) | 230 (100.0%) |
| 5 to 9 Unit Apartments | 0 (0.0%) | 511 (100.0%) |
| 10 or more Apartments | 66 (13.1%) | 438 (86.9%) |
| Mobile Home / Other | 76 (36.5%) | 132 (63.5%) |
| Total | 3,614 (59.5%) | 2,462 (40.5%) |
Housing Structures by Number of Rooms in Greeneville
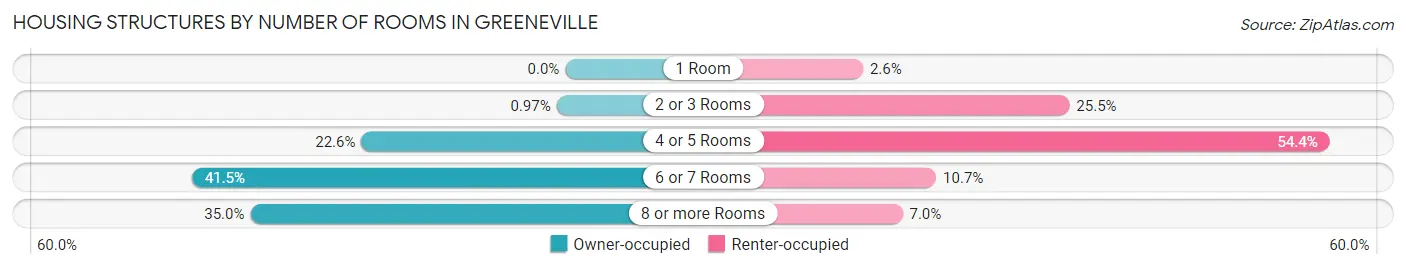
| Number of Rooms | Owner-occupied | Renter-occupied |
| 1 Room | 0 (0.0%) | 63 (2.6%) |
| 2 or 3 Rooms | 35 (1.0%) | 627 (25.5%) |
| 4 or 5 Rooms | 818 (22.6%) | 1,338 (54.3%) |
| 6 or 7 Rooms | 1,498 (41.4%) | 263 (10.7%) |
| 8 or more Rooms | 1,263 (34.9%) | 171 (7.0%) |
| Total | 3,614 (100.0%) | 2,462 (100.0%) |
Housing Structure by Heating Type in Greeneville
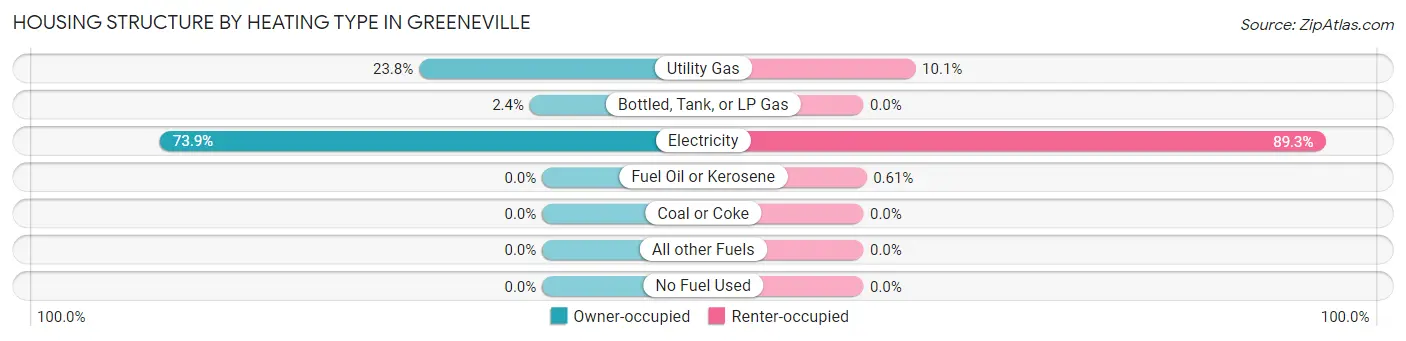
| Heating Type | Owner-occupied | Renter-occupied |
| Utility Gas | 859 (23.8%) | 248 (10.1%) |
| Bottled, Tank, or LP Gas | 86 (2.4%) | 0 (0.0%) |
| Electricity | 2,669 (73.9%) | 2,199 (89.3%) |
| Fuel Oil or Kerosene | 0 (0.0%) | 15 (0.6%) |
| Coal or Coke | 0 (0.0%) | 0 (0.0%) |
| All other Fuels | 0 (0.0%) | 0 (0.0%) |
| No Fuel Used | 0 (0.0%) | 0 (0.0%) |
| Total | 3,614 (100.0%) | 2,462 (100.0%) |
Household Vehicle Usage in Greeneville
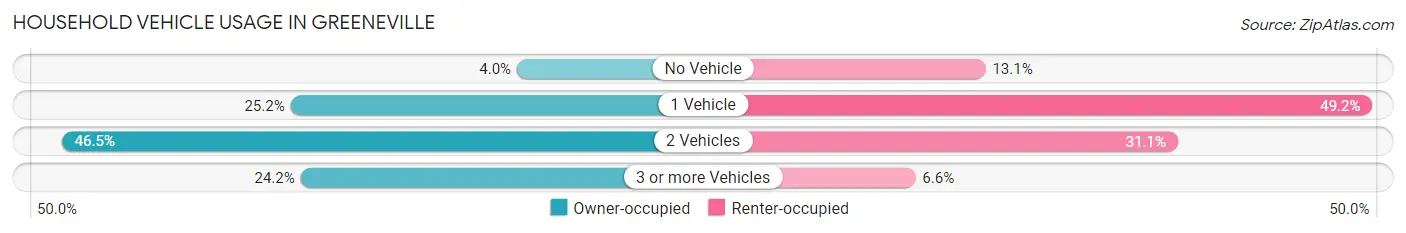
| Vehicles per Household | Owner-occupied | Renter-occupied |
| No Vehicle | 146 (4.0%) | 323 (13.1%) |
| 1 Vehicle | 910 (25.2%) | 1,212 (49.2%) |
| 2 Vehicles | 1,682 (46.5%) | 765 (31.1%) |
| 3 or more Vehicles | 876 (24.2%) | 162 (6.6%) |
| Total | 3,614 (100.0%) | 2,462 (100.0%) |
Real Estate & Mortgages in Greeneville
Real Estate and Mortgage Overview in Greeneville
| Characteristic | Without Mortgage | With Mortgage |
| Housing Units | 1,391 | 2,223 |
| Median Property Value | $163,300 | $197,600 |
| Median Household Income | $47,044 | $304 |
| Monthly Housing Costs | $413 | $112 |
| Real Estate Taxes | $1,411 | $21 |
Property Value by Mortgage Status in Greeneville
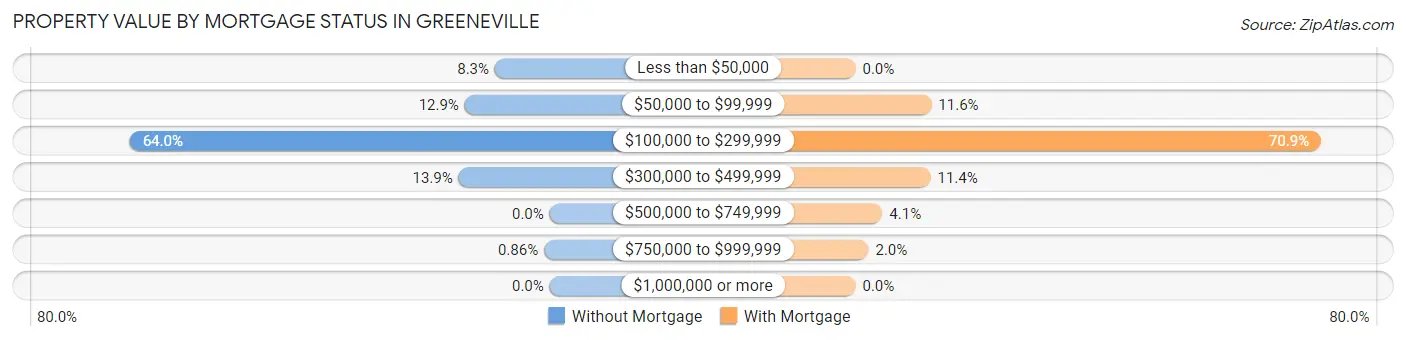
| Property Value | Without Mortgage | With Mortgage |
| Less than $50,000 | 116 (8.3%) | 0 (0.0%) |
| $50,000 to $99,999 | 180 (12.9%) | 257 (11.6%) |
| $100,000 to $299,999 | 890 (64.0%) | 1,577 (70.9%) |
| $300,000 to $499,999 | 193 (13.9%) | 254 (11.4%) |
| $500,000 to $749,999 | 0 (0.0%) | 91 (4.1%) |
| $750,000 to $999,999 | 12 (0.9%) | 44 (2.0%) |
| $1,000,000 or more | 0 (0.0%) | 0 (0.0%) |
| Total | 1,391 (100.0%) | 2,223 (100.0%) |
Household Income by Mortgage Status in Greeneville
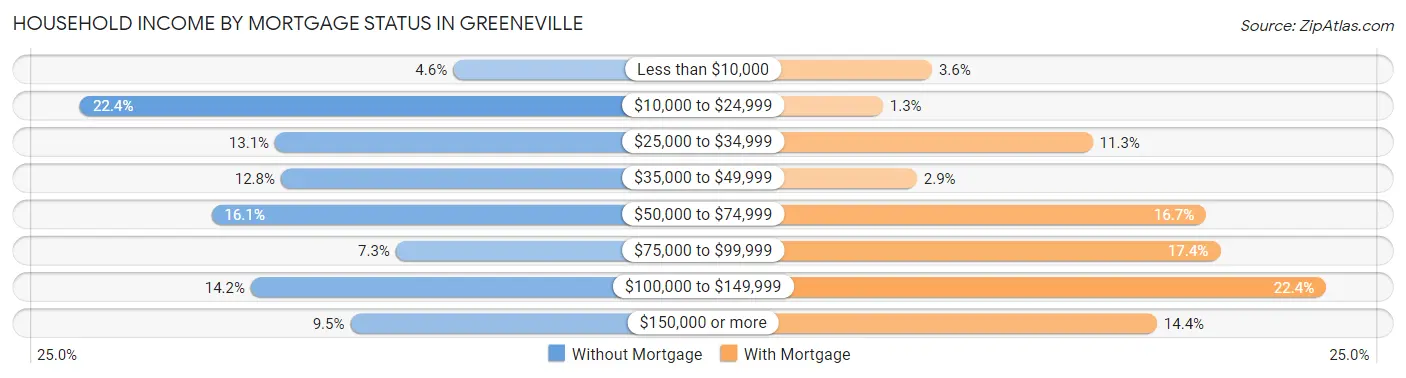
| Household Income | Without Mortgage | With Mortgage |
| Less than $10,000 | 64 (4.6%) | 81 (3.6%) |
| $10,000 to $24,999 | 311 (22.4%) | 29 (1.3%) |
| $25,000 to $34,999 | 182 (13.1%) | 251 (11.3%) |
| $35,000 to $49,999 | 178 (12.8%) | 65 (2.9%) |
| $50,000 to $74,999 | 224 (16.1%) | 371 (16.7%) |
| $75,000 to $99,999 | 102 (7.3%) | 386 (17.4%) |
| $100,000 to $149,999 | 198 (14.2%) | 498 (22.4%) |
| $150,000 or more | 132 (9.5%) | 319 (14.3%) |
| Total | 1,391 (100.0%) | 2,223 (100.0%) |
Property Value to Household Income Ratio in Greeneville
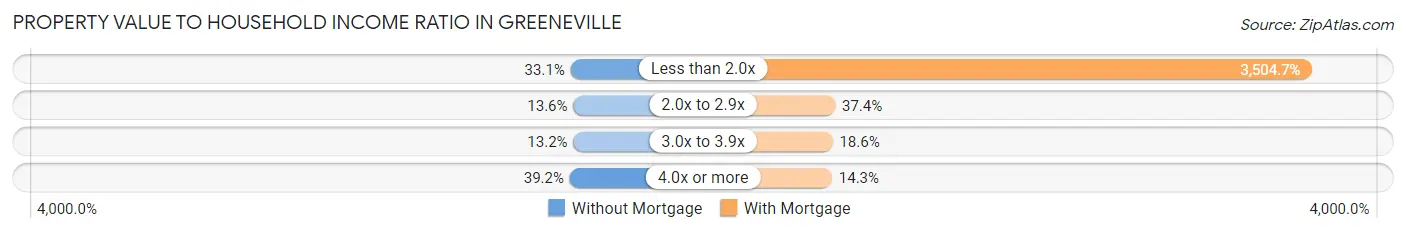
| Value-to-Income Ratio | Without Mortgage | With Mortgage |
| Less than 2.0x | 460 (33.1%) | 77,909 (3,504.7%) |
| 2.0x to 2.9x | 189 (13.6%) | 832 (37.4%) |
| 3.0x to 3.9x | 184 (13.2%) | 413 (18.6%) |
| 4.0x or more | 545 (39.2%) | 318 (14.3%) |
| Total | 1,391 (100.0%) | 2,223 (100.0%) |
Real Estate Taxes by Mortgage Status in Greeneville
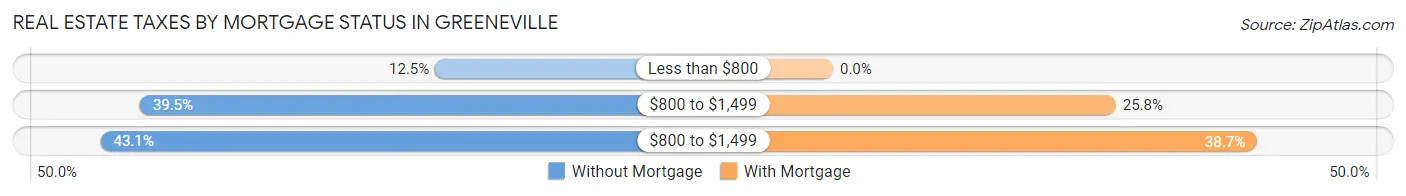
| Property Taxes | Without Mortgage | With Mortgage |
| Less than $800 | 174 (12.5%) | 0 (0.0%) |
| $800 to $1,499 | 549 (39.5%) | 574 (25.8%) |
| $800 to $1,499 | 599 (43.1%) | 861 (38.7%) |
| Total | 1,391 (100.0%) | 2,223 (100.0%) |
Health & Disability in Greeneville
Health Insurance Coverage by Age in Greeneville
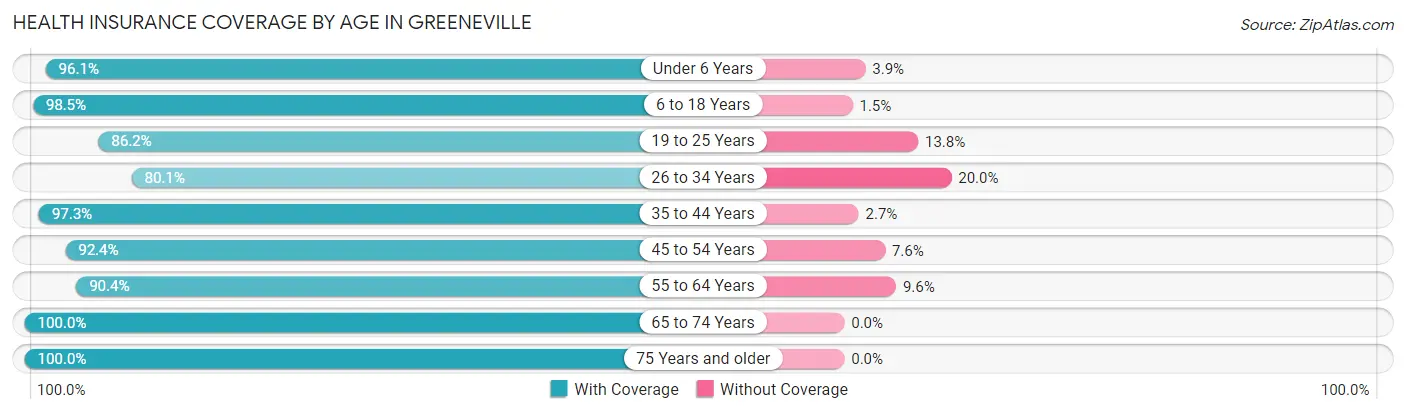
| Age Bracket | With Coverage | Without Coverage |
| Under 6 Years | 782 (96.1%) | 32 (3.9%) |
| 6 to 18 Years | 2,489 (98.5%) | 39 (1.5%) |
| 19 to 25 Years | 984 (86.2%) | 157 (13.8%) |
| 26 to 34 Years | 1,396 (80.0%) | 348 (20.0%) |
| 35 to 44 Years | 1,713 (97.3%) | 47 (2.7%) |
| 45 to 54 Years | 1,754 (92.4%) | 144 (7.6%) |
| 55 to 64 Years | 1,696 (90.4%) | 181 (9.6%) |
| 65 to 74 Years | 1,804 (100.0%) | 0 (0.0%) |
| 75 Years and older | 1,113 (100.0%) | 0 (0.0%) |
| Total | 13,731 (93.5%) | 948 (6.5%) |
Health Insurance Coverage by Citizenship Status in Greeneville
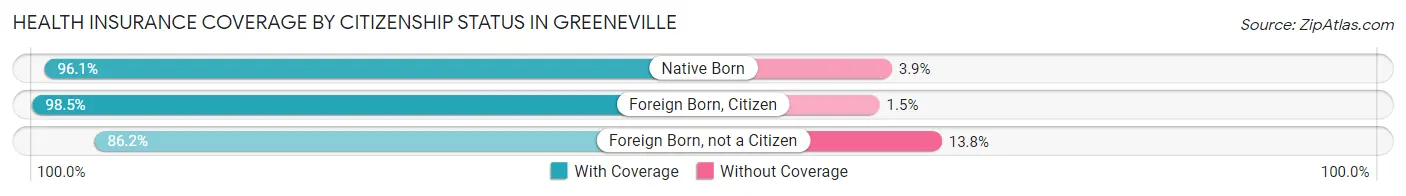
| Citizenship Status | With Coverage | Without Coverage |
| Native Born | 782 (96.1%) | 32 (3.9%) |
| Foreign Born, Citizen | 2,489 (98.5%) | 39 (1.5%) |
| Foreign Born, not a Citizen | 984 (86.2%) | 157 (13.8%) |
Health Insurance Coverage by Household Income in Greeneville
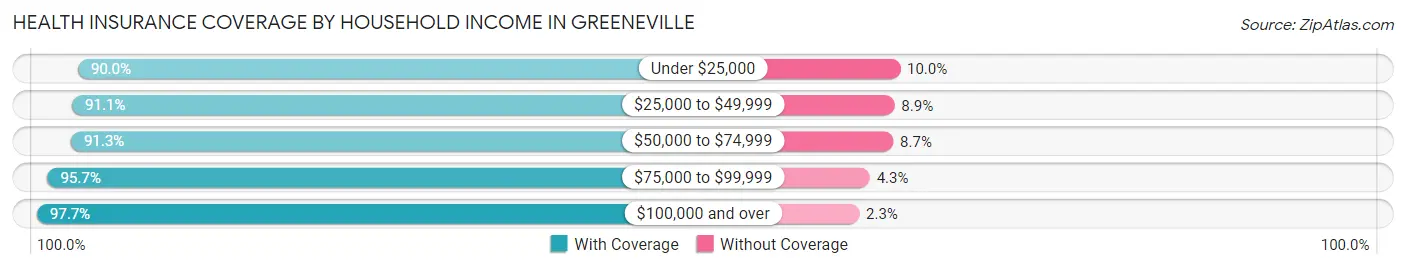
| Household Income | With Coverage | Without Coverage |
| Under $25,000 | 2,357 (90.0%) | 261 (10.0%) |
| $25,000 to $49,999 | 3,123 (91.1%) | 306 (8.9%) |
| $50,000 to $74,999 | 2,092 (91.3%) | 199 (8.7%) |
| $75,000 to $99,999 | 1,740 (95.7%) | 78 (4.3%) |
| $100,000 and over | 4,321 (97.7%) | 102 (2.3%) |
Public vs Private Health Insurance Coverage by Age in Greeneville
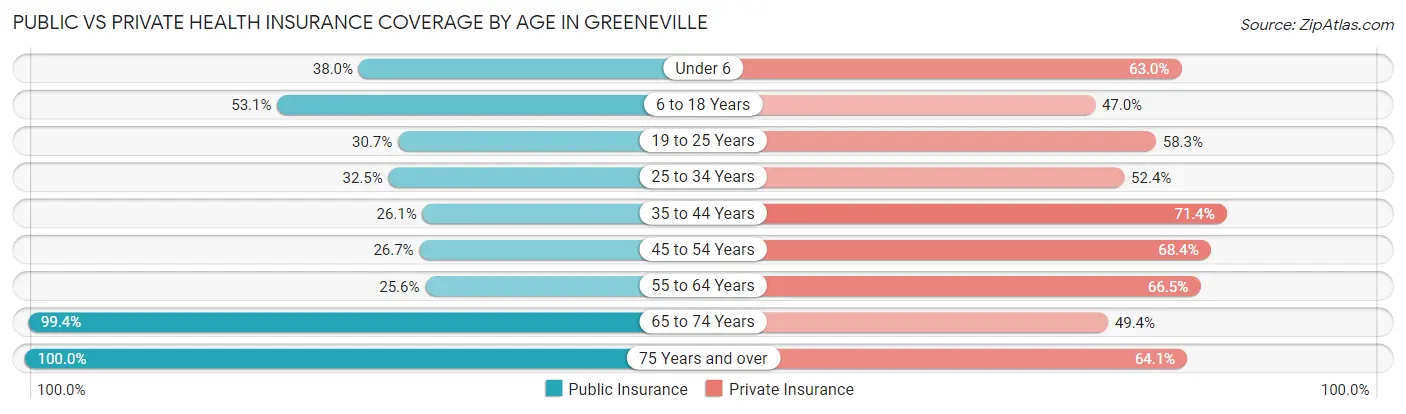
| Age Bracket | Public Insurance | Private Insurance |
| Under 6 | 309 (38.0%) | 513 (63.0%) |
| 6 to 18 Years | 1,342 (53.1%) | 1,188 (47.0%) |
| 19 to 25 Years | 350 (30.7%) | 665 (58.3%) |
| 25 to 34 Years | 566 (32.5%) | 914 (52.4%) |
| 35 to 44 Years | 460 (26.1%) | 1,257 (71.4%) |
| 45 to 54 Years | 507 (26.7%) | 1,299 (68.4%) |
| 55 to 64 Years | 481 (25.6%) | 1,248 (66.5%) |
| 65 to 74 Years | 1,793 (99.4%) | 891 (49.4%) |
| 75 Years and over | 1,113 (100.0%) | 713 (64.1%) |
| Total | 6,921 (47.1%) | 8,688 (59.2%) |
Disability Status by Sex by Age in Greeneville
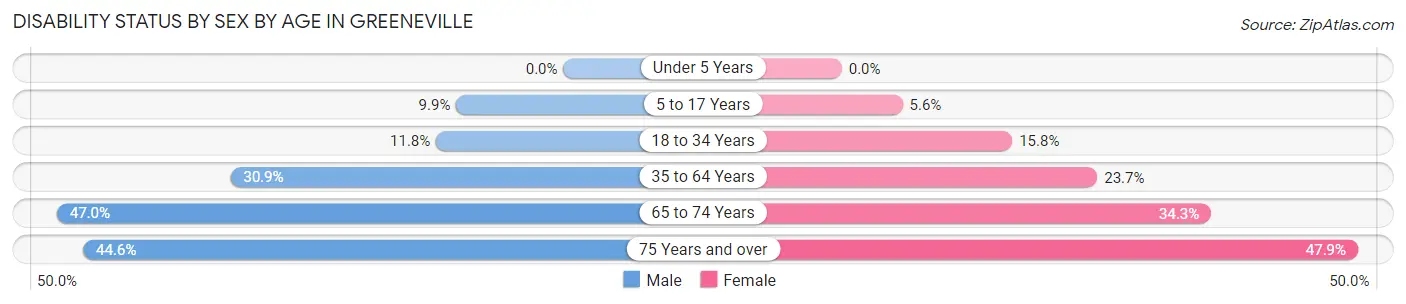
| Age Bracket | Male | Female |
| Under 5 Years | 0 (0.0%) | 0 (0.0%) |
| 5 to 17 Years | 125 (9.9%) | 71 (5.6%) |
| 18 to 34 Years | 172 (11.8%) | 245 (15.8%) |
| 35 to 64 Years | 839 (30.9%) | 669 (23.7%) |
| 65 to 74 Years | 346 (47.0%) | 366 (34.3%) |
| 75 Years and over | 201 (44.6%) | 317 (47.9%) |
Disability Class by Sex by Age in Greeneville
Disability Class: Hearing Difficulty
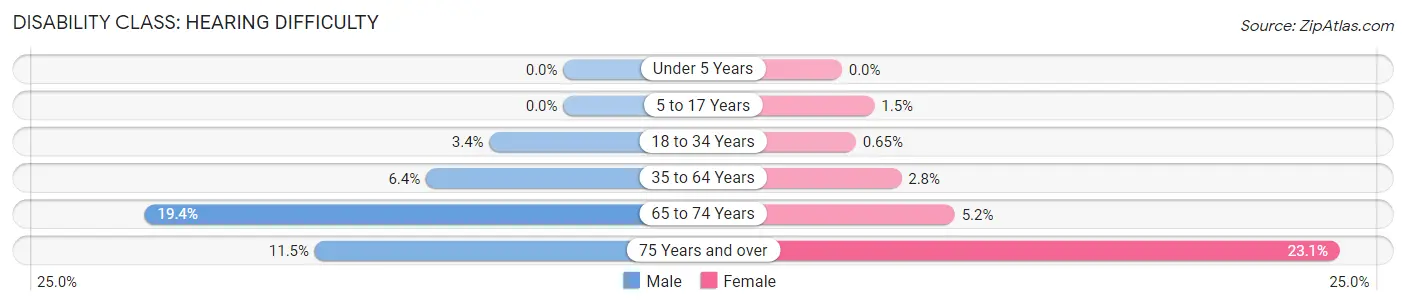
| Age Bracket | Male | Female |
| Under 5 Years | 0 (0.0%) | 0 (0.0%) |
| 5 to 17 Years | 0 (0.0%) | 19 (1.5%) |
| 18 to 34 Years | 50 (3.4%) | 10 (0.6%) |
| 35 to 64 Years | 173 (6.4%) | 78 (2.8%) |
| 65 to 74 Years | 143 (19.4%) | 56 (5.2%) |
| 75 Years and over | 52 (11.5%) | 153 (23.1%) |
Disability Class: Vision Difficulty
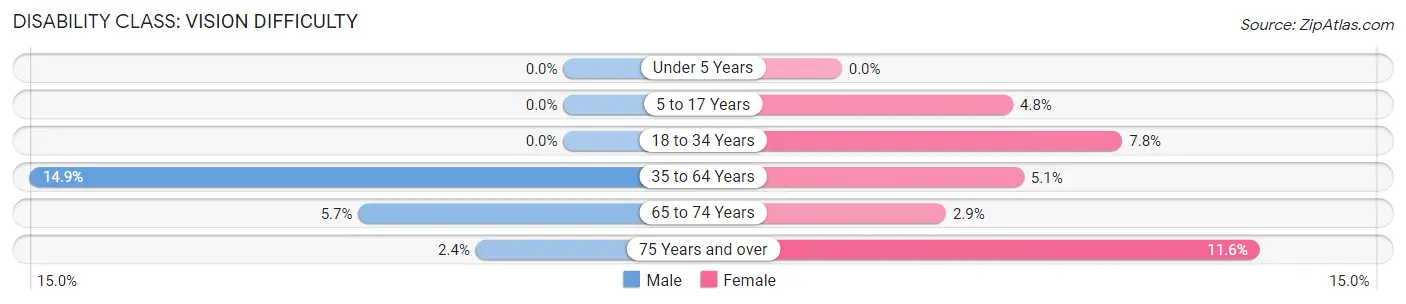
| Age Bracket | Male | Female |
| Under 5 Years | 0 (0.0%) | 0 (0.0%) |
| 5 to 17 Years | 0 (0.0%) | 60 (4.8%) |
| 18 to 34 Years | 0 (0.0%) | 121 (7.8%) |
| 35 to 64 Years | 403 (14.8%) | 143 (5.1%) |
| 65 to 74 Years | 42 (5.7%) | 31 (2.9%) |
| 75 Years and over | 11 (2.4%) | 77 (11.6%) |
Disability Class: Cognitive Difficulty
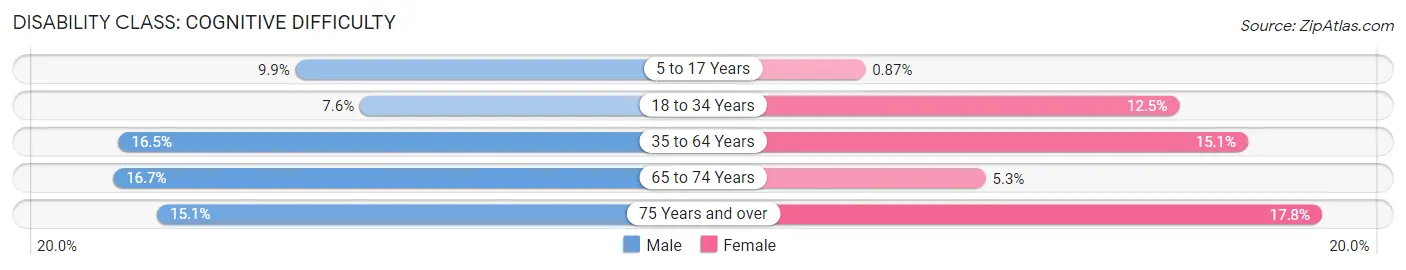
| Age Bracket | Male | Female |
| 5 to 17 Years | 125 (9.9%) | 11 (0.9%) |
| 18 to 34 Years | 110 (7.5%) | 194 (12.5%) |
| 35 to 64 Years | 448 (16.5%) | 425 (15.1%) |
| 65 to 74 Years | 123 (16.7%) | 57 (5.3%) |
| 75 Years and over | 68 (15.1%) | 118 (17.8%) |
Disability Class: Ambulatory Difficulty
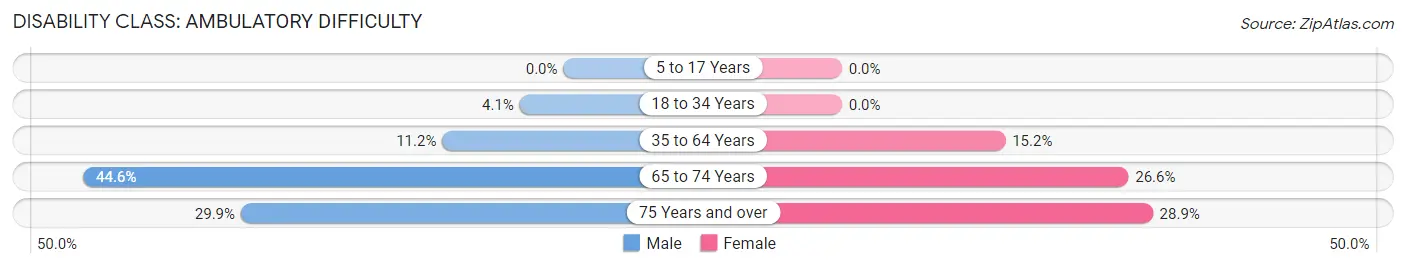
| Age Bracket | Male | Female |
| 5 to 17 Years | 0 (0.0%) | 0 (0.0%) |
| 18 to 34 Years | 59 (4.1%) | 0 (0.0%) |
| 35 to 64 Years | 305 (11.2%) | 428 (15.2%) |
| 65 to 74 Years | 328 (44.6%) | 284 (26.6%) |
| 75 Years and over | 135 (29.9%) | 191 (28.8%) |
Disability Class: Self-Care Difficulty
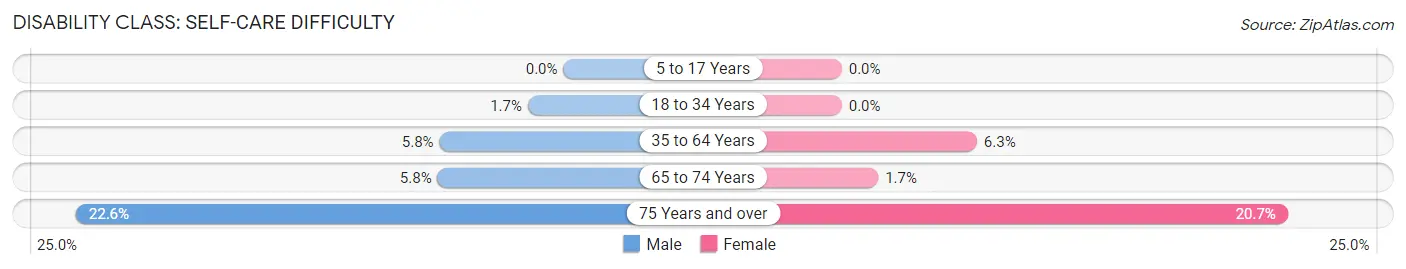
| Age Bracket | Male | Female |
| 5 to 17 Years | 0 (0.0%) | 0 (0.0%) |
| 18 to 34 Years | 24 (1.7%) | 0 (0.0%) |
| 35 to 64 Years | 156 (5.8%) | 177 (6.3%) |
| 65 to 74 Years | 43 (5.8%) | 18 (1.7%) |
| 75 Years and over | 102 (22.6%) | 137 (20.7%) |
Technology Access in Greeneville
Computing Device Access in Greeneville
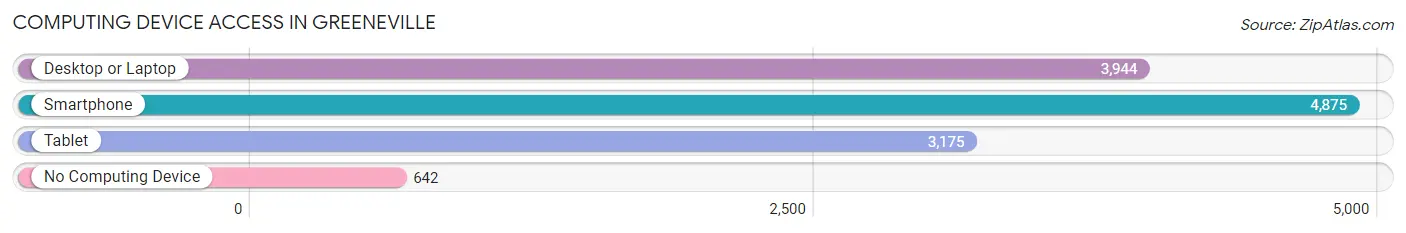
| Device Type | # Households | % Households |
| Desktop or Laptop | 3,944 | 64.9% |
| Smartphone | 4,875 | 80.2% |
| Tablet | 3,175 | 52.2% |
| No Computing Device | 642 | 10.6% |
| Total | 6,076 | 100.0% |
Internet Access in Greeneville
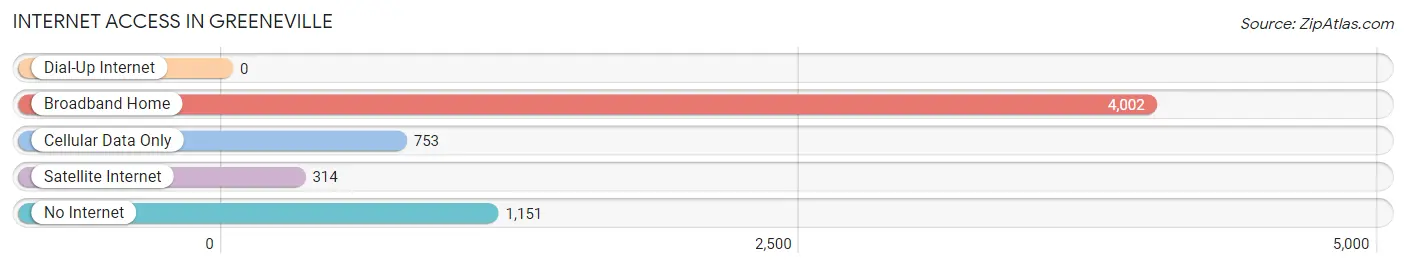
| Internet Type | # Households | % Households |
| Dial-Up Internet | 0 | 0.0% |
| Broadband Home | 4,002 | 65.9% |
| Cellular Data Only | 753 | 12.4% |
| Satellite Internet | 314 | 5.2% |
| No Internet | 1,151 | 18.9% |
| Total | 6,076 | 100.0% |
Greeneville Summary
Greeneville, Tennessee is a small town located in the northeastern corner of the state, in Greene County. It is situated in the foothills of the Appalachian Mountains, and is the county seat of Greene County. The town was founded in 1783 by Revolutionary War veteran, General Nathanael Greene, and is named in his honor. The town has a population of approximately 15,000 people, and is the home of Tusculum College, the oldest college in Tennessee.
Geography
Greeneville is located in the foothills of the Appalachian Mountains, and is situated in the Nolichucky River Valley. The town is located at the intersection of US 11E and US 70, and is approximately 75 miles northeast of Knoxville. The town is surrounded by the Cherokee National Forest, and is located near the Appalachian Trail. The town is located at an elevation of 1,400 feet, and has a humid subtropical climate.
Economy
Greeneville’s economy is largely based on agriculture, manufacturing, and tourism. The town is home to several large manufacturing companies, including Eastman Chemical Company, which produces chemicals and plastics, and Nisus Corporation, which produces wood preservatives. The town is also home to several small businesses, including restaurants, retail stores, and service providers. The town is also home to several tourist attractions, including the Andrew Johnson National Historic Site, the Davy Crockett Birthplace State Park, and the Greeneville-Greene County History Museum.
Demographics
As of the 2010 census, Greeneville had a population of 15,062 people. The racial makeup of the town was 90.2% White, 6.2% African American, 0.3% Native American, 0.7% Asian, 0.1% Pacific Islander, 1.2% from other races, and 1.3% from two or more races. Hispanic or Latino of any race were 2.7% of the population. The median income for a household in the town was $30,945, and the median income for a family was $37,945.
History
Greeneville was founded in 1783 by Revolutionary War veteran, General Nathanael Greene. The town was named in his honor, and was the first town in Tennessee to be named after an American Revolutionary War hero. The town was incorporated in 1797, and was the county seat of Greene County. During the Civil War, the town was the site of several battles, including the Battle of Greeneville in 1863. After the war, the town experienced a period of growth and prosperity, and was home to several prominent businesses, including the Greeneville Woolen Mills, which was the largest woolen mill in the South. The town was also home to several educational institutions, including Tusculum College, the oldest college in Tennessee.
Today, Greeneville is a small town with a population of approximately 15,000 people. The town is home to several businesses, including manufacturing companies, restaurants, retail stores, and service providers. The town is also home to several tourist attractions, including the Andrew Johnson National Historic Site, the Davy Crockett Birthplace State Park, and the Greeneville-Greene County History Museum.
Common Questions
What is the Total Population of Greeneville?
Total Population of Greeneville is 15,458.
What is the Total Male Population of Greeneville?
Total Male Population of Greeneville is 7,394.
What is the Total Female Population of Greeneville?
Total Female Population of Greeneville is 8,064.
What is the Ratio of Males per 100 Females in Greeneville?
There are 91.69 Males per 100 Females in Greeneville.
What is the Ratio of Females per 100 Males in Greeneville?
There are 109.06 Females per 100 Males in Greeneville.
What is the Median Population Age in Greeneville?
Median Population Age in Greeneville is 41.9 Years.
What is the Average Family Size in Greeneville
Average Family Size in Greeneville is 3.2 People.
What is the Average Household Size in Greeneville
Average Household Size in Greeneville is 2.4 People.
What is Per Capita Income in Greeneville?
Per Capita income in Greeneville is $28,314.
What is the Median Family Income in Greeneville?
Median Family Income in Greeneville is $61,673.
What is the Median Household income in Greeneville?
Median Household Income in Greeneville is $46,473.
What is Income or Wage Gap in Greeneville?
Income or Wage Gap in Greeneville is 6.9%.
Women in Greeneville earn 93.1 cents for every dollar earned by a man.
What is Inequality or Gini Index in Greeneville?
Inequality or Gini Index in Greeneville is 0.51.
How Large is the Labor Force in Greeneville?
There are 6,547 People in the Labor Forcein in Greeneville.
What is the Percentage of People in the Labor Force in Greeneville?
51.6% of People are in the Labor Force in Greeneville.
What is the Unemployment Rate in Greeneville?
Unemployment Rate in Greeneville is 9.2%.