South Cleveland, TN
South Cleveland Map
South Cleveland Overview
7,188
TOTAL POPULATION
3,618
MALE POPULATION
3,570
FEMALE POPULATION
101.34
MALES / 100 FEMALES
98.67
FEMALES / 100 MALES
40.9
MEDIAN AGE
2.8
AVG FAMILY SIZE
2.5
AVG HOUSEHOLD SIZE
$25,719
PER CAPITA INCOME
$69,636
AVG FAMILY INCOME
$61,547
AVG HOUSEHOLD INCOME
34.6%
WAGE / INCOME GAP [ % ]
65.4¢/ $1
WAGE / INCOME GAP [ $ ]
$9,923
FAMILY INCOME DEFICIT
0.33
INEQUALITY / GINI INDEX
3,483
LABOR FORCE [ PEOPLE ]
59.2%
PERCENT IN LABOR FORCE
10.5%
UNEMPLOYMENT RATE
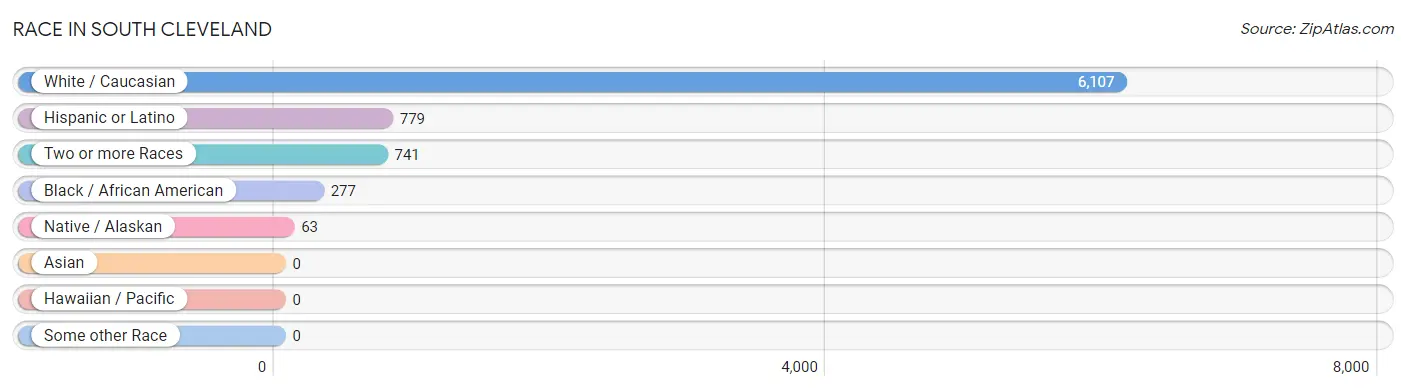
Race in South Cleveland
The most populous races in South Cleveland are White / Caucasian (6,107 | 85.0%), Hispanic or Latino (779 | 10.8%), and Two or more Races (741 | 10.3%).
| Race | # Population | % Population |
| Asian | 0 | 0.0% |
| Black / African American | 277 | 3.8% |
| Hawaiian / Pacific | 0 | 0.0% |
| Hispanic or Latino | 779 | 10.8% |
| Native / Alaskan | 63 | 0.9% |
| White / Caucasian | 6,107 | 85.0% |
| Two or more Races | 741 | 10.3% |
| Some other Race | 0 | 0.0% |
| Total | 7,188 | 100.0% |
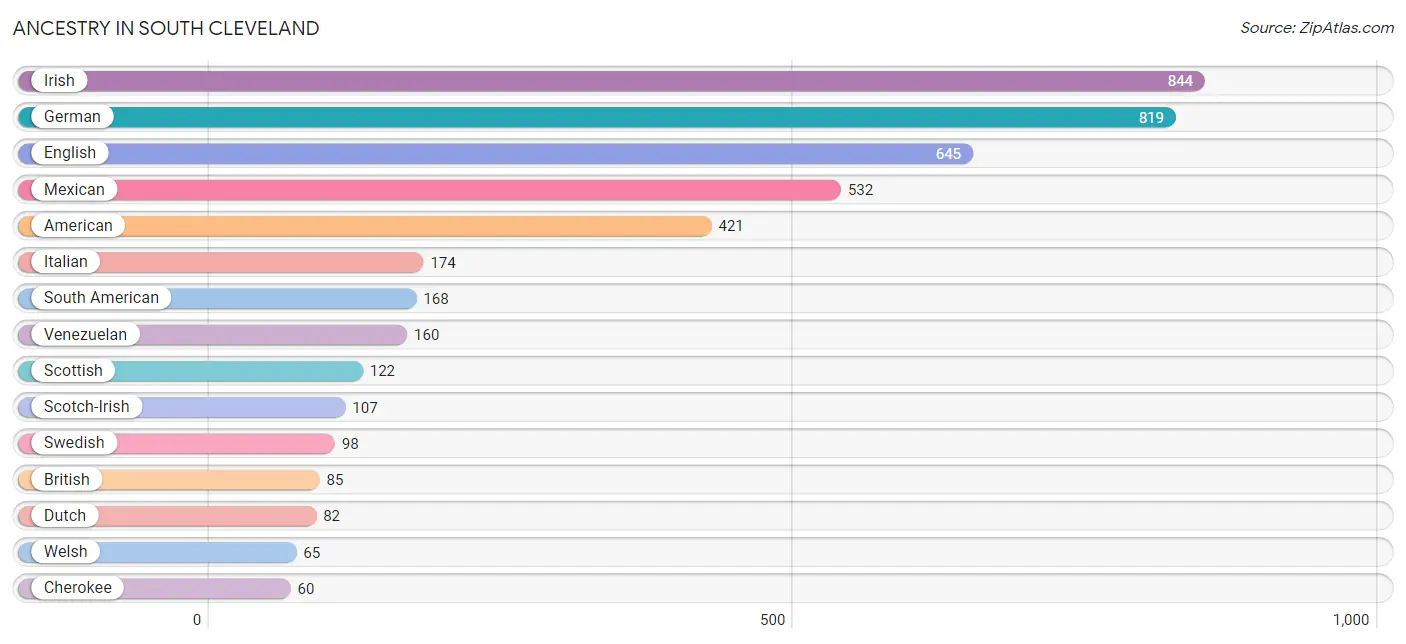
Ancestry in South Cleveland
The most populous ancestries reported in South Cleveland are Irish (844 | 11.7%), German (819 | 11.4%), English (645 | 9.0%), Mexican (532 | 7.4%), and American (421 | 5.9%), together accounting for 45.4% of all South Cleveland residents.
| Ancestry | # Population | % Population |
| African | 52 | 0.7% |
| American | 421 | 5.9% |
| British | 85 | 1.2% |
| Cherokee | 60 | 0.8% |
| Colombian | 8 | 0.1% |
| Cuban | 6 | 0.1% |
| Dutch | 82 | 1.1% |
| English | 645 | 9.0% |
| European | 46 | 0.6% |
| French | 18 | 0.3% |
| German | 819 | 11.4% |
| Irish | 844 | 11.7% |
| Italian | 174 | 2.4% |
| Mexican | 532 | 7.4% |
| Puerto Rican | 30 | 0.4% |
| Scotch-Irish | 107 | 1.5% |
| Scottish | 122 | 1.7% |
| South American | 168 | 2.3% |
| South American Indian | 8 | 0.1% |
| Subsaharan African | 52 | 0.7% |
| Swedish | 98 | 1.4% |
| Ukrainian | 32 | 0.4% |
| Venezuelan | 160 | 2.2% |
| Welsh | 65 | 0.9% | View All 24 Rows |
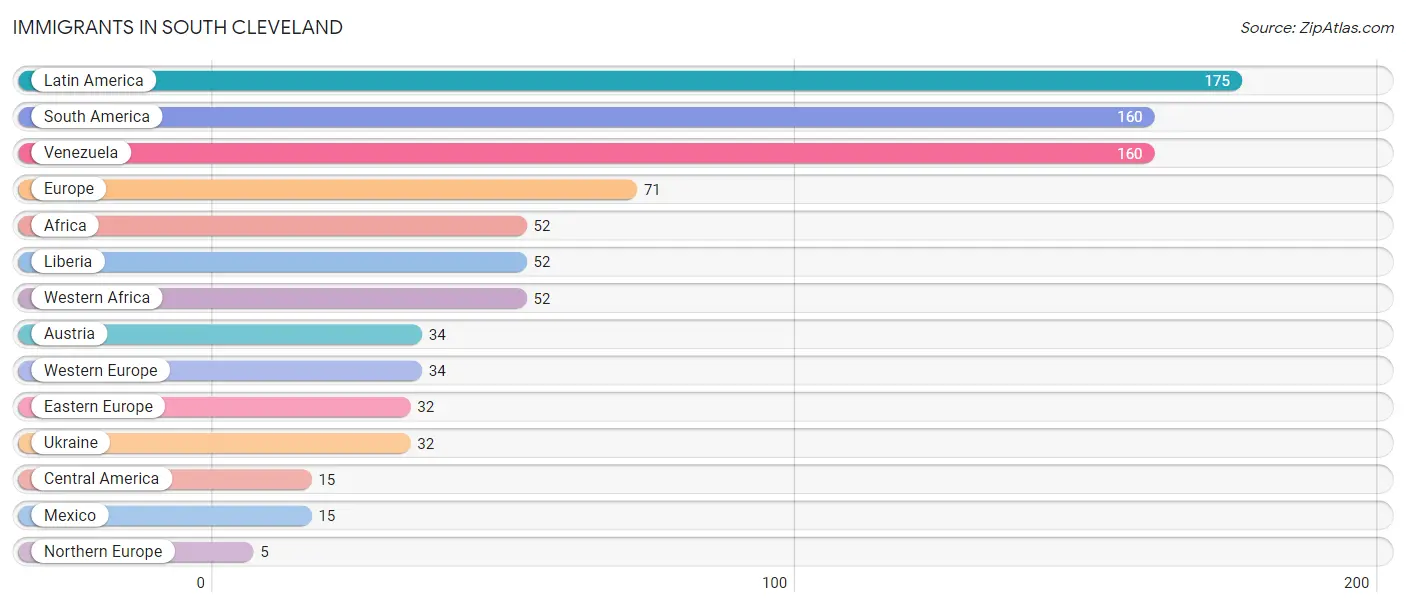
Immigrants in South Cleveland
The most numerous immigrant groups reported in South Cleveland came from Latin America (175 | 2.4%), South America (160 | 2.2%), Venezuela (160 | 2.2%), Europe (71 | 1.0%), and Africa (52 | 0.7%), together accounting for 8.6% of all South Cleveland residents.
| Immigration Origin | # Population | % Population |
| Africa | 52 | 0.7% |
| Austria | 34 | 0.5% |
| Central America | 15 | 0.2% |
| Eastern Europe | 32 | 0.4% |
| Europe | 71 | 1.0% |
| Latin America | 175 | 2.4% |
| Liberia | 52 | 0.7% |
| Mexico | 15 | 0.2% |
| Northern Europe | 5 | 0.1% |
| South America | 160 | 2.2% |
| Ukraine | 32 | 0.4% |
| Venezuela | 160 | 2.2% |
| Western Africa | 52 | 0.7% |
| Western Europe | 34 | 0.5% | View All 14 Rows |
Sex and Age in South Cleveland
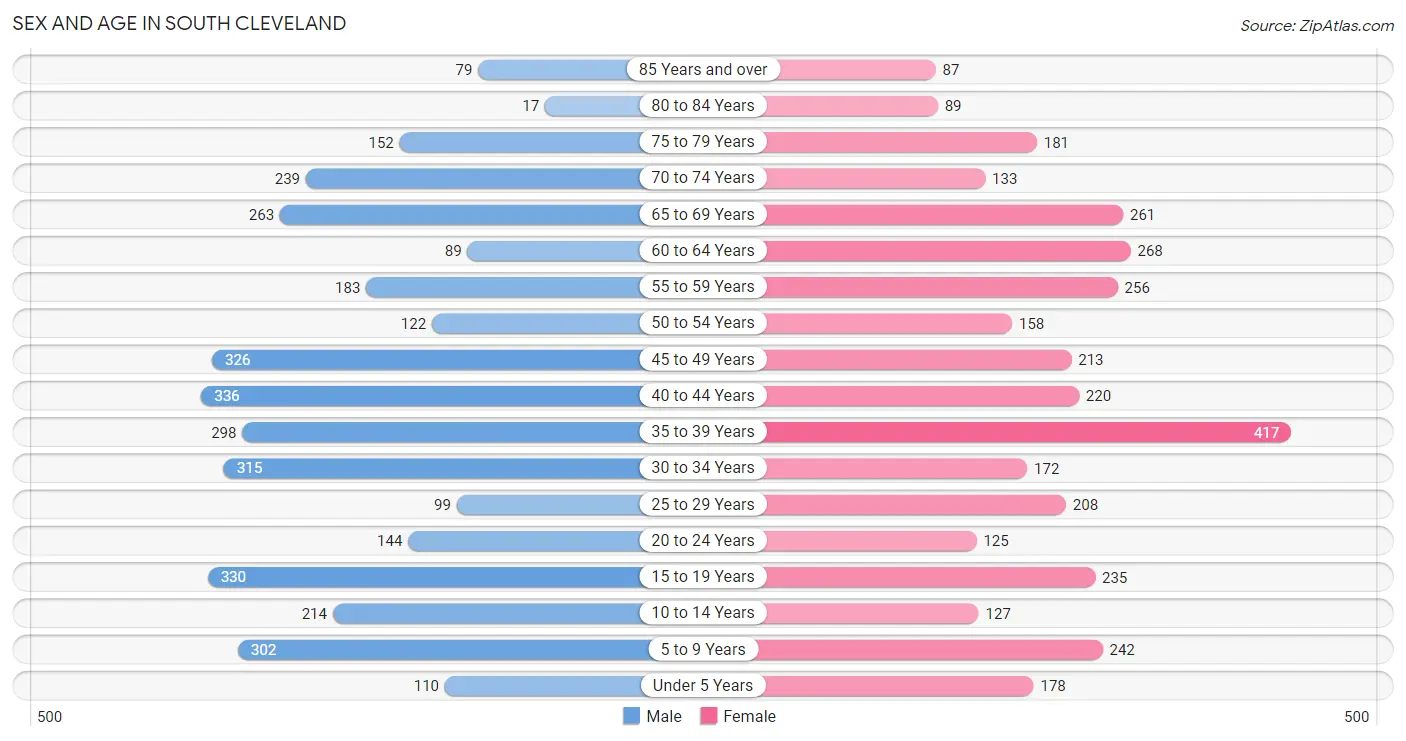
Sex and Age in South Cleveland
The most populous age groups in South Cleveland are 40 to 44 Years (336 | 9.3%) for men and 35 to 39 Years (417 | 11.7%) for women.
| Age Bracket | Male | Female |
| Under 5 Years | 110 (3.0%) | 178 (5.0%) |
| 5 to 9 Years | 302 (8.4%) | 242 (6.8%) |
| 10 to 14 Years | 214 (5.9%) | 127 (3.6%) |
| 15 to 19 Years | 330 (9.1%) | 235 (6.6%) |
| 20 to 24 Years | 144 (4.0%) | 125 (3.5%) |
| 25 to 29 Years | 99 (2.7%) | 208 (5.8%) |
| 30 to 34 Years | 315 (8.7%) | 172 (4.8%) |
| 35 to 39 Years | 298 (8.2%) | 417 (11.7%) |
| 40 to 44 Years | 336 (9.3%) | 220 (6.2%) |
| 45 to 49 Years | 326 (9.0%) | 213 (6.0%) |
| 50 to 54 Years | 122 (3.4%) | 158 (4.4%) |
| 55 to 59 Years | 183 (5.1%) | 256 (7.2%) |
| 60 to 64 Years | 89 (2.5%) | 268 (7.5%) |
| 65 to 69 Years | 263 (7.3%) | 261 (7.3%) |
| 70 to 74 Years | 239 (6.6%) | 133 (3.7%) |
| 75 to 79 Years | 152 (4.2%) | 181 (5.1%) |
| 80 to 84 Years | 17 (0.5%) | 89 (2.5%) |
| 85 Years and over | 79 (2.2%) | 87 (2.4%) |
| Total | 3,618 (100.0%) | 3,570 (100.0%) |
Families and Households in South Cleveland
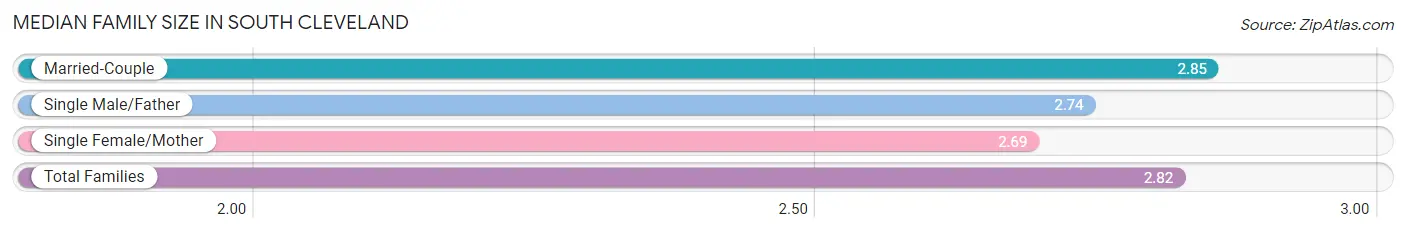
Median Family Size in South Cleveland
The median family size in South Cleveland is 2.82 persons per family, with married-couple families (1,737 | 80.8%) accounting for the largest median family size of 2.85 persons per family. On the other hand, single female/mother families (320 | 14.9%) represent the smallest median family size with 2.69 persons per family.
| Family Type | # Families | Family Size |
| Married-Couple | 1,737 (80.8%) | 2.85 |
| Single Male/Father | 93 (4.3%) | 2.74 |
| Single Female/Mother | 320 (14.9%) | 2.69 |
| Total Families | 2,150 (100.0%) | 2.82 |
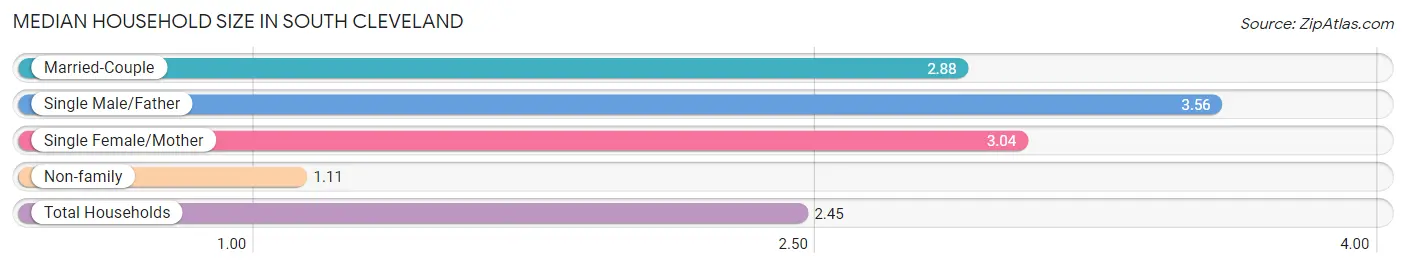
Median Household Size in South Cleveland
The median household size in South Cleveland is 2.45 persons per household, with single male/father households (93 | 3.2%) accounting for the largest median household size of 3.56 persons per household. non-family households (788 | 26.8%) represent the smallest median household size with 1.11 persons per household.
| Household Type | # Households | Household Size |
| Married-Couple | 1,737 (59.1%) | 2.88 |
| Single Male/Father | 93 (3.2%) | 3.56 |
| Single Female/Mother | 320 (10.9%) | 3.04 |
| Non-family | 788 (26.8%) | 1.11 |
| Total Households | 2,938 (100.0%) | 2.45 |
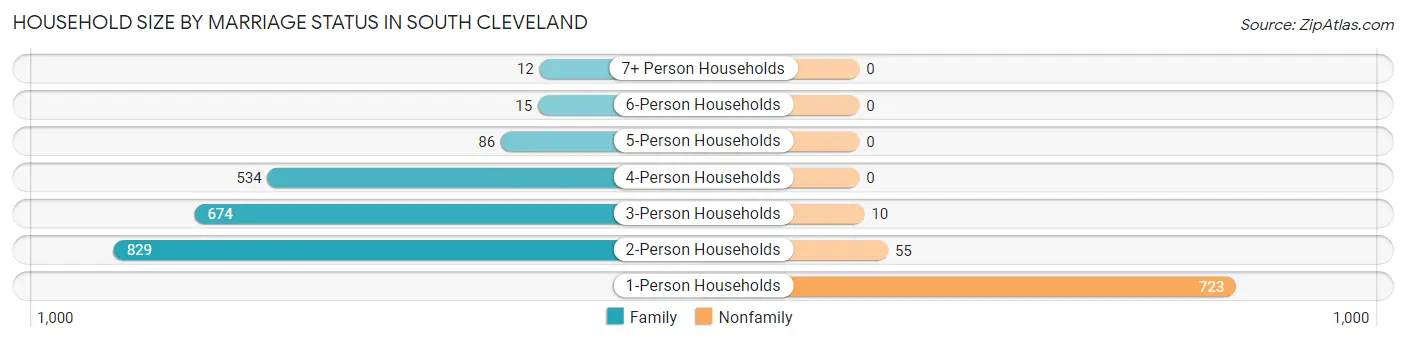
Household Size by Marriage Status in South Cleveland
Out of a total of 2,938 households in South Cleveland, 2,150 (73.2%) are family households, while 788 (26.8%) are nonfamily households. The most numerous type of family households are 2-person households, comprising 829, and the most common type of nonfamily households are 1-person households, comprising 723.
| Household Size | Family Households | Nonfamily Households |
| 1-Person Households | - | 723 (24.6%) |
| 2-Person Households | 829 (28.2%) | 55 (1.9%) |
| 3-Person Households | 674 (22.9%) | 10 (0.3%) |
| 4-Person Households | 534 (18.2%) | 0 (0.0%) |
| 5-Person Households | 86 (2.9%) | 0 (0.0%) |
| 6-Person Households | 15 (0.5%) | 0 (0.0%) |
| 7+ Person Households | 12 (0.4%) | 0 (0.0%) |
| Total | 2,150 (73.2%) | 788 (26.8%) |
Female Fertility in South Cleveland
Fertility by Age in South Cleveland
Average fertility rate in South Cleveland is 37.0 births per 1,000 women. Women in the age bracket of 20 to 34 years have the highest fertility rate with 119.0 births per 1,000 women. Women in the age bracket of 20 to 34 years acount for 100.0% of all women with births.
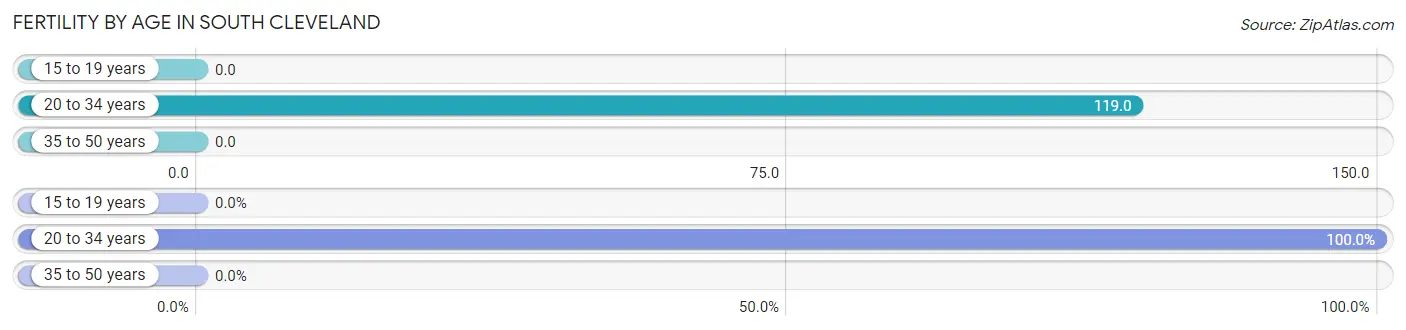
| Age Bracket | Women with Births | Births / 1,000 Women |
| 15 to 19 years | 0 (0.0%) | 0.0 |
| 20 to 34 years | 60 (100.0%) | 119.0 |
| 35 to 50 years | 0 (0.0%) | 0.0 |
| Total | 60 (100.0%) | 37.0 |
Fertility by Age by Marriage Status in South Cleveland
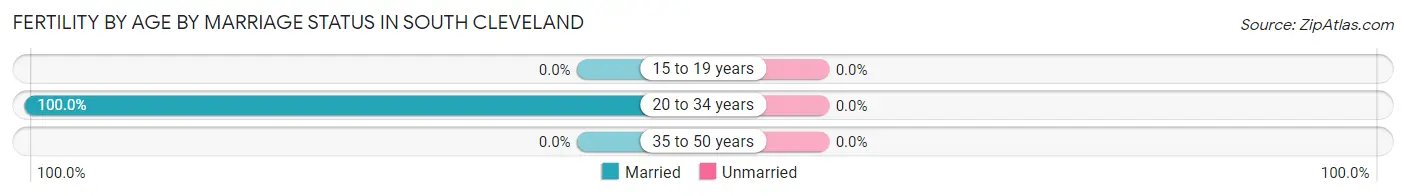
| Age Bracket | Married | Unmarried |
| 15 to 19 years | 0 (0.0%) | 0 (0.0%) |
| 20 to 34 years | 60 (100.0%) | 0 (0.0%) |
| 35 to 50 years | 0 (0.0%) | 0 (0.0%) |
| Total | 60 (100.0%) | 0 (0.0%) |
Fertility by Education in South Cleveland
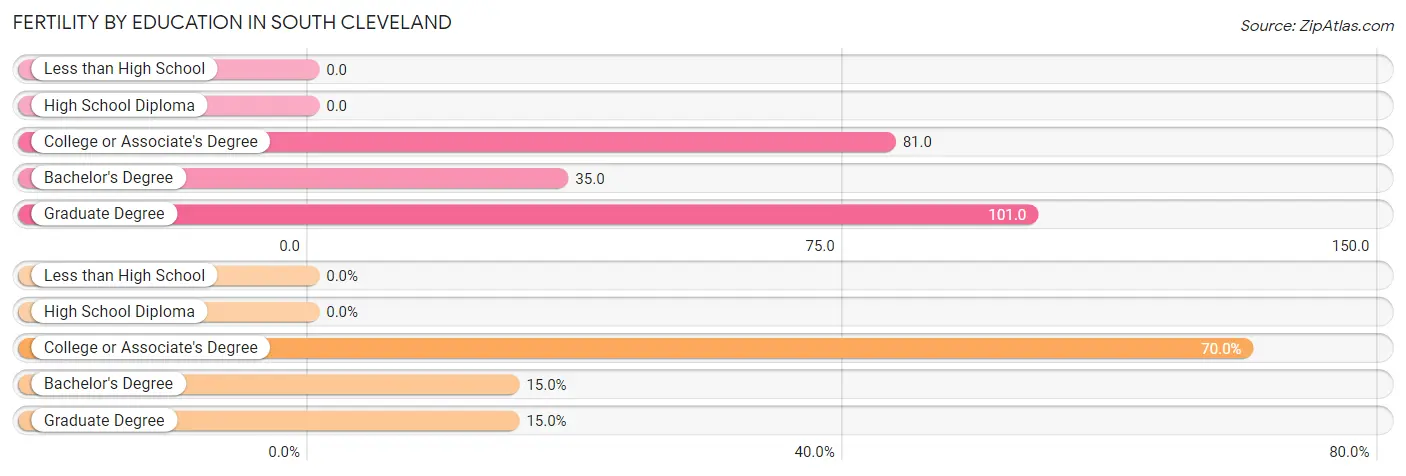
| Educational Attainment | Women with Births | Births / 1,000 Women |
| Less than High School | 0 (0.0%) | 0.0 |
| High School Diploma | 0 (0.0%) | 0.0 |
| College or Associate's Degree | 42 (70.0%) | 81.0 |
| Bachelor's Degree | 9 (15.0%) | 35.0 |
| Graduate Degree | 9 (15.0%) | 101.0 |
| Total | 60 (100.0%) | 37.0 |
Fertility by Education by Marriage Status in South Cleveland
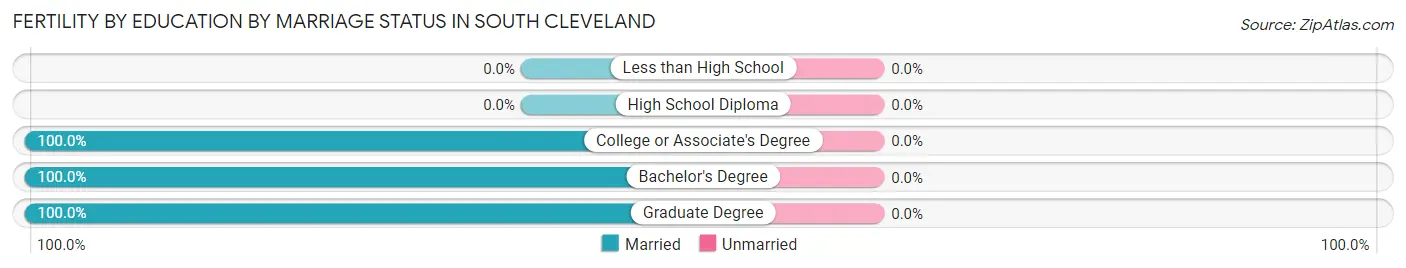
| Educational Attainment | Married | Unmarried |
| Less than High School | 0 (0.0%) | 0 (0.0%) |
| High School Diploma | 0 (0.0%) | 0 (0.0%) |
| College or Associate's Degree | 42 (100.0%) | 0 (0.0%) |
| Bachelor's Degree | 9 (100.0%) | 0 (0.0%) |
| Graduate Degree | 9 (100.0%) | 0 (0.0%) |
| Total | 60 (100.0%) | 0 (0.0%) |
Income in South Cleveland
Income Overview in South Cleveland
Per Capita Income in South Cleveland is $25,719, while median incomes of families and households are $69,636 and $61,547 respectively.
| Characteristic | Number | Measure |
| Per Capita Income | 7,188 | $25,719 |
| Median Family Income | 2,150 | $69,636 |
| Mean Family Income | 2,150 | $71,468 |
| Median Household Income | 2,938 | $61,547 |
| Mean Household Income | 2,938 | $61,923 |
| Income Deficit | 2,150 | $9,923 |
| Wage / Income Gap (%) | 7,188 | 34.61% |
| Wage / Income Gap ($) | 7,188 | 65.39¢ per $1 |
| Gini / Inequality Index | 7,188 | 0.33 |
Earnings by Sex in South Cleveland
Average Earnings in South Cleveland are $34,666, $45,581 for men and $29,806 for women, a difference of 34.6%.
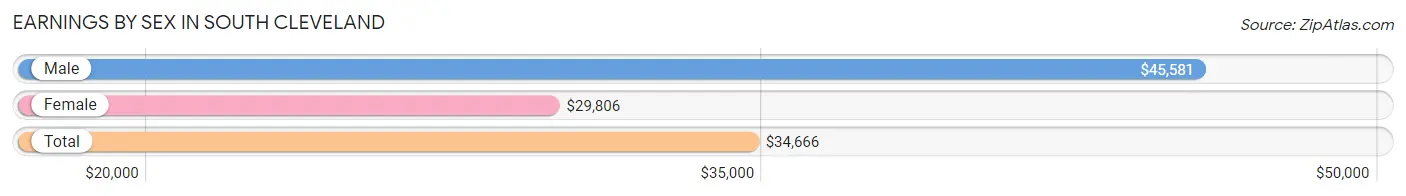
| Sex | Number | Average Earnings |
| Male | 1,775 (49.6%) | $45,581 |
| Female | 1,803 (50.4%) | $29,806 |
| Total | 3,578 (100.0%) | $34,666 |
Earnings by Sex by Income Bracket in South Cleveland
The most common earnings brackets in South Cleveland are $55,000 to $64,999 for men (309 | 17.4%) and $25,000 to $29,999 for women (241 | 13.4%).
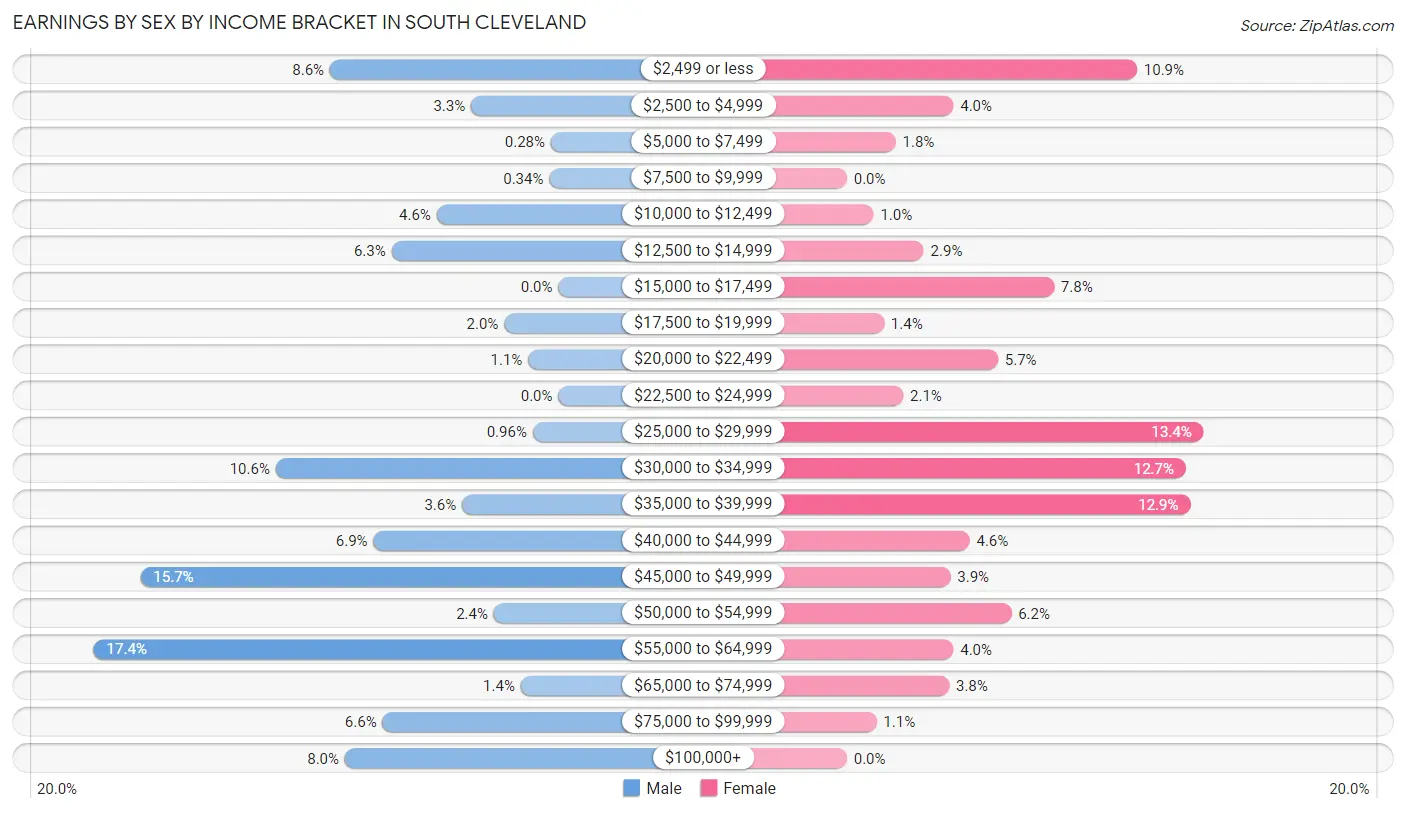
| Income | Male | Female |
| $2,499 or less | 152 (8.6%) | 196 (10.9%) |
| $2,500 to $4,999 | 58 (3.3%) | 72 (4.0%) |
| $5,000 to $7,499 | 5 (0.3%) | 33 (1.8%) |
| $7,500 to $9,999 | 6 (0.3%) | 0 (0.0%) |
| $10,000 to $12,499 | 81 (4.6%) | 18 (1.0%) |
| $12,500 to $14,999 | 111 (6.2%) | 52 (2.9%) |
| $15,000 to $17,499 | 0 (0.0%) | 140 (7.8%) |
| $17,500 to $19,999 | 36 (2.0%) | 25 (1.4%) |
| $20,000 to $22,499 | 20 (1.1%) | 102 (5.7%) |
| $22,500 to $24,999 | 0 (0.0%) | 38 (2.1%) |
| $25,000 to $29,999 | 17 (1.0%) | 241 (13.4%) |
| $30,000 to $34,999 | 188 (10.6%) | 229 (12.7%) |
| $35,000 to $39,999 | 64 (3.6%) | 232 (12.9%) |
| $40,000 to $44,999 | 123 (6.9%) | 83 (4.6%) |
| $45,000 to $49,999 | 278 (15.7%) | 70 (3.9%) |
| $50,000 to $54,999 | 43 (2.4%) | 111 (6.2%) |
| $55,000 to $64,999 | 309 (17.4%) | 72 (4.0%) |
| $65,000 to $74,999 | 25 (1.4%) | 69 (3.8%) |
| $75,000 to $99,999 | 117 (6.6%) | 20 (1.1%) |
| $100,000+ | 142 (8.0%) | 0 (0.0%) |
| Total | 1,775 (100.0%) | 1,803 (100.0%) |
Earnings by Sex by Educational Attainment in South Cleveland
Average earnings in South Cleveland are $46,721 for men and $30,074 for women, a difference of 35.6%. Men with an educational attainment of graduate degree enjoy the highest average annual earnings of $77,375, while those with less than high school education earn the least with $2,499. Women with an educational attainment of bachelor's degree earn the most with the average annual earnings of $41,711, while those with college or associate's degree education have the smallest earnings of $21,518.
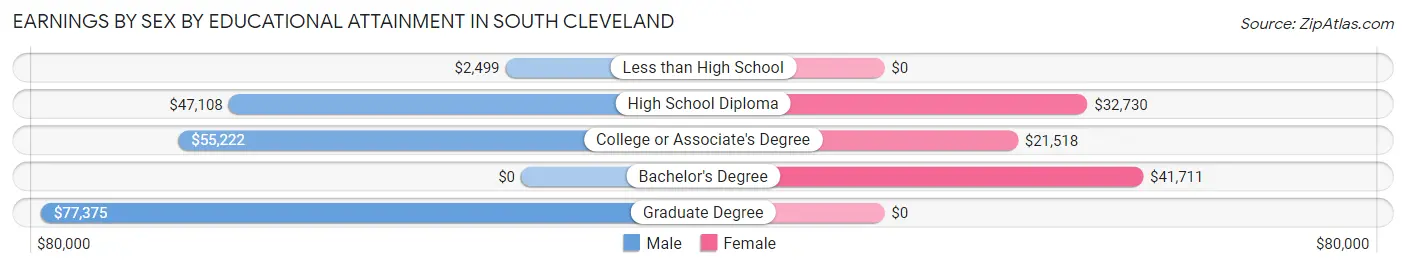
| Educational Attainment | Male Income | Female Income |
| Less than High School | $2,499 | $0 |
| High School Diploma | $47,108 | $32,730 |
| College or Associate's Degree | $55,222 | $21,518 |
| Bachelor's Degree | - | - |
| Graduate Degree | $77,375 | $0 |
| Total | $46,721 | $30,074 |
Family Income in South Cleveland
Family Income Brackets in South Cleveland
According to the South Cleveland family income data, there are 624 families falling into the $75,000 to $99,999 income range, which is the most common income bracket and makes up 29.0% of all families. Conversely, the $200,000+ income bracket is the least frequent group with only 15 families (0.7%) belonging to this category.
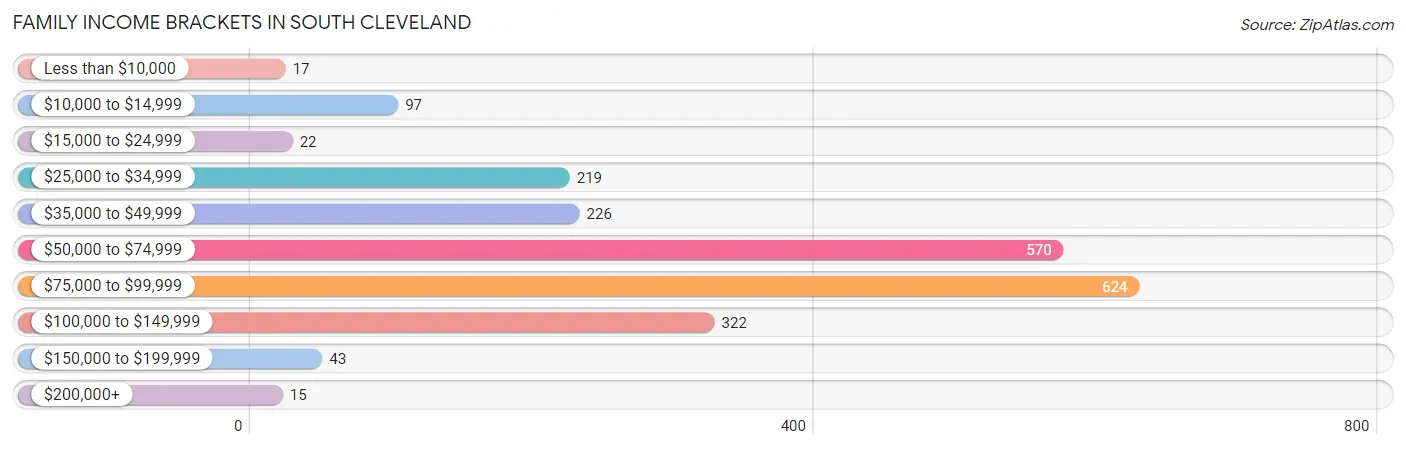
| Income Bracket | # Families | % Families |
| Less than $10,000 | 17 | 0.8% |
| $10,000 to $14,999 | 97 | 4.5% |
| $15,000 to $24,999 | 22 | 1.0% |
| $25,000 to $34,999 | 219 | 10.2% |
| $35,000 to $49,999 | 226 | 10.5% |
| $50,000 to $74,999 | 570 | 26.5% |
| $75,000 to $99,999 | 624 | 29.0% |
| $100,000 to $149,999 | 322 | 15.0% |
| $150,000 to $199,999 | 43 | 2.0% |
| $200,000+ | 15 | 0.7% |
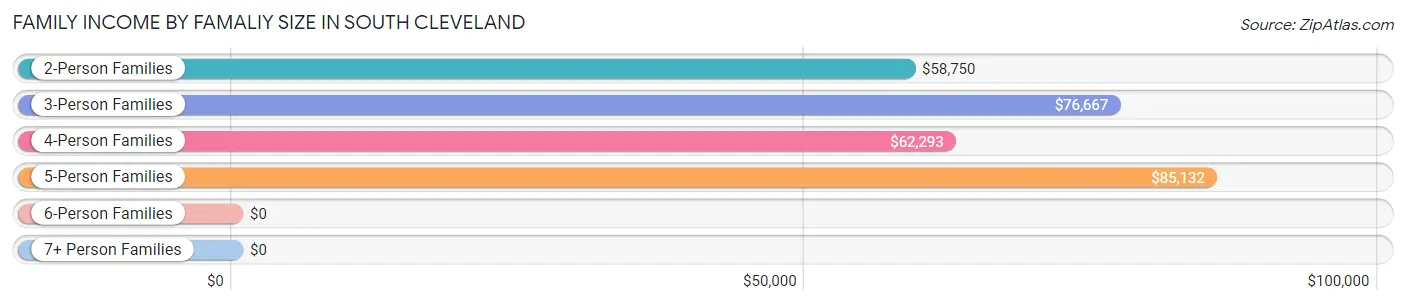
Family Income by Famaliy Size in South Cleveland
5-person families (86 | 4.0%) account for the highest median family income in South Cleveland with $85,132 per family, while 2-person families (955 | 44.4%) have the highest median income of $29,375 per family member.
| Income Bracket | # Families | Median Income |
| 2-Person Families | 955 (44.4%) | $58,750 |
| 3-Person Families | 548 (25.5%) | $76,667 |
| 4-Person Families | 534 (24.8%) | $62,293 |
| 5-Person Families | 86 (4.0%) | $85,132 |
| 6-Person Families | 15 (0.7%) | $0 |
| 7+ Person Families | 12 (0.6%) | $0 |
| Total | 2,150 (100.0%) | $69,636 |
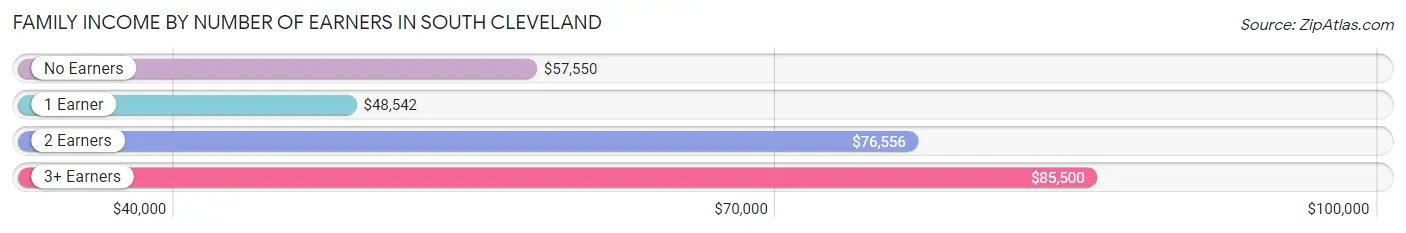
Family Income by Number of Earners in South Cleveland
The median family income in South Cleveland is $69,636, with families comprising 3+ earners (64) having the highest median family income of $85,500, while families with 1 earner (677) have the lowest median family income of $48,542, accounting for 3.0% and 31.5% of families, respectively.
| Number of Earners | # Families | Median Income |
| No Earners | 379 (17.6%) | $57,550 |
| 1 Earner | 677 (31.5%) | $48,542 |
| 2 Earners | 1,030 (47.9%) | $76,556 |
| 3+ Earners | 64 (3.0%) | $85,500 |
| Total | 2,150 (100.0%) | $69,636 |
Household Income in South Cleveland
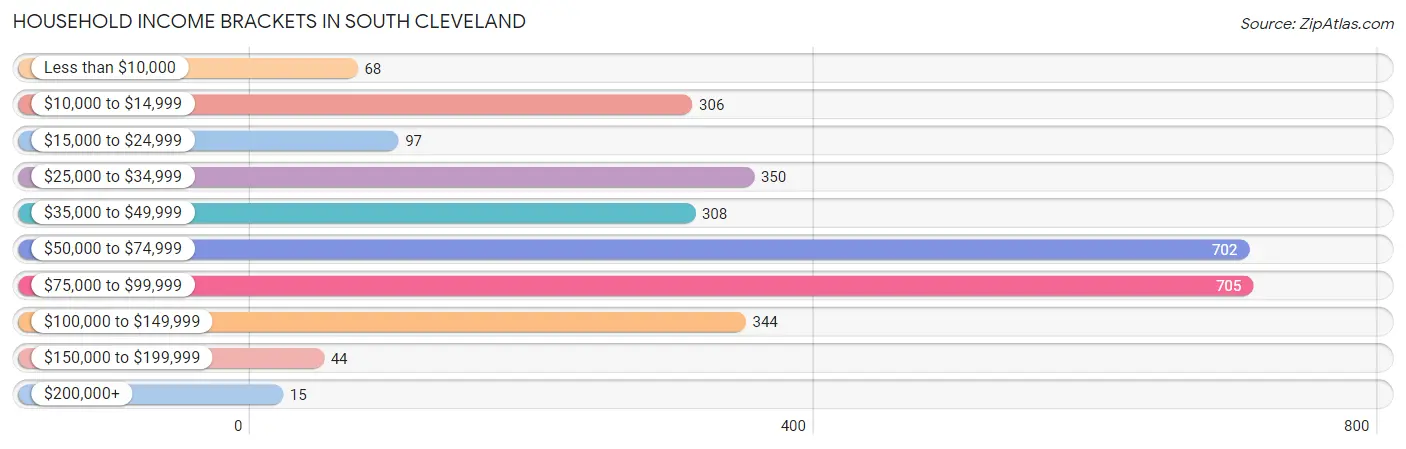
Household Income Brackets in South Cleveland
With 705 households falling in the category, the $75,000 to $99,999 income range is the most frequent in South Cleveland, accounting for 24.0% of all households. In contrast, only 15 households (0.5%) fall into the $200,000+ income bracket, making it the least populous group.
| Income Bracket | # Households | % Households |
| Less than $10,000 | 68 | 2.3% |
| $10,000 to $14,999 | 306 | 10.4% |
| $15,000 to $24,999 | 97 | 3.3% |
| $25,000 to $34,999 | 350 | 11.9% |
| $35,000 to $49,999 | 308 | 10.5% |
| $50,000 to $74,999 | 702 | 23.9% |
| $75,000 to $99,999 | 705 | 24.0% |
| $100,000 to $149,999 | 344 | 11.7% |
| $150,000 to $199,999 | 44 | 1.5% |
| $200,000+ | 15 | 0.5% |
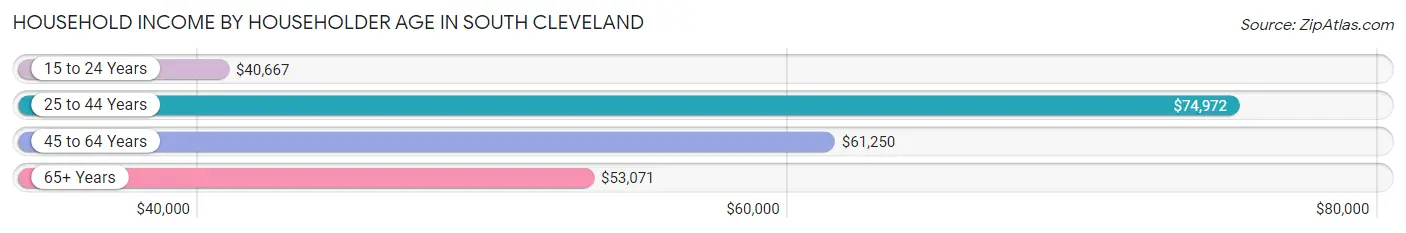
Household Income by Householder Age in South Cleveland
The median household income in South Cleveland is $61,547, with the highest median household income of $74,972 found in the 25 to 44 years age bracket for the primary householder. A total of 1,017 households (34.6%) fall into this category. Meanwhile, the 15 to 24 years age bracket for the primary householder has the lowest median household income of $40,667, with 64 households (2.2%) in this group.
| Income Bracket | # Households | Median Income |
| 15 to 24 Years | 64 (2.2%) | $40,667 |
| 25 to 44 Years | 1,017 (34.6%) | $74,972 |
| 45 to 64 Years | 857 (29.2%) | $61,250 |
| 65+ Years | 1,000 (34.0%) | $53,071 |
| Total | 2,938 (100.0%) | $61,547 |
Poverty in South Cleveland
Income Below Poverty by Sex and Age in South Cleveland
With 10.5% poverty level for males and 8.8% for females among the residents of South Cleveland, 15 year old males and 18 to 24 year old females are the most vulnerable to poverty, with 26 males (33.3%) and 33 females (20.9%) in their respective age groups living below the poverty level.
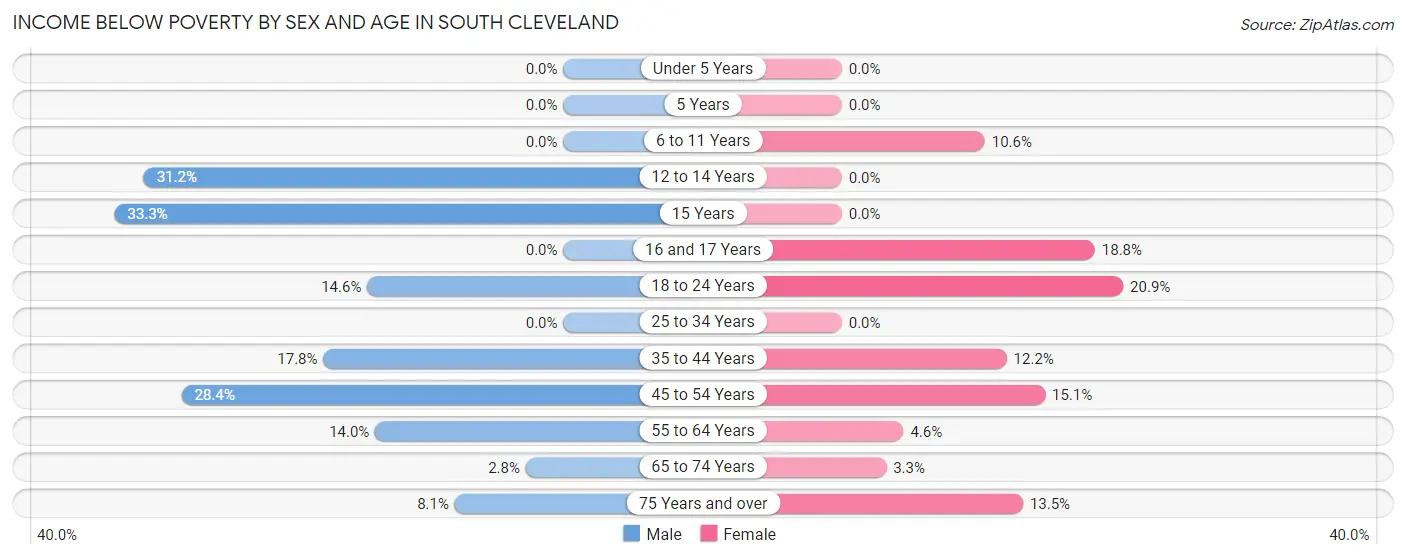
| Age Bracket | Male | Female |
| Under 5 Years | 0 (0.0%) | 0 (0.0%) |
| 5 Years | 0 (0.0%) | 0 (0.0%) |
| 6 to 11 Years | 0 (0.0%) | 29 (10.6%) |
| 12 to 14 Years | 19 (31.1%) | 0 (0.0%) |
| 15 Years | 26 (33.3%) | 0 (0.0%) |
| 16 and 17 Years | 0 (0.0%) | 28 (18.8%) |
| 18 to 24 Years | 23 (14.6%) | 33 (20.9%) |
| 25 to 34 Years | 0 (0.0%) | 0 (0.0%) |
| 35 to 44 Years | 113 (17.8%) | 78 (12.2%) |
| 45 to 54 Years | 127 (28.3%) | 56 (15.1%) |
| 55 to 64 Years | 38 (14.0%) | 24 (4.6%) |
| 65 to 74 Years | 14 (2.8%) | 13 (3.3%) |
| 75 Years and over | 20 (8.1%) | 48 (13.5%) |
| Total | 380 (10.5%) | 309 (8.8%) |
Income Above Poverty by Sex and Age in South Cleveland
According to the poverty statistics in South Cleveland, males aged under 5 years and females aged under 5 years are the age groups that are most secure financially, with 100.0% of males and 100.0% of females in these age groups living above the poverty line.
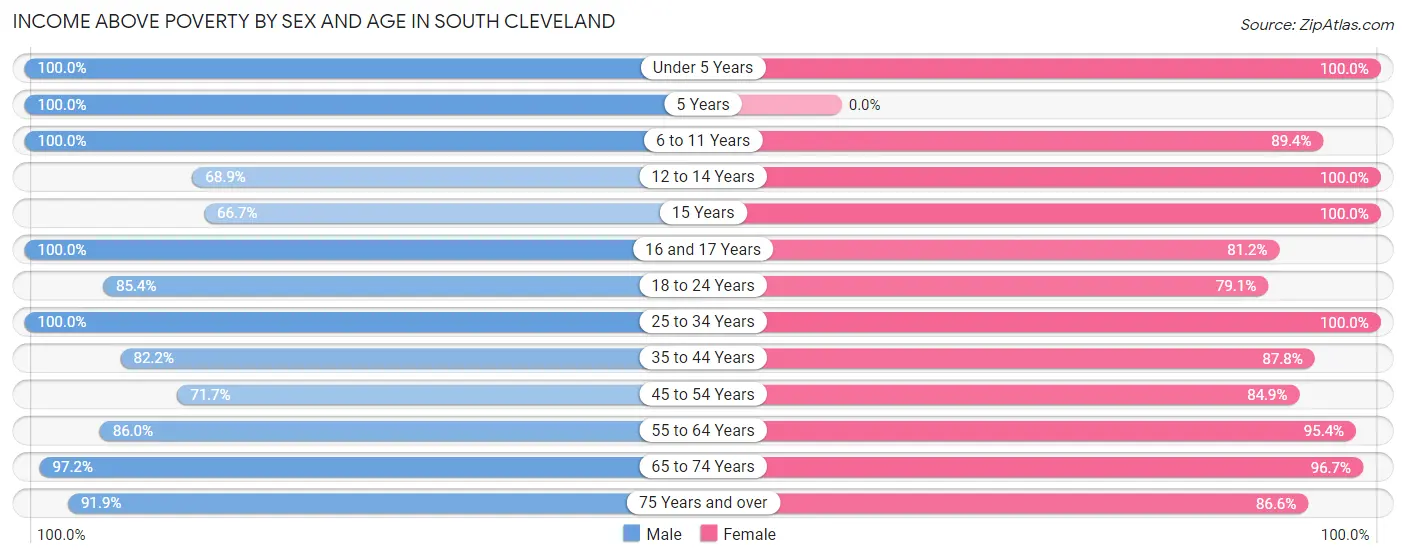
| Age Bracket | Male | Female |
| Under 5 Years | 110 (100.0%) | 135 (100.0%) |
| 5 Years | 101 (100.0%) | 0 (0.0%) |
| 6 to 11 Years | 354 (100.0%) | 244 (89.4%) |
| 12 to 14 Years | 42 (68.9%) | 96 (100.0%) |
| 15 Years | 52 (66.7%) | 53 (100.0%) |
| 16 and 17 Years | 238 (100.0%) | 121 (81.2%) |
| 18 to 24 Years | 135 (85.4%) | 125 (79.1%) |
| 25 to 34 Years | 414 (100.0%) | 380 (100.0%) |
| 35 to 44 Years | 521 (82.2%) | 559 (87.8%) |
| 45 to 54 Years | 321 (71.7%) | 315 (84.9%) |
| 55 to 64 Years | 234 (86.0%) | 500 (95.4%) |
| 65 to 74 Years | 488 (97.2%) | 381 (96.7%) |
| 75 Years and over | 228 (91.9%) | 309 (86.6%) |
| Total | 3,238 (89.5%) | 3,218 (91.2%) |
Income Below Poverty Among Married-Couple Families in South Cleveland
The poverty statistics for married-couple families in South Cleveland show that 4.0% or 69 of the total 1,737 families live below the poverty line. Families with 1 or 2 children have the highest poverty rate of 4.5%, comprising of 39 families. On the other hand, families with 3 or 4 children have the lowest poverty rate of 0.0%, which includes 0 families.
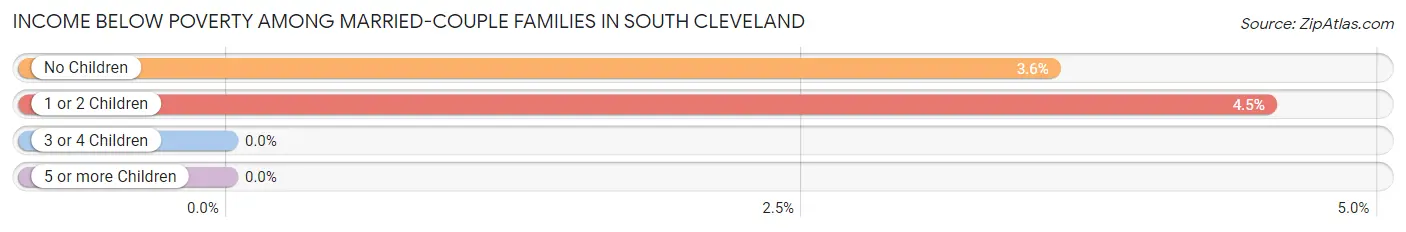
| Children | Above Poverty | Below Poverty |
| No Children | 808 (96.4%) | 30 (3.6%) |
| 1 or 2 Children | 823 (95.5%) | 39 (4.5%) |
| 3 or 4 Children | 37 (100.0%) | 0 (0.0%) |
| 5 or more Children | 0 (0.0%) | 0 (0.0%) |
| Total | 1,668 (96.0%) | 69 (4.0%) |
Income Below Poverty Among Single-Parent Households in South Cleveland
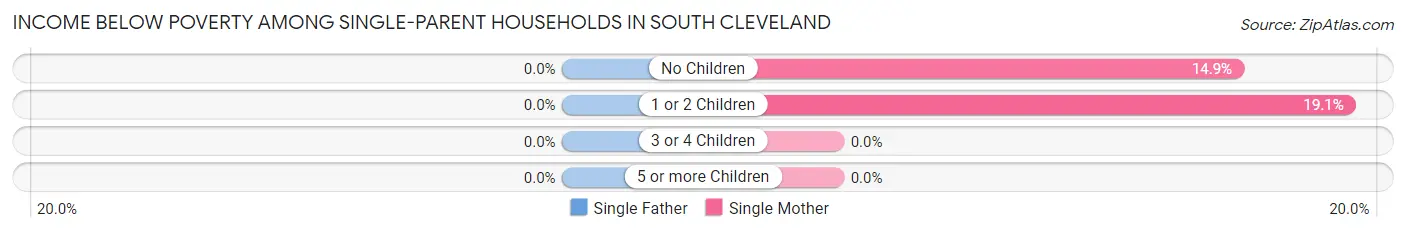
| Children | Single Father | Single Mother |
| No Children | 0 (0.0%) | 17 (14.9%) |
| 1 or 2 Children | 0 (0.0%) | 37 (19.1%) |
| 3 or 4 Children | 0 (0.0%) | 0 (0.0%) |
| 5 or more Children | 0 (0.0%) | 0 (0.0%) |
| Total | 0 (0.0%) | 54 (16.9%) |
Income Below Poverty Among Married-Couple vs Single-Parent Households in South Cleveland
The poverty data for South Cleveland shows that 69 of the married-couple family households (4.0%) and 54 of the single-parent households (13.1%) are living below the poverty level. Within the married-couple family households, those with 1 or 2 children have the highest poverty rate, with 39 households (4.5%) falling below the poverty line. Among the single-parent households, those with no children have the highest poverty rate, with 17 household (13.7%) living below poverty.
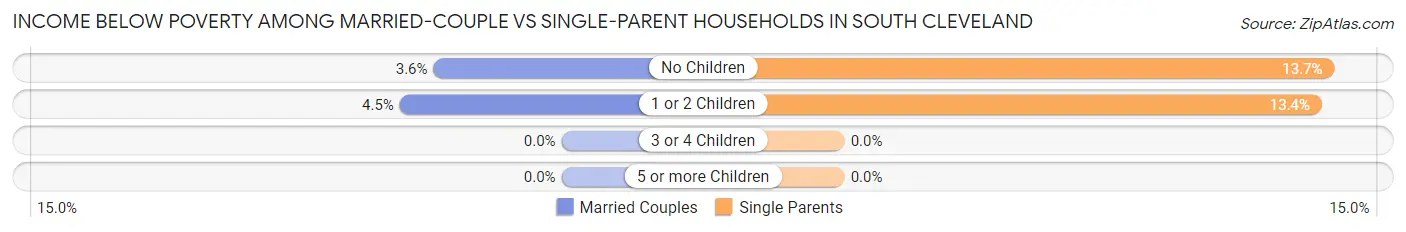
| Children | Married-Couple Families | Single-Parent Households |
| No Children | 30 (3.6%) | 17 (13.7%) |
| 1 or 2 Children | 39 (4.5%) | 37 (13.4%) |
| 3 or 4 Children | 0 (0.0%) | 0 (0.0%) |
| 5 or more Children | 0 (0.0%) | 0 (0.0%) |
| Total | 69 (4.0%) | 54 (13.1%) |
Employment Characteristics in South Cleveland
Employment by Class of Employer in South Cleveland
Among the 3,020 employed individuals in South Cleveland, private company employees (1,912 | 63.3%), local government employees (404 | 13.4%), and self-employed (not incorporated) (301 | 10.0%) make up the most common classes of employment.
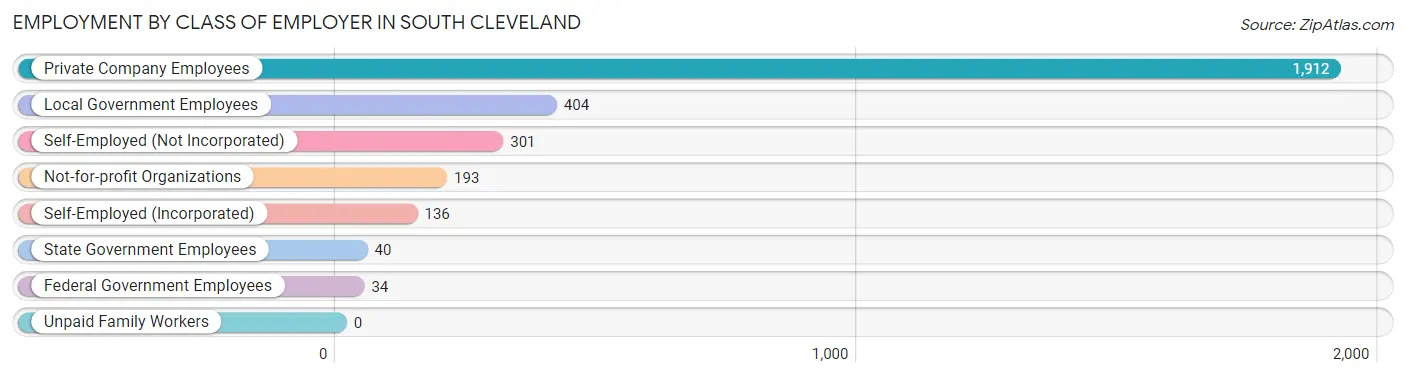
| Employer Class | # Employees | % Employees |
| Private Company Employees | 1,912 | 63.3% |
| Self-Employed (Incorporated) | 136 | 4.5% |
| Self-Employed (Not Incorporated) | 301 | 10.0% |
| Not-for-profit Organizations | 193 | 6.4% |
| Local Government Employees | 404 | 13.4% |
| State Government Employees | 40 | 1.3% |
| Federal Government Employees | 34 | 1.1% |
| Unpaid Family Workers | 0 | 0.0% |
| Total | 3,020 | 100.0% |
Employment Status by Age in South Cleveland
According to the labor force statistics for South Cleveland, out of the total population over 16 years of age (5,884), 59.2% or 3,483 individuals are in the labor force, with 10.5% or 366 of them unemployed. The age group with the highest labor force participation rate is 25 to 29 years, with 91.9% or 282 individuals in the labor force. Within the labor force, the 16 to 19 years age range has the highest percentage of unemployed individuals, with 90.8% or 148 of them being unemployed.
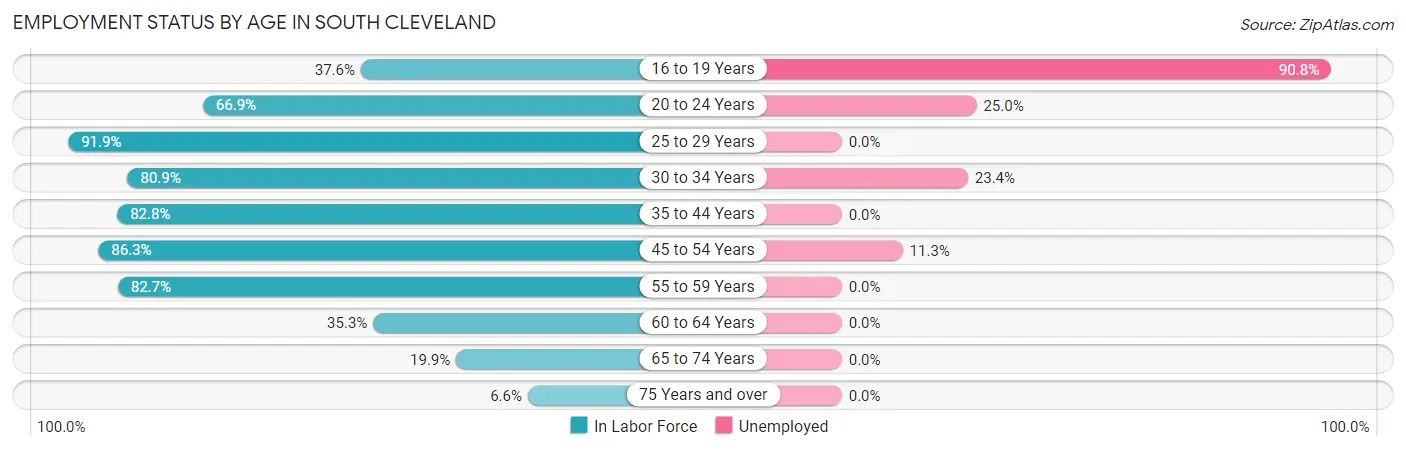
| Age Bracket | In Labor Force | Unemployed |
| 16 to 19 Years | 163 (37.6%) | 148 (90.8%) |
| 20 to 24 Years | 180 (66.9%) | 45 (25.0%) |
| 25 to 29 Years | 282 (91.9%) | 0 (0.0%) |
| 30 to 34 Years | 394 (80.9%) | 92 (23.4%) |
| 35 to 44 Years | 1,052 (82.8%) | 0 (0.0%) |
| 45 to 54 Years | 707 (86.3%) | 80 (11.3%) |
| 55 to 59 Years | 363 (82.7%) | 0 (0.0%) |
| 60 to 64 Years | 126 (35.3%) | 0 (0.0%) |
| 65 to 74 Years | 178 (19.9%) | 0 (0.0%) |
| 75 Years and over | 40 (6.6%) | 0 (0.0%) |
| Total | 3,483 (59.2%) | 366 (10.5%) |
Employment Status by Educational Attainment in South Cleveland
According to labor force statistics for South Cleveland, 79.5% of individuals (2,926) out of the total population between 25 and 64 years of age (3,680) are in the labor force, with 5.9% or 173 of them being unemployed. The group with the highest labor force participation rate are those with the educational attainment of college / associate degree, with 87.1% or 1,158 individuals in the labor force. Within the labor force, individuals with high school diploma education have the highest percentage of unemployment, with 8.9% or 100 of them being unemployed.
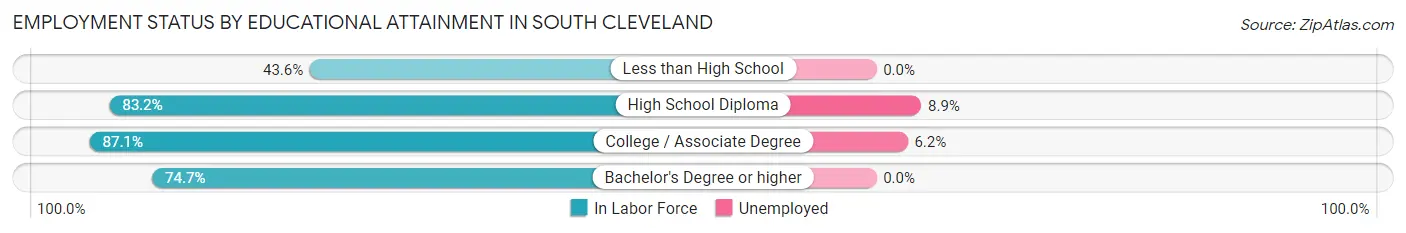
| Educational Attainment | In Labor Force | Unemployed |
| Less than High School | 146 (43.6%) | 0 (0.0%) |
| High School Diploma | 1,122 (83.2%) | 120 (8.9%) |
| College / Associate Degree | 1,158 (87.1%) | 82 (6.2%) |
| Bachelor's Degree or higher | 498 (74.7%) | 0 (0.0%) |
| Total | 2,926 (79.5%) | 217 (5.9%) |
Employment Occupations by Sex in South Cleveland
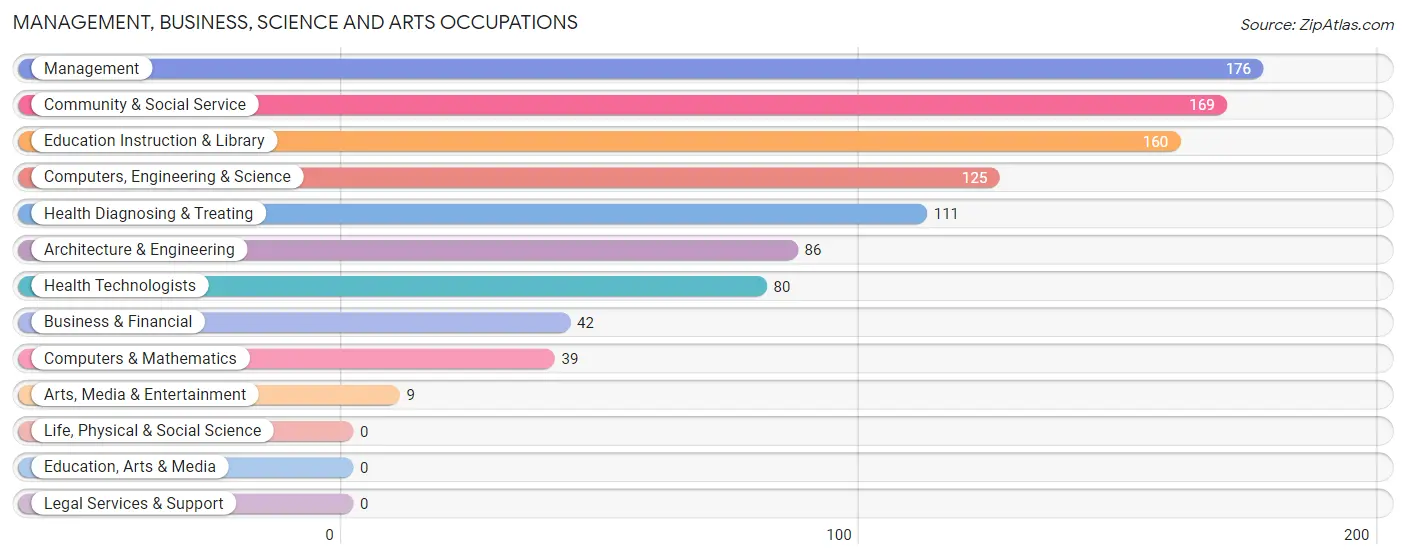
Management, Business, Science and Arts Occupations
The most common Management, Business, Science and Arts occupations in South Cleveland are Management (176 | 5.6%), Community & Social Service (169 | 5.4%), Education Instruction & Library (160 | 5.1%), Computers, Engineering & Science (125 | 4.0%), and Health Diagnosing & Treating (111 | 3.6%).
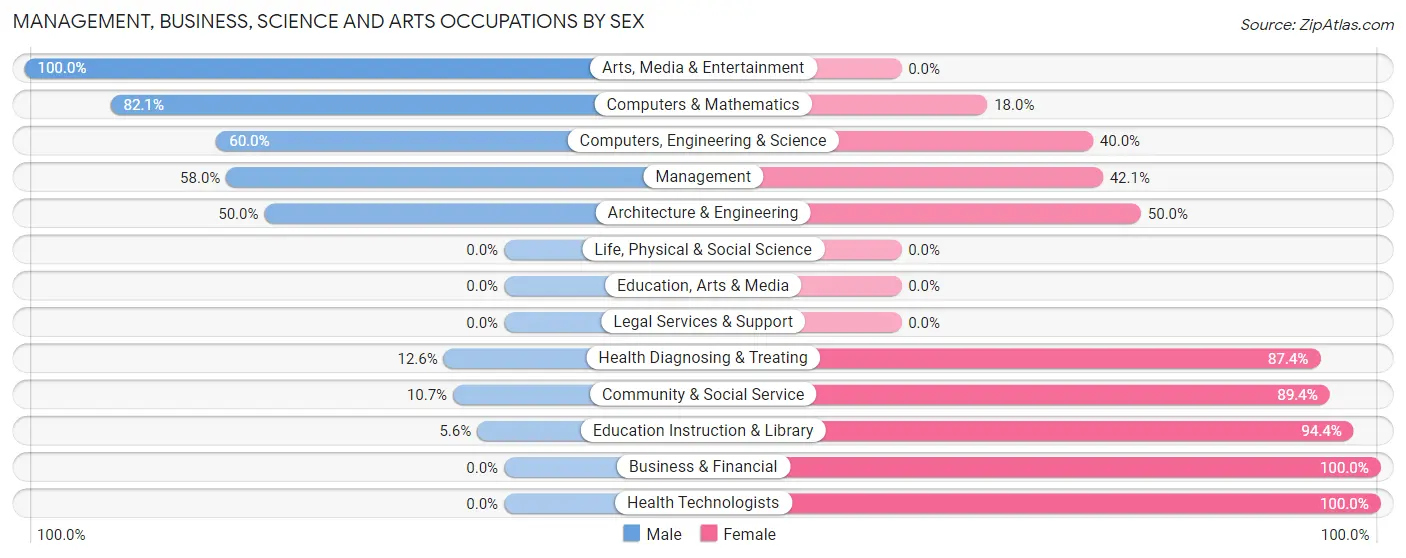
Management, Business, Science and Arts Occupations by Sex
Within the Management, Business, Science and Arts occupations in South Cleveland, the most male-oriented occupations are Arts, Media & Entertainment (100.0%), Computers & Mathematics (82.1%), and Computers, Engineering & Science (60.0%), while the most female-oriented occupations are Business & Financial (100.0%), Health Technologists (100.0%), and Education Instruction & Library (94.4%).
| Occupation | Male | Female |
| Management | 102 (58.0%) | 74 (42.0%) |
| Business & Financial | 0 (0.0%) | 42 (100.0%) |
| Computers, Engineering & Science | 75 (60.0%) | 50 (40.0%) |
| Computers & Mathematics | 32 (82.1%) | 7 (17.9%) |
| Architecture & Engineering | 43 (50.0%) | 43 (50.0%) |
| Life, Physical & Social Science | 0 (0.0%) | 0 (0.0%) |
| Community & Social Service | 18 (10.6%) | 151 (89.3%) |
| Education, Arts & Media | 0 (0.0%) | 0 (0.0%) |
| Legal Services & Support | 0 (0.0%) | 0 (0.0%) |
| Education Instruction & Library | 9 (5.6%) | 151 (94.4%) |
| Arts, Media & Entertainment | 9 (100.0%) | 0 (0.0%) |
| Health Diagnosing & Treating | 14 (12.6%) | 97 (87.4%) |
| Health Technologists | 0 (0.0%) | 80 (100.0%) |
| Total (Category) | 209 (33.6%) | 414 (66.4%) |
| Total (Overall) | 1,392 (44.6%) | 1,728 (55.4%) |
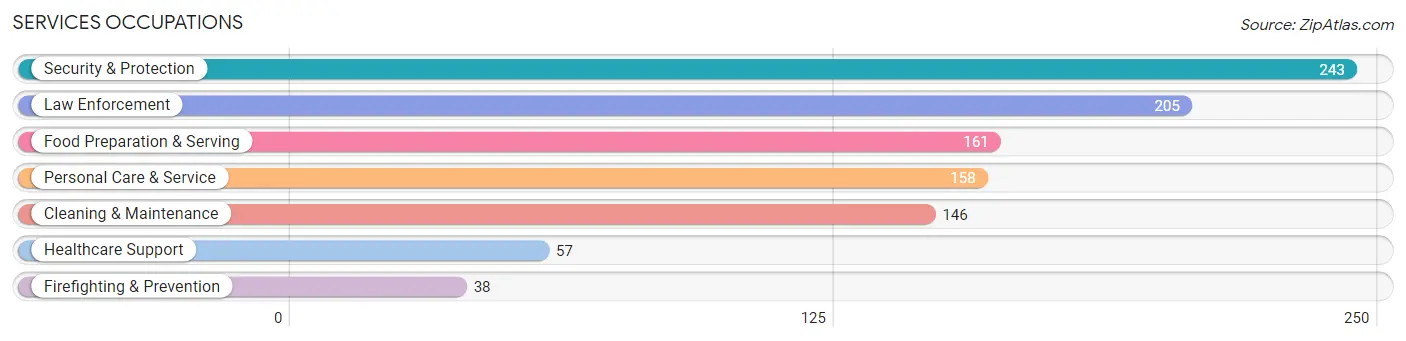
Services Occupations
The most common Services occupations in South Cleveland are Security & Protection (243 | 7.8%), Law Enforcement (205 | 6.6%), Food Preparation & Serving (161 | 5.2%), Personal Care & Service (158 | 5.1%), and Cleaning & Maintenance (146 | 4.7%).
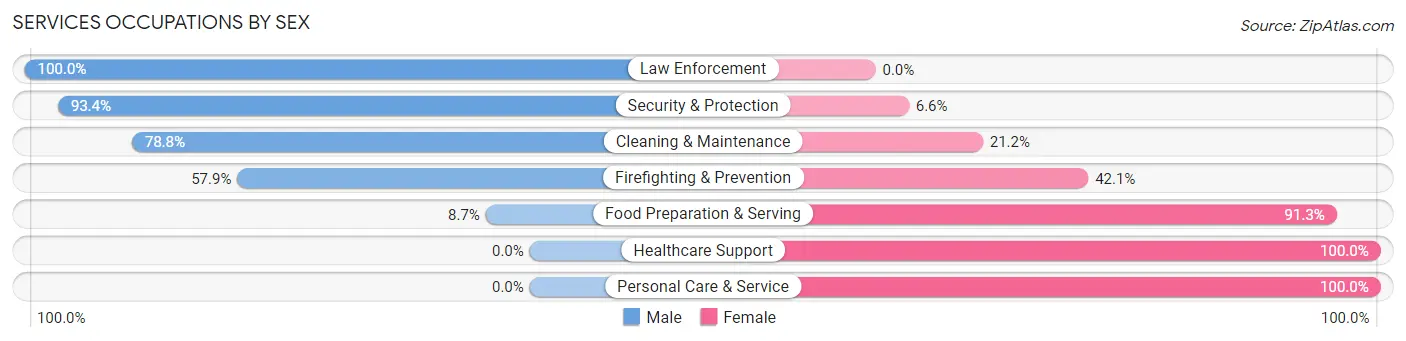
Services Occupations by Sex
Within the Services occupations in South Cleveland, the most male-oriented occupations are Law Enforcement (100.0%), Security & Protection (93.4%), and Cleaning & Maintenance (78.8%), while the most female-oriented occupations are Healthcare Support (100.0%), Personal Care & Service (100.0%), and Food Preparation & Serving (91.3%).
| Occupation | Male | Female |
| Healthcare Support | 0 (0.0%) | 57 (100.0%) |
| Security & Protection | 227 (93.4%) | 16 (6.6%) |
| Firefighting & Prevention | 22 (57.9%) | 16 (42.1%) |
| Law Enforcement | 205 (100.0%) | 0 (0.0%) |
| Food Preparation & Serving | 14 (8.7%) | 147 (91.3%) |
| Cleaning & Maintenance | 115 (78.8%) | 31 (21.2%) |
| Personal Care & Service | 0 (0.0%) | 158 (100.0%) |
| Total (Category) | 356 (46.5%) | 409 (53.5%) |
| Total (Overall) | 1,392 (44.6%) | 1,728 (55.4%) |
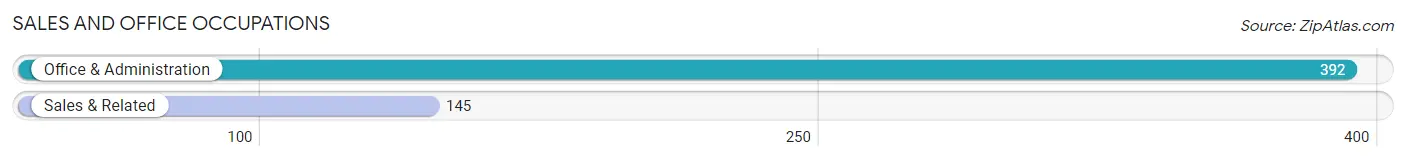
Sales and Office Occupations
The most common Sales and Office occupations in South Cleveland are Office & Administration (392 | 12.6%), and Sales & Related (145 | 4.6%).
Sales and Office Occupations by Sex
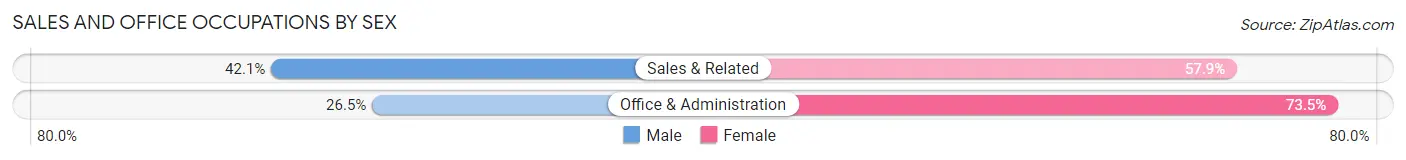
| Occupation | Male | Female |
| Sales & Related | 61 (42.1%) | 84 (57.9%) |
| Office & Administration | 104 (26.5%) | 288 (73.5%) |
| Total (Category) | 165 (30.7%) | 372 (69.3%) |
| Total (Overall) | 1,392 (44.6%) | 1,728 (55.4%) |
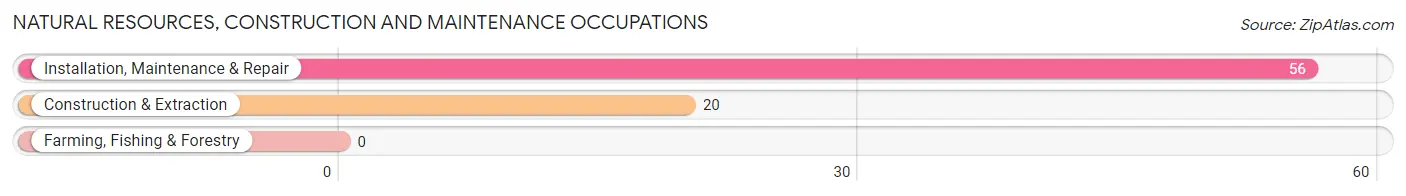
Natural Resources, Construction and Maintenance Occupations
The most common Natural Resources, Construction and Maintenance occupations in South Cleveland are Installation, Maintenance & Repair (56 | 1.8%), and Construction & Extraction (20 | 0.6%).
Natural Resources, Construction and Maintenance Occupations by Sex
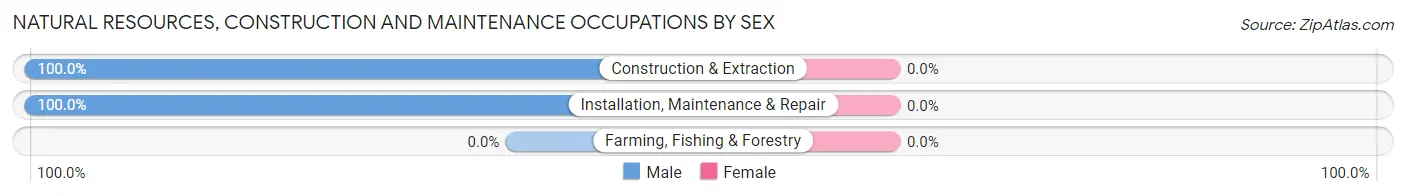
| Occupation | Male | Female |
| Farming, Fishing & Forestry | 0 (0.0%) | 0 (0.0%) |
| Construction & Extraction | 20 (100.0%) | 0 (0.0%) |
| Installation, Maintenance & Repair | 56 (100.0%) | 0 (0.0%) |
| Total (Category) | 76 (100.0%) | 0 (0.0%) |
| Total (Overall) | 1,392 (44.6%) | 1,728 (55.4%) |
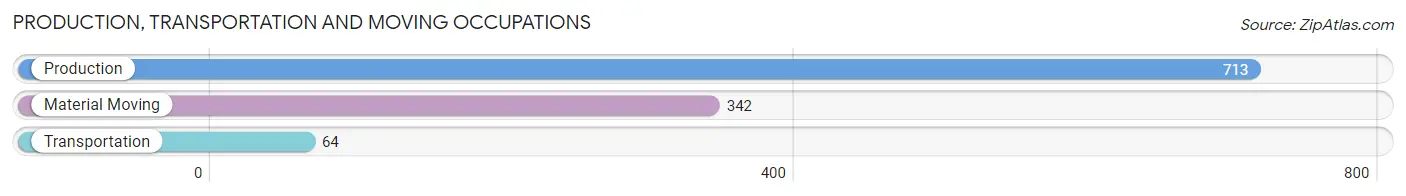
Production, Transportation and Moving Occupations
The most common Production, Transportation and Moving occupations in South Cleveland are Production (713 | 22.9%), Material Moving (342 | 11.0%), and Transportation (64 | 2.1%).
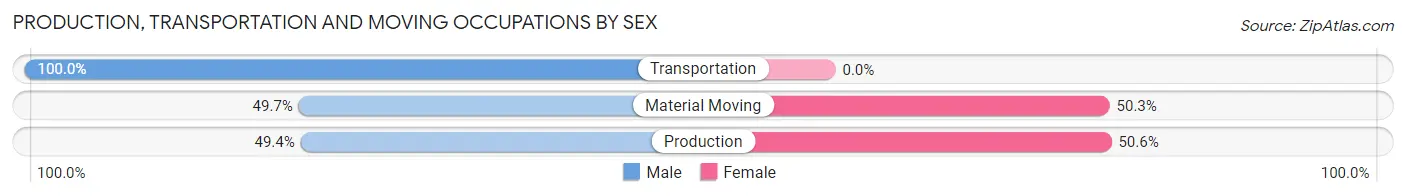
Production, Transportation and Moving Occupations by Sex
| Occupation | Male | Female |
| Production | 352 (49.4%) | 361 (50.6%) |
| Transportation | 64 (100.0%) | 0 (0.0%) |
| Material Moving | 170 (49.7%) | 172 (50.3%) |
| Total (Category) | 586 (52.4%) | 533 (47.6%) |
| Total (Overall) | 1,392 (44.6%) | 1,728 (55.4%) |
Employment Industries by Sex in South Cleveland
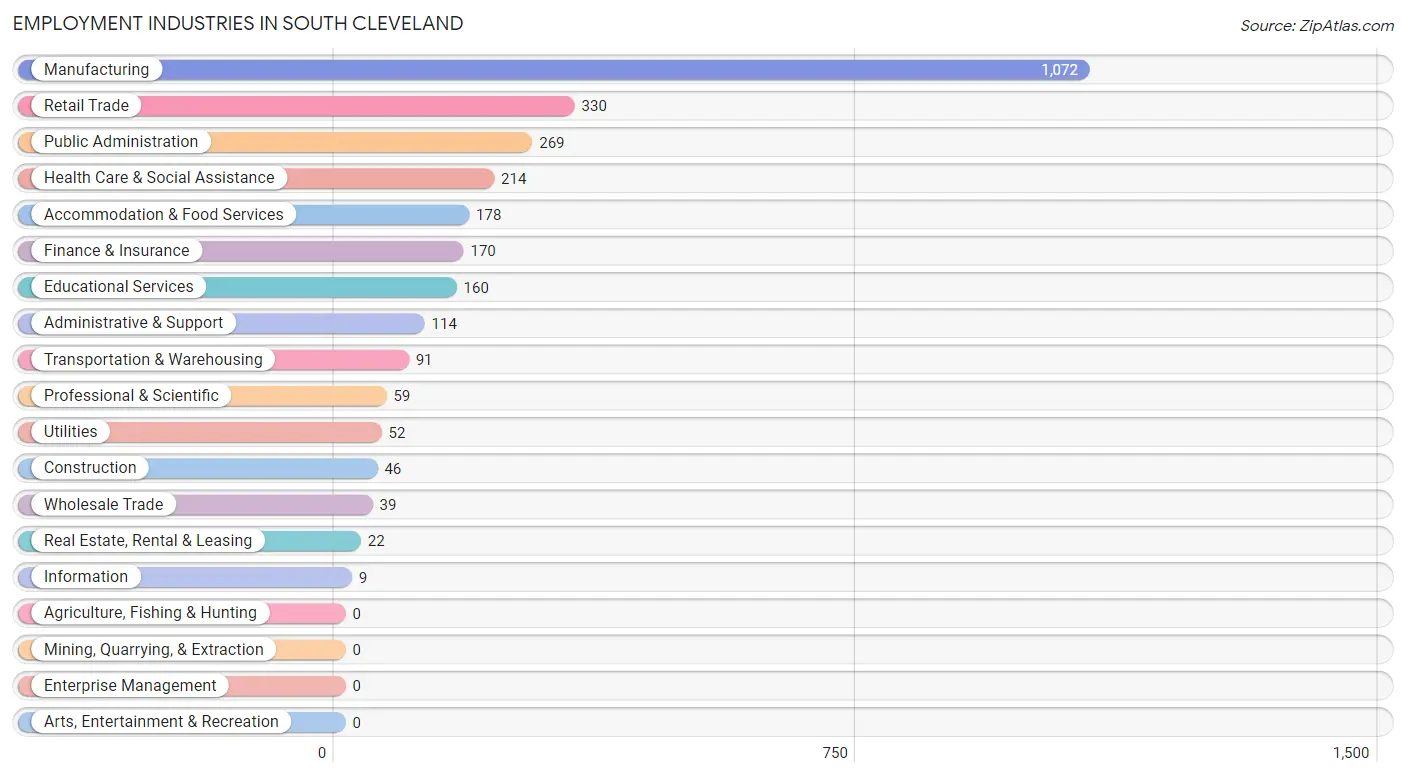
Employment Industries in South Cleveland
The major employment industries in South Cleveland include Manufacturing (1,072 | 34.4%), Retail Trade (330 | 10.6%), Public Administration (269 | 8.6%), Health Care & Social Assistance (214 | 6.9%), and Accommodation & Food Services (178 | 5.7%).
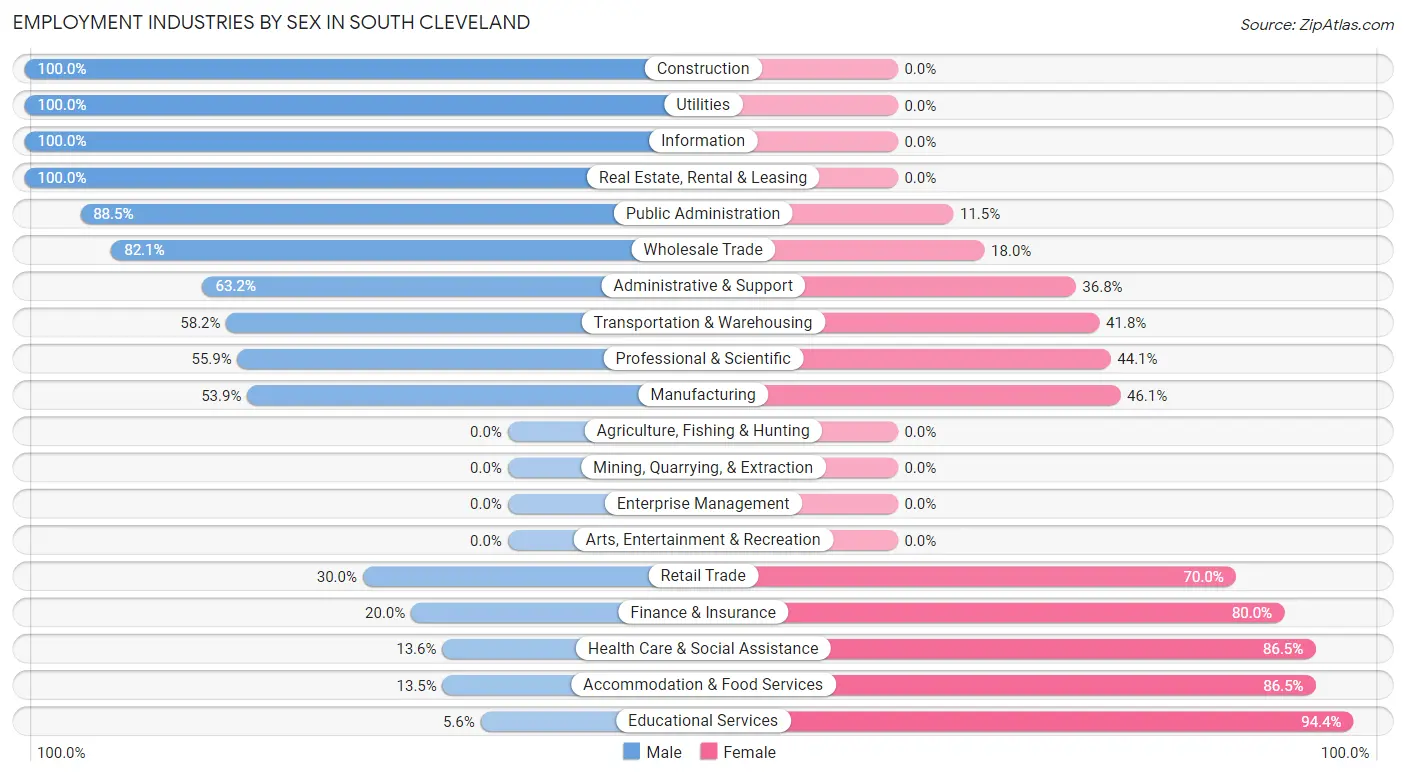
Employment Industries by Sex in South Cleveland
The South Cleveland industries that see more men than women are Construction (100.0%), Utilities (100.0%), and Information (100.0%), whereas the industries that tend to have a higher number of women are Educational Services (94.4%), Accommodation & Food Services (86.5%), and Health Care & Social Assistance (86.5%).
| Industry | Male | Female |
| Agriculture, Fishing & Hunting | 0 (0.0%) | 0 (0.0%) |
| Mining, Quarrying, & Extraction | 0 (0.0%) | 0 (0.0%) |
| Construction | 46 (100.0%) | 0 (0.0%) |
| Manufacturing | 578 (53.9%) | 494 (46.1%) |
| Wholesale Trade | 32 (82.1%) | 7 (17.9%) |
| Retail Trade | 99 (30.0%) | 231 (70.0%) |
| Transportation & Warehousing | 53 (58.2%) | 38 (41.8%) |
| Utilities | 52 (100.0%) | 0 (0.0%) |
| Information | 9 (100.0%) | 0 (0.0%) |
| Finance & Insurance | 34 (20.0%) | 136 (80.0%) |
| Real Estate, Rental & Leasing | 22 (100.0%) | 0 (0.0%) |
| Professional & Scientific | 33 (55.9%) | 26 (44.1%) |
| Enterprise Management | 0 (0.0%) | 0 (0.0%) |
| Administrative & Support | 72 (63.2%) | 42 (36.8%) |
| Educational Services | 9 (5.6%) | 151 (94.4%) |
| Health Care & Social Assistance | 29 (13.6%) | 185 (86.5%) |
| Arts, Entertainment & Recreation | 0 (0.0%) | 0 (0.0%) |
| Accommodation & Food Services | 24 (13.5%) | 154 (86.5%) |
| Public Administration | 238 (88.5%) | 31 (11.5%) |
| Total | 1,392 (44.6%) | 1,728 (55.4%) |
Education in South Cleveland
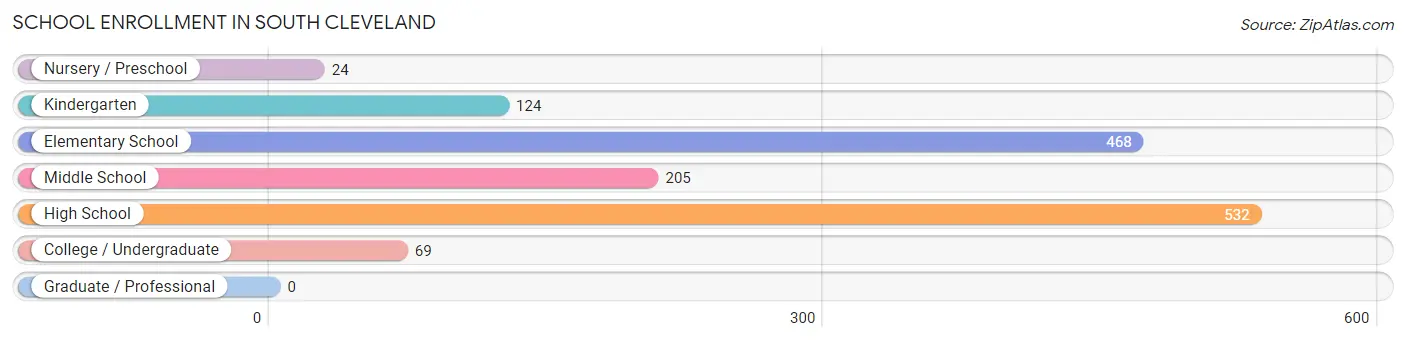
School Enrollment in South Cleveland
The most common levels of schooling among the 1,422 students in South Cleveland are high school (532 | 37.4%), elementary school (468 | 32.9%), and middle school (205 | 14.4%).
| School Level | # Students | % Students |
| Nursery / Preschool | 24 | 1.7% |
| Kindergarten | 124 | 8.7% |
| Elementary School | 468 | 32.9% |
| Middle School | 205 | 14.4% |
| High School | 532 | 37.4% |
| College / Undergraduate | 69 | 4.9% |
| Graduate / Professional | 0 | 0.0% |
| Total | 1,422 | 100.0% |
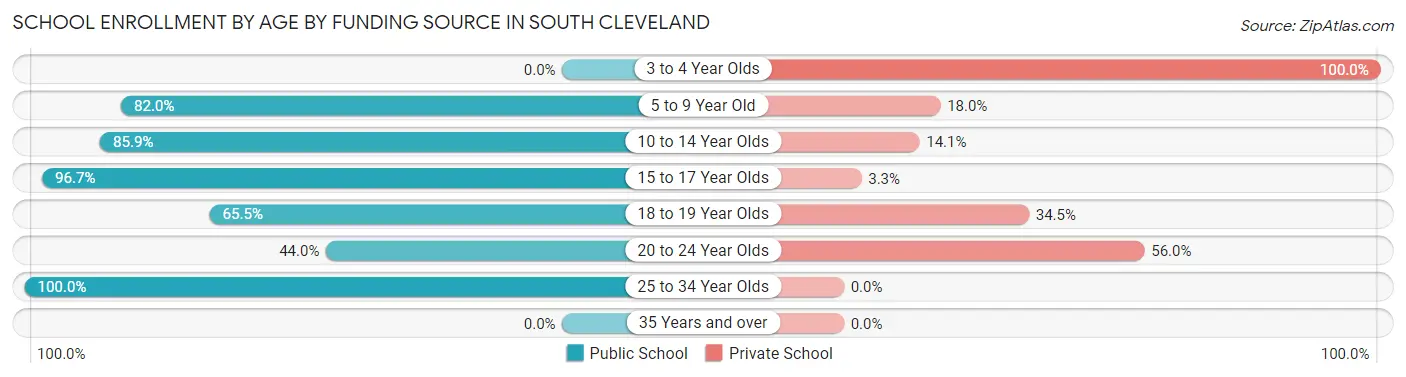
School Enrollment by Age by Funding Source in South Cleveland
Out of a total of 1,422 students who are enrolled in schools in South Cleveland, 195 (13.7%) attend a private institution, while the remaining 1,227 (86.3%) are enrolled in public schools. The age group of 3 to 4 year olds has the highest likelihood of being enrolled in private schools, with 24 (100.0% in the age bracket) enrolled. Conversely, the age group of 25 to 34 year olds has the lowest likelihood of being enrolled in a private school, with 29 (100.0% in the age bracket) attending a public institution.
| Age Bracket | Public School | Private School |
| 3 to 4 Year Olds | 0 (0.0%) | 24 (100.0%) |
| 5 to 9 Year Old | 374 (82.0%) | 82 (18.0%) |
| 10 to 14 Year Olds | 293 (85.9%) | 48 (14.1%) |
| 15 to 17 Year Olds | 501 (96.7%) | 17 (3.3%) |
| 18 to 19 Year Olds | 19 (65.5%) | 10 (34.5%) |
| 20 to 24 Year Olds | 11 (44.0%) | 14 (56.0%) |
| 25 to 34 Year Olds | 29 (100.0%) | 0 (0.0%) |
| 35 Years and over | 0 (0.0%) | 0 (0.0%) |
| Total | 1,227 (86.3%) | 195 (13.7%) |
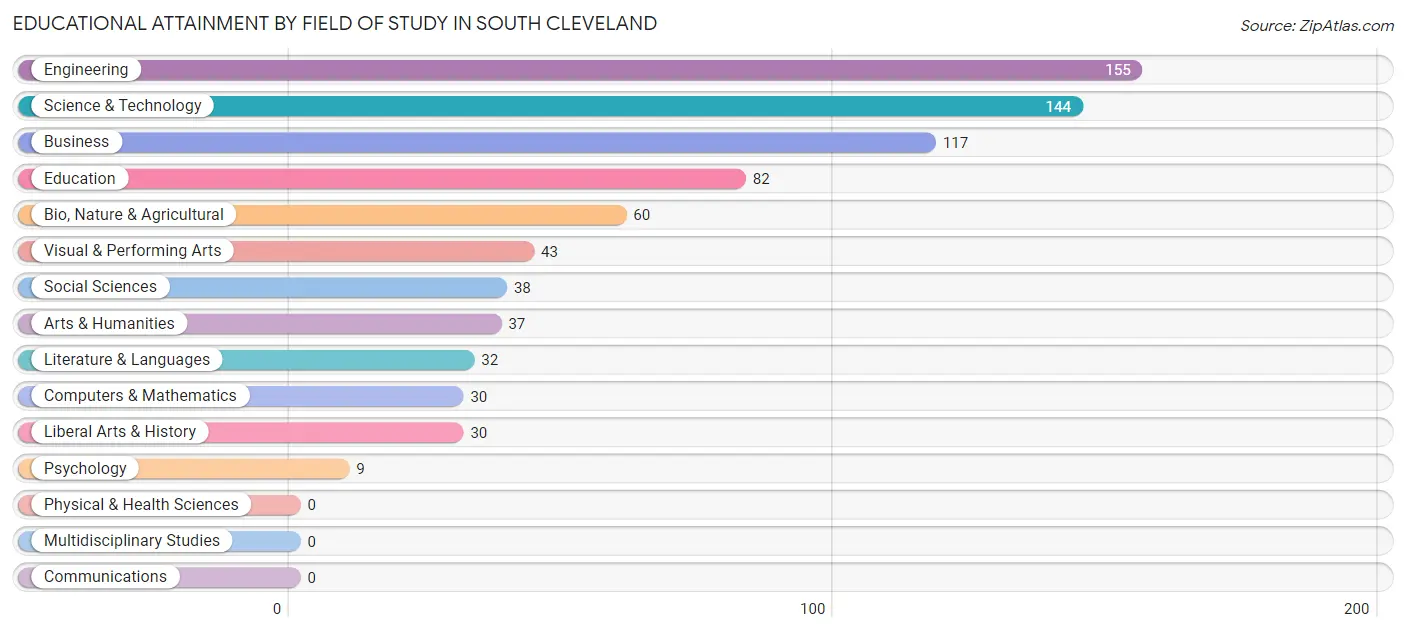
Educational Attainment by Field of Study in South Cleveland
Engineering (155 | 20.0%), science & technology (144 | 18.5%), business (117 | 15.1%), education (82 | 10.5%), and bio, nature & agricultural (60 | 7.7%) are the most common fields of study among 777 individuals in South Cleveland who have obtained a bachelor's degree or higher.
| Field of Study | # Graduates | % Graduates |
| Computers & Mathematics | 30 | 3.9% |
| Bio, Nature & Agricultural | 60 | 7.7% |
| Physical & Health Sciences | 0 | 0.0% |
| Psychology | 9 | 1.2% |
| Social Sciences | 38 | 4.9% |
| Engineering | 155 | 20.0% |
| Multidisciplinary Studies | 0 | 0.0% |
| Science & Technology | 144 | 18.5% |
| Business | 117 | 15.1% |
| Education | 82 | 10.5% |
| Literature & Languages | 32 | 4.1% |
| Liberal Arts & History | 30 | 3.9% |
| Visual & Performing Arts | 43 | 5.5% |
| Communications | 0 | 0.0% |
| Arts & Humanities | 37 | 4.8% |
| Total | 777 | 100.0% |
Transportation & Commute in South Cleveland
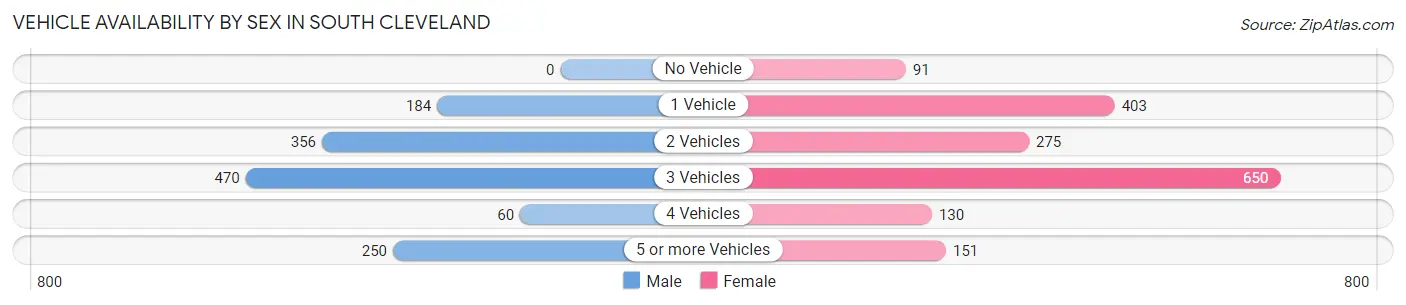
Vehicle Availability by Sex in South Cleveland
The most prevalent vehicle ownership categories in South Cleveland are males with 3 vehicles (470, accounting for 35.6%) and females with 3 vehicles (650, making up 27.7%).
| Vehicles Available | Male | Female |
| No Vehicle | 0 (0.0%) | 91 (5.3%) |
| 1 Vehicle | 184 (13.9%) | 403 (23.7%) |
| 2 Vehicles | 356 (27.0%) | 275 (16.2%) |
| 3 Vehicles | 470 (35.6%) | 650 (38.2%) |
| 4 Vehicles | 60 (4.5%) | 130 (7.6%) |
| 5 or more Vehicles | 250 (18.9%) | 151 (8.9%) |
| Total | 1,320 (100.0%) | 1,700 (100.0%) |
Commute Time in South Cleveland
The most frequently occuring commute durations in South Cleveland are 15 to 19 minutes (633 commuters, 22.3%), 30 to 34 minutes (478 commuters, 16.9%), and 20 to 24 minutes (474 commuters, 16.7%).
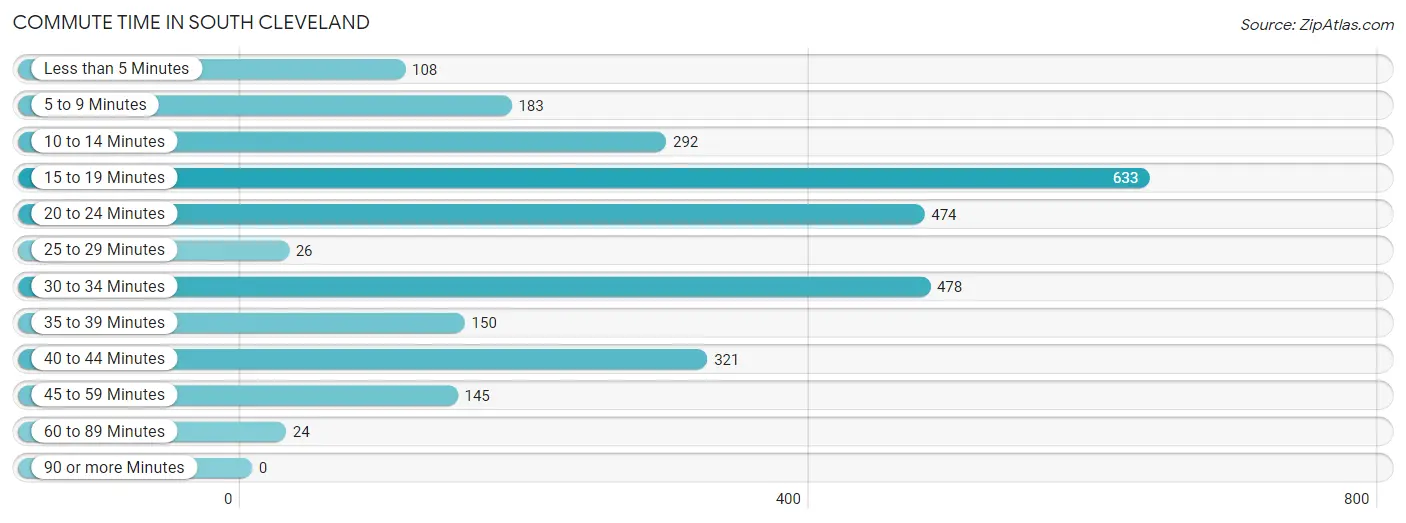
| Commute Time | # Commuters | % Commuters |
| Less than 5 Minutes | 108 | 3.8% |
| 5 to 9 Minutes | 183 | 6.5% |
| 10 to 14 Minutes | 292 | 10.3% |
| 15 to 19 Minutes | 633 | 22.3% |
| 20 to 24 Minutes | 474 | 16.7% |
| 25 to 29 Minutes | 26 | 0.9% |
| 30 to 34 Minutes | 478 | 16.9% |
| 35 to 39 Minutes | 150 | 5.3% |
| 40 to 44 Minutes | 321 | 11.3% |
| 45 to 59 Minutes | 145 | 5.1% |
| 60 to 89 Minutes | 24 | 0.9% |
| 90 or more Minutes | 0 | 0.0% |
Commute Time by Sex in South Cleveland
The most common commute times in South Cleveland are 15 to 19 minutes (403 commuters, 31.7%) for males and 20 to 24 minutes (409 commuters, 26.2%) for females.
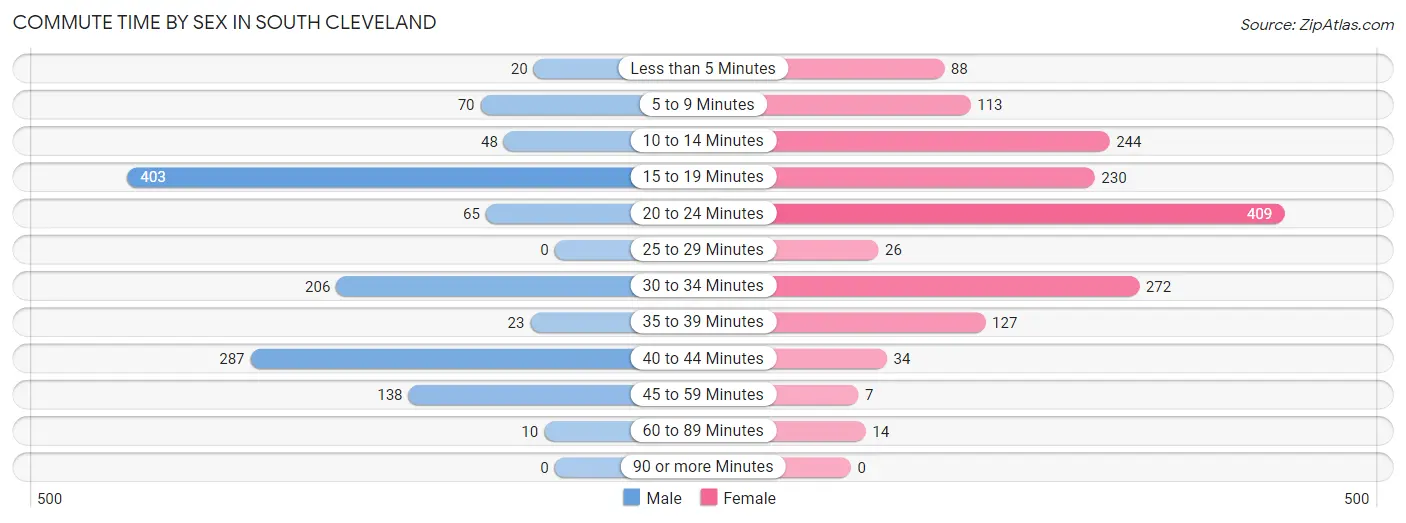
| Commute Time | Male | Female |
| Less than 5 Minutes | 20 (1.6%) | 88 (5.6%) |
| 5 to 9 Minutes | 70 (5.5%) | 113 (7.2%) |
| 10 to 14 Minutes | 48 (3.8%) | 244 (15.6%) |
| 15 to 19 Minutes | 403 (31.7%) | 230 (14.7%) |
| 20 to 24 Minutes | 65 (5.1%) | 409 (26.2%) |
| 25 to 29 Minutes | 0 (0.0%) | 26 (1.7%) |
| 30 to 34 Minutes | 206 (16.2%) | 272 (17.4%) |
| 35 to 39 Minutes | 23 (1.8%) | 127 (8.1%) |
| 40 to 44 Minutes | 287 (22.6%) | 34 (2.2%) |
| 45 to 59 Minutes | 138 (10.9%) | 7 (0.4%) |
| 60 to 89 Minutes | 10 (0.8%) | 14 (0.9%) |
| 90 or more Minutes | 0 (0.0%) | 0 (0.0%) |
Time of Departure to Work by Sex in South Cleveland
The most frequent times of departure to work in South Cleveland are 4:00 PM to 11:59 PM (363, 28.6%) for males and 7:00 AM to 7:29 AM (439, 28.1%) for females.
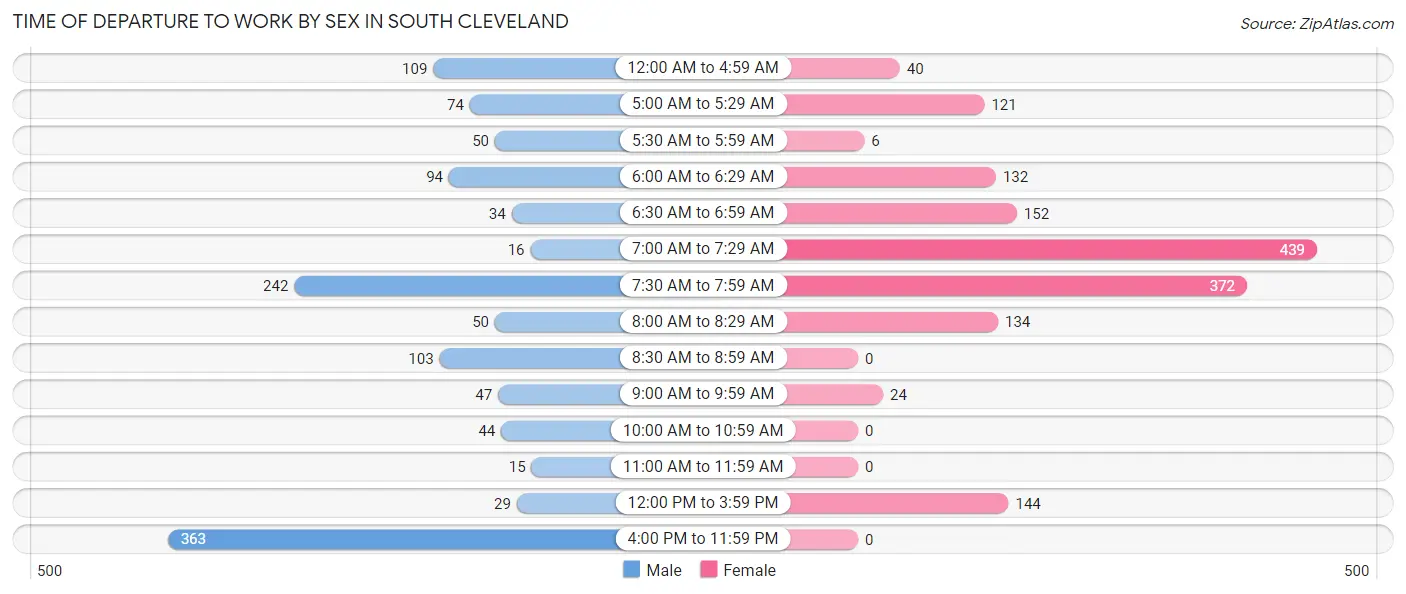
| Time of Departure | Male | Female |
| 12:00 AM to 4:59 AM | 109 (8.6%) | 40 (2.6%) |
| 5:00 AM to 5:29 AM | 74 (5.8%) | 121 (7.7%) |
| 5:30 AM to 5:59 AM | 50 (3.9%) | 6 (0.4%) |
| 6:00 AM to 6:29 AM | 94 (7.4%) | 132 (8.4%) |
| 6:30 AM to 6:59 AM | 34 (2.7%) | 152 (9.7%) |
| 7:00 AM to 7:29 AM | 16 (1.3%) | 439 (28.1%) |
| 7:30 AM to 7:59 AM | 242 (19.1%) | 372 (23.8%) |
| 8:00 AM to 8:29 AM | 50 (3.9%) | 134 (8.6%) |
| 8:30 AM to 8:59 AM | 103 (8.1%) | 0 (0.0%) |
| 9:00 AM to 9:59 AM | 47 (3.7%) | 24 (1.5%) |
| 10:00 AM to 10:59 AM | 44 (3.5%) | 0 (0.0%) |
| 11:00 AM to 11:59 AM | 15 (1.2%) | 0 (0.0%) |
| 12:00 PM to 3:59 PM | 29 (2.3%) | 144 (9.2%) |
| 4:00 PM to 11:59 PM | 363 (28.6%) | 0 (0.0%) |
| Total | 1,270 (100.0%) | 1,564 (100.0%) |
Housing Occupancy in South Cleveland
Occupancy by Ownership in South Cleveland
Of the total 2,938 dwellings in South Cleveland, owner-occupied units account for 2,354 (80.1%), while renter-occupied units make up 584 (19.9%).
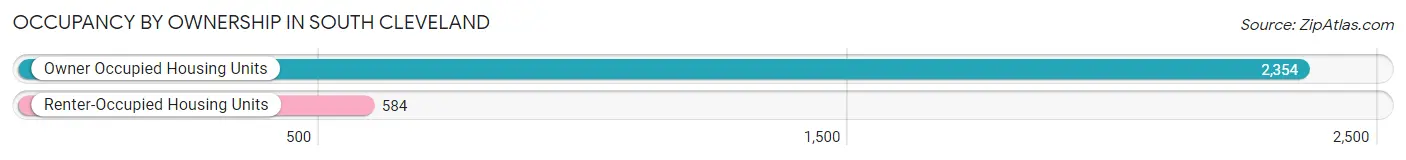
| Occupancy | # Housing Units | % Housing Units |
| Owner Occupied Housing Units | 2,354 | 80.1% |
| Renter-Occupied Housing Units | 584 | 19.9% |
| Total Occupied Housing Units | 2,938 | 100.0% |
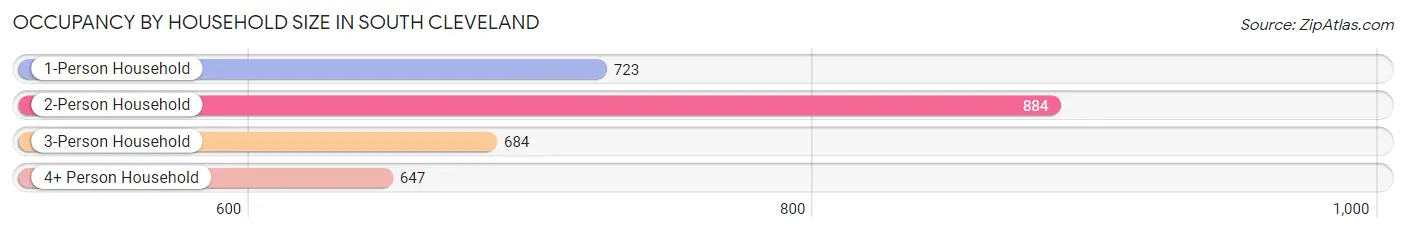
Occupancy by Household Size in South Cleveland
| Household Size | # Housing Units | % Housing Units |
| 1-Person Household | 723 | 24.6% |
| 2-Person Household | 884 | 30.1% |
| 3-Person Household | 684 | 23.3% |
| 4+ Person Household | 647 | 22.0% |
| Total Housing Units | 2,938 | 100.0% |
Occupancy by Ownership by Household Size in South Cleveland
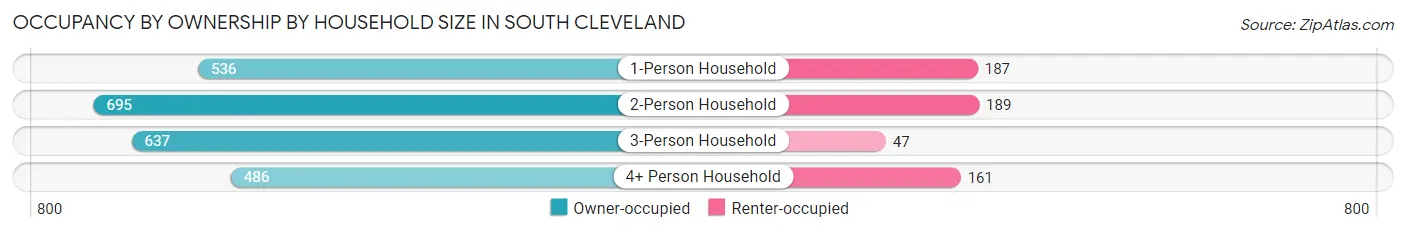
| Household Size | Owner-occupied | Renter-occupied |
| 1-Person Household | 536 (74.1%) | 187 (25.9%) |
| 2-Person Household | 695 (78.6%) | 189 (21.4%) |
| 3-Person Household | 637 (93.1%) | 47 (6.9%) |
| 4+ Person Household | 486 (75.1%) | 161 (24.9%) |
| Total Housing Units | 2,354 (80.1%) | 584 (19.9%) |
Occupancy by Educational Attainment in South Cleveland
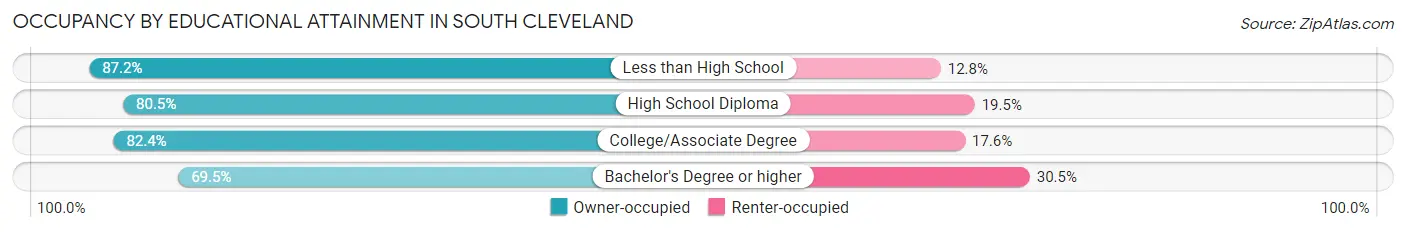
| Household Size | Owner-occupied | Renter-occupied |
| Less than High School | 211 (87.2%) | 31 (12.8%) |
| High School Diploma | 832 (80.5%) | 202 (19.5%) |
| College/Associate Degree | 996 (82.4%) | 213 (17.6%) |
| Bachelor's Degree or higher | 315 (69.5%) | 138 (30.5%) |
Occupancy by Age of Householder in South Cleveland
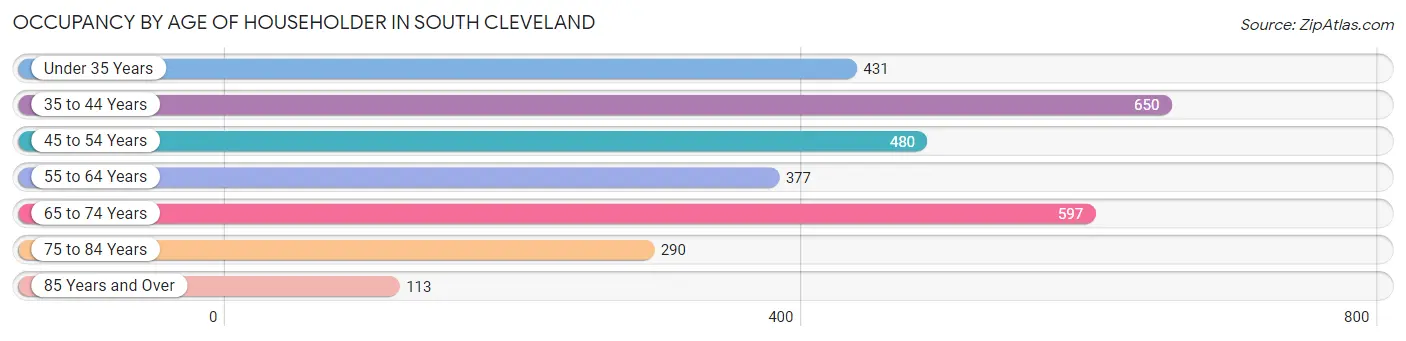
| Age Bracket | # Households | % Households |
| Under 35 Years | 431 | 14.7% |
| 35 to 44 Years | 650 | 22.1% |
| 45 to 54 Years | 480 | 16.3% |
| 55 to 64 Years | 377 | 12.8% |
| 65 to 74 Years | 597 | 20.3% |
| 75 to 84 Years | 290 | 9.9% |
| 85 Years and Over | 113 | 3.8% |
| Total | 2,938 | 100.0% |
Housing Finances in South Cleveland
Median Income by Occupancy in South Cleveland
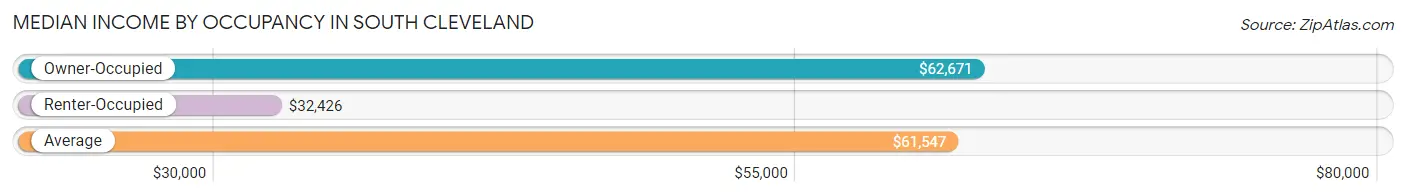
| Occupancy Type | # Households | Median Income |
| Owner-Occupied | 2,354 (80.1%) | $62,671 |
| Renter-Occupied | 584 (19.9%) | $32,426 |
| Average | 2,938 (100.0%) | $61,547 |
Occupancy by Householder Income Bracket in South Cleveland
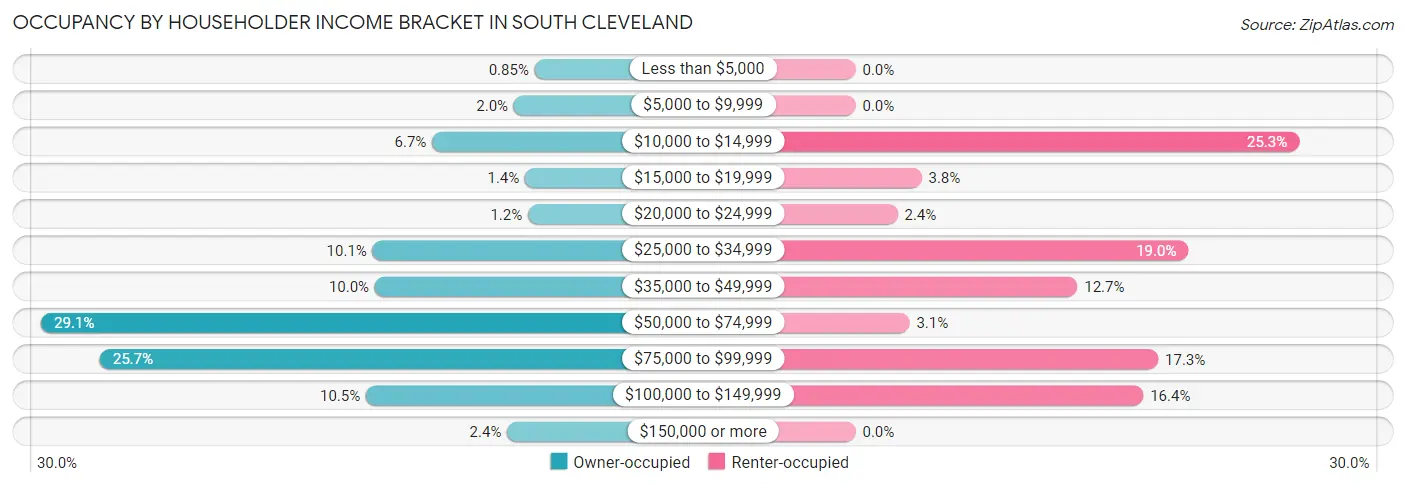
| Income Bracket | Owner-occupied | Renter-occupied |
| Less than $5,000 | 20 (0.9%) | 0 (0.0%) |
| $5,000 to $9,999 | 48 (2.0%) | 0 (0.0%) |
| $10,000 to $14,999 | 158 (6.7%) | 148 (25.3%) |
| $15,000 to $19,999 | 33 (1.4%) | 22 (3.8%) |
| $20,000 to $24,999 | 29 (1.2%) | 14 (2.4%) |
| $25,000 to $34,999 | 238 (10.1%) | 111 (19.0%) |
| $35,000 to $49,999 | 235 (10.0%) | 74 (12.7%) |
| $50,000 to $74,999 | 684 (29.1%) | 18 (3.1%) |
| $75,000 to $99,999 | 605 (25.7%) | 101 (17.3%) |
| $100,000 to $149,999 | 247 (10.5%) | 96 (16.4%) |
| $150,000 or more | 57 (2.4%) | 0 (0.0%) |
| Total | 2,354 (100.0%) | 584 (100.0%) |
Monthly Housing Cost Tiers in South Cleveland
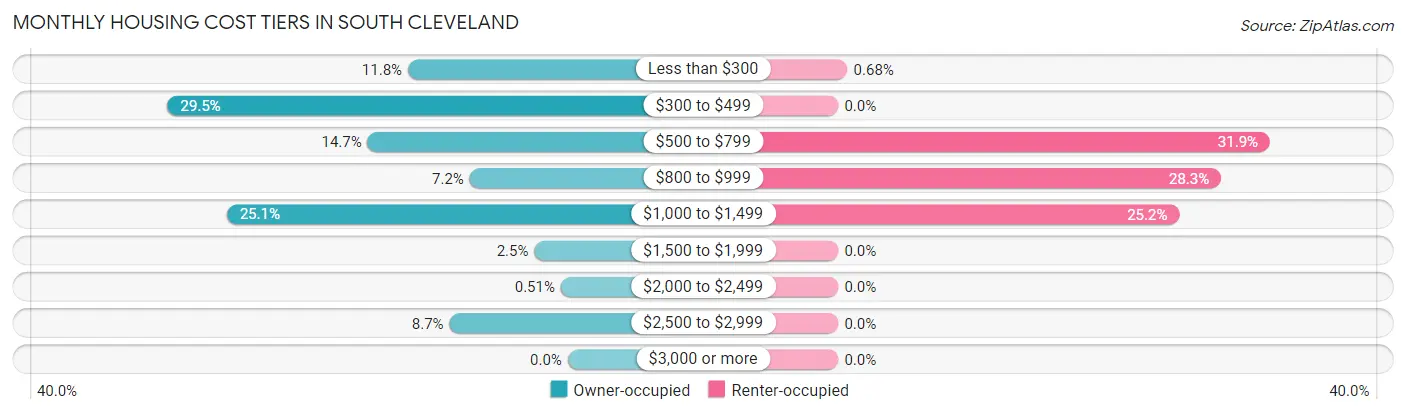
| Monthly Cost | Owner-occupied | Renter-occupied |
| Less than $300 | 277 (11.8%) | 4 (0.7%) |
| $300 to $499 | 694 (29.5%) | 0 (0.0%) |
| $500 to $799 | 347 (14.7%) | 186 (31.9%) |
| $800 to $999 | 170 (7.2%) | 165 (28.2%) |
| $1,000 to $1,499 | 591 (25.1%) | 147 (25.2%) |
| $1,500 to $1,999 | 58 (2.5%) | 0 (0.0%) |
| $2,000 to $2,499 | 12 (0.5%) | 0 (0.0%) |
| $2,500 to $2,999 | 205 (8.7%) | 0 (0.0%) |
| $3,000 or more | 0 (0.0%) | 0 (0.0%) |
| Total | 2,354 (100.0%) | 584 (100.0%) |
Physical Housing Characteristics in South Cleveland
Housing Structures in South Cleveland
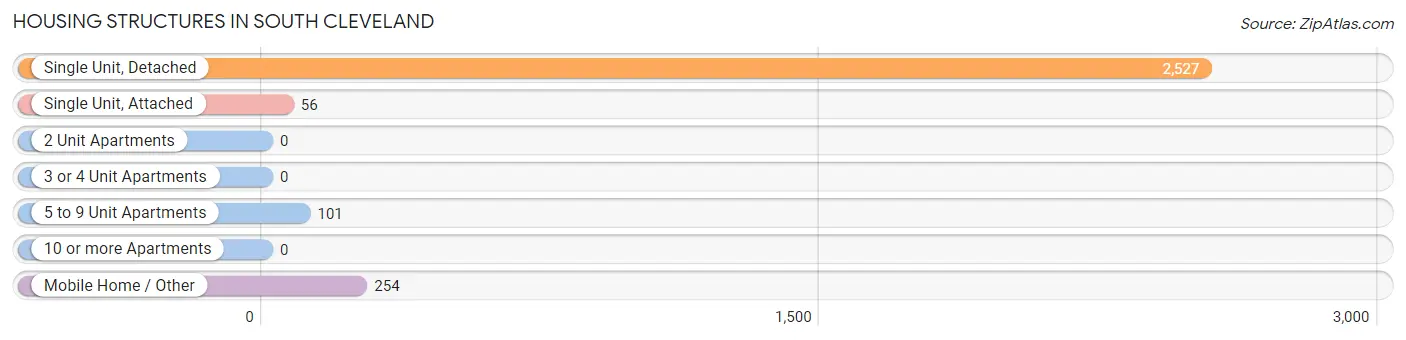
| Structure Type | # Housing Units | % Housing Units |
| Single Unit, Detached | 2,527 | 86.0% |
| Single Unit, Attached | 56 | 1.9% |
| 2 Unit Apartments | 0 | 0.0% |
| 3 or 4 Unit Apartments | 0 | 0.0% |
| 5 to 9 Unit Apartments | 101 | 3.4% |
| 10 or more Apartments | 0 | 0.0% |
| Mobile Home / Other | 254 | 8.6% |
| Total | 2,938 | 100.0% |
Housing Structures by Occupancy in South Cleveland
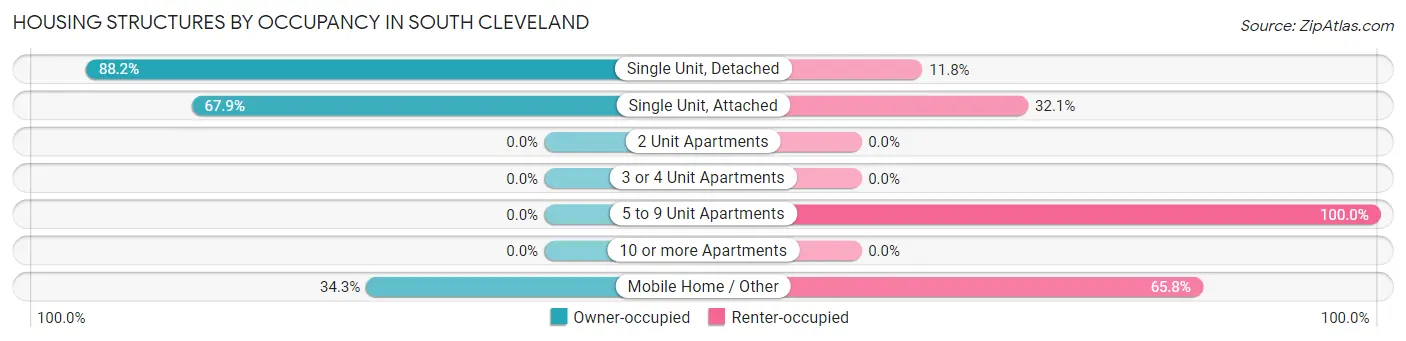
| Structure Type | Owner-occupied | Renter-occupied |
| Single Unit, Detached | 2,229 (88.2%) | 298 (11.8%) |
| Single Unit, Attached | 38 (67.9%) | 18 (32.1%) |
| 2 Unit Apartments | 0 (0.0%) | 0 (0.0%) |
| 3 or 4 Unit Apartments | 0 (0.0%) | 0 (0.0%) |
| 5 to 9 Unit Apartments | 0 (0.0%) | 101 (100.0%) |
| 10 or more Apartments | 0 (0.0%) | 0 (0.0%) |
| Mobile Home / Other | 87 (34.3%) | 167 (65.7%) |
| Total | 2,354 (80.1%) | 584 (19.9%) |
Housing Structures by Number of Rooms in South Cleveland
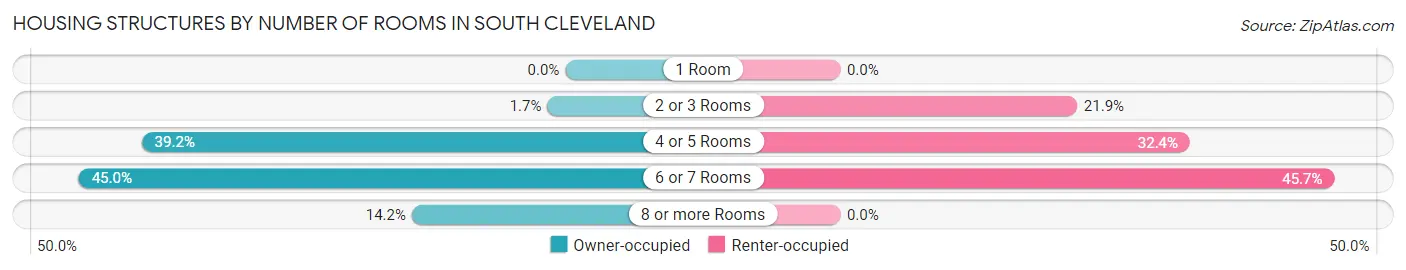
| Number of Rooms | Owner-occupied | Renter-occupied |
| 1 Room | 0 (0.0%) | 0 (0.0%) |
| 2 or 3 Rooms | 39 (1.7%) | 128 (21.9%) |
| 4 or 5 Rooms | 922 (39.2%) | 189 (32.4%) |
| 6 or 7 Rooms | 1,059 (45.0%) | 267 (45.7%) |
| 8 or more Rooms | 334 (14.2%) | 0 (0.0%) |
| Total | 2,354 (100.0%) | 584 (100.0%) |
Housing Structure by Heating Type in South Cleveland
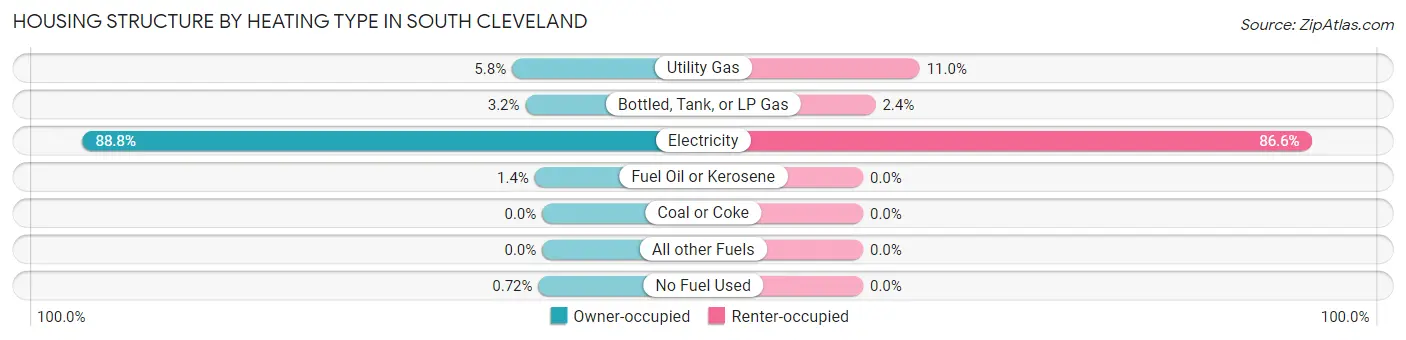
| Heating Type | Owner-occupied | Renter-occupied |
| Utility Gas | 137 (5.8%) | 64 (11.0%) |
| Bottled, Tank, or LP Gas | 76 (3.2%) | 14 (2.4%) |
| Electricity | 2,090 (88.8%) | 506 (86.6%) |
| Fuel Oil or Kerosene | 34 (1.4%) | 0 (0.0%) |
| Coal or Coke | 0 (0.0%) | 0 (0.0%) |
| All other Fuels | 0 (0.0%) | 0 (0.0%) |
| No Fuel Used | 17 (0.7%) | 0 (0.0%) |
| Total | 2,354 (100.0%) | 584 (100.0%) |
Household Vehicle Usage in South Cleveland
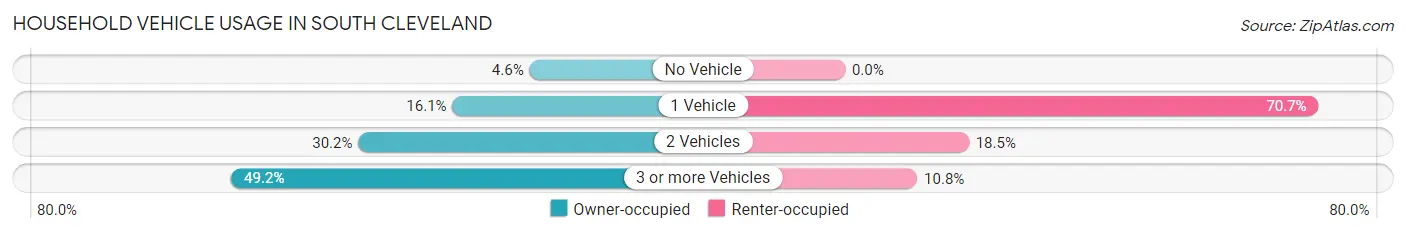
| Vehicles per Household | Owner-occupied | Renter-occupied |
| No Vehicle | 108 (4.6%) | 0 (0.0%) |
| 1 Vehicle | 379 (16.1%) | 413 (70.7%) |
| 2 Vehicles | 710 (30.2%) | 108 (18.5%) |
| 3 or more Vehicles | 1,157 (49.1%) | 63 (10.8%) |
| Total | 2,354 (100.0%) | 584 (100.0%) |
Real Estate & Mortgages in South Cleveland
Real Estate and Mortgage Overview in South Cleveland
| Characteristic | Without Mortgage | With Mortgage |
| Housing Units | 1,231 | 1,123 |
| Median Property Value | $170,900 | $171,700 |
| Median Household Income | $53,005 | $23 |
| Monthly Housing Costs | $375 | $0 |
| Real Estate Taxes | $745 | $214 |
Property Value by Mortgage Status in South Cleveland
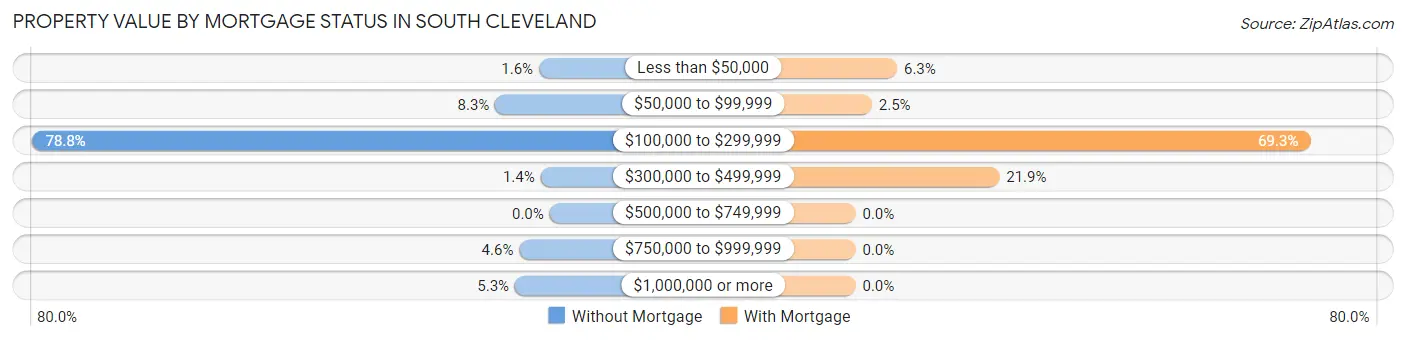
| Property Value | Without Mortgage | With Mortgage |
| Less than $50,000 | 20 (1.6%) | 71 (6.3%) |
| $50,000 to $99,999 | 102 (8.3%) | 28 (2.5%) |
| $100,000 to $299,999 | 970 (78.8%) | 778 (69.3%) |
| $300,000 to $499,999 | 17 (1.4%) | 246 (21.9%) |
| $500,000 to $749,999 | 0 (0.0%) | 0 (0.0%) |
| $750,000 to $999,999 | 57 (4.6%) | 0 (0.0%) |
| $1,000,000 or more | 65 (5.3%) | 0 (0.0%) |
| Total | 1,231 (100.0%) | 1,123 (100.0%) |
Household Income by Mortgage Status in South Cleveland
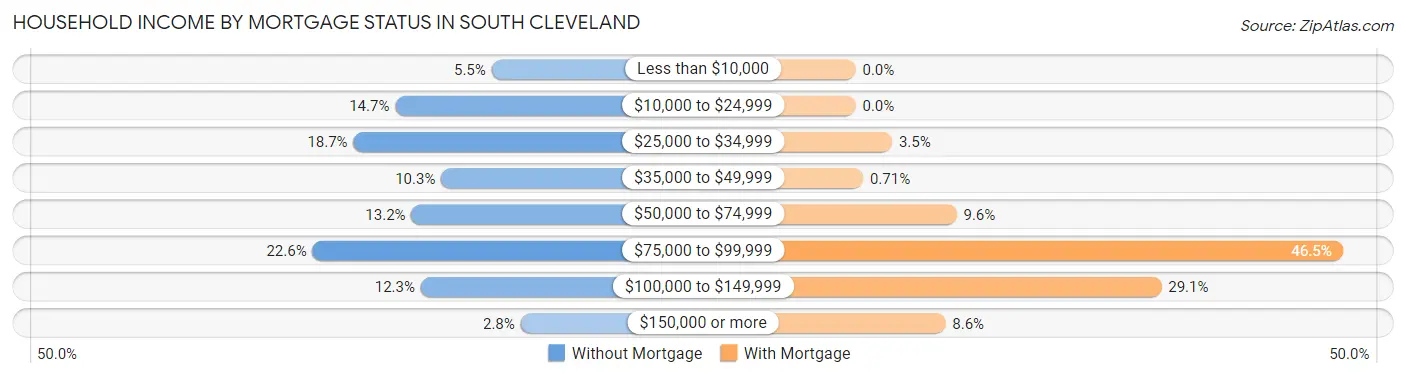
| Household Income | Without Mortgage | With Mortgage |
| Less than $10,000 | 68 (5.5%) | 0 (0.0%) |
| $10,000 to $24,999 | 181 (14.7%) | 0 (0.0%) |
| $25,000 to $34,999 | 230 (18.7%) | 39 (3.5%) |
| $35,000 to $49,999 | 127 (10.3%) | 8 (0.7%) |
| $50,000 to $74,999 | 162 (13.2%) | 108 (9.6%) |
| $75,000 to $99,999 | 278 (22.6%) | 522 (46.5%) |
| $100,000 to $149,999 | 151 (12.3%) | 327 (29.1%) |
| $150,000 or more | 34 (2.8%) | 96 (8.6%) |
| Total | 1,231 (100.0%) | 1,123 (100.0%) |
Property Value to Household Income Ratio in South Cleveland
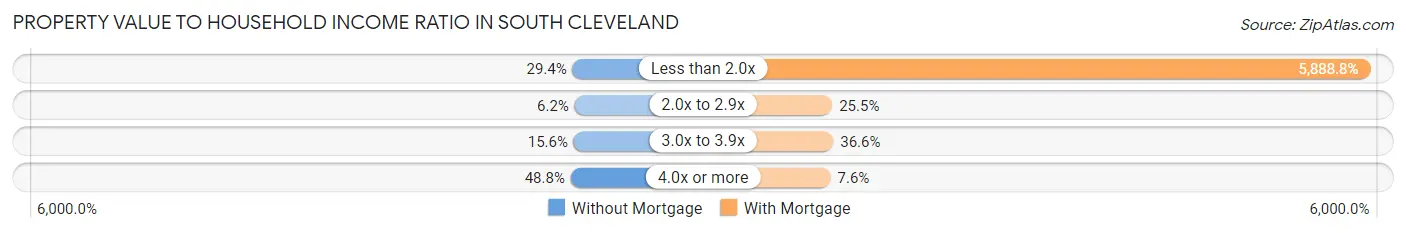
| Value-to-Income Ratio | Without Mortgage | With Mortgage |
| Less than 2.0x | 362 (29.4%) | 66,131 (5,888.8%) |
| 2.0x to 2.9x | 76 (6.2%) | 286 (25.5%) |
| 3.0x to 3.9x | 192 (15.6%) | 411 (36.6%) |
| 4.0x or more | 601 (48.8%) | 85 (7.6%) |
| Total | 1,231 (100.0%) | 1,123 (100.0%) |
Real Estate Taxes by Mortgage Status in South Cleveland
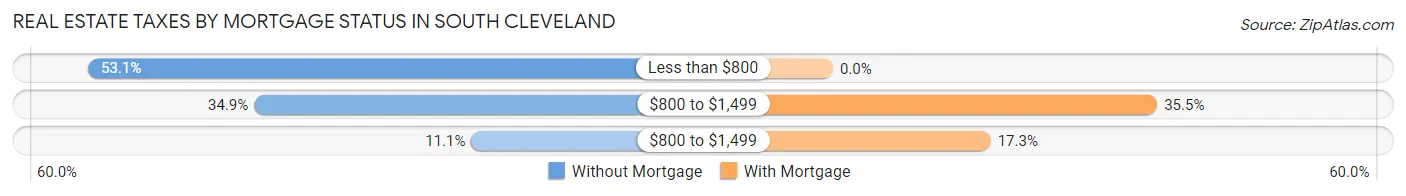
| Property Taxes | Without Mortgage | With Mortgage |
| Less than $800 | 653 (53.0%) | 0 (0.0%) |
| $800 to $1,499 | 429 (34.8%) | 399 (35.5%) |
| $800 to $1,499 | 136 (11.1%) | 194 (17.3%) |
| Total | 1,231 (100.0%) | 1,123 (100.0%) |
Health & Disability in South Cleveland
Health Insurance Coverage by Age in South Cleveland
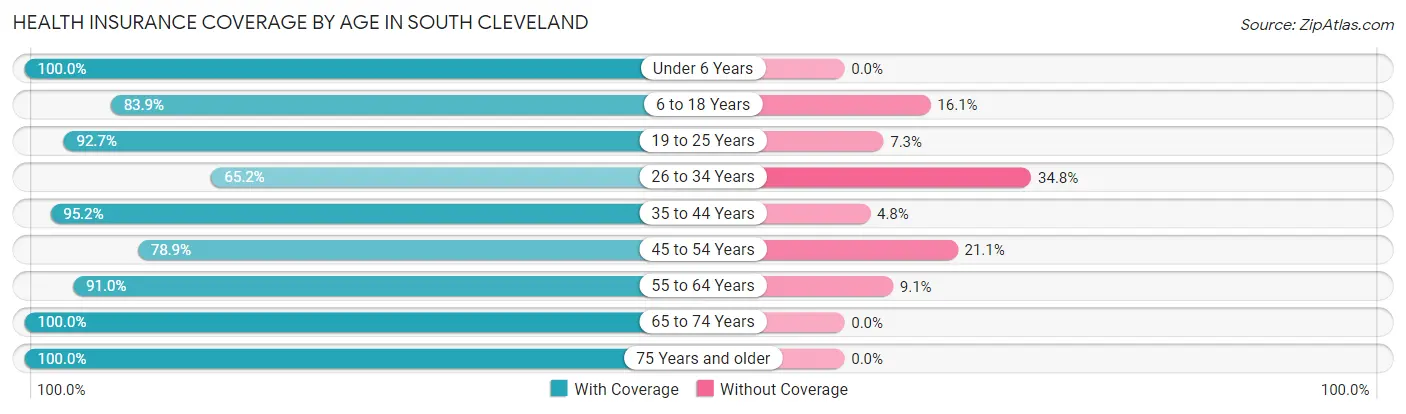
| Age Bracket | With Coverage | Without Coverage |
| Under 6 Years | 389 (100.0%) | 0 (0.0%) |
| 6 to 18 Years | 1,124 (83.9%) | 215 (16.1%) |
| 19 to 25 Years | 319 (92.7%) | 25 (7.3%) |
| 26 to 34 Years | 475 (65.2%) | 254 (34.8%) |
| 35 to 44 Years | 1,210 (95.2%) | 61 (4.8%) |
| 45 to 54 Years | 646 (78.9%) | 173 (21.1%) |
| 55 to 64 Years | 724 (90.9%) | 72 (9.0%) |
| 65 to 74 Years | 896 (100.0%) | 0 (0.0%) |
| 75 Years and older | 605 (100.0%) | 0 (0.0%) |
| Total | 6,388 (88.9%) | 800 (11.1%) |
Health Insurance Coverage by Citizenship Status in South Cleveland
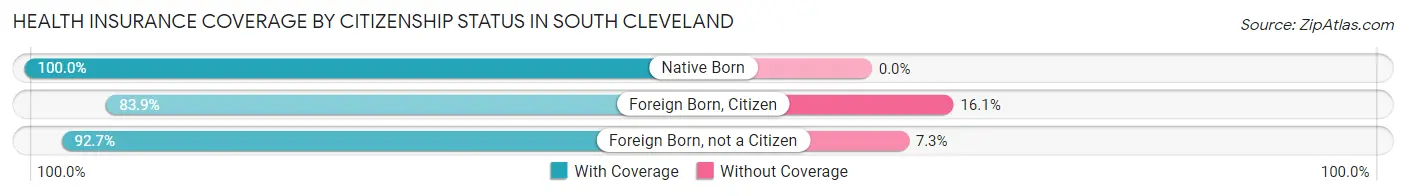
| Citizenship Status | With Coverage | Without Coverage |
| Native Born | 389 (100.0%) | 0 (0.0%) |
| Foreign Born, Citizen | 1,124 (83.9%) | 215 (16.1%) |
| Foreign Born, not a Citizen | 319 (92.7%) | 25 (7.3%) |
Health Insurance Coverage by Household Income in South Cleveland
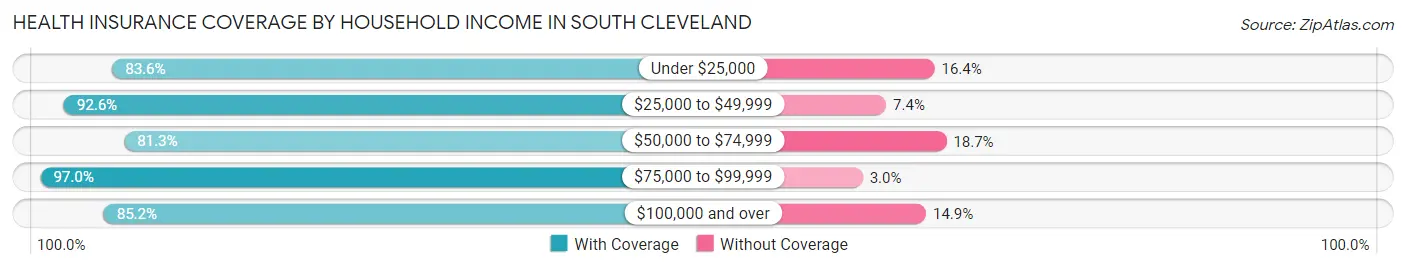
| Household Income | With Coverage | Without Coverage |
| Under $25,000 | 615 (83.6%) | 121 (16.4%) |
| $25,000 to $49,999 | 1,106 (92.6%) | 88 (7.4%) |
| $50,000 to $74,999 | 1,472 (81.3%) | 338 (18.7%) |
| $75,000 to $99,999 | 2,117 (97.0%) | 65 (3.0%) |
| $100,000 and over | 1,078 (85.2%) | 188 (14.8%) |
Public vs Private Health Insurance Coverage by Age in South Cleveland
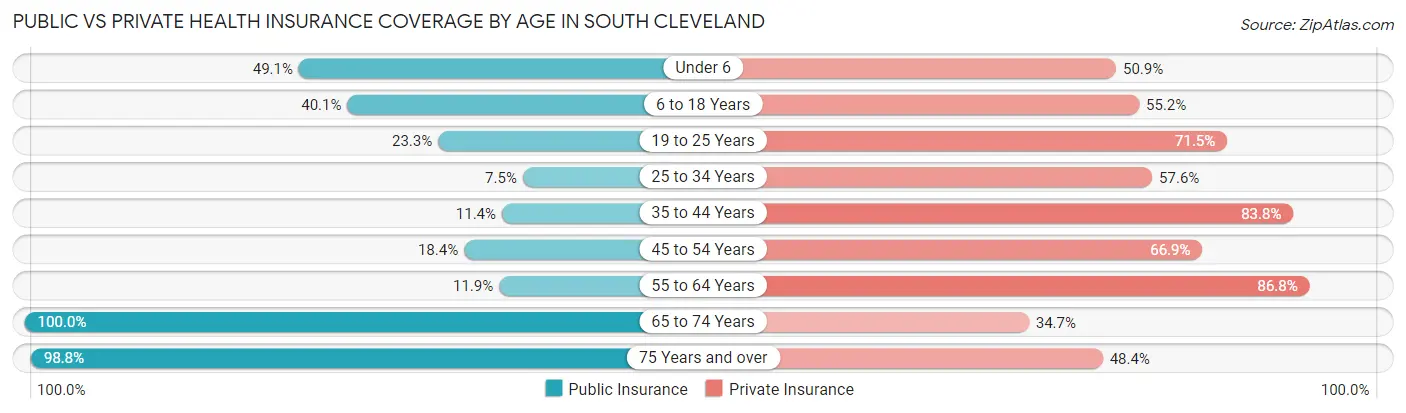
| Age Bracket | Public Insurance | Private Insurance |
| Under 6 | 191 (49.1%) | 198 (50.9%) |
| 6 to 18 Years | 537 (40.1%) | 739 (55.2%) |
| 19 to 25 Years | 80 (23.3%) | 246 (71.5%) |
| 25 to 34 Years | 55 (7.5%) | 420 (57.6%) |
| 35 to 44 Years | 145 (11.4%) | 1,065 (83.8%) |
| 45 to 54 Years | 151 (18.4%) | 548 (66.9%) |
| 55 to 64 Years | 95 (11.9%) | 691 (86.8%) |
| 65 to 74 Years | 896 (100.0%) | 311 (34.7%) |
| 75 Years and over | 598 (98.8%) | 293 (48.4%) |
| Total | 2,748 (38.2%) | 4,511 (62.8%) |
Disability Status by Sex by Age in South Cleveland
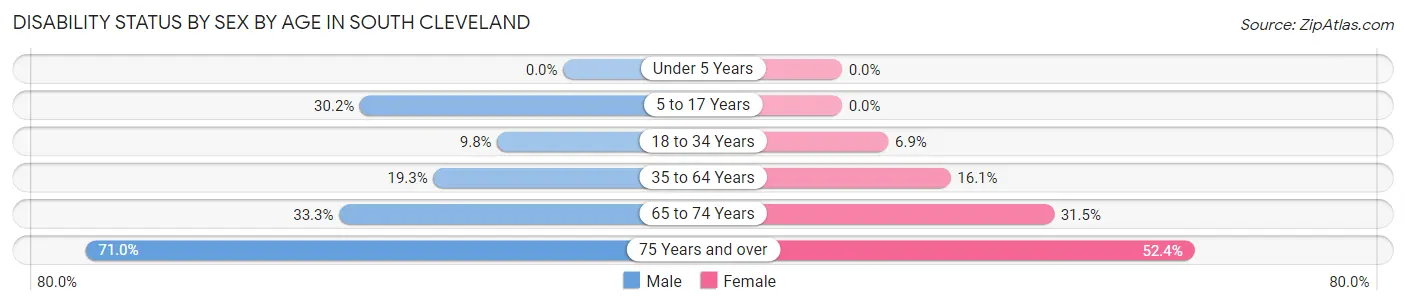
| Age Bracket | Male | Female |
| Under 5 Years | 0 (0.0%) | 0 (0.0%) |
| 5 to 17 Years | 251 (30.2%) | 0 (0.0%) |
| 18 to 34 Years | 56 (9.8%) | 37 (6.9%) |
| 35 to 64 Years | 261 (19.3%) | 247 (16.1%) |
| 65 to 74 Years | 167 (33.3%) | 124 (31.5%) |
| 75 Years and over | 176 (71.0%) | 187 (52.4%) |
Disability Class by Sex by Age in South Cleveland
Disability Class: Hearing Difficulty
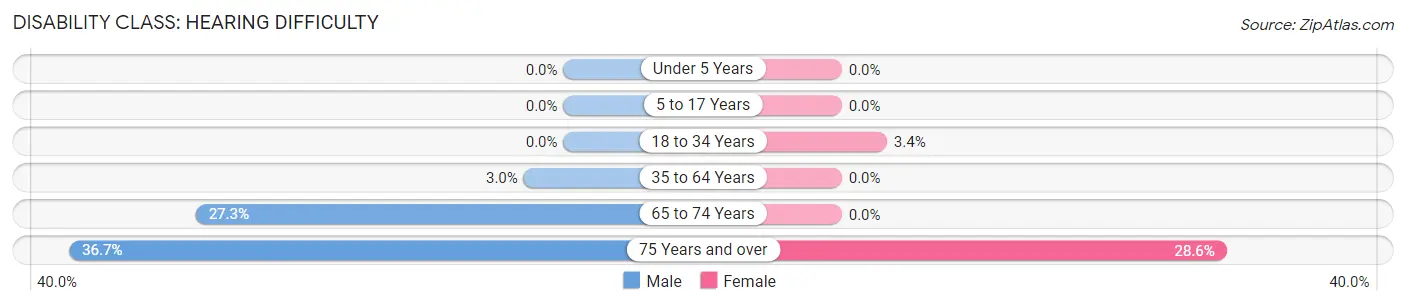
| Age Bracket | Male | Female |
| Under 5 Years | 0 (0.0%) | 0 (0.0%) |
| 5 to 17 Years | 0 (0.0%) | 0 (0.0%) |
| 18 to 34 Years | 0 (0.0%) | 18 (3.4%) |
| 35 to 64 Years | 40 (2.9%) | 0 (0.0%) |
| 65 to 74 Years | 137 (27.3%) | 0 (0.0%) |
| 75 Years and over | 91 (36.7%) | 102 (28.6%) |
Disability Class: Vision Difficulty
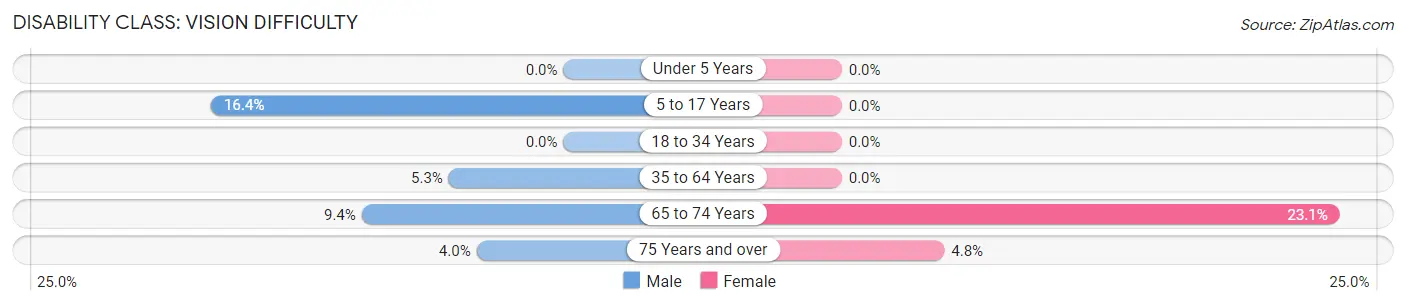
| Age Bracket | Male | Female |
| Under 5 Years | 0 (0.0%) | 0 (0.0%) |
| 5 to 17 Years | 136 (16.4%) | 0 (0.0%) |
| 18 to 34 Years | 0 (0.0%) | 0 (0.0%) |
| 35 to 64 Years | 72 (5.3%) | 0 (0.0%) |
| 65 to 74 Years | 47 (9.4%) | 91 (23.1%) |
| 75 Years and over | 10 (4.0%) | 17 (4.8%) |
Disability Class: Cognitive Difficulty
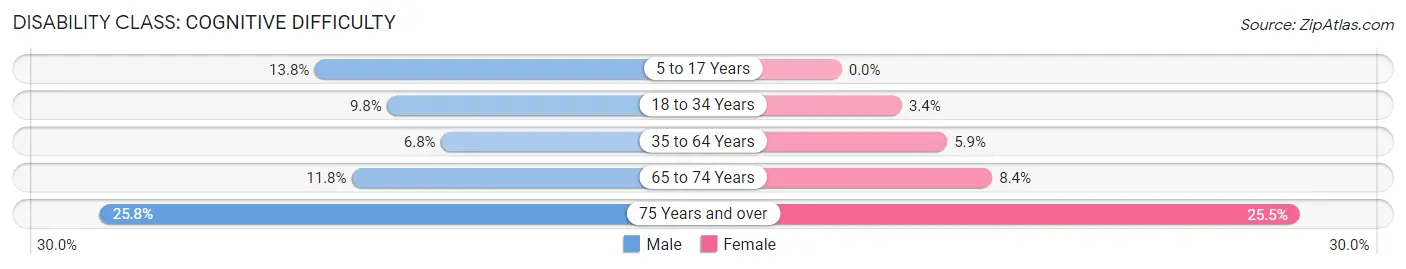
| Age Bracket | Male | Female |
| 5 to 17 Years | 115 (13.8%) | 0 (0.0%) |
| 18 to 34 Years | 56 (9.8%) | 18 (3.4%) |
| 35 to 64 Years | 92 (6.8%) | 90 (5.9%) |
| 65 to 74 Years | 59 (11.7%) | 33 (8.4%) |
| 75 Years and over | 64 (25.8%) | 91 (25.5%) |
Disability Class: Ambulatory Difficulty
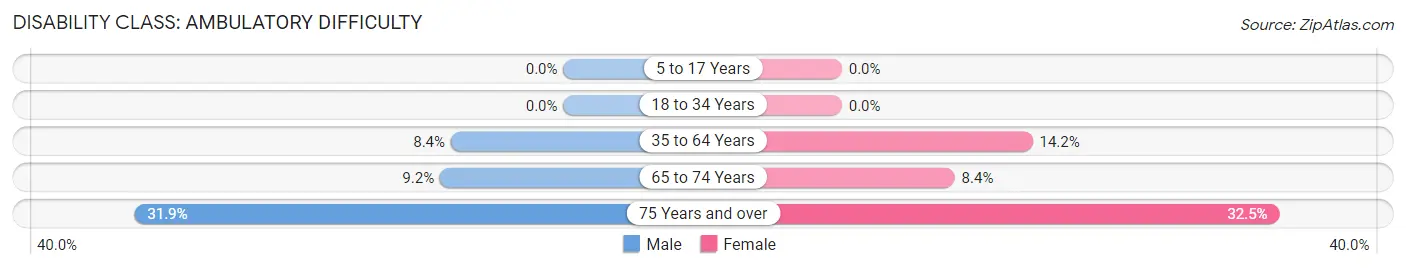
| Age Bracket | Male | Female |
| 5 to 17 Years | 0 (0.0%) | 0 (0.0%) |
| 18 to 34 Years | 0 (0.0%) | 0 (0.0%) |
| 35 to 64 Years | 113 (8.4%) | 217 (14.2%) |
| 65 to 74 Years | 46 (9.2%) | 33 (8.4%) |
| 75 Years and over | 79 (31.9%) | 116 (32.5%) |
Disability Class: Self-Care Difficulty
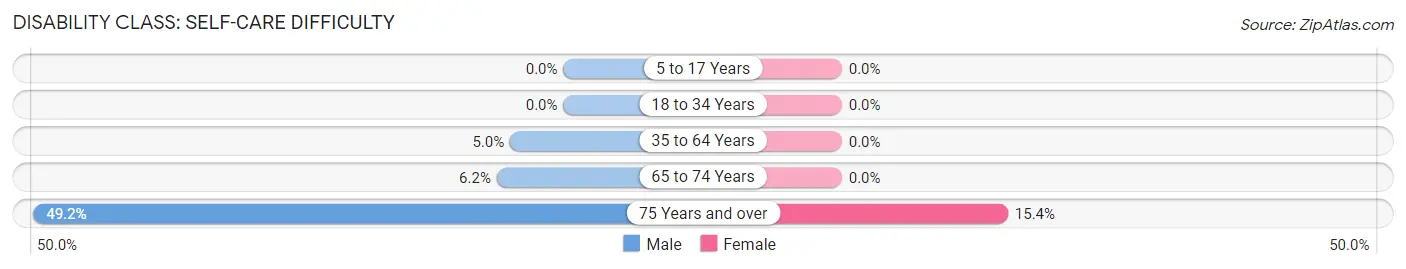
| Age Bracket | Male | Female |
| 5 to 17 Years | 0 (0.0%) | 0 (0.0%) |
| 18 to 34 Years | 0 (0.0%) | 0 (0.0%) |
| 35 to 64 Years | 67 (5.0%) | 0 (0.0%) |
| 65 to 74 Years | 31 (6.2%) | 0 (0.0%) |
| 75 Years and over | 122 (49.2%) | 55 (15.4%) |
Technology Access in South Cleveland
Computing Device Access in South Cleveland
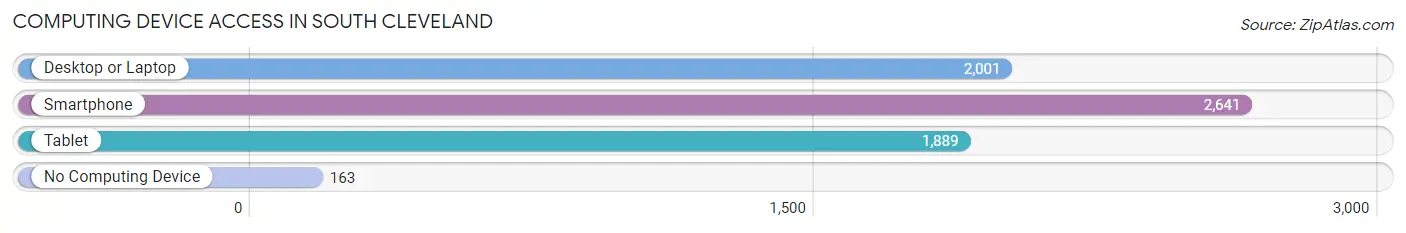
| Device Type | # Households | % Households |
| Desktop or Laptop | 2,001 | 68.1% |
| Smartphone | 2,641 | 89.9% |
| Tablet | 1,889 | 64.3% |
| No Computing Device | 163 | 5.6% |
| Total | 2,938 | 100.0% |
Internet Access in South Cleveland
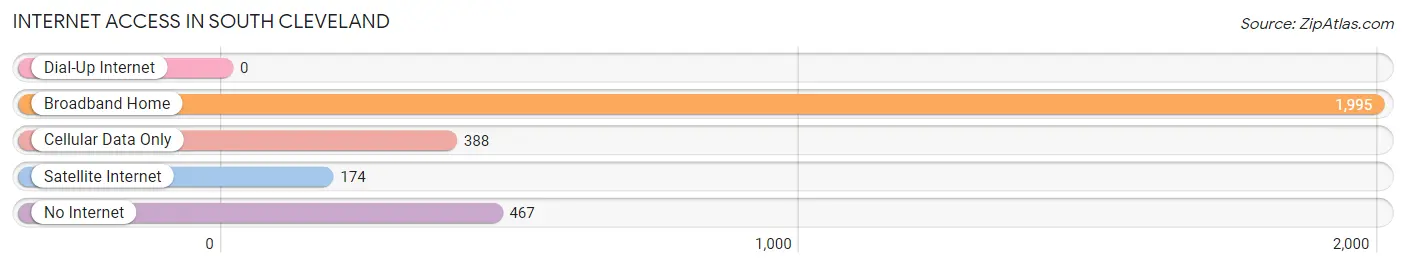
| Internet Type | # Households | % Households |
| Dial-Up Internet | 0 | 0.0% |
| Broadband Home | 1,995 | 67.9% |
| Cellular Data Only | 388 | 13.2% |
| Satellite Internet | 174 | 5.9% |
| No Internet | 467 | 15.9% |
| Total | 2,938 | 100.0% |
South Cleveland Summary
Cleveland, Tennessee is a city located in Bradley County, Tennessee, United States. It is the county seat of Bradley County and the largest city in the southeastern portion of the state. The population was 41,285 at the 2010 census. It is the principal city of the Cleveland, Tennessee metropolitan area (consisting of Bradley County and neighboring Polk County), which is included in the Chattanooga-Cleveland-Dalton, TN-GA-AL Combined Statistical Area.
History
Cleveland was founded in 1837 as a county seat for Bradley County. The city was named after Colonel Benjamin Cleveland, a commander in the American Revolutionary War. The city was incorporated in 1842 and was the site of the Battle of Cleveland during the American Civil War.
Geography
Cleveland is located in southeastern Tennessee at 35°12′17″N 84°51′35″W (35.204722, -84.859722). The city is situated among the foothills of the Appalachian Mountains. The Hiwassee River flows through the city.
According to the United States Census Bureau, the city has a total area of 26.3 square miles (68.1 km2), of which 26.2 square miles (67.9 km2) is land and 0.1 square miles (0.2 km2) (0.38%) is water.
Economy
Cleveland is home to several major industries, including manufacturing, healthcare, and education. The city is home to the corporate headquarters of the Life Care Centers of America, the world's largest nursing home chain. The city is also home to the corporate headquarters of the Check Into Cash chain of payday loan stores.
The city is also home to the Cleveland State Community College, Lee University, and the Tennessee College of Applied Technology.
Demographics
As of the census of 2010, there were 41,285 people, 16,852 households, and 10,890 families residing in the city. The population density was 1,571.3 people per square mile (607.2/km2). There were 18,769 housing units at an average density of 714.7 per square mile (276.2/km2). The racial makeup of the city was 79.5% White, 15.8% African American, 0.3% Native American, 1.2% Asian, 0.1% Pacific Islander, 1.2% from other races, and 2.0% from two or more races. Hispanic or Latino of any race were 3.2% of the population.
There were 16,852 households, out of which 28.2% had children under the age of 18 living with them, 44.2% were married couples living together, 15.7% had a female householder with no husband present, and 35.7% were non-families. 30.2% of all households were made up of individuals, and 11.3% had someone living alone who was 65 years of age or older. The average household size was 2.37 and the average family size was 2.94.
In the city, the population was spread out, with 23.2% under the age of 18, 11.2% from 18 to 24, 28.5% from 25 to 44, 22.2% from 45 to 64, and 14.9% who were 65 years of age or older. The median age was 35 years. For every 100 females, there were 88.7 males. For every 100 females age 18 and over, there were 84.7 males.
The median income for a household in the city was $32,001, and the median income for a family was $40,174. Males had a median income of $31,837 versus $22,852 for females. The per capita income for the city was $17,868. About 12.2% of families and 15.7% of the population were below the poverty line, including 22.3% of those under age 18 and 11.0% of those age 65 or over.
Common Questions
What is the Total Population of South Cleveland?
Total Population of South Cleveland is 7,188.
What is the Total Male Population of South Cleveland?
Total Male Population of South Cleveland is 3,618.
What is the Total Female Population of South Cleveland?
Total Female Population of South Cleveland is 3,570.
What is the Ratio of Males per 100 Females in South Cleveland?
There are 101.34 Males per 100 Females in South Cleveland.
What is the Ratio of Females per 100 Males in South Cleveland?
There are 98.67 Females per 100 Males in South Cleveland.
What is the Median Population Age in South Cleveland?
Median Population Age in South Cleveland is 40.9 Years.
What is the Average Family Size in South Cleveland
Average Family Size in South Cleveland is 2.8 People.
What is the Average Household Size in South Cleveland
Average Household Size in South Cleveland is 2.5 People.
What is Per Capita Income in South Cleveland?
Per Capita income in South Cleveland is $25,719.
What is the Median Family Income in South Cleveland?
Median Family Income in South Cleveland is $69,636.
What is the Median Household income in South Cleveland?
Median Household Income in South Cleveland is $61,547.
What is Income or Wage Gap in South Cleveland?
Income or Wage Gap in South Cleveland is 34.6%.
Women in South Cleveland earn 65.4 cents for every dollar earned by a man.
What is Family Income Deficit in South Cleveland?
Family Income Deficit in South Cleveland is $9,923.
Families that are below poverty line in South Cleveland earn $9,923 less on average than the poverty threshold level.
What is Inequality or Gini Index in South Cleveland?
Inequality or Gini Index in South Cleveland is 0.33.
How Large is the Labor Force in South Cleveland?
There are 3,483 People in the Labor Forcein in South Cleveland.
What is the Percentage of People in the Labor Force in South Cleveland?
59.2% of People are in the Labor Force in South Cleveland.
What is the Unemployment Rate in South Cleveland?
Unemployment Rate in South Cleveland is 10.5%.