Walden, TN
Walden Map
Walden Overview
1,802
TOTAL POPULATION
870
MALE POPULATION
932
FEMALE POPULATION
93.35
MALES / 100 FEMALES
107.13
FEMALES / 100 MALES
42.6
MEDIAN AGE
3.0
AVG FAMILY SIZE
2.6
AVG HOUSEHOLD SIZE
$68,712
PER CAPITA INCOME
$155,855
AVG FAMILY INCOME
$130,227
AVG HOUSEHOLD INCOME
55.9%
WAGE / INCOME GAP [ % ]
44.1¢/ $1
WAGE / INCOME GAP [ $ ]
0.46
INEQUALITY / GINI INDEX
863
LABOR FORCE [ PEOPLE ]
63.3%
PERCENT IN LABOR FORCE
5.2%
UNEMPLOYMENT RATE
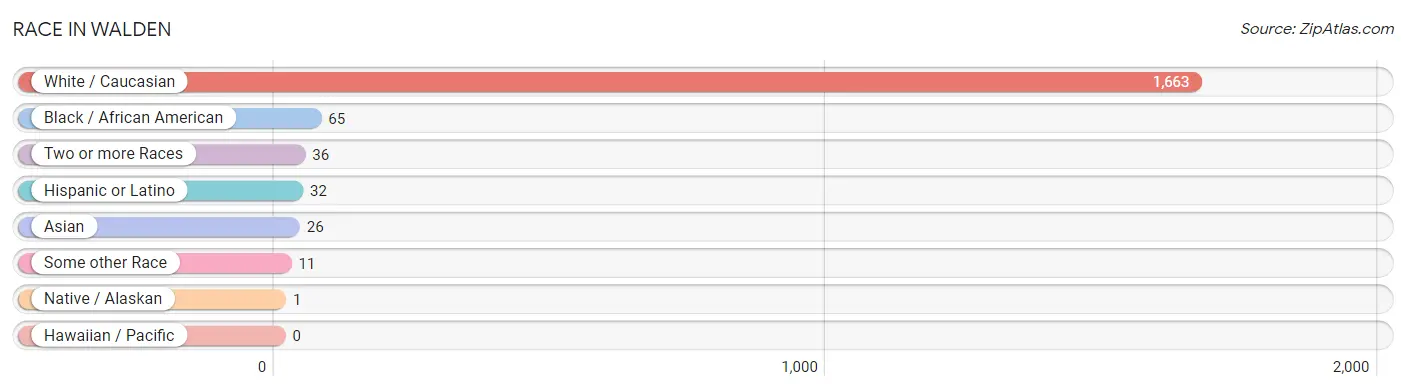
Race in Walden
The most populous races in Walden are White / Caucasian (1,663 | 92.3%), Black / African American (65 | 3.6%), and Two or more Races (36 | 2.0%).
| Race | # Population | % Population |
| Asian | 26 | 1.4% |
| Black / African American | 65 | 3.6% |
| Hawaiian / Pacific | 0 | 0.0% |
| Hispanic or Latino | 32 | 1.8% |
| Native / Alaskan | 1 | 0.1% |
| White / Caucasian | 1,663 | 92.3% |
| Two or more Races | 36 | 2.0% |
| Some other Race | 11 | 0.6% |
| Total | 1,802 | 100.0% |
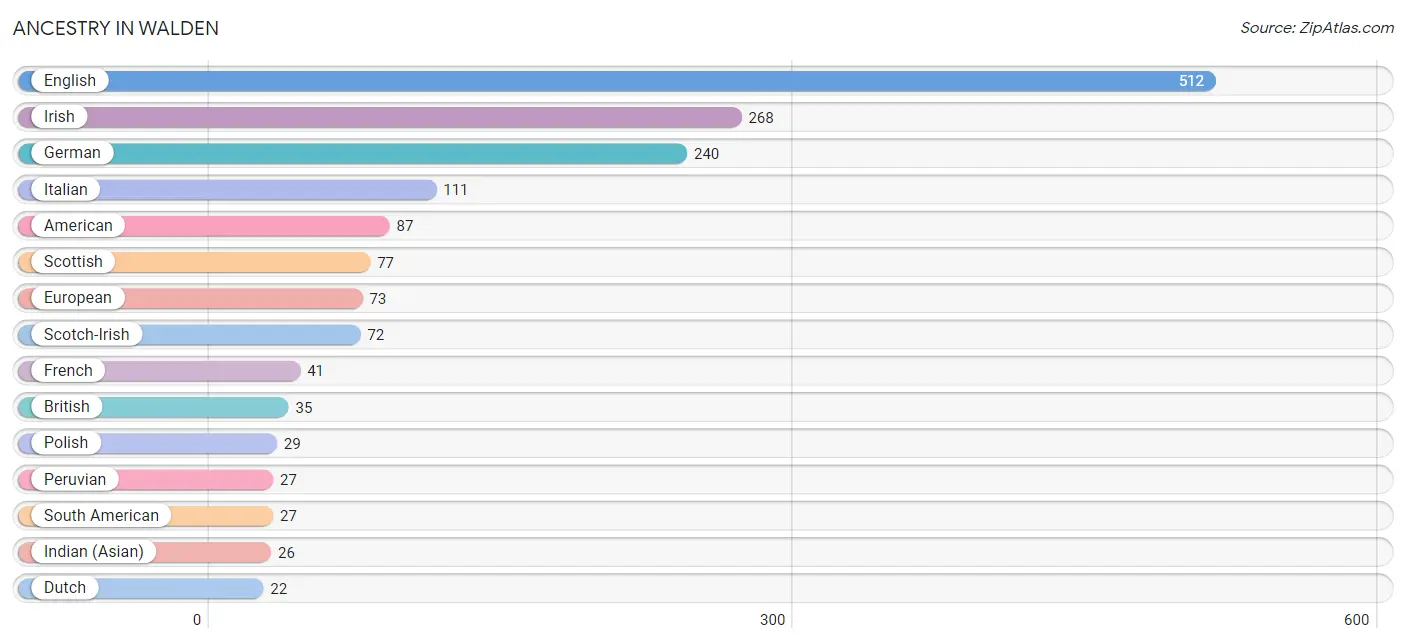
Ancestry in Walden
The most populous ancestries reported in Walden are English (512 | 28.4%), Irish (268 | 14.9%), German (240 | 13.3%), Italian (111 | 6.2%), and American (87 | 4.8%), together accounting for 67.6% of all Walden residents.
| Ancestry | # Population | % Population |
| American | 87 | 4.8% |
| Austrian | 4 | 0.2% |
| Bhutanese | 4 | 0.2% |
| British | 35 | 1.9% |
| Canadian | 1 | 0.1% |
| Cherokee | 8 | 0.4% |
| Choctaw | 4 | 0.2% |
| Czech | 2 | 0.1% |
| Danish | 2 | 0.1% |
| Dutch | 22 | 1.2% |
| English | 512 | 28.4% |
| European | 73 | 4.1% |
| French | 41 | 2.3% |
| French Canadian | 13 | 0.7% |
| German | 240 | 13.3% |
| Greek | 3 | 0.2% |
| Indian (Asian) | 26 | 1.4% |
| Irish | 268 | 14.9% |
| Italian | 111 | 6.2% |
| Mexican | 5 | 0.3% |
| Northern European | 5 | 0.3% |
| Norwegian | 17 | 0.9% |
| Peruvian | 27 | 1.5% |
| Polish | 29 | 1.6% |
| Russian | 3 | 0.2% |
| Scandinavian | 11 | 0.6% |
| Scotch-Irish | 72 | 4.0% |
| Scottish | 77 | 4.3% |
| Slovak | 3 | 0.2% |
| South American | 27 | 1.5% |
| Swedish | 2 | 0.1% |
| Thai | 7 | 0.4% |
| Ukrainian | 8 | 0.4% |
| Welsh | 20 | 1.1% | View All 34 Rows |
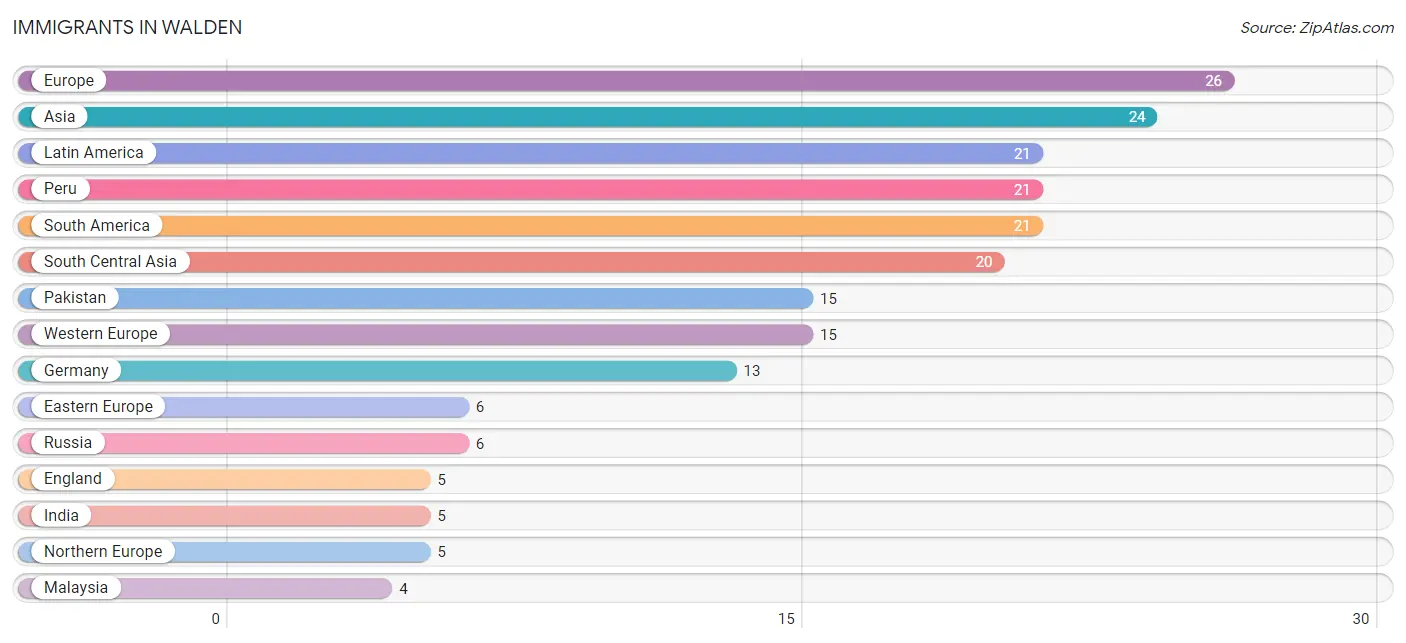
Immigrants in Walden
The most numerous immigrant groups reported in Walden came from Europe (26 | 1.4%), Asia (24 | 1.3%), Latin America (21 | 1.2%), Peru (21 | 1.2%), and South America (21 | 1.2%), together accounting for 6.3% of all Walden residents.
| Immigration Origin | # Population | % Population |
| Asia | 24 | 1.3% |
| Canada | 2 | 0.1% |
| Eastern Europe | 6 | 0.3% |
| England | 5 | 0.3% |
| Europe | 26 | 1.4% |
| Germany | 13 | 0.7% |
| India | 5 | 0.3% |
| Latin America | 21 | 1.2% |
| Malaysia | 4 | 0.2% |
| Netherlands | 2 | 0.1% |
| Northern Europe | 5 | 0.3% |
| Pakistan | 15 | 0.8% |
| Peru | 21 | 1.2% |
| Russia | 6 | 0.3% |
| South America | 21 | 1.2% |
| South Central Asia | 20 | 1.1% |
| South Eastern Asia | 4 | 0.2% |
| Western Europe | 15 | 0.8% | View All 18 Rows |
Sex and Age in Walden
Sex and Age in Walden
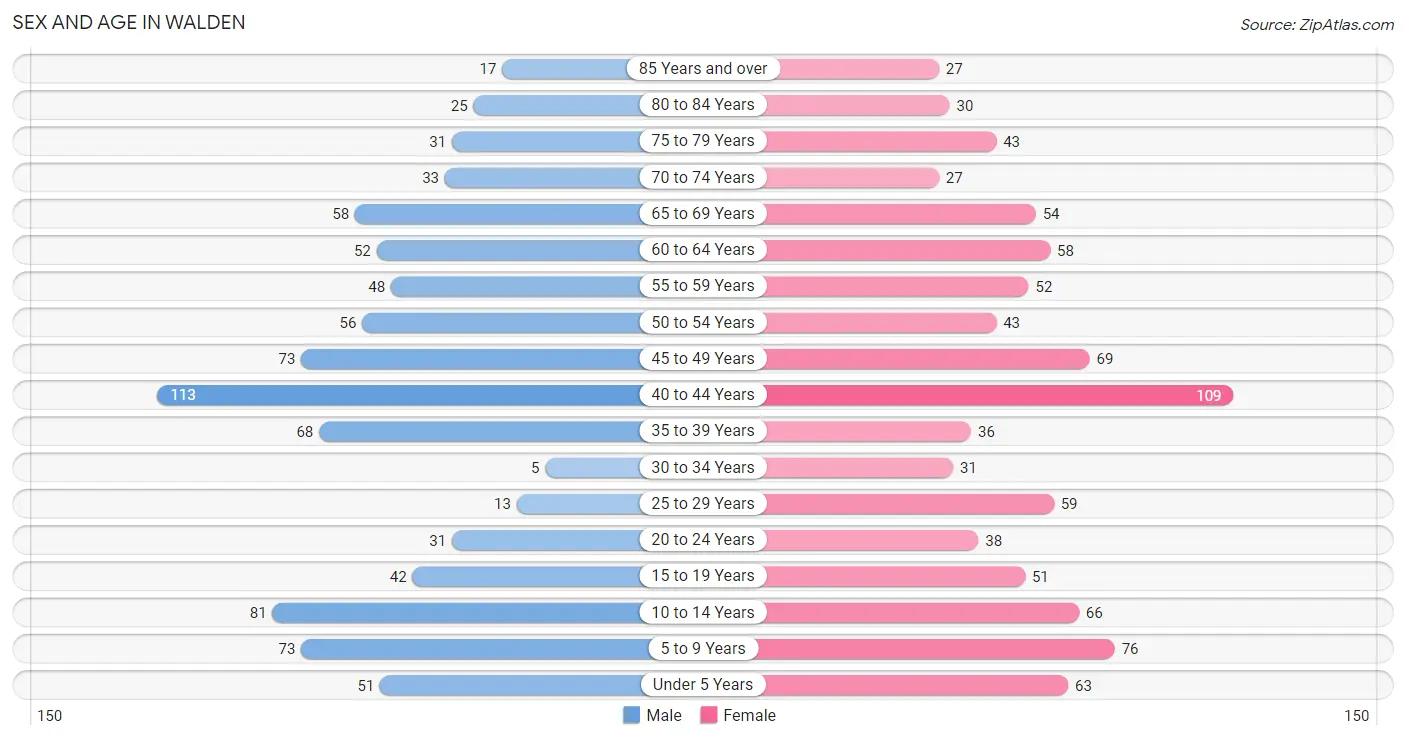
The most populous age groups in Walden are 40 to 44 Years (113 | 13.0%) for men and 40 to 44 Years (109 | 11.7%) for women.
| Age Bracket | Male | Female |
| Under 5 Years | 51 (5.9%) | 63 (6.8%) |
| 5 to 9 Years | 73 (8.4%) | 76 (8.2%) |
| 10 to 14 Years | 81 (9.3%) | 66 (7.1%) |
| 15 to 19 Years | 42 (4.8%) | 51 (5.5%) |
| 20 to 24 Years | 31 (3.6%) | 38 (4.1%) |
| 25 to 29 Years | 13 (1.5%) | 59 (6.3%) |
| 30 to 34 Years | 5 (0.6%) | 31 (3.3%) |
| 35 to 39 Years | 68 (7.8%) | 36 (3.9%) |
| 40 to 44 Years | 113 (13.0%) | 109 (11.7%) |
| 45 to 49 Years | 73 (8.4%) | 69 (7.4%) |
| 50 to 54 Years | 56 (6.4%) | 43 (4.6%) |
| 55 to 59 Years | 48 (5.5%) | 52 (5.6%) |
| 60 to 64 Years | 52 (6.0%) | 58 (6.2%) |
| 65 to 69 Years | 58 (6.7%) | 54 (5.8%) |
| 70 to 74 Years | 33 (3.8%) | 27 (2.9%) |
| 75 to 79 Years | 31 (3.6%) | 43 (4.6%) |
| 80 to 84 Years | 25 (2.9%) | 30 (3.2%) |
| 85 Years and over | 17 (1.9%) | 27 (2.9%) |
| Total | 870 (100.0%) | 932 (100.0%) |
Families and Households in Walden
Median Family Size in Walden
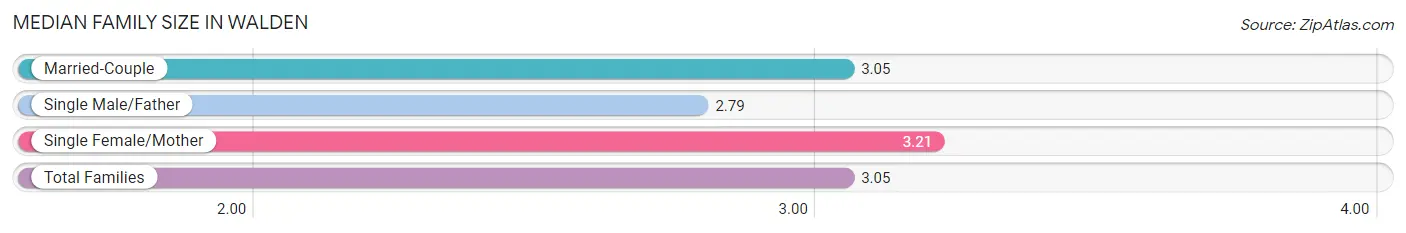
The median family size in Walden is 3.05 persons per family, with single female/mother families (61 | 11.9%) accounting for the largest median family size of 3.21 persons per family. On the other hand, single male/father families (43 | 8.4%) represent the smallest median family size with 2.79 persons per family.
| Family Type | # Families | Family Size |
| Married-Couple | 409 (79.7%) | 3.05 |
| Single Male/Father | 43 (8.4%) | 2.79 |
| Single Female/Mother | 61 (11.9%) | 3.21 |
| Total Families | 513 (100.0%) | 3.05 |
Median Household Size in Walden
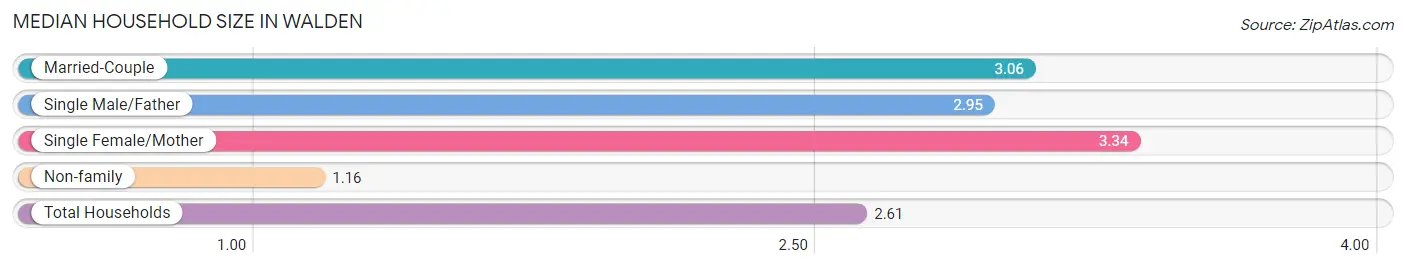
The median household size in Walden is 2.61 persons per household, with single female/mother households (61 | 9.0%) accounting for the largest median household size of 3.34 persons per household. non-family households (167 | 24.6%) represent the smallest median household size with 1.16 persons per household.
| Household Type | # Households | Household Size |
| Married-Couple | 409 (60.2%) | 3.06 |
| Single Male/Father | 43 (6.3%) | 2.95 |
| Single Female/Mother | 61 (9.0%) | 3.34 |
| Non-family | 167 (24.6%) | 1.16 |
| Total Households | 680 (100.0%) | 2.61 |
Household Size by Marriage Status in Walden
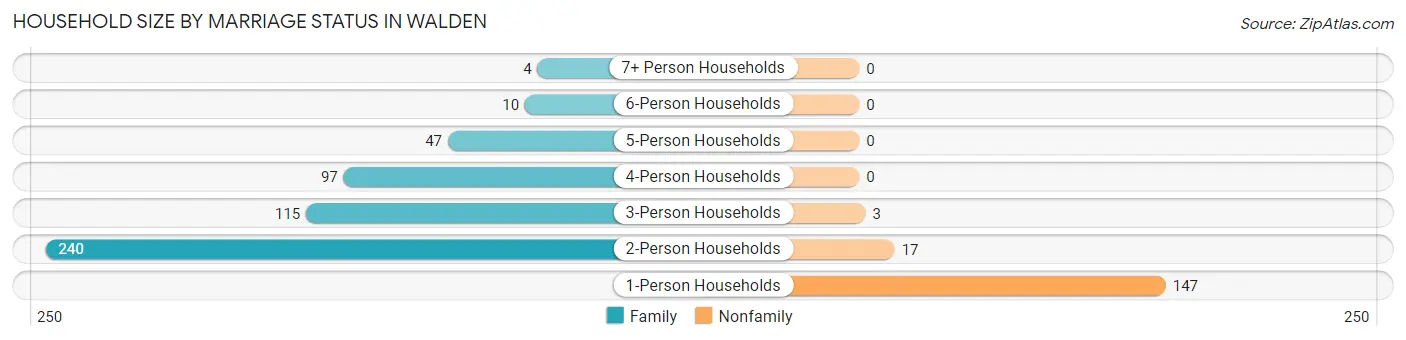
Out of a total of 680 households in Walden, 513 (75.4%) are family households, while 167 (24.6%) are nonfamily households. The most numerous type of family households are 2-person households, comprising 240, and the most common type of nonfamily households are 1-person households, comprising 147.
| Household Size | Family Households | Nonfamily Households |
| 1-Person Households | - | 147 (21.6%) |
| 2-Person Households | 240 (35.3%) | 17 (2.5%) |
| 3-Person Households | 115 (16.9%) | 3 (0.4%) |
| 4-Person Households | 97 (14.3%) | 0 (0.0%) |
| 5-Person Households | 47 (6.9%) | 0 (0.0%) |
| 6-Person Households | 10 (1.5%) | 0 (0.0%) |
| 7+ Person Households | 4 (0.6%) | 0 (0.0%) |
| Total | 513 (75.4%) | 167 (24.6%) |
Female Fertility in Walden
Fertility by Age in Walden
Average fertility rate in Walden is 44.0 births per 1,000 women. Women in the age bracket of 20 to 34 years have the highest fertility rate with 141.0 births per 1,000 women. Women in the age bracket of 20 to 34 years acount for 100.0% of all women with births.
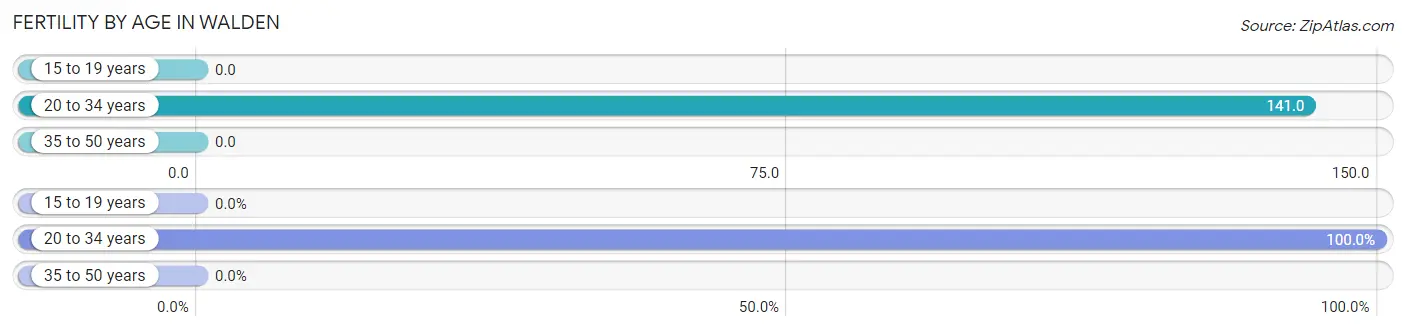
| Age Bracket | Women with Births | Births / 1,000 Women |
| 15 to 19 years | 0 (0.0%) | 0.0 |
| 20 to 34 years | 18 (100.0%) | 141.0 |
| 35 to 50 years | 0 (0.0%) | 0.0 |
| Total | 18 (100.0%) | 44.0 |
Fertility by Age by Marriage Status in Walden
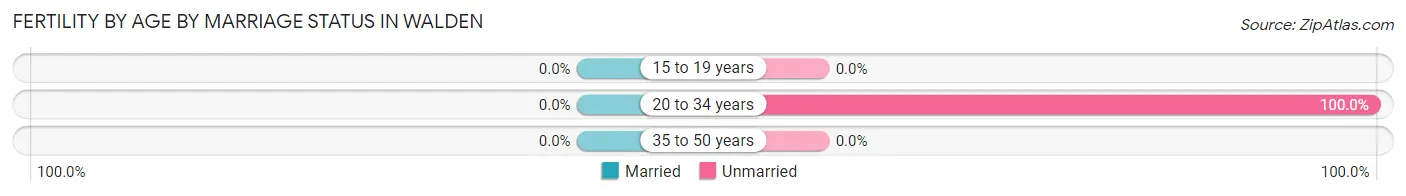
| Age Bracket | Married | Unmarried |
| 15 to 19 years | 0 (0.0%) | 0 (0.0%) |
| 20 to 34 years | 0 (0.0%) | 18 (100.0%) |
| 35 to 50 years | 0 (0.0%) | 0 (0.0%) |
| Total | 0 (0.0%) | 18 (100.0%) |
Fertility by Education in Walden
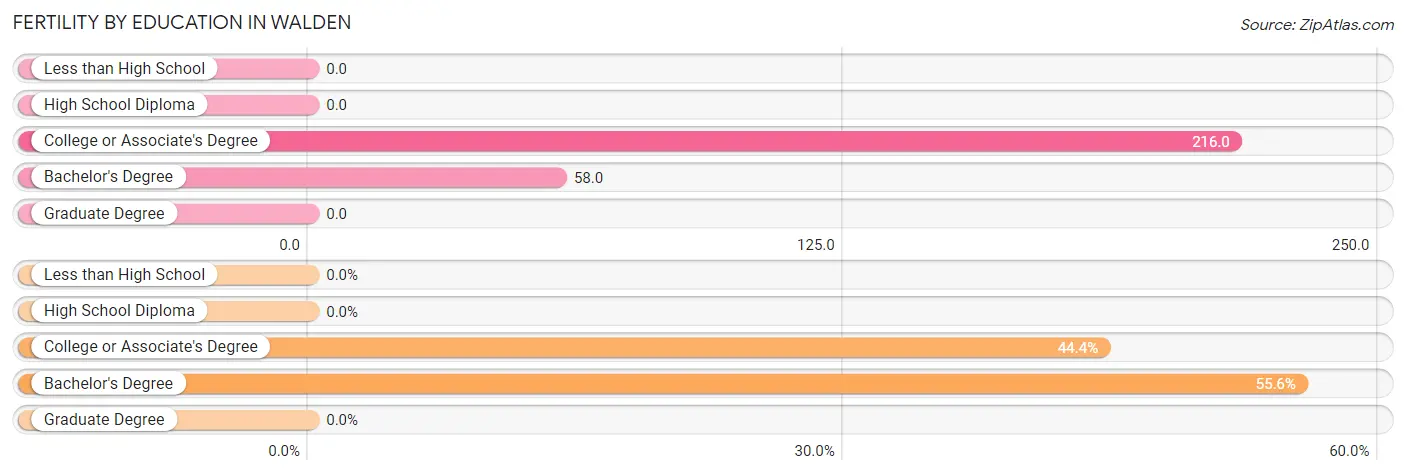
| Educational Attainment | Women with Births | Births / 1,000 Women |
| Less than High School | 0 (0.0%) | 0.0 |
| High School Diploma | 0 (0.0%) | 0.0 |
| College or Associate's Degree | 8 (44.4%) | 216.0 |
| Bachelor's Degree | 10 (55.6%) | 58.0 |
| Graduate Degree | 0 (0.0%) | 0.0 |
| Total | 18 (100.0%) | 44.0 |
Fertility by Education by Marriage Status in Walden
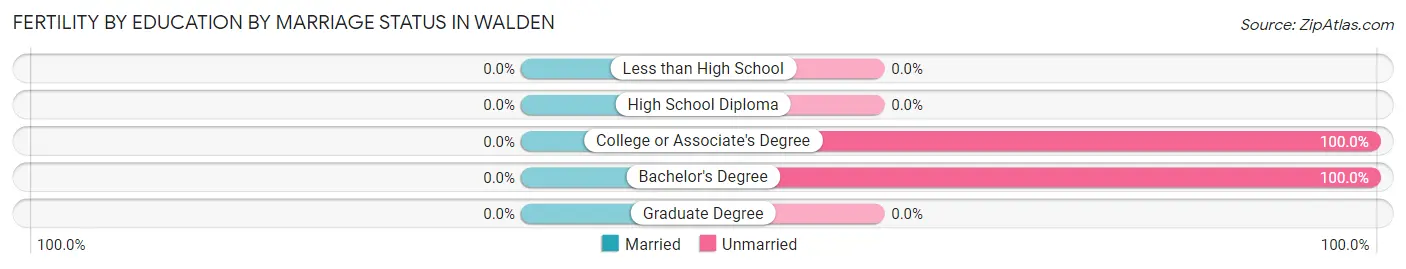
| Educational Attainment | Married | Unmarried |
| Less than High School | 0 (0.0%) | 0 (0.0%) |
| High School Diploma | 0 (0.0%) | 0 (0.0%) |
| College or Associate's Degree | 0 (0.0%) | 8 (100.0%) |
| Bachelor's Degree | 0 (0.0%) | 10 (100.0%) |
| Graduate Degree | 0 (0.0%) | 0 (0.0%) |
| Total | 0 (0.0%) | 18 (100.0%) |
Income in Walden
Income Overview in Walden
Per Capita Income in Walden is $68,712, while median incomes of families and households are $155,855 and $130,227 respectively.
| Characteristic | Number | Measure |
| Per Capita Income | 1,802 | $68,712 |
| Median Family Income | 513 | $155,855 |
| Mean Family Income | 513 | $200,543 |
| Median Household Income | 680 | $130,227 |
| Mean Household Income | 680 | $179,514 |
| Income Deficit | 513 | $0 |
| Wage / Income Gap (%) | 1,802 | 55.86% |
| Wage / Income Gap ($) | 1,802 | 44.14¢ per $1 |
| Gini / Inequality Index | 1,802 | 0.46 |
Earnings by Sex in Walden
Average Earnings in Walden are $54,815, $87,375 for men and $38,563 for women, a difference of 55.9%.
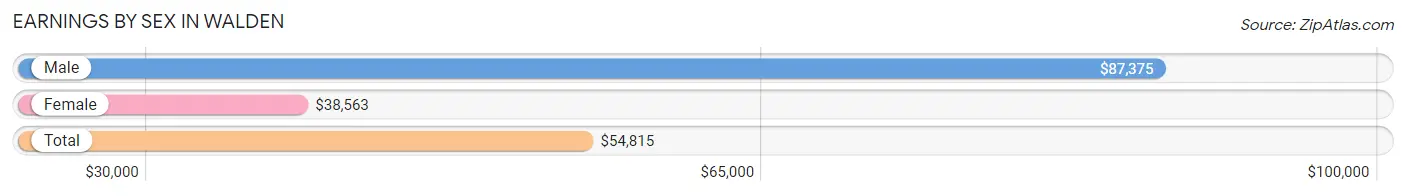
| Sex | Number | Average Earnings |
| Male | 513 (56.5%) | $87,375 |
| Female | 395 (43.5%) | $38,563 |
| Total | 908 (100.0%) | $54,815 |
Earnings by Sex by Income Bracket in Walden
The most common earnings brackets in Walden are $100,000+ for men (246 | 47.9%) and $35,000 to $39,999 for women (44 | 11.1%).
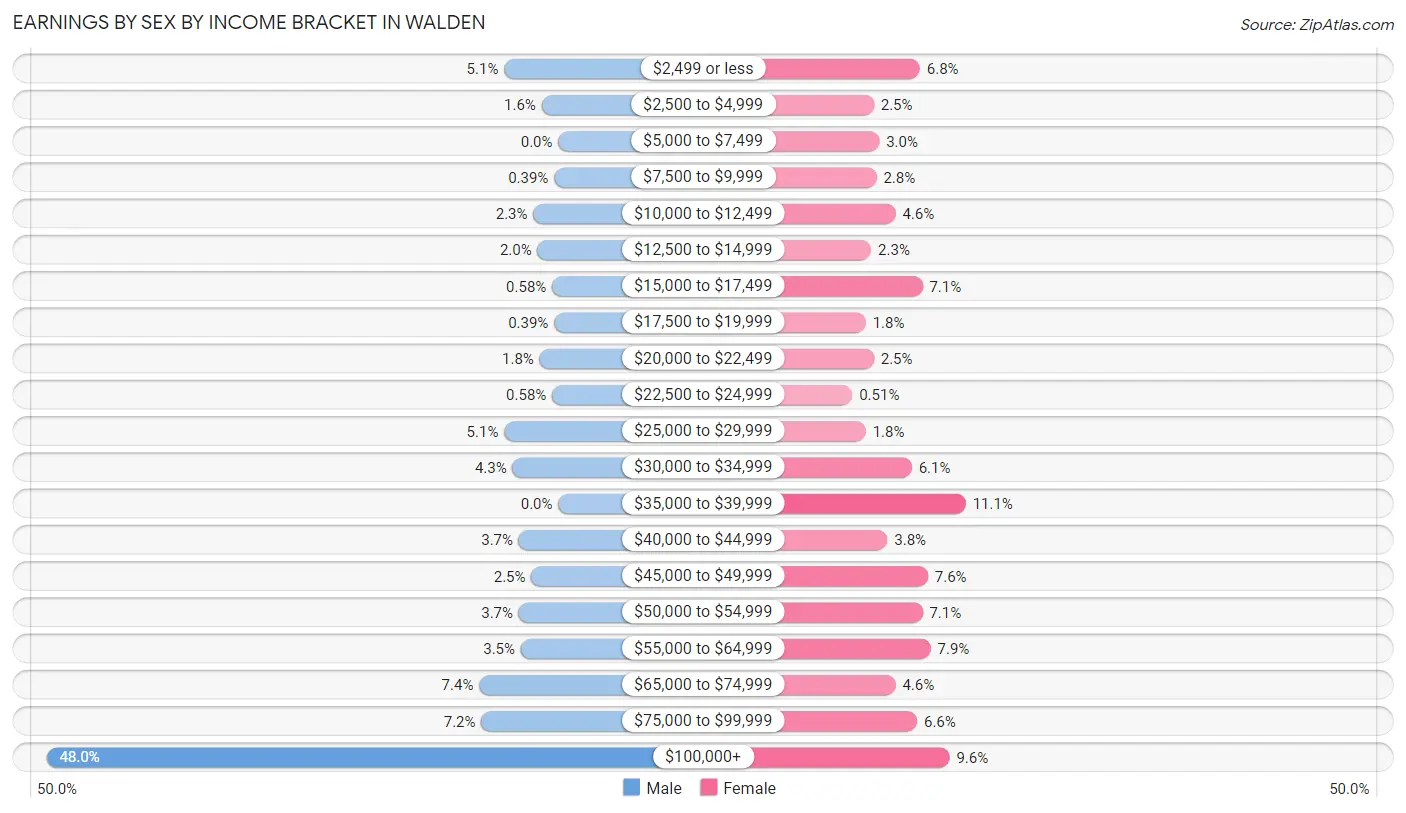
| Income | Male | Female |
| $2,499 or less | 26 (5.1%) | 27 (6.8%) |
| $2,500 to $4,999 | 8 (1.6%) | 10 (2.5%) |
| $5,000 to $7,499 | 0 (0.0%) | 12 (3.0%) |
| $7,500 to $9,999 | 2 (0.4%) | 11 (2.8%) |
| $10,000 to $12,499 | 12 (2.3%) | 18 (4.6%) |
| $12,500 to $14,999 | 10 (1.9%) | 9 (2.3%) |
| $15,000 to $17,499 | 3 (0.6%) | 28 (7.1%) |
| $17,500 to $19,999 | 2 (0.4%) | 7 (1.8%) |
| $20,000 to $22,499 | 9 (1.8%) | 10 (2.5%) |
| $22,500 to $24,999 | 3 (0.6%) | 2 (0.5%) |
| $25,000 to $29,999 | 26 (5.1%) | 7 (1.8%) |
| $30,000 to $34,999 | 22 (4.3%) | 24 (6.1%) |
| $35,000 to $39,999 | 0 (0.0%) | 44 (11.1%) |
| $40,000 to $44,999 | 19 (3.7%) | 15 (3.8%) |
| $45,000 to $49,999 | 13 (2.5%) | 30 (7.6%) |
| $50,000 to $54,999 | 19 (3.7%) | 28 (7.1%) |
| $55,000 to $64,999 | 18 (3.5%) | 31 (7.9%) |
| $65,000 to $74,999 | 38 (7.4%) | 18 (4.6%) |
| $75,000 to $99,999 | 37 (7.2%) | 26 (6.6%) |
| $100,000+ | 246 (47.9%) | 38 (9.6%) |
| Total | 513 (100.0%) | 395 (100.0%) |
Earnings by Sex by Educational Attainment in Walden
Average earnings in Walden are $105,341 for men and $41,875 for women, a difference of 60.3%. Men with an educational attainment of graduate degree enjoy the highest average annual earnings of $166,333, while those with high school diploma education earn the least with $62,188. Women with an educational attainment of bachelor's degree earn the most with the average annual earnings of $53,295, while those with graduate degree education have the smallest earnings of $39,375.
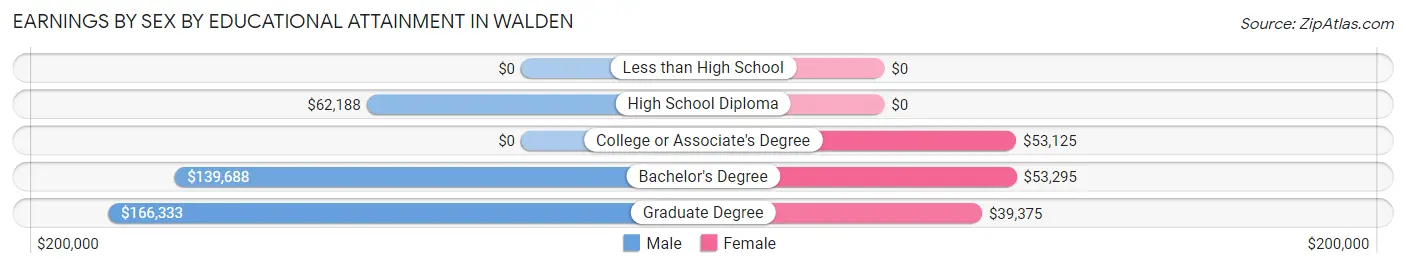
| Educational Attainment | Male Income | Female Income |
| Less than High School | - | - |
| High School Diploma | $62,188 | $0 |
| College or Associate's Degree | - | - |
| Bachelor's Degree | $139,688 | $53,295 |
| Graduate Degree | $166,333 | $39,375 |
| Total | $105,341 | $41,875 |
Family Income in Walden
Family Income Brackets in Walden
According to the Walden family income data, there are 183 families falling into the $200,000+ income range, which is the most common income bracket and makes up 35.7% of all families. Conversely, the $10,000 to $14,999 income bracket is the least frequent group with only 2 families (0.4%) belonging to this category.
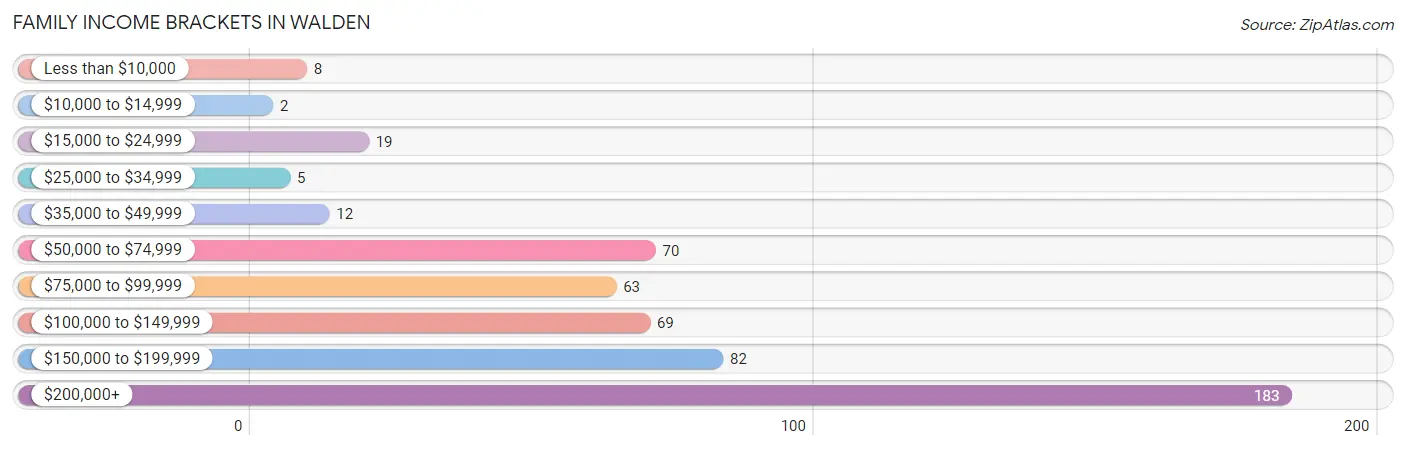
| Income Bracket | # Families | % Families |
| Less than $10,000 | 8 | 1.6% |
| $10,000 to $14,999 | 2 | 0.4% |
| $15,000 to $24,999 | 19 | 3.7% |
| $25,000 to $34,999 | 5 | 1.0% |
| $35,000 to $49,999 | 12 | 2.3% |
| $50,000 to $74,999 | 70 | 13.6% |
| $75,000 to $99,999 | 63 | 12.3% |
| $100,000 to $149,999 | 69 | 13.5% |
| $150,000 to $199,999 | 82 | 16.0% |
| $200,000+ | 183 | 35.7% |
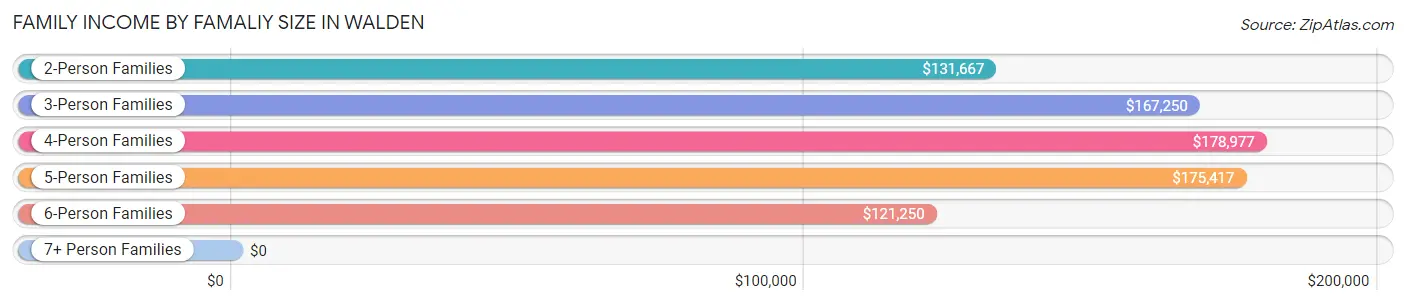
Family Income by Famaliy Size in Walden
4-person families (91 | 17.7%) account for the highest median family income in Walden with $178,977 per family, while 2-person families (244 | 47.6%) have the highest median income of $65,834 per family member.
| Income Bracket | # Families | Median Income |
| 2-Person Families | 244 (47.6%) | $131,667 |
| 3-Person Families | 119 (23.2%) | $167,250 |
| 4-Person Families | 91 (17.7%) | $178,977 |
| 5-Person Families | 45 (8.8%) | $175,417 |
| 6-Person Families | 10 (1.9%) | $121,250 |
| 7+ Person Families | 4 (0.8%) | $0 |
| Total | 513 (100.0%) | $155,855 |
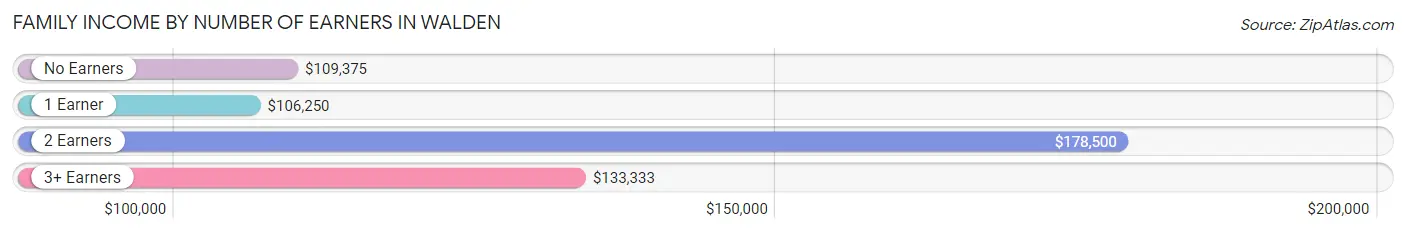
Family Income by Number of Earners in Walden
The median family income in Walden is $155,855, with families comprising 2 earners (246) having the highest median family income of $178,500, while families with 1 earner (176) have the lowest median family income of $106,250, accounting for 47.9% and 34.3% of families, respectively.
| Number of Earners | # Families | Median Income |
| No Earners | 67 (13.1%) | $109,375 |
| 1 Earner | 176 (34.3%) | $106,250 |
| 2 Earners | 246 (47.9%) | $178,500 |
| 3+ Earners | 24 (4.7%) | $133,333 |
| Total | 513 (100.0%) | $155,855 |
Household Income in Walden
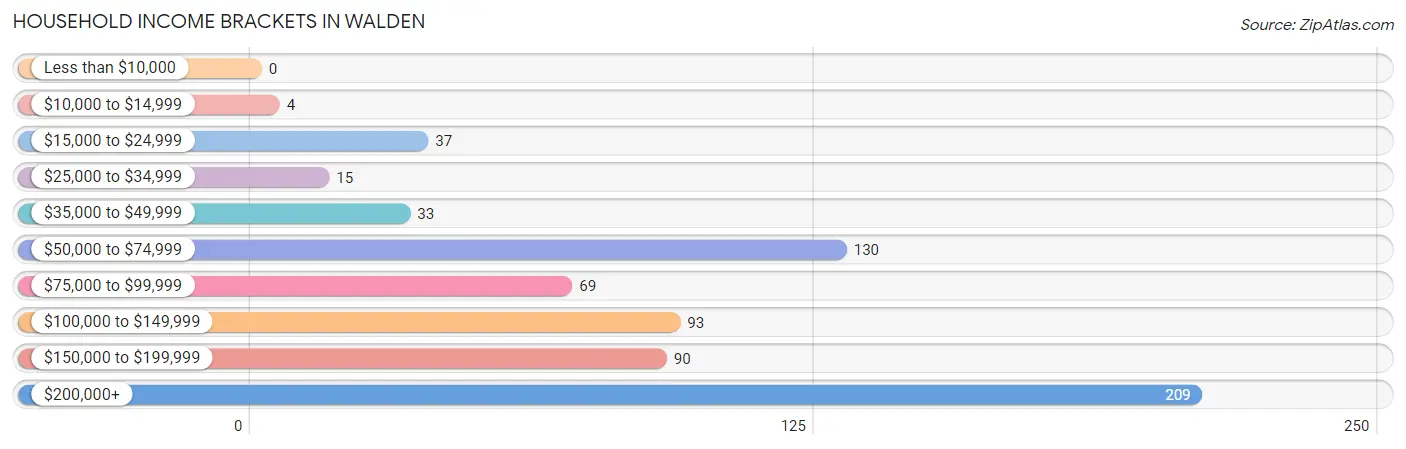
Household Income Brackets in Walden
With 209 households falling in the category, the $200,000+ income range is the most frequent in Walden, accounting for 30.7% of all households.
| Income Bracket | # Households | % Households |
| Less than $10,000 | 0 | 0.0% |
| $10,000 to $14,999 | 4 | 0.6% |
| $15,000 to $24,999 | 37 | 5.4% |
| $25,000 to $34,999 | 15 | 2.2% |
| $35,000 to $49,999 | 33 | 4.9% |
| $50,000 to $74,999 | 130 | 19.1% |
| $75,000 to $99,999 | 69 | 10.1% |
| $100,000 to $149,999 | 93 | 13.7% |
| $150,000 to $199,999 | 90 | 13.2% |
| $200,000+ | 209 | 30.7% |
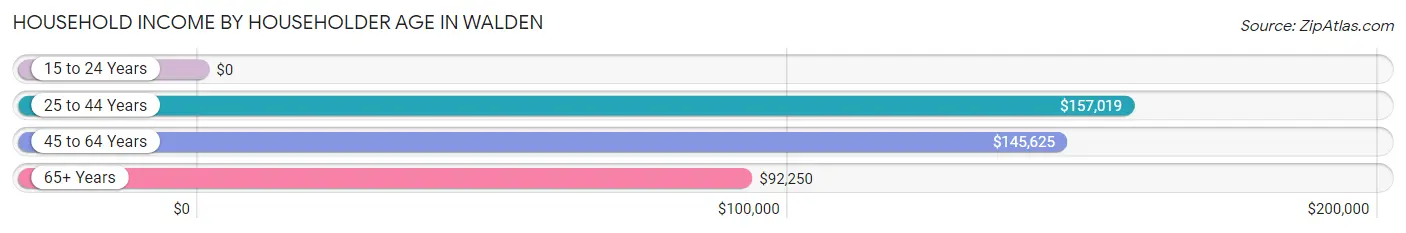
Household Income by Householder Age in Walden
The median household income in Walden is $130,227, with the highest median household income of $157,019 found in the 25 to 44 years age bracket for the primary householder. A total of 187 households (27.5%) fall into this category. Meanwhile, the 15 to 24 years age bracket for the primary householder has the lowest median household income of $0, with 14 households (2.1%) in this group.
| Income Bracket | # Households | Median Income |
| 15 to 24 Years | 14 (2.1%) | $0 |
| 25 to 44 Years | 187 (27.5%) | $157,019 |
| 45 to 64 Years | 260 (38.2%) | $145,625 |
| 65+ Years | 219 (32.2%) | $92,250 |
| Total | 680 (100.0%) | $130,227 |
Poverty in Walden
Income Below Poverty by Sex and Age in Walden
With 8.9% poverty level for males and 4.6% for females among the residents of Walden, under 5 year old males and 25 to 34 year old females are the most vulnerable to poverty, with 18 males (36.7%) and 16 females (17.8%) in their respective age groups living below the poverty level.
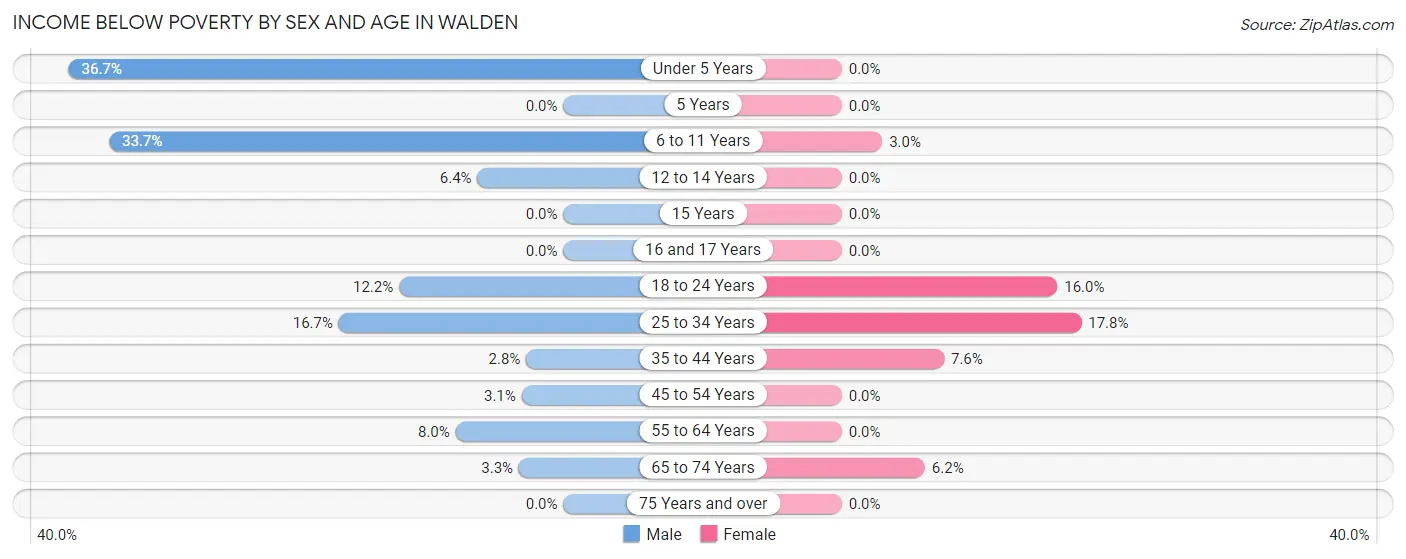
| Age Bracket | Male | Female |
| Under 5 Years | 18 (36.7%) | 0 (0.0%) |
| 5 Years | 0 (0.0%) | 0 (0.0%) |
| 6 to 11 Years | 28 (33.7%) | 3 (3.0%) |
| 12 to 14 Years | 3 (6.4%) | 0 (0.0%) |
| 15 Years | 0 (0.0%) | 0 (0.0%) |
| 16 and 17 Years | 0 (0.0%) | 0 (0.0%) |
| 18 to 24 Years | 5 (12.2%) | 8 (16.0%) |
| 25 to 34 Years | 3 (16.7%) | 16 (17.8%) |
| 35 to 44 Years | 5 (2.8%) | 11 (7.6%) |
| 45 to 54 Years | 4 (3.1%) | 0 (0.0%) |
| 55 to 64 Years | 8 (8.0%) | 0 (0.0%) |
| 65 to 74 Years | 3 (3.3%) | 5 (6.2%) |
| 75 Years and over | 0 (0.0%) | 0 (0.0%) |
| Total | 77 (8.9%) | 43 (4.6%) |
Income Above Poverty by Sex and Age in Walden
According to the poverty statistics in Walden, males aged 5 years and females aged under 5 years are the age groups that are most secure financially, with 100.0% of males and 100.0% of females in these age groups living above the poverty line.
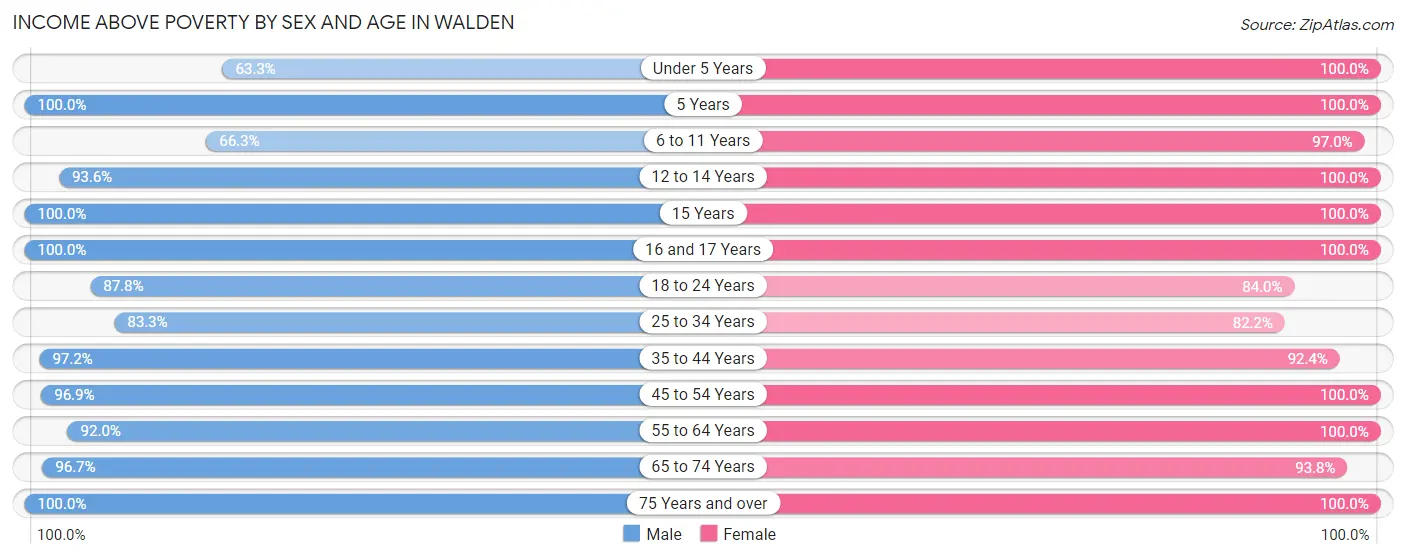
| Age Bracket | Male | Female |
| Under 5 Years | 31 (63.3%) | 63 (100.0%) |
| 5 Years | 24 (100.0%) | 4 (100.0%) |
| 6 to 11 Years | 55 (66.3%) | 97 (97.0%) |
| 12 to 14 Years | 44 (93.6%) | 38 (100.0%) |
| 15 Years | 17 (100.0%) | 12 (100.0%) |
| 16 and 17 Years | 15 (100.0%) | 27 (100.0%) |
| 18 to 24 Years | 36 (87.8%) | 42 (84.0%) |
| 25 to 34 Years | 15 (83.3%) | 74 (82.2%) |
| 35 to 44 Years | 176 (97.2%) | 134 (92.4%) |
| 45 to 54 Years | 125 (96.9%) | 112 (100.0%) |
| 55 to 64 Years | 92 (92.0%) | 110 (100.0%) |
| 65 to 74 Years | 88 (96.7%) | 76 (93.8%) |
| 75 Years and over | 73 (100.0%) | 100 (100.0%) |
| Total | 791 (91.1%) | 889 (95.4%) |
Income Below Poverty Among Married-Couple Families in Walden
The poverty statistics for married-couple families in Walden show that 0.7% or 3 of the total 409 families live below the poverty line. Families with 1 or 2 children have the highest poverty rate of 1.9%, comprising of 3 families. On the other hand, families with no children have the lowest poverty rate of 0.0%, which includes 0 families.
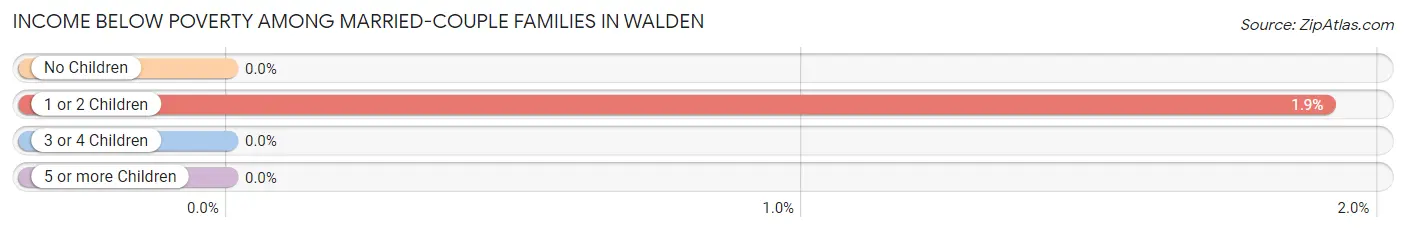
| Children | Above Poverty | Below Poverty |
| No Children | 212 (100.0%) | 0 (0.0%) |
| 1 or 2 Children | 154 (98.1%) | 3 (1.9%) |
| 3 or 4 Children | 36 (100.0%) | 0 (0.0%) |
| 5 or more Children | 4 (100.0%) | 0 (0.0%) |
| Total | 406 (99.3%) | 3 (0.7%) |
Income Below Poverty Among Single-Parent Households in Walden
According to the poverty data in Walden, 4.6% or 2 single-father households and 36.1% or 22 single-mother households are living below the poverty line. Among single-father households, those with no children have the highest poverty rate, with 2 households (8.0%) experiencing poverty. Likewise, among single-mother households, those with 3 or 4 children have the highest poverty rate, with 10 households (100.0%) falling below the poverty line.
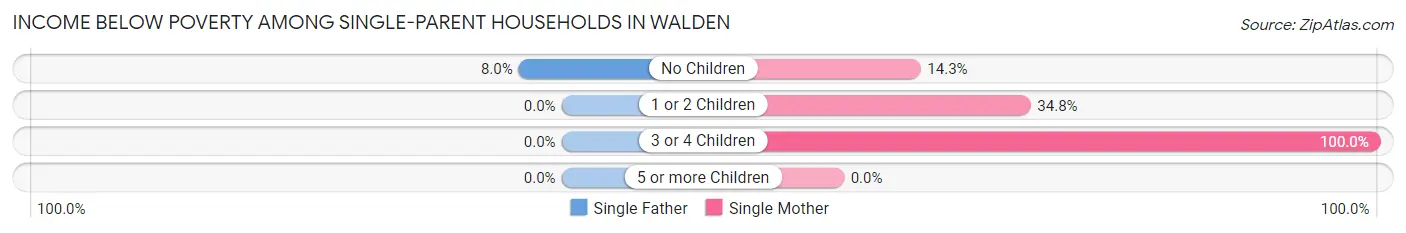
| Children | Single Father | Single Mother |
| No Children | 2 (8.0%) | 4 (14.3%) |
| 1 or 2 Children | 0 (0.0%) | 8 (34.8%) |
| 3 or 4 Children | 0 (0.0%) | 10 (100.0%) |
| 5 or more Children | 0 (0.0%) | 0 (0.0%) |
| Total | 2 (4.6%) | 22 (36.1%) |
Income Below Poverty Among Married-Couple vs Single-Parent Households in Walden
The poverty data for Walden shows that 3 of the married-couple family households (0.7%) and 24 of the single-parent households (23.1%) are living below the poverty level. Within the married-couple family households, those with 1 or 2 children have the highest poverty rate, with 3 households (1.9%) falling below the poverty line. Among the single-parent households, those with 3 or 4 children have the highest poverty rate, with 10 household (47.6%) living below poverty.
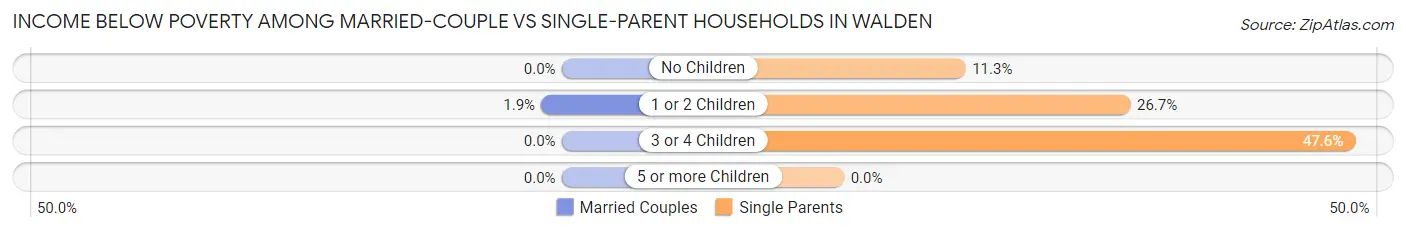
| Children | Married-Couple Families | Single-Parent Households |
| No Children | 0 (0.0%) | 6 (11.3%) |
| 1 or 2 Children | 3 (1.9%) | 8 (26.7%) |
| 3 or 4 Children | 0 (0.0%) | 10 (47.6%) |
| 5 or more Children | 0 (0.0%) | 0 (0.0%) |
| Total | 3 (0.7%) | 24 (23.1%) |
Employment Characteristics in Walden
Employment by Class of Employer in Walden
Among the 813 employed individuals in Walden, private company employees (513 | 63.1%), self-employed (not incorporated) (98 | 12.0%), and not-for-profit organizations (81 | 10.0%) make up the most common classes of employment.
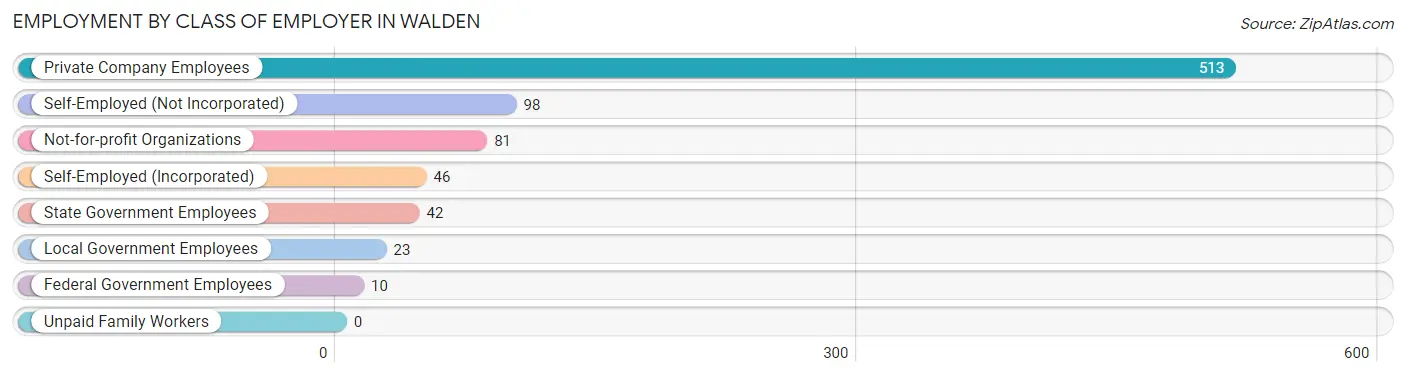
| Employer Class | # Employees | % Employees |
| Private Company Employees | 513 | 63.1% |
| Self-Employed (Incorporated) | 46 | 5.7% |
| Self-Employed (Not Incorporated) | 98 | 12.0% |
| Not-for-profit Organizations | 81 | 10.0% |
| Local Government Employees | 23 | 2.8% |
| State Government Employees | 42 | 5.2% |
| Federal Government Employees | 10 | 1.2% |
| Unpaid Family Workers | 0 | 0.0% |
| Total | 813 | 100.0% |
Employment Status by Age in Walden
According to the labor force statistics for Walden, out of the total population over 16 years of age (1,363), 63.3% or 863 individuals are in the labor force, with 5.2% or 45 of them unemployed. The age group with the highest labor force participation rate is 25 to 29 years, with 95.8% or 69 individuals in the labor force. Within the labor force, the 16 to 19 years age range has the highest percentage of unemployed individuals, with 33.3% or 8 of them being unemployed.
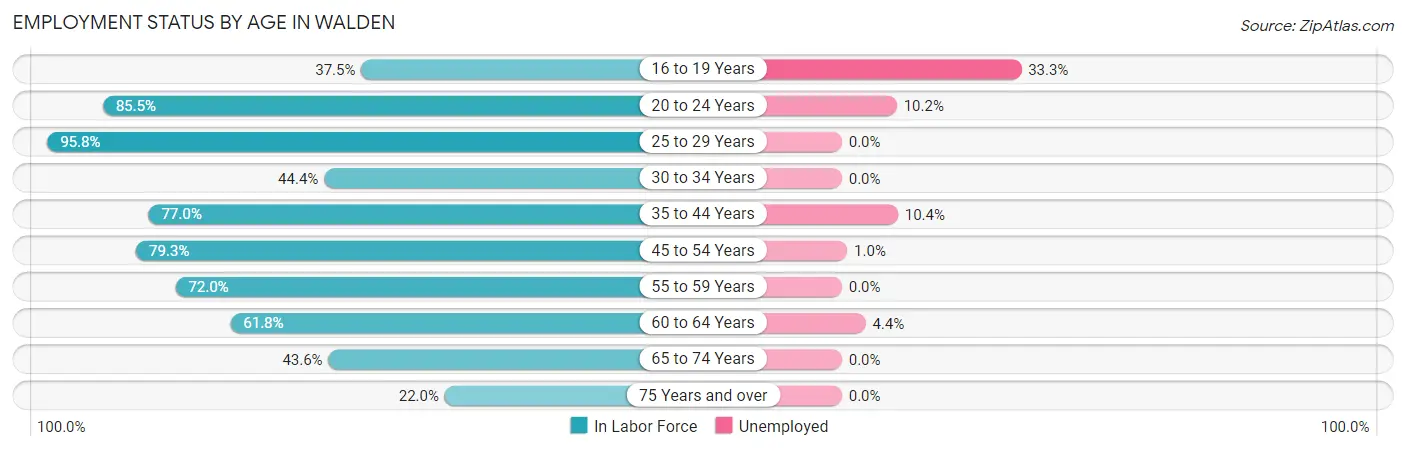
| Age Bracket | In Labor Force | Unemployed |
| 16 to 19 Years | 24 (37.5%) | 8 (33.3%) |
| 20 to 24 Years | 59 (85.5%) | 6 (10.2%) |
| 25 to 29 Years | 69 (95.8%) | 0 (0.0%) |
| 30 to 34 Years | 16 (44.4%) | 0 (0.0%) |
| 35 to 44 Years | 251 (77.0%) | 26 (10.4%) |
| 45 to 54 Years | 191 (79.3%) | 2 (1.0%) |
| 55 to 59 Years | 72 (72.0%) | 0 (0.0%) |
| 60 to 64 Years | 68 (61.8%) | 3 (4.4%) |
| 65 to 74 Years | 75 (43.6%) | 0 (0.0%) |
| 75 Years and over | 38 (22.0%) | 0 (0.0%) |
| Total | 863 (63.3%) | 45 (5.2%) |
Employment Status by Educational Attainment in Walden
According to labor force statistics for Walden, 75.4% of individuals (667) out of the total population between 25 and 64 years of age (885) are in the labor force, with 4.6% or 31 of them being unemployed. The group with the highest labor force participation rate are those with the educational attainment of college / associate degree, with 83.5% or 106 individuals in the labor force. Within the labor force, individuals with college / associate degree education have the highest percentage of unemployment, with 24.5% or 26 of them being unemployed.
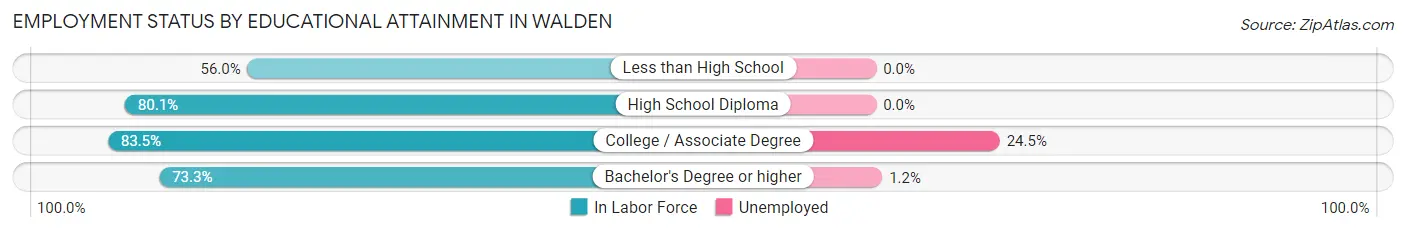
| Educational Attainment | In Labor Force | Unemployed |
| Less than High School | 14 (56.0%) | 0 (0.0%) |
| High School Diploma | 117 (80.1%) | 0 (0.0%) |
| College / Associate Degree | 106 (83.5%) | 31 (24.5%) |
| Bachelor's Degree or higher | 430 (73.3%) | 7 (1.2%) |
| Total | 667 (75.4%) | 41 (4.6%) |
Employment Occupations by Sex in Walden
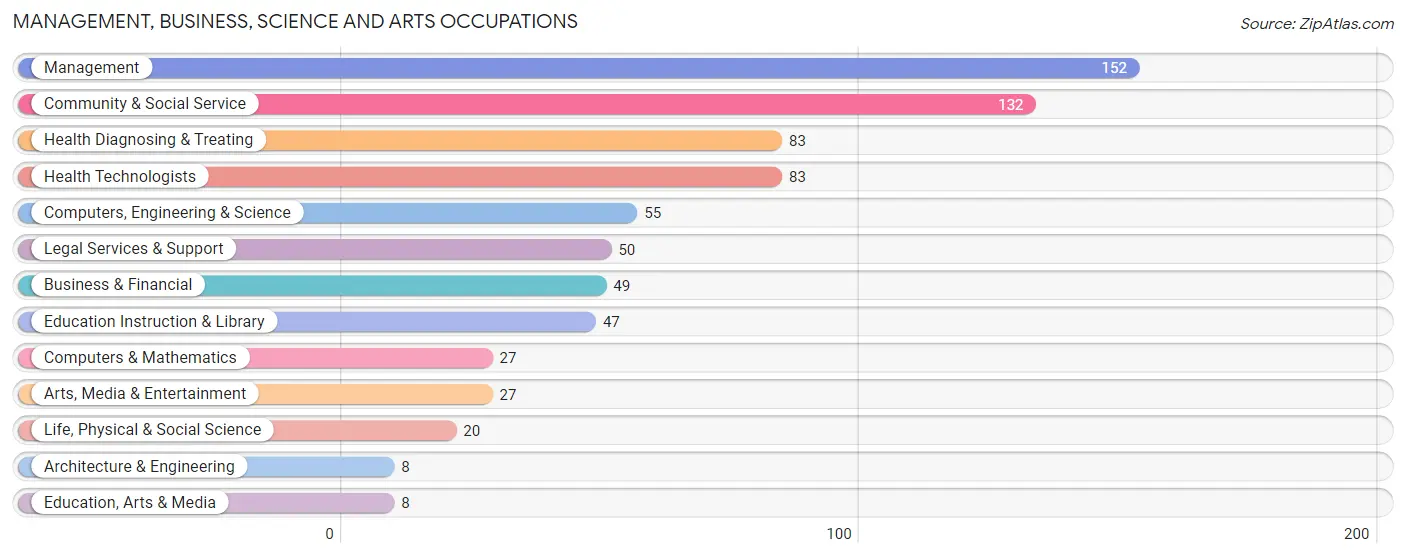
Management, Business, Science and Arts Occupations
The most common Management, Business, Science and Arts occupations in Walden are Management (152 | 18.6%), Community & Social Service (132 | 16.1%), Health Diagnosing & Treating (83 | 10.2%), Health Technologists (83 | 10.2%), and Computers, Engineering & Science (55 | 6.7%).
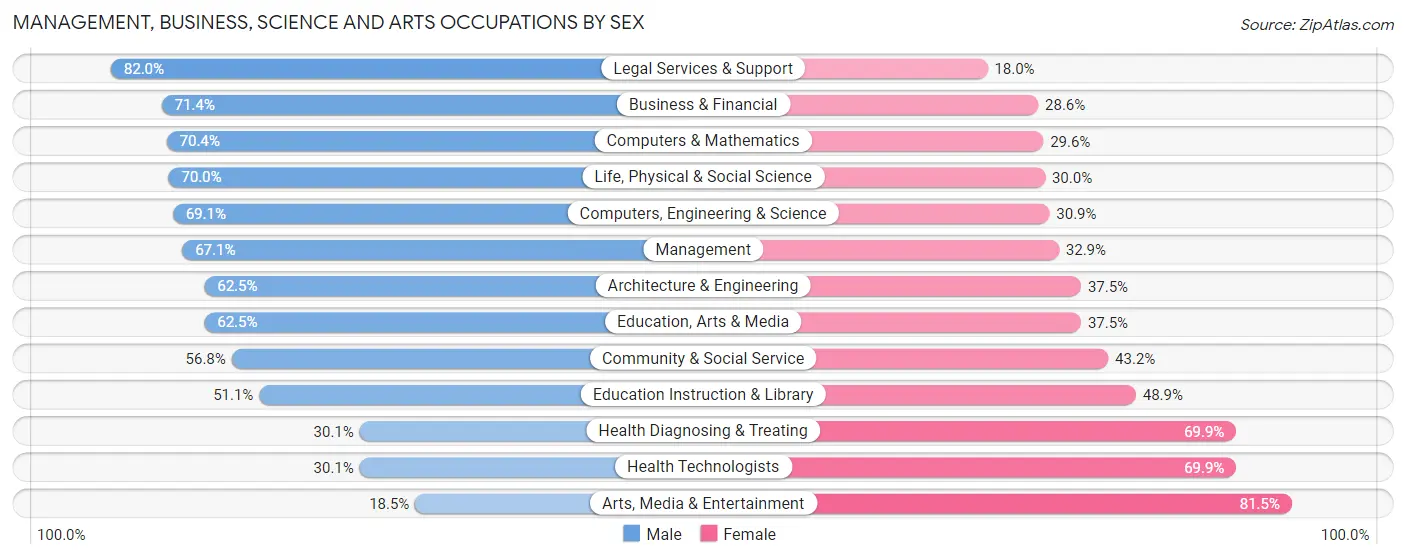
Management, Business, Science and Arts Occupations by Sex
Within the Management, Business, Science and Arts occupations in Walden, the most male-oriented occupations are Legal Services & Support (82.0%), Business & Financial (71.4%), and Computers & Mathematics (70.4%), while the most female-oriented occupations are Arts, Media & Entertainment (81.5%), Health Diagnosing & Treating (69.9%), and Health Technologists (69.9%).
| Occupation | Male | Female |
| Management | 102 (67.1%) | 50 (32.9%) |
| Business & Financial | 35 (71.4%) | 14 (28.6%) |
| Computers, Engineering & Science | 38 (69.1%) | 17 (30.9%) |
| Computers & Mathematics | 19 (70.4%) | 8 (29.6%) |
| Architecture & Engineering | 5 (62.5%) | 3 (37.5%) |
| Life, Physical & Social Science | 14 (70.0%) | 6 (30.0%) |
| Community & Social Service | 75 (56.8%) | 57 (43.2%) |
| Education, Arts & Media | 5 (62.5%) | 3 (37.5%) |
| Legal Services & Support | 41 (82.0%) | 9 (18.0%) |
| Education Instruction & Library | 24 (51.1%) | 23 (48.9%) |
| Arts, Media & Entertainment | 5 (18.5%) | 22 (81.5%) |
| Health Diagnosing & Treating | 25 (30.1%) | 58 (69.9%) |
| Health Technologists | 25 (30.1%) | 58 (69.9%) |
| Total (Category) | 275 (58.4%) | 196 (41.6%) |
| Total (Overall) | 452 (55.3%) | 366 (44.7%) |
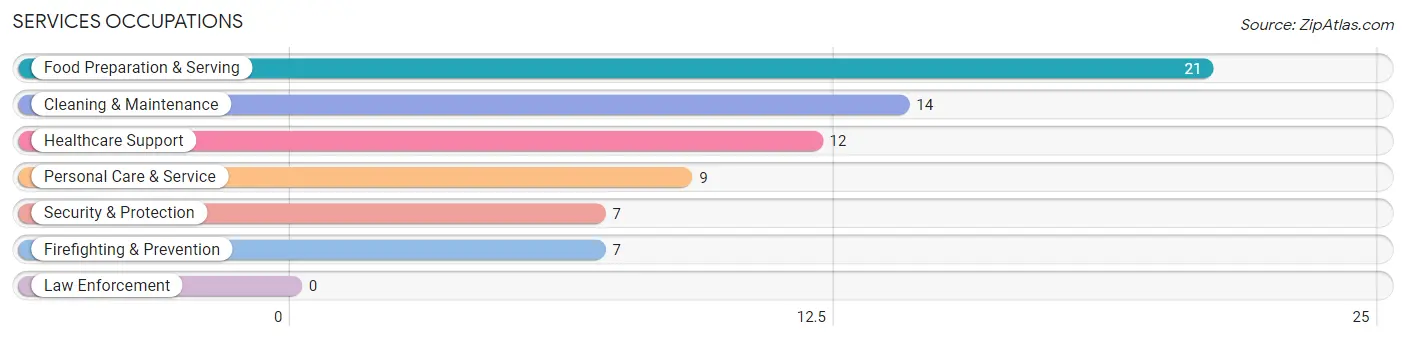
Services Occupations
The most common Services occupations in Walden are Food Preparation & Serving (21 | 2.6%), Cleaning & Maintenance (14 | 1.7%), Healthcare Support (12 | 1.5%), Personal Care & Service (9 | 1.1%), and Security & Protection (7 | 0.9%).
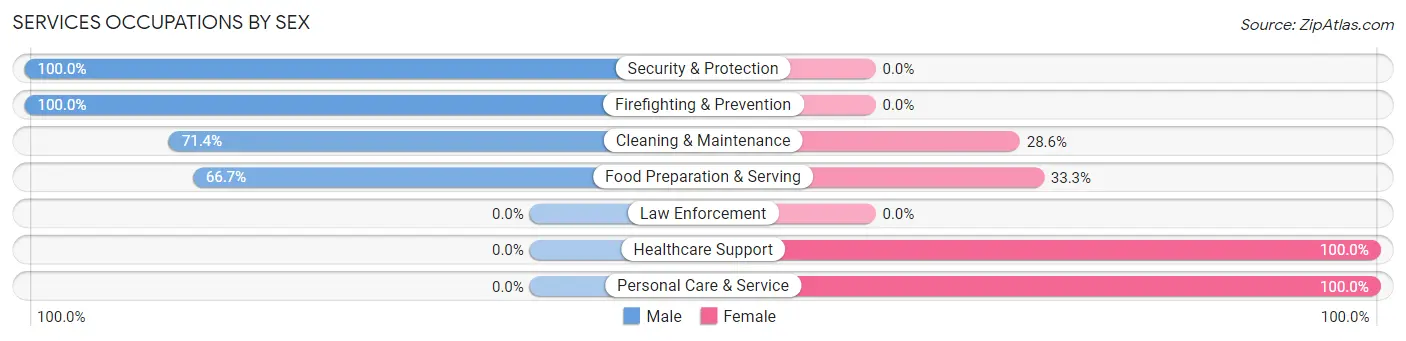
Services Occupations by Sex
Within the Services occupations in Walden, the most male-oriented occupations are Security & Protection (100.0%), Firefighting & Prevention (100.0%), and Cleaning & Maintenance (71.4%), while the most female-oriented occupations are Healthcare Support (100.0%), Personal Care & Service (100.0%), and Food Preparation & Serving (33.3%).
| Occupation | Male | Female |
| Healthcare Support | 0 (0.0%) | 12 (100.0%) |
| Security & Protection | 7 (100.0%) | 0 (0.0%) |
| Firefighting & Prevention | 7 (100.0%) | 0 (0.0%) |
| Law Enforcement | 0 (0.0%) | 0 (0.0%) |
| Food Preparation & Serving | 14 (66.7%) | 7 (33.3%) |
| Cleaning & Maintenance | 10 (71.4%) | 4 (28.6%) |
| Personal Care & Service | 0 (0.0%) | 9 (100.0%) |
| Total (Category) | 31 (49.2%) | 32 (50.8%) |
| Total (Overall) | 452 (55.3%) | 366 (44.7%) |
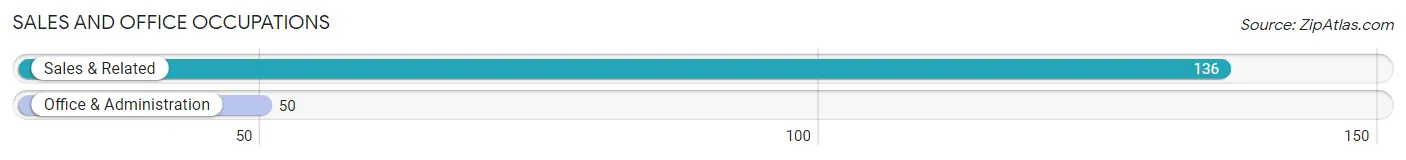
Sales and Office Occupations
The most common Sales and Office occupations in Walden are Sales & Related (136 | 16.6%), and Office & Administration (50 | 6.1%).
Sales and Office Occupations by Sex
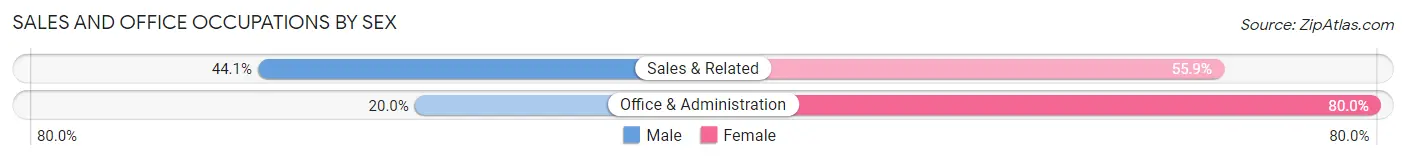
| Occupation | Male | Female |
| Sales & Related | 60 (44.1%) | 76 (55.9%) |
| Office & Administration | 10 (20.0%) | 40 (80.0%) |
| Total (Category) | 70 (37.6%) | 116 (62.4%) |
| Total (Overall) | 452 (55.3%) | 366 (44.7%) |
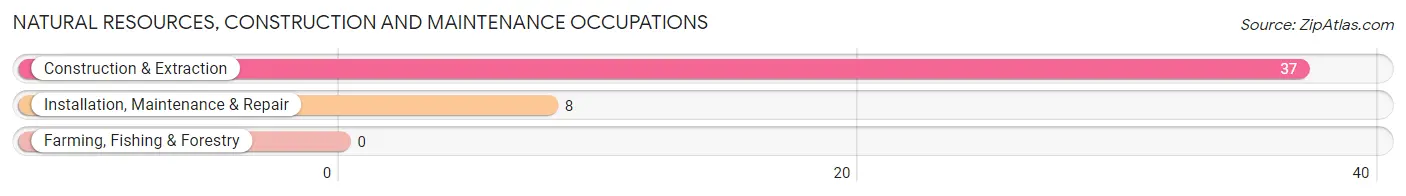
Natural Resources, Construction and Maintenance Occupations
The most common Natural Resources, Construction and Maintenance occupations in Walden are Construction & Extraction (37 | 4.5%), and Installation, Maintenance & Repair (8 | 1.0%).
Natural Resources, Construction and Maintenance Occupations by Sex
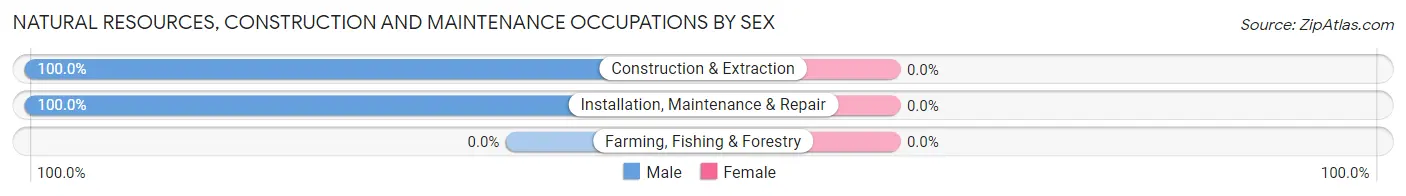
| Occupation | Male | Female |
| Farming, Fishing & Forestry | 0 (0.0%) | 0 (0.0%) |
| Construction & Extraction | 37 (100.0%) | 0 (0.0%) |
| Installation, Maintenance & Repair | 8 (100.0%) | 0 (0.0%) |
| Total (Category) | 45 (100.0%) | 0 (0.0%) |
| Total (Overall) | 452 (55.3%) | 366 (44.7%) |
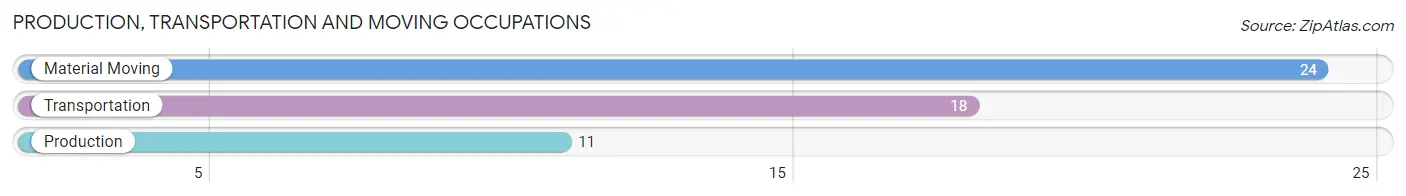
Production, Transportation and Moving Occupations
The most common Production, Transportation and Moving occupations in Walden are Material Moving (24 | 2.9%), Transportation (18 | 2.2%), and Production (11 | 1.3%).
Production, Transportation and Moving Occupations by Sex
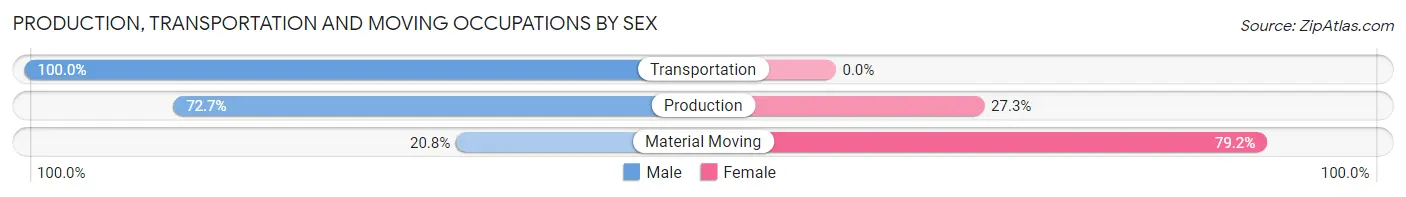
| Occupation | Male | Female |
| Production | 8 (72.7%) | 3 (27.3%) |
| Transportation | 18 (100.0%) | 0 (0.0%) |
| Material Moving | 5 (20.8%) | 19 (79.2%) |
| Total (Category) | 31 (58.5%) | 22 (41.5%) |
| Total (Overall) | 452 (55.3%) | 366 (44.7%) |
Employment Industries by Sex in Walden
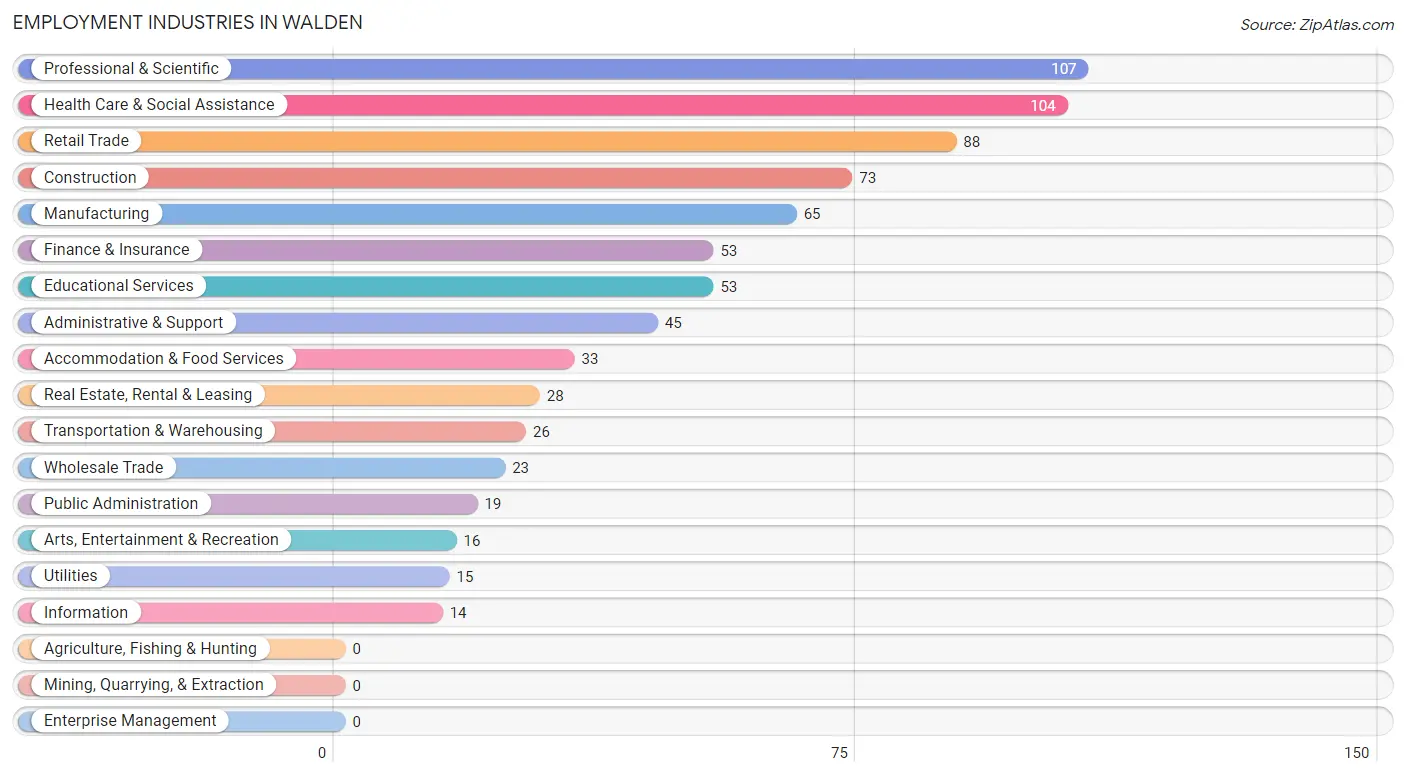
Employment Industries in Walden
The major employment industries in Walden include Professional & Scientific (107 | 13.1%), Health Care & Social Assistance (104 | 12.7%), Retail Trade (88 | 10.8%), Construction (73 | 8.9%), and Manufacturing (65 | 8.0%).
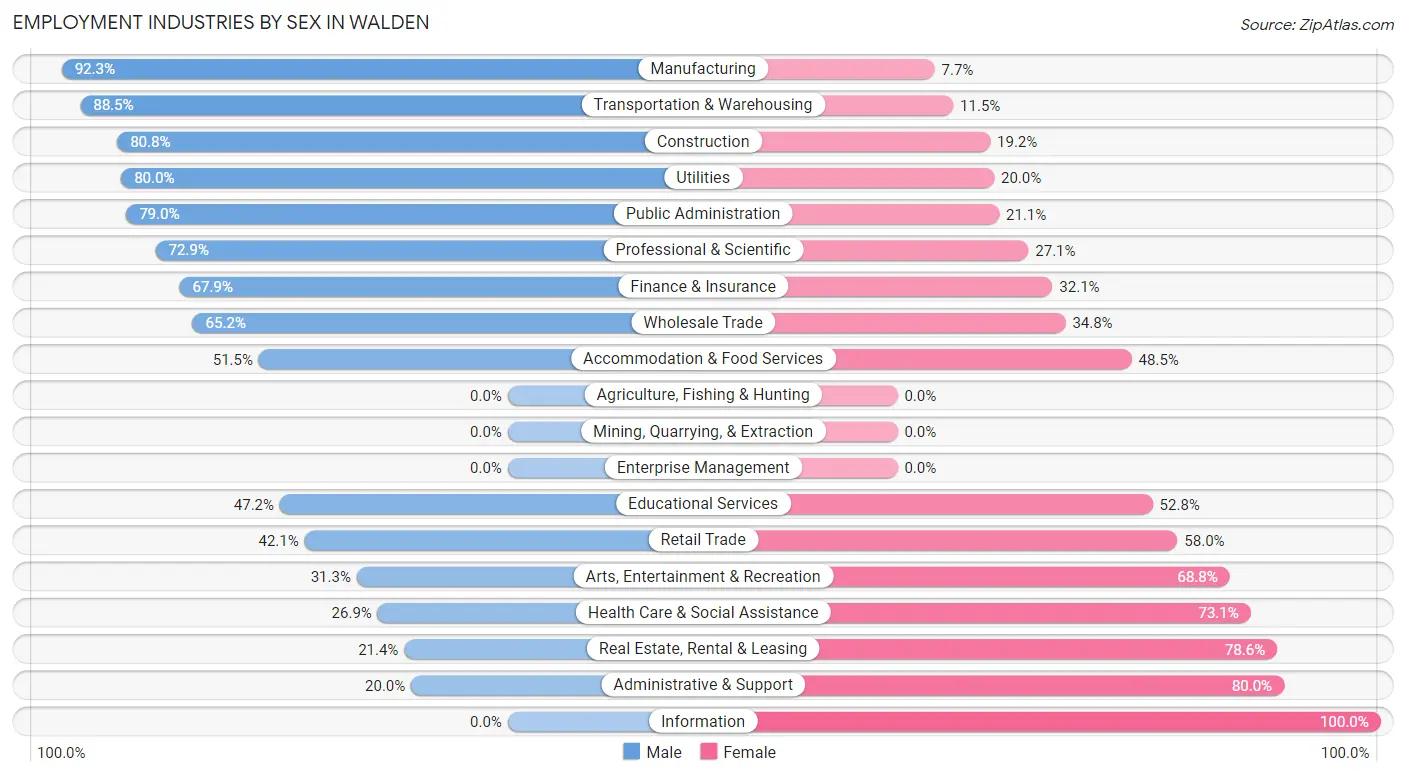
Employment Industries by Sex in Walden
The Walden industries that see more men than women are Manufacturing (92.3%), Transportation & Warehousing (88.5%), and Construction (80.8%), whereas the industries that tend to have a higher number of women are Information (100.0%), Administrative & Support (80.0%), and Real Estate, Rental & Leasing (78.6%).
| Industry | Male | Female |
| Agriculture, Fishing & Hunting | 0 (0.0%) | 0 (0.0%) |
| Mining, Quarrying, & Extraction | 0 (0.0%) | 0 (0.0%) |
| Construction | 59 (80.8%) | 14 (19.2%) |
| Manufacturing | 60 (92.3%) | 5 (7.7%) |
| Wholesale Trade | 15 (65.2%) | 8 (34.8%) |
| Retail Trade | 37 (42.0%) | 51 (58.0%) |
| Transportation & Warehousing | 23 (88.5%) | 3 (11.5%) |
| Utilities | 12 (80.0%) | 3 (20.0%) |
| Information | 0 (0.0%) | 14 (100.0%) |
| Finance & Insurance | 36 (67.9%) | 17 (32.1%) |
| Real Estate, Rental & Leasing | 6 (21.4%) | 22 (78.6%) |
| Professional & Scientific | 78 (72.9%) | 29 (27.1%) |
| Enterprise Management | 0 (0.0%) | 0 (0.0%) |
| Administrative & Support | 9 (20.0%) | 36 (80.0%) |
| Educational Services | 25 (47.2%) | 28 (52.8%) |
| Health Care & Social Assistance | 28 (26.9%) | 76 (73.1%) |
| Arts, Entertainment & Recreation | 5 (31.2%) | 11 (68.8%) |
| Accommodation & Food Services | 17 (51.5%) | 16 (48.5%) |
| Public Administration | 15 (78.9%) | 4 (21.0%) |
| Total | 452 (55.3%) | 366 (44.7%) |
Education in Walden
School Enrollment in Walden
The most common levels of schooling among the 466 students in Walden are elementary school (133 | 28.5%), high school (106 | 22.8%), and middle school (102 | 21.9%).
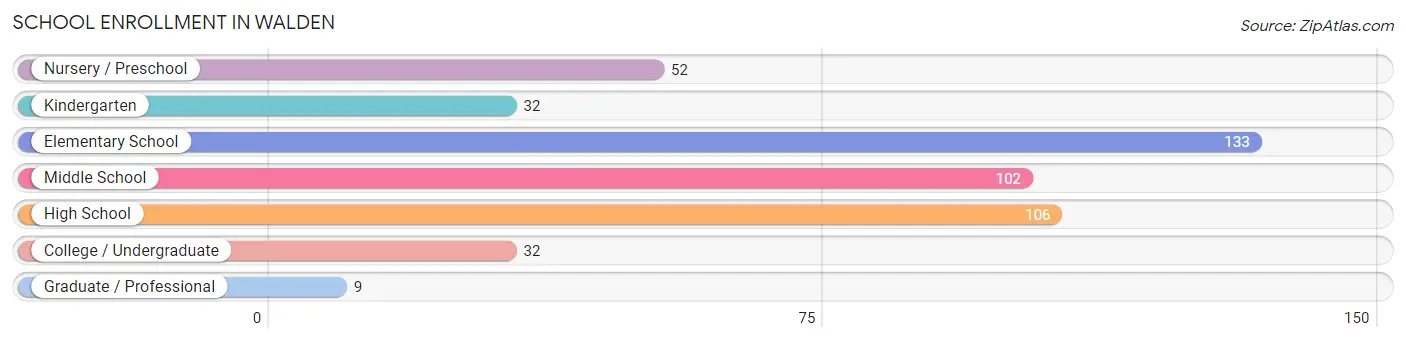
| School Level | # Students | % Students |
| Nursery / Preschool | 52 | 11.2% |
| Kindergarten | 32 | 6.9% |
| Elementary School | 133 | 28.5% |
| Middle School | 102 | 21.9% |
| High School | 106 | 22.8% |
| College / Undergraduate | 32 | 6.9% |
| Graduate / Professional | 9 | 1.9% |
| Total | 466 | 100.0% |
School Enrollment by Age by Funding Source in Walden
Out of a total of 466 students who are enrolled in schools in Walden, 119 (25.5%) attend a private institution, while the remaining 347 (74.5%) are enrolled in public schools. The age group of 35 years and over has the highest likelihood of being enrolled in private schools, with 10 (71.4% in the age bracket) enrolled. Conversely, the age group of 5 to 9 year old has the lowest likelihood of being enrolled in a private school, with 122 (84.1% in the age bracket) attending a public institution.
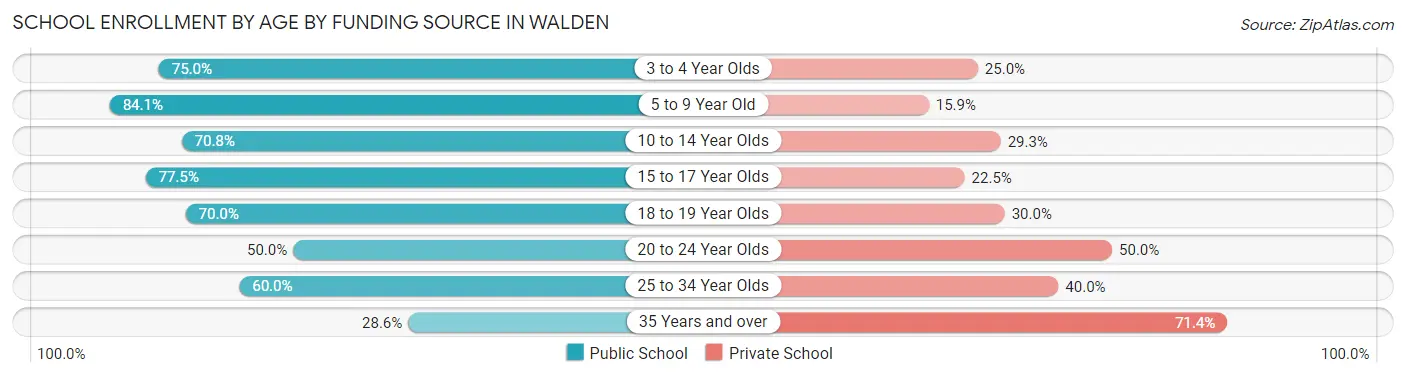
| Age Bracket | Public School | Private School |
| 3 to 4 Year Olds | 39 (75.0%) | 13 (25.0%) |
| 5 to 9 Year Old | 122 (84.1%) | 23 (15.9%) |
| 10 to 14 Year Olds | 104 (70.8%) | 43 (29.2%) |
| 15 to 17 Year Olds | 55 (77.5%) | 16 (22.5%) |
| 18 to 19 Year Olds | 14 (70.0%) | 6 (30.0%) |
| 20 to 24 Year Olds | 6 (50.0%) | 6 (50.0%) |
| 25 to 34 Year Olds | 3 (60.0%) | 2 (40.0%) |
| 35 Years and over | 4 (28.6%) | 10 (71.4%) |
| Total | 347 (74.5%) | 119 (25.5%) |
Educational Attainment by Field of Study in Walden
Business (169 | 19.4%), education (91 | 10.4%), science & technology (89 | 10.2%), bio, nature & agricultural (78 | 9.0%), and social sciences (70 | 8.0%) are the most common fields of study among 871 individuals in Walden who have obtained a bachelor's degree or higher.
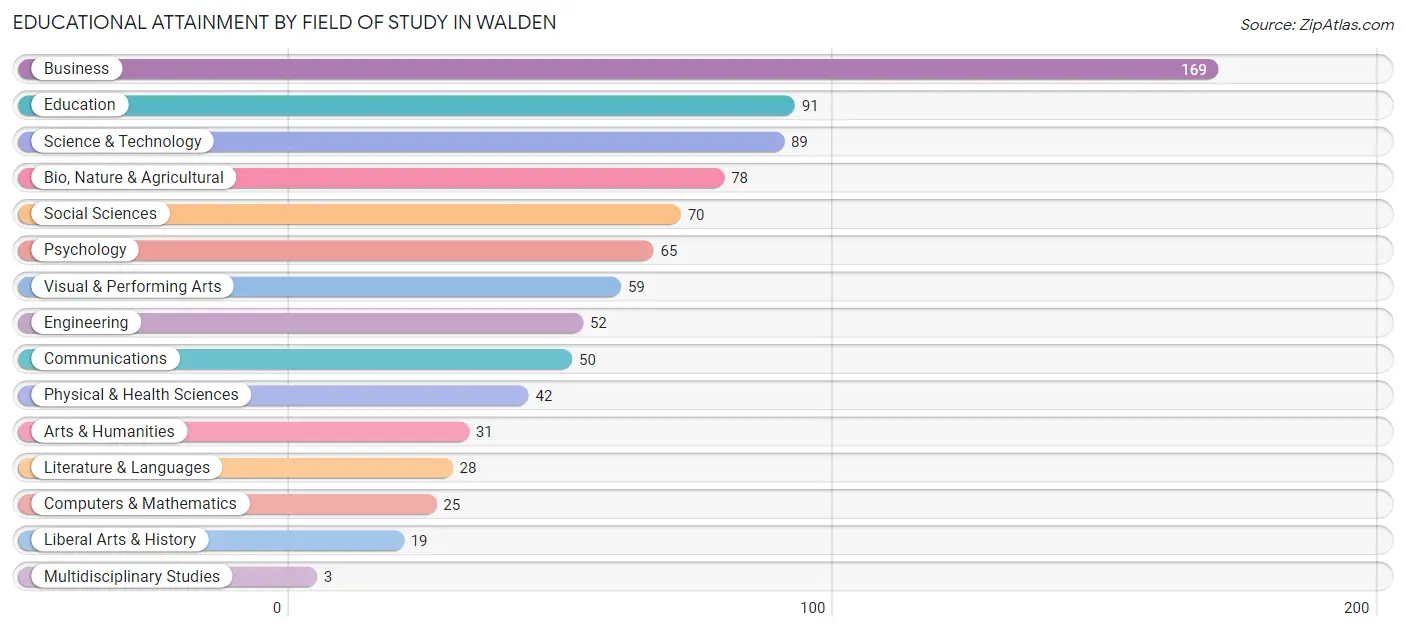
| Field of Study | # Graduates | % Graduates |
| Computers & Mathematics | 25 | 2.9% |
| Bio, Nature & Agricultural | 78 | 9.0% |
| Physical & Health Sciences | 42 | 4.8% |
| Psychology | 65 | 7.5% |
| Social Sciences | 70 | 8.0% |
| Engineering | 52 | 6.0% |
| Multidisciplinary Studies | 3 | 0.3% |
| Science & Technology | 89 | 10.2% |
| Business | 169 | 19.4% |
| Education | 91 | 10.4% |
| Literature & Languages | 28 | 3.2% |
| Liberal Arts & History | 19 | 2.2% |
| Visual & Performing Arts | 59 | 6.8% |
| Communications | 50 | 5.7% |
| Arts & Humanities | 31 | 3.6% |
| Total | 871 | 100.0% |
Transportation & Commute in Walden
Vehicle Availability by Sex in Walden
The most prevalent vehicle ownership categories in Walden are males with 2 vehicles (227, accounting for 50.9%) and females with 2 vehicles (150, making up 62.0%).
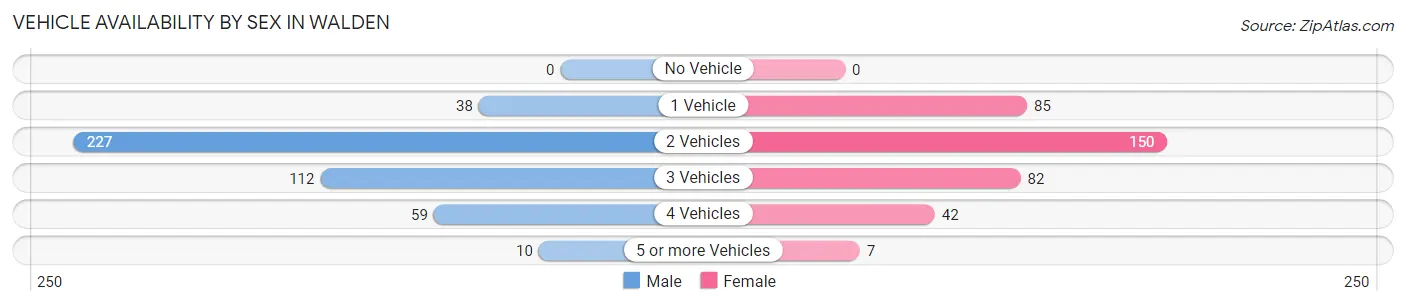
| Vehicles Available | Male | Female |
| No Vehicle | 0 (0.0%) | 0 (0.0%) |
| 1 Vehicle | 38 (8.5%) | 85 (23.2%) |
| 2 Vehicles | 227 (50.9%) | 150 (41.0%) |
| 3 Vehicles | 112 (25.1%) | 82 (22.4%) |
| 4 Vehicles | 59 (13.2%) | 42 (11.5%) |
| 5 or more Vehicles | 10 (2.2%) | 7 (1.9%) |
| Total | 446 (100.0%) | 366 (100.0%) |
Commute Time in Walden
The most frequently occuring commute durations in Walden are 20 to 24 minutes (188 commuters, 27.0%), 30 to 34 minutes (113 commuters, 16.2%), and 25 to 29 minutes (103 commuters, 14.8%).
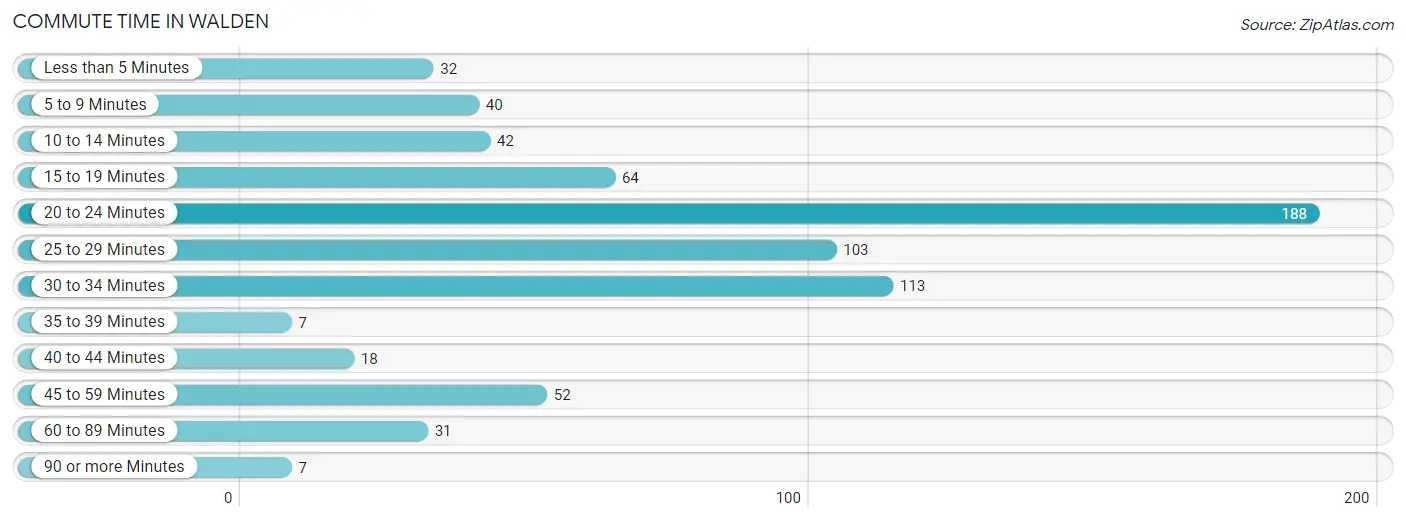
| Commute Time | # Commuters | % Commuters |
| Less than 5 Minutes | 32 | 4.6% |
| 5 to 9 Minutes | 40 | 5.7% |
| 10 to 14 Minutes | 42 | 6.0% |
| 15 to 19 Minutes | 64 | 9.2% |
| 20 to 24 Minutes | 188 | 27.0% |
| 25 to 29 Minutes | 103 | 14.8% |
| 30 to 34 Minutes | 113 | 16.2% |
| 35 to 39 Minutes | 7 | 1.0% |
| 40 to 44 Minutes | 18 | 2.6% |
| 45 to 59 Minutes | 52 | 7.5% |
| 60 to 89 Minutes | 31 | 4.4% |
| 90 or more Minutes | 7 | 1.0% |
Commute Time by Sex in Walden
The most common commute times in Walden are 20 to 24 minutes (84 commuters, 22.2%) for males and 20 to 24 minutes (104 commuters, 32.7%) for females.
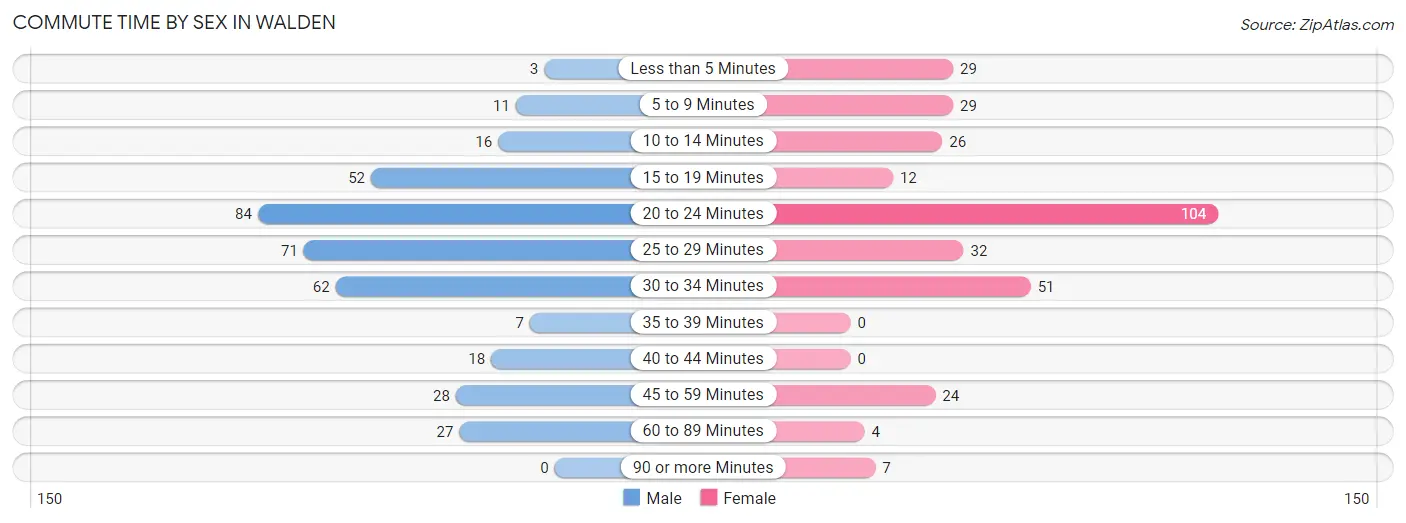
| Commute Time | Male | Female |
| Less than 5 Minutes | 3 (0.8%) | 29 (9.1%) |
| 5 to 9 Minutes | 11 (2.9%) | 29 (9.1%) |
| 10 to 14 Minutes | 16 (4.2%) | 26 (8.2%) |
| 15 to 19 Minutes | 52 (13.7%) | 12 (3.8%) |
| 20 to 24 Minutes | 84 (22.2%) | 104 (32.7%) |
| 25 to 29 Minutes | 71 (18.7%) | 32 (10.1%) |
| 30 to 34 Minutes | 62 (16.4%) | 51 (16.0%) |
| 35 to 39 Minutes | 7 (1.8%) | 0 (0.0%) |
| 40 to 44 Minutes | 18 (4.8%) | 0 (0.0%) |
| 45 to 59 Minutes | 28 (7.4%) | 24 (7.5%) |
| 60 to 89 Minutes | 27 (7.1%) | 4 (1.3%) |
| 90 or more Minutes | 0 (0.0%) | 7 (2.2%) |
Time of Departure to Work by Sex in Walden
The most frequent times of departure to work in Walden are 7:00 AM to 7:29 AM (80, 21.1%) for males and 8:00 AM to 8:29 AM (64, 20.1%) for females.
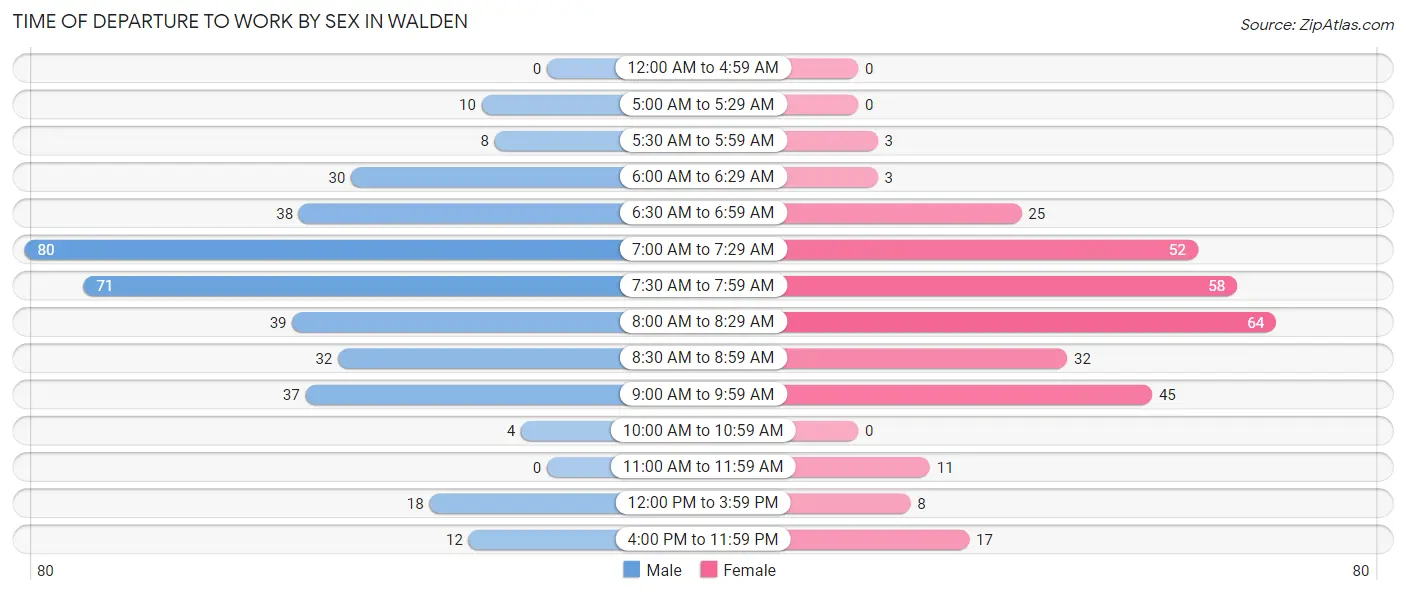
| Time of Departure | Male | Female |
| 12:00 AM to 4:59 AM | 0 (0.0%) | 0 (0.0%) |
| 5:00 AM to 5:29 AM | 10 (2.6%) | 0 (0.0%) |
| 5:30 AM to 5:59 AM | 8 (2.1%) | 3 (0.9%) |
| 6:00 AM to 6:29 AM | 30 (7.9%) | 3 (0.9%) |
| 6:30 AM to 6:59 AM | 38 (10.0%) | 25 (7.9%) |
| 7:00 AM to 7:29 AM | 80 (21.1%) | 52 (16.4%) |
| 7:30 AM to 7:59 AM | 71 (18.7%) | 58 (18.2%) |
| 8:00 AM to 8:29 AM | 39 (10.3%) | 64 (20.1%) |
| 8:30 AM to 8:59 AM | 32 (8.4%) | 32 (10.1%) |
| 9:00 AM to 9:59 AM | 37 (9.8%) | 45 (14.1%) |
| 10:00 AM to 10:59 AM | 4 (1.1%) | 0 (0.0%) |
| 11:00 AM to 11:59 AM | 0 (0.0%) | 11 (3.5%) |
| 12:00 PM to 3:59 PM | 18 (4.8%) | 8 (2.5%) |
| 4:00 PM to 11:59 PM | 12 (3.2%) | 17 (5.3%) |
| Total | 379 (100.0%) | 318 (100.0%) |
Housing Occupancy in Walden
Occupancy by Ownership in Walden
Of the total 680 dwellings in Walden, owner-occupied units account for 582 (85.6%), while renter-occupied units make up 98 (14.4%).
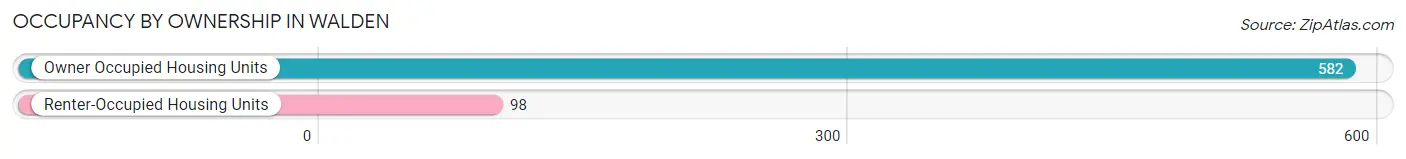
| Occupancy | # Housing Units | % Housing Units |
| Owner Occupied Housing Units | 582 | 85.6% |
| Renter-Occupied Housing Units | 98 | 14.4% |
| Total Occupied Housing Units | 680 | 100.0% |
Occupancy by Household Size in Walden
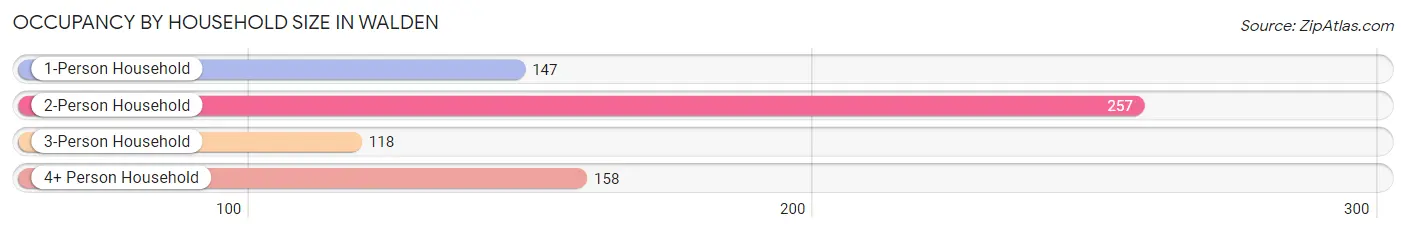
| Household Size | # Housing Units | % Housing Units |
| 1-Person Household | 147 | 21.6% |
| 2-Person Household | 257 | 37.8% |
| 3-Person Household | 118 | 17.3% |
| 4+ Person Household | 158 | 23.2% |
| Total Housing Units | 680 | 100.0% |
Occupancy by Ownership by Household Size in Walden
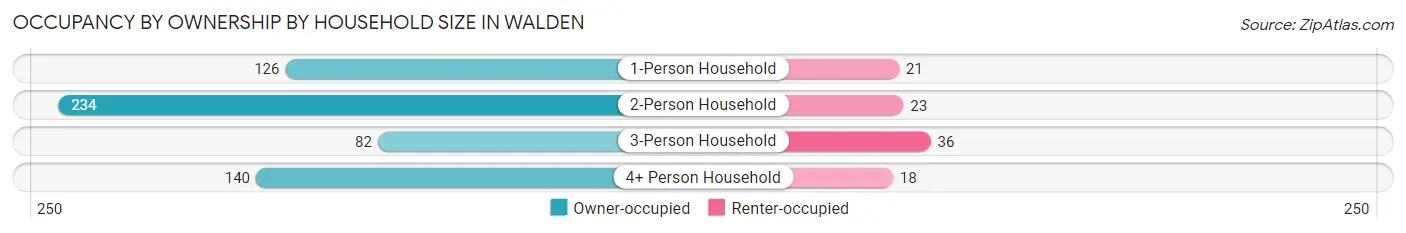
| Household Size | Owner-occupied | Renter-occupied |
| 1-Person Household | 126 (85.7%) | 21 (14.3%) |
| 2-Person Household | 234 (91.0%) | 23 (8.9%) |
| 3-Person Household | 82 (69.5%) | 36 (30.5%) |
| 4+ Person Household | 140 (88.6%) | 18 (11.4%) |
| Total Housing Units | 582 (85.6%) | 98 (14.4%) |
Occupancy by Educational Attainment in Walden
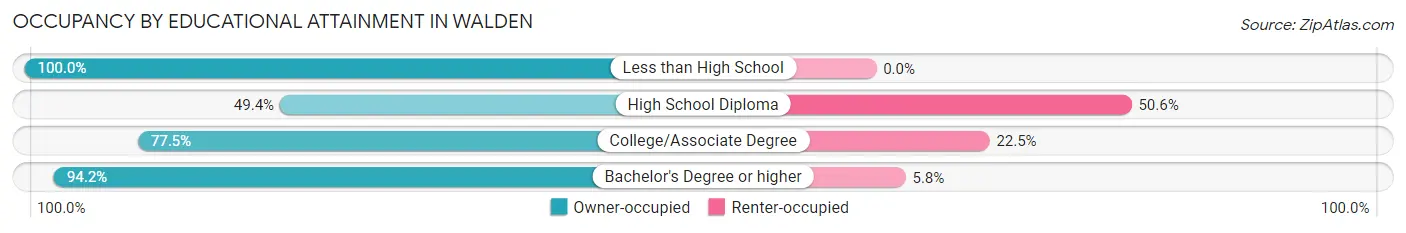
| Household Size | Owner-occupied | Renter-occupied |
| Less than High School | 14 (100.0%) | 0 (0.0%) |
| High School Diploma | 40 (49.4%) | 41 (50.6%) |
| College/Associate Degree | 107 (77.5%) | 31 (22.5%) |
| Bachelor's Degree or higher | 421 (94.2%) | 26 (5.8%) |
Occupancy by Age of Householder in Walden
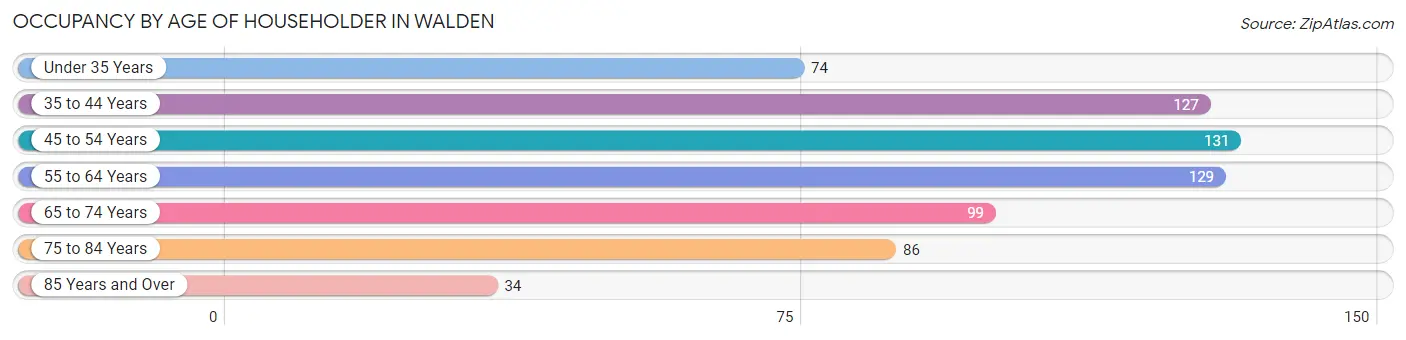
| Age Bracket | # Households | % Households |
| Under 35 Years | 74 | 10.9% |
| 35 to 44 Years | 127 | 18.7% |
| 45 to 54 Years | 131 | 19.3% |
| 55 to 64 Years | 129 | 19.0% |
| 65 to 74 Years | 99 | 14.6% |
| 75 to 84 Years | 86 | 12.7% |
| 85 Years and Over | 34 | 5.0% |
| Total | 680 | 100.0% |
Housing Finances in Walden
Median Income by Occupancy in Walden
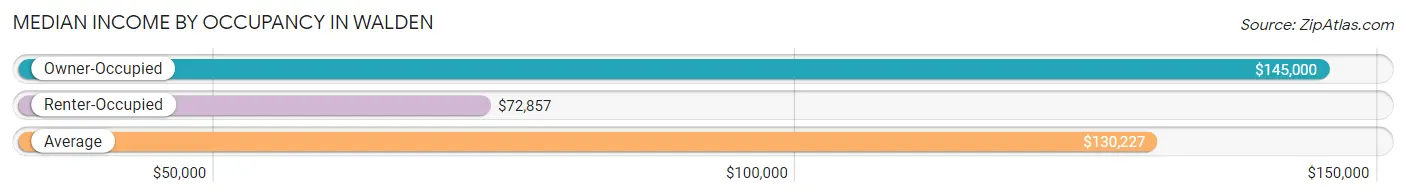
| Occupancy Type | # Households | Median Income |
| Owner-Occupied | 582 (85.6%) | $145,000 |
| Renter-Occupied | 98 (14.4%) | $72,857 |
| Average | 680 (100.0%) | $130,227 |
Occupancy by Householder Income Bracket in Walden
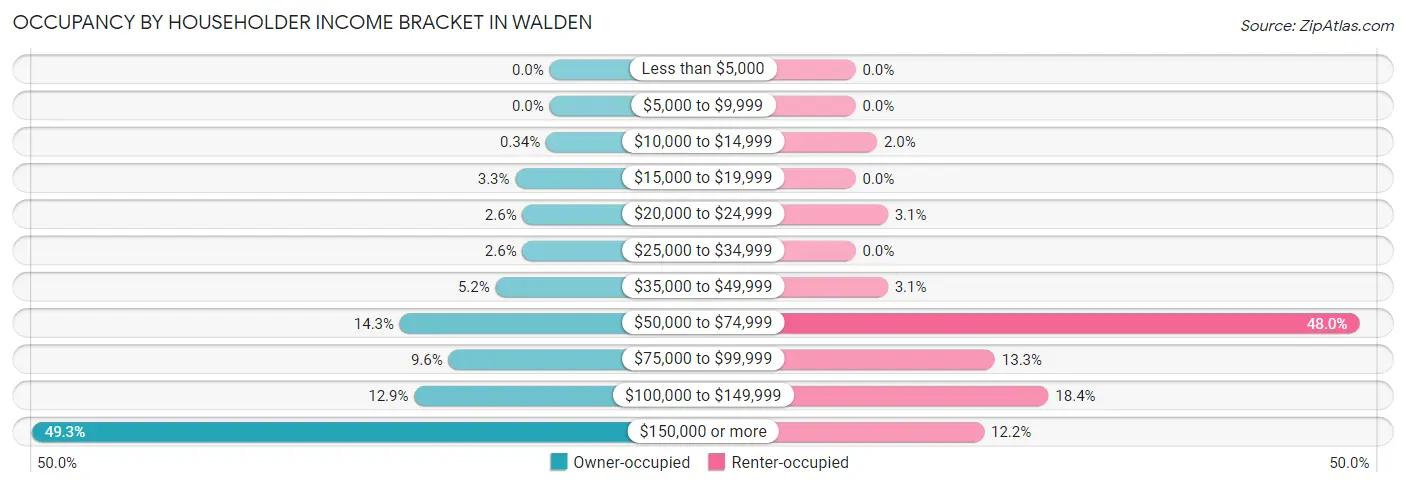
| Income Bracket | Owner-occupied | Renter-occupied |
| Less than $5,000 | 0 (0.0%) | 0 (0.0%) |
| $5,000 to $9,999 | 0 (0.0%) | 0 (0.0%) |
| $10,000 to $14,999 | 2 (0.3%) | 2 (2.0%) |
| $15,000 to $19,999 | 19 (3.3%) | 0 (0.0%) |
| $20,000 to $24,999 | 15 (2.6%) | 3 (3.1%) |
| $25,000 to $34,999 | 15 (2.6%) | 0 (0.0%) |
| $35,000 to $49,999 | 30 (5.1%) | 3 (3.1%) |
| $50,000 to $74,999 | 83 (14.3%) | 47 (48.0%) |
| $75,000 to $99,999 | 56 (9.6%) | 13 (13.3%) |
| $100,000 to $149,999 | 75 (12.9%) | 18 (18.4%) |
| $150,000 or more | 287 (49.3%) | 12 (12.2%) |
| Total | 582 (100.0%) | 98 (100.0%) |
Monthly Housing Cost Tiers in Walden
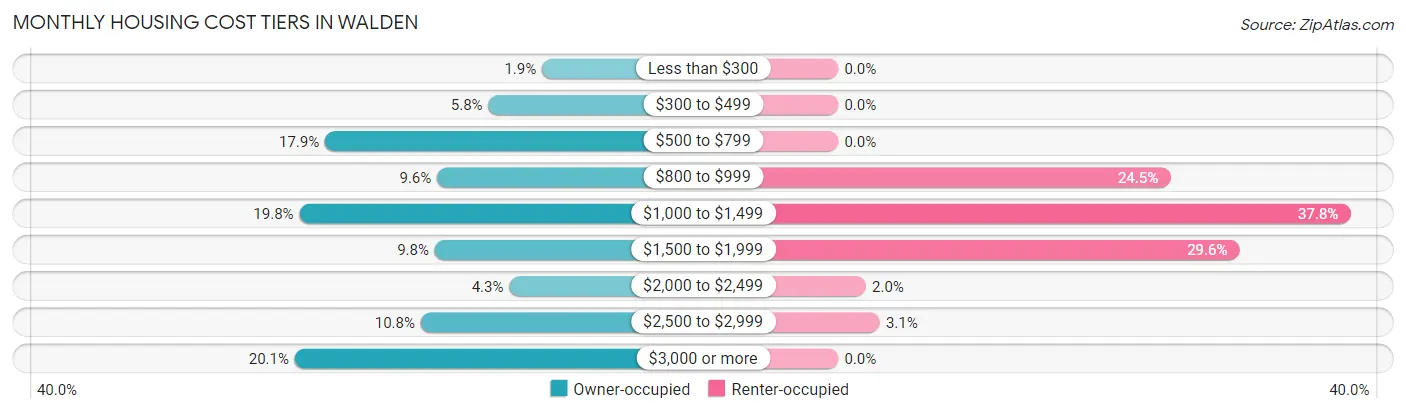
| Monthly Cost | Owner-occupied | Renter-occupied |
| Less than $300 | 11 (1.9%) | 0 (0.0%) |
| $300 to $499 | 34 (5.8%) | 0 (0.0%) |
| $500 to $799 | 104 (17.9%) | 0 (0.0%) |
| $800 to $999 | 56 (9.6%) | 24 (24.5%) |
| $1,000 to $1,499 | 115 (19.8%) | 37 (37.8%) |
| $1,500 to $1,999 | 57 (9.8%) | 29 (29.6%) |
| $2,000 to $2,499 | 25 (4.3%) | 2 (2.0%) |
| $2,500 to $2,999 | 63 (10.8%) | 3 (3.1%) |
| $3,000 or more | 117 (20.1%) | 0 (0.0%) |
| Total | 582 (100.0%) | 98 (100.0%) |
Physical Housing Characteristics in Walden
Housing Structures in Walden
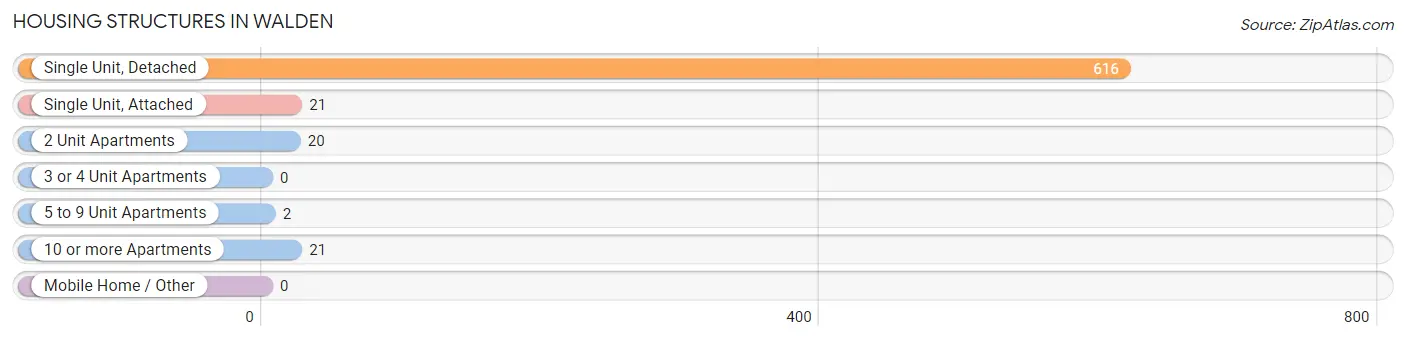
| Structure Type | # Housing Units | % Housing Units |
| Single Unit, Detached | 616 | 90.6% |
| Single Unit, Attached | 21 | 3.1% |
| 2 Unit Apartments | 20 | 2.9% |
| 3 or 4 Unit Apartments | 0 | 0.0% |
| 5 to 9 Unit Apartments | 2 | 0.3% |
| 10 or more Apartments | 21 | 3.1% |
| Mobile Home / Other | 0 | 0.0% |
| Total | 680 | 100.0% |
Housing Structures by Occupancy in Walden
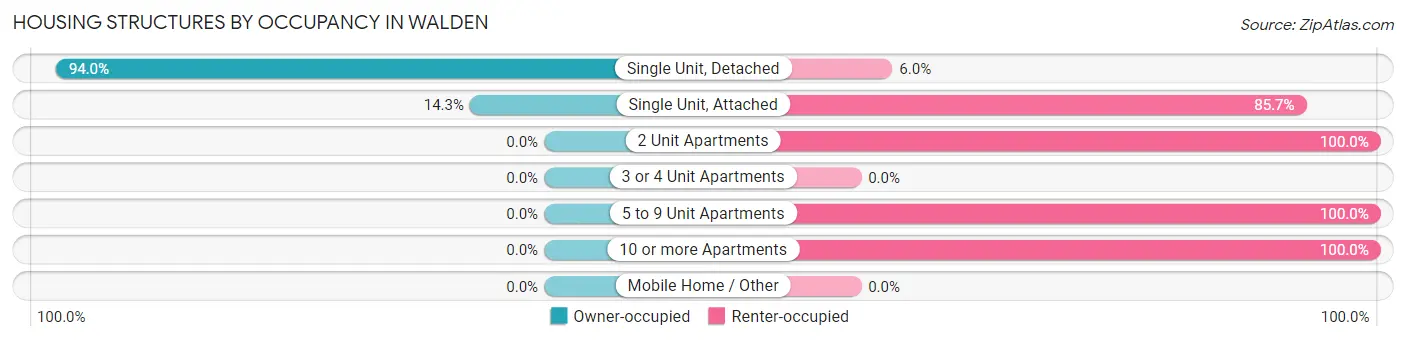
| Structure Type | Owner-occupied | Renter-occupied |
| Single Unit, Detached | 579 (94.0%) | 37 (6.0%) |
| Single Unit, Attached | 3 (14.3%) | 18 (85.7%) |
| 2 Unit Apartments | 0 (0.0%) | 20 (100.0%) |
| 3 or 4 Unit Apartments | 0 (0.0%) | 0 (0.0%) |
| 5 to 9 Unit Apartments | 0 (0.0%) | 2 (100.0%) |
| 10 or more Apartments | 0 (0.0%) | 21 (100.0%) |
| Mobile Home / Other | 0 (0.0%) | 0 (0.0%) |
| Total | 582 (85.6%) | 98 (14.4%) |
Housing Structures by Number of Rooms in Walden
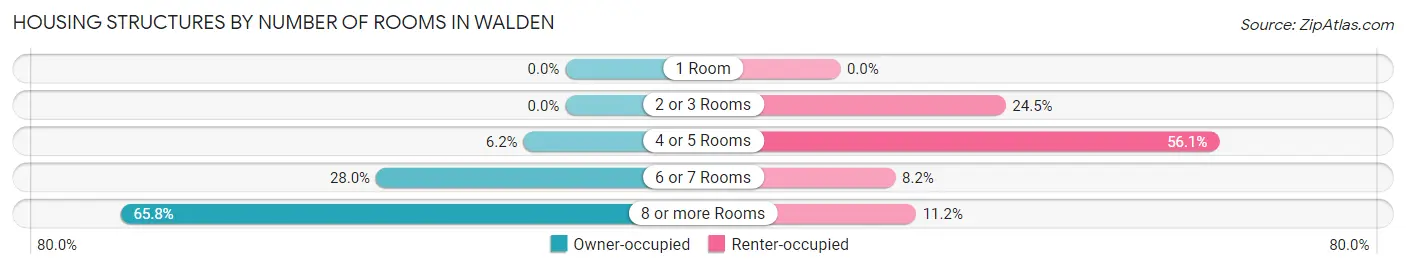
| Number of Rooms | Owner-occupied | Renter-occupied |
| 1 Room | 0 (0.0%) | 0 (0.0%) |
| 2 or 3 Rooms | 0 (0.0%) | 24 (24.5%) |
| 4 or 5 Rooms | 36 (6.2%) | 55 (56.1%) |
| 6 or 7 Rooms | 163 (28.0%) | 8 (8.2%) |
| 8 or more Rooms | 383 (65.8%) | 11 (11.2%) |
| Total | 582 (100.0%) | 98 (100.0%) |
Housing Structure by Heating Type in Walden
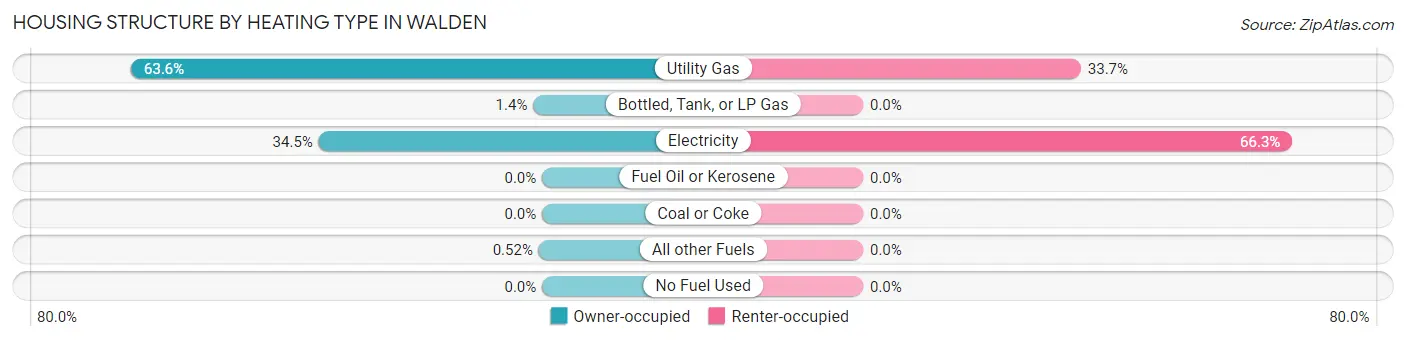
| Heating Type | Owner-occupied | Renter-occupied |
| Utility Gas | 370 (63.6%) | 33 (33.7%) |
| Bottled, Tank, or LP Gas | 8 (1.4%) | 0 (0.0%) |
| Electricity | 201 (34.5%) | 65 (66.3%) |
| Fuel Oil or Kerosene | 0 (0.0%) | 0 (0.0%) |
| Coal or Coke | 0 (0.0%) | 0 (0.0%) |
| All other Fuels | 3 (0.5%) | 0 (0.0%) |
| No Fuel Used | 0 (0.0%) | 0 (0.0%) |
| Total | 582 (100.0%) | 98 (100.0%) |
Household Vehicle Usage in Walden
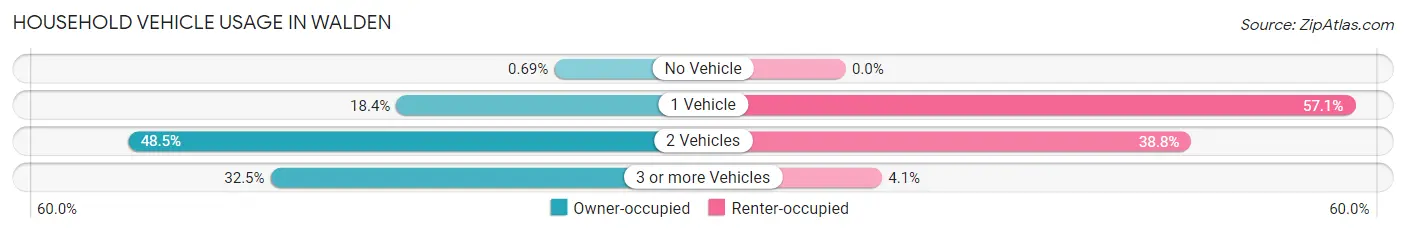
| Vehicles per Household | Owner-occupied | Renter-occupied |
| No Vehicle | 4 (0.7%) | 0 (0.0%) |
| 1 Vehicle | 107 (18.4%) | 56 (57.1%) |
| 2 Vehicles | 282 (48.4%) | 38 (38.8%) |
| 3 or more Vehicles | 189 (32.5%) | 4 (4.1%) |
| Total | 582 (100.0%) | 98 (100.0%) |
Real Estate & Mortgages in Walden
Real Estate and Mortgage Overview in Walden
| Characteristic | Without Mortgage | With Mortgage |
| Housing Units | 293 | 289 |
| Median Property Value | $616,200 | $559,100 |
| Median Household Income | $93,125 | $191 |
| Monthly Housing Costs | $811 | $115 |
| Real Estate Taxes | $3,943 | $0 |
Property Value by Mortgage Status in Walden
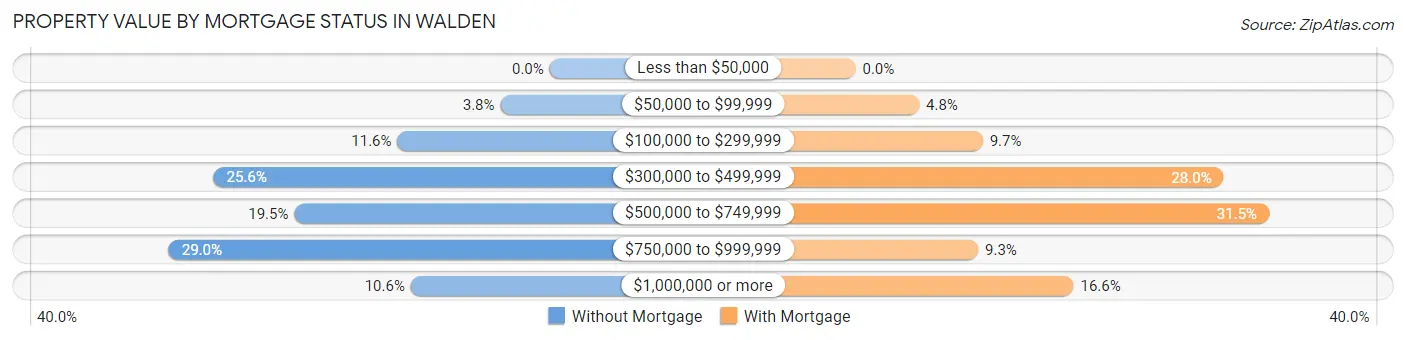
| Property Value | Without Mortgage | With Mortgage |
| Less than $50,000 | 0 (0.0%) | 0 (0.0%) |
| $50,000 to $99,999 | 11 (3.7%) | 14 (4.8%) |
| $100,000 to $299,999 | 34 (11.6%) | 28 (9.7%) |
| $300,000 to $499,999 | 75 (25.6%) | 81 (28.0%) |
| $500,000 to $749,999 | 57 (19.5%) | 91 (31.5%) |
| $750,000 to $999,999 | 85 (29.0%) | 27 (9.3%) |
| $1,000,000 or more | 31 (10.6%) | 48 (16.6%) |
| Total | 293 (100.0%) | 289 (100.0%) |
Household Income by Mortgage Status in Walden
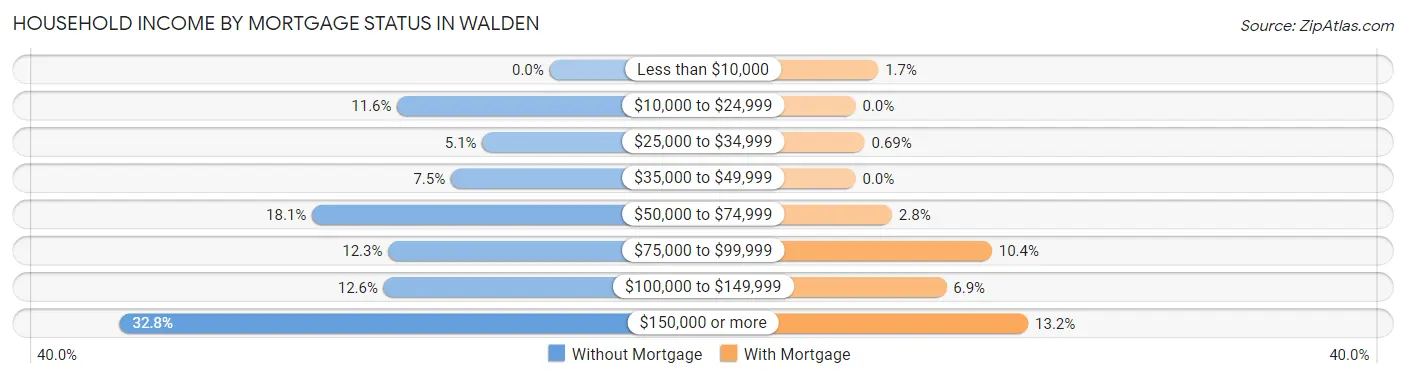
| Household Income | Without Mortgage | With Mortgage |
| Less than $10,000 | 0 (0.0%) | 5 (1.7%) |
| $10,000 to $24,999 | 34 (11.6%) | 0 (0.0%) |
| $25,000 to $34,999 | 15 (5.1%) | 2 (0.7%) |
| $35,000 to $49,999 | 22 (7.5%) | 0 (0.0%) |
| $50,000 to $74,999 | 53 (18.1%) | 8 (2.8%) |
| $75,000 to $99,999 | 36 (12.3%) | 30 (10.4%) |
| $100,000 to $149,999 | 37 (12.6%) | 20 (6.9%) |
| $150,000 or more | 96 (32.8%) | 38 (13.2%) |
| Total | 293 (100.0%) | 289 (100.0%) |
Property Value to Household Income Ratio in Walden
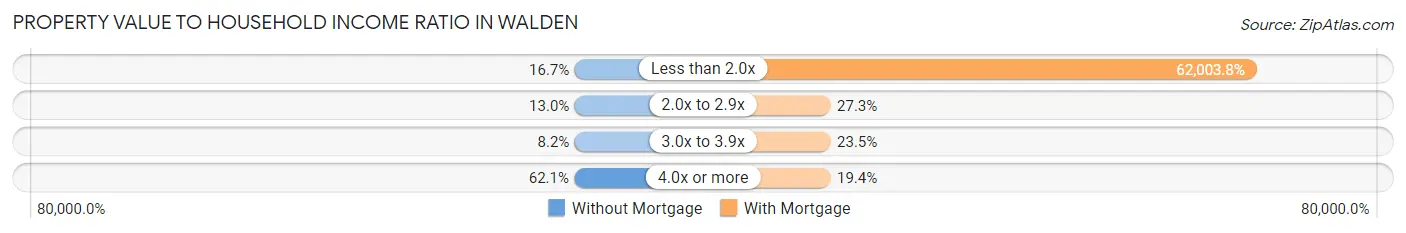
| Value-to-Income Ratio | Without Mortgage | With Mortgage |
| Less than 2.0x | 49 (16.7%) | 179,191 (62,003.8%) |
| 2.0x to 2.9x | 38 (13.0%) | 79 (27.3%) |
| 3.0x to 3.9x | 24 (8.2%) | 68 (23.5%) |
| 4.0x or more | 182 (62.1%) | 56 (19.4%) |
| Total | 293 (100.0%) | 289 (100.0%) |
Real Estate Taxes by Mortgage Status in Walden
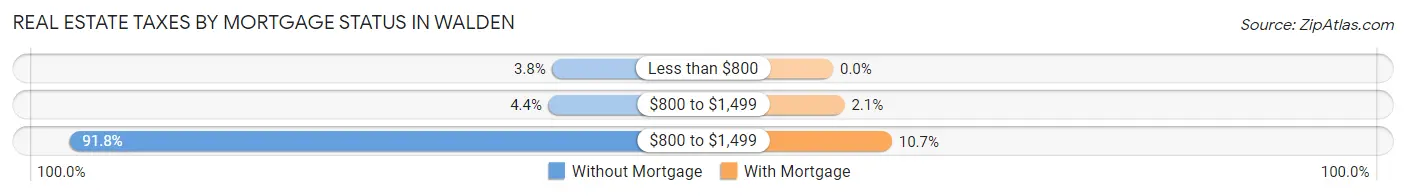
| Property Taxes | Without Mortgage | With Mortgage |
| Less than $800 | 11 (3.7%) | 0 (0.0%) |
| $800 to $1,499 | 13 (4.4%) | 6 (2.1%) |
| $800 to $1,499 | 269 (91.8%) | 31 (10.7%) |
| Total | 293 (100.0%) | 289 (100.0%) |
Health & Disability in Walden
Health Insurance Coverage by Age in Walden
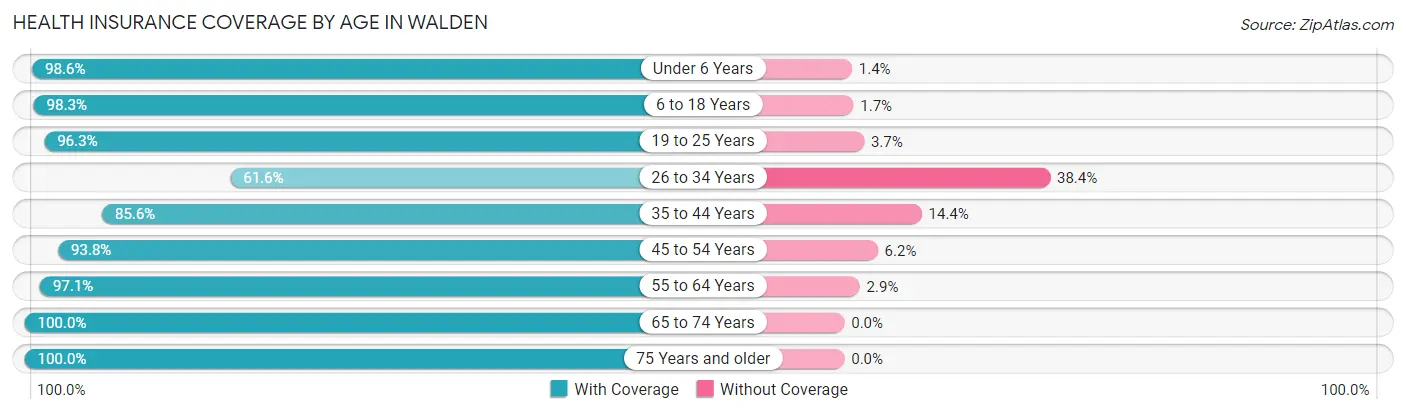
| Age Bracket | With Coverage | Without Coverage |
| Under 6 Years | 140 (98.6%) | 2 (1.4%) |
| 6 to 18 Years | 350 (98.3%) | 6 (1.7%) |
| 19 to 25 Years | 105 (96.3%) | 4 (3.7%) |
| 26 to 34 Years | 45 (61.6%) | 28 (38.4%) |
| 35 to 44 Years | 279 (85.6%) | 47 (14.4%) |
| 45 to 54 Years | 226 (93.8%) | 15 (6.2%) |
| 55 to 64 Years | 204 (97.1%) | 6 (2.9%) |
| 65 to 74 Years | 172 (100.0%) | 0 (0.0%) |
| 75 Years and older | 173 (100.0%) | 0 (0.0%) |
| Total | 1,694 (94.0%) | 108 (6.0%) |
Health Insurance Coverage by Citizenship Status in Walden
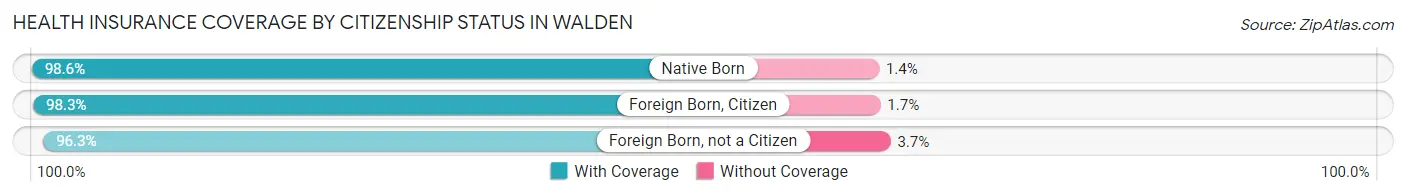
| Citizenship Status | With Coverage | Without Coverage |
| Native Born | 140 (98.6%) | 2 (1.4%) |
| Foreign Born, Citizen | 350 (98.3%) | 6 (1.7%) |
| Foreign Born, not a Citizen | 105 (96.3%) | 4 (3.7%) |
Health Insurance Coverage by Household Income in Walden
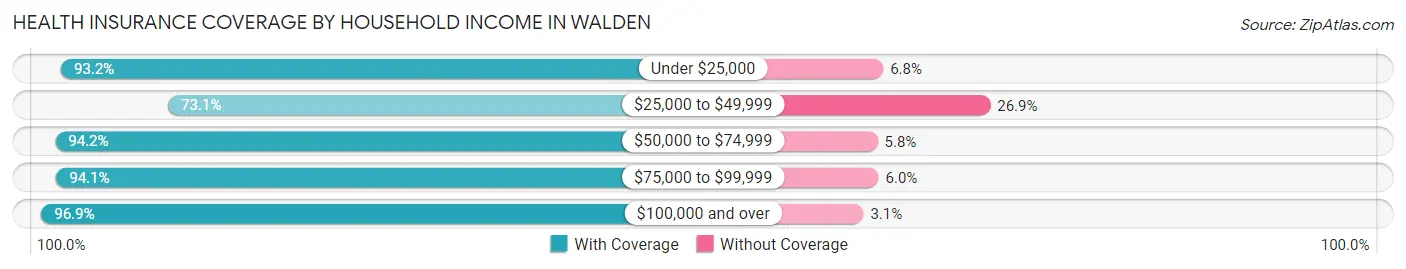
| Household Income | With Coverage | Without Coverage |
| Under $25,000 | 82 (93.2%) | 6 (6.8%) |
| $25,000 to $49,999 | 68 (73.1%) | 25 (26.9%) |
| $50,000 to $74,999 | 245 (94.2%) | 15 (5.8%) |
| $75,000 to $99,999 | 174 (94.1%) | 11 (5.9%) |
| $100,000 and over | 1,113 (96.9%) | 36 (3.1%) |
Public vs Private Health Insurance Coverage by Age in Walden
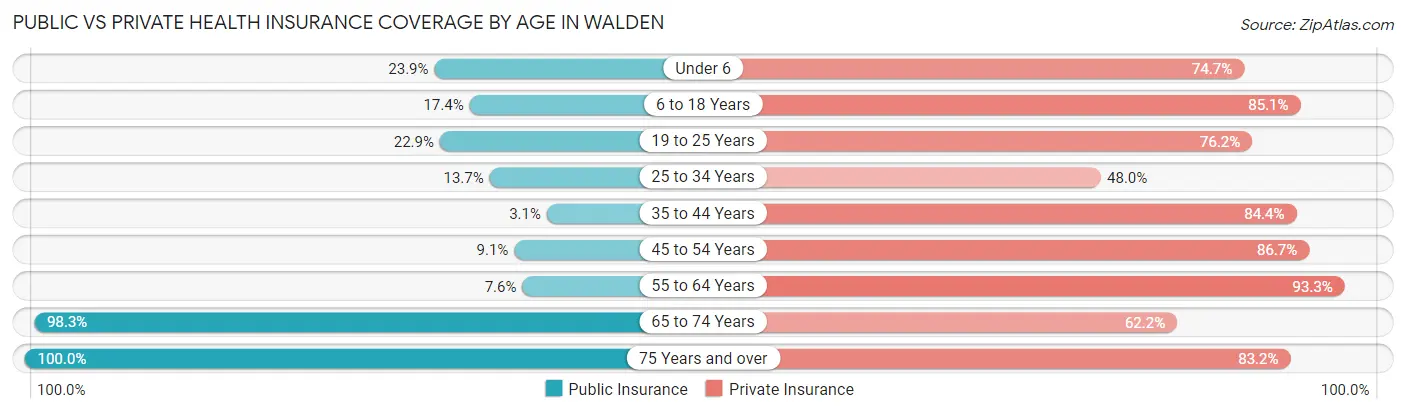
| Age Bracket | Public Insurance | Private Insurance |
| Under 6 | 34 (23.9%) | 106 (74.7%) |
| 6 to 18 Years | 62 (17.4%) | 303 (85.1%) |
| 19 to 25 Years | 25 (22.9%) | 83 (76.1%) |
| 25 to 34 Years | 10 (13.7%) | 35 (47.9%) |
| 35 to 44 Years | 10 (3.1%) | 275 (84.4%) |
| 45 to 54 Years | 22 (9.1%) | 209 (86.7%) |
| 55 to 64 Years | 16 (7.6%) | 196 (93.3%) |
| 65 to 74 Years | 169 (98.3%) | 107 (62.2%) |
| 75 Years and over | 173 (100.0%) | 144 (83.2%) |
| Total | 521 (28.9%) | 1,458 (80.9%) |
Disability Status by Sex by Age in Walden
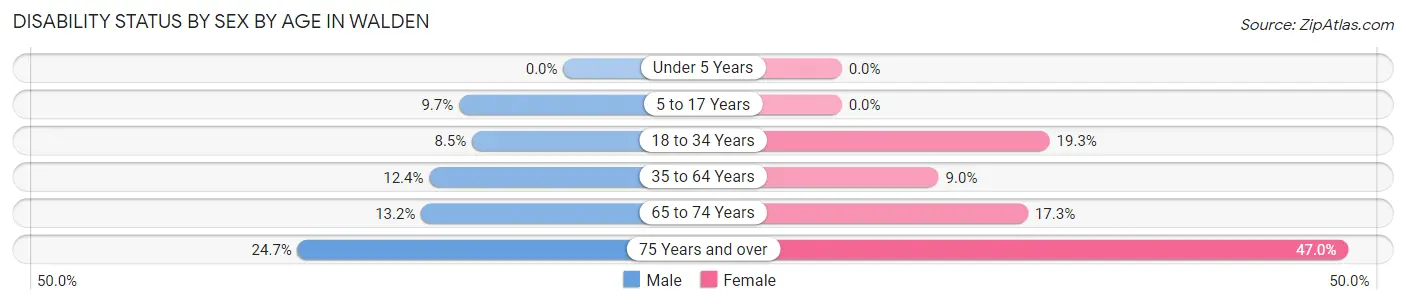
| Age Bracket | Male | Female |
| Under 5 Years | 0 (0.0%) | 0 (0.0%) |
| 5 to 17 Years | 18 (9.7%) | 0 (0.0%) |
| 18 to 34 Years | 5 (8.5%) | 27 (19.3%) |
| 35 to 64 Years | 51 (12.4%) | 33 (9.0%) |
| 65 to 74 Years | 12 (13.2%) | 14 (17.3%) |
| 75 Years and over | 18 (24.7%) | 47 (47.0%) |
Disability Class by Sex by Age in Walden
Disability Class: Hearing Difficulty
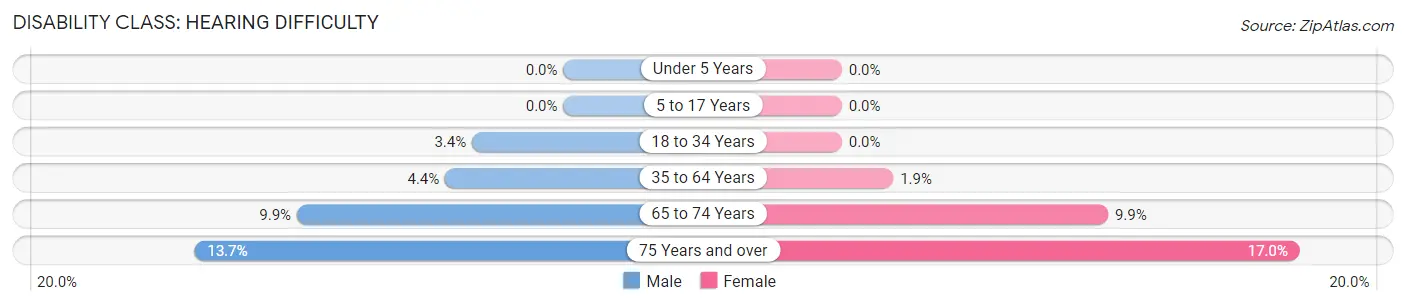
| Age Bracket | Male | Female |
| Under 5 Years | 0 (0.0%) | 0 (0.0%) |
| 5 to 17 Years | 0 (0.0%) | 0 (0.0%) |
| 18 to 34 Years | 2 (3.4%) | 0 (0.0%) |
| 35 to 64 Years | 18 (4.4%) | 7 (1.9%) |
| 65 to 74 Years | 9 (9.9%) | 8 (9.9%) |
| 75 Years and over | 10 (13.7%) | 17 (17.0%) |
Disability Class: Vision Difficulty
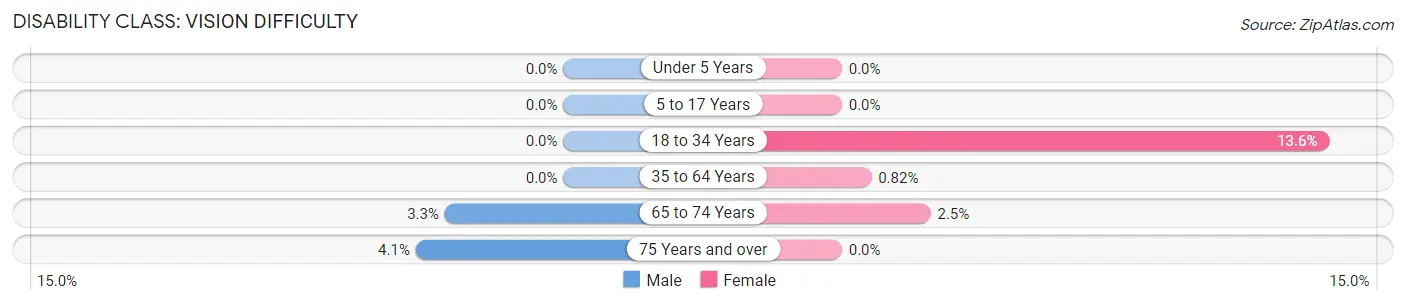
| Age Bracket | Male | Female |
| Under 5 Years | 0 (0.0%) | 0 (0.0%) |
| 5 to 17 Years | 0 (0.0%) | 0 (0.0%) |
| 18 to 34 Years | 0 (0.0%) | 19 (13.6%) |
| 35 to 64 Years | 0 (0.0%) | 3 (0.8%) |
| 65 to 74 Years | 3 (3.3%) | 2 (2.5%) |
| 75 Years and over | 3 (4.1%) | 0 (0.0%) |
Disability Class: Cognitive Difficulty
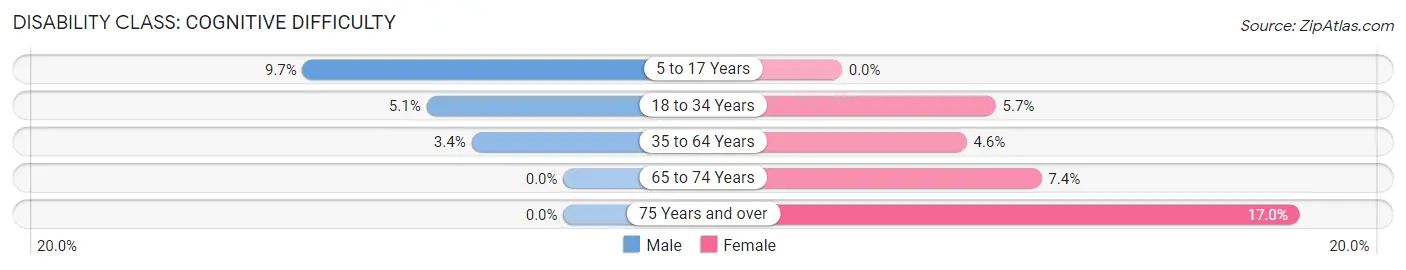
| Age Bracket | Male | Female |
| 5 to 17 Years | 18 (9.7%) | 0 (0.0%) |
| 18 to 34 Years | 3 (5.1%) | 8 (5.7%) |
| 35 to 64 Years | 14 (3.4%) | 17 (4.6%) |
| 65 to 74 Years | 0 (0.0%) | 6 (7.4%) |
| 75 Years and over | 0 (0.0%) | 17 (17.0%) |
Disability Class: Ambulatory Difficulty
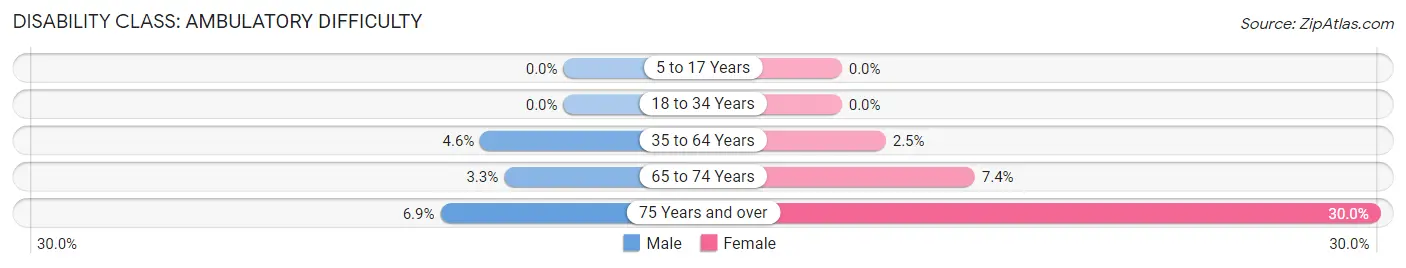
| Age Bracket | Male | Female |
| 5 to 17 Years | 0 (0.0%) | 0 (0.0%) |
| 18 to 34 Years | 0 (0.0%) | 0 (0.0%) |
| 35 to 64 Years | 19 (4.6%) | 9 (2.5%) |
| 65 to 74 Years | 3 (3.3%) | 6 (7.4%) |
| 75 Years and over | 5 (6.9%) | 30 (30.0%) |
Disability Class: Self-Care Difficulty
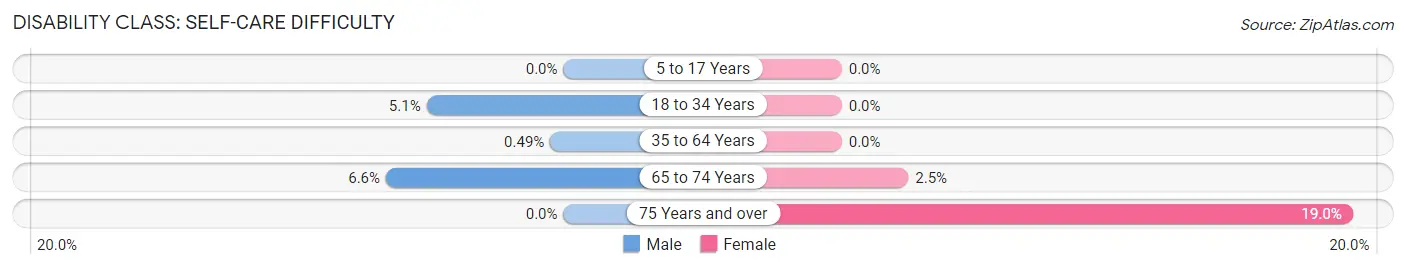
| Age Bracket | Male | Female |
| 5 to 17 Years | 0 (0.0%) | 0 (0.0%) |
| 18 to 34 Years | 3 (5.1%) | 0 (0.0%) |
| 35 to 64 Years | 2 (0.5%) | 0 (0.0%) |
| 65 to 74 Years | 6 (6.6%) | 2 (2.5%) |
| 75 Years and over | 0 (0.0%) | 19 (19.0%) |
Technology Access in Walden
Computing Device Access in Walden
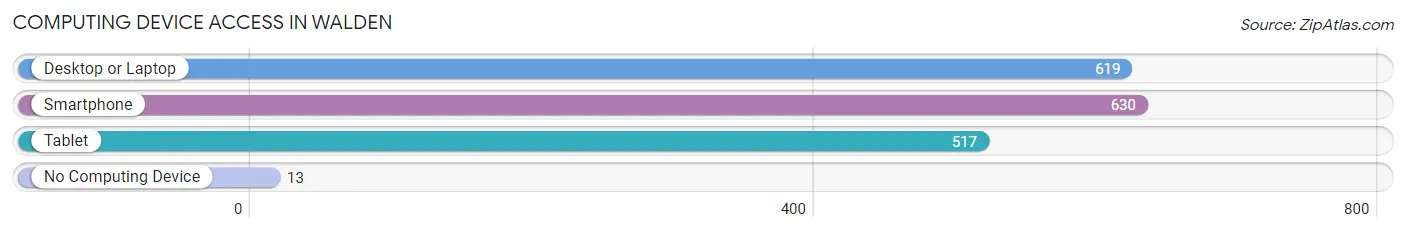
| Device Type | # Households | % Households |
| Desktop or Laptop | 619 | 91.0% |
| Smartphone | 630 | 92.6% |
| Tablet | 517 | 76.0% |
| No Computing Device | 13 | 1.9% |
| Total | 680 | 100.0% |
Internet Access in Walden
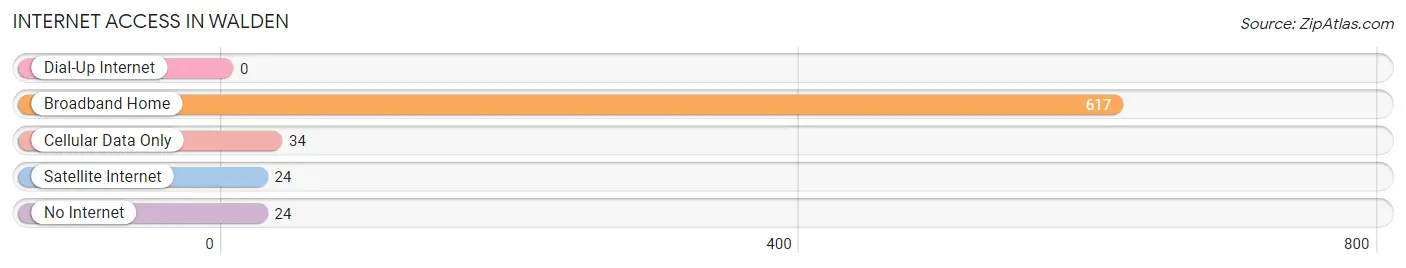
| Internet Type | # Households | % Households |
| Dial-Up Internet | 0 | 0.0% |
| Broadband Home | 617 | 90.7% |
| Cellular Data Only | 34 | 5.0% |
| Satellite Internet | 24 | 3.5% |
| No Internet | 24 | 3.5% |
| Total | 680 | 100.0% |
Walden Summary
Walden is a small town located in the state of Tennessee, in the United States. It is situated in the eastern part of the state, in the foothills of the Appalachian Mountains. The town is located in the Sequatchie Valley, which is a narrow valley that runs through the mountains. The town is located in the Sequatchie County, and is part of the Chattanooga, TN-GA Metropolitan Statistical Area.
History
The town of Walden was founded in 1820 by a group of settlers from North Carolina. The town was named after the nearby Walden Creek, which was named after the English philosopher and poet Henry David Thoreau. The town was originally a farming community, and the settlers grew corn, wheat, and other crops. The town was also known for its iron ore deposits, which were mined and used to make tools and weapons.
In the late 19th century, the town began to grow and develop. The railroad was built through the town, and the town became a hub for the surrounding area. The town also became a popular tourist destination, as it was located near the Great Smoky Mountains National Park.
Geography
Walden is located in the eastern part of Tennessee, in the foothills of the Appalachian Mountains. The town is situated in the Sequatchie Valley, which is a narrow valley that runs through the mountains. The town is located in the Sequatchie County, and is part of the Chattanooga, TN-GA Metropolitan Statistical Area.
The town is located at an elevation of 1,000 feet above sea level. The town is surrounded by mountains, and the highest peak in the area is the Lookout Mountain, which is located just to the north of the town. The town is located near the Sequatchie River, which is a tributary of the Tennessee River.
Economy
The economy of Walden is largely based on agriculture and tourism. The town is home to several farms, which produce corn, wheat, and other crops. The town is also home to several tourist attractions, such as the Great Smoky Mountains National Park, which is located just to the north of the town.
The town is also home to several small businesses, such as restaurants, shops, and other services. The town is also home to several manufacturing companies, which produce a variety of products, such as furniture, clothing, and other items.
Demographics
As of the 2010 census, the town of Walden had a population of 1,845 people. The population is largely white, with a small percentage of African Americans and other minorities. The median household income in the town is $35,000, and the median age is 40 years old. The town has a low unemployment rate, and the majority of the population is employed in the agricultural and tourism industries.
Common Questions
What is the Total Population of Walden?
Total Population of Walden is 1,802.
What is the Total Male Population of Walden?
Total Male Population of Walden is 870.
What is the Total Female Population of Walden?
Total Female Population of Walden is 932.
What is the Ratio of Males per 100 Females in Walden?
There are 93.35 Males per 100 Females in Walden.
What is the Ratio of Females per 100 Males in Walden?
There are 107.13 Females per 100 Males in Walden.
What is the Median Population Age in Walden?
Median Population Age in Walden is 42.6 Years.
What is the Average Family Size in Walden
Average Family Size in Walden is 3.0 People.
What is the Average Household Size in Walden
Average Household Size in Walden is 2.6 People.
What is Per Capita Income in Walden?
Per Capita income in Walden is $68,712.
What is the Median Family Income in Walden?
Median Family Income in Walden is $155,855.
What is the Median Household income in Walden?
Median Household Income in Walden is $130,227.
What is Income or Wage Gap in Walden?
Income or Wage Gap in Walden is 55.9%.
Women in Walden earn 44.1 cents for every dollar earned by a man.
What is Inequality or Gini Index in Walden?
Inequality or Gini Index in Walden is 0.46.
How Large is the Labor Force in Walden?
There are 863 People in the Labor Forcein in Walden.
What is the Percentage of People in the Labor Force in Walden?
63.3% of People are in the Labor Force in Walden.
What is the Unemployment Rate in Walden?
Unemployment Rate in Walden is 5.2%.