Lakesite, TN
Lakesite Map
Lakesite Overview
2,056
TOTAL POPULATION
1,031
MALE POPULATION
1,025
FEMALE POPULATION
100.59
MALES / 100 FEMALES
99.42
FEMALES / 100 MALES
40.4
MEDIAN AGE
3.2
AVG FAMILY SIZE
2.8
AVG HOUSEHOLD SIZE
$40,681
PER CAPITA INCOME
$101,319
AVG FAMILY INCOME
$89,602
AVG HOUSEHOLD INCOME
27.4%
WAGE / INCOME GAP [ % ]
72.6¢/ $1
WAGE / INCOME GAP [ $ ]
0.42
INEQUALITY / GINI INDEX
1,047
LABOR FORCE [ PEOPLE ]
67.4%
PERCENT IN LABOR FORCE
1.8%
UNEMPLOYMENT RATE
Lakesite Area Codes
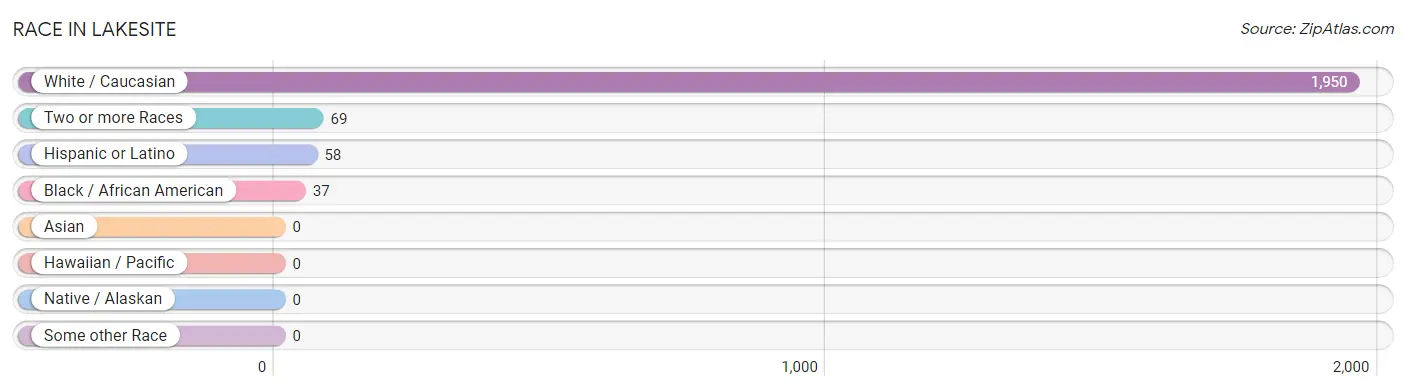
Race in Lakesite
The most populous races in Lakesite are White / Caucasian (1,950 | 94.8%), Two or more Races (69 | 3.4%), and Hispanic or Latino (58 | 2.8%).
| Race | # Population | % Population |
| Asian | 0 | 0.0% |
| Black / African American | 37 | 1.8% |
| Hawaiian / Pacific | 0 | 0.0% |
| Hispanic or Latino | 58 | 2.8% |
| Native / Alaskan | 0 | 0.0% |
| White / Caucasian | 1,950 | 94.8% |
| Two or more Races | 69 | 3.4% |
| Some other Race | 0 | 0.0% |
| Total | 2,056 | 100.0% |
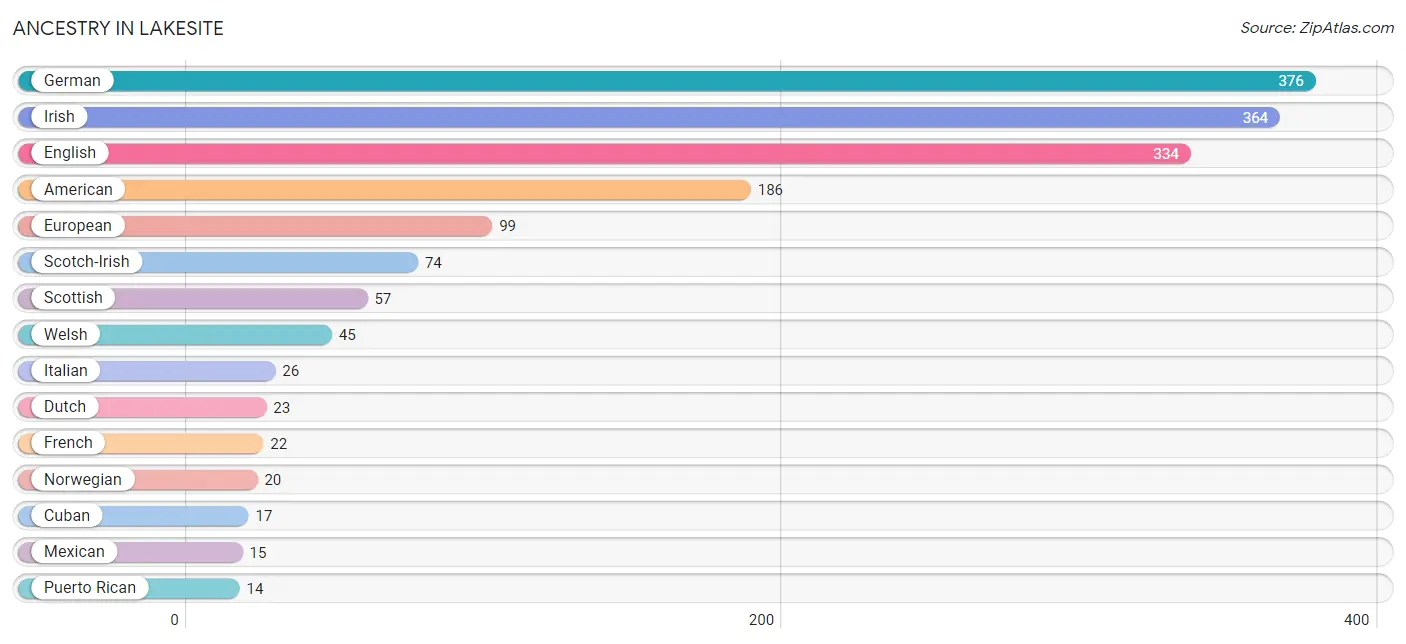
Ancestry in Lakesite
The most populous ancestries reported in Lakesite are German (376 | 18.3%), Irish (364 | 17.7%), English (334 | 16.3%), American (186 | 9.0%), and European (99 | 4.8%), together accounting for 66.1% of all Lakesite residents.
| Ancestry | # Population | % Population |
| American | 186 | 9.0% |
| Arab | 12 | 0.6% |
| Cherokee | 8 | 0.4% |
| Colombian | 12 | 0.6% |
| Croatian | 4 | 0.2% |
| Crow | 8 | 0.4% |
| Cuban | 17 | 0.8% |
| Danish | 2 | 0.1% |
| Dutch | 23 | 1.1% |
| English | 334 | 16.3% |
| European | 99 | 4.8% |
| Finnish | 3 | 0.2% |
| French | 22 | 1.1% |
| German | 376 | 18.3% |
| Irish | 364 | 17.7% |
| Italian | 26 | 1.3% |
| Jamaican | 10 | 0.5% |
| Mexican | 15 | 0.7% |
| Norwegian | 20 | 1.0% |
| Palestinian | 12 | 0.6% |
| Polish | 3 | 0.2% |
| Puerto Rican | 14 | 0.7% |
| Russian | 3 | 0.2% |
| Scotch-Irish | 74 | 3.6% |
| Scottish | 57 | 2.8% |
| Sioux | 8 | 0.4% |
| South American | 12 | 0.6% |
| Swiss | 4 | 0.2% |
| Welsh | 45 | 2.2% |
| Yugoslavian | 3 | 0.2% | View All 30 Rows |
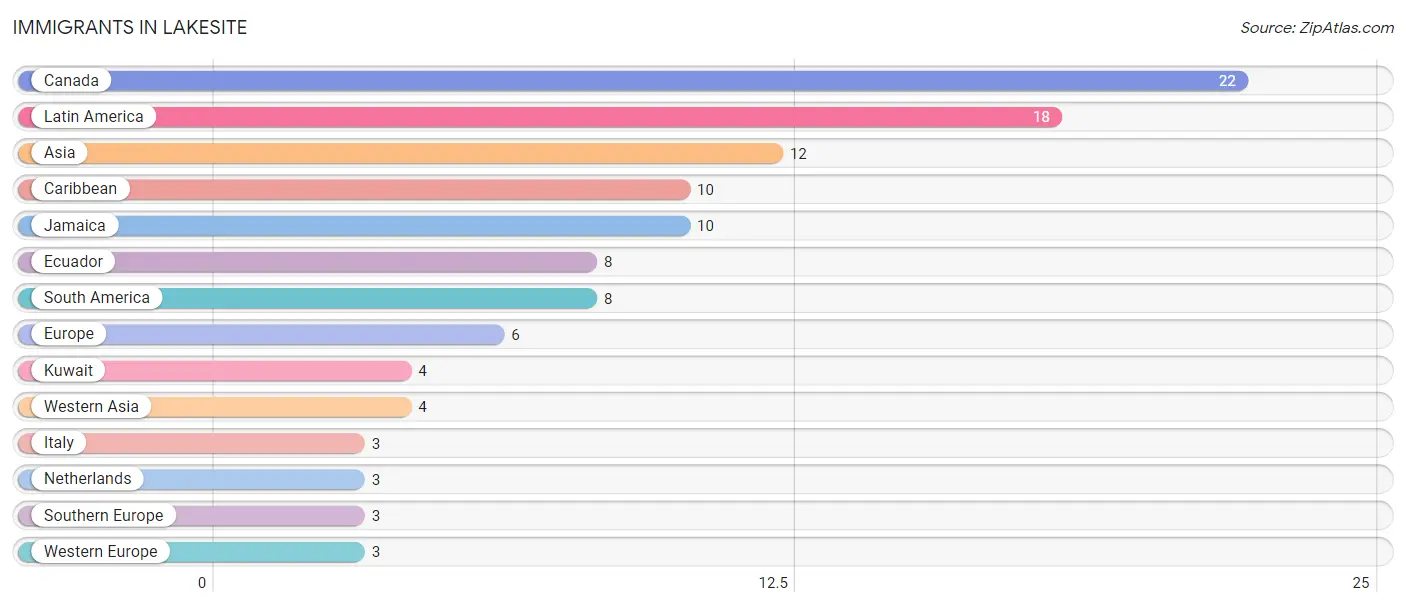
Immigrants in Lakesite
The most numerous immigrant groups reported in Lakesite came from Canada (22 | 1.1%), Latin America (18 | 0.9%), Asia (12 | 0.6%), Caribbean (10 | 0.5%), and Jamaica (10 | 0.5%), together accounting for 3.5% of all Lakesite residents.
| Immigration Origin | # Population | % Population |
| Asia | 12 | 0.6% |
| Canada | 22 | 1.1% |
| Caribbean | 10 | 0.5% |
| Ecuador | 8 | 0.4% |
| Europe | 6 | 0.3% |
| Italy | 3 | 0.2% |
| Jamaica | 10 | 0.5% |
| Kuwait | 4 | 0.2% |
| Latin America | 18 | 0.9% |
| Netherlands | 3 | 0.2% |
| South America | 8 | 0.4% |
| Southern Europe | 3 | 0.2% |
| Western Asia | 4 | 0.2% |
| Western Europe | 3 | 0.2% | View All 14 Rows |
Sex and Age in Lakesite
Sex and Age in Lakesite
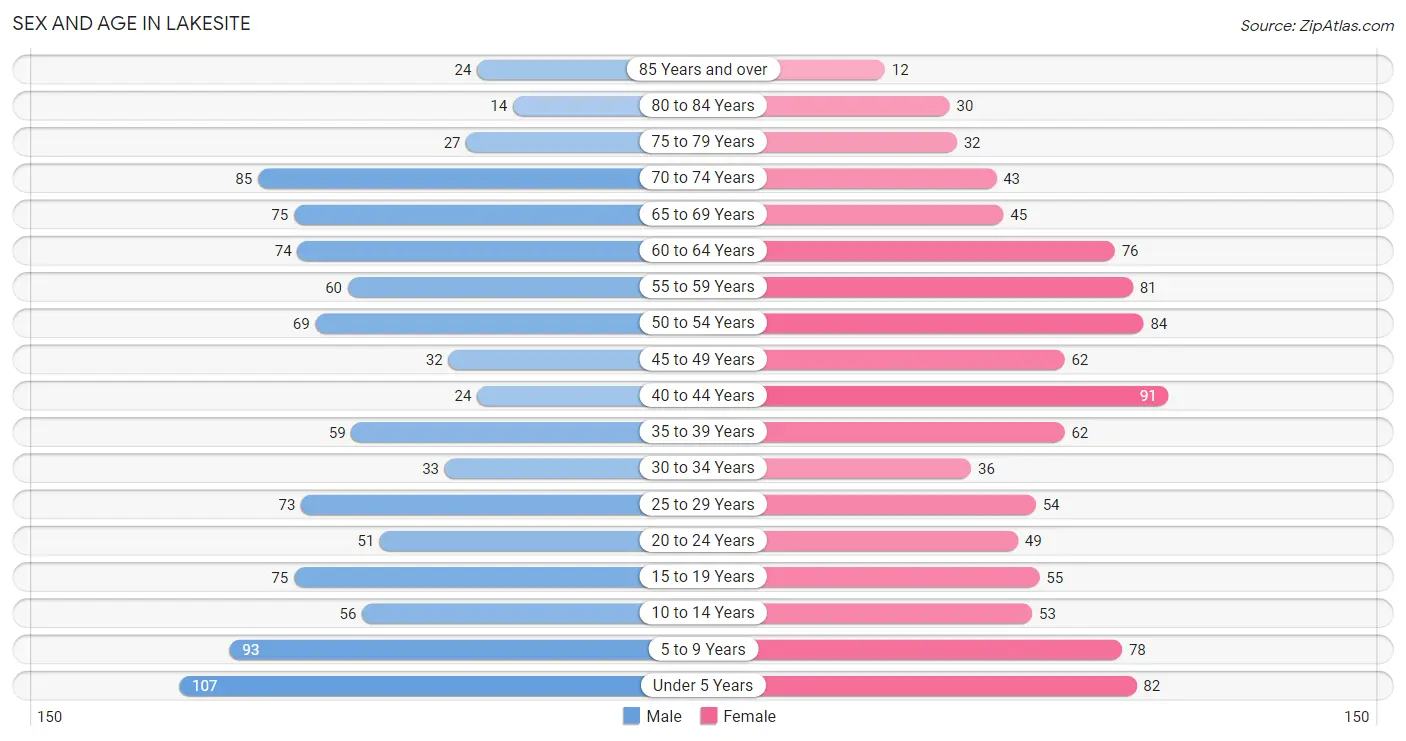
The most populous age groups in Lakesite are Under 5 Years (107 | 10.4%) for men and 40 to 44 Years (91 | 8.9%) for women.
| Age Bracket | Male | Female |
| Under 5 Years | 107 (10.4%) | 82 (8.0%) |
| 5 to 9 Years | 93 (9.0%) | 78 (7.6%) |
| 10 to 14 Years | 56 (5.4%) | 53 (5.2%) |
| 15 to 19 Years | 75 (7.3%) | 55 (5.4%) |
| 20 to 24 Years | 51 (5.0%) | 49 (4.8%) |
| 25 to 29 Years | 73 (7.1%) | 54 (5.3%) |
| 30 to 34 Years | 33 (3.2%) | 36 (3.5%) |
| 35 to 39 Years | 59 (5.7%) | 62 (6.0%) |
| 40 to 44 Years | 24 (2.3%) | 91 (8.9%) |
| 45 to 49 Years | 32 (3.1%) | 62 (6.0%) |
| 50 to 54 Years | 69 (6.7%) | 84 (8.2%) |
| 55 to 59 Years | 60 (5.8%) | 81 (7.9%) |
| 60 to 64 Years | 74 (7.2%) | 76 (7.4%) |
| 65 to 69 Years | 75 (7.3%) | 45 (4.4%) |
| 70 to 74 Years | 85 (8.2%) | 43 (4.2%) |
| 75 to 79 Years | 27 (2.6%) | 32 (3.1%) |
| 80 to 84 Years | 14 (1.4%) | 30 (2.9%) |
| 85 Years and over | 24 (2.3%) | 12 (1.2%) |
| Total | 1,031 (100.0%) | 1,025 (100.0%) |
Families and Households in Lakesite
Median Family Size in Lakesite
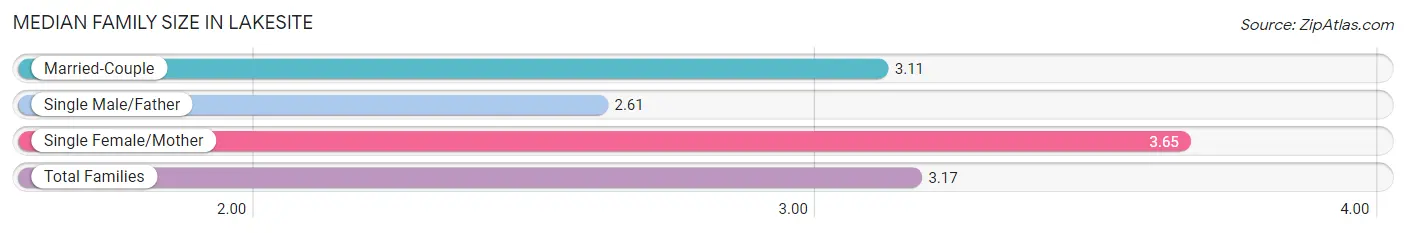
The median family size in Lakesite is 3.17 persons per family, with single female/mother families (89 | 15.8%) accounting for the largest median family size of 3.65 persons per family. On the other hand, single male/father families (31 | 5.5%) represent the smallest median family size with 2.61 persons per family.
| Family Type | # Families | Family Size |
| Married-Couple | 443 (78.7%) | 3.11 |
| Single Male/Father | 31 (5.5%) | 2.61 |
| Single Female/Mother | 89 (15.8%) | 3.65 |
| Total Families | 563 (100.0%) | 3.17 |
Median Household Size in Lakesite
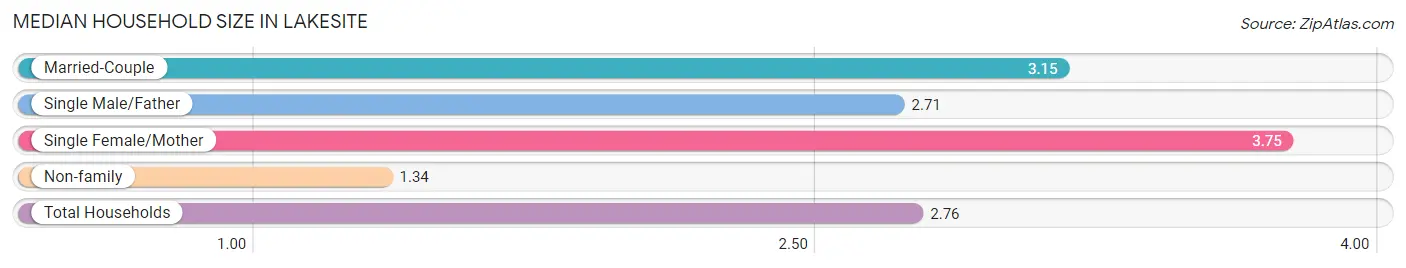
The median household size in Lakesite is 2.76 persons per household, with single female/mother households (89 | 11.9%) accounting for the largest median household size of 3.75 persons per household. non-family households (182 | 24.4%) represent the smallest median household size with 1.34 persons per household.
| Household Type | # Households | Household Size |
| Married-Couple | 443 (59.5%) | 3.15 |
| Single Male/Father | 31 (4.2%) | 2.71 |
| Single Female/Mother | 89 (11.9%) | 3.75 |
| Non-family | 182 (24.4%) | 1.34 |
| Total Households | 745 (100.0%) | 2.76 |
Household Size by Marriage Status in Lakesite
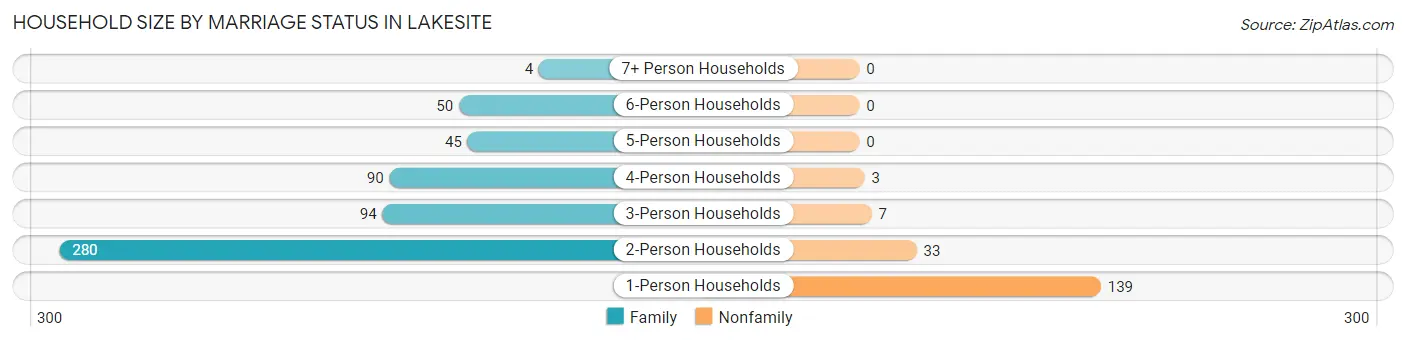
Out of a total of 745 households in Lakesite, 563 (75.6%) are family households, while 182 (24.4%) are nonfamily households. The most numerous type of family households are 2-person households, comprising 280, and the most common type of nonfamily households are 1-person households, comprising 139.
| Household Size | Family Households | Nonfamily Households |
| 1-Person Households | - | 139 (18.7%) |
| 2-Person Households | 280 (37.6%) | 33 (4.4%) |
| 3-Person Households | 94 (12.6%) | 7 (0.9%) |
| 4-Person Households | 90 (12.1%) | 3 (0.4%) |
| 5-Person Households | 45 (6.0%) | 0 (0.0%) |
| 6-Person Households | 50 (6.7%) | 0 (0.0%) |
| 7+ Person Households | 4 (0.5%) | 0 (0.0%) |
| Total | 563 (75.6%) | 182 (24.4%) |
Female Fertility in Lakesite
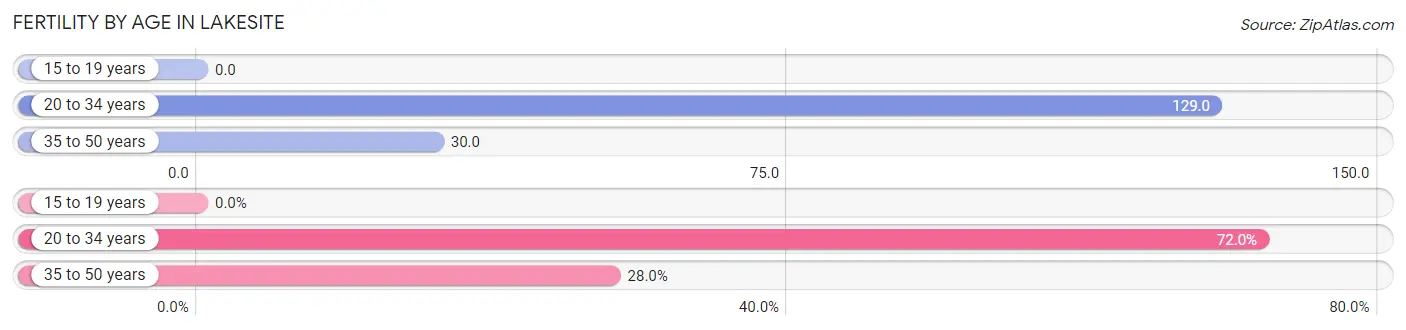
Fertility by Age in Lakesite
Average fertility rate in Lakesite is 58.0 births per 1,000 women. Women in the age bracket of 20 to 34 years have the highest fertility rate with 129.0 births per 1,000 women. Women in the age bracket of 20 to 34 years acount for 72.0% of all women with births.
| Age Bracket | Women with Births | Births / 1,000 Women |
| 15 to 19 years | 0 (0.0%) | 0.0 |
| 20 to 34 years | 18 (72.0%) | 129.0 |
| 35 to 50 years | 7 (28.0%) | 30.0 |
| Total | 25 (100.0%) | 58.0 |
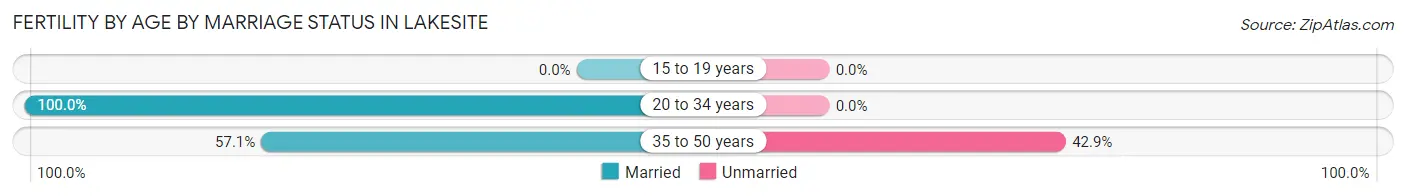
Fertility by Age by Marriage Status in Lakesite
88.0% of women with births (25) in Lakesite are married. The highest percentage of unmarried women with births falls into 35 to 50 years age bracket with 42.9% of them unmarried at the time of birth, while the lowest percentage of unmarried women with births belong to 20 to 34 years age bracket with 0.0% of them unmarried.
| Age Bracket | Married | Unmarried |
| 15 to 19 years | 0 (0.0%) | 0 (0.0%) |
| 20 to 34 years | 18 (100.0%) | 0 (0.0%) |
| 35 to 50 years | 4 (57.1%) | 3 (42.9%) |
| Total | 22 (88.0%) | 3 (12.0%) |
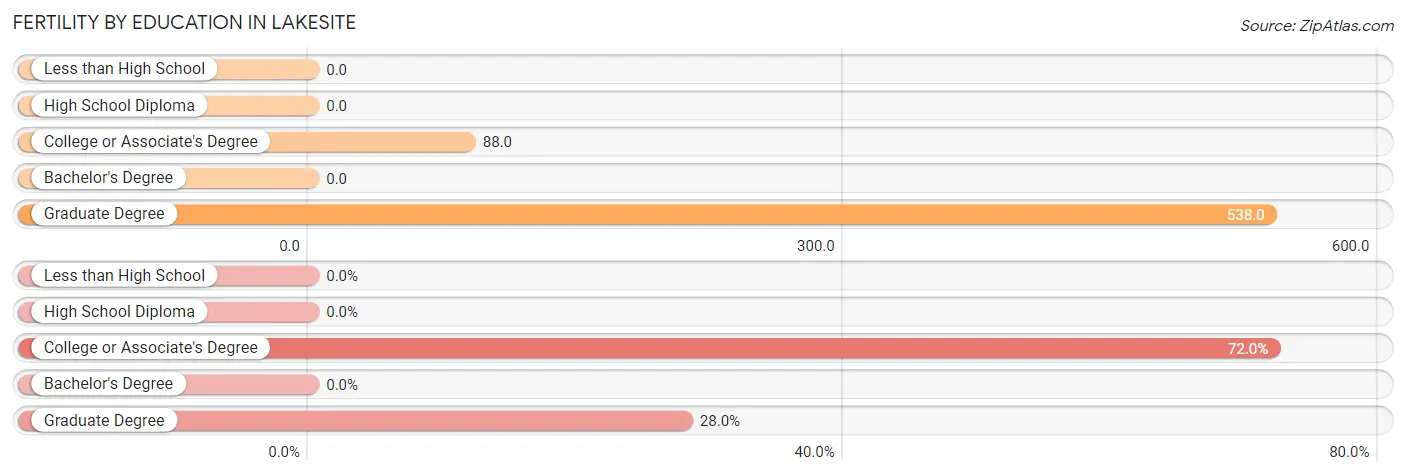
Fertility by Education in Lakesite
| Educational Attainment | Women with Births | Births / 1,000 Women |
| Less than High School | 0 (0.0%) | 0.0 |
| High School Diploma | 0 (0.0%) | 0.0 |
| College or Associate's Degree | 18 (72.0%) | 88.0 |
| Bachelor's Degree | 0 (0.0%) | 0.0 |
| Graduate Degree | 7 (28.0%) | 538.0 |
| Total | 25 (100.0%) | 58.0 |
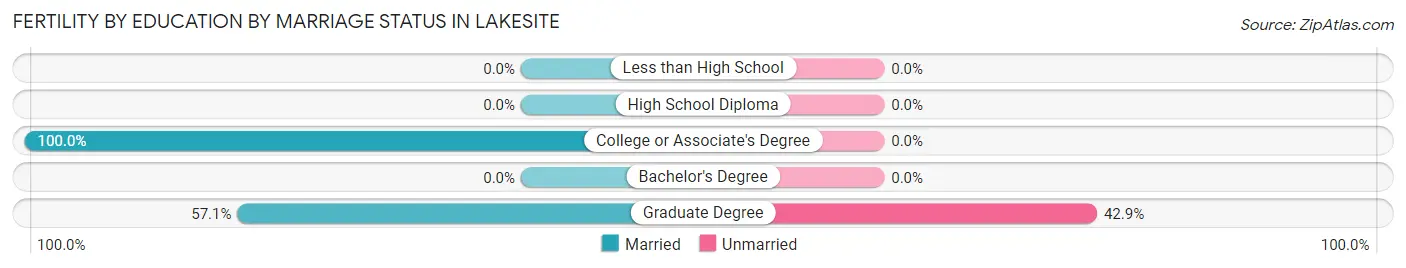
Fertility by Education by Marriage Status in Lakesite
12.0% of women with births in Lakesite are unmarried. Women with the educational attainment of college or associate's degree are most likely to be married with 100.0% of them married at childbirth, while women with the educational attainment of graduate degree are least likely to be married with 42.9% of them unmarried at childbirth.
| Educational Attainment | Married | Unmarried |
| Less than High School | 0 (0.0%) | 0 (0.0%) |
| High School Diploma | 0 (0.0%) | 0 (0.0%) |
| College or Associate's Degree | 18 (100.0%) | 0 (0.0%) |
| Bachelor's Degree | 0 (0.0%) | 0 (0.0%) |
| Graduate Degree | 4 (57.1%) | 3 (42.9%) |
| Total | 22 (88.0%) | 3 (12.0%) |
Income in Lakesite
Income Overview in Lakesite
Per Capita Income in Lakesite is $40,681, while median incomes of families and households are $101,319 and $89,602 respectively.
| Characteristic | Number | Measure |
| Per Capita Income | 2,056 | $40,681 |
| Median Family Income | 563 | $101,319 |
| Mean Family Income | 563 | $125,250 |
| Median Household Income | 745 | $89,602 |
| Mean Household Income | 745 | $111,475 |
| Income Deficit | 563 | $0 |
| Wage / Income Gap (%) | 2,056 | 27.44% |
| Wage / Income Gap ($) | 2,056 | 72.56¢ per $1 |
| Gini / Inequality Index | 2,056 | 0.42 |
Earnings by Sex in Lakesite
Average Earnings in Lakesite are $37,022, $45,096 for men and $32,721 for women, a difference of 27.4%.
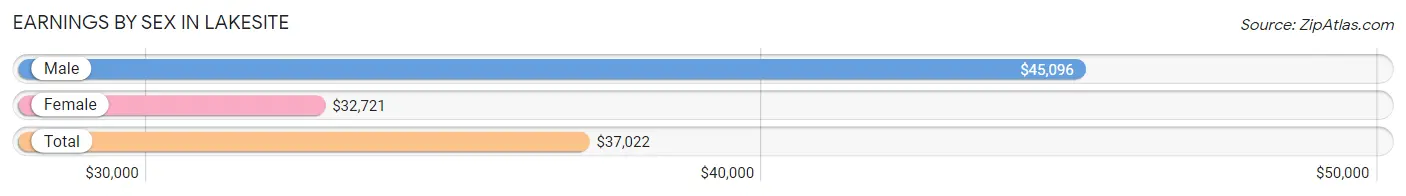
| Sex | Number | Average Earnings |
| Male | 524 (48.5%) | $45,096 |
| Female | 556 (51.5%) | $32,721 |
| Total | 1,080 (100.0%) | $37,022 |
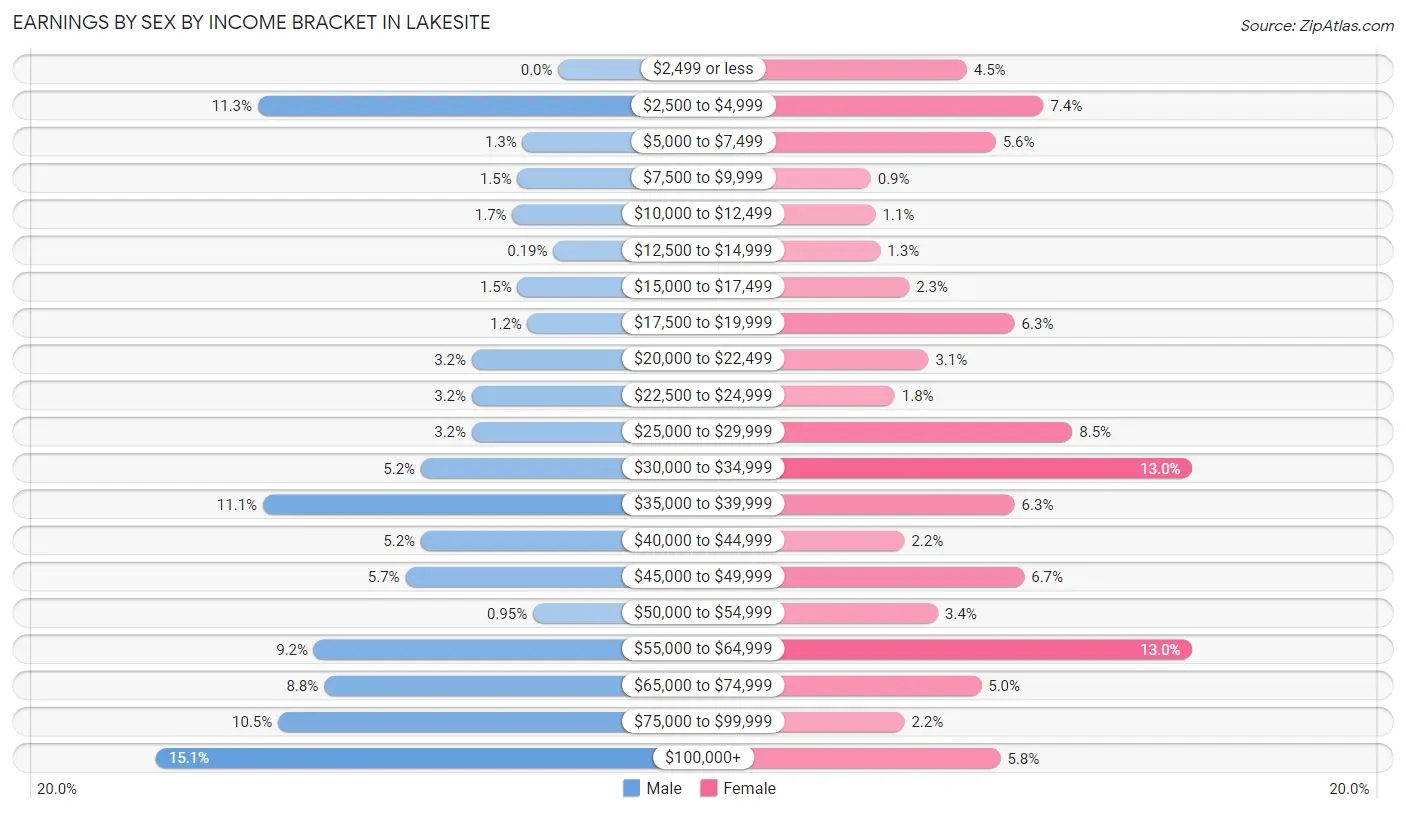
Earnings by Sex by Income Bracket in Lakesite
The most common earnings brackets in Lakesite are $100,000+ for men (79 | 15.1%) and $30,000 to $34,999 for women (72 | 13.0%).
| Income | Male | Female |
| $2,499 or less | 0 (0.0%) | 25 (4.5%) |
| $2,500 to $4,999 | 59 (11.3%) | 41 (7.4%) |
| $5,000 to $7,499 | 7 (1.3%) | 31 (5.6%) |
| $7,500 to $9,999 | 8 (1.5%) | 5 (0.9%) |
| $10,000 to $12,499 | 9 (1.7%) | 6 (1.1%) |
| $12,500 to $14,999 | 1 (0.2%) | 7 (1.3%) |
| $15,000 to $17,499 | 8 (1.5%) | 13 (2.3%) |
| $17,500 to $19,999 | 6 (1.1%) | 35 (6.3%) |
| $20,000 to $22,499 | 17 (3.2%) | 17 (3.1%) |
| $22,500 to $24,999 | 17 (3.2%) | 10 (1.8%) |
| $25,000 to $29,999 | 17 (3.2%) | 47 (8.5%) |
| $30,000 to $34,999 | 27 (5.1%) | 72 (13.0%) |
| $35,000 to $39,999 | 58 (11.1%) | 35 (6.3%) |
| $40,000 to $44,999 | 27 (5.1%) | 12 (2.2%) |
| $45,000 to $49,999 | 30 (5.7%) | 37 (6.7%) |
| $50,000 to $54,999 | 5 (0.9%) | 19 (3.4%) |
| $55,000 to $64,999 | 48 (9.2%) | 72 (13.0%) |
| $65,000 to $74,999 | 46 (8.8%) | 28 (5.0%) |
| $75,000 to $99,999 | 55 (10.5%) | 12 (2.2%) |
| $100,000+ | 79 (15.1%) | 32 (5.8%) |
| Total | 524 (100.0%) | 556 (100.0%) |
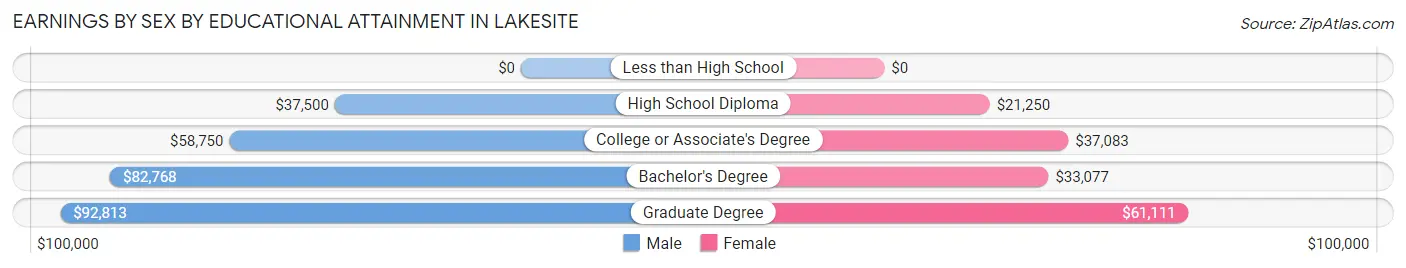
Earnings by Sex by Educational Attainment in Lakesite
Average earnings in Lakesite are $61,146 for men and $34,779 for women, a difference of 43.1%. Men with an educational attainment of graduate degree enjoy the highest average annual earnings of $92,813, while those with high school diploma education earn the least with $37,500. Women with an educational attainment of graduate degree earn the most with the average annual earnings of $61,111, while those with high school diploma education have the smallest earnings of $21,250.
| Educational Attainment | Male Income | Female Income |
| Less than High School | - | - |
| High School Diploma | $37,500 | $21,250 |
| College or Associate's Degree | $58,750 | $37,083 |
| Bachelor's Degree | $82,768 | $33,077 |
| Graduate Degree | $92,813 | $61,111 |
| Total | $61,146 | $34,779 |
Family Income in Lakesite
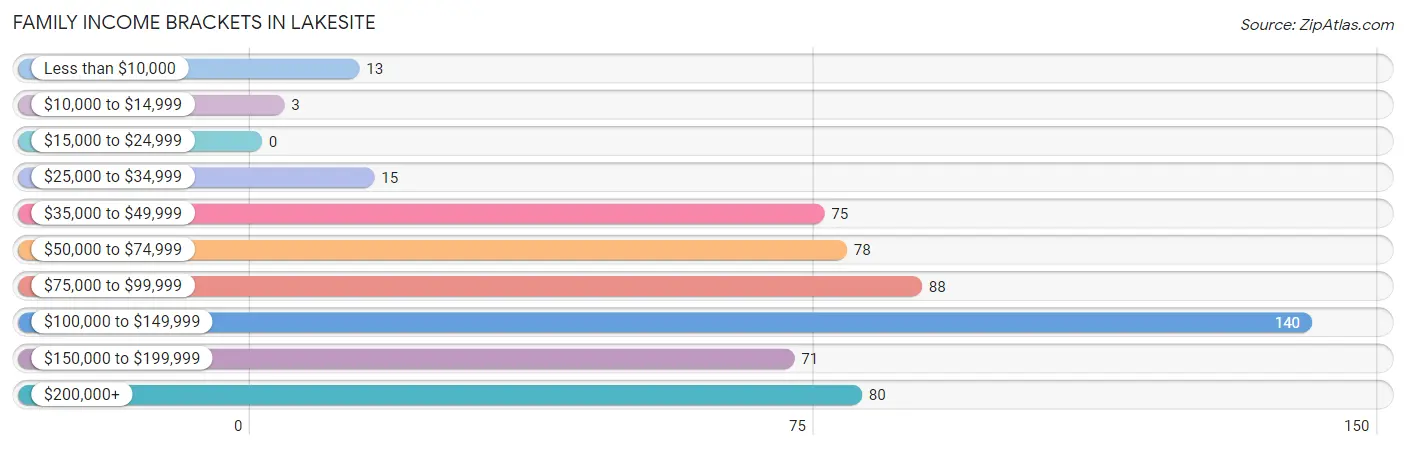
Family Income Brackets in Lakesite
According to the Lakesite family income data, there are 140 families falling into the $100,000 to $149,999 income range, which is the most common income bracket and makes up 24.9% of all families.
| Income Bracket | # Families | % Families |
| Less than $10,000 | 13 | 2.3% |
| $10,000 to $14,999 | 3 | 0.5% |
| $15,000 to $24,999 | 0 | 0.0% |
| $25,000 to $34,999 | 15 | 2.7% |
| $35,000 to $49,999 | 75 | 13.3% |
| $50,000 to $74,999 | 78 | 13.9% |
| $75,000 to $99,999 | 88 | 15.6% |
| $100,000 to $149,999 | 140 | 24.9% |
| $150,000 to $199,999 | 71 | 12.6% |
| $200,000+ | 80 | 14.2% |
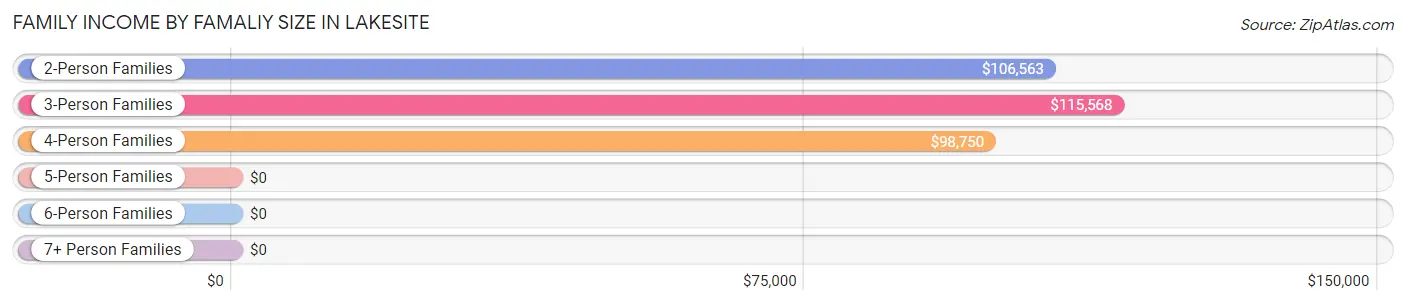
Family Income by Famaliy Size in Lakesite
3-person families (95 | 16.9%) account for the highest median family income in Lakesite with $115,568 per family, while 2-person families (286 | 50.8%) have the highest median income of $53,282 per family member.
| Income Bracket | # Families | Median Income |
| 2-Person Families | 286 (50.8%) | $106,563 |
| 3-Person Families | 95 (16.9%) | $115,568 |
| 4-Person Families | 85 (15.1%) | $98,750 |
| 5-Person Families | 43 (7.6%) | $0 |
| 6-Person Families | 53 (9.4%) | $0 |
| 7+ Person Families | 1 (0.2%) | $0 |
| Total | 563 (100.0%) | $101,319 |
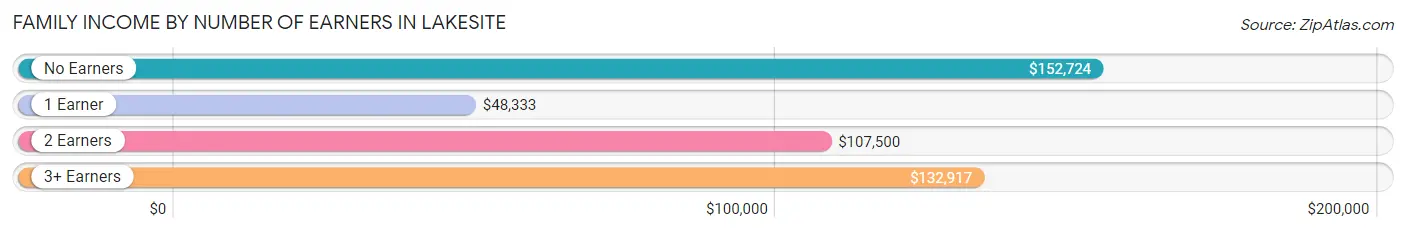
Family Income by Number of Earners in Lakesite
The median family income in Lakesite is $101,319, with families comprising no earners (99) having the highest median family income of $152,724, while families with 1 earner (158) have the lowest median family income of $48,333, accounting for 17.6% and 28.1% of families, respectively.
| Number of Earners | # Families | Median Income |
| No Earners | 99 (17.6%) | $152,724 |
| 1 Earner | 158 (28.1%) | $48,333 |
| 2 Earners | 216 (38.4%) | $107,500 |
| 3+ Earners | 90 (16.0%) | $132,917 |
| Total | 563 (100.0%) | $101,319 |
Household Income in Lakesite
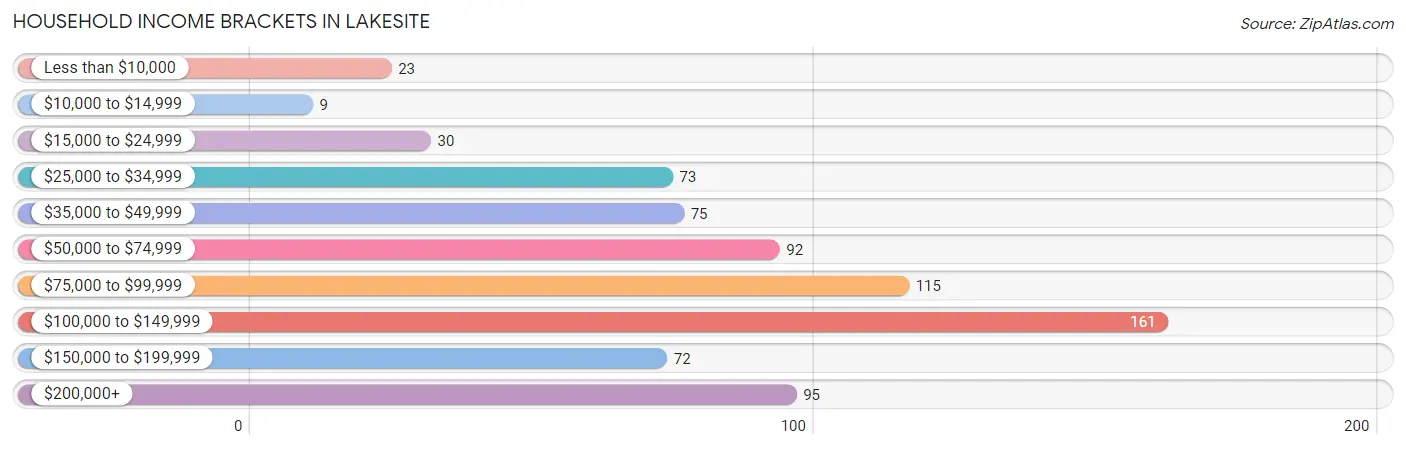
Household Income Brackets in Lakesite
With 161 households falling in the category, the $100,000 to $149,999 income range is the most frequent in Lakesite, accounting for 21.6% of all households. In contrast, only 9 households (1.2%) fall into the $10,000 to $14,999 income bracket, making it the least populous group.
| Income Bracket | # Households | % Households |
| Less than $10,000 | 23 | 3.1% |
| $10,000 to $14,999 | 9 | 1.2% |
| $15,000 to $24,999 | 30 | 4.0% |
| $25,000 to $34,999 | 73 | 9.8% |
| $35,000 to $49,999 | 75 | 10.1% |
| $50,000 to $74,999 | 92 | 12.3% |
| $75,000 to $99,999 | 115 | 15.4% |
| $100,000 to $149,999 | 161 | 21.6% |
| $150,000 to $199,999 | 72 | 9.7% |
| $200,000+ | 95 | 12.8% |
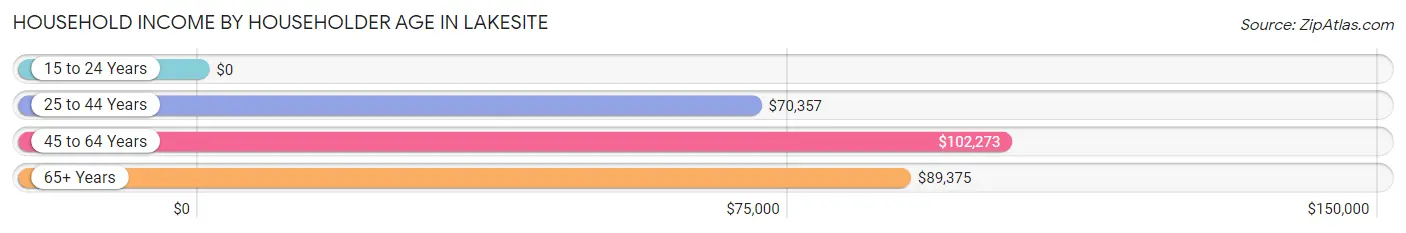
Household Income by Householder Age in Lakesite
The median household income in Lakesite is $89,602, with the highest median household income of $102,273 found in the 45 to 64 years age bracket for the primary householder. A total of 310 households (41.6%) fall into this category. Meanwhile, the 15 to 24 years age bracket for the primary householder has the lowest median household income of $0, with 13 households (1.7%) in this group.
| Income Bracket | # Households | Median Income |
| 15 to 24 Years | 13 (1.7%) | $0 |
| 25 to 44 Years | 200 (26.9%) | $70,357 |
| 45 to 64 Years | 310 (41.6%) | $102,273 |
| 65+ Years | 222 (29.8%) | $89,375 |
| Total | 745 (100.0%) | $89,602 |
Poverty in Lakesite
Income Below Poverty by Sex and Age in Lakesite
With 4.3% poverty level for males and 5.1% for females among the residents of Lakesite, 12 to 14 year old males and 35 to 44 year old females are the most vulnerable to poverty, with 10 males (47.6%) and 25 females (16.3%) in their respective age groups living below the poverty level.
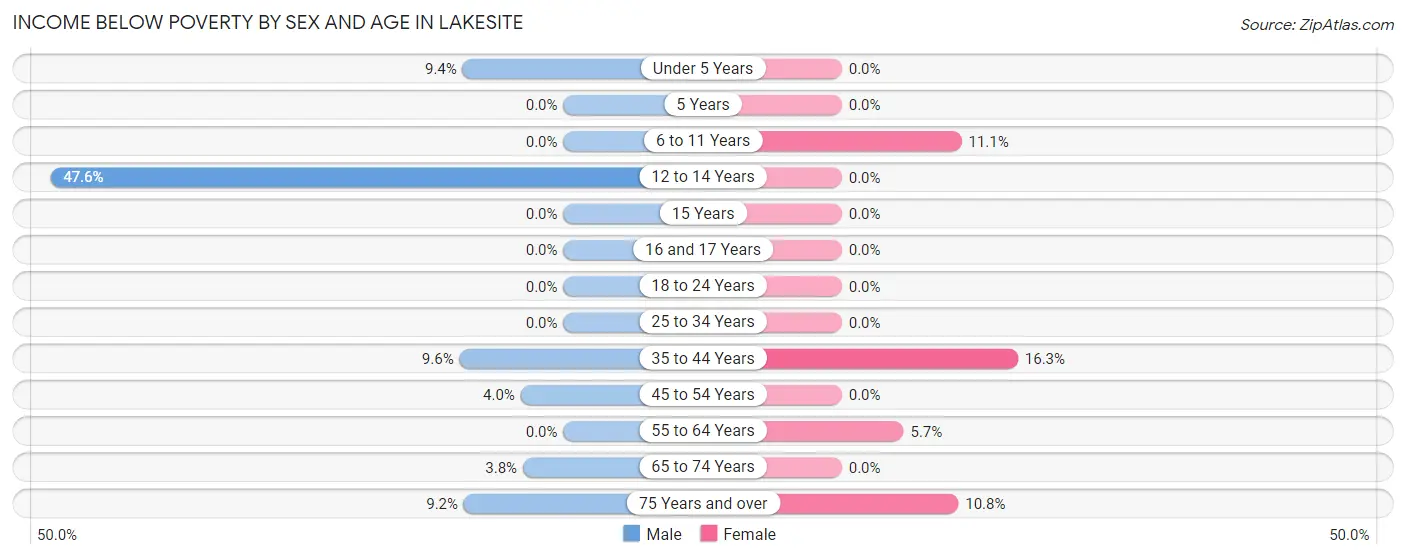
| Age Bracket | Male | Female |
| Under 5 Years | 10 (9.3%) | 0 (0.0%) |
| 5 Years | 0 (0.0%) | 0 (0.0%) |
| 6 to 11 Years | 0 (0.0%) | 10 (11.1%) |
| 12 to 14 Years | 10 (47.6%) | 0 (0.0%) |
| 15 Years | 0 (0.0%) | 0 (0.0%) |
| 16 and 17 Years | 0 (0.0%) | 0 (0.0%) |
| 18 to 24 Years | 0 (0.0%) | 0 (0.0%) |
| 25 to 34 Years | 0 (0.0%) | 0 (0.0%) |
| 35 to 44 Years | 8 (9.6%) | 25 (16.3%) |
| 45 to 54 Years | 4 (4.0%) | 0 (0.0%) |
| 55 to 64 Years | 0 (0.0%) | 9 (5.7%) |
| 65 to 74 Years | 6 (3.7%) | 0 (0.0%) |
| 75 Years and over | 6 (9.2%) | 8 (10.8%) |
| Total | 44 (4.3%) | 52 (5.1%) |
Income Above Poverty by Sex and Age in Lakesite
According to the poverty statistics in Lakesite, males aged 5 years and females aged under 5 years are the age groups that are most secure financially, with 100.0% of males and 100.0% of females in these age groups living above the poverty line.
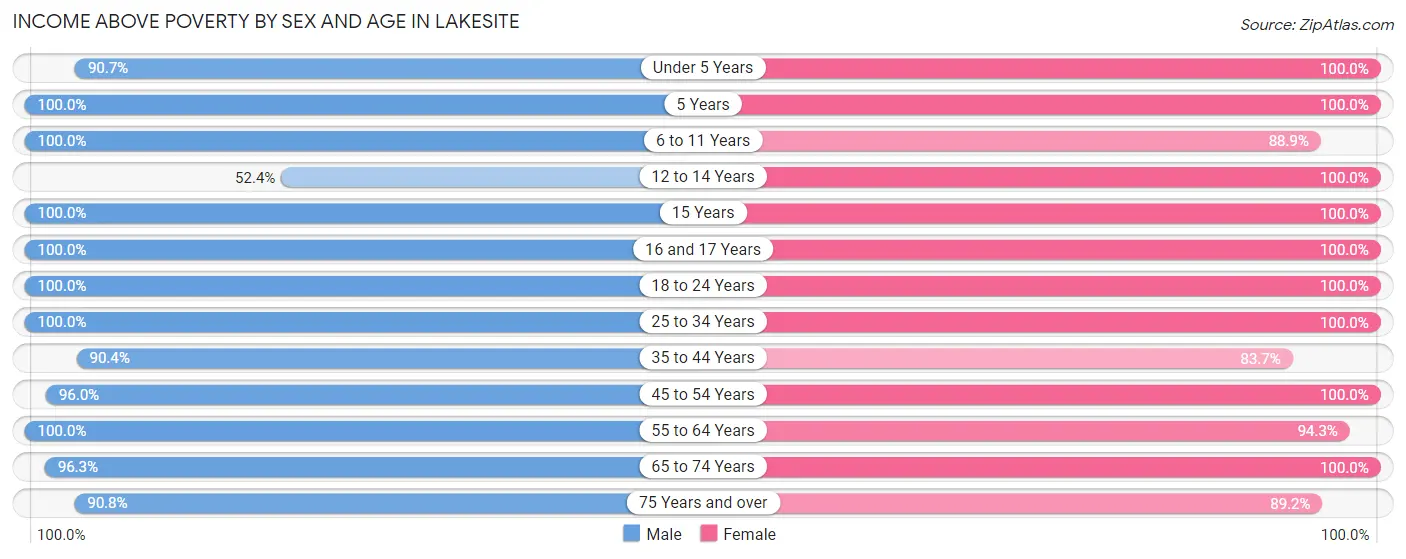
| Age Bracket | Male | Female |
| Under 5 Years | 97 (90.6%) | 82 (100.0%) |
| 5 Years | 2 (100.0%) | 9 (100.0%) |
| 6 to 11 Years | 126 (100.0%) | 80 (88.9%) |
| 12 to 14 Years | 11 (52.4%) | 27 (100.0%) |
| 15 Years | 21 (100.0%) | 12 (100.0%) |
| 16 and 17 Years | 51 (100.0%) | 24 (100.0%) |
| 18 to 24 Years | 54 (100.0%) | 68 (100.0%) |
| 25 to 34 Years | 106 (100.0%) | 90 (100.0%) |
| 35 to 44 Years | 75 (90.4%) | 128 (83.7%) |
| 45 to 54 Years | 97 (96.0%) | 146 (100.0%) |
| 55 to 64 Years | 134 (100.0%) | 148 (94.3%) |
| 65 to 74 Years | 154 (96.3%) | 88 (100.0%) |
| 75 Years and over | 59 (90.8%) | 66 (89.2%) |
| Total | 987 (95.7%) | 968 (94.9%) |
Income Below Poverty Among Married-Couple Families in Lakesite
The poverty statistics for married-couple families in Lakesite show that 0.7% or 3 of the total 443 families live below the poverty line. Families with 3 or 4 children have the highest poverty rate of 6.2%, comprising of 3 families. On the other hand, families with no children have the lowest poverty rate of 0.0%, which includes 0 families.
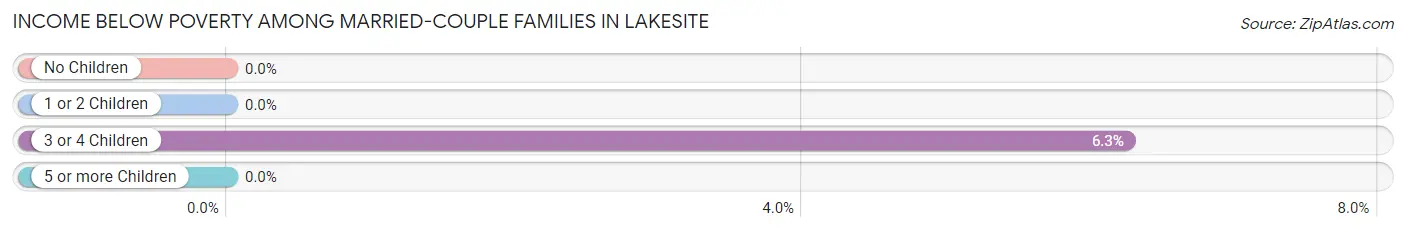
| Children | Above Poverty | Below Poverty |
| No Children | 281 (100.0%) | 0 (0.0%) |
| 1 or 2 Children | 114 (100.0%) | 0 (0.0%) |
| 3 or 4 Children | 45 (93.8%) | 3 (6.2%) |
| 5 or more Children | 0 (0.0%) | 0 (0.0%) |
| Total | 440 (99.3%) | 3 (0.7%) |
Income Below Poverty Among Single-Parent Households in Lakesite
According to the poverty data in Lakesite, 9.7% or 3 single-father households and 11.2% or 10 single-mother households are living below the poverty line. Among single-father households, those with no children have the highest poverty rate, with 3 households (11.5%) experiencing poverty. Likewise, among single-mother households, those with 1 or 2 children have the highest poverty rate, with 10 households (24.4%) falling below the poverty line.
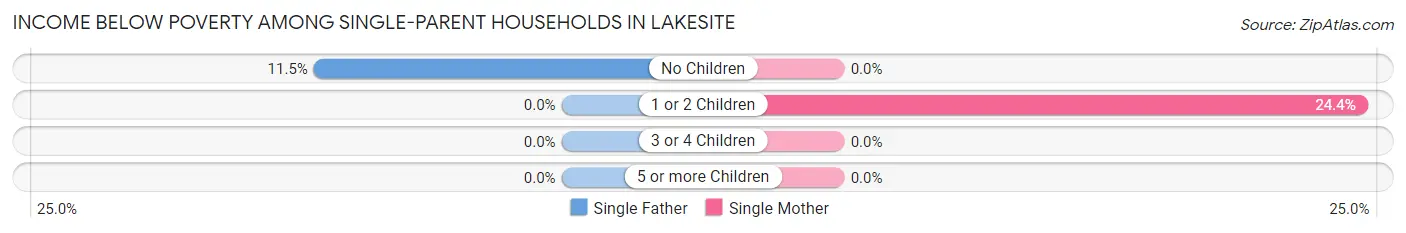
| Children | Single Father | Single Mother |
| No Children | 3 (11.5%) | 0 (0.0%) |
| 1 or 2 Children | 0 (0.0%) | 10 (24.4%) |
| 3 or 4 Children | 0 (0.0%) | 0 (0.0%) |
| 5 or more Children | 0 (0.0%) | 0 (0.0%) |
| Total | 3 (9.7%) | 10 (11.2%) |
Income Below Poverty Among Married-Couple vs Single-Parent Households in Lakesite
The poverty data for Lakesite shows that 3 of the married-couple family households (0.7%) and 13 of the single-parent households (10.8%) are living below the poverty level. Within the married-couple family households, those with 3 or 4 children have the highest poverty rate, with 3 households (6.2%) falling below the poverty line. Among the single-parent households, those with 1 or 2 children have the highest poverty rate, with 10 household (21.7%) living below poverty.
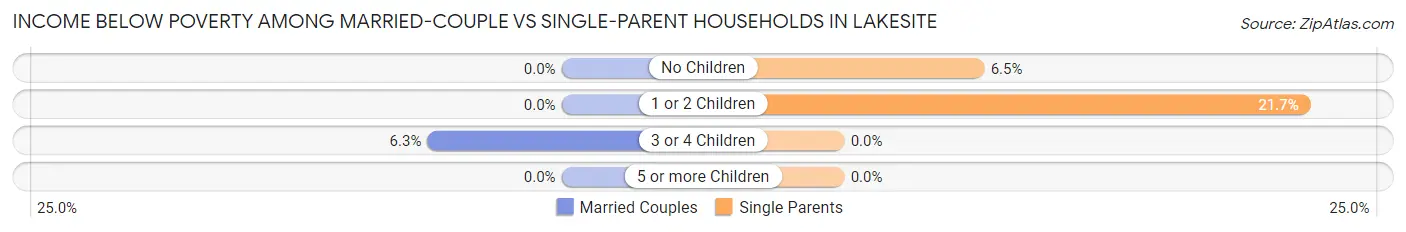
| Children | Married-Couple Families | Single-Parent Households |
| No Children | 0 (0.0%) | 3 (6.5%) |
| 1 or 2 Children | 0 (0.0%) | 10 (21.7%) |
| 3 or 4 Children | 3 (6.2%) | 0 (0.0%) |
| 5 or more Children | 0 (0.0%) | 0 (0.0%) |
| Total | 3 (0.7%) | 13 (10.8%) |
Employment Characteristics in Lakesite
Employment by Class of Employer in Lakesite
Among the 1,028 employed individuals in Lakesite, private company employees (664 | 64.6%), not-for-profit organizations (109 | 10.6%), and local government employees (101 | 9.8%) make up the most common classes of employment.
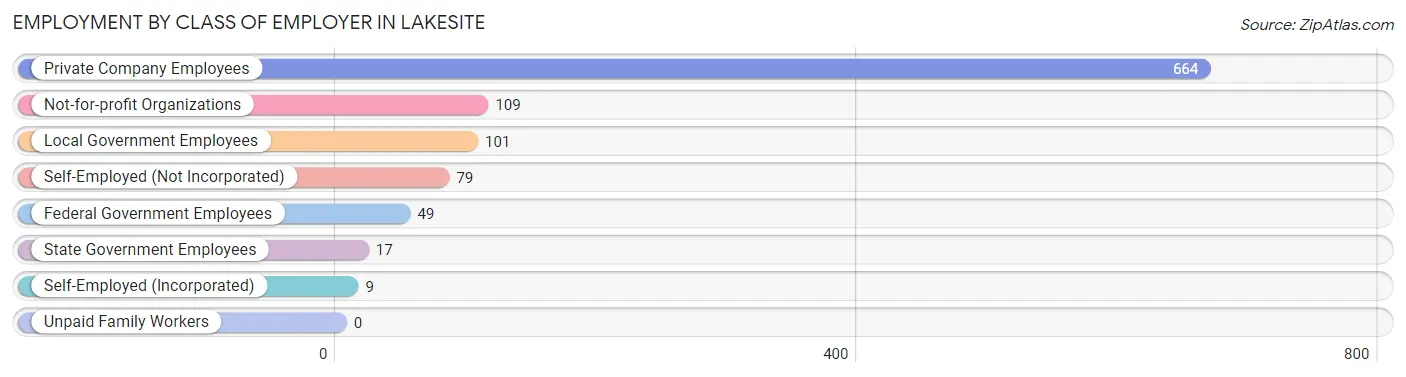
| Employer Class | # Employees | % Employees |
| Private Company Employees | 664 | 64.6% |
| Self-Employed (Incorporated) | 9 | 0.9% |
| Self-Employed (Not Incorporated) | 79 | 7.7% |
| Not-for-profit Organizations | 109 | 10.6% |
| Local Government Employees | 101 | 9.8% |
| State Government Employees | 17 | 1.7% |
| Federal Government Employees | 49 | 4.8% |
| Unpaid Family Workers | 0 | 0.0% |
| Total | 1,028 | 100.0% |
Employment Status by Age in Lakesite
According to the labor force statistics for Lakesite, out of the total population over 16 years of age (1,554), 67.4% or 1,047 individuals are in the labor force, with 1.8% or 19 of them unemployed. The age group with the highest labor force participation rate is 55 to 59 years, with 92.2% or 130 individuals in the labor force. Within the labor force, the 65 to 74 years age range has the highest percentage of unemployed individuals, with 5.1% or 4 of them being unemployed.
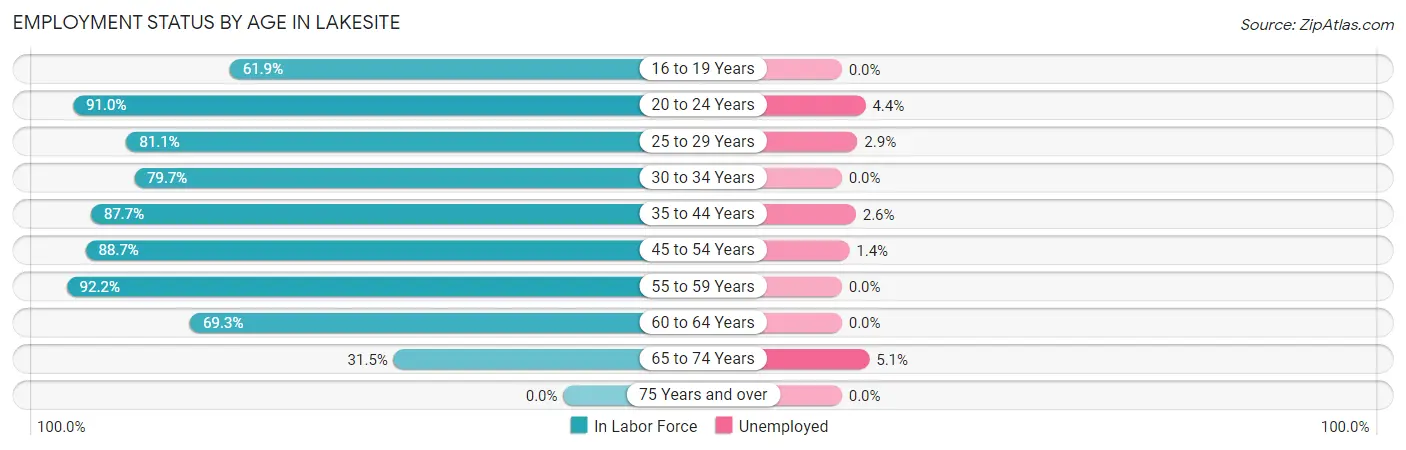
| Age Bracket | In Labor Force | Unemployed |
| 16 to 19 Years | 60 (61.9%) | 0 (0.0%) |
| 20 to 24 Years | 91 (91.0%) | 4 (4.4%) |
| 25 to 29 Years | 103 (81.1%) | 3 (2.9%) |
| 30 to 34 Years | 55 (79.7%) | 0 (0.0%) |
| 35 to 44 Years | 207 (87.7%) | 5 (2.6%) |
| 45 to 54 Years | 219 (88.7%) | 3 (1.4%) |
| 55 to 59 Years | 130 (92.2%) | 0 (0.0%) |
| 60 to 64 Years | 104 (69.3%) | 0 (0.0%) |
| 65 to 74 Years | 78 (31.5%) | 4 (5.1%) |
| 75 Years and over | 0 (0.0%) | 0 (0.0%) |
| Total | 1,047 (67.4%) | 19 (1.8%) |
Employment Status by Educational Attainment in Lakesite
According to labor force statistics for Lakesite, 84.3% of individuals (818) out of the total population between 25 and 64 years of age (970) are in the labor force, with 1.4% or 11 of them being unemployed. The group with the highest labor force participation rate are those with the educational attainment of bachelor's degree or higher, with 88.0% or 307 individuals in the labor force. Within the labor force, individuals with college / associate degree education have the highest percentage of unemployment, with 2.4% or 8 of them being unemployed.
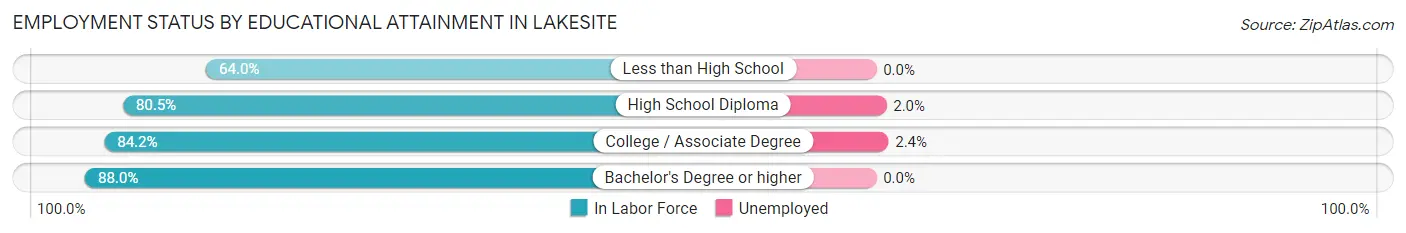
| Educational Attainment | In Labor Force | Unemployed |
| Less than High School | 16 (64.0%) | 0 (0.0%) |
| High School Diploma | 153 (80.5%) | 4 (2.0%) |
| College / Associate Degree | 342 (84.2%) | 10 (2.4%) |
| Bachelor's Degree or higher | 307 (88.0%) | 0 (0.0%) |
| Total | 818 (84.3%) | 14 (1.4%) |
Employment Occupations by Sex in Lakesite
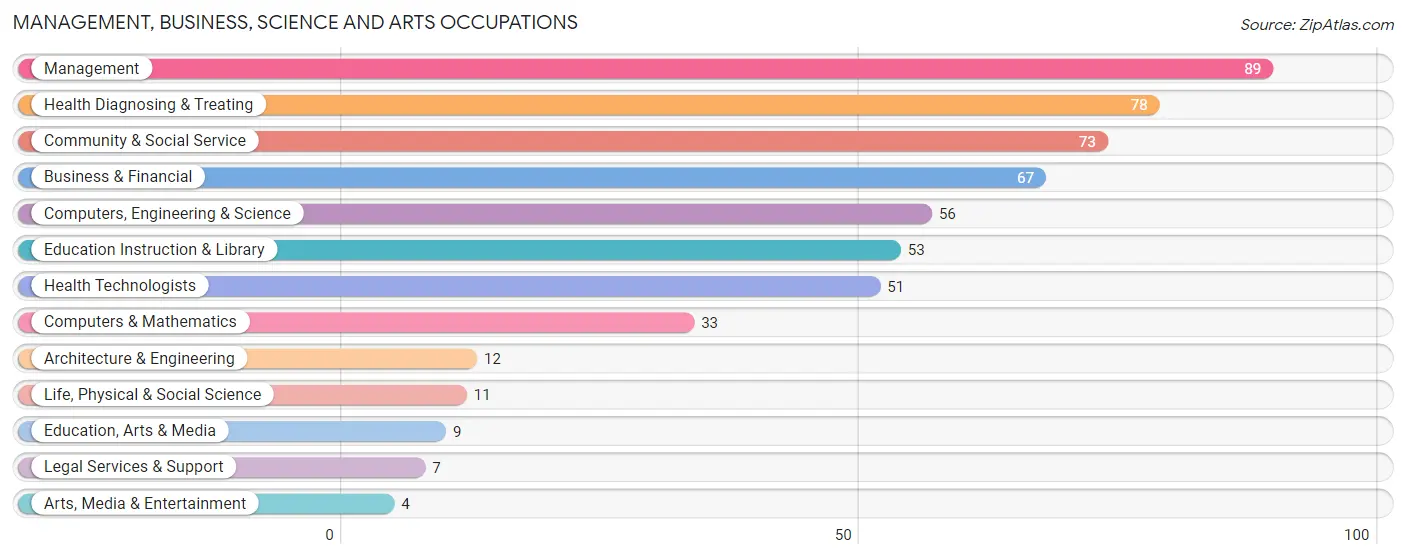
Management, Business, Science and Arts Occupations
The most common Management, Business, Science and Arts occupations in Lakesite are Management (89 | 8.8%), Health Diagnosing & Treating (78 | 7.7%), Community & Social Service (73 | 7.2%), Business & Financial (67 | 6.6%), and Computers, Engineering & Science (56 | 5.5%).
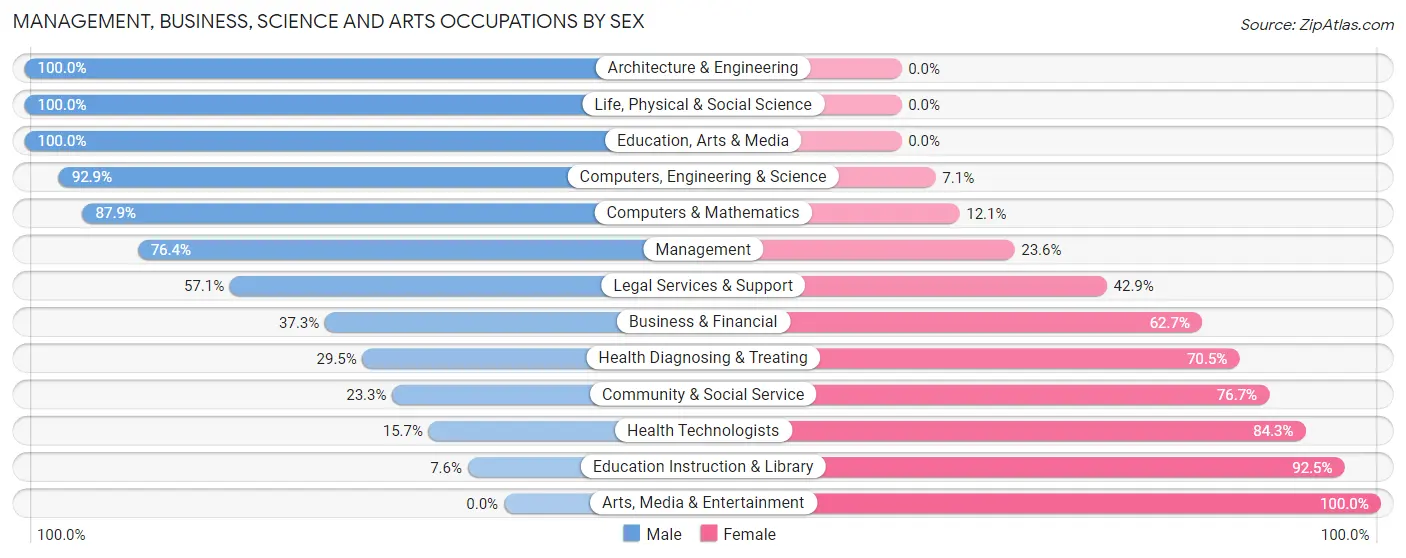
Management, Business, Science and Arts Occupations by Sex
Within the Management, Business, Science and Arts occupations in Lakesite, the most male-oriented occupations are Architecture & Engineering (100.0%), Life, Physical & Social Science (100.0%), and Education, Arts & Media (100.0%), while the most female-oriented occupations are Arts, Media & Entertainment (100.0%), Education Instruction & Library (92.4%), and Health Technologists (84.3%).
| Occupation | Male | Female |
| Management | 68 (76.4%) | 21 (23.6%) |
| Business & Financial | 25 (37.3%) | 42 (62.7%) |
| Computers, Engineering & Science | 52 (92.9%) | 4 (7.1%) |
| Computers & Mathematics | 29 (87.9%) | 4 (12.1%) |
| Architecture & Engineering | 12 (100.0%) | 0 (0.0%) |
| Life, Physical & Social Science | 11 (100.0%) | 0 (0.0%) |
| Community & Social Service | 17 (23.3%) | 56 (76.7%) |
| Education, Arts & Media | 9 (100.0%) | 0 (0.0%) |
| Legal Services & Support | 4 (57.1%) | 3 (42.9%) |
| Education Instruction & Library | 4 (7.5%) | 49 (92.4%) |
| Arts, Media & Entertainment | 0 (0.0%) | 4 (100.0%) |
| Health Diagnosing & Treating | 23 (29.5%) | 55 (70.5%) |
| Health Technologists | 8 (15.7%) | 43 (84.3%) |
| Total (Category) | 185 (51.0%) | 178 (49.0%) |
| Total (Overall) | 493 (48.5%) | 523 (51.5%) |
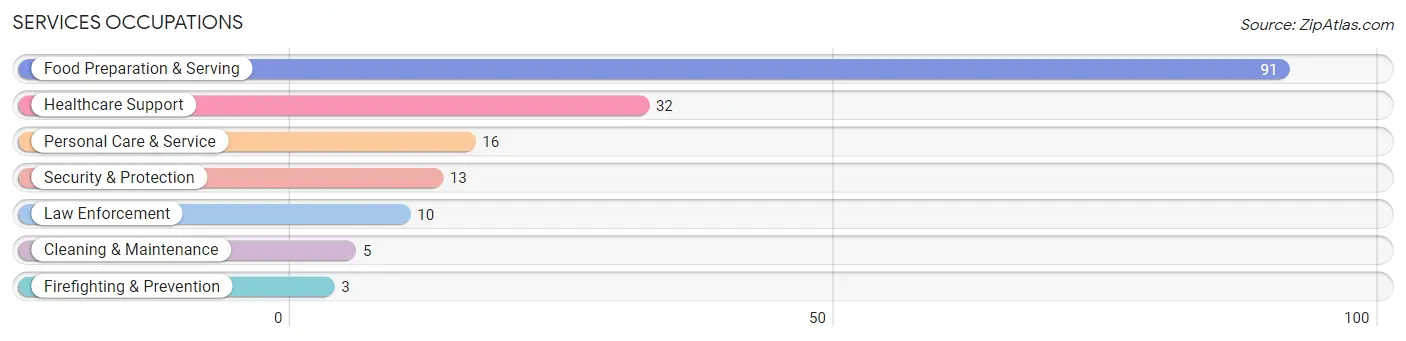
Services Occupations
The most common Services occupations in Lakesite are Food Preparation & Serving (91 | 9.0%), Healthcare Support (32 | 3.2%), Personal Care & Service (16 | 1.6%), Security & Protection (13 | 1.3%), and Law Enforcement (10 | 1.0%).
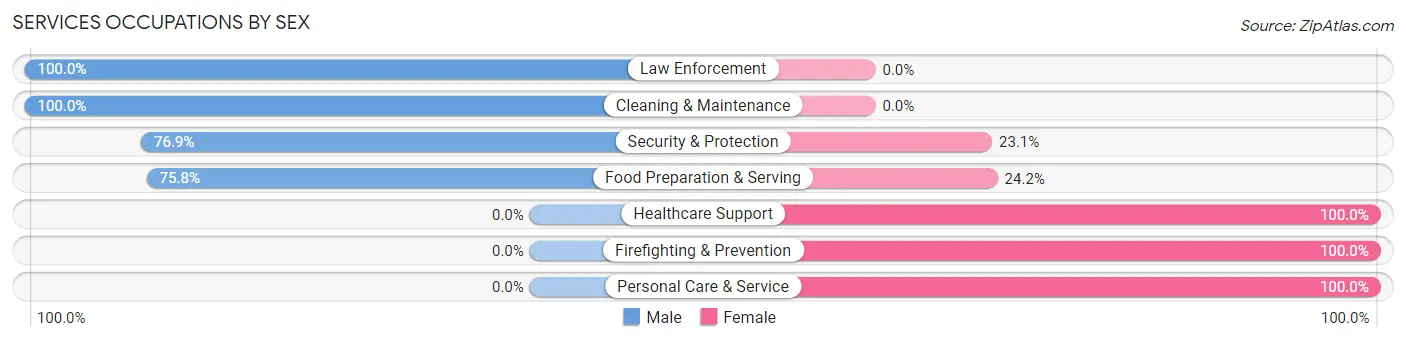
Services Occupations by Sex
Within the Services occupations in Lakesite, the most male-oriented occupations are Law Enforcement (100.0%), Cleaning & Maintenance (100.0%), and Security & Protection (76.9%), while the most female-oriented occupations are Healthcare Support (100.0%), Firefighting & Prevention (100.0%), and Personal Care & Service (100.0%).
| Occupation | Male | Female |
| Healthcare Support | 0 (0.0%) | 32 (100.0%) |
| Security & Protection | 10 (76.9%) | 3 (23.1%) |
| Firefighting & Prevention | 0 (0.0%) | 3 (100.0%) |
| Law Enforcement | 10 (100.0%) | 0 (0.0%) |
| Food Preparation & Serving | 69 (75.8%) | 22 (24.2%) |
| Cleaning & Maintenance | 5 (100.0%) | 0 (0.0%) |
| Personal Care & Service | 0 (0.0%) | 16 (100.0%) |
| Total (Category) | 84 (53.5%) | 73 (46.5%) |
| Total (Overall) | 493 (48.5%) | 523 (51.5%) |
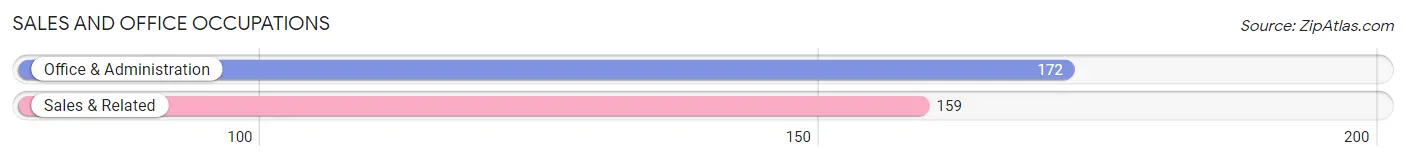
Sales and Office Occupations
The most common Sales and Office occupations in Lakesite are Office & Administration (172 | 16.9%), and Sales & Related (159 | 15.7%).
Sales and Office Occupations by Sex
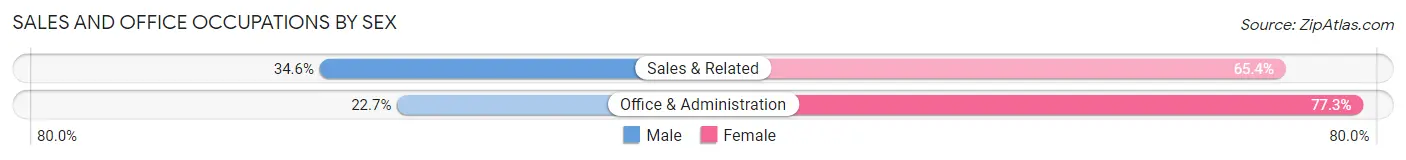
| Occupation | Male | Female |
| Sales & Related | 55 (34.6%) | 104 (65.4%) |
| Office & Administration | 39 (22.7%) | 133 (77.3%) |
| Total (Category) | 94 (28.4%) | 237 (71.6%) |
| Total (Overall) | 493 (48.5%) | 523 (51.5%) |
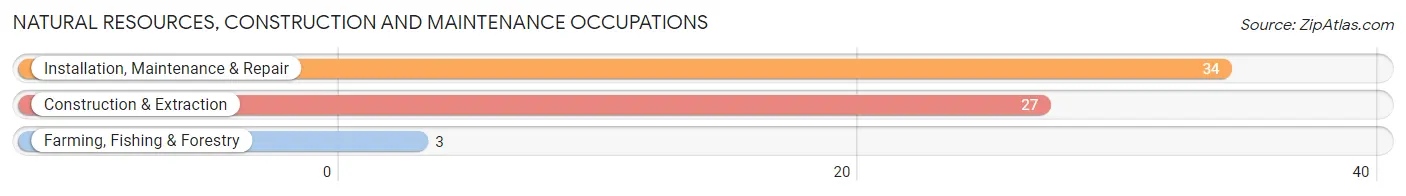
Natural Resources, Construction and Maintenance Occupations
The most common Natural Resources, Construction and Maintenance occupations in Lakesite are Installation, Maintenance & Repair (34 | 3.4%), Construction & Extraction (27 | 2.7%), and Farming, Fishing & Forestry (3 | 0.3%).
Natural Resources, Construction and Maintenance Occupations by Sex
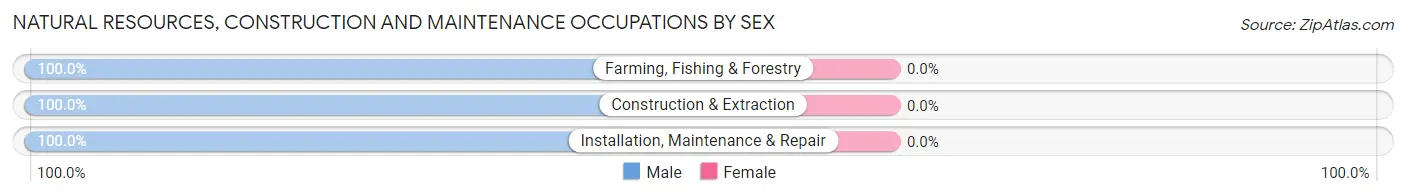
| Occupation | Male | Female |
| Farming, Fishing & Forestry | 3 (100.0%) | 0 (0.0%) |
| Construction & Extraction | 27 (100.0%) | 0 (0.0%) |
| Installation, Maintenance & Repair | 34 (100.0%) | 0 (0.0%) |
| Total (Category) | 64 (100.0%) | 0 (0.0%) |
| Total (Overall) | 493 (48.5%) | 523 (51.5%) |
Production, Transportation and Moving Occupations
The most common Production, Transportation and Moving occupations in Lakesite are Transportation (53 | 5.2%), and Production (48 | 4.7%).
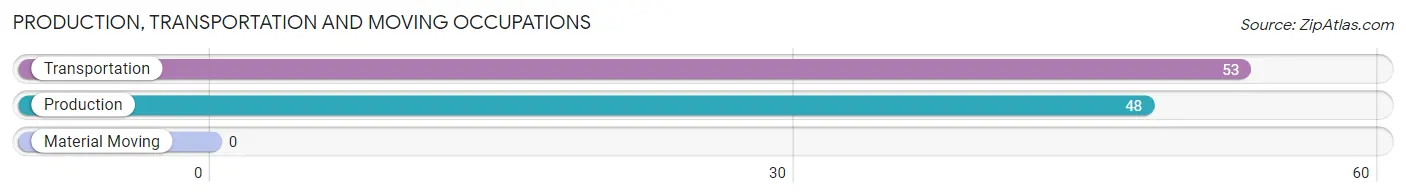
Production, Transportation and Moving Occupations by Sex
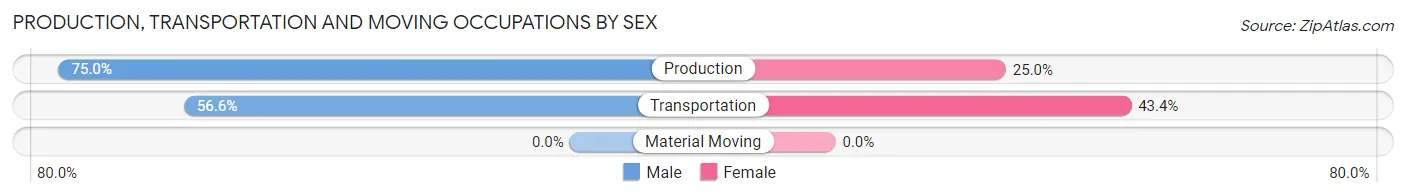
| Occupation | Male | Female |
| Production | 36 (75.0%) | 12 (25.0%) |
| Transportation | 30 (56.6%) | 23 (43.4%) |
| Material Moving | 0 (0.0%) | 0 (0.0%) |
| Total (Category) | 66 (65.3%) | 35 (34.6%) |
| Total (Overall) | 493 (48.5%) | 523 (51.5%) |
Employment Industries by Sex in Lakesite
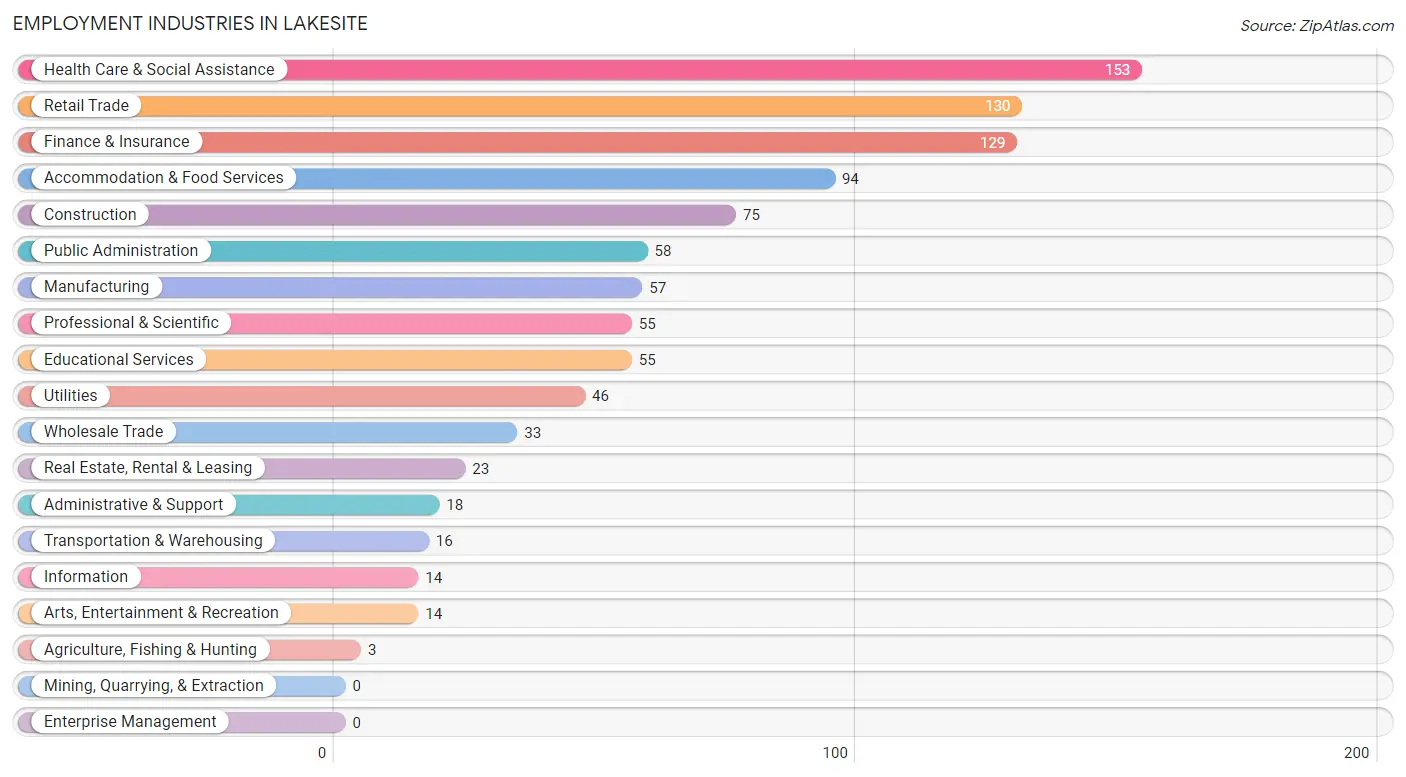
Employment Industries in Lakesite
The major employment industries in Lakesite include Health Care & Social Assistance (153 | 15.1%), Retail Trade (130 | 12.8%), Finance & Insurance (129 | 12.7%), Accommodation & Food Services (94 | 9.2%), and Construction (75 | 7.4%).
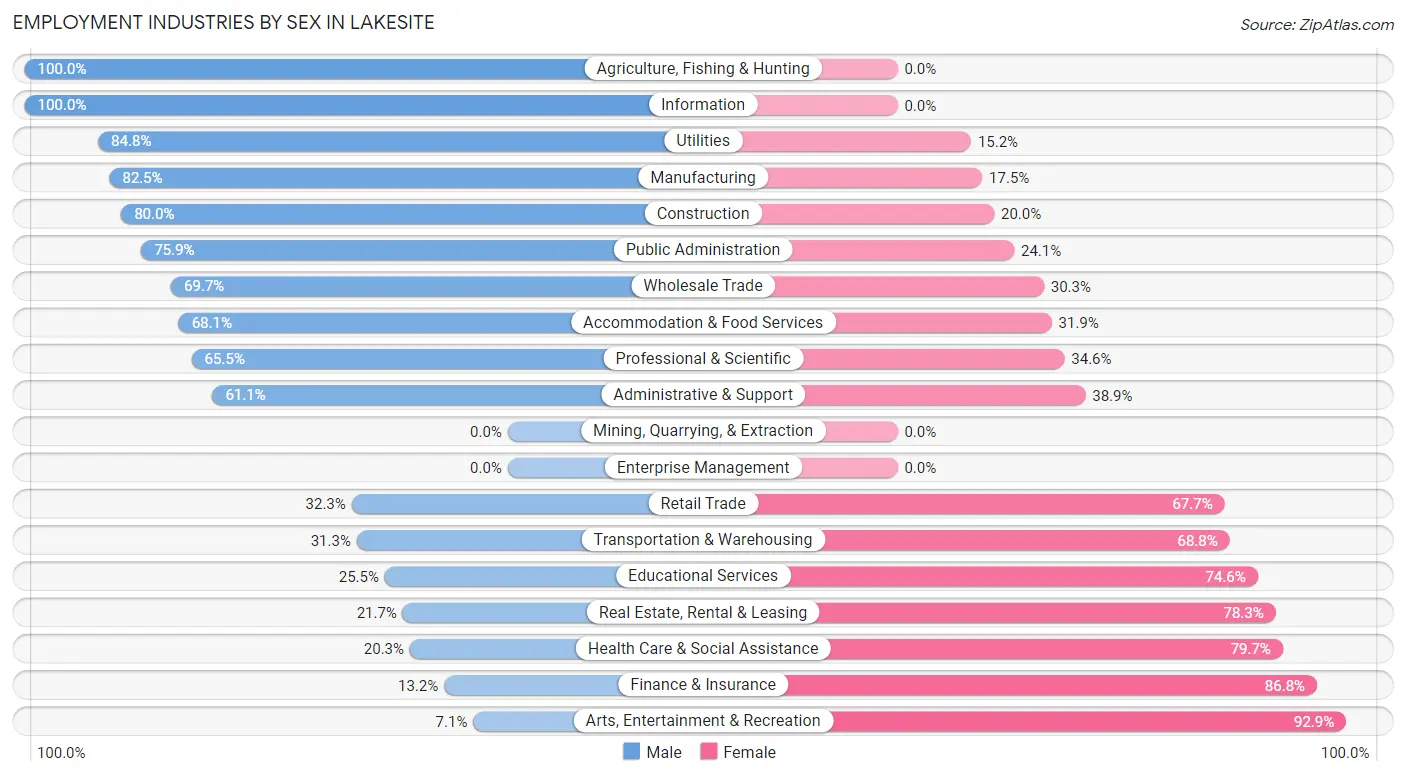
Employment Industries by Sex in Lakesite
The Lakesite industries that see more men than women are Agriculture, Fishing & Hunting (100.0%), Information (100.0%), and Utilities (84.8%), whereas the industries that tend to have a higher number of women are Arts, Entertainment & Recreation (92.9%), Finance & Insurance (86.8%), and Health Care & Social Assistance (79.7%).
| Industry | Male | Female |
| Agriculture, Fishing & Hunting | 3 (100.0%) | 0 (0.0%) |
| Mining, Quarrying, & Extraction | 0 (0.0%) | 0 (0.0%) |
| Construction | 60 (80.0%) | 15 (20.0%) |
| Manufacturing | 47 (82.5%) | 10 (17.5%) |
| Wholesale Trade | 23 (69.7%) | 10 (30.3%) |
| Retail Trade | 42 (32.3%) | 88 (67.7%) |
| Transportation & Warehousing | 5 (31.2%) | 11 (68.8%) |
| Utilities | 39 (84.8%) | 7 (15.2%) |
| Information | 14 (100.0%) | 0 (0.0%) |
| Finance & Insurance | 17 (13.2%) | 112 (86.8%) |
| Real Estate, Rental & Leasing | 5 (21.7%) | 18 (78.3%) |
| Professional & Scientific | 36 (65.4%) | 19 (34.5%) |
| Enterprise Management | 0 (0.0%) | 0 (0.0%) |
| Administrative & Support | 11 (61.1%) | 7 (38.9%) |
| Educational Services | 14 (25.5%) | 41 (74.6%) |
| Health Care & Social Assistance | 31 (20.3%) | 122 (79.7%) |
| Arts, Entertainment & Recreation | 1 (7.1%) | 13 (92.9%) |
| Accommodation & Food Services | 64 (68.1%) | 30 (31.9%) |
| Public Administration | 44 (75.9%) | 14 (24.1%) |
| Total | 493 (48.5%) | 523 (51.5%) |
Education in Lakesite
School Enrollment in Lakesite
The most common levels of schooling among the 489 students in Lakesite are elementary school (138 | 28.2%), high school (117 | 23.9%), and middle school (98 | 20.0%).
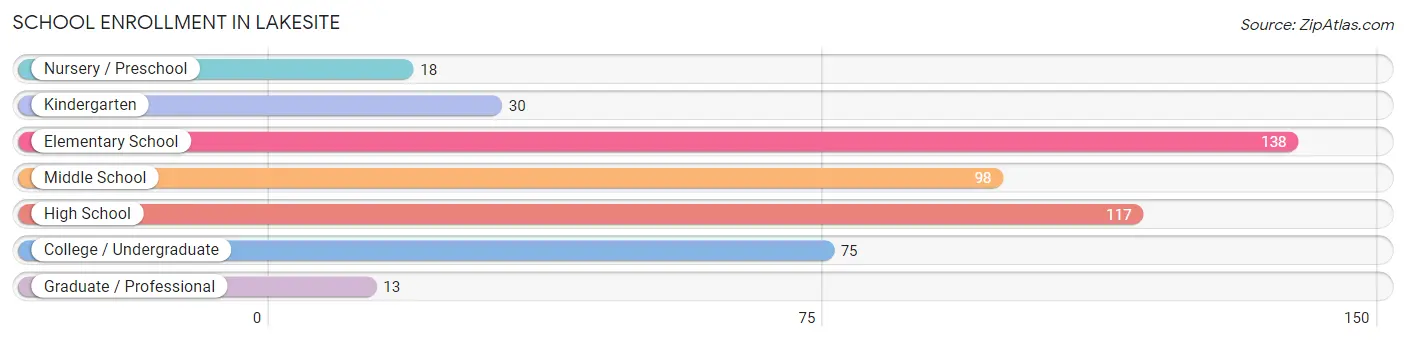
| School Level | # Students | % Students |
| Nursery / Preschool | 18 | 3.7% |
| Kindergarten | 30 | 6.1% |
| Elementary School | 138 | 28.2% |
| Middle School | 98 | 20.0% |
| High School | 117 | 23.9% |
| College / Undergraduate | 75 | 15.3% |
| Graduate / Professional | 13 | 2.7% |
| Total | 489 | 100.0% |
School Enrollment by Age by Funding Source in Lakesite
Out of a total of 489 students who are enrolled in schools in Lakesite, 42 (8.6%) attend a private institution, while the remaining 447 (91.4%) are enrolled in public schools. The age group of 3 to 4 year olds has the highest likelihood of being enrolled in private schools, with 12 (92.3% in the age bracket) enrolled. Conversely, the age group of 18 to 19 year olds has the lowest likelihood of being enrolled in a private school, with 22 (100.0% in the age bracket) attending a public institution.
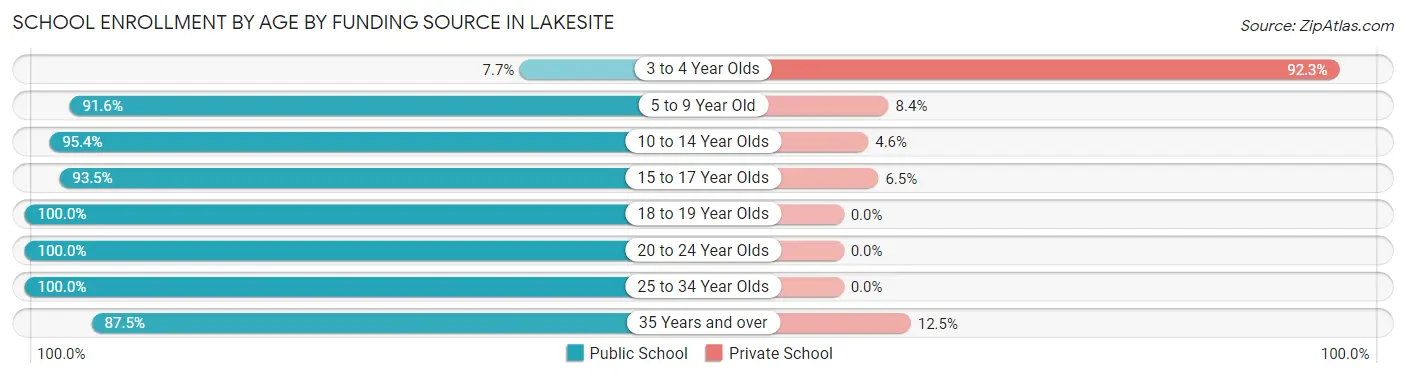
| Age Bracket | Public School | Private School |
| 3 to 4 Year Olds | 1 (7.7%) | 12 (92.3%) |
| 5 to 9 Year Old | 153 (91.6%) | 14 (8.4%) |
| 10 to 14 Year Olds | 104 (95.4%) | 5 (4.6%) |
| 15 to 17 Year Olds | 101 (93.5%) | 7 (6.5%) |
| 18 to 19 Year Olds | 22 (100.0%) | 0 (0.0%) |
| 20 to 24 Year Olds | 28 (100.0%) | 0 (0.0%) |
| 25 to 34 Year Olds | 10 (100.0%) | 0 (0.0%) |
| 35 Years and over | 28 (87.5%) | 4 (12.5%) |
| Total | 447 (91.4%) | 42 (8.6%) |
Educational Attainment by Field of Study in Lakesite
Business (124 | 23.8%), education (76 | 14.6%), science & technology (64 | 12.3%), arts & humanities (58 | 11.1%), and engineering (42 | 8.1%) are the most common fields of study among 521 individuals in Lakesite who have obtained a bachelor's degree or higher.
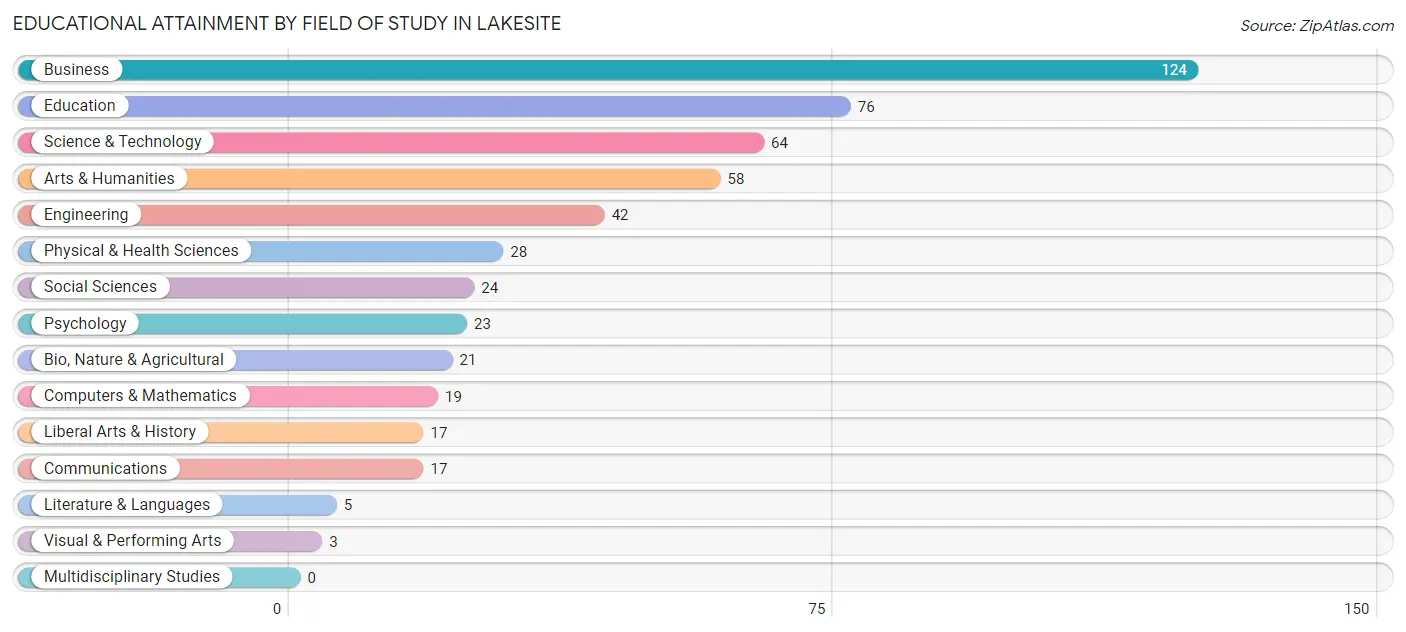
| Field of Study | # Graduates | % Graduates |
| Computers & Mathematics | 19 | 3.6% |
| Bio, Nature & Agricultural | 21 | 4.0% |
| Physical & Health Sciences | 28 | 5.4% |
| Psychology | 23 | 4.4% |
| Social Sciences | 24 | 4.6% |
| Engineering | 42 | 8.1% |
| Multidisciplinary Studies | 0 | 0.0% |
| Science & Technology | 64 | 12.3% |
| Business | 124 | 23.8% |
| Education | 76 | 14.6% |
| Literature & Languages | 5 | 1.0% |
| Liberal Arts & History | 17 | 3.3% |
| Visual & Performing Arts | 3 | 0.6% |
| Communications | 17 | 3.3% |
| Arts & Humanities | 58 | 11.1% |
| Total | 521 | 100.0% |
Transportation & Commute in Lakesite
Vehicle Availability by Sex in Lakesite
The most prevalent vehicle ownership categories in Lakesite are males with 2 vehicles (207, accounting for 41.0%) and females with 2 vehicles (161, making up 39.6%).
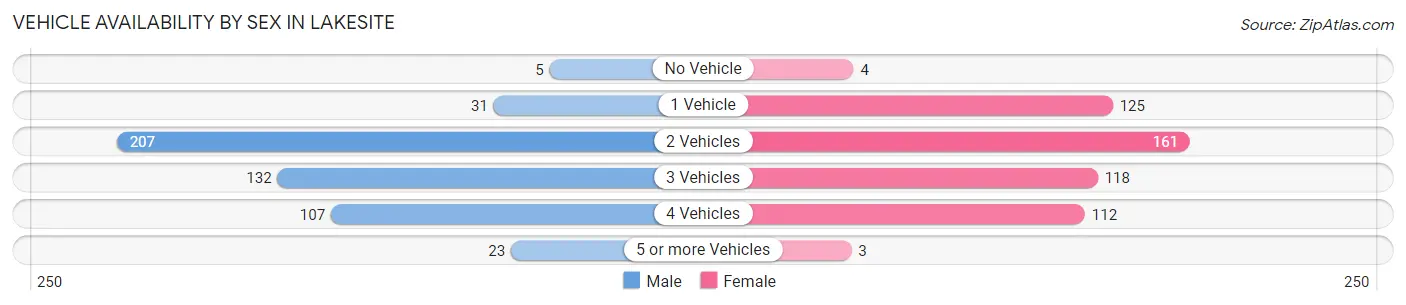
| Vehicles Available | Male | Female |
| No Vehicle | 5 (1.0%) | 4 (0.8%) |
| 1 Vehicle | 31 (6.1%) | 125 (23.9%) |
| 2 Vehicles | 207 (41.0%) | 161 (30.8%) |
| 3 Vehicles | 132 (26.1%) | 118 (22.6%) |
| 4 Vehicles | 107 (21.2%) | 112 (21.4%) |
| 5 or more Vehicles | 23 (4.5%) | 3 (0.6%) |
| Total | 505 (100.0%) | 523 (100.0%) |
Commute Time in Lakesite
The most frequently occuring commute durations in Lakesite are 30 to 34 minutes (259 commuters, 29.3%), 25 to 29 minutes (159 commuters, 18.0%), and 45 to 59 minutes (87 commuters, 9.9%).
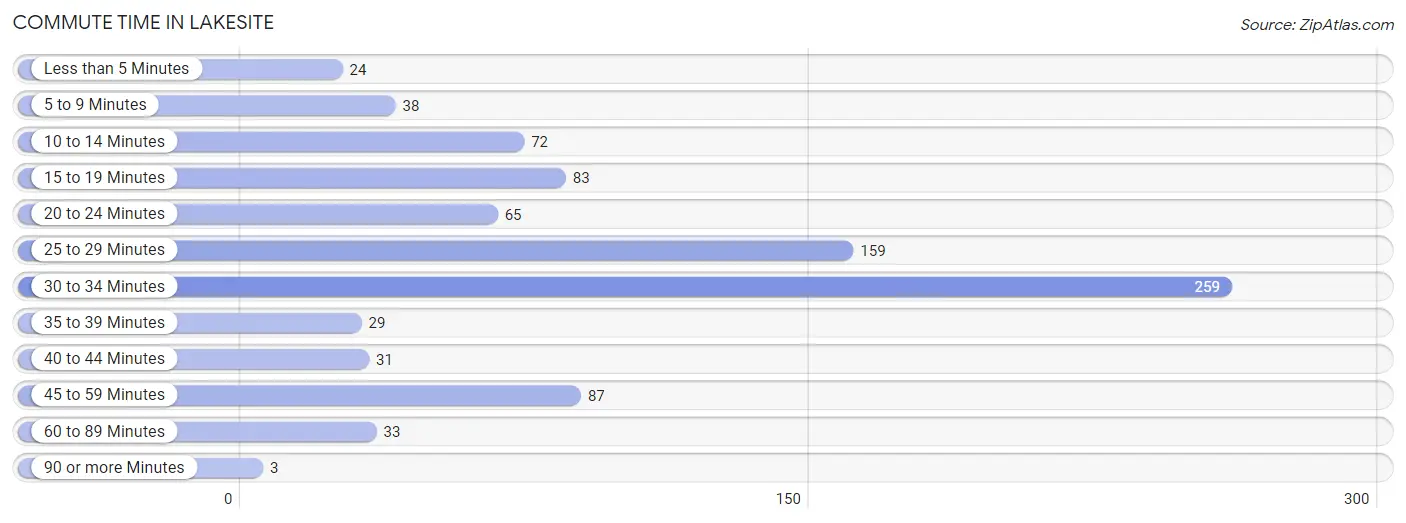
| Commute Time | # Commuters | % Commuters |
| Less than 5 Minutes | 24 | 2.7% |
| 5 to 9 Minutes | 38 | 4.3% |
| 10 to 14 Minutes | 72 | 8.2% |
| 15 to 19 Minutes | 83 | 9.4% |
| 20 to 24 Minutes | 65 | 7.4% |
| 25 to 29 Minutes | 159 | 18.0% |
| 30 to 34 Minutes | 259 | 29.3% |
| 35 to 39 Minutes | 29 | 3.3% |
| 40 to 44 Minutes | 31 | 3.5% |
| 45 to 59 Minutes | 87 | 9.9% |
| 60 to 89 Minutes | 33 | 3.7% |
| 90 or more Minutes | 3 | 0.3% |
Commute Time by Sex in Lakesite
The most common commute times in Lakesite are 30 to 34 minutes (116 commuters, 25.9%) for males and 30 to 34 minutes (143 commuters, 32.9%) for females.
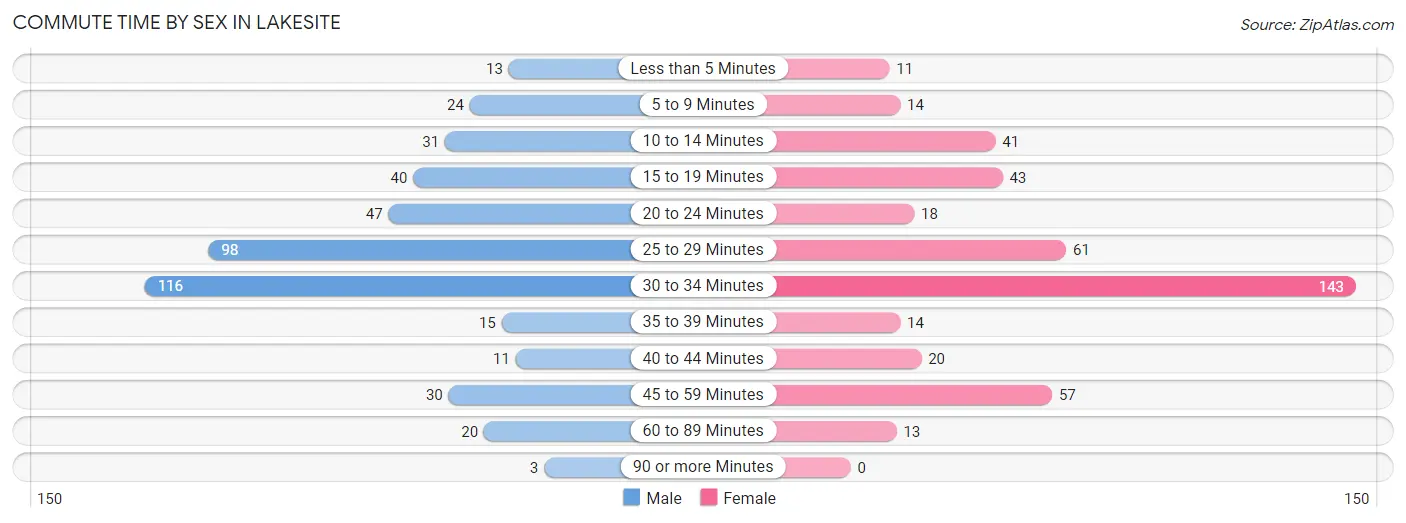
| Commute Time | Male | Female |
| Less than 5 Minutes | 13 (2.9%) | 11 (2.5%) |
| 5 to 9 Minutes | 24 (5.4%) | 14 (3.2%) |
| 10 to 14 Minutes | 31 (6.9%) | 41 (9.4%) |
| 15 to 19 Minutes | 40 (8.9%) | 43 (9.9%) |
| 20 to 24 Minutes | 47 (10.5%) | 18 (4.1%) |
| 25 to 29 Minutes | 98 (21.9%) | 61 (14.0%) |
| 30 to 34 Minutes | 116 (25.9%) | 143 (32.9%) |
| 35 to 39 Minutes | 15 (3.4%) | 14 (3.2%) |
| 40 to 44 Minutes | 11 (2.5%) | 20 (4.6%) |
| 45 to 59 Minutes | 30 (6.7%) | 57 (13.1%) |
| 60 to 89 Minutes | 20 (4.5%) | 13 (3.0%) |
| 90 or more Minutes | 3 (0.7%) | 0 (0.0%) |
Time of Departure to Work by Sex in Lakesite
The most frequent times of departure to work in Lakesite are 6:00 AM to 6:29 AM (77, 17.2%) for males and 7:00 AM to 7:29 AM (64, 14.7%) for females.
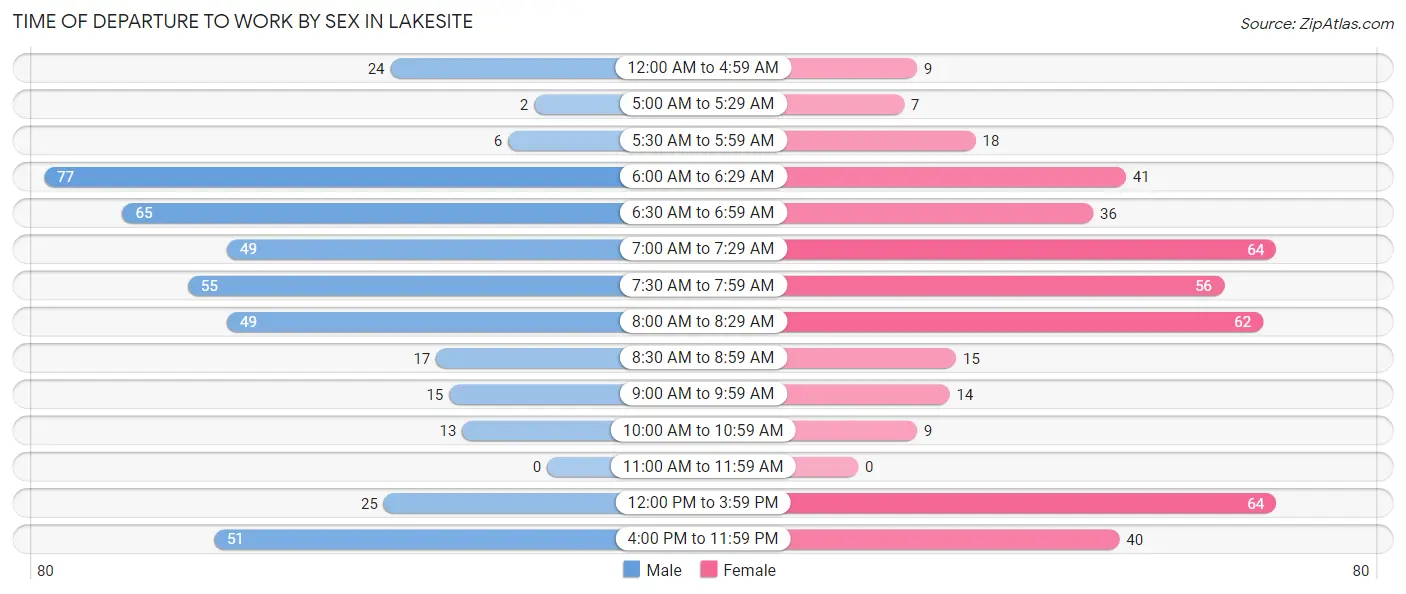
| Time of Departure | Male | Female |
| 12:00 AM to 4:59 AM | 24 (5.4%) | 9 (2.1%) |
| 5:00 AM to 5:29 AM | 2 (0.4%) | 7 (1.6%) |
| 5:30 AM to 5:59 AM | 6 (1.3%) | 18 (4.1%) |
| 6:00 AM to 6:29 AM | 77 (17.2%) | 41 (9.4%) |
| 6:30 AM to 6:59 AM | 65 (14.5%) | 36 (8.3%) |
| 7:00 AM to 7:29 AM | 49 (10.9%) | 64 (14.7%) |
| 7:30 AM to 7:59 AM | 55 (12.3%) | 56 (12.9%) |
| 8:00 AM to 8:29 AM | 49 (10.9%) | 62 (14.2%) |
| 8:30 AM to 8:59 AM | 17 (3.8%) | 15 (3.5%) |
| 9:00 AM to 9:59 AM | 15 (3.4%) | 14 (3.2%) |
| 10:00 AM to 10:59 AM | 13 (2.9%) | 9 (2.1%) |
| 11:00 AM to 11:59 AM | 0 (0.0%) | 0 (0.0%) |
| 12:00 PM to 3:59 PM | 25 (5.6%) | 64 (14.7%) |
| 4:00 PM to 11:59 PM | 51 (11.4%) | 40 (9.2%) |
| Total | 448 (100.0%) | 435 (100.0%) |
Housing Occupancy in Lakesite
Occupancy by Ownership in Lakesite
Of the total 745 dwellings in Lakesite, owner-occupied units account for 636 (85.4%), while renter-occupied units make up 109 (14.6%).
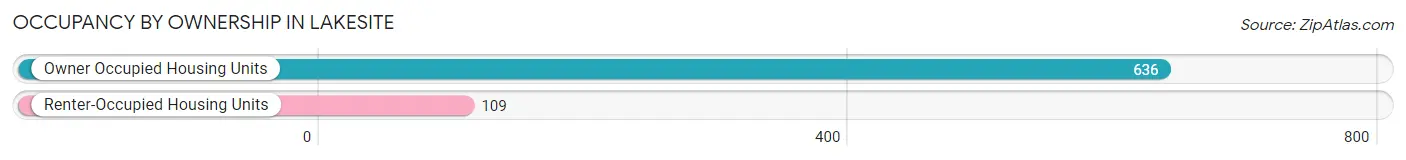
| Occupancy | # Housing Units | % Housing Units |
| Owner Occupied Housing Units | 636 | 85.4% |
| Renter-Occupied Housing Units | 109 | 14.6% |
| Total Occupied Housing Units | 745 | 100.0% |
Occupancy by Household Size in Lakesite
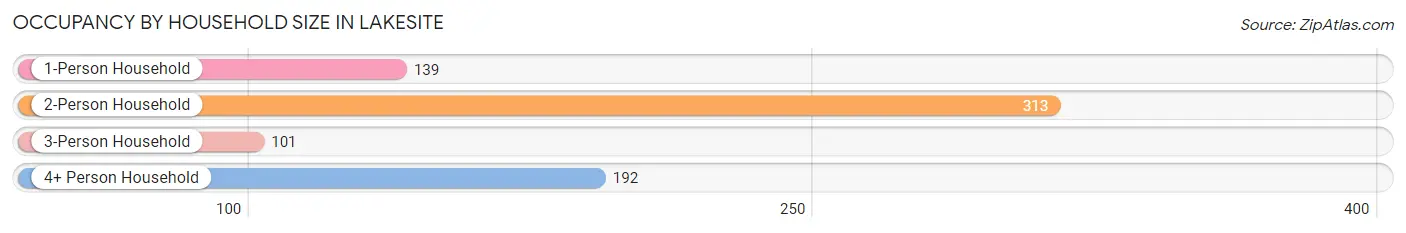
| Household Size | # Housing Units | % Housing Units |
| 1-Person Household | 139 | 18.7% |
| 2-Person Household | 313 | 42.0% |
| 3-Person Household | 101 | 13.6% |
| 4+ Person Household | 192 | 25.8% |
| Total Housing Units | 745 | 100.0% |
Occupancy by Ownership by Household Size in Lakesite
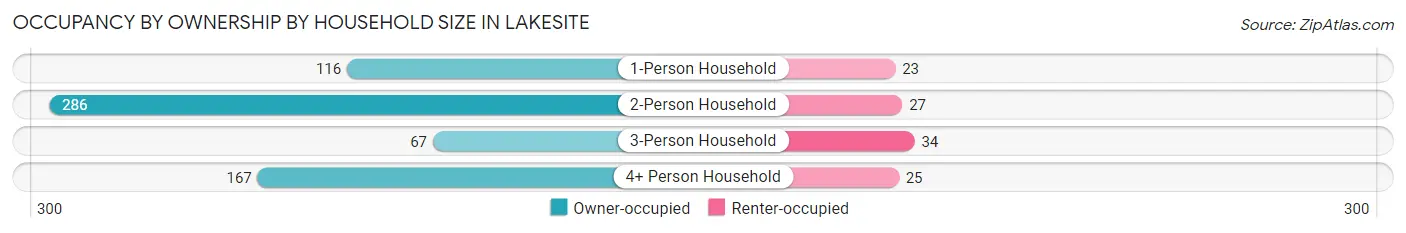
| Household Size | Owner-occupied | Renter-occupied |
| 1-Person Household | 116 (83.5%) | 23 (16.6%) |
| 2-Person Household | 286 (91.4%) | 27 (8.6%) |
| 3-Person Household | 67 (66.3%) | 34 (33.7%) |
| 4+ Person Household | 167 (87.0%) | 25 (13.0%) |
| Total Housing Units | 636 (85.4%) | 109 (14.6%) |
Occupancy by Educational Attainment in Lakesite
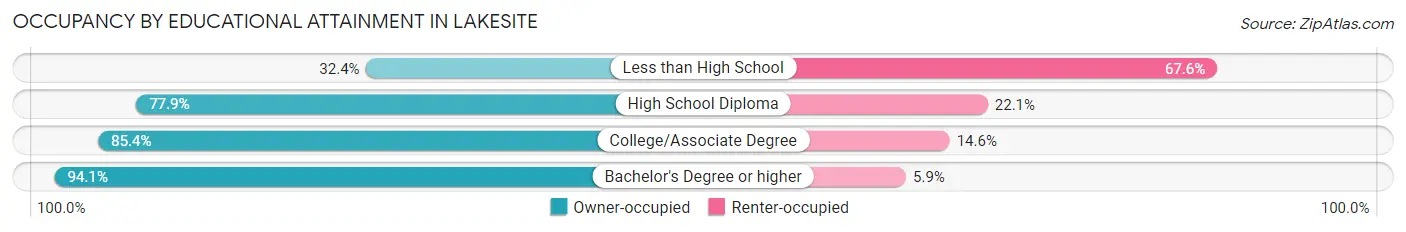
| Household Size | Owner-occupied | Renter-occupied |
| Less than High School | 12 (32.4%) | 25 (67.6%) |
| High School Diploma | 102 (77.9%) | 29 (22.1%) |
| College/Associate Degree | 205 (85.4%) | 35 (14.6%) |
| Bachelor's Degree or higher | 317 (94.1%) | 20 (5.9%) |
Occupancy by Age of Householder in Lakesite
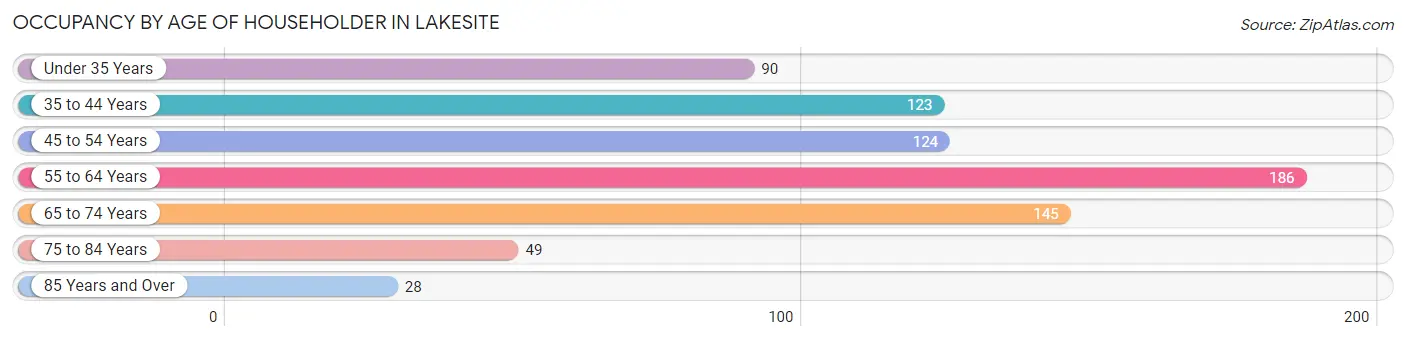
| Age Bracket | # Households | % Households |
| Under 35 Years | 90 | 12.1% |
| 35 to 44 Years | 123 | 16.5% |
| 45 to 54 Years | 124 | 16.6% |
| 55 to 64 Years | 186 | 25.0% |
| 65 to 74 Years | 145 | 19.5% |
| 75 to 84 Years | 49 | 6.6% |
| 85 Years and Over | 28 | 3.8% |
| Total | 745 | 100.0% |
Housing Finances in Lakesite
Median Income by Occupancy in Lakesite
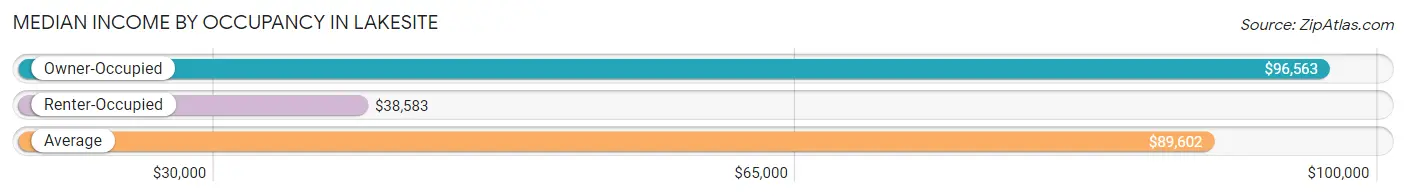
| Occupancy Type | # Households | Median Income |
| Owner-Occupied | 636 (85.4%) | $96,563 |
| Renter-Occupied | 109 (14.6%) | $38,583 |
| Average | 745 (100.0%) | $89,602 |
Occupancy by Householder Income Bracket in Lakesite
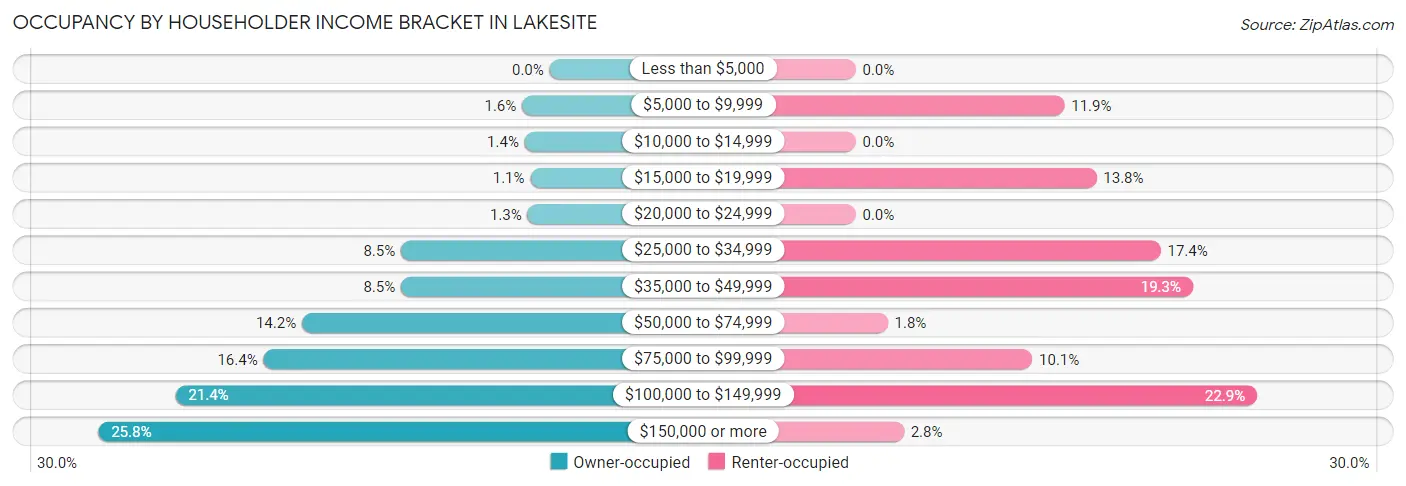
| Income Bracket | Owner-occupied | Renter-occupied |
| Less than $5,000 | 0 (0.0%) | 0 (0.0%) |
| $5,000 to $9,999 | 10 (1.6%) | 13 (11.9%) |
| $10,000 to $14,999 | 9 (1.4%) | 0 (0.0%) |
| $15,000 to $19,999 | 7 (1.1%) | 15 (13.8%) |
| $20,000 to $24,999 | 8 (1.3%) | 0 (0.0%) |
| $25,000 to $34,999 | 54 (8.5%) | 19 (17.4%) |
| $35,000 to $49,999 | 54 (8.5%) | 21 (19.3%) |
| $50,000 to $74,999 | 90 (14.1%) | 2 (1.8%) |
| $75,000 to $99,999 | 104 (16.4%) | 11 (10.1%) |
| $100,000 to $149,999 | 136 (21.4%) | 25 (22.9%) |
| $150,000 or more | 164 (25.8%) | 3 (2.8%) |
| Total | 636 (100.0%) | 109 (100.0%) |
Monthly Housing Cost Tiers in Lakesite
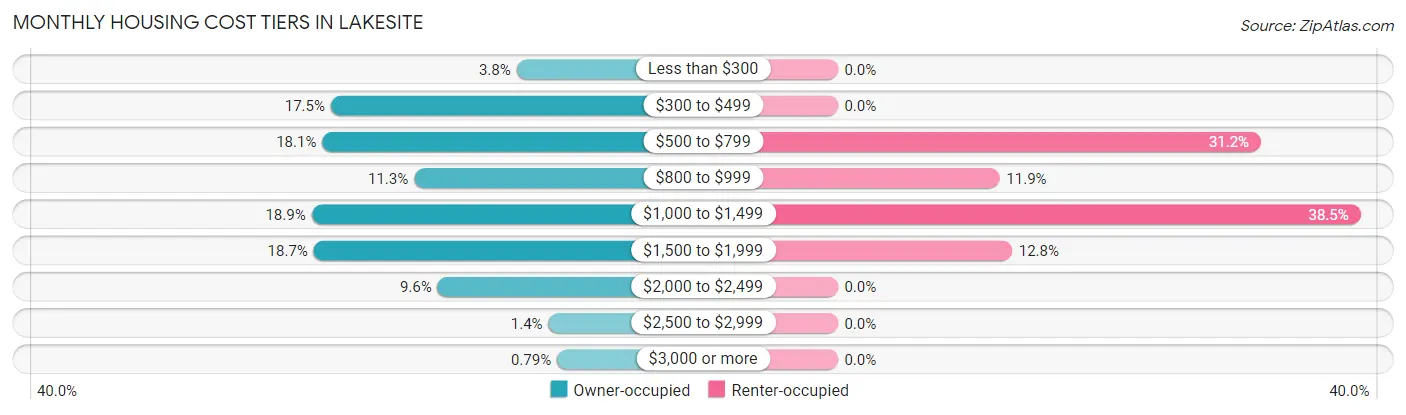
| Monthly Cost | Owner-occupied | Renter-occupied |
| Less than $300 | 24 (3.8%) | 0 (0.0%) |
| $300 to $499 | 111 (17.4%) | 0 (0.0%) |
| $500 to $799 | 115 (18.1%) | 34 (31.2%) |
| $800 to $999 | 72 (11.3%) | 13 (11.9%) |
| $1,000 to $1,499 | 120 (18.9%) | 42 (38.5%) |
| $1,500 to $1,999 | 119 (18.7%) | 14 (12.8%) |
| $2,000 to $2,499 | 61 (9.6%) | 0 (0.0%) |
| $2,500 to $2,999 | 9 (1.4%) | 0 (0.0%) |
| $3,000 or more | 5 (0.8%) | 0 (0.0%) |
| Total | 636 (100.0%) | 109 (100.0%) |
Physical Housing Characteristics in Lakesite
Housing Structures in Lakesite
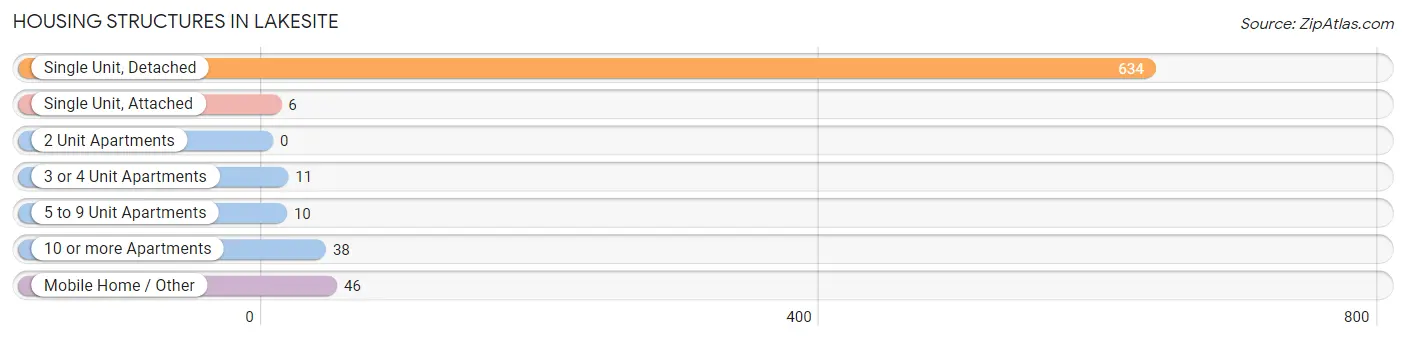
| Structure Type | # Housing Units | % Housing Units |
| Single Unit, Detached | 634 | 85.1% |
| Single Unit, Attached | 6 | 0.8% |
| 2 Unit Apartments | 0 | 0.0% |
| 3 or 4 Unit Apartments | 11 | 1.5% |
| 5 to 9 Unit Apartments | 10 | 1.3% |
| 10 or more Apartments | 38 | 5.1% |
| Mobile Home / Other | 46 | 6.2% |
| Total | 745 | 100.0% |
Housing Structures by Occupancy in Lakesite
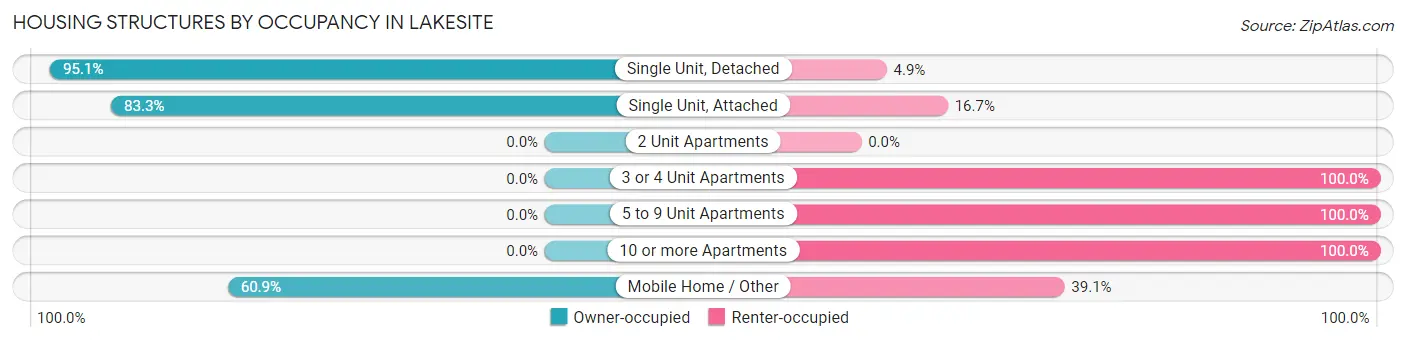
| Structure Type | Owner-occupied | Renter-occupied |
| Single Unit, Detached | 603 (95.1%) | 31 (4.9%) |
| Single Unit, Attached | 5 (83.3%) | 1 (16.7%) |
| 2 Unit Apartments | 0 (0.0%) | 0 (0.0%) |
| 3 or 4 Unit Apartments | 0 (0.0%) | 11 (100.0%) |
| 5 to 9 Unit Apartments | 0 (0.0%) | 10 (100.0%) |
| 10 or more Apartments | 0 (0.0%) | 38 (100.0%) |
| Mobile Home / Other | 28 (60.9%) | 18 (39.1%) |
| Total | 636 (85.4%) | 109 (14.6%) |
Housing Structures by Number of Rooms in Lakesite
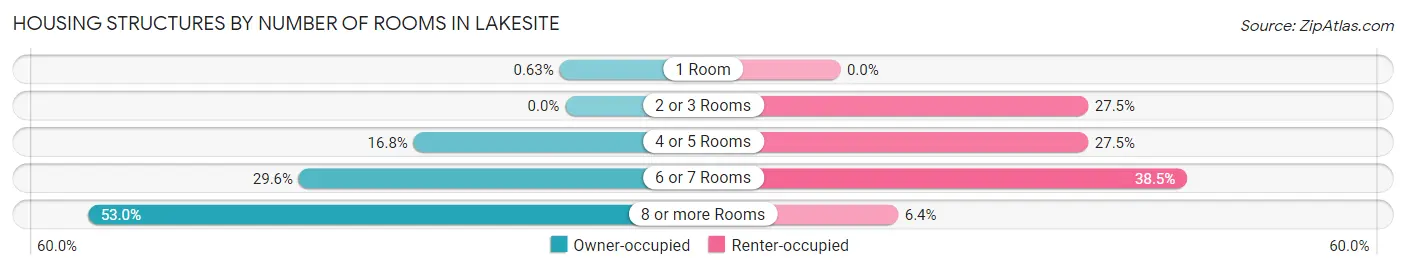
| Number of Rooms | Owner-occupied | Renter-occupied |
| 1 Room | 4 (0.6%) | 0 (0.0%) |
| 2 or 3 Rooms | 0 (0.0%) | 30 (27.5%) |
| 4 or 5 Rooms | 107 (16.8%) | 30 (27.5%) |
| 6 or 7 Rooms | 188 (29.6%) | 42 (38.5%) |
| 8 or more Rooms | 337 (53.0%) | 7 (6.4%) |
| Total | 636 (100.0%) | 109 (100.0%) |
Housing Structure by Heating Type in Lakesite
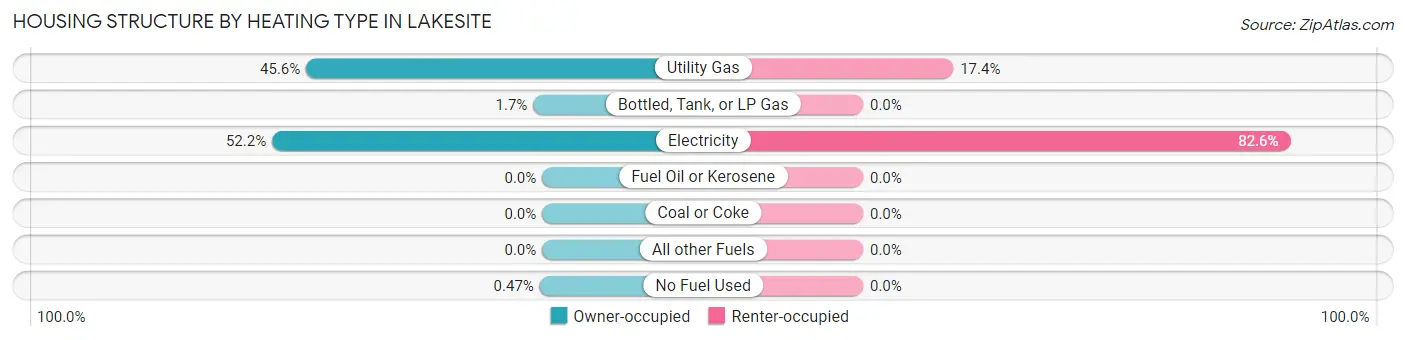
| Heating Type | Owner-occupied | Renter-occupied |
| Utility Gas | 290 (45.6%) | 19 (17.4%) |
| Bottled, Tank, or LP Gas | 11 (1.7%) | 0 (0.0%) |
| Electricity | 332 (52.2%) | 90 (82.6%) |
| Fuel Oil or Kerosene | 0 (0.0%) | 0 (0.0%) |
| Coal or Coke | 0 (0.0%) | 0 (0.0%) |
| All other Fuels | 0 (0.0%) | 0 (0.0%) |
| No Fuel Used | 3 (0.5%) | 0 (0.0%) |
| Total | 636 (100.0%) | 109 (100.0%) |
Household Vehicle Usage in Lakesite
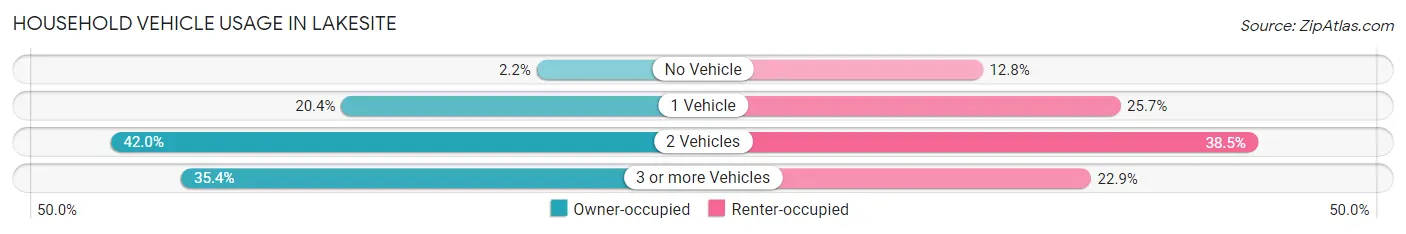
| Vehicles per Household | Owner-occupied | Renter-occupied |
| No Vehicle | 14 (2.2%) | 14 (12.8%) |
| 1 Vehicle | 130 (20.4%) | 28 (25.7%) |
| 2 Vehicles | 267 (42.0%) | 42 (38.5%) |
| 3 or more Vehicles | 225 (35.4%) | 25 (22.9%) |
| Total | 636 (100.0%) | 109 (100.0%) |
Real Estate & Mortgages in Lakesite
Real Estate and Mortgage Overview in Lakesite
| Characteristic | Without Mortgage | With Mortgage |
| Housing Units | 246 | 390 |
| Median Property Value | $314,300 | $245,000 |
| Median Household Income | $108,750 | $56 |
| Monthly Housing Costs | $493 | $5 |
| Real Estate Taxes | $1,816 | $5 |
Property Value by Mortgage Status in Lakesite
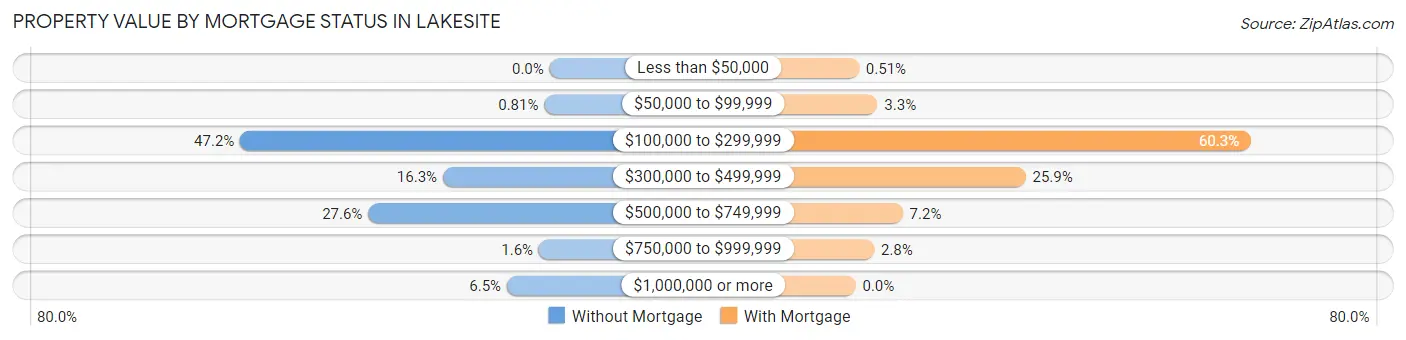
| Property Value | Without Mortgage | With Mortgage |
| Less than $50,000 | 0 (0.0%) | 2 (0.5%) |
| $50,000 to $99,999 | 2 (0.8%) | 13 (3.3%) |
| $100,000 to $299,999 | 116 (47.1%) | 235 (60.3%) |
| $300,000 to $499,999 | 40 (16.3%) | 101 (25.9%) |
| $500,000 to $749,999 | 68 (27.6%) | 28 (7.2%) |
| $750,000 to $999,999 | 4 (1.6%) | 11 (2.8%) |
| $1,000,000 or more | 16 (6.5%) | 0 (0.0%) |
| Total | 246 (100.0%) | 390 (100.0%) |
Household Income by Mortgage Status in Lakesite
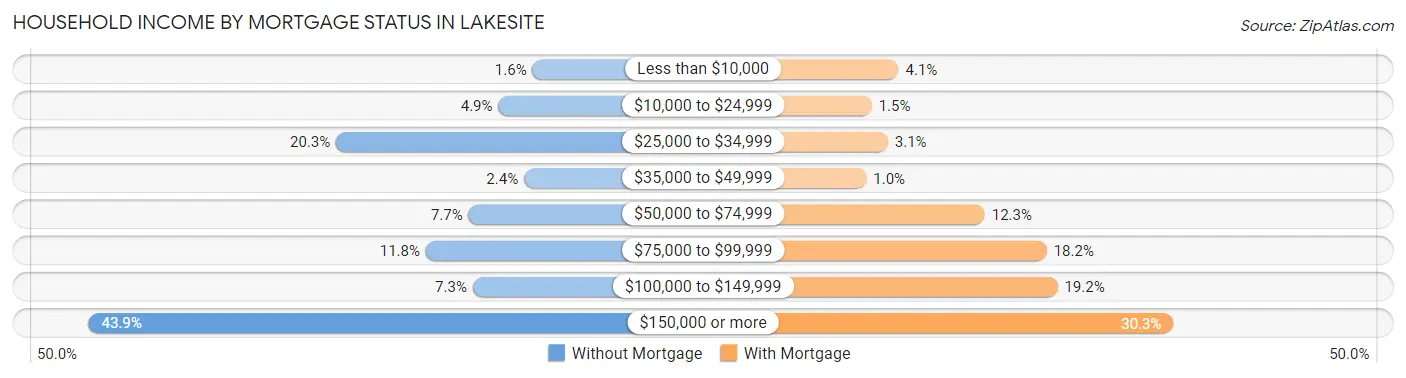
| Household Income | Without Mortgage | With Mortgage |
| Less than $10,000 | 4 (1.6%) | 16 (4.1%) |
| $10,000 to $24,999 | 12 (4.9%) | 6 (1.5%) |
| $25,000 to $34,999 | 50 (20.3%) | 12 (3.1%) |
| $35,000 to $49,999 | 6 (2.4%) | 4 (1.0%) |
| $50,000 to $74,999 | 19 (7.7%) | 48 (12.3%) |
| $75,000 to $99,999 | 29 (11.8%) | 71 (18.2%) |
| $100,000 to $149,999 | 18 (7.3%) | 75 (19.2%) |
| $150,000 or more | 108 (43.9%) | 118 (30.3%) |
| Total | 246 (100.0%) | 390 (100.0%) |
Property Value to Household Income Ratio in Lakesite
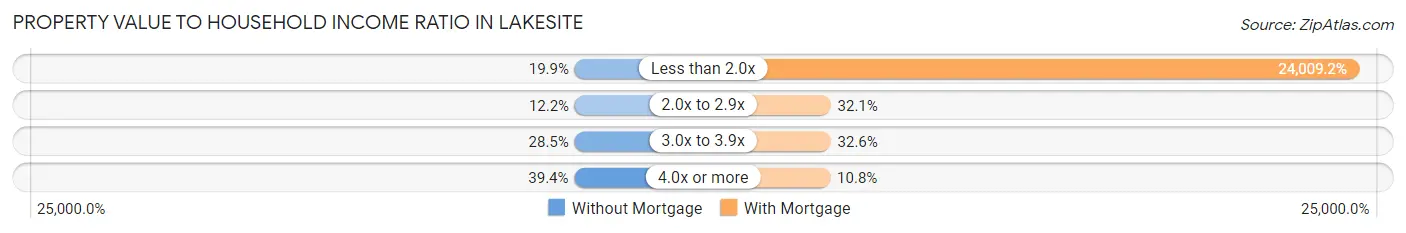
| Value-to-Income Ratio | Without Mortgage | With Mortgage |
| Less than 2.0x | 49 (19.9%) | 93,636 (24,009.2%) |
| 2.0x to 2.9x | 30 (12.2%) | 125 (32.1%) |
| 3.0x to 3.9x | 70 (28.5%) | 127 (32.6%) |
| 4.0x or more | 97 (39.4%) | 42 (10.8%) |
| Total | 246 (100.0%) | 390 (100.0%) |
Real Estate Taxes by Mortgage Status in Lakesite
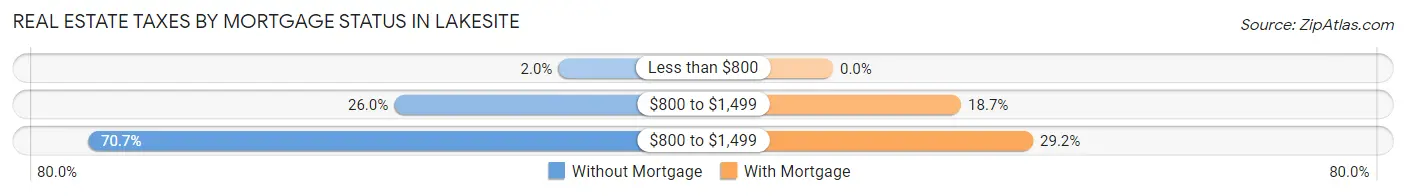
| Property Taxes | Without Mortgage | With Mortgage |
| Less than $800 | 5 (2.0%) | 0 (0.0%) |
| $800 to $1,499 | 64 (26.0%) | 73 (18.7%) |
| $800 to $1,499 | 174 (70.7%) | 114 (29.2%) |
| Total | 246 (100.0%) | 390 (100.0%) |
Health & Disability in Lakesite
Health Insurance Coverage by Age in Lakesite
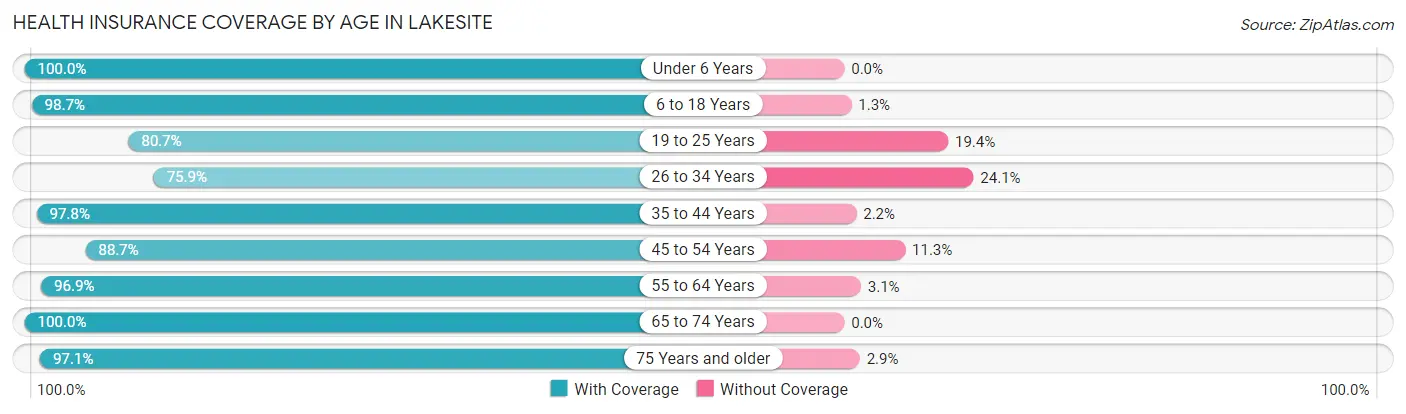
| Age Bracket | With Coverage | Without Coverage |
| Under 6 Years | 202 (100.0%) | 0 (0.0%) |
| 6 to 18 Years | 373 (98.7%) | 5 (1.3%) |
| 19 to 25 Years | 100 (80.6%) | 24 (19.4%) |
| 26 to 34 Years | 145 (75.9%) | 46 (24.1%) |
| 35 to 44 Years | 219 (97.8%) | 5 (2.2%) |
| 45 to 54 Years | 219 (88.7%) | 28 (11.3%) |
| 55 to 64 Years | 282 (96.9%) | 9 (3.1%) |
| 65 to 74 Years | 248 (100.0%) | 0 (0.0%) |
| 75 Years and older | 135 (97.1%) | 4 (2.9%) |
| Total | 1,923 (94.1%) | 121 (5.9%) |
Health Insurance Coverage by Citizenship Status in Lakesite
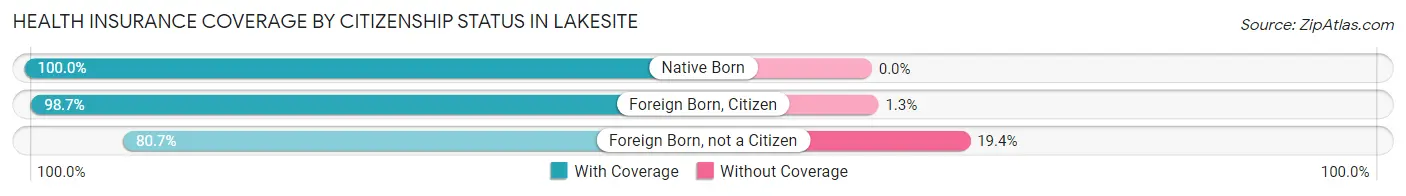
| Citizenship Status | With Coverage | Without Coverage |
| Native Born | 202 (100.0%) | 0 (0.0%) |
| Foreign Born, Citizen | 373 (98.7%) | 5 (1.3%) |
| Foreign Born, not a Citizen | 100 (80.6%) | 24 (19.4%) |
Health Insurance Coverage by Household Income in Lakesite
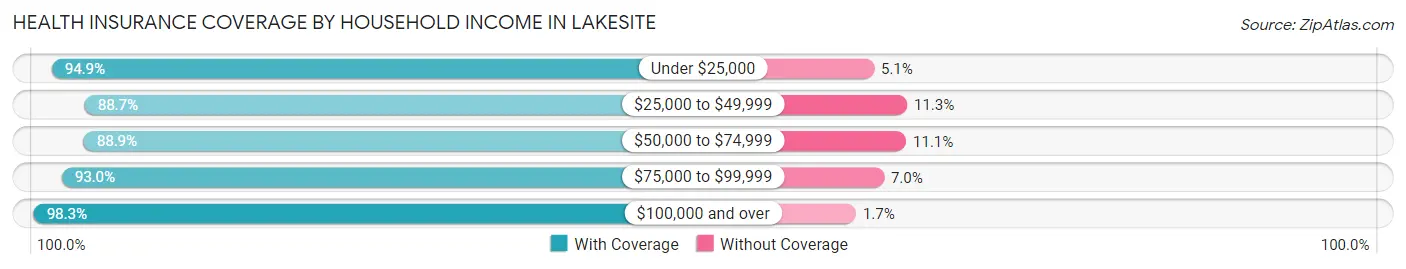
| Household Income | With Coverage | Without Coverage |
| Under $25,000 | 93 (94.9%) | 5 (5.1%) |
| $25,000 to $49,999 | 377 (88.7%) | 48 (11.3%) |
| $50,000 to $74,999 | 232 (88.9%) | 29 (11.1%) |
| $75,000 to $99,999 | 307 (93.0%) | 23 (7.0%) |
| $100,000 and over | 914 (98.3%) | 16 (1.7%) |
Public vs Private Health Insurance Coverage by Age in Lakesite
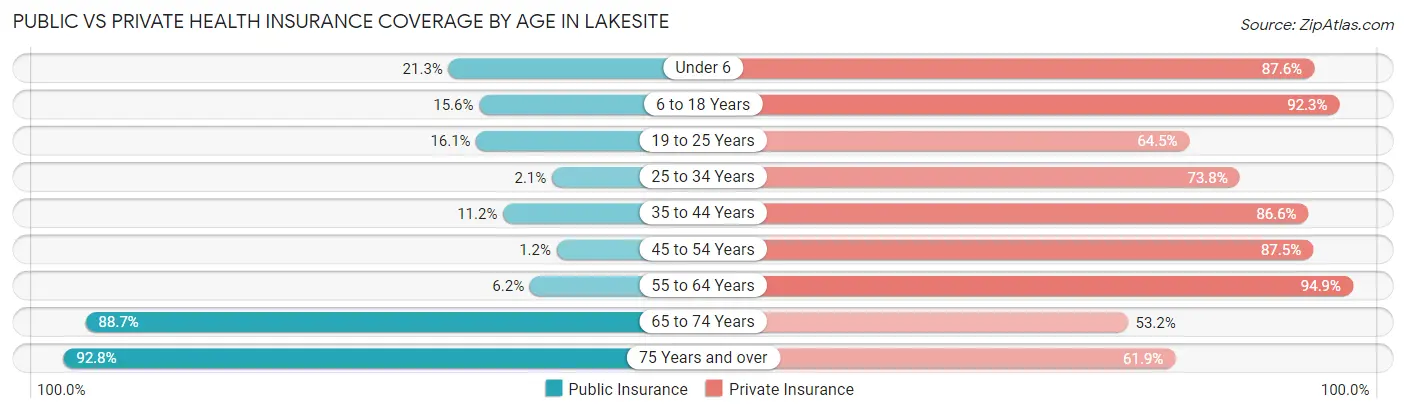
| Age Bracket | Public Insurance | Private Insurance |
| Under 6 | 43 (21.3%) | 177 (87.6%) |
| 6 to 18 Years | 59 (15.6%) | 349 (92.3%) |
| 19 to 25 Years | 20 (16.1%) | 80 (64.5%) |
| 25 to 34 Years | 4 (2.1%) | 141 (73.8%) |
| 35 to 44 Years | 25 (11.2%) | 194 (86.6%) |
| 45 to 54 Years | 3 (1.2%) | 216 (87.5%) |
| 55 to 64 Years | 18 (6.2%) | 276 (94.9%) |
| 65 to 74 Years | 220 (88.7%) | 132 (53.2%) |
| 75 Years and over | 129 (92.8%) | 86 (61.9%) |
| Total | 521 (25.5%) | 1,651 (80.8%) |
Disability Status by Sex by Age in Lakesite
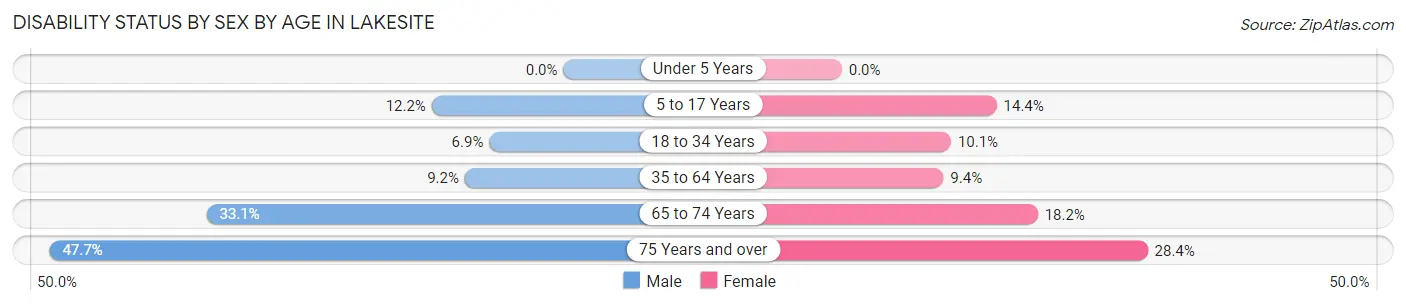
| Age Bracket | Male | Female |
| Under 5 Years | 0 (0.0%) | 0 (0.0%) |
| 5 to 17 Years | 27 (12.2%) | 24 (14.4%) |
| 18 to 34 Years | 11 (6.9%) | 16 (10.1%) |
| 35 to 64 Years | 28 (9.1%) | 43 (9.4%) |
| 65 to 74 Years | 53 (33.1%) | 16 (18.2%) |
| 75 Years and over | 31 (47.7%) | 21 (28.4%) |
Disability Class by Sex by Age in Lakesite
Disability Class: Hearing Difficulty
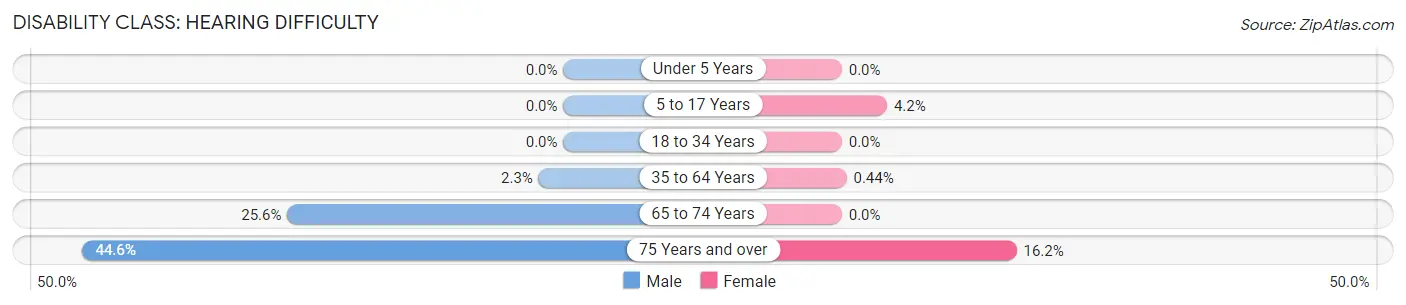
| Age Bracket | Male | Female |
| Under 5 Years | 0 (0.0%) | 0 (0.0%) |
| 5 to 17 Years | 0 (0.0%) | 7 (4.2%) |
| 18 to 34 Years | 0 (0.0%) | 0 (0.0%) |
| 35 to 64 Years | 7 (2.3%) | 2 (0.4%) |
| 65 to 74 Years | 41 (25.6%) | 0 (0.0%) |
| 75 Years and over | 29 (44.6%) | 12 (16.2%) |
Disability Class: Vision Difficulty
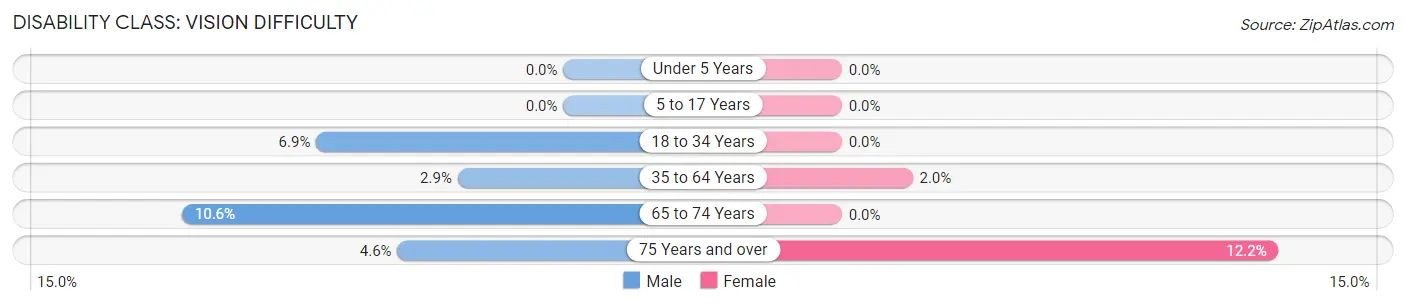
| Age Bracket | Male | Female |
| Under 5 Years | 0 (0.0%) | 0 (0.0%) |
| 5 to 17 Years | 0 (0.0%) | 0 (0.0%) |
| 18 to 34 Years | 11 (6.9%) | 0 (0.0%) |
| 35 to 64 Years | 9 (2.9%) | 9 (2.0%) |
| 65 to 74 Years | 17 (10.6%) | 0 (0.0%) |
| 75 Years and over | 3 (4.6%) | 9 (12.2%) |
Disability Class: Cognitive Difficulty
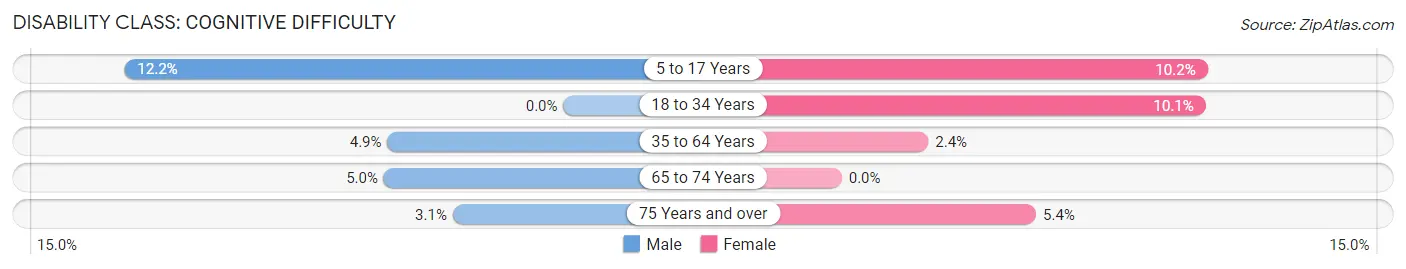
| Age Bracket | Male | Female |
| 5 to 17 Years | 27 (12.2%) | 17 (10.2%) |
| 18 to 34 Years | 0 (0.0%) | 16 (10.1%) |
| 35 to 64 Years | 15 (4.9%) | 11 (2.4%) |
| 65 to 74 Years | 8 (5.0%) | 0 (0.0%) |
| 75 Years and over | 2 (3.1%) | 4 (5.4%) |
Disability Class: Ambulatory Difficulty
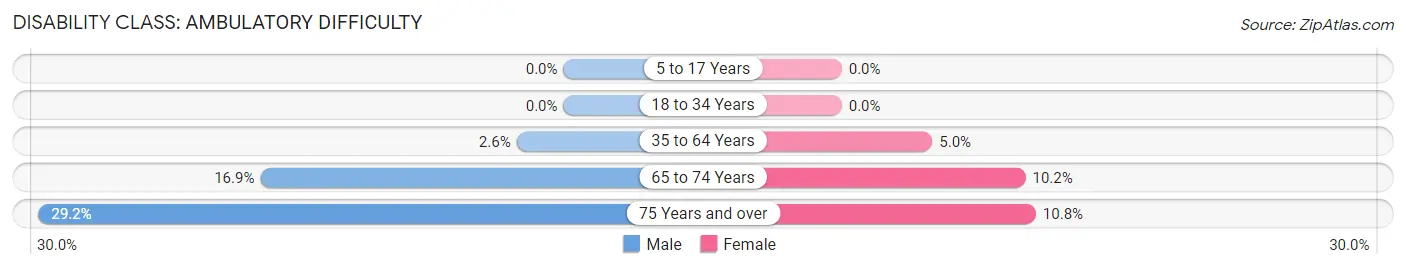
| Age Bracket | Male | Female |
| 5 to 17 Years | 0 (0.0%) | 0 (0.0%) |
| 18 to 34 Years | 0 (0.0%) | 0 (0.0%) |
| 35 to 64 Years | 8 (2.6%) | 23 (5.0%) |
| 65 to 74 Years | 27 (16.9%) | 9 (10.2%) |
| 75 Years and over | 19 (29.2%) | 8 (10.8%) |
Disability Class: Self-Care Difficulty
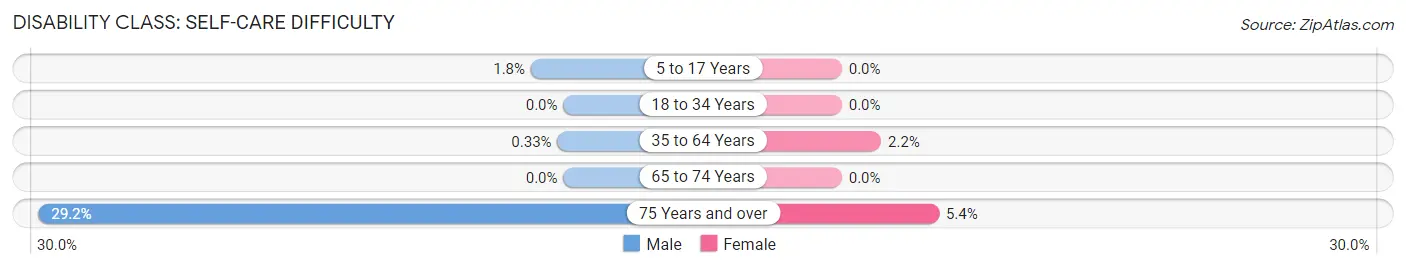
| Age Bracket | Male | Female |
| 5 to 17 Years | 4 (1.8%) | 0 (0.0%) |
| 18 to 34 Years | 0 (0.0%) | 0 (0.0%) |
| 35 to 64 Years | 1 (0.3%) | 10 (2.2%) |
| 65 to 74 Years | 0 (0.0%) | 0 (0.0%) |
| 75 Years and over | 19 (29.2%) | 4 (5.4%) |
Technology Access in Lakesite
Computing Device Access in Lakesite
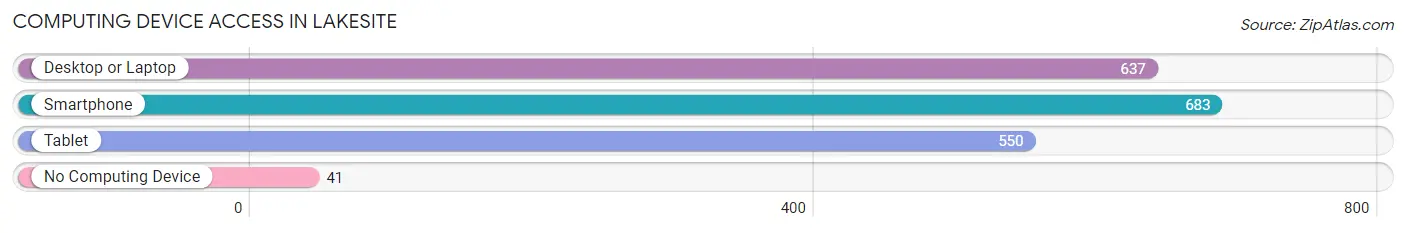
| Device Type | # Households | % Households |
| Desktop or Laptop | 637 | 85.5% |
| Smartphone | 683 | 91.7% |
| Tablet | 550 | 73.8% |
| No Computing Device | 41 | 5.5% |
| Total | 745 | 100.0% |
Internet Access in Lakesite
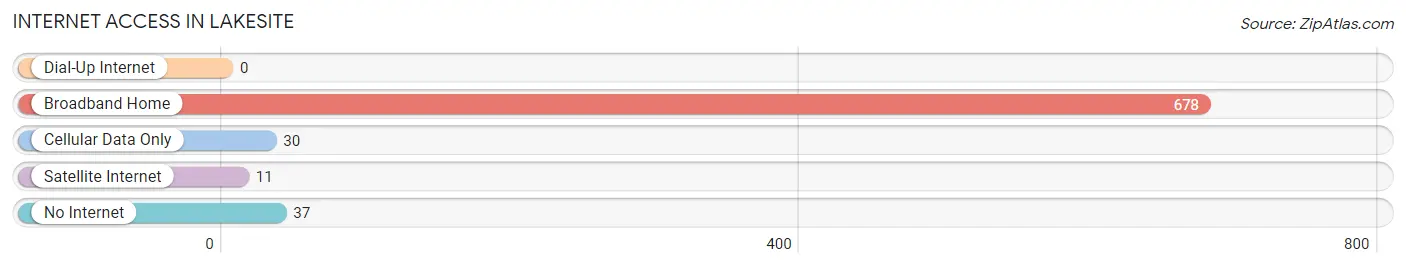
| Internet Type | # Households | % Households |
| Dial-Up Internet | 0 | 0.0% |
| Broadband Home | 678 | 91.0% |
| Cellular Data Only | 30 | 4.0% |
| Satellite Internet | 11 | 1.5% |
| No Internet | 37 | 5.0% |
| Total | 745 | 100.0% |
Lakesite Summary
Lakesite is a small town located in Hamilton County, Tennessee. It is situated on the banks of Chickamauga Lake, a reservoir created by the Tennessee Valley Authority (TVA) in the 1940s. The town was founded in the late 1800s and has a population of approximately 1,500 people.
History
Lakesite was founded in the late 1800s by a group of settlers who were looking for a place to settle and farm. The town was originally called “Lakeside” but was later changed to “Lakesite”. The town was incorporated in 1891 and was the first town in Hamilton County to be incorporated.
The town was originally a farming community, but in the 1940s the TVA created Chickamauga Lake, which flooded much of the surrounding area. This caused many of the farmers to move away, but some stayed and the town began to grow.
In the 1950s, the town began to attract tourists due to its proximity to the lake. This led to the development of several resorts and marinas in the area. The town also began to attract retirees who were looking for a quiet place to live.
Geography
Lakesite is located in Hamilton County, Tennessee, on the banks of Chickamauga Lake. The town is situated in a valley surrounded by hills and mountains. The town is located approximately 20 miles from Chattanooga and is accessible by Interstate 75.
The town is located in a temperate climate, with hot summers and mild winters. The average temperature in the summer is around 80 degrees Fahrenheit, and the average temperature in the winter is around 40 degrees Fahrenheit.
Economy
The economy of Lakesite is largely based on tourism and retirement. The town is home to several resorts and marinas, which attract tourists from all over the country. The town also has a large retirement community, which attracts retirees from all over the country.
The town also has a few small businesses, including a grocery store, a hardware store, and a few restaurants. The town also has a few small manufacturing companies, which produce items such as furniture and clothing.
Demographics
As of the 2010 census, the population of Lakesite was 1,500 people. The racial makeup of the town was 95.3% White, 1.7% African American, 0.7% Native American, 0.3% Asian, and 2.0% from other races. The median household income was $37,500, and the median age was 44.
Conclusion
Lakesite is a small town located in Hamilton County, Tennessee. It was founded in the late 1800s and has a population of approximately 1,500 people. The town is situated on the banks of Chickamauga Lake and is a popular tourist destination. The economy of the town is largely based on tourism and retirement, and the town has a few small businesses. The racial makeup of the town is mostly White, with a small percentage of African American, Native American, and Asian residents.
Common Questions
What is the Total Population of Lakesite?
Total Population of Lakesite is 2,056.
What is the Total Male Population of Lakesite?
Total Male Population of Lakesite is 1,031.
What is the Total Female Population of Lakesite?
Total Female Population of Lakesite is 1,025.
What is the Ratio of Males per 100 Females in Lakesite?
There are 100.59 Males per 100 Females in Lakesite.
What is the Ratio of Females per 100 Males in Lakesite?
There are 99.42 Females per 100 Males in Lakesite.
What is the Median Population Age in Lakesite?
Median Population Age in Lakesite is 40.4 Years.
What is the Average Family Size in Lakesite
Average Family Size in Lakesite is 3.2 People.
What is the Average Household Size in Lakesite
Average Household Size in Lakesite is 2.8 People.
What is Per Capita Income in Lakesite?
Per Capita income in Lakesite is $40,681.
What is the Median Family Income in Lakesite?
Median Family Income in Lakesite is $101,319.
What is the Median Household income in Lakesite?
Median Household Income in Lakesite is $89,602.
What is Income or Wage Gap in Lakesite?
Income or Wage Gap in Lakesite is 27.4%.
Women in Lakesite earn 72.6 cents for every dollar earned by a man.
What is Inequality or Gini Index in Lakesite?
Inequality or Gini Index in Lakesite is 0.42.
How Large is the Labor Force in Lakesite?
There are 1,047 People in the Labor Forcein in Lakesite.
What is the Percentage of People in the Labor Force in Lakesite?
67.4% of People are in the Labor Force in Lakesite.
What is the Unemployment Rate in Lakesite?
Unemployment Rate in Lakesite is 1.8%.