Baneberry, TN
Baneberry Map
Baneberry Overview
620
TOTAL POPULATION
331
MALE POPULATION
289
FEMALE POPULATION
114.53
MALES / 100 FEMALES
87.31
FEMALES / 100 MALES
52.7
MEDIAN AGE
2.8
AVG FAMILY SIZE
2.5
AVG HOUSEHOLD SIZE
$50,354
PER CAPITA INCOME
$117,344
AVG FAMILY INCOME
$95,000
AVG HOUSEHOLD INCOME
33.4%
WAGE / INCOME GAP [ % ]
66.6¢/ $1
WAGE / INCOME GAP [ $ ]
0.41
INEQUALITY / GINI INDEX
297
LABOR FORCE [ PEOPLE ]
54.2%
PERCENT IN LABOR FORCE
7.1%
UNEMPLOYMENT RATE
Baneberry Area Codes
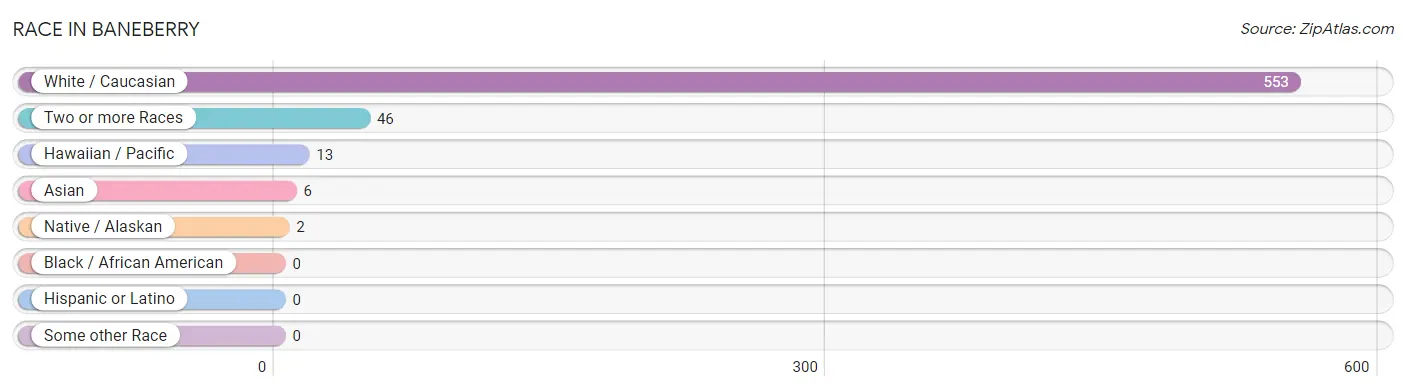
Race in Baneberry
The most populous races in Baneberry are White / Caucasian (553 | 89.2%), Two or more Races (46 | 7.4%), and Hawaiian / Pacific (13 | 2.1%).
| Race | # Population | % Population |
| Asian | 6 | 1.0% |
| Black / African American | 0 | 0.0% |
| Hawaiian / Pacific | 13 | 2.1% |
| Hispanic or Latino | 0 | 0.0% |
| Native / Alaskan | 2 | 0.3% |
| White / Caucasian | 553 | 89.2% |
| Two or more Races | 46 | 7.4% |
| Some other Race | 0 | 0.0% |
| Total | 620 | 100.0% |
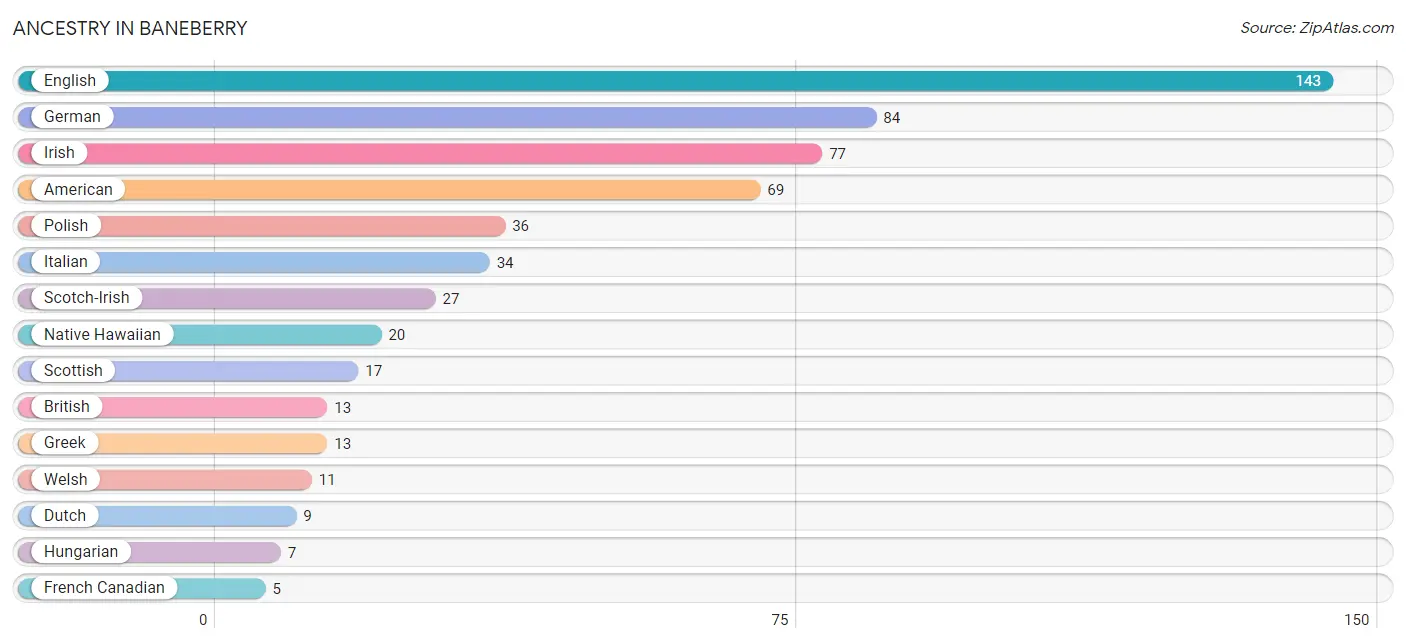
Ancestry in Baneberry
The most populous ancestries reported in Baneberry are English (143 | 23.1%), German (84 | 13.6%), Irish (77 | 12.4%), American (69 | 11.1%), and Polish (36 | 5.8%), together accounting for 66.0% of all Baneberry residents.
| Ancestry | # Population | % Population |
| American | 69 | 11.1% |
| Austrian | 2 | 0.3% |
| British | 13 | 2.1% |
| Cherokee | 3 | 0.5% |
| Czech | 2 | 0.3% |
| Dutch | 9 | 1.5% |
| English | 143 | 23.1% |
| European | 2 | 0.3% |
| French | 4 | 0.6% |
| French Canadian | 5 | 0.8% |
| German | 84 | 13.6% |
| Greek | 13 | 2.1% |
| Guamanian / Chamorro | 1 | 0.2% |
| Hungarian | 7 | 1.1% |
| Irish | 77 | 12.4% |
| Italian | 34 | 5.5% |
| Korean | 5 | 0.8% |
| Native Hawaiian | 20 | 3.2% |
| Nigerian | 3 | 0.5% |
| Norwegian | 2 | 0.3% |
| Polish | 36 | 5.8% |
| Russian | 3 | 0.5% |
| Scandinavian | 1 | 0.2% |
| Scotch-Irish | 27 | 4.3% |
| Scottish | 17 | 2.7% |
| Slovak | 1 | 0.2% |
| Sri Lankan | 4 | 0.6% |
| Subsaharan African | 3 | 0.5% |
| Swedish | 3 | 0.5% |
| Welsh | 11 | 1.8% | View All 30 Rows |
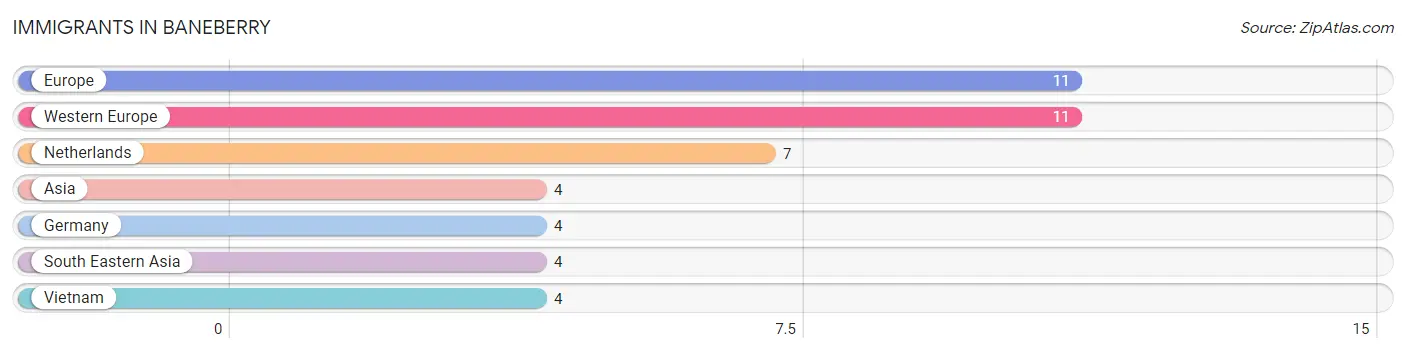
Immigrants in Baneberry
The most numerous immigrant groups reported in Baneberry came from Europe (11 | 1.8%), Western Europe (11 | 1.8%), Netherlands (7 | 1.1%), Asia (4 | 0.6%), and Germany (4 | 0.6%), together accounting for 6.0% of all Baneberry residents.
| Immigration Origin | # Population | % Population |
| Asia | 4 | 0.6% |
| Europe | 11 | 1.8% |
| Germany | 4 | 0.6% |
| Netherlands | 7 | 1.1% |
| South Eastern Asia | 4 | 0.6% |
| Vietnam | 4 | 0.6% |
| Western Europe | 11 | 1.8% | View All 7 Rows |
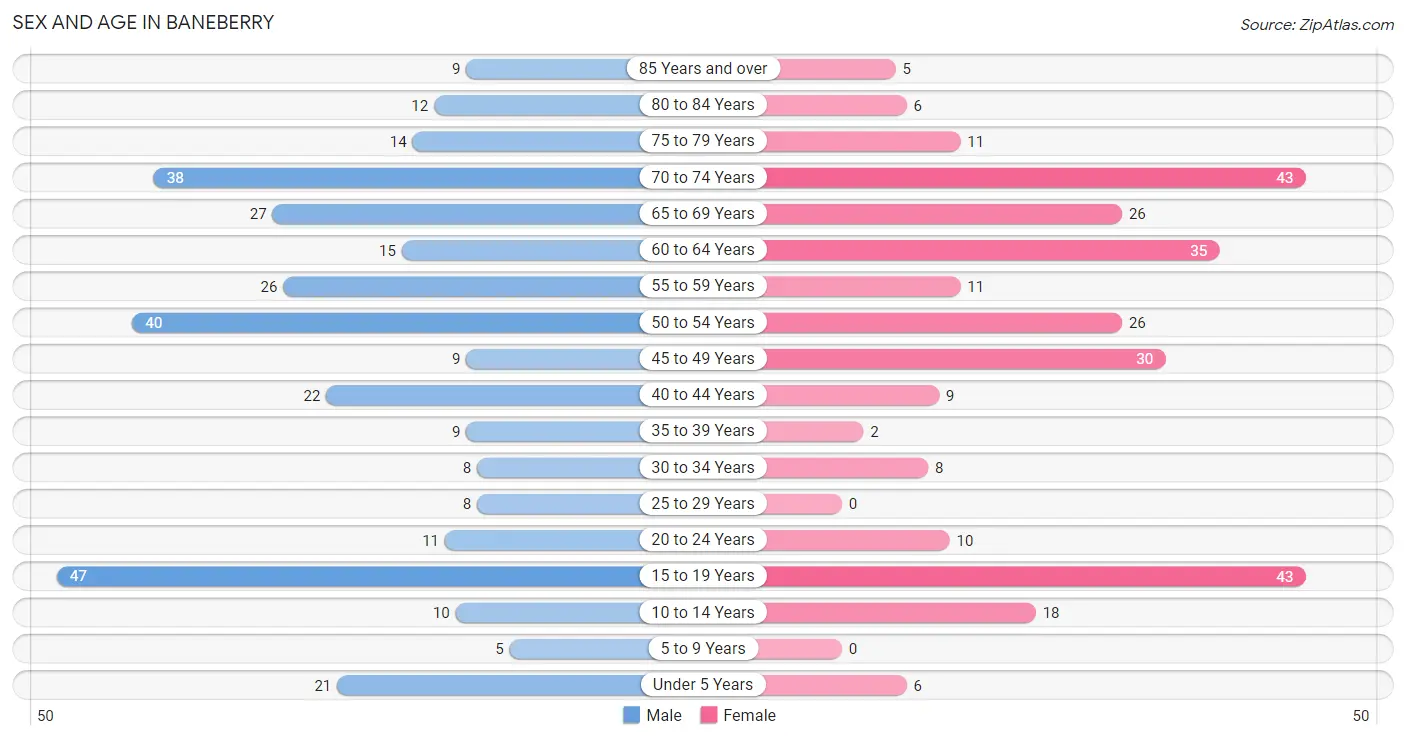
Sex and Age in Baneberry
Sex and Age in Baneberry
The most populous age groups in Baneberry are 15 to 19 Years (47 | 14.2%) for men and 15 to 19 Years (43 | 14.9%) for women.
| Age Bracket | Male | Female |
| Under 5 Years | 21 (6.3%) | 6 (2.1%) |
| 5 to 9 Years | 5 (1.5%) | 0 (0.0%) |
| 10 to 14 Years | 10 (3.0%) | 18 (6.2%) |
| 15 to 19 Years | 47 (14.2%) | 43 (14.9%) |
| 20 to 24 Years | 11 (3.3%) | 10 (3.5%) |
| 25 to 29 Years | 8 (2.4%) | 0 (0.0%) |
| 30 to 34 Years | 8 (2.4%) | 8 (2.8%) |
| 35 to 39 Years | 9 (2.7%) | 2 (0.7%) |
| 40 to 44 Years | 22 (6.7%) | 9 (3.1%) |
| 45 to 49 Years | 9 (2.7%) | 30 (10.4%) |
| 50 to 54 Years | 40 (12.1%) | 26 (9.0%) |
| 55 to 59 Years | 26 (7.9%) | 11 (3.8%) |
| 60 to 64 Years | 15 (4.5%) | 35 (12.1%) |
| 65 to 69 Years | 27 (8.2%) | 26 (9.0%) |
| 70 to 74 Years | 38 (11.5%) | 43 (14.9%) |
| 75 to 79 Years | 14 (4.2%) | 11 (3.8%) |
| 80 to 84 Years | 12 (3.6%) | 6 (2.1%) |
| 85 Years and over | 9 (2.7%) | 5 (1.7%) |
| Total | 331 (100.0%) | 289 (100.0%) |
Families and Households in Baneberry
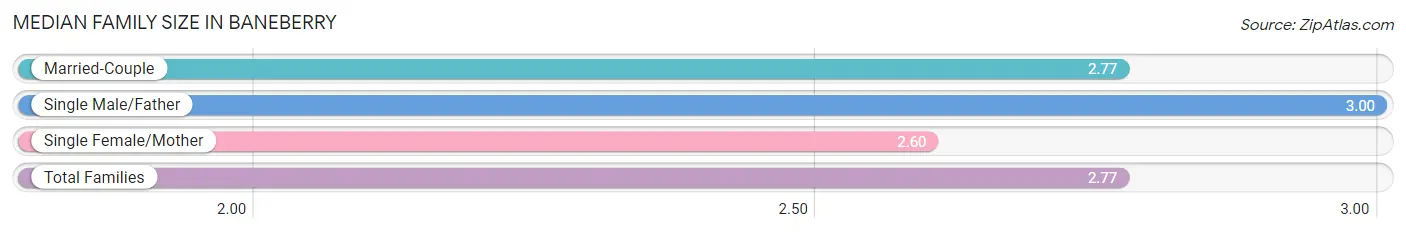
Median Family Size in Baneberry
The median family size in Baneberry is 2.77 persons per family, with single male/father families (1 | 0.5%) accounting for the largest median family size of 3 persons per family. On the other hand, single female/mother families (5 | 2.6%) represent the smallest median family size with 2.60 persons per family.
| Family Type | # Families | Family Size |
| Married-Couple | 189 (96.9%) | 2.77 |
| Single Male/Father | 1 (0.5%) | 3.00 |
| Single Female/Mother | 5 (2.6%) | 2.60 |
| Total Families | 195 (100.0%) | 2.77 |
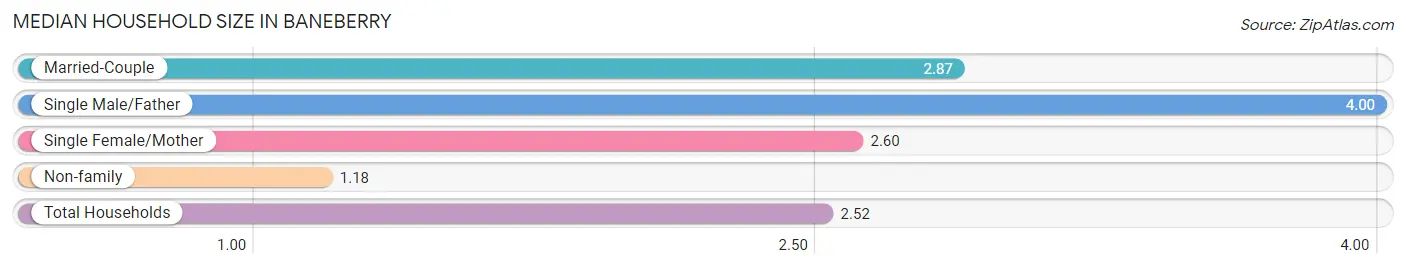
Median Household Size in Baneberry
The median household size in Baneberry is 2.52 persons per household, with single male/father households (1 | 0.4%) accounting for the largest median household size of 4 persons per household. non-family households (51 | 20.7%) represent the smallest median household size with 1.18 persons per household.
| Household Type | # Households | Household Size |
| Married-Couple | 189 (76.8%) | 2.87 |
| Single Male/Father | 1 (0.4%) | 4.00 |
| Single Female/Mother | 5 (2.0%) | 2.60 |
| Non-family | 51 (20.7%) | 1.18 |
| Total Households | 246 (100.0%) | 2.52 |
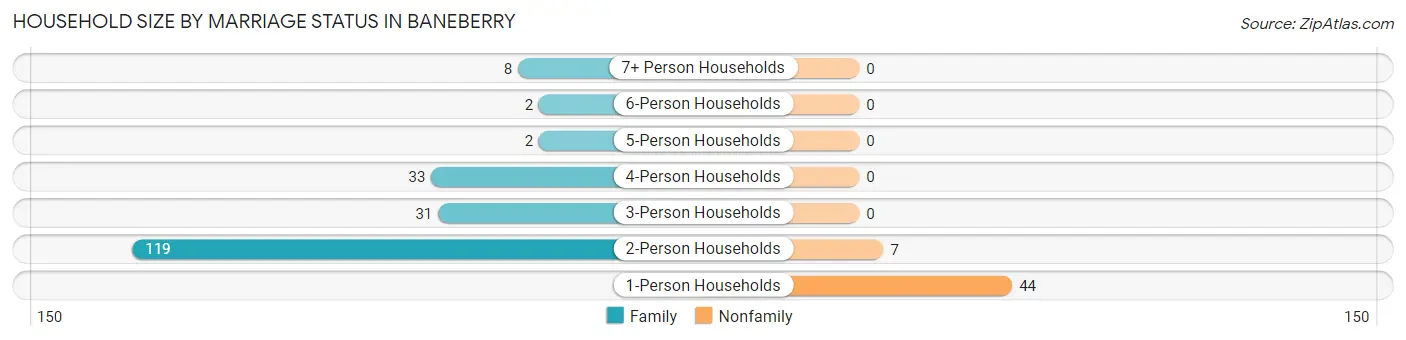
Household Size by Marriage Status in Baneberry
Out of a total of 246 households in Baneberry, 195 (79.3%) are family households, while 51 (20.7%) are nonfamily households. The most numerous type of family households are 2-person households, comprising 119, and the most common type of nonfamily households are 1-person households, comprising 44.
| Household Size | Family Households | Nonfamily Households |
| 1-Person Households | - | 44 (17.9%) |
| 2-Person Households | 119 (48.4%) | 7 (2.9%) |
| 3-Person Households | 31 (12.6%) | 0 (0.0%) |
| 4-Person Households | 33 (13.4%) | 0 (0.0%) |
| 5-Person Households | 2 (0.8%) | 0 (0.0%) |
| 6-Person Households | 2 (0.8%) | 0 (0.0%) |
| 7+ Person Households | 8 (3.3%) | 0 (0.0%) |
| Total | 195 (79.3%) | 51 (20.7%) |
Female Fertility in Baneberry
Fertility by Age in Baneberry
Average fertility rate in Baneberry is 143.0 births per 1,000 women. Women in the age bracket of 15 to 19 years have the highest fertility rate with 279.0 births per 1,000 women. Women in the age bracket of 15 to 19 years acount for 80.0% of all women with births.
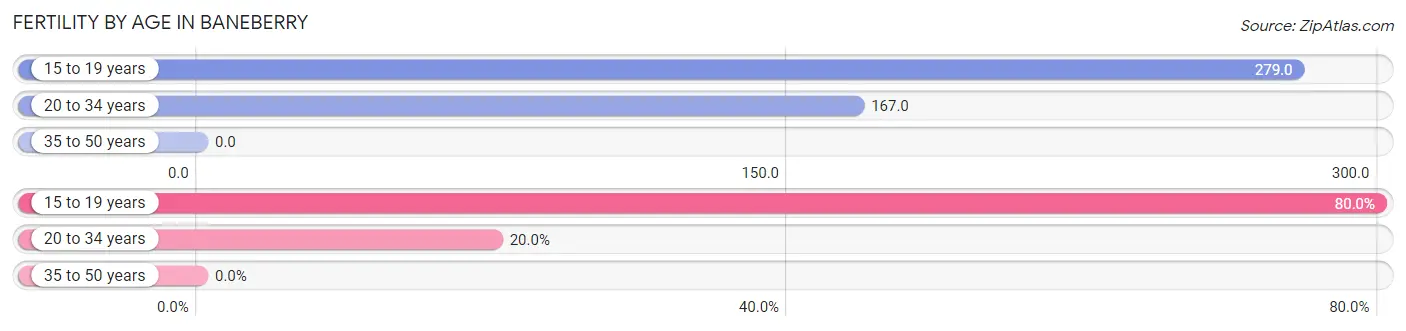
| Age Bracket | Women with Births | Births / 1,000 Women |
| 15 to 19 years | 12 (80.0%) | 279.0 |
| 20 to 34 years | 3 (20.0%) | 167.0 |
| 35 to 50 years | 0 (0.0%) | 0.0 |
| Total | 15 (100.0%) | 143.0 |
Fertility by Age by Marriage Status in Baneberry
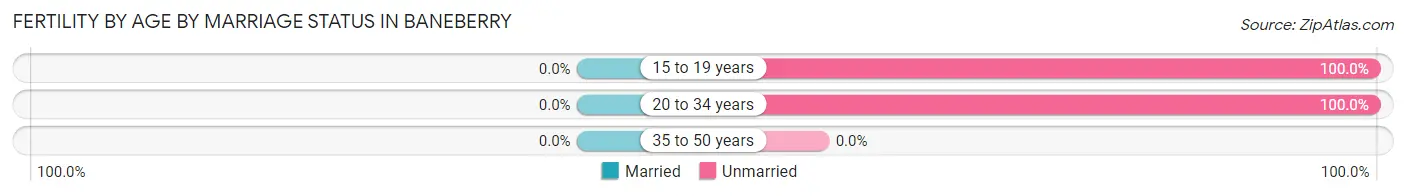
| Age Bracket | Married | Unmarried |
| 15 to 19 years | 0 (0.0%) | 12 (100.0%) |
| 20 to 34 years | 0 (0.0%) | 3 (100.0%) |
| 35 to 50 years | 0 (0.0%) | 0 (0.0%) |
| Total | 0 (0.0%) | 15 (100.0%) |
Fertility by Education in Baneberry
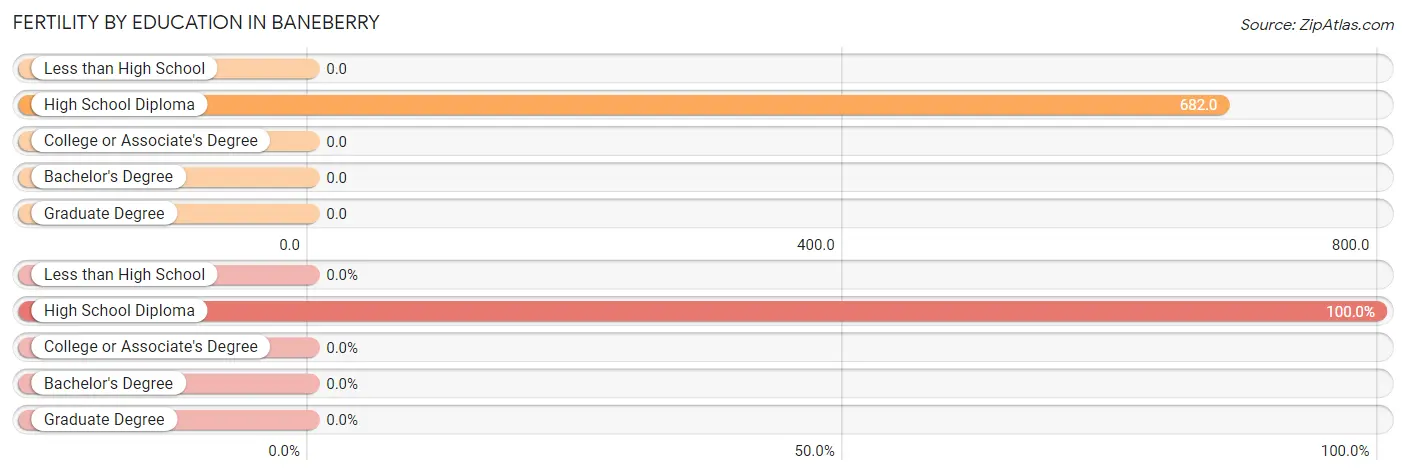
| Educational Attainment | Women with Births | Births / 1,000 Women |
| Less than High School | 0 (0.0%) | 0.0 |
| High School Diploma | 15 (100.0%) | 682.0 |
| College or Associate's Degree | 0 (0.0%) | 0.0 |
| Bachelor's Degree | 0 (0.0%) | 0.0 |
| Graduate Degree | 0 (0.0%) | 0.0 |
| Total | 15 (100.0%) | 143.0 |
Fertility by Education by Marriage Status in Baneberry
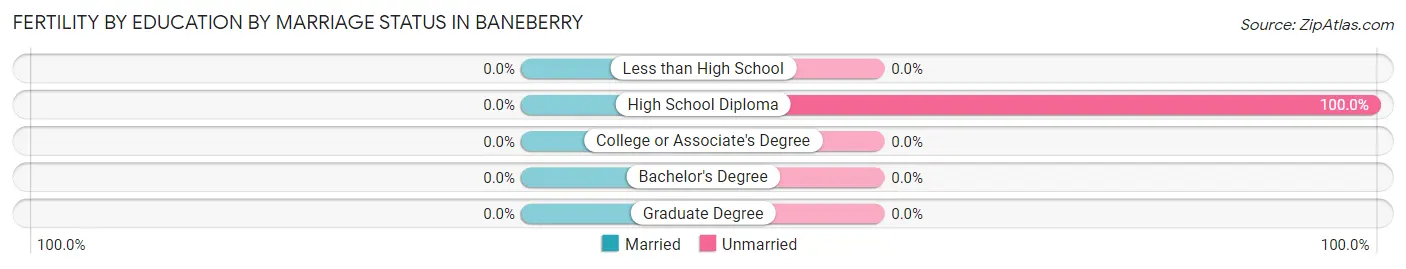
| Educational Attainment | Married | Unmarried |
| Less than High School | 0 (0.0%) | 0 (0.0%) |
| High School Diploma | 0 (0.0%) | 15 (100.0%) |
| College or Associate's Degree | 0 (0.0%) | 0 (0.0%) |
| Bachelor's Degree | 0 (0.0%) | 0 (0.0%) |
| Graduate Degree | 0 (0.0%) | 0 (0.0%) |
| Total | 0 (0.0%) | 15 (100.0%) |
Income in Baneberry
Income Overview in Baneberry
Per Capita Income in Baneberry is $50,354, while median incomes of families and households are $117,344 and $95,000 respectively.
| Characteristic | Number | Measure |
| Per Capita Income | 620 | $50,354 |
| Median Family Income | 195 | $117,344 |
| Mean Family Income | 195 | $146,342 |
| Median Household Income | 246 | $95,000 |
| Mean Household Income | 246 | $129,948 |
| Income Deficit | 195 | $0 |
| Wage / Income Gap (%) | 620 | 33.41% |
| Wage / Income Gap ($) | 620 | 66.59¢ per $1 |
| Gini / Inequality Index | 620 | 0.41 |
Earnings by Sex in Baneberry
Average Earnings in Baneberry are $46,016, $58,194 for men and $38,750 for women, a difference of 33.4%.
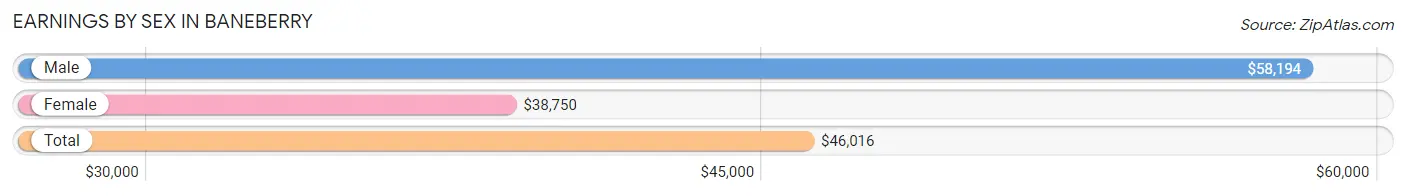
| Sex | Number | Average Earnings |
| Male | 161 (54.9%) | $58,194 |
| Female | 132 (45.1%) | $38,750 |
| Total | 293 (100.0%) | $46,016 |
Earnings by Sex by Income Bracket in Baneberry
The most common earnings brackets in Baneberry are $75,000 to $99,999 for men (34 | 21.1%) and $65,000 to $74,999 for women (23 | 17.4%).
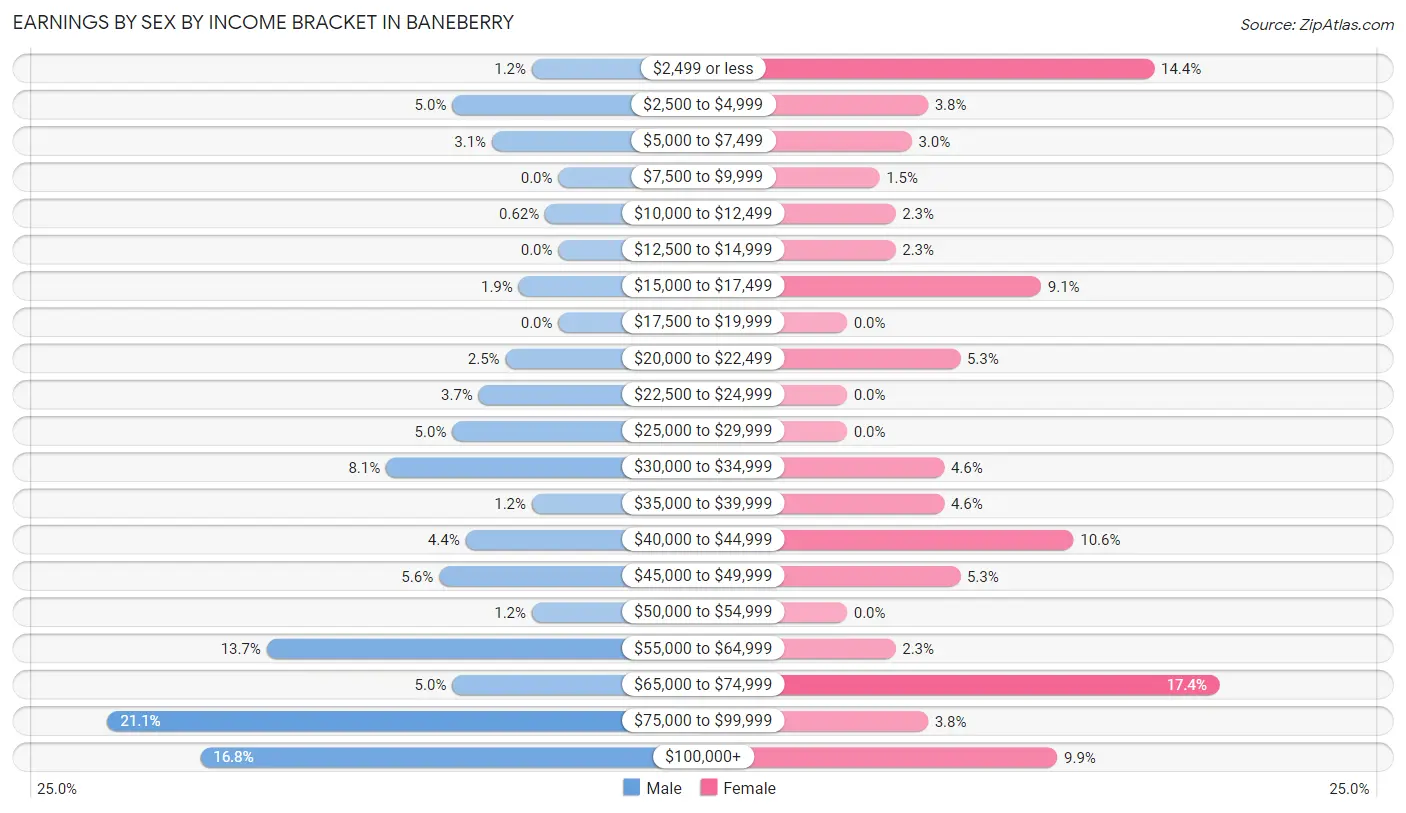
| Income | Male | Female |
| $2,499 or less | 2 (1.2%) | 19 (14.4%) |
| $2,500 to $4,999 | 8 (5.0%) | 5 (3.8%) |
| $5,000 to $7,499 | 5 (3.1%) | 4 (3.0%) |
| $7,500 to $9,999 | 0 (0.0%) | 2 (1.5%) |
| $10,000 to $12,499 | 1 (0.6%) | 3 (2.3%) |
| $12,500 to $14,999 | 0 (0.0%) | 3 (2.3%) |
| $15,000 to $17,499 | 3 (1.9%) | 12 (9.1%) |
| $17,500 to $19,999 | 0 (0.0%) | 0 (0.0%) |
| $20,000 to $22,499 | 4 (2.5%) | 7 (5.3%) |
| $22,500 to $24,999 | 6 (3.7%) | 0 (0.0%) |
| $25,000 to $29,999 | 8 (5.0%) | 0 (0.0%) |
| $30,000 to $34,999 | 13 (8.1%) | 6 (4.5%) |
| $35,000 to $39,999 | 2 (1.2%) | 6 (4.5%) |
| $40,000 to $44,999 | 7 (4.3%) | 14 (10.6%) |
| $45,000 to $49,999 | 9 (5.6%) | 7 (5.3%) |
| $50,000 to $54,999 | 2 (1.2%) | 0 (0.0%) |
| $55,000 to $64,999 | 22 (13.7%) | 3 (2.3%) |
| $65,000 to $74,999 | 8 (5.0%) | 23 (17.4%) |
| $75,000 to $99,999 | 34 (21.1%) | 5 (3.8%) |
| $100,000+ | 27 (16.8%) | 13 (9.9%) |
| Total | 161 (100.0%) | 132 (100.0%) |
Earnings by Sex by Educational Attainment in Baneberry
Average earnings in Baneberry are $61,500 for men and $45,179 for women, a difference of 26.5%. Men with an educational attainment of bachelor's degree enjoy the highest average annual earnings of $61,000, while those with high school diploma education earn the least with $57,292. Women with an educational attainment of graduate degree earn the most with the average annual earnings of $78,750, while those with bachelor's degree education have the smallest earnings of $66,250.
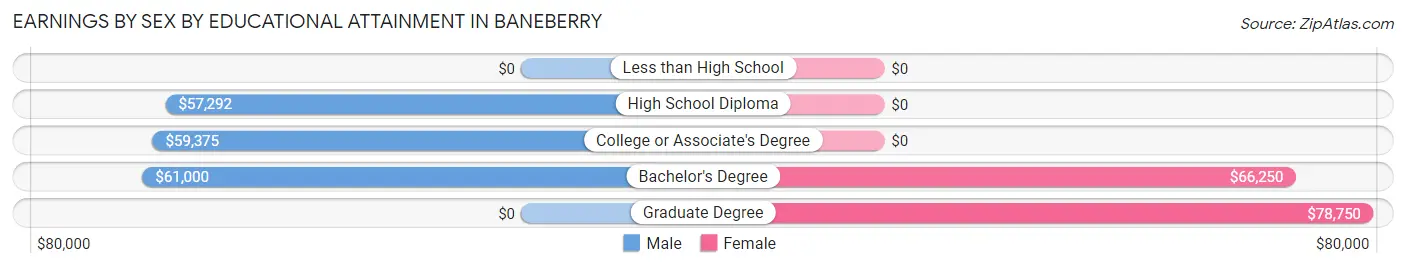
| Educational Attainment | Male Income | Female Income |
| Less than High School | - | - |
| High School Diploma | $57,292 | $0 |
| College or Associate's Degree | $59,375 | $0 |
| Bachelor's Degree | $61,000 | $66,250 |
| Graduate Degree | - | - |
| Total | $61,500 | $45,179 |
Family Income in Baneberry
Family Income Brackets in Baneberry
According to the Baneberry family income data, there are 47 families falling into the $100,000 to $149,999 income range, which is the most common income bracket and makes up 24.1% of all families.
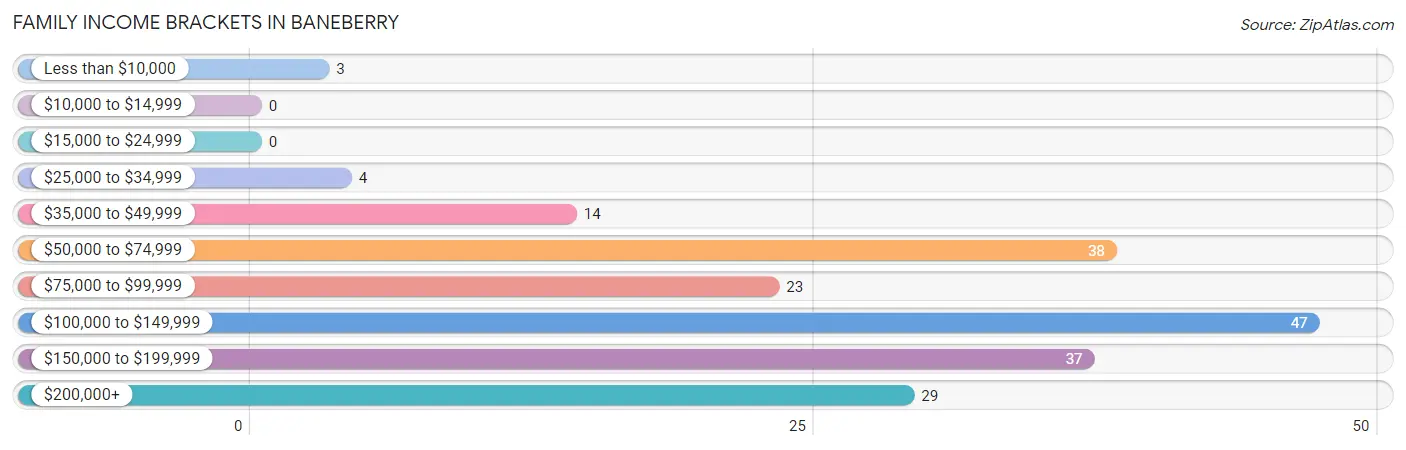
| Income Bracket | # Families | % Families |
| Less than $10,000 | 3 | 1.5% |
| $10,000 to $14,999 | 0 | 0.0% |
| $15,000 to $24,999 | 0 | 0.0% |
| $25,000 to $34,999 | 4 | 2.1% |
| $35,000 to $49,999 | 14 | 7.2% |
| $50,000 to $74,999 | 38 | 19.5% |
| $75,000 to $99,999 | 23 | 11.8% |
| $100,000 to $149,999 | 47 | 24.1% |
| $150,000 to $199,999 | 37 | 19.0% |
| $200,000+ | 29 | 14.9% |
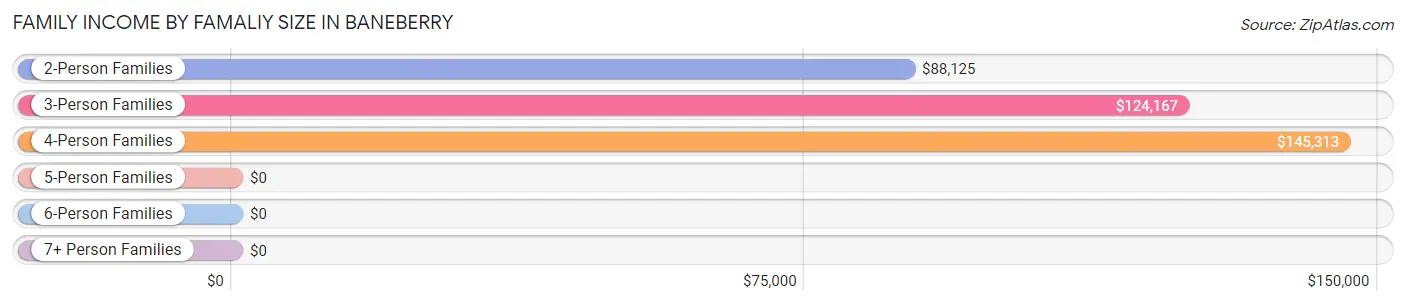
Family Income by Famaliy Size in Baneberry
4-person families (30 | 15.4%) account for the highest median family income in Baneberry with $145,313 per family, while 2-person families (123 | 63.1%) have the highest median income of $44,062 per family member.
| Income Bracket | # Families | Median Income |
| 2-Person Families | 123 (63.1%) | $88,125 |
| 3-Person Families | 30 (15.4%) | $124,167 |
| 4-Person Families | 30 (15.4%) | $145,313 |
| 5-Person Families | 2 (1.0%) | $0 |
| 6-Person Families | 2 (1.0%) | $0 |
| 7+ Person Families | 8 (4.1%) | $0 |
| Total | 195 (100.0%) | $117,344 |
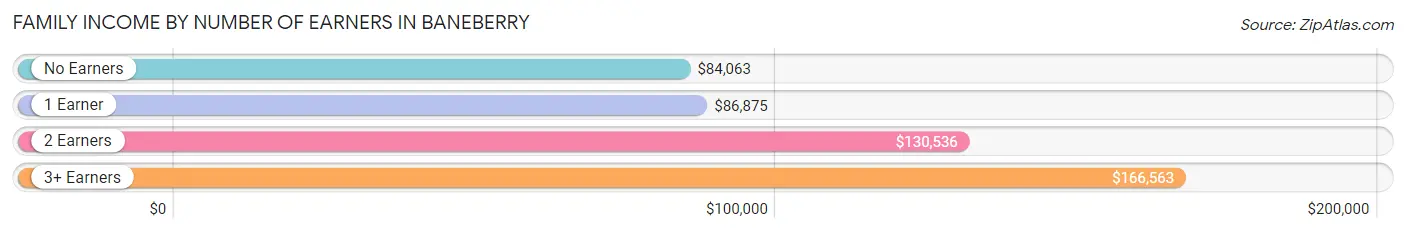
Family Income by Number of Earners in Baneberry
The median family income in Baneberry is $117,344, with families comprising 3+ earners (22) having the highest median family income of $166,563, while families with no earners (61) have the lowest median family income of $84,063, accounting for 11.3% and 31.3% of families, respectively.
| Number of Earners | # Families | Median Income |
| No Earners | 61 (31.3%) | $84,063 |
| 1 Earner | 45 (23.1%) | $86,875 |
| 2 Earners | 67 (34.4%) | $130,536 |
| 3+ Earners | 22 (11.3%) | $166,563 |
| Total | 195 (100.0%) | $117,344 |
Household Income in Baneberry
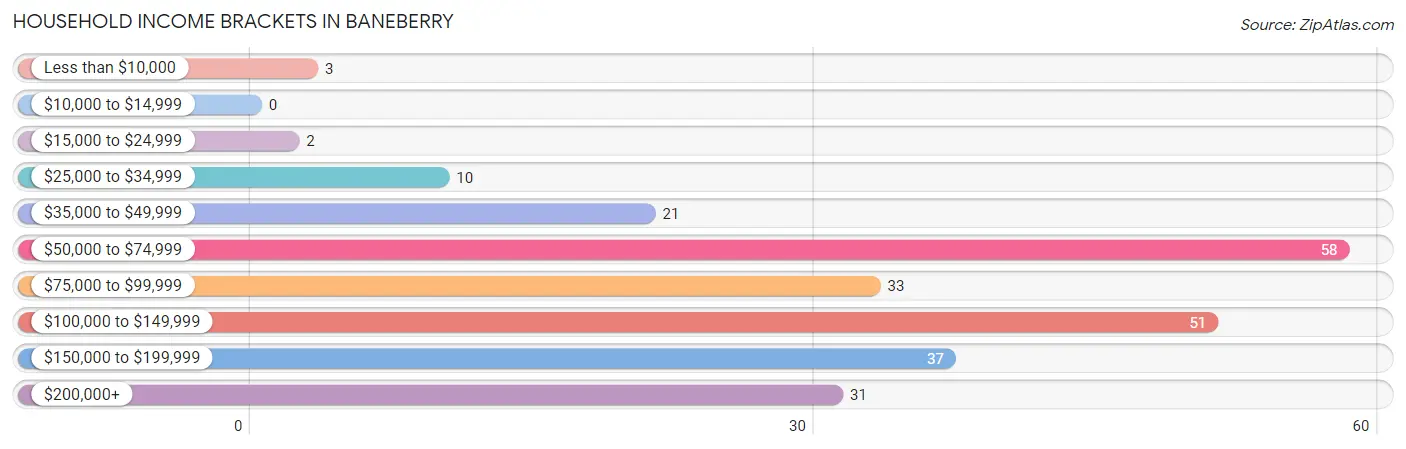
Household Income Brackets in Baneberry
With 58 households falling in the category, the $50,000 to $74,999 income range is the most frequent in Baneberry, accounting for 23.6% of all households.
| Income Bracket | # Households | % Households |
| Less than $10,000 | 3 | 1.2% |
| $10,000 to $14,999 | 0 | 0.0% |
| $15,000 to $24,999 | 2 | 0.8% |
| $25,000 to $34,999 | 10 | 4.1% |
| $35,000 to $49,999 | 21 | 8.5% |
| $50,000 to $74,999 | 58 | 23.6% |
| $75,000 to $99,999 | 33 | 13.4% |
| $100,000 to $149,999 | 51 | 20.7% |
| $150,000 to $199,999 | 37 | 15.0% |
| $200,000+ | 31 | 12.6% |
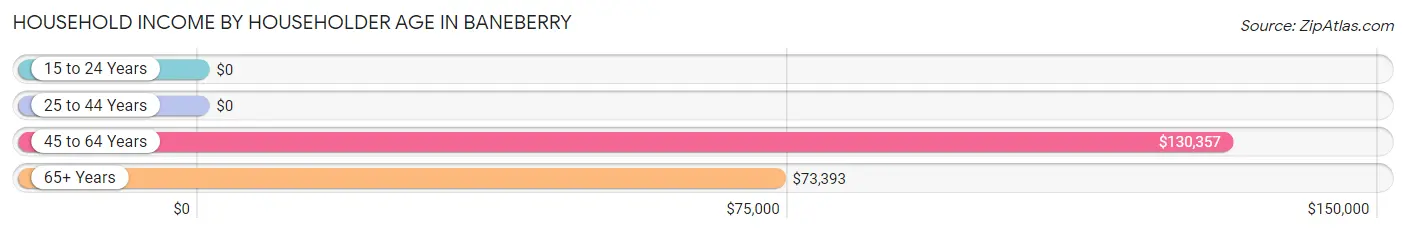
Household Income by Householder Age in Baneberry
The median household income in Baneberry is $95,000, with the highest median household income of $130,357 found in the 45 to 64 years age bracket for the primary householder. A total of 96 households (39.0%) fall into this category. Meanwhile, the 15 to 24 years age bracket for the primary householder has the lowest median household income of $0, with 4 households (1.6%) in this group.
| Income Bracket | # Households | Median Income |
| 15 to 24 Years | 4 (1.6%) | $0 |
| 25 to 44 Years | 39 (15.9%) | $0 |
| 45 to 64 Years | 96 (39.0%) | $130,357 |
| 65+ Years | 107 (43.5%) | $73,393 |
| Total | 246 (100.0%) | $95,000 |
Poverty in Baneberry
Income Below Poverty by Sex and Age in Baneberry
With 1.8% poverty level for males and 6.6% for females among the residents of Baneberry, 75 year old and over males and 18 to 24 year old females are the most vulnerable to poverty, with 3 males (8.6%) and 16 females (64.0%) in their respective age groups living below the poverty level.
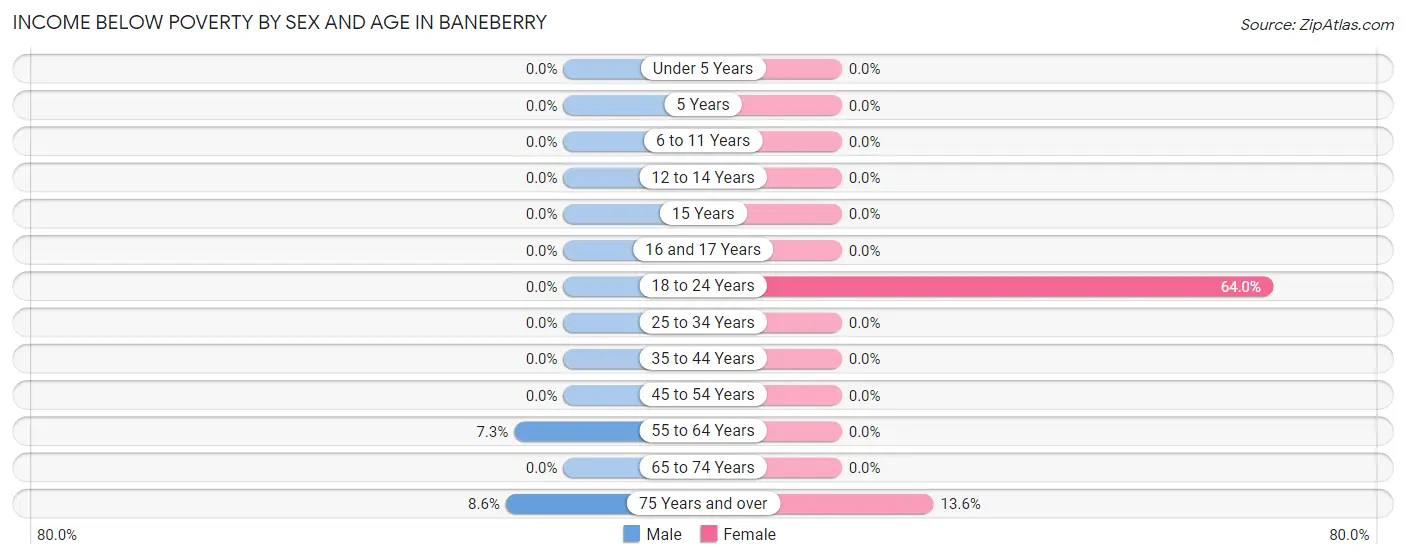
| Age Bracket | Male | Female |
| Under 5 Years | 0 (0.0%) | 0 (0.0%) |
| 5 Years | 0 (0.0%) | 0 (0.0%) |
| 6 to 11 Years | 0 (0.0%) | 0 (0.0%) |
| 12 to 14 Years | 0 (0.0%) | 0 (0.0%) |
| 15 Years | 0 (0.0%) | 0 (0.0%) |
| 16 and 17 Years | 0 (0.0%) | 0 (0.0%) |
| 18 to 24 Years | 0 (0.0%) | 16 (64.0%) |
| 25 to 34 Years | 0 (0.0%) | 0 (0.0%) |
| 35 to 44 Years | 0 (0.0%) | 0 (0.0%) |
| 45 to 54 Years | 0 (0.0%) | 0 (0.0%) |
| 55 to 64 Years | 3 (7.3%) | 0 (0.0%) |
| 65 to 74 Years | 0 (0.0%) | 0 (0.0%) |
| 75 Years and over | 3 (8.6%) | 3 (13.6%) |
| Total | 6 (1.8%) | 19 (6.6%) |
Income Above Poverty by Sex and Age in Baneberry
According to the poverty statistics in Baneberry, males aged under 5 years and females aged under 5 years are the age groups that are most secure financially, with 100.0% of males and 100.0% of females in these age groups living above the poverty line.
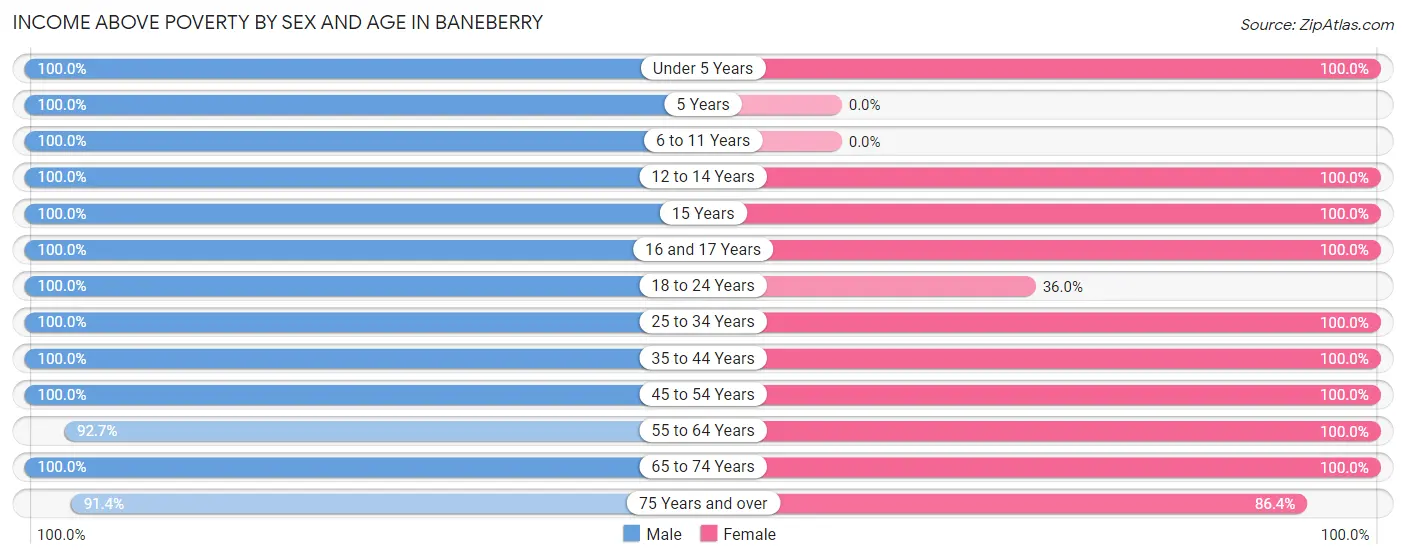
| Age Bracket | Male | Female |
| Under 5 Years | 17 (100.0%) | 6 (100.0%) |
| 5 Years | 5 (100.0%) | 0 (0.0%) |
| 6 to 11 Years | 8 (100.0%) | 0 (0.0%) |
| 12 to 14 Years | 2 (100.0%) | 18 (100.0%) |
| 15 Years | 9 (100.0%) | 3 (100.0%) |
| 16 and 17 Years | 26 (100.0%) | 25 (100.0%) |
| 18 to 24 Years | 23 (100.0%) | 9 (36.0%) |
| 25 to 34 Years | 16 (100.0%) | 8 (100.0%) |
| 35 to 44 Years | 31 (100.0%) | 11 (100.0%) |
| 45 to 54 Years | 49 (100.0%) | 56 (100.0%) |
| 55 to 64 Years | 38 (92.7%) | 46 (100.0%) |
| 65 to 74 Years | 65 (100.0%) | 69 (100.0%) |
| 75 Years and over | 32 (91.4%) | 19 (86.4%) |
| Total | 321 (98.2%) | 270 (93.4%) |
Income Below Poverty Among Married-Couple Families in Baneberry
The poverty statistics for married-couple families in Baneberry show that 1.6% or 3 of the total 189 families live below the poverty line. Families with no children have the highest poverty rate of 2.3%, comprising of 3 families. On the other hand, families with 1 or 2 children have the lowest poverty rate of 0.0%, which includes 0 families.
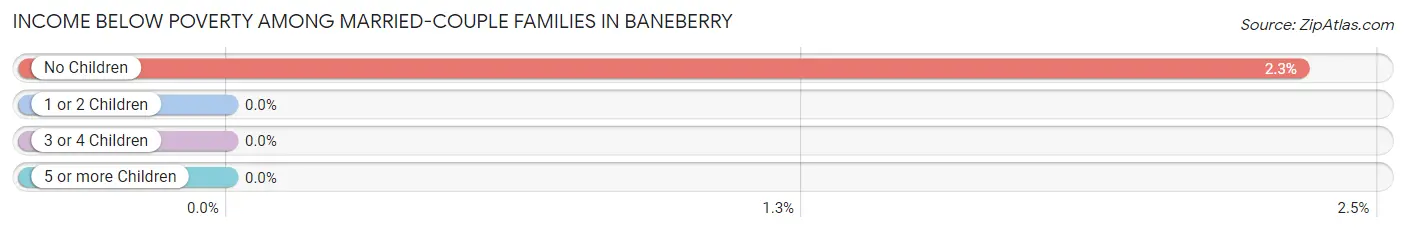
| Children | Above Poverty | Below Poverty |
| No Children | 126 (97.7%) | 3 (2.3%) |
| 1 or 2 Children | 48 (100.0%) | 0 (0.0%) |
| 3 or 4 Children | 12 (100.0%) | 0 (0.0%) |
| 5 or more Children | 0 (0.0%) | 0 (0.0%) |
| Total | 186 (98.4%) | 3 (1.6%) |
Income Below Poverty Among Single-Parent Households in Baneberry
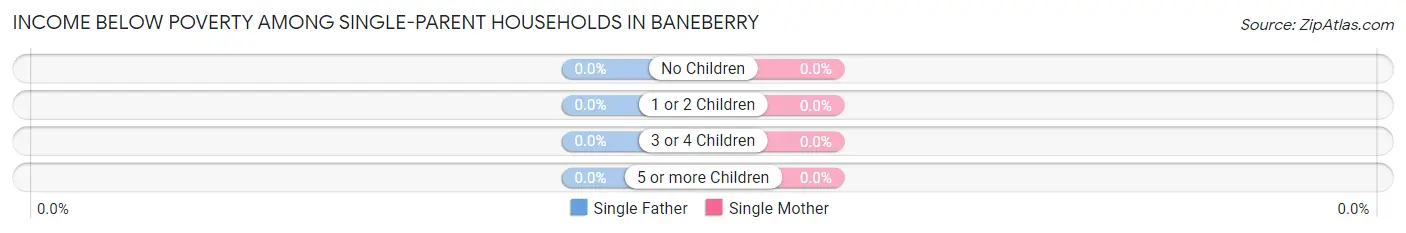
| Children | Single Father | Single Mother |
| No Children | 0 (0.0%) | 0 (0.0%) |
| 1 or 2 Children | 0 (0.0%) | 0 (0.0%) |
| 3 or 4 Children | 0 (0.0%) | 0 (0.0%) |
| 5 or more Children | 0 (0.0%) | 0 (0.0%) |
| Total | 0 (0.0%) | 0 (0.0%) |
Income Below Poverty Among Married-Couple vs Single-Parent Households in Baneberry
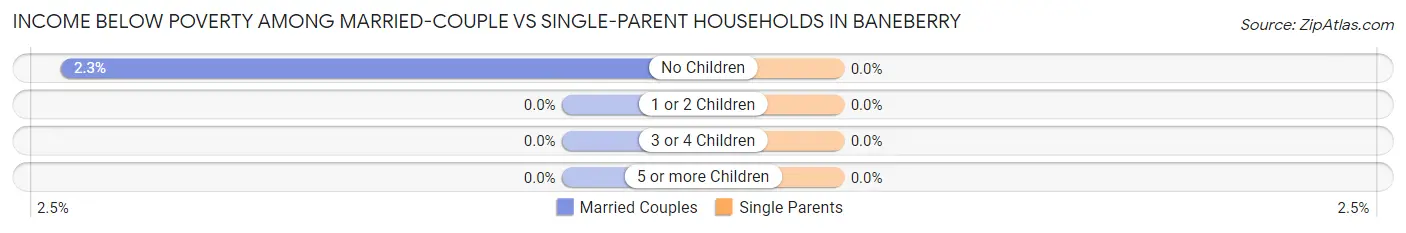
| Children | Married-Couple Families | Single-Parent Households |
| No Children | 3 (2.3%) | 0 (0.0%) |
| 1 or 2 Children | 0 (0.0%) | 0 (0.0%) |
| 3 or 4 Children | 0 (0.0%) | 0 (0.0%) |
| 5 or more Children | 0 (0.0%) | 0 (0.0%) |
| Total | 3 (1.6%) | 0 (0.0%) |
Employment Characteristics in Baneberry
Employment by Class of Employer in Baneberry
Among the 274 employed individuals in Baneberry, private company employees (204 | 74.5%), local government employees (32 | 11.7%), and not-for-profit organizations (18 | 6.6%) make up the most common classes of employment.
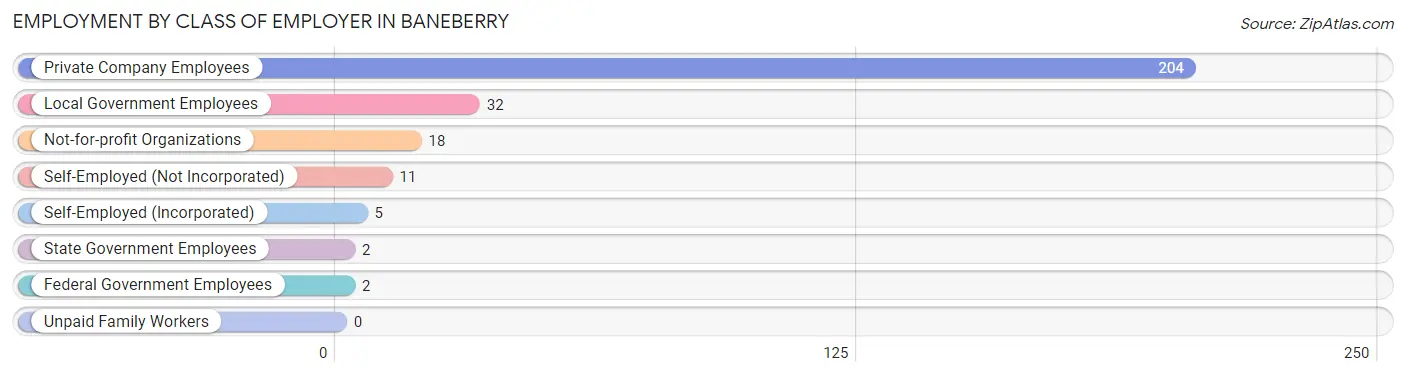
| Employer Class | # Employees | % Employees |
| Private Company Employees | 204 | 74.5% |
| Self-Employed (Incorporated) | 5 | 1.8% |
| Self-Employed (Not Incorporated) | 11 | 4.0% |
| Not-for-profit Organizations | 18 | 6.6% |
| Local Government Employees | 32 | 11.7% |
| State Government Employees | 2 | 0.7% |
| Federal Government Employees | 2 | 0.7% |
| Unpaid Family Workers | 0 | 0.0% |
| Total | 274 | 100.0% |
Employment Status by Age in Baneberry
According to the labor force statistics for Baneberry, out of the total population over 16 years of age (548), 54.2% or 297 individuals are in the labor force, with 7.1% or 21 of them unemployed. The age group with the highest labor force participation rate is 20 to 24 years, with 100.0% or 21 individuals in the labor force. Within the labor force, the 16 to 19 years age range has the highest percentage of unemployed individuals, with 36.5% or 19 of them being unemployed.
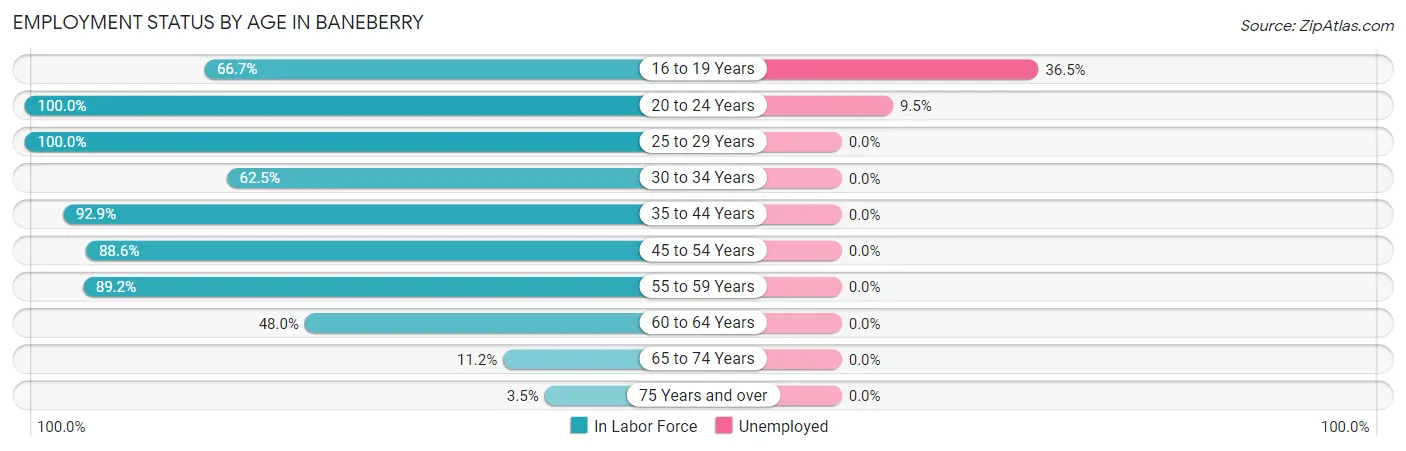
| Age Bracket | In Labor Force | Unemployed |
| 16 to 19 Years | 52 (66.7%) | 19 (36.5%) |
| 20 to 24 Years | 21 (100.0%) | 2 (9.5%) |
| 25 to 29 Years | 8 (100.0%) | 0 (0.0%) |
| 30 to 34 Years | 10 (62.5%) | 0 (0.0%) |
| 35 to 44 Years | 39 (92.9%) | 0 (0.0%) |
| 45 to 54 Years | 93 (88.6%) | 0 (0.0%) |
| 55 to 59 Years | 33 (89.2%) | 0 (0.0%) |
| 60 to 64 Years | 24 (48.0%) | 0 (0.0%) |
| 65 to 74 Years | 15 (11.2%) | 0 (0.0%) |
| 75 Years and over | 2 (3.5%) | 0 (0.0%) |
| Total | 297 (54.2%) | 21 (7.1%) |
Employment Status by Educational Attainment in Baneberry
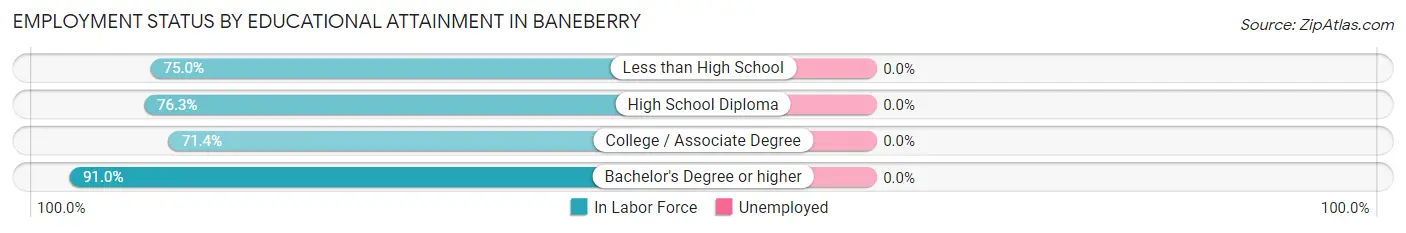
| Educational Attainment | In Labor Force | Unemployed |
| Less than High School | 6 (75.0%) | 0 (0.0%) |
| High School Diploma | 45 (76.3%) | 0 (0.0%) |
| College / Associate Degree | 65 (71.4%) | 0 (0.0%) |
| Bachelor's Degree or higher | 91 (91.0%) | 0 (0.0%) |
| Total | 207 (80.2%) | 0 (0.0%) |
Employment Occupations by Sex in Baneberry
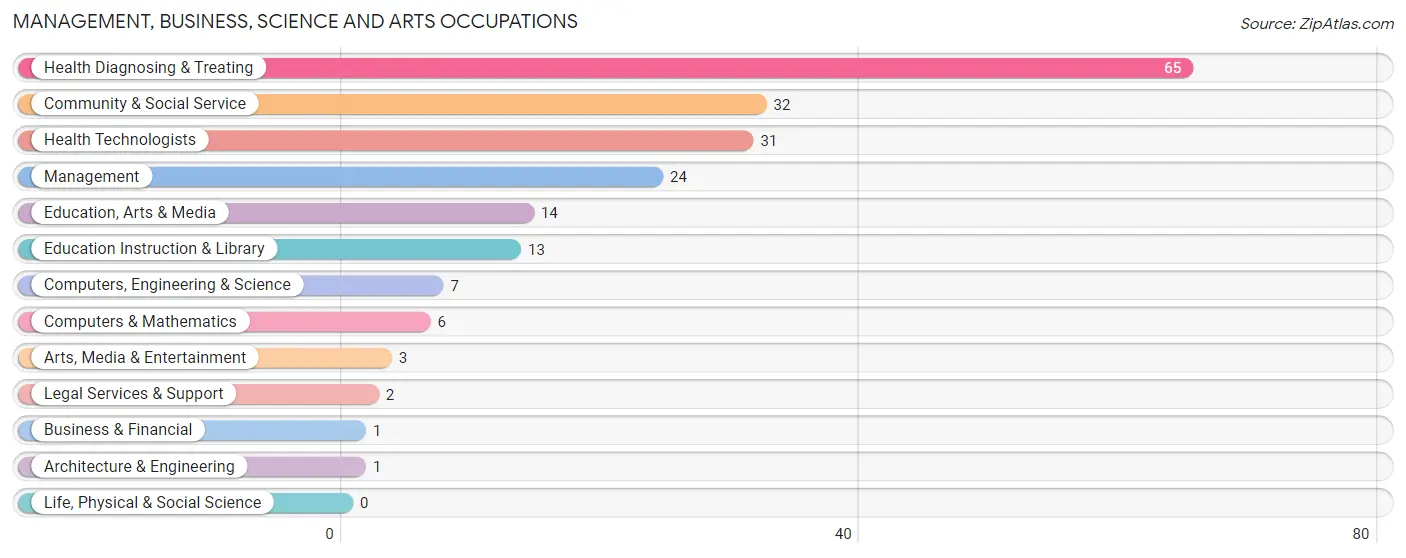
Management, Business, Science and Arts Occupations
The most common Management, Business, Science and Arts occupations in Baneberry are Health Diagnosing & Treating (65 | 23.5%), Community & Social Service (32 | 11.6%), Health Technologists (31 | 11.2%), Management (24 | 8.7%), and Education, Arts & Media (14 | 5.1%).
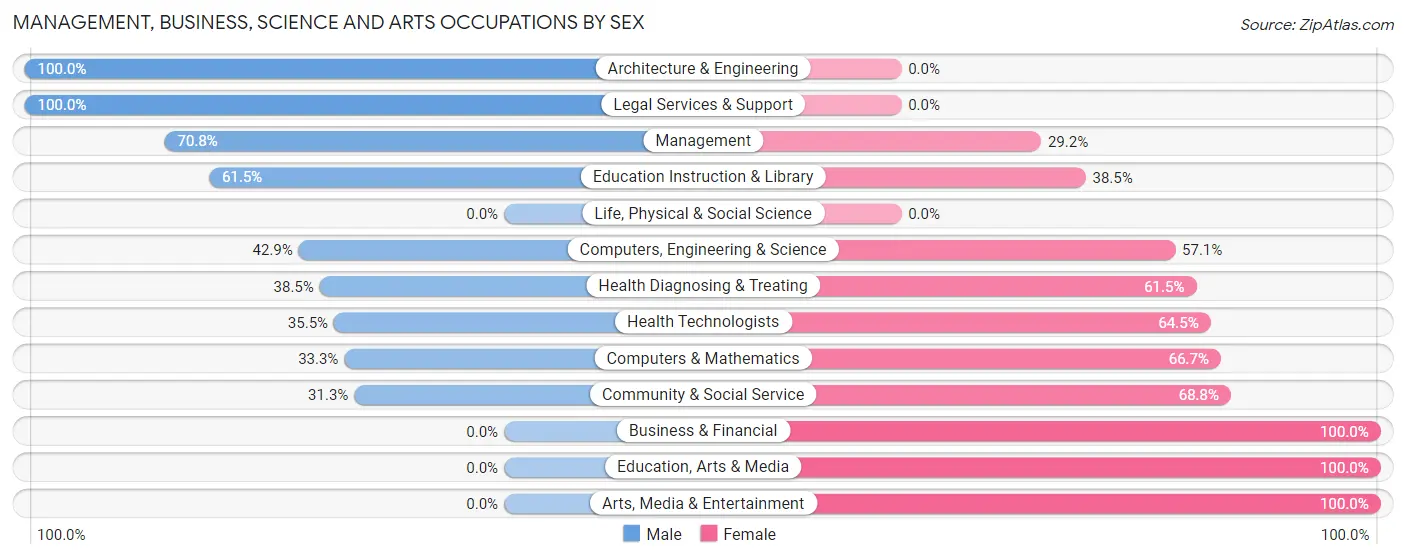
Management, Business, Science and Arts Occupations by Sex
Within the Management, Business, Science and Arts occupations in Baneberry, the most male-oriented occupations are Architecture & Engineering (100.0%), Legal Services & Support (100.0%), and Management (70.8%), while the most female-oriented occupations are Business & Financial (100.0%), Education, Arts & Media (100.0%), and Arts, Media & Entertainment (100.0%).
| Occupation | Male | Female |
| Management | 17 (70.8%) | 7 (29.2%) |
| Business & Financial | 0 (0.0%) | 1 (100.0%) |
| Computers, Engineering & Science | 3 (42.9%) | 4 (57.1%) |
| Computers & Mathematics | 2 (33.3%) | 4 (66.7%) |
| Architecture & Engineering | 1 (100.0%) | 0 (0.0%) |
| Life, Physical & Social Science | 0 (0.0%) | 0 (0.0%) |
| Community & Social Service | 10 (31.2%) | 22 (68.8%) |
| Education, Arts & Media | 0 (0.0%) | 14 (100.0%) |
| Legal Services & Support | 2 (100.0%) | 0 (0.0%) |
| Education Instruction & Library | 8 (61.5%) | 5 (38.5%) |
| Arts, Media & Entertainment | 0 (0.0%) | 3 (100.0%) |
| Health Diagnosing & Treating | 25 (38.5%) | 40 (61.5%) |
| Health Technologists | 11 (35.5%) | 20 (64.5%) |
| Total (Category) | 55 (42.6%) | 74 (57.4%) |
| Total (Overall) | 153 (55.4%) | 123 (44.6%) |
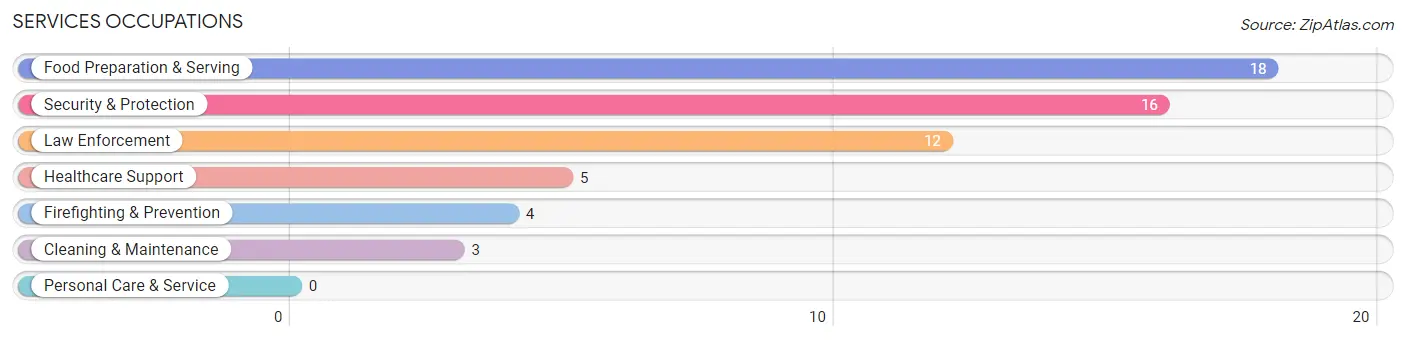
Services Occupations
The most common Services occupations in Baneberry are Food Preparation & Serving (18 | 6.5%), Security & Protection (16 | 5.8%), Law Enforcement (12 | 4.3%), Healthcare Support (5 | 1.8%), and Firefighting & Prevention (4 | 1.5%).
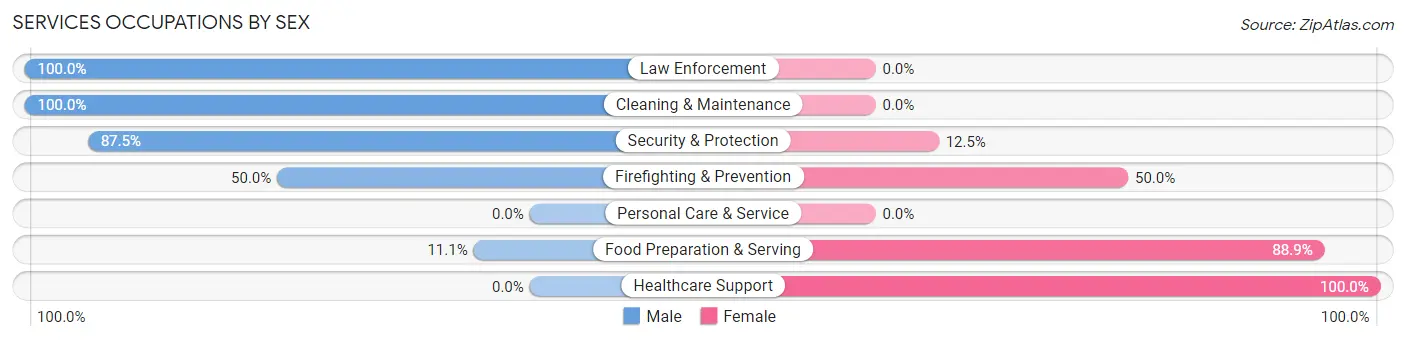
Services Occupations by Sex
Within the Services occupations in Baneberry, the most male-oriented occupations are Law Enforcement (100.0%), Cleaning & Maintenance (100.0%), and Security & Protection (87.5%), while the most female-oriented occupations are Healthcare Support (100.0%), Food Preparation & Serving (88.9%), and Firefighting & Prevention (50.0%).
| Occupation | Male | Female |
| Healthcare Support | 0 (0.0%) | 5 (100.0%) |
| Security & Protection | 14 (87.5%) | 2 (12.5%) |
| Firefighting & Prevention | 2 (50.0%) | 2 (50.0%) |
| Law Enforcement | 12 (100.0%) | 0 (0.0%) |
| Food Preparation & Serving | 2 (11.1%) | 16 (88.9%) |
| Cleaning & Maintenance | 3 (100.0%) | 0 (0.0%) |
| Personal Care & Service | 0 (0.0%) | 0 (0.0%) |
| Total (Category) | 19 (45.2%) | 23 (54.8%) |
| Total (Overall) | 153 (55.4%) | 123 (44.6%) |
Sales and Office Occupations
The most common Sales and Office occupations in Baneberry are Sales & Related (42 | 15.2%), and Office & Administration (10 | 3.6%).
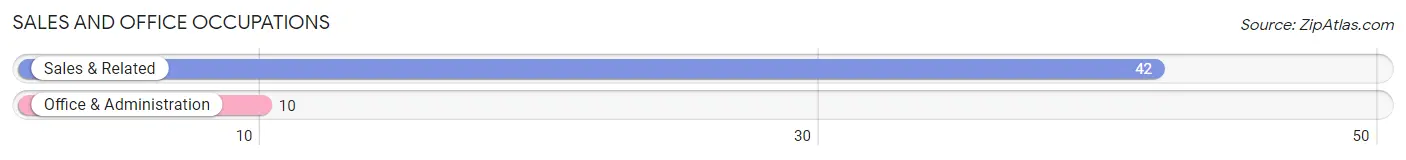
Sales and Office Occupations by Sex
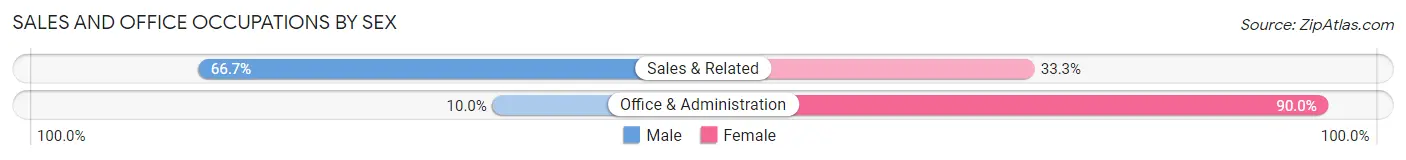
| Occupation | Male | Female |
| Sales & Related | 28 (66.7%) | 14 (33.3%) |
| Office & Administration | 1 (10.0%) | 9 (90.0%) |
| Total (Category) | 29 (55.8%) | 23 (44.2%) |
| Total (Overall) | 153 (55.4%) | 123 (44.6%) |
Natural Resources, Construction and Maintenance Occupations
The most common Natural Resources, Construction and Maintenance occupations in Baneberry are Construction & Extraction (16 | 5.8%), and Installation, Maintenance & Repair (8 | 2.9%).
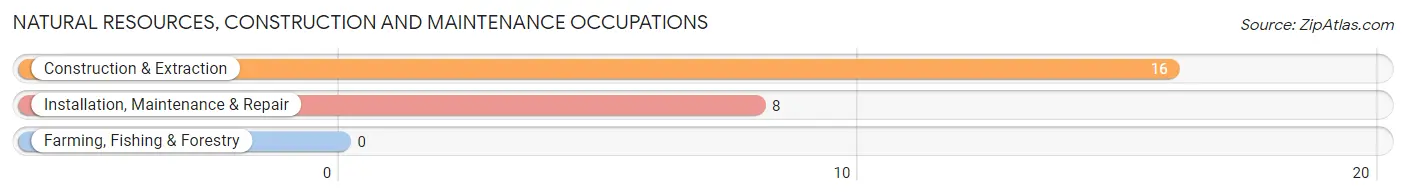
Natural Resources, Construction and Maintenance Occupations by Sex
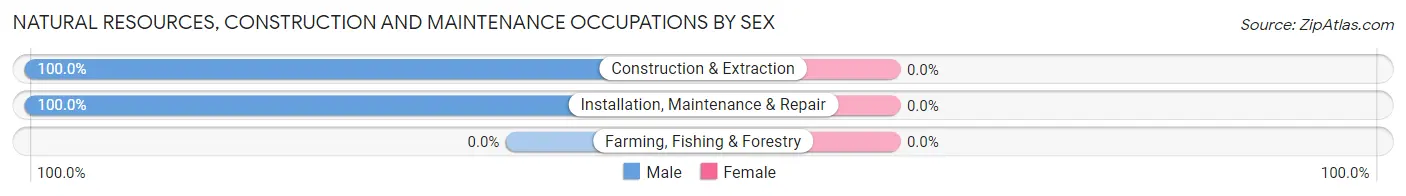
| Occupation | Male | Female |
| Farming, Fishing & Forestry | 0 (0.0%) | 0 (0.0%) |
| Construction & Extraction | 16 (100.0%) | 0 (0.0%) |
| Installation, Maintenance & Repair | 8 (100.0%) | 0 (0.0%) |
| Total (Category) | 24 (100.0%) | 0 (0.0%) |
| Total (Overall) | 153 (55.4%) | 123 (44.6%) |
Production, Transportation and Moving Occupations
The most common Production, Transportation and Moving occupations in Baneberry are Material Moving (13 | 4.7%), Production (9 | 3.3%), and Transportation (7 | 2.5%).
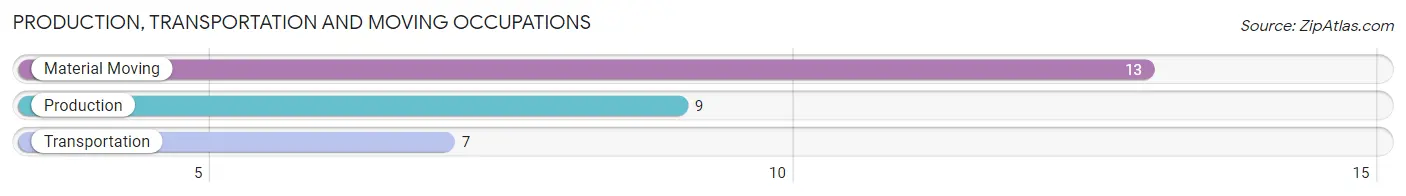
Production, Transportation and Moving Occupations by Sex
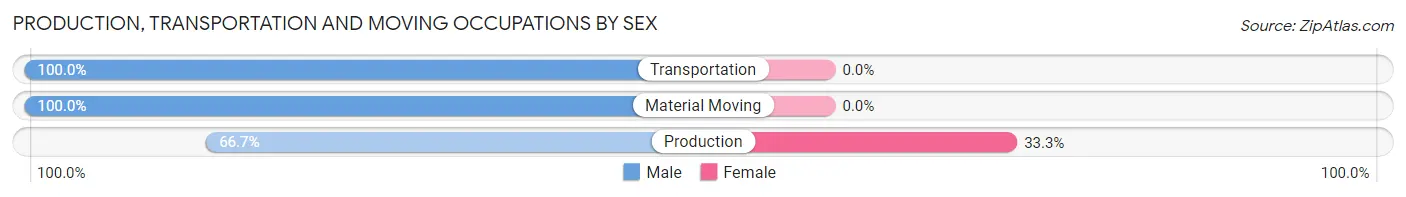
| Occupation | Male | Female |
| Production | 6 (66.7%) | 3 (33.3%) |
| Transportation | 7 (100.0%) | 0 (0.0%) |
| Material Moving | 13 (100.0%) | 0 (0.0%) |
| Total (Category) | 26 (89.7%) | 3 (10.3%) |
| Total (Overall) | 153 (55.4%) | 123 (44.6%) |
Employment Industries by Sex in Baneberry
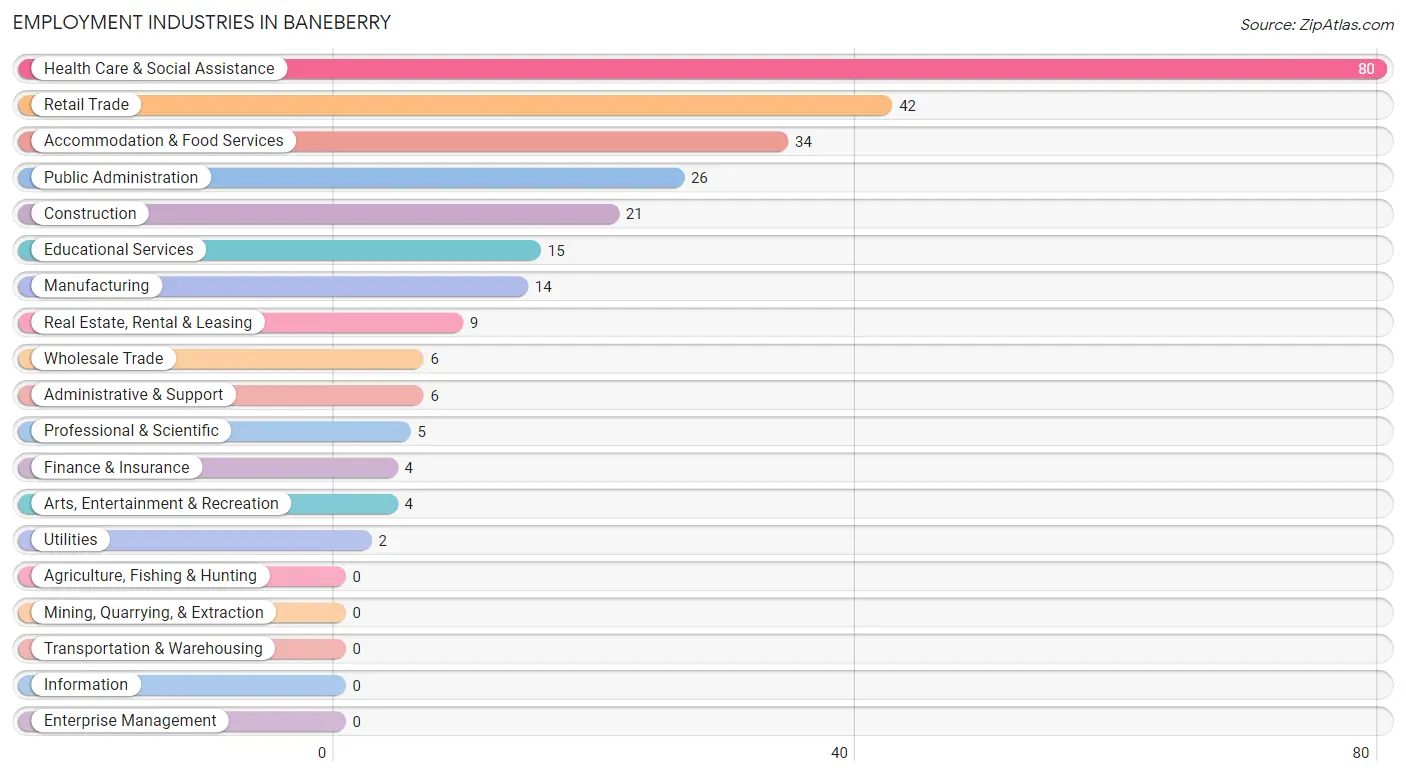
Employment Industries in Baneberry
The major employment industries in Baneberry include Health Care & Social Assistance (80 | 29.0%), Retail Trade (42 | 15.2%), Accommodation & Food Services (34 | 12.3%), Public Administration (26 | 9.4%), and Construction (21 | 7.6%).
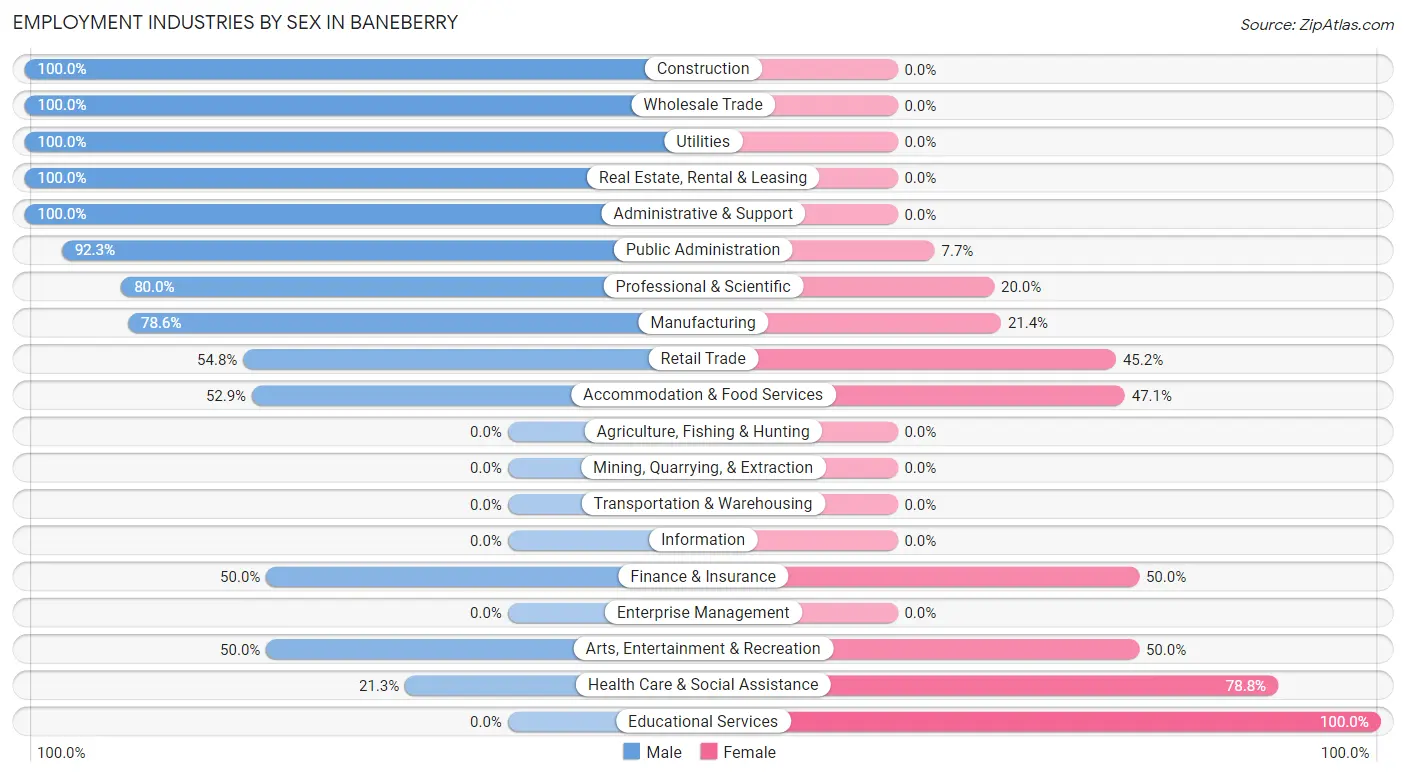
Employment Industries by Sex in Baneberry
The Baneberry industries that see more men than women are Construction (100.0%), Wholesale Trade (100.0%), and Utilities (100.0%), whereas the industries that tend to have a higher number of women are Educational Services (100.0%), Health Care & Social Assistance (78.7%), and Finance & Insurance (50.0%).
| Industry | Male | Female |
| Agriculture, Fishing & Hunting | 0 (0.0%) | 0 (0.0%) |
| Mining, Quarrying, & Extraction | 0 (0.0%) | 0 (0.0%) |
| Construction | 21 (100.0%) | 0 (0.0%) |
| Manufacturing | 11 (78.6%) | 3 (21.4%) |
| Wholesale Trade | 6 (100.0%) | 0 (0.0%) |
| Retail Trade | 23 (54.8%) | 19 (45.2%) |
| Transportation & Warehousing | 0 (0.0%) | 0 (0.0%) |
| Utilities | 2 (100.0%) | 0 (0.0%) |
| Information | 0 (0.0%) | 0 (0.0%) |
| Finance & Insurance | 2 (50.0%) | 2 (50.0%) |
| Real Estate, Rental & Leasing | 9 (100.0%) | 0 (0.0%) |
| Professional & Scientific | 4 (80.0%) | 1 (20.0%) |
| Enterprise Management | 0 (0.0%) | 0 (0.0%) |
| Administrative & Support | 6 (100.0%) | 0 (0.0%) |
| Educational Services | 0 (0.0%) | 15 (100.0%) |
| Health Care & Social Assistance | 17 (21.2%) | 63 (78.7%) |
| Arts, Entertainment & Recreation | 2 (50.0%) | 2 (50.0%) |
| Accommodation & Food Services | 18 (52.9%) | 16 (47.1%) |
| Public Administration | 24 (92.3%) | 2 (7.7%) |
| Total | 153 (55.4%) | 123 (44.6%) |
Education in Baneberry
School Enrollment in Baneberry
The most common levels of schooling among the 124 students in Baneberry are high school (92 | 74.2%), college / undergraduate (17 | 13.7%), and middle school (12 | 9.7%).
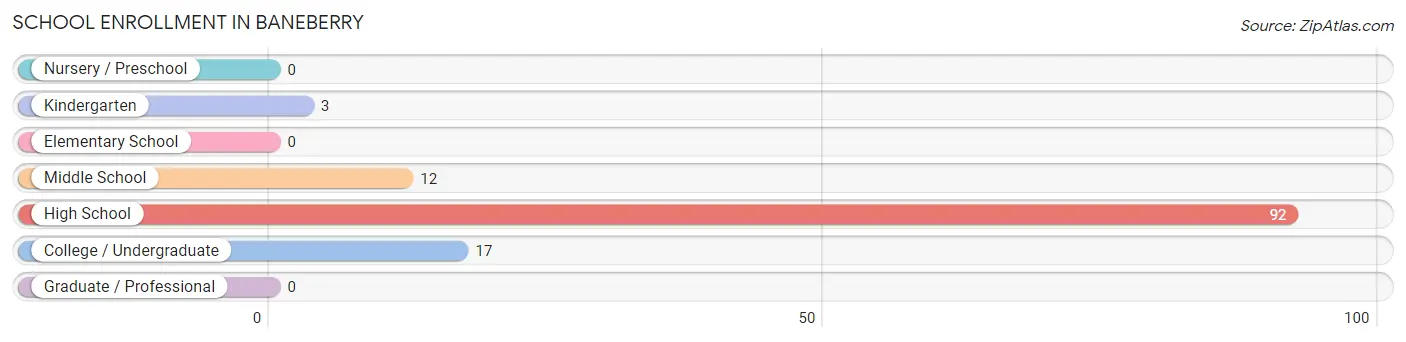
| School Level | # Students | % Students |
| Nursery / Preschool | 0 | 0.0% |
| Kindergarten | 3 | 2.4% |
| Elementary School | 0 | 0.0% |
| Middle School | 12 | 9.7% |
| High School | 92 | 74.2% |
| College / Undergraduate | 17 | 13.7% |
| Graduate / Professional | 0 | 0.0% |
| Total | 124 | 100.0% |
School Enrollment by Age by Funding Source in Baneberry
Out of a total of 124 students who are enrolled in schools in Baneberry, 16 (12.9%) attend a private institution, while the remaining 108 (87.1%) are enrolled in public schools. The age group of 25 to 34 year olds has the highest likelihood of being enrolled in private schools, with 3 (60.0% in the age bracket) enrolled. Conversely, the age group of 5 to 9 year old has the lowest likelihood of being enrolled in a private school, with 3 (100.0% in the age bracket) attending a public institution.
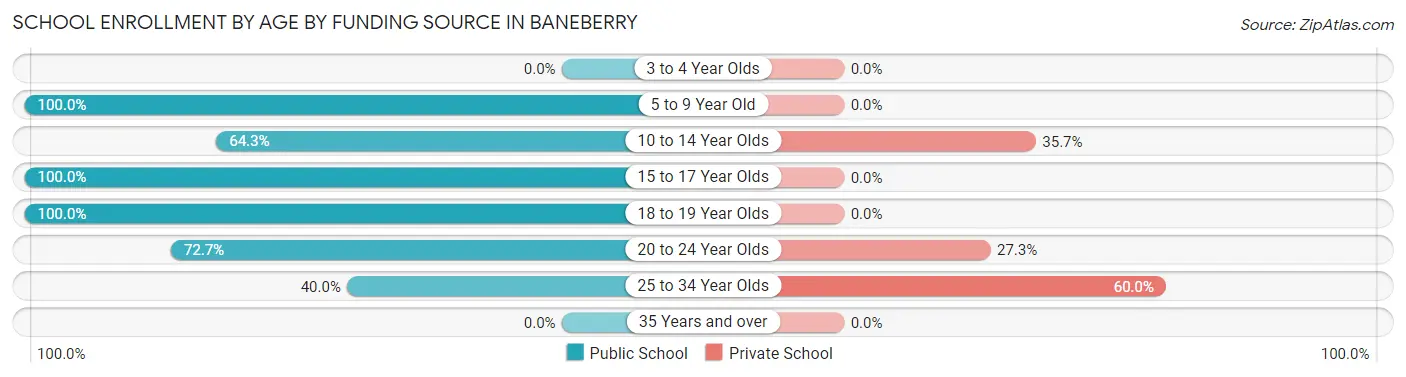
| Age Bracket | Public School | Private School |
| 3 to 4 Year Olds | 0 (0.0%) | 0 (0.0%) |
| 5 to 9 Year Old | 3 (100.0%) | 0 (0.0%) |
| 10 to 14 Year Olds | 18 (64.3%) | 10 (35.7%) |
| 15 to 17 Year Olds | 63 (100.0%) | 0 (0.0%) |
| 18 to 19 Year Olds | 14 (100.0%) | 0 (0.0%) |
| 20 to 24 Year Olds | 8 (72.7%) | 3 (27.3%) |
| 25 to 34 Year Olds | 2 (40.0%) | 3 (60.0%) |
| 35 Years and over | 0 (0.0%) | 0 (0.0%) |
| Total | 108 (87.1%) | 16 (12.9%) |
Educational Attainment by Field of Study in Baneberry
Business (49 | 26.5%), science & technology (33 | 17.8%), bio, nature & agricultural (21 | 11.4%), communications (17 | 9.2%), and education (14 | 7.6%) are the most common fields of study among 185 individuals in Baneberry who have obtained a bachelor's degree or higher.
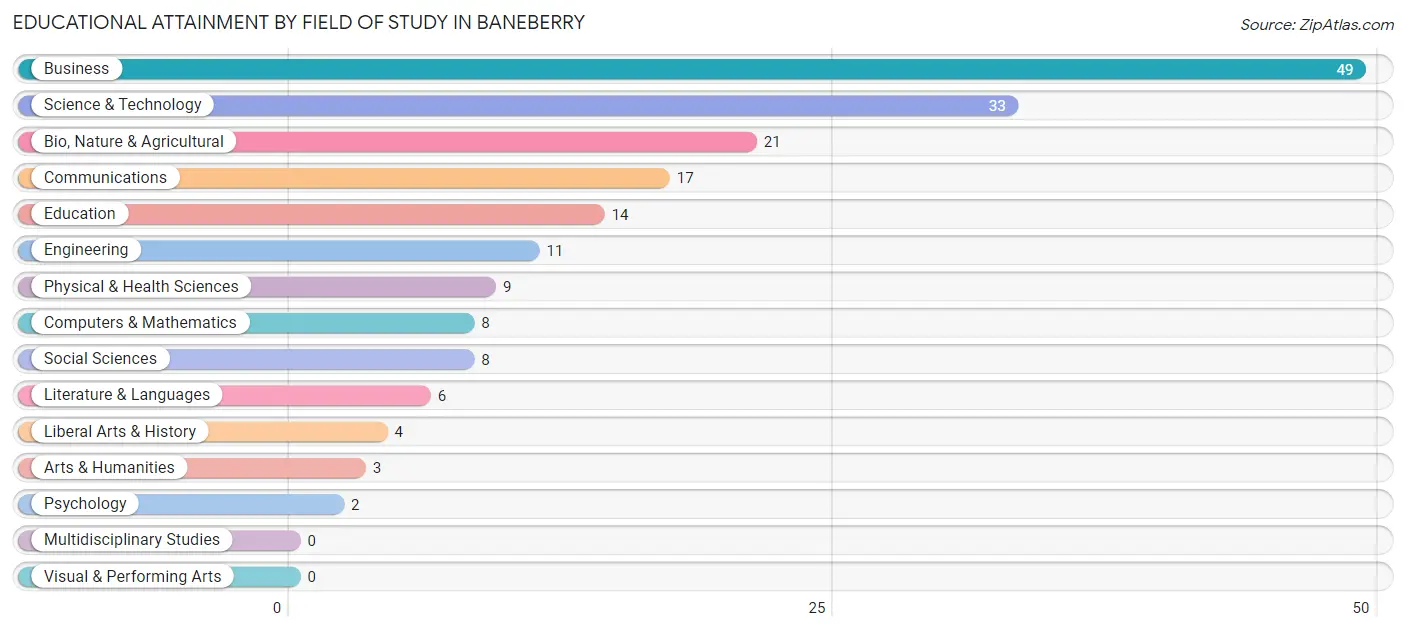
| Field of Study | # Graduates | % Graduates |
| Computers & Mathematics | 8 | 4.3% |
| Bio, Nature & Agricultural | 21 | 11.4% |
| Physical & Health Sciences | 9 | 4.9% |
| Psychology | 2 | 1.1% |
| Social Sciences | 8 | 4.3% |
| Engineering | 11 | 5.9% |
| Multidisciplinary Studies | 0 | 0.0% |
| Science & Technology | 33 | 17.8% |
| Business | 49 | 26.5% |
| Education | 14 | 7.6% |
| Literature & Languages | 6 | 3.2% |
| Liberal Arts & History | 4 | 2.2% |
| Visual & Performing Arts | 0 | 0.0% |
| Communications | 17 | 9.2% |
| Arts & Humanities | 3 | 1.6% |
| Total | 185 | 100.0% |
Transportation & Commute in Baneberry
Vehicle Availability by Sex in Baneberry
The most prevalent vehicle ownership categories in Baneberry are males with 3 vehicles (52, accounting for 34.4%) and females with 3 vehicles (35, making up 42.3%).
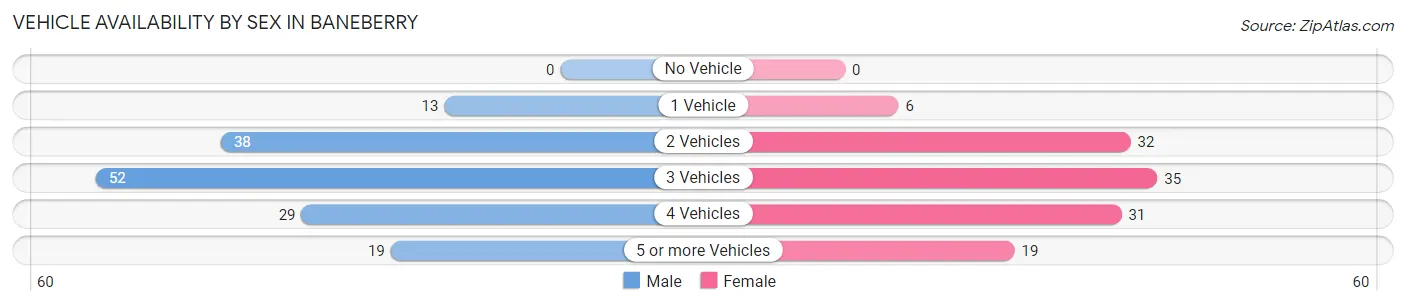
| Vehicles Available | Male | Female |
| No Vehicle | 0 (0.0%) | 0 (0.0%) |
| 1 Vehicle | 13 (8.6%) | 6 (4.9%) |
| 2 Vehicles | 38 (25.2%) | 32 (26.0%) |
| 3 Vehicles | 52 (34.4%) | 35 (28.5%) |
| 4 Vehicles | 29 (19.2%) | 31 (25.2%) |
| 5 or more Vehicles | 19 (12.6%) | 19 (15.4%) |
| Total | 151 (100.0%) | 123 (100.0%) |
Commute Time in Baneberry
The most frequently occuring commute durations in Baneberry are 30 to 34 minutes (44 commuters, 17.6%), 45 to 59 minutes (43 commuters, 17.2%), and 60 to 89 minutes (37 commuters, 14.8%).
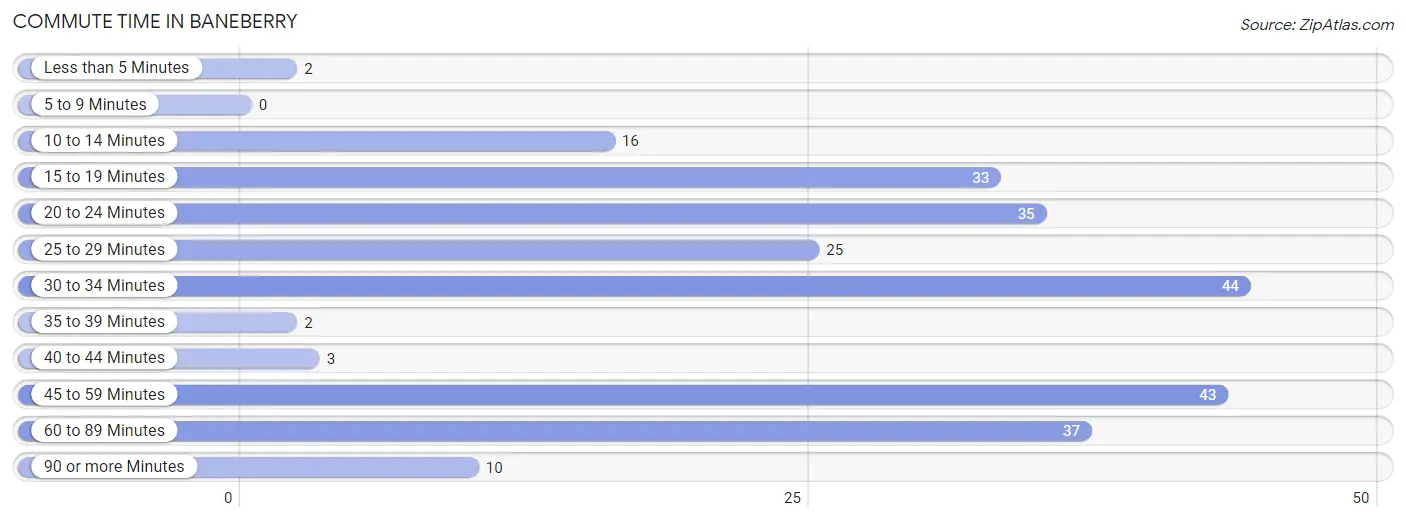
| Commute Time | # Commuters | % Commuters |
| Less than 5 Minutes | 2 | 0.8% |
| 5 to 9 Minutes | 0 | 0.0% |
| 10 to 14 Minutes | 16 | 6.4% |
| 15 to 19 Minutes | 33 | 13.2% |
| 20 to 24 Minutes | 35 | 14.0% |
| 25 to 29 Minutes | 25 | 10.0% |
| 30 to 34 Minutes | 44 | 17.6% |
| 35 to 39 Minutes | 2 | 0.8% |
| 40 to 44 Minutes | 3 | 1.2% |
| 45 to 59 Minutes | 43 | 17.2% |
| 60 to 89 Minutes | 37 | 14.8% |
| 90 or more Minutes | 10 | 4.0% |
Commute Time by Sex in Baneberry
The most common commute times in Baneberry are 30 to 34 minutes (33 commuters, 23.6%) for males and 20 to 24 minutes (28 commuters, 25.5%) for females.
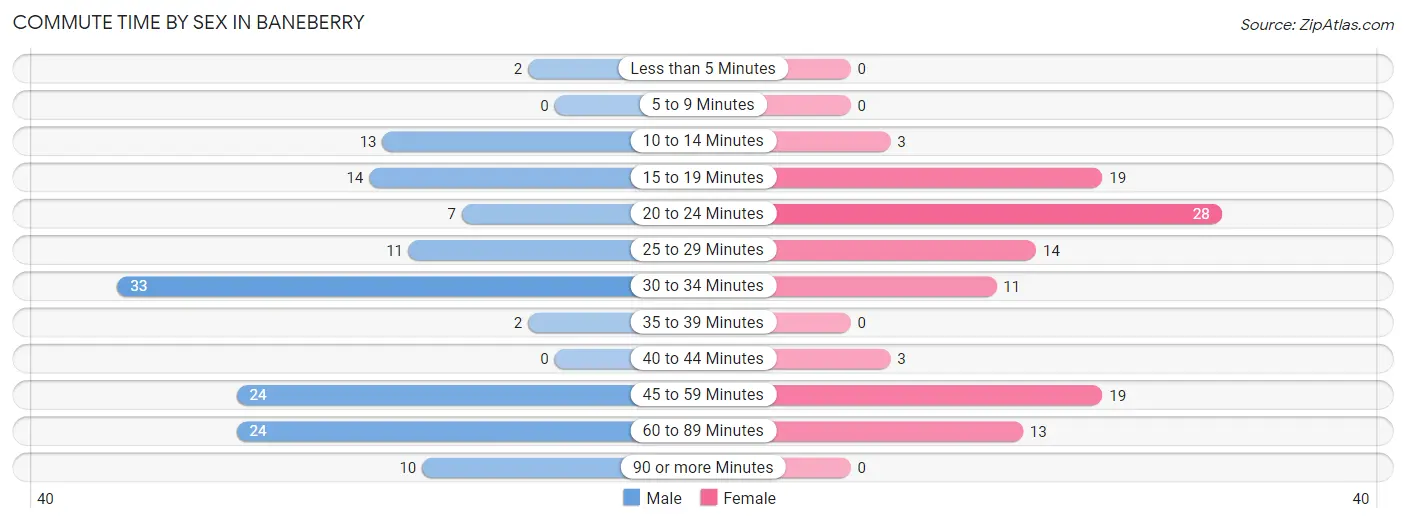
| Commute Time | Male | Female |
| Less than 5 Minutes | 2 (1.4%) | 0 (0.0%) |
| 5 to 9 Minutes | 0 (0.0%) | 0 (0.0%) |
| 10 to 14 Minutes | 13 (9.3%) | 3 (2.7%) |
| 15 to 19 Minutes | 14 (10.0%) | 19 (17.3%) |
| 20 to 24 Minutes | 7 (5.0%) | 28 (25.5%) |
| 25 to 29 Minutes | 11 (7.9%) | 14 (12.7%) |
| 30 to 34 Minutes | 33 (23.6%) | 11 (10.0%) |
| 35 to 39 Minutes | 2 (1.4%) | 0 (0.0%) |
| 40 to 44 Minutes | 0 (0.0%) | 3 (2.7%) |
| 45 to 59 Minutes | 24 (17.1%) | 19 (17.3%) |
| 60 to 89 Minutes | 24 (17.1%) | 13 (11.8%) |
| 90 or more Minutes | 10 (7.1%) | 0 (0.0%) |
Time of Departure to Work by Sex in Baneberry
The most frequent times of departure to work in Baneberry are 7:30 AM to 7:59 AM (37, 26.4%) for males and 7:00 AM to 7:29 AM (33, 30.0%) for females.
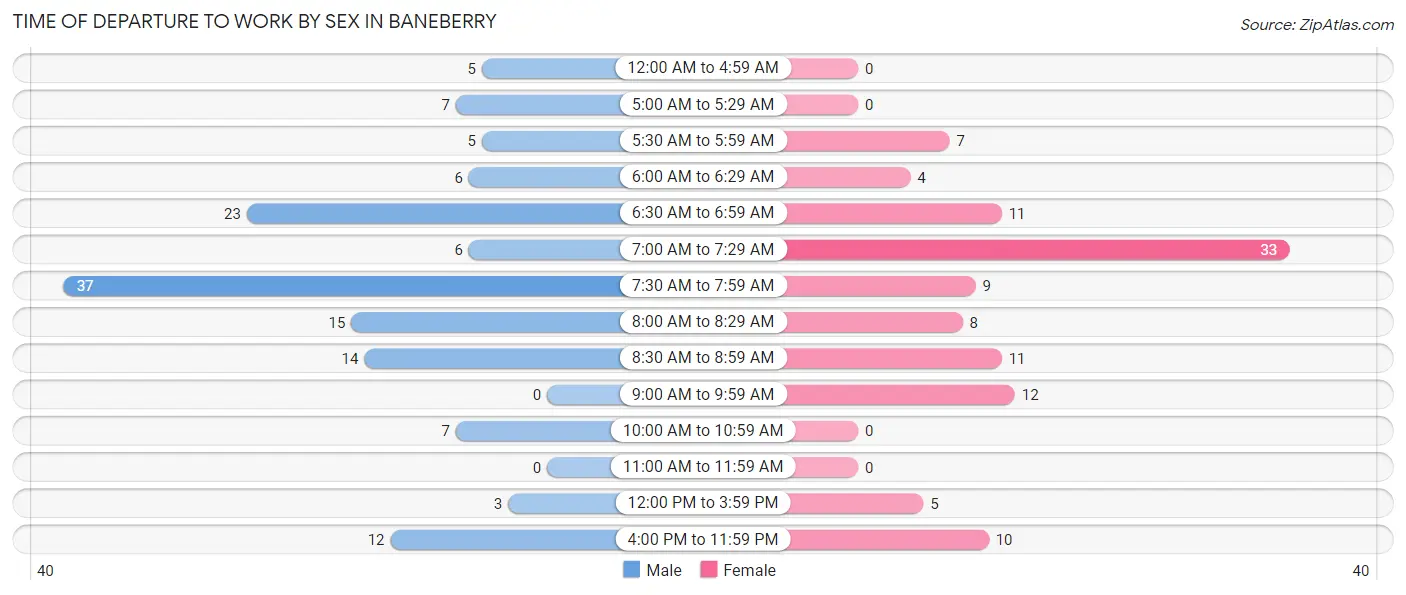
| Time of Departure | Male | Female |
| 12:00 AM to 4:59 AM | 5 (3.6%) | 0 (0.0%) |
| 5:00 AM to 5:29 AM | 7 (5.0%) | 0 (0.0%) |
| 5:30 AM to 5:59 AM | 5 (3.6%) | 7 (6.4%) |
| 6:00 AM to 6:29 AM | 6 (4.3%) | 4 (3.6%) |
| 6:30 AM to 6:59 AM | 23 (16.4%) | 11 (10.0%) |
| 7:00 AM to 7:29 AM | 6 (4.3%) | 33 (30.0%) |
| 7:30 AM to 7:59 AM | 37 (26.4%) | 9 (8.2%) |
| 8:00 AM to 8:29 AM | 15 (10.7%) | 8 (7.3%) |
| 8:30 AM to 8:59 AM | 14 (10.0%) | 11 (10.0%) |
| 9:00 AM to 9:59 AM | 0 (0.0%) | 12 (10.9%) |
| 10:00 AM to 10:59 AM | 7 (5.0%) | 0 (0.0%) |
| 11:00 AM to 11:59 AM | 0 (0.0%) | 0 (0.0%) |
| 12:00 PM to 3:59 PM | 3 (2.1%) | 5 (4.5%) |
| 4:00 PM to 11:59 PM | 12 (8.6%) | 10 (9.1%) |
| Total | 140 (100.0%) | 110 (100.0%) |
Housing Occupancy in Baneberry
Occupancy by Ownership in Baneberry
Of the total 246 dwellings in Baneberry, owner-occupied units account for 231 (93.9%), while renter-occupied units make up 15 (6.1%).
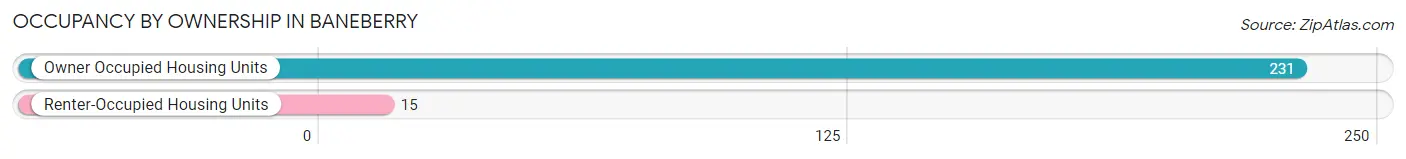
| Occupancy | # Housing Units | % Housing Units |
| Owner Occupied Housing Units | 231 | 93.9% |
| Renter-Occupied Housing Units | 15 | 6.1% |
| Total Occupied Housing Units | 246 | 100.0% |
Occupancy by Household Size in Baneberry
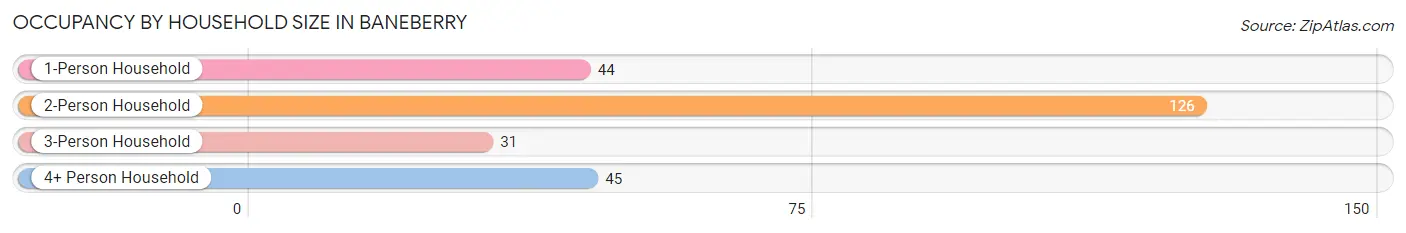
| Household Size | # Housing Units | % Housing Units |
| 1-Person Household | 44 | 17.9% |
| 2-Person Household | 126 | 51.2% |
| 3-Person Household | 31 | 12.6% |
| 4+ Person Household | 45 | 18.3% |
| Total Housing Units | 246 | 100.0% |
Occupancy by Ownership by Household Size in Baneberry
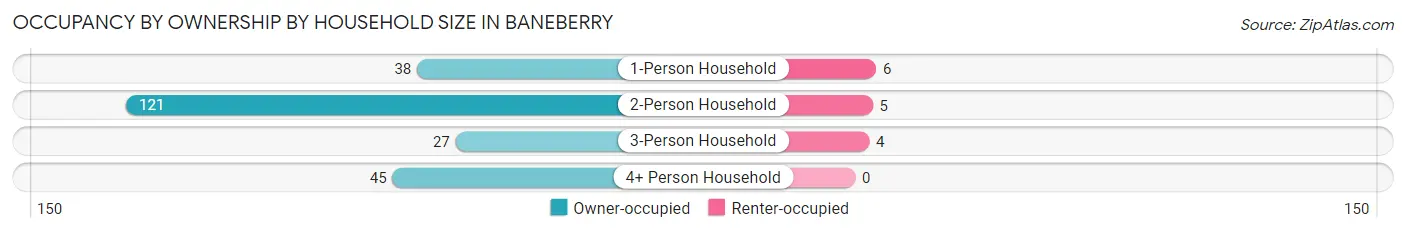
| Household Size | Owner-occupied | Renter-occupied |
| 1-Person Household | 38 (86.4%) | 6 (13.6%) |
| 2-Person Household | 121 (96.0%) | 5 (4.0%) |
| 3-Person Household | 27 (87.1%) | 4 (12.9%) |
| 4+ Person Household | 45 (100.0%) | 0 (0.0%) |
| Total Housing Units | 231 (93.9%) | 15 (6.1%) |
Occupancy by Educational Attainment in Baneberry
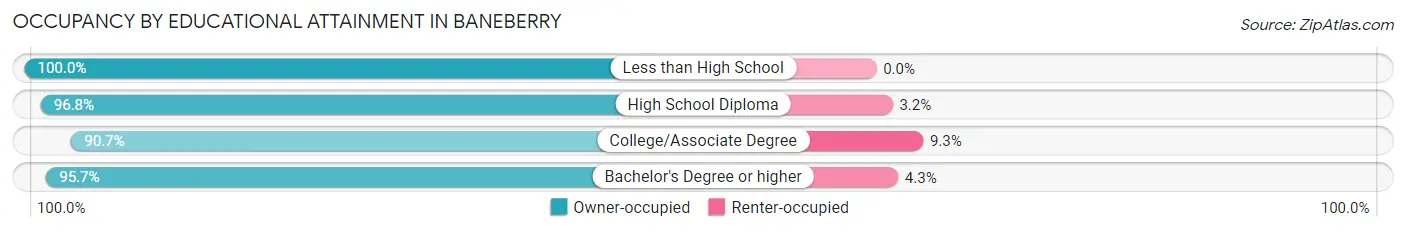
| Household Size | Owner-occupied | Renter-occupied |
| Less than High School | 2 (100.0%) | 0 (0.0%) |
| High School Diploma | 30 (96.8%) | 1 (3.2%) |
| College/Associate Degree | 88 (90.7%) | 9 (9.3%) |
| Bachelor's Degree or higher | 111 (95.7%) | 5 (4.3%) |
Occupancy by Age of Householder in Baneberry
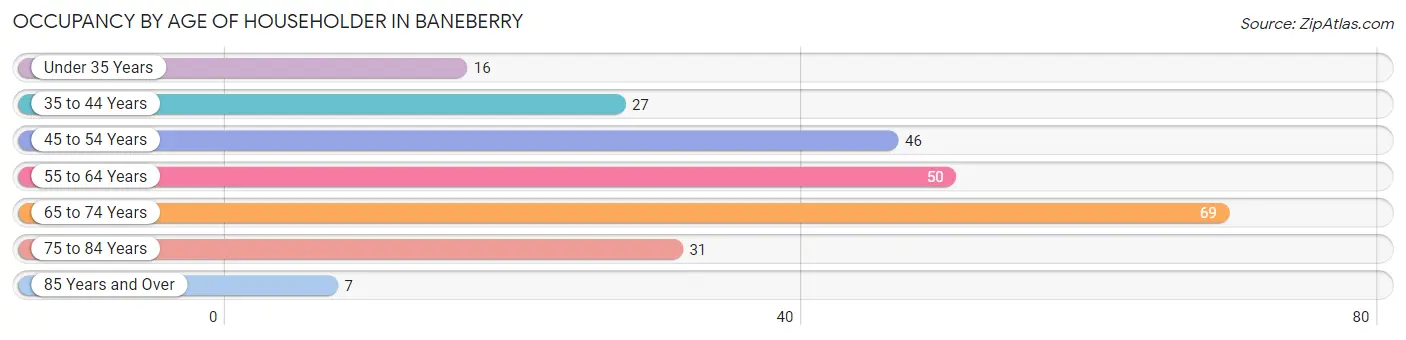
| Age Bracket | # Households | % Households |
| Under 35 Years | 16 | 6.5% |
| 35 to 44 Years | 27 | 11.0% |
| 45 to 54 Years | 46 | 18.7% |
| 55 to 64 Years | 50 | 20.3% |
| 65 to 74 Years | 69 | 28.1% |
| 75 to 84 Years | 31 | 12.6% |
| 85 Years and Over | 7 | 2.9% |
| Total | 246 | 100.0% |
Housing Finances in Baneberry
Median Income by Occupancy in Baneberry
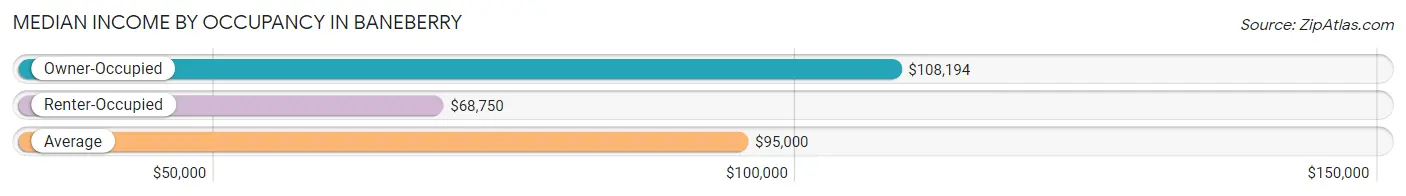
| Occupancy Type | # Households | Median Income |
| Owner-Occupied | 231 (93.9%) | $108,194 |
| Renter-Occupied | 15 (6.1%) | $68,750 |
| Average | 246 (100.0%) | $95,000 |
Occupancy by Householder Income Bracket in Baneberry
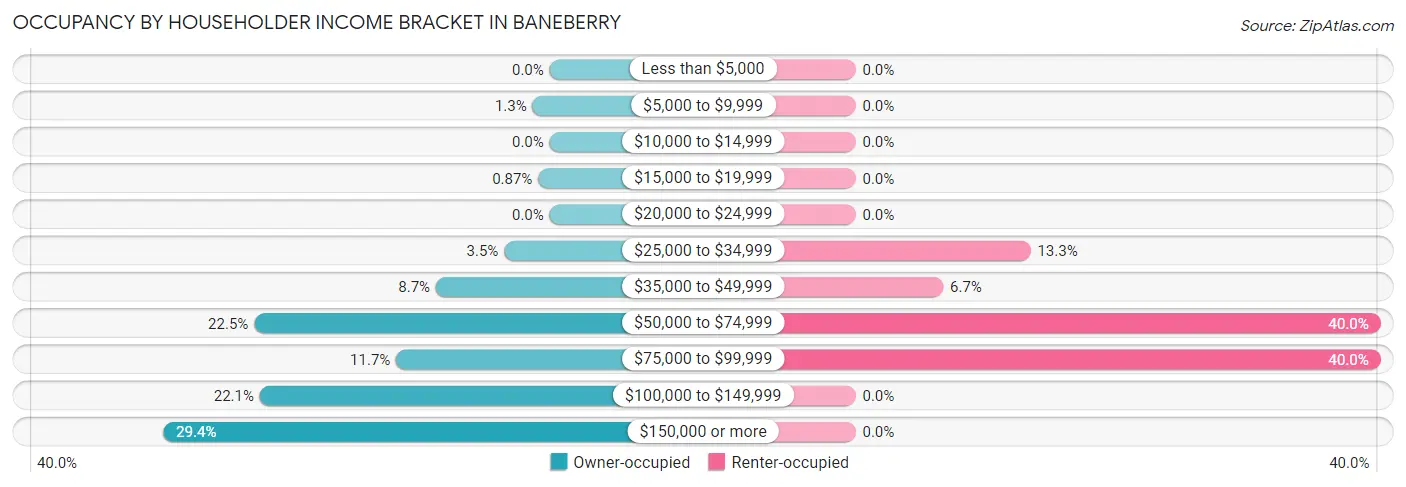
| Income Bracket | Owner-occupied | Renter-occupied |
| Less than $5,000 | 0 (0.0%) | 0 (0.0%) |
| $5,000 to $9,999 | 3 (1.3%) | 0 (0.0%) |
| $10,000 to $14,999 | 0 (0.0%) | 0 (0.0%) |
| $15,000 to $19,999 | 2 (0.9%) | 0 (0.0%) |
| $20,000 to $24,999 | 0 (0.0%) | 0 (0.0%) |
| $25,000 to $34,999 | 8 (3.5%) | 2 (13.3%) |
| $35,000 to $49,999 | 20 (8.7%) | 1 (6.7%) |
| $50,000 to $74,999 | 52 (22.5%) | 6 (40.0%) |
| $75,000 to $99,999 | 27 (11.7%) | 6 (40.0%) |
| $100,000 to $149,999 | 51 (22.1%) | 0 (0.0%) |
| $150,000 or more | 68 (29.4%) | 0 (0.0%) |
| Total | 231 (100.0%) | 15 (100.0%) |
Monthly Housing Cost Tiers in Baneberry
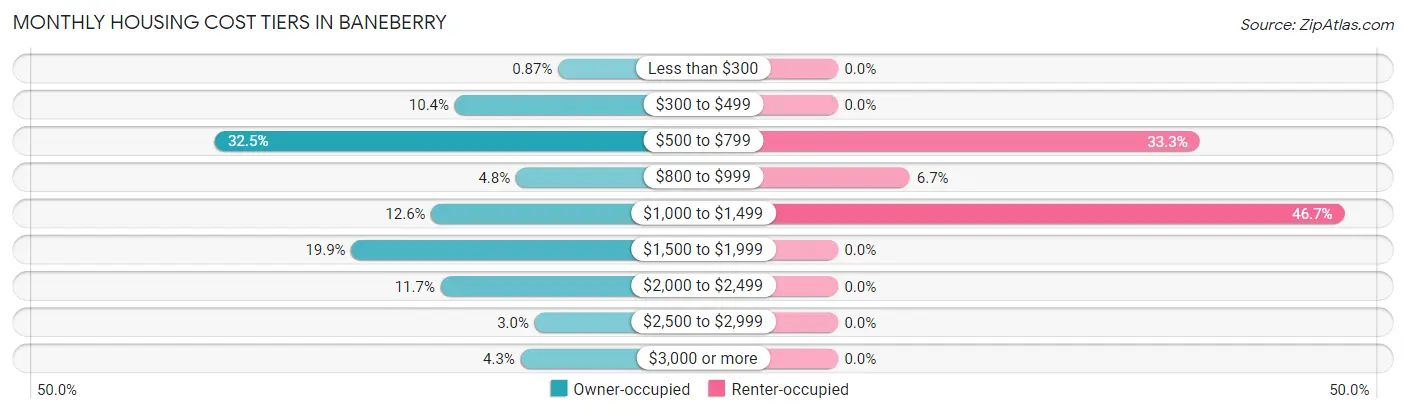
| Monthly Cost | Owner-occupied | Renter-occupied |
| Less than $300 | 2 (0.9%) | 0 (0.0%) |
| $300 to $499 | 24 (10.4%) | 0 (0.0%) |
| $500 to $799 | 75 (32.5%) | 5 (33.3%) |
| $800 to $999 | 11 (4.8%) | 1 (6.7%) |
| $1,000 to $1,499 | 29 (12.6%) | 7 (46.7%) |
| $1,500 to $1,999 | 46 (19.9%) | 0 (0.0%) |
| $2,000 to $2,499 | 27 (11.7%) | 0 (0.0%) |
| $2,500 to $2,999 | 7 (3.0%) | 0 (0.0%) |
| $3,000 or more | 10 (4.3%) | 0 (0.0%) |
| Total | 231 (100.0%) | 15 (100.0%) |
Physical Housing Characteristics in Baneberry
Housing Structures in Baneberry
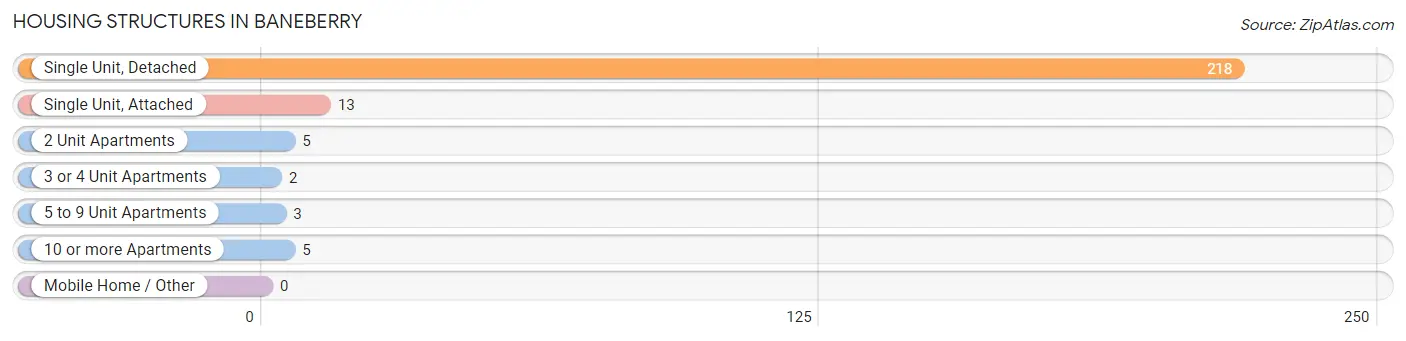
| Structure Type | # Housing Units | % Housing Units |
| Single Unit, Detached | 218 | 88.6% |
| Single Unit, Attached | 13 | 5.3% |
| 2 Unit Apartments | 5 | 2.0% |
| 3 or 4 Unit Apartments | 2 | 0.8% |
| 5 to 9 Unit Apartments | 3 | 1.2% |
| 10 or more Apartments | 5 | 2.0% |
| Mobile Home / Other | 0 | 0.0% |
| Total | 246 | 100.0% |
Housing Structures by Occupancy in Baneberry
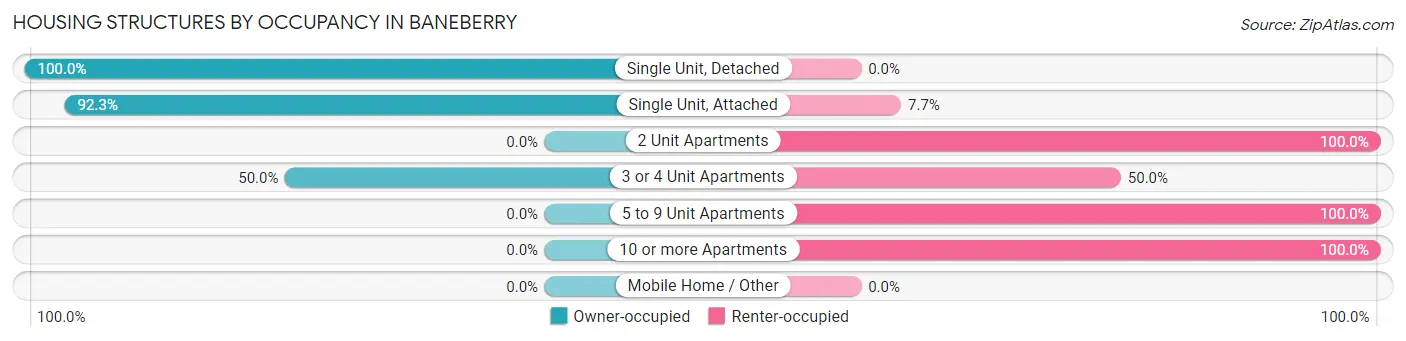
| Structure Type | Owner-occupied | Renter-occupied |
| Single Unit, Detached | 218 (100.0%) | 0 (0.0%) |
| Single Unit, Attached | 12 (92.3%) | 1 (7.7%) |
| 2 Unit Apartments | 0 (0.0%) | 5 (100.0%) |
| 3 or 4 Unit Apartments | 1 (50.0%) | 1 (50.0%) |
| 5 to 9 Unit Apartments | 0 (0.0%) | 3 (100.0%) |
| 10 or more Apartments | 0 (0.0%) | 5 (100.0%) |
| Mobile Home / Other | 0 (0.0%) | 0 (0.0%) |
| Total | 231 (93.9%) | 15 (6.1%) |
Housing Structures by Number of Rooms in Baneberry
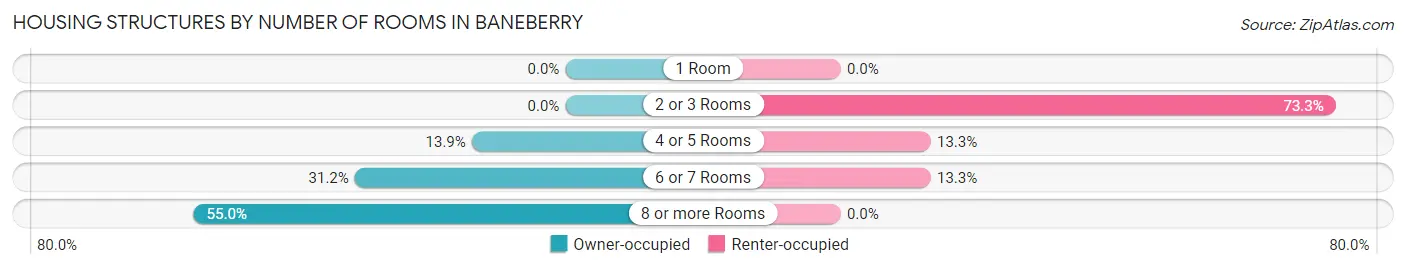
| Number of Rooms | Owner-occupied | Renter-occupied |
| 1 Room | 0 (0.0%) | 0 (0.0%) |
| 2 or 3 Rooms | 0 (0.0%) | 11 (73.3%) |
| 4 or 5 Rooms | 32 (13.9%) | 2 (13.3%) |
| 6 or 7 Rooms | 72 (31.2%) | 2 (13.3%) |
| 8 or more Rooms | 127 (55.0%) | 0 (0.0%) |
| Total | 231 (100.0%) | 15 (100.0%) |
Housing Structure by Heating Type in Baneberry
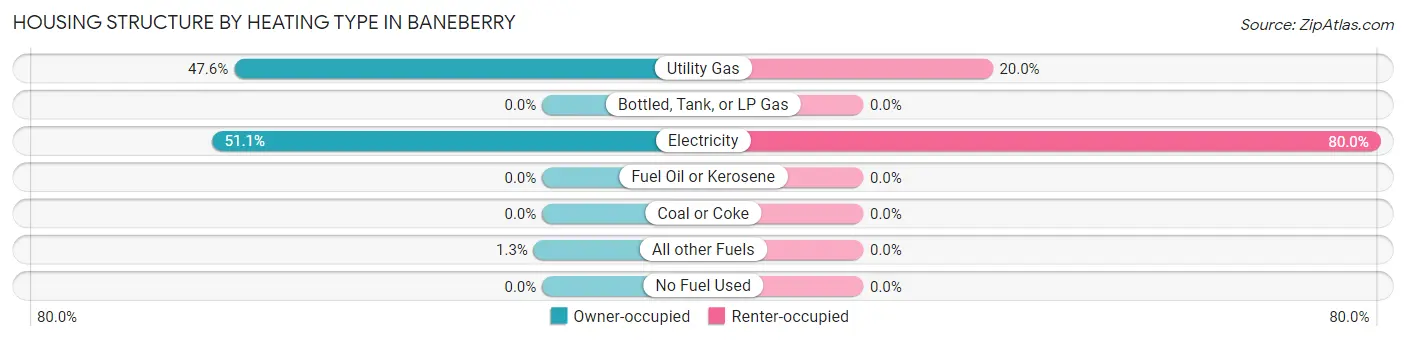
| Heating Type | Owner-occupied | Renter-occupied |
| Utility Gas | 110 (47.6%) | 3 (20.0%) |
| Bottled, Tank, or LP Gas | 0 (0.0%) | 0 (0.0%) |
| Electricity | 118 (51.1%) | 12 (80.0%) |
| Fuel Oil or Kerosene | 0 (0.0%) | 0 (0.0%) |
| Coal or Coke | 0 (0.0%) | 0 (0.0%) |
| All other Fuels | 3 (1.3%) | 0 (0.0%) |
| No Fuel Used | 0 (0.0%) | 0 (0.0%) |
| Total | 231 (100.0%) | 15 (100.0%) |
Household Vehicle Usage in Baneberry
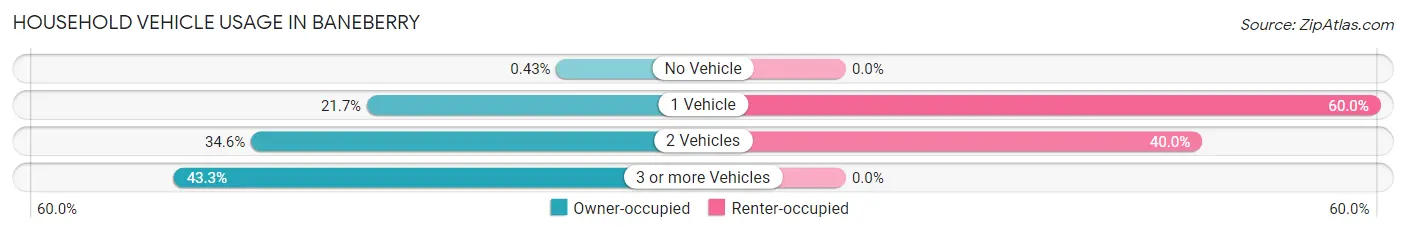
| Vehicles per Household | Owner-occupied | Renter-occupied |
| No Vehicle | 1 (0.4%) | 0 (0.0%) |
| 1 Vehicle | 50 (21.6%) | 9 (60.0%) |
| 2 Vehicles | 80 (34.6%) | 6 (40.0%) |
| 3 or more Vehicles | 100 (43.3%) | 0 (0.0%) |
| Total | 231 (100.0%) | 15 (100.0%) |
Real Estate & Mortgages in Baneberry
Real Estate and Mortgage Overview in Baneberry
| Characteristic | Without Mortgage | With Mortgage |
| Housing Units | 107 | 124 |
| Median Property Value | $334,200 | $345,200 |
| Median Household Income | $72,188 | $38 |
| Monthly Housing Costs | $592 | $10 |
| Real Estate Taxes | $2,149 | $0 |
Property Value by Mortgage Status in Baneberry
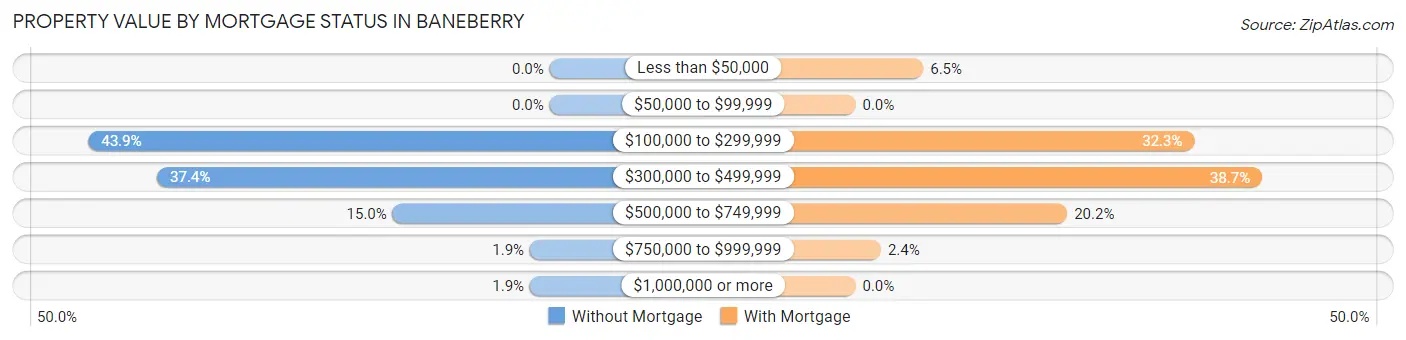
| Property Value | Without Mortgage | With Mortgage |
| Less than $50,000 | 0 (0.0%) | 8 (6.5%) |
| $50,000 to $99,999 | 0 (0.0%) | 0 (0.0%) |
| $100,000 to $299,999 | 47 (43.9%) | 40 (32.3%) |
| $300,000 to $499,999 | 40 (37.4%) | 48 (38.7%) |
| $500,000 to $749,999 | 16 (14.9%) | 25 (20.2%) |
| $750,000 to $999,999 | 2 (1.9%) | 3 (2.4%) |
| $1,000,000 or more | 2 (1.9%) | 0 (0.0%) |
| Total | 107 (100.0%) | 124 (100.0%) |
Household Income by Mortgage Status in Baneberry
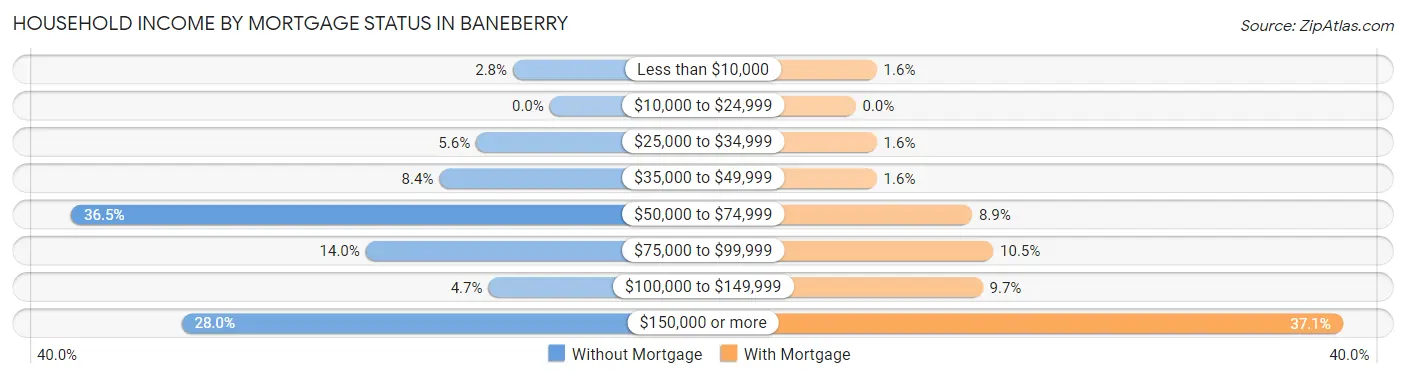
| Household Income | Without Mortgage | With Mortgage |
| Less than $10,000 | 3 (2.8%) | 2 (1.6%) |
| $10,000 to $24,999 | 0 (0.0%) | 0 (0.0%) |
| $25,000 to $34,999 | 6 (5.6%) | 2 (1.6%) |
| $35,000 to $49,999 | 9 (8.4%) | 2 (1.6%) |
| $50,000 to $74,999 | 39 (36.4%) | 11 (8.9%) |
| $75,000 to $99,999 | 15 (14.0%) | 13 (10.5%) |
| $100,000 to $149,999 | 5 (4.7%) | 12 (9.7%) |
| $150,000 or more | 30 (28.0%) | 46 (37.1%) |
| Total | 107 (100.0%) | 124 (100.0%) |
Property Value to Household Income Ratio in Baneberry
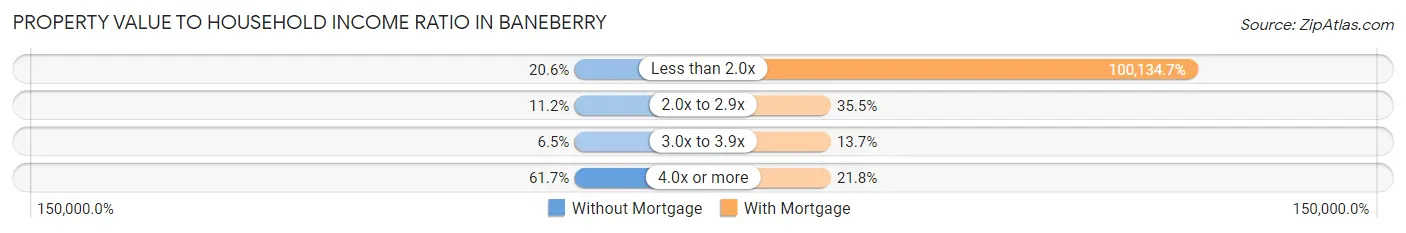
| Value-to-Income Ratio | Without Mortgage | With Mortgage |
| Less than 2.0x | 22 (20.6%) | 124,167 (100,134.7%) |
| 2.0x to 2.9x | 12 (11.2%) | 44 (35.5%) |
| 3.0x to 3.9x | 7 (6.5%) | 17 (13.7%) |
| 4.0x or more | 66 (61.7%) | 27 (21.8%) |
| Total | 107 (100.0%) | 124 (100.0%) |
Real Estate Taxes by Mortgage Status in Baneberry
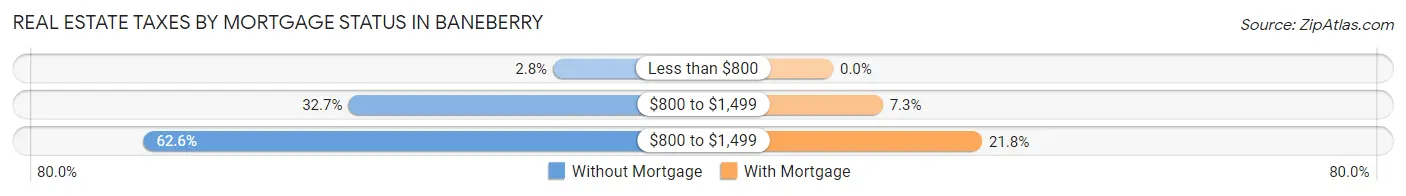
| Property Taxes | Without Mortgage | With Mortgage |
| Less than $800 | 3 (2.8%) | 0 (0.0%) |
| $800 to $1,499 | 35 (32.7%) | 9 (7.3%) |
| $800 to $1,499 | 67 (62.6%) | 27 (21.8%) |
| Total | 107 (100.0%) | 124 (100.0%) |
Health & Disability in Baneberry
Health Insurance Coverage by Age in Baneberry
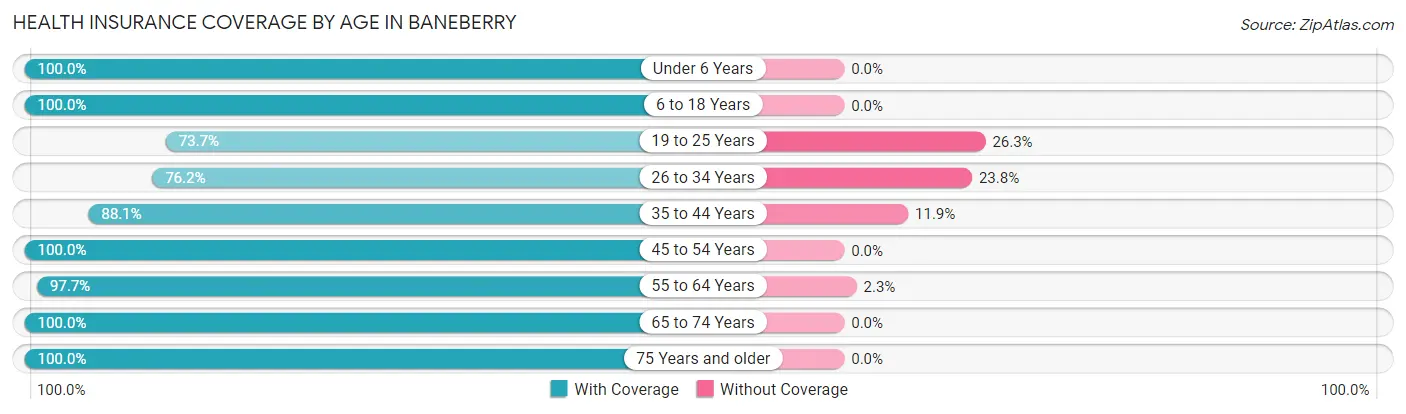
| Age Bracket | With Coverage | Without Coverage |
| Under 6 Years | 32 (100.0%) | 0 (0.0%) |
| 6 to 18 Years | 104 (100.0%) | 0 (0.0%) |
| 19 to 25 Years | 28 (73.7%) | 10 (26.3%) |
| 26 to 34 Years | 16 (76.2%) | 5 (23.8%) |
| 35 to 44 Years | 37 (88.1%) | 5 (11.9%) |
| 45 to 54 Years | 105 (100.0%) | 0 (0.0%) |
| 55 to 64 Years | 85 (97.7%) | 2 (2.3%) |
| 65 to 74 Years | 134 (100.0%) | 0 (0.0%) |
| 75 Years and older | 57 (100.0%) | 0 (0.0%) |
| Total | 598 (96.5%) | 22 (3.5%) |
Health Insurance Coverage by Citizenship Status in Baneberry
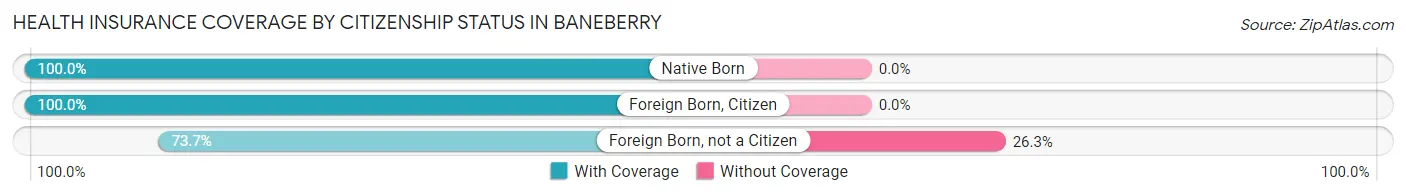
| Citizenship Status | With Coverage | Without Coverage |
| Native Born | 32 (100.0%) | 0 (0.0%) |
| Foreign Born, Citizen | 104 (100.0%) | 0 (0.0%) |
| Foreign Born, not a Citizen | 28 (73.7%) | 10 (26.3%) |
Health Insurance Coverage by Household Income in Baneberry
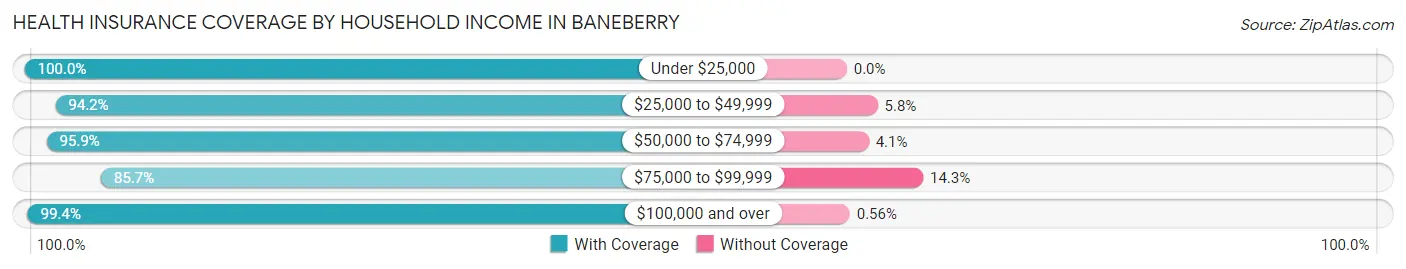
| Household Income | With Coverage | Without Coverage |
| Under $25,000 | 8 (100.0%) | 0 (0.0%) |
| $25,000 to $49,999 | 49 (94.2%) | 3 (5.8%) |
| $50,000 to $74,999 | 117 (95.9%) | 5 (4.1%) |
| $75,000 to $99,999 | 72 (85.7%) | 12 (14.3%) |
| $100,000 and over | 352 (99.4%) | 2 (0.6%) |
Public vs Private Health Insurance Coverage by Age in Baneberry
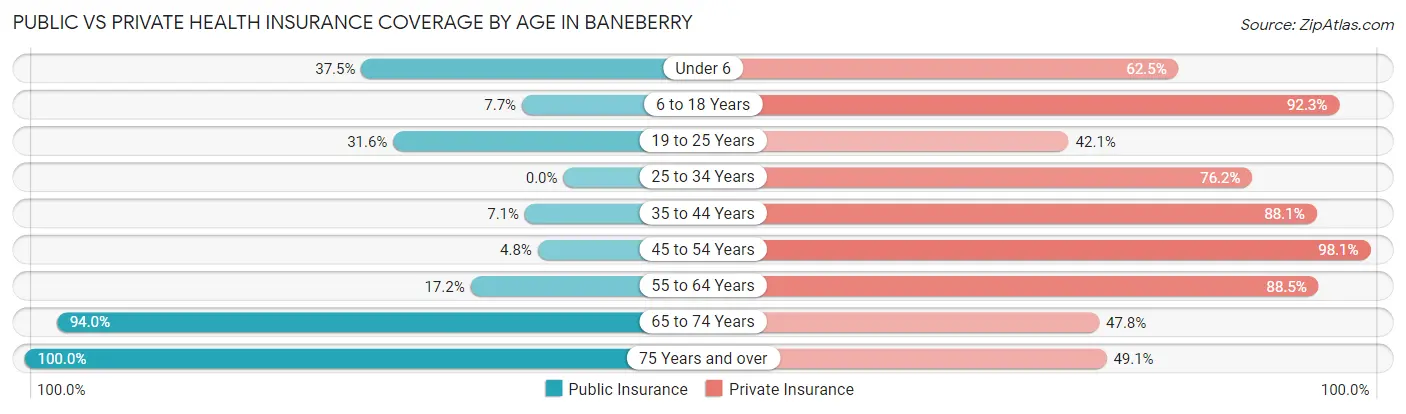
| Age Bracket | Public Insurance | Private Insurance |
| Under 6 | 12 (37.5%) | 20 (62.5%) |
| 6 to 18 Years | 8 (7.7%) | 96 (92.3%) |
| 19 to 25 Years | 12 (31.6%) | 16 (42.1%) |
| 25 to 34 Years | 0 (0.0%) | 16 (76.2%) |
| 35 to 44 Years | 3 (7.1%) | 37 (88.1%) |
| 45 to 54 Years | 5 (4.8%) | 103 (98.1%) |
| 55 to 64 Years | 15 (17.2%) | 77 (88.5%) |
| 65 to 74 Years | 126 (94.0%) | 64 (47.8%) |
| 75 Years and over | 57 (100.0%) | 28 (49.1%) |
| Total | 238 (38.4%) | 457 (73.7%) |
Disability Status by Sex by Age in Baneberry
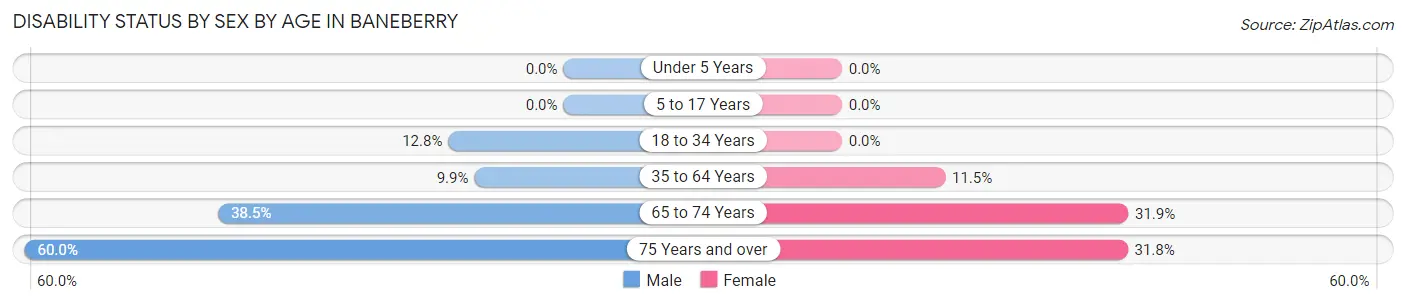
| Age Bracket | Male | Female |
| Under 5 Years | 0 (0.0%) | 0 (0.0%) |
| 5 to 17 Years | 0 (0.0%) | 0 (0.0%) |
| 18 to 34 Years | 5 (12.8%) | 0 (0.0%) |
| 35 to 64 Years | 12 (9.9%) | 13 (11.5%) |
| 65 to 74 Years | 25 (38.5%) | 22 (31.9%) |
| 75 Years and over | 21 (60.0%) | 7 (31.8%) |
Disability Class by Sex by Age in Baneberry
Disability Class: Hearing Difficulty
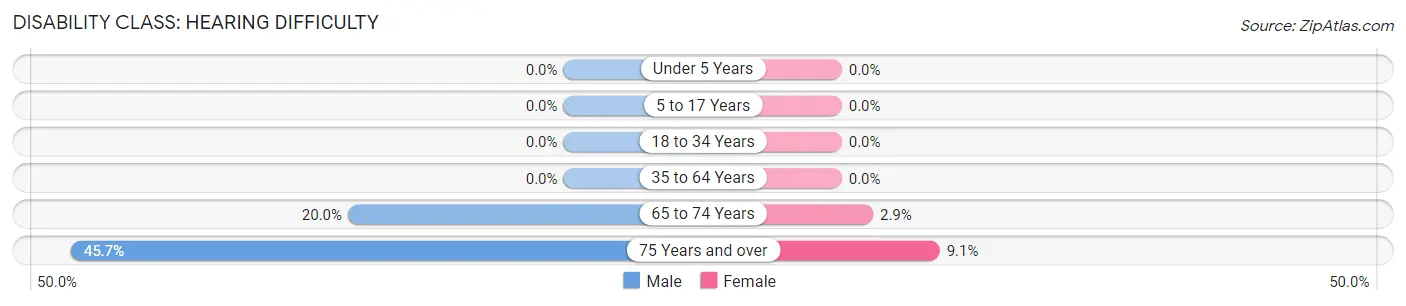
| Age Bracket | Male | Female |
| Under 5 Years | 0 (0.0%) | 0 (0.0%) |
| 5 to 17 Years | 0 (0.0%) | 0 (0.0%) |
| 18 to 34 Years | 0 (0.0%) | 0 (0.0%) |
| 35 to 64 Years | 0 (0.0%) | 0 (0.0%) |
| 65 to 74 Years | 13 (20.0%) | 2 (2.9%) |
| 75 Years and over | 16 (45.7%) | 2 (9.1%) |
Disability Class: Vision Difficulty
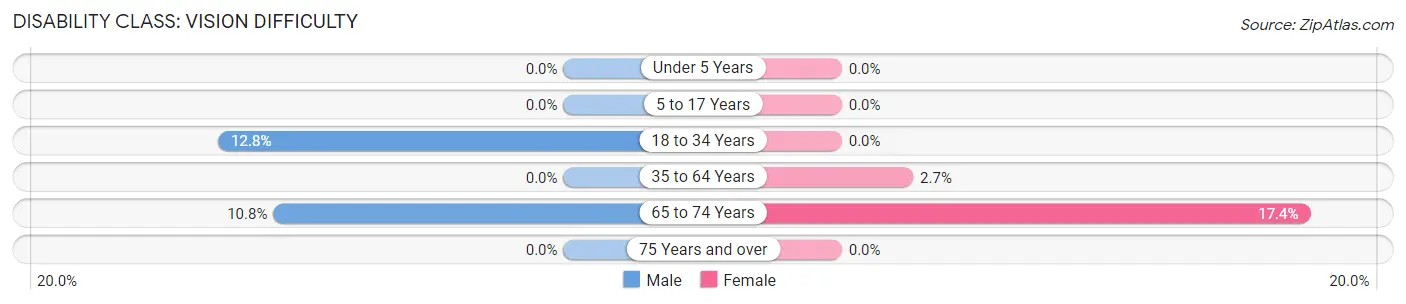
| Age Bracket | Male | Female |
| Under 5 Years | 0 (0.0%) | 0 (0.0%) |
| 5 to 17 Years | 0 (0.0%) | 0 (0.0%) |
| 18 to 34 Years | 5 (12.8%) | 0 (0.0%) |
| 35 to 64 Years | 0 (0.0%) | 3 (2.6%) |
| 65 to 74 Years | 7 (10.8%) | 12 (17.4%) |
| 75 Years and over | 0 (0.0%) | 0 (0.0%) |
Disability Class: Cognitive Difficulty
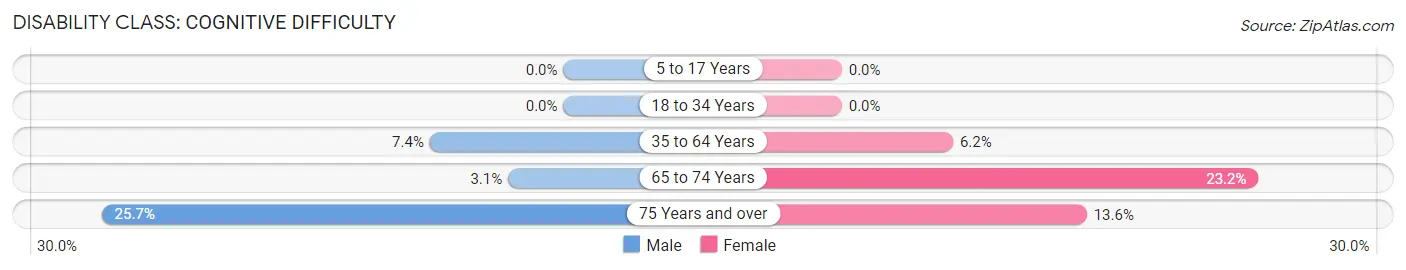
| Age Bracket | Male | Female |
| 5 to 17 Years | 0 (0.0%) | 0 (0.0%) |
| 18 to 34 Years | 0 (0.0%) | 0 (0.0%) |
| 35 to 64 Years | 9 (7.4%) | 7 (6.2%) |
| 65 to 74 Years | 2 (3.1%) | 16 (23.2%) |
| 75 Years and over | 9 (25.7%) | 3 (13.6%) |
Disability Class: Ambulatory Difficulty
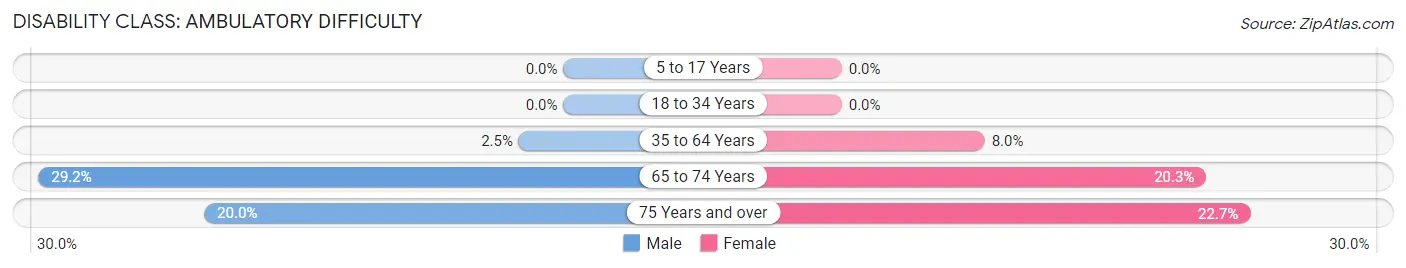
| Age Bracket | Male | Female |
| 5 to 17 Years | 0 (0.0%) | 0 (0.0%) |
| 18 to 34 Years | 0 (0.0%) | 0 (0.0%) |
| 35 to 64 Years | 3 (2.5%) | 9 (8.0%) |
| 65 to 74 Years | 19 (29.2%) | 14 (20.3%) |
| 75 Years and over | 7 (20.0%) | 5 (22.7%) |
Disability Class: Self-Care Difficulty
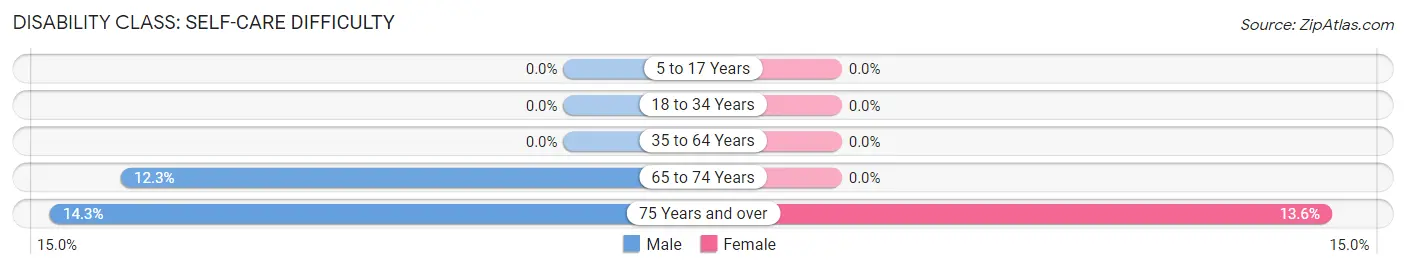
| Age Bracket | Male | Female |
| 5 to 17 Years | 0 (0.0%) | 0 (0.0%) |
| 18 to 34 Years | 0 (0.0%) | 0 (0.0%) |
| 35 to 64 Years | 0 (0.0%) | 0 (0.0%) |
| 65 to 74 Years | 8 (12.3%) | 0 (0.0%) |
| 75 Years and over | 5 (14.3%) | 3 (13.6%) |
Technology Access in Baneberry
Computing Device Access in Baneberry
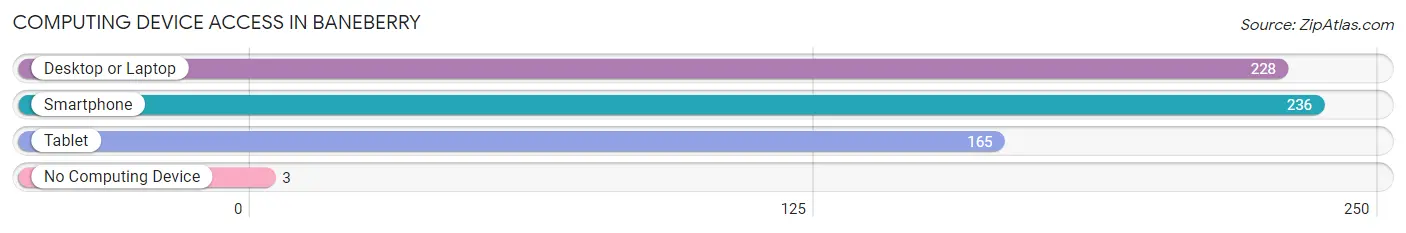
| Device Type | # Households | % Households |
| Desktop or Laptop | 228 | 92.7% |
| Smartphone | 236 | 95.9% |
| Tablet | 165 | 67.1% |
| No Computing Device | 3 | 1.2% |
| Total | 246 | 100.0% |
Internet Access in Baneberry
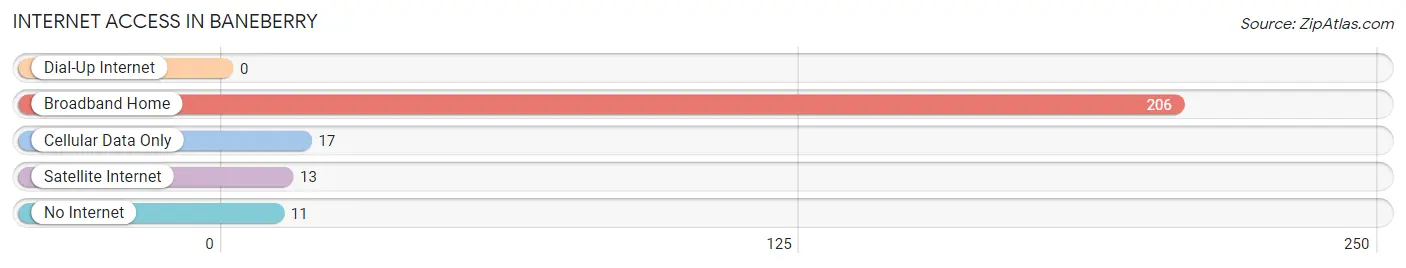
| Internet Type | # Households | % Households |
| Dial-Up Internet | 0 | 0.0% |
| Broadband Home | 206 | 83.7% |
| Cellular Data Only | 17 | 6.9% |
| Satellite Internet | 13 | 5.3% |
| No Internet | 11 | 4.5% |
| Total | 246 | 100.0% |
Baneberry Summary
Baneberry, Tennessee is a small town located in the foothills of the Great Smoky Mountains in eastern Tennessee. It is situated in Jefferson County, approximately 20 miles east of Knoxville. The town was founded in the late 1800s and has a population of approximately 1,000 people.
History
Baneberry was founded in the late 1800s by a group of settlers from North Carolina. The town was named after a wild berry that grew in the area. The settlers were attracted to the area due to its proximity to the Great Smoky Mountains and the abundance of natural resources. The town quickly grew and by the early 1900s, it had become a thriving community.
In the early 1900s, Baneberry was a popular tourist destination due to its proximity to the Great Smoky Mountains. The town was home to several hotels and resorts, as well as a number of shops and restaurants. The town also had a thriving lumber industry, which provided jobs for many of the town’s residents.
In the late 1950s, the town began to decline as the lumber industry began to decline. Many of the town’s businesses closed and the population began to dwindle. In the late 1970s, the town was revitalized when the Great Smoky Mountains National Park was established. The park brought new visitors to the area and provided jobs for many of the town’s residents.
Geography
Baneberry is located in the foothills of the Great Smoky Mountains in eastern Tennessee. The town is situated in Jefferson County, approximately 20 miles east of Knoxville. The town is surrounded by the Cherokee National Forest and is located near the French Broad River. The town is located at an elevation of 1,000 feet and has a humid subtropical climate.
Economy
The economy of Baneberry is largely based on tourism. The town is located near the Great Smoky Mountains National Park, which attracts thousands of visitors each year. The town is also home to several hotels and resorts, as well as a number of shops and restaurants. The town also has a thriving lumber industry, which provides jobs for many of the town’s residents.
Demographics
As of the 2010 census, the population of Baneberry was 1,000 people. The town is predominantly white, with approximately 95% of the population being white. The median household income is $35,000 and the median home value is $150,000. The town has a low unemployment rate of 4.5%.
Baneberry is a small town with a rich history and a vibrant economy. The town is located in the foothills of the Great Smoky Mountains and is home to a number of hotels and resorts, as well as a number of shops and restaurants. The town also has a thriving lumber industry, which provides jobs for many of the town’s residents. The town has a population of approximately 1,000 people and is predominantly white. The median household income is $35,000 and the median home value is $150,000. The town has a low unemployment rate of 4.5%.
Common Questions
What is the Total Population of Baneberry?
Total Population of Baneberry is 620.
What is the Total Male Population of Baneberry?
Total Male Population of Baneberry is 331.
What is the Total Female Population of Baneberry?
Total Female Population of Baneberry is 289.
What is the Ratio of Males per 100 Females in Baneberry?
There are 114.53 Males per 100 Females in Baneberry.
What is the Ratio of Females per 100 Males in Baneberry?
There are 87.31 Females per 100 Males in Baneberry.
What is the Median Population Age in Baneberry?
Median Population Age in Baneberry is 52.7 Years.
What is the Average Family Size in Baneberry
Average Family Size in Baneberry is 2.8 People.
What is the Average Household Size in Baneberry
Average Household Size in Baneberry is 2.5 People.
What is Per Capita Income in Baneberry?
Per Capita income in Baneberry is $50,354.
What is the Median Family Income in Baneberry?
Median Family Income in Baneberry is $117,344.
What is the Median Household income in Baneberry?
Median Household Income in Baneberry is $95,000.
What is Income or Wage Gap in Baneberry?
Income or Wage Gap in Baneberry is 33.4%.
Women in Baneberry earn 66.6 cents for every dollar earned by a man.
What is Inequality or Gini Index in Baneberry?
Inequality or Gini Index in Baneberry is 0.41.
How Large is the Labor Force in Baneberry?
There are 297 People in the Labor Forcein in Baneberry.
What is the Percentage of People in the Labor Force in Baneberry?
54.2% of People are in the Labor Force in Baneberry.
What is the Unemployment Rate in Baneberry?
Unemployment Rate in Baneberry is 7.1%.