Oak Ridge, TN
Oak Ridge Map
Oak Ridge Overview
31,535
TOTAL POPULATION
15,267
MALE POPULATION
16,268
FEMALE POPULATION
93.85
MALES / 100 FEMALES
106.56
FEMALES / 100 MALES
39.9
MEDIAN AGE
3.0
AVG FAMILY SIZE
2.4
AVG HOUSEHOLD SIZE
$36,915
PER CAPITA INCOME
$81,784
AVG FAMILY INCOME
$67,152
AVG HOUSEHOLD INCOME
37.7%
WAGE / INCOME GAP [ % ]
62.3¢/ $1
WAGE / INCOME GAP [ $ ]
$9,773
FAMILY INCOME DEFICIT
0.43
INEQUALITY / GINI INDEX
14,177
LABOR FORCE [ PEOPLE ]
56.8%
PERCENT IN LABOR FORCE
5.6%
UNEMPLOYMENT RATE
Oak Ridge Zip Codes
Oak Ridge Area Codes
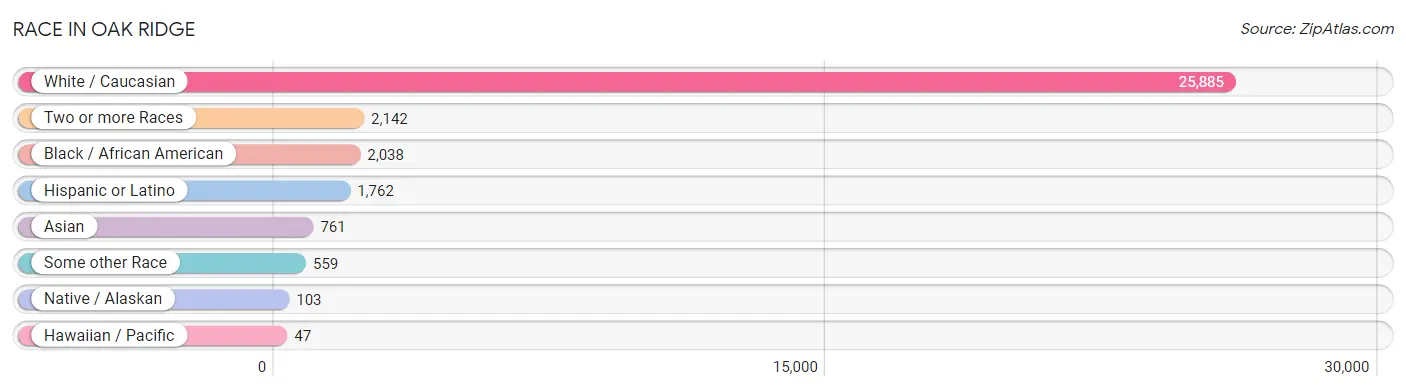
Race in Oak Ridge
The most populous races in Oak Ridge are White / Caucasian (25,885 | 82.1%), Two or more Races (2,142 | 6.8%), and Black / African American (2,038 | 6.5%).
| Race | # Population | % Population |
| Asian | 761 | 2.4% |
| Black / African American | 2,038 | 6.5% |
| Hawaiian / Pacific | 47 | 0.2% |
| Hispanic or Latino | 1,762 | 5.6% |
| Native / Alaskan | 103 | 0.3% |
| White / Caucasian | 25,885 | 82.1% |
| Two or more Races | 2,142 | 6.8% |
| Some other Race | 559 | 1.8% |
| Total | 31,535 | 100.0% |
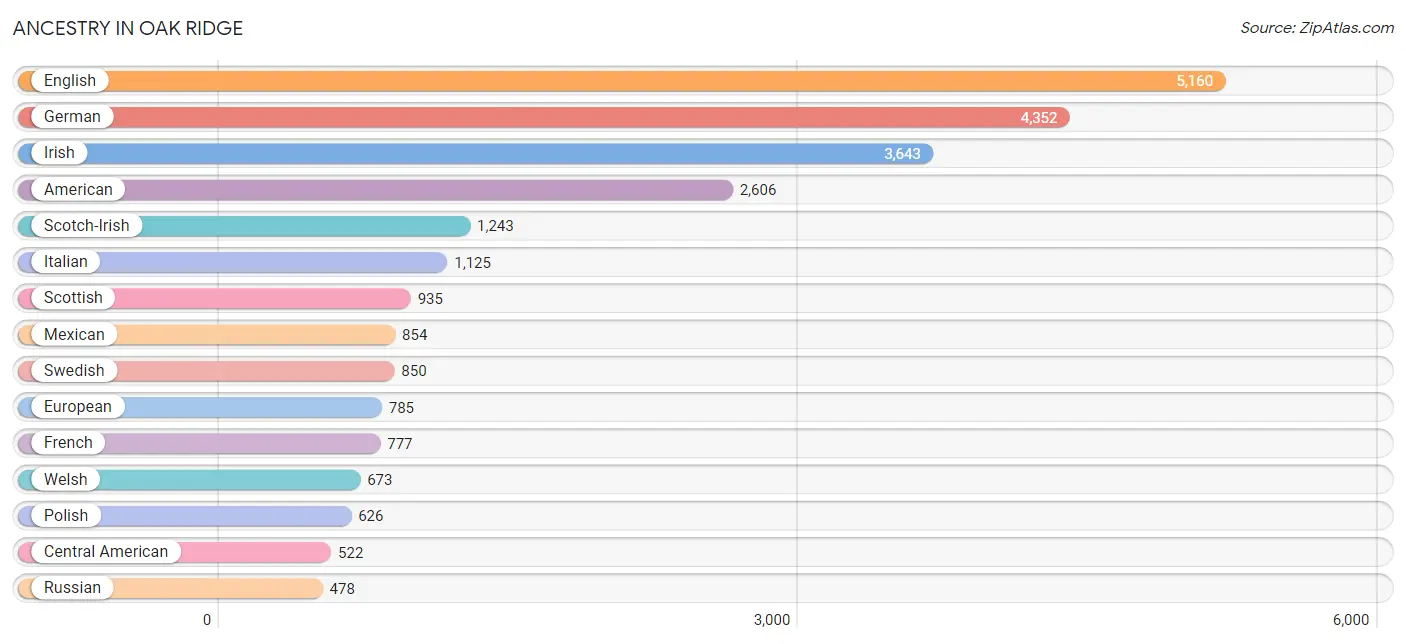
Ancestry in Oak Ridge
The most populous ancestries reported in Oak Ridge are English (5,160 | 16.4%), German (4,352 | 13.8%), Irish (3,643 | 11.6%), American (2,606 | 8.3%), and Scotch-Irish (1,243 | 3.9%), together accounting for 53.9% of all Oak Ridge residents.
| Ancestry | # Population | % Population |
| African | 179 | 0.6% |
| American | 2,606 | 8.3% |
| Arab | 80 | 0.3% |
| Argentinean | 17 | 0.1% |
| Austrian | 21 | 0.1% |
| Belgian | 8 | 0.0% |
| Bhutanese | 49 | 0.2% |
| Blackfeet | 7 | 0.0% |
| Brazilian | 78 | 0.3% |
| British | 293 | 0.9% |
| British West Indian | 14 | 0.0% |
| Burmese | 167 | 0.5% |
| Cajun | 8 | 0.0% |
| Canadian | 41 | 0.1% |
| Celtic | 34 | 0.1% |
| Central American | 522 | 1.7% |
| Central American Indian | 62 | 0.2% |
| Cherokee | 134 | 0.4% |
| Choctaw | 30 | 0.1% |
| Cuban | 213 | 0.7% |
| Czech | 136 | 0.4% |
| Czechoslovakian | 45 | 0.1% |
| Danish | 69 | 0.2% |
| Dominican | 8 | 0.0% |
| Dutch | 384 | 1.2% |
| Eastern European | 89 | 0.3% |
| Egyptian | 52 | 0.2% |
| English | 5,160 | 16.4% |
| European | 785 | 2.5% |
| Filipino | 23 | 0.1% |
| Finnish | 21 | 0.1% |
| French | 777 | 2.5% |
| French Canadian | 157 | 0.5% |
| German | 4,352 | 13.8% |
| Ghanaian | 7 | 0.0% |
| Greek | 99 | 0.3% |
| Guatemalan | 91 | 0.3% |
| Honduran | 343 | 1.1% |
| Hopi | 4 | 0.0% |
| Hungarian | 157 | 0.5% |
| Indian (Asian) | 373 | 1.2% |
| Irish | 3,643 | 11.6% |
| Italian | 1,125 | 3.6% |
| Jamaican | 14 | 0.0% |
| Japanese | 14 | 0.0% |
| Kenyan | 6 | 0.0% |
| Korean | 164 | 0.5% |
| Lebanese | 16 | 0.1% |
| Lithuanian | 58 | 0.2% |
| Mexican | 854 | 2.7% |
| Mexican American Indian | 2 | 0.0% |
| Moroccan | 12 | 0.0% |
| Native Hawaiian | 47 | 0.2% |
| Navajo | 17 | 0.1% |
| Northern European | 70 | 0.2% |
| Norwegian | 344 | 1.1% |
| Panamanian | 10 | 0.0% |
| Pennsylvania German | 12 | 0.0% |
| Peruvian | 41 | 0.1% |
| Polish | 626 | 2.0% |
| Portuguese | 30 | 0.1% |
| Puerto Rican | 41 | 0.1% |
| Romanian | 86 | 0.3% |
| Russian | 478 | 1.5% |
| Salvadoran | 78 | 0.3% |
| Scandinavian | 92 | 0.3% |
| Scotch-Irish | 1,243 | 3.9% |
| Scottish | 935 | 3.0% |
| Slovak | 62 | 0.2% |
| South American | 65 | 0.2% |
| South American Indian | 23 | 0.1% |
| Spaniard | 13 | 0.0% |
| Spanish | 13 | 0.0% |
| Sri Lankan | 70 | 0.2% |
| Subsaharan African | 192 | 0.6% |
| Swedish | 850 | 2.7% |
| Swiss | 141 | 0.4% |
| Thai | 102 | 0.3% |
| Ukrainian | 21 | 0.1% |
| Uruguayan | 7 | 0.0% |
| Vietnamese | 20 | 0.1% |
| Welsh | 673 | 2.1% |
| West Indian | 74 | 0.2% | View All 83 Rows |
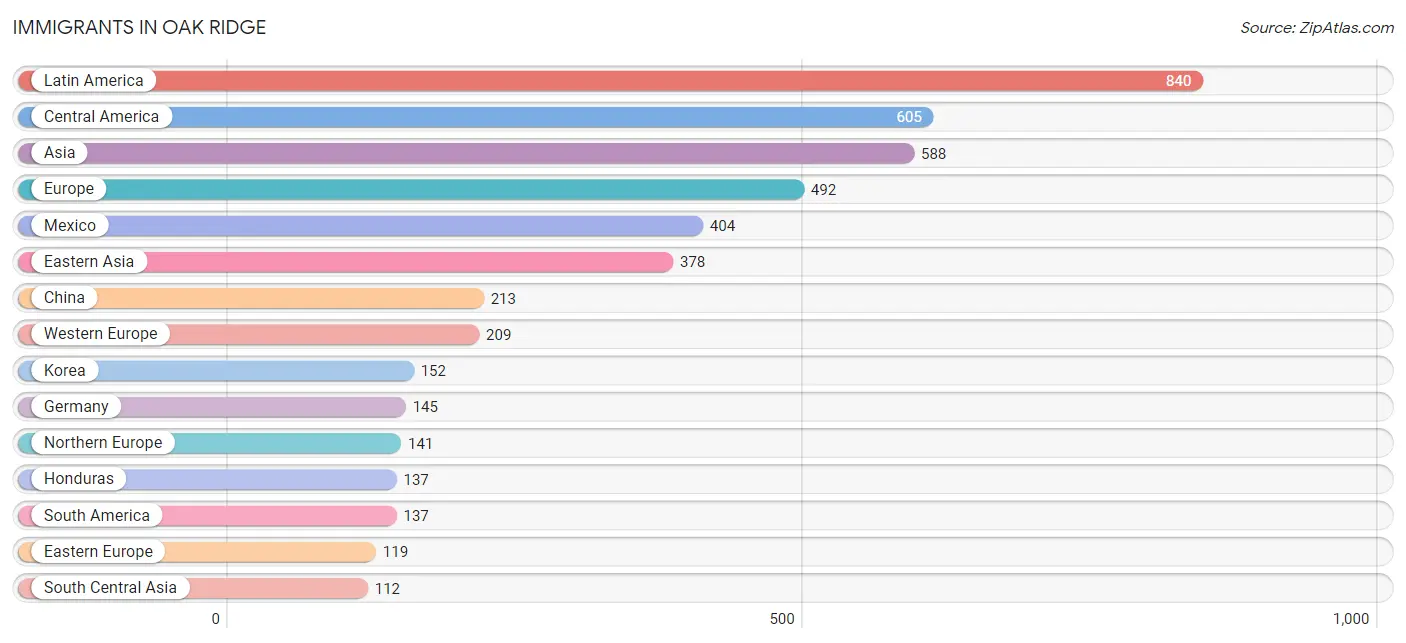
Immigrants in Oak Ridge
The most numerous immigrant groups reported in Oak Ridge came from Latin America (840 | 2.7%), Central America (605 | 1.9%), Asia (588 | 1.9%), Europe (492 | 1.6%), and Mexico (404 | 1.3%), together accounting for 9.3% of all Oak Ridge residents.
| Immigration Origin | # Population | % Population |
| Africa | 40 | 0.1% |
| Argentina | 22 | 0.1% |
| Asia | 588 | 1.9% |
| Bangladesh | 20 | 0.1% |
| Brazil | 78 | 0.3% |
| Canada | 48 | 0.2% |
| Caribbean | 98 | 0.3% |
| Central America | 605 | 1.9% |
| China | 213 | 0.7% |
| Cuba | 80 | 0.3% |
| Czechoslovakia | 26 | 0.1% |
| Denmark | 28 | 0.1% |
| Eastern Africa | 6 | 0.0% |
| Eastern Asia | 378 | 1.2% |
| Eastern Europe | 119 | 0.4% |
| Egypt | 15 | 0.1% |
| El Salvador | 8 | 0.0% |
| England | 40 | 0.1% |
| Europe | 492 | 1.6% |
| France | 46 | 0.2% |
| Germany | 145 | 0.5% |
| Ghana | 7 | 0.0% |
| Greece | 23 | 0.1% |
| Guatemala | 50 | 0.2% |
| Honduras | 137 | 0.4% |
| Hungary | 54 | 0.2% |
| India | 89 | 0.3% |
| Ireland | 6 | 0.0% |
| Japan | 13 | 0.0% |
| Kenya | 6 | 0.0% |
| Korea | 152 | 0.5% |
| Laos | 11 | 0.0% |
| Latin America | 840 | 2.7% |
| Mexico | 404 | 1.3% |
| Morocco | 12 | 0.0% |
| Northern Africa | 27 | 0.1% |
| Northern Europe | 141 | 0.4% |
| Panama | 6 | 0.0% |
| Peru | 22 | 0.1% |
| Philippines | 17 | 0.1% |
| Russia | 15 | 0.1% |
| South America | 137 | 0.4% |
| South Central Asia | 112 | 0.4% |
| South Eastern Asia | 98 | 0.3% |
| Southern Europe | 23 | 0.1% |
| Sri Lanka | 3 | 0.0% |
| Sweden | 19 | 0.1% |
| Switzerland | 18 | 0.1% |
| Taiwan | 33 | 0.1% |
| Ukraine | 16 | 0.1% |
| Uruguay | 7 | 0.0% |
| Venezuela | 8 | 0.0% |
| Vietnam | 70 | 0.2% |
| Western Africa | 7 | 0.0% |
| Western Europe | 209 | 0.7% | View All 55 Rows |
Sex and Age in Oak Ridge
Sex and Age in Oak Ridge
The most populous age groups in Oak Ridge are 25 to 29 Years (1,263 | 8.3%) for men and 10 to 14 Years (1,398 | 8.6%) for women.
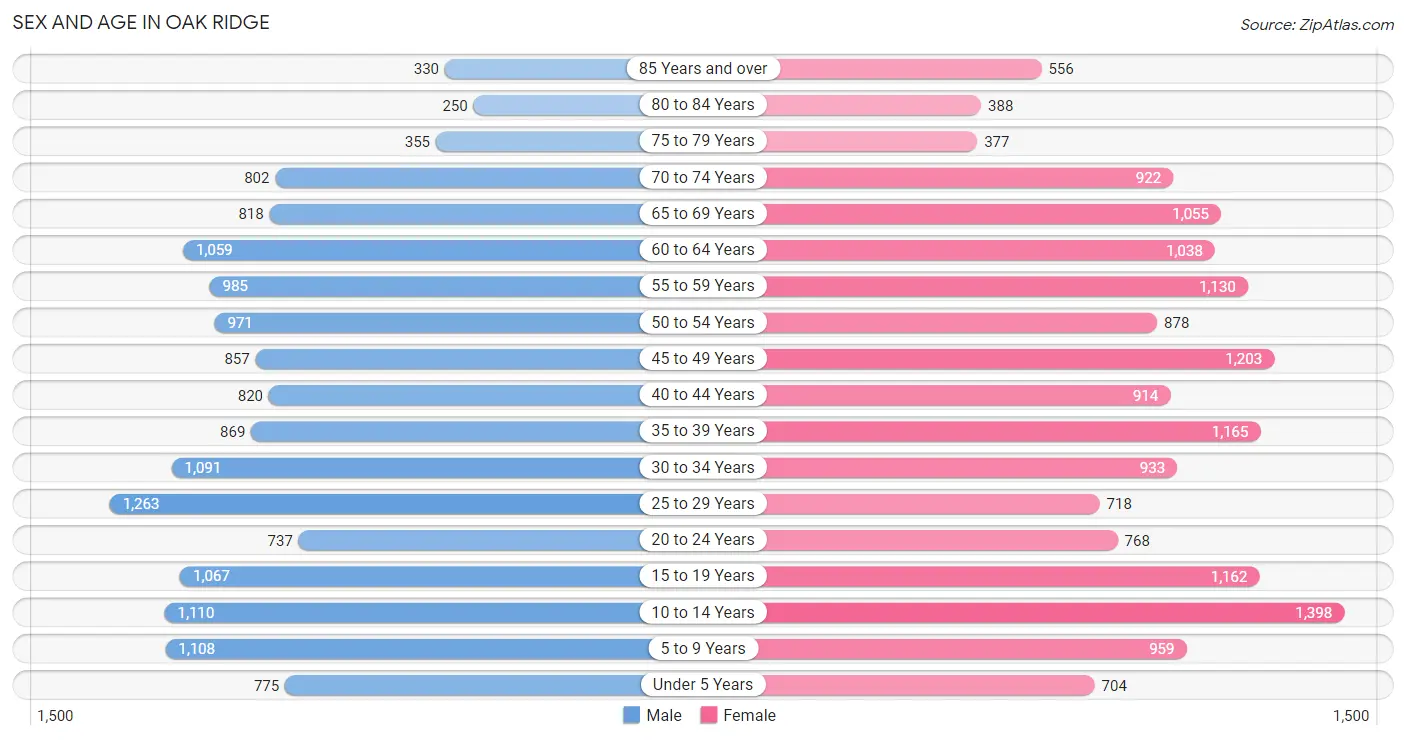
| Age Bracket | Male | Female |
| Under 5 Years | 775 (5.1%) | 704 (4.3%) |
| 5 to 9 Years | 1,108 (7.3%) | 959 (5.9%) |
| 10 to 14 Years | 1,110 (7.3%) | 1,398 (8.6%) |
| 15 to 19 Years | 1,067 (7.0%) | 1,162 (7.1%) |
| 20 to 24 Years | 737 (4.8%) | 768 (4.7%) |
| 25 to 29 Years | 1,263 (8.3%) | 718 (4.4%) |
| 30 to 34 Years | 1,091 (7.1%) | 933 (5.7%) |
| 35 to 39 Years | 869 (5.7%) | 1,165 (7.2%) |
| 40 to 44 Years | 820 (5.4%) | 914 (5.6%) |
| 45 to 49 Years | 857 (5.6%) | 1,203 (7.4%) |
| 50 to 54 Years | 971 (6.4%) | 878 (5.4%) |
| 55 to 59 Years | 985 (6.5%) | 1,130 (7.0%) |
| 60 to 64 Years | 1,059 (6.9%) | 1,038 (6.4%) |
| 65 to 69 Years | 818 (5.4%) | 1,055 (6.5%) |
| 70 to 74 Years | 802 (5.2%) | 922 (5.7%) |
| 75 to 79 Years | 355 (2.3%) | 377 (2.3%) |
| 80 to 84 Years | 250 (1.6%) | 388 (2.4%) |
| 85 Years and over | 330 (2.2%) | 556 (3.4%) |
| Total | 15,267 (100.0%) | 16,268 (100.0%) |
Families and Households in Oak Ridge
Median Family Size in Oak Ridge
The median family size in Oak Ridge is 3.02 persons per family, with single female/mother families (1,576 | 19.6%) accounting for the largest median family size of 3.07 persons per family. On the other hand, single male/father families (526 | 6.5%) represent the smallest median family size with 2.73 persons per family.
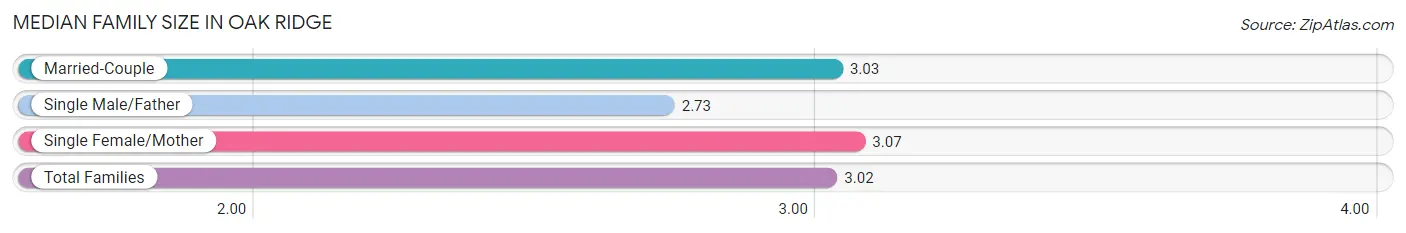
| Family Type | # Families | Family Size |
| Married-Couple | 5,951 (73.9%) | 3.03 |
| Single Male/Father | 526 (6.5%) | 2.73 |
| Single Female/Mother | 1,576 (19.6%) | 3.07 |
| Total Families | 8,053 (100.0%) | 3.02 |
Median Household Size in Oak Ridge
The median household size in Oak Ridge is 2.38 persons per household, with single female/mother households (1,576 | 12.1%) accounting for the largest median household size of 3.3 persons per household. non-family households (5,018 | 38.4%) represent the smallest median household size with 1.21 persons per household.
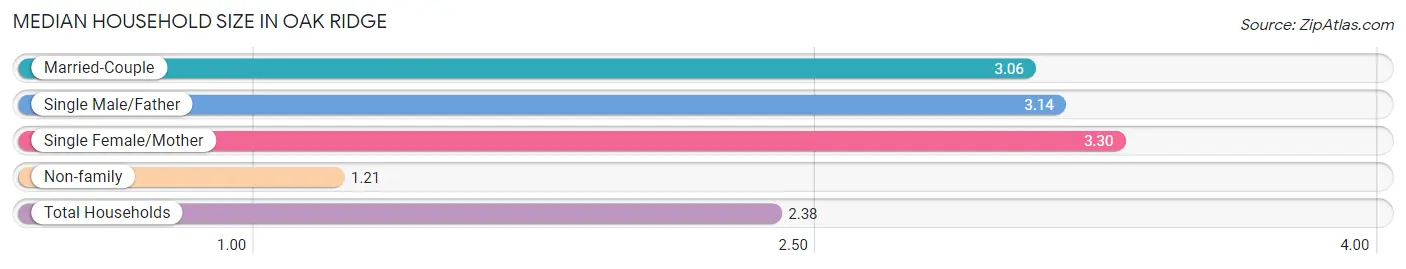
| Household Type | # Households | Household Size |
| Married-Couple | 5,951 (45.5%) | 3.06 |
| Single Male/Father | 526 (4.0%) | 3.14 |
| Single Female/Mother | 1,576 (12.1%) | 3.30 |
| Non-family | 5,018 (38.4%) | 1.21 |
| Total Households | 13,071 (100.0%) | 2.38 |
Household Size by Marriage Status in Oak Ridge
Out of a total of 13,071 households in Oak Ridge, 8,053 (61.6%) are family households, while 5,018 (38.4%) are nonfamily households. The most numerous type of family households are 2-person households, comprising 3,708, and the most common type of nonfamily households are 1-person households, comprising 4,423.
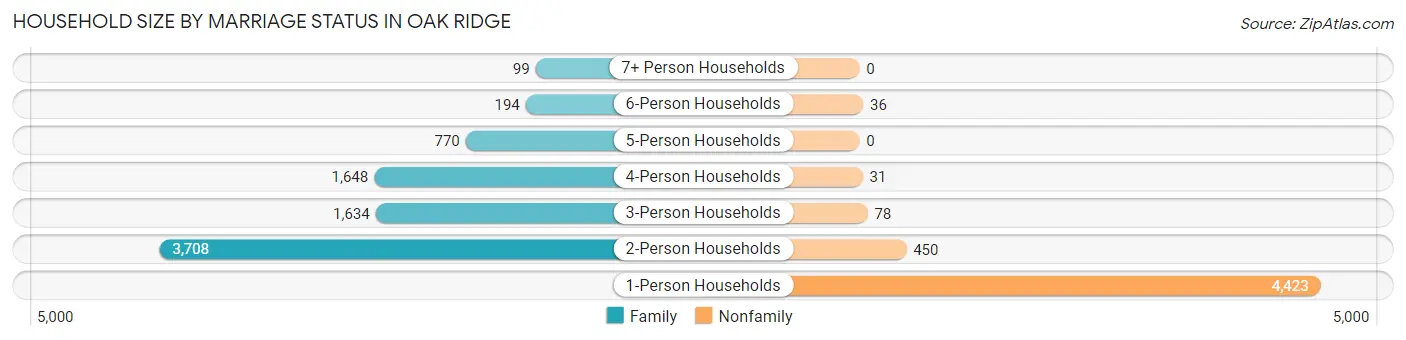
| Household Size | Family Households | Nonfamily Households |
| 1-Person Households | - | 4,423 (33.8%) |
| 2-Person Households | 3,708 (28.4%) | 450 (3.4%) |
| 3-Person Households | 1,634 (12.5%) | 78 (0.6%) |
| 4-Person Households | 1,648 (12.6%) | 31 (0.2%) |
| 5-Person Households | 770 (5.9%) | 0 (0.0%) |
| 6-Person Households | 194 (1.5%) | 36 (0.3%) |
| 7+ Person Households | 99 (0.8%) | 0 (0.0%) |
| Total | 8,053 (61.6%) | 5,018 (38.4%) |
Female Fertility in Oak Ridge
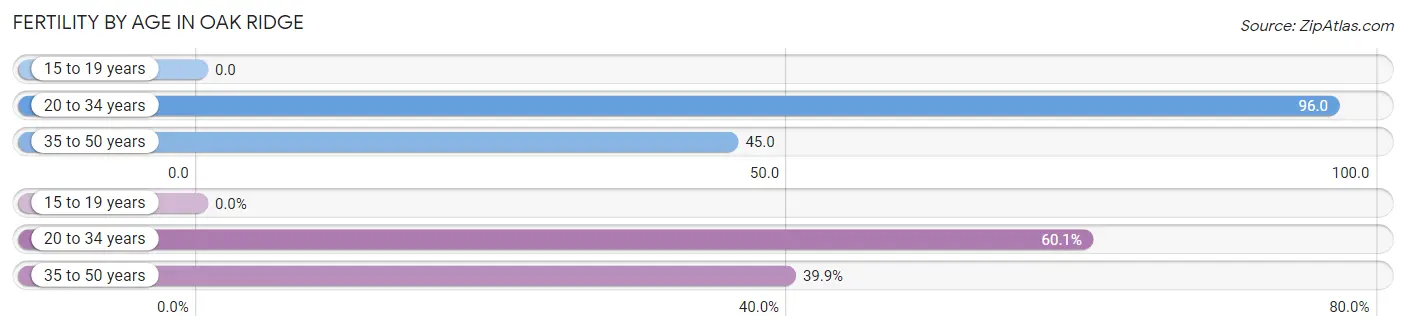
Fertility by Age in Oak Ridge
Average fertility rate in Oak Ridge is 55.0 births per 1,000 women. Women in the age bracket of 20 to 34 years have the highest fertility rate with 96.0 births per 1,000 women. Women in the age bracket of 20 to 34 years acount for 60.1% of all women with births.
| Age Bracket | Women with Births | Births / 1,000 Women |
| 15 to 19 years | 0 (0.0%) | 0.0 |
| 20 to 34 years | 232 (60.1%) | 96.0 |
| 35 to 50 years | 154 (39.9%) | 45.0 |
| Total | 386 (100.0%) | 55.0 |
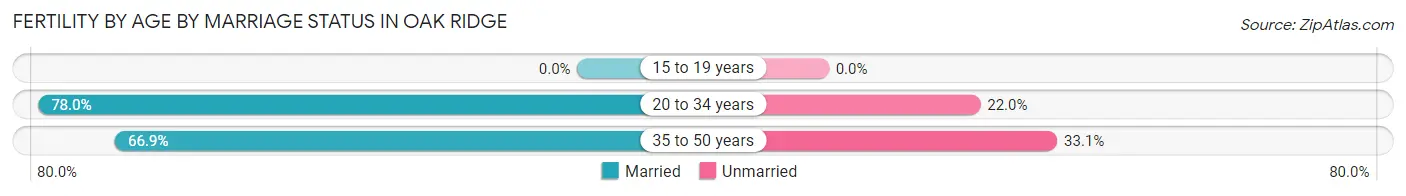
Fertility by Age by Marriage Status in Oak Ridge
73.6% of women with births (386) in Oak Ridge are married. The highest percentage of unmarried women with births falls into 35 to 50 years age bracket with 33.1% of them unmarried at the time of birth, while the lowest percentage of unmarried women with births belong to 20 to 34 years age bracket with 22.0% of them unmarried.
| Age Bracket | Married | Unmarried |
| 15 to 19 years | 0 (0.0%) | 0 (0.0%) |
| 20 to 34 years | 181 (78.0%) | 51 (22.0%) |
| 35 to 50 years | 103 (66.9%) | 51 (33.1%) |
| Total | 284 (73.6%) | 102 (26.4%) |
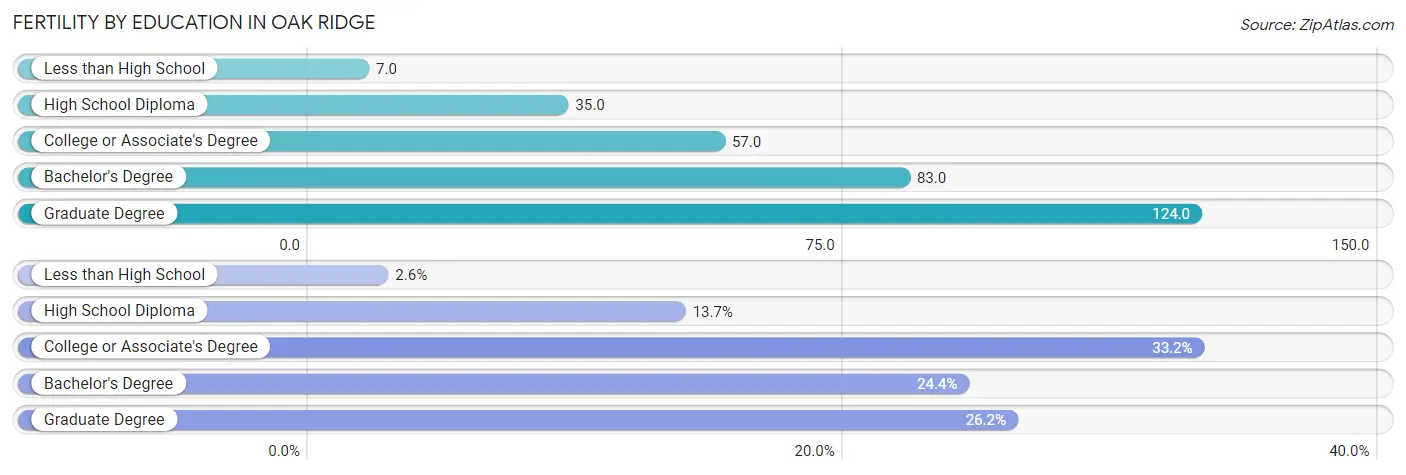
Fertility by Education in Oak Ridge
Average fertility rate in Oak Ridge is 55.0 births per 1,000 women. Women with the education attainment of graduate degree have the highest fertility rate of 124.0 births per 1,000 women, while women with the education attainment of less than high school have the lowest fertility at 7.0 births per 1,000 women. Women with the education attainment of college or associate's degree represent 33.2% of all women with births.
| Educational Attainment | Women with Births | Births / 1,000 Women |
| Less than High School | 10 (2.6%) | 7.0 |
| High School Diploma | 53 (13.7%) | 35.0 |
| College or Associate's Degree | 128 (33.2%) | 57.0 |
| Bachelor's Degree | 94 (24.3%) | 83.0 |
| Graduate Degree | 101 (26.2%) | 124.0 |
| Total | 386 (100.0%) | 55.0 |
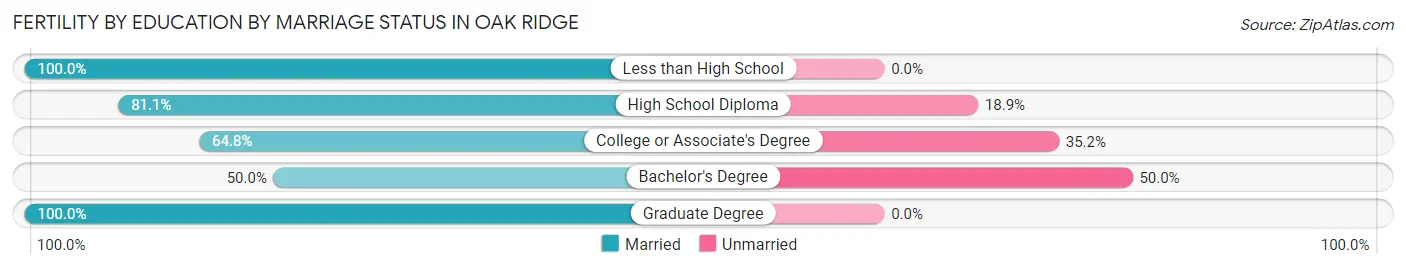
Fertility by Education by Marriage Status in Oak Ridge
26.4% of women with births in Oak Ridge are unmarried. Women with the educational attainment of less than high school are most likely to be married with 100.0% of them married at childbirth, while women with the educational attainment of bachelor's degree are least likely to be married with 50.0% of them unmarried at childbirth.
| Educational Attainment | Married | Unmarried |
| Less than High School | 10 (100.0%) | 0 (0.0%) |
| High School Diploma | 43 (81.1%) | 10 (18.9%) |
| College or Associate's Degree | 83 (64.8%) | 45 (35.2%) |
| Bachelor's Degree | 47 (50.0%) | 47 (50.0%) |
| Graduate Degree | 101 (100.0%) | 0 (0.0%) |
| Total | 284 (73.6%) | 102 (26.4%) |
Income in Oak Ridge
Income Overview in Oak Ridge
Per Capita Income in Oak Ridge is $36,915, while median incomes of families and households are $81,784 and $67,152 respectively.
| Characteristic | Number | Measure |
| Per Capita Income | 31,535 | $36,915 |
| Median Family Income | 8,053 | $81,784 |
| Mean Family Income | 8,053 | $103,982 |
| Median Household Income | 13,071 | $67,152 |
| Mean Household Income | 13,071 | $88,036 |
| Income Deficit | 8,053 | $9,773 |
| Wage / Income Gap (%) | 31,535 | 37.66% |
| Wage / Income Gap ($) | 31,535 | 62.34¢ per $1 |
| Gini / Inequality Index | 31,535 | 0.43 |
Earnings by Sex in Oak Ridge
Average Earnings in Oak Ridge are $39,505, $49,562 for men and $30,895 for women, a difference of 37.7%.
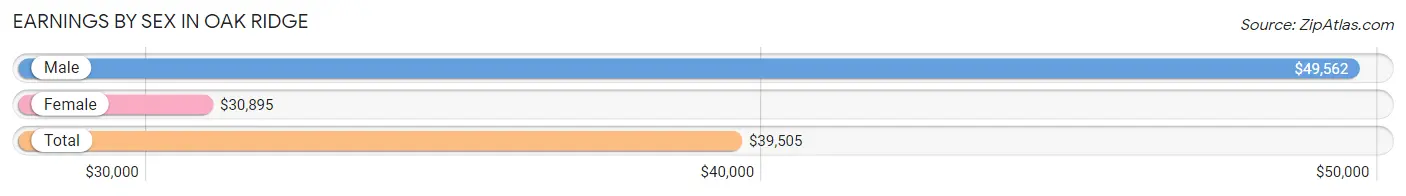
| Sex | Number | Average Earnings |
| Male | 7,891 (52.7%) | $49,562 |
| Female | 7,090 (47.3%) | $30,895 |
| Total | 14,981 (100.0%) | $39,505 |
Earnings by Sex by Income Bracket in Oak Ridge
The most common earnings brackets in Oak Ridge are $100,000+ for men (1,812 | 23.0%) and $2,499 or less for women (642 | 9.1%).
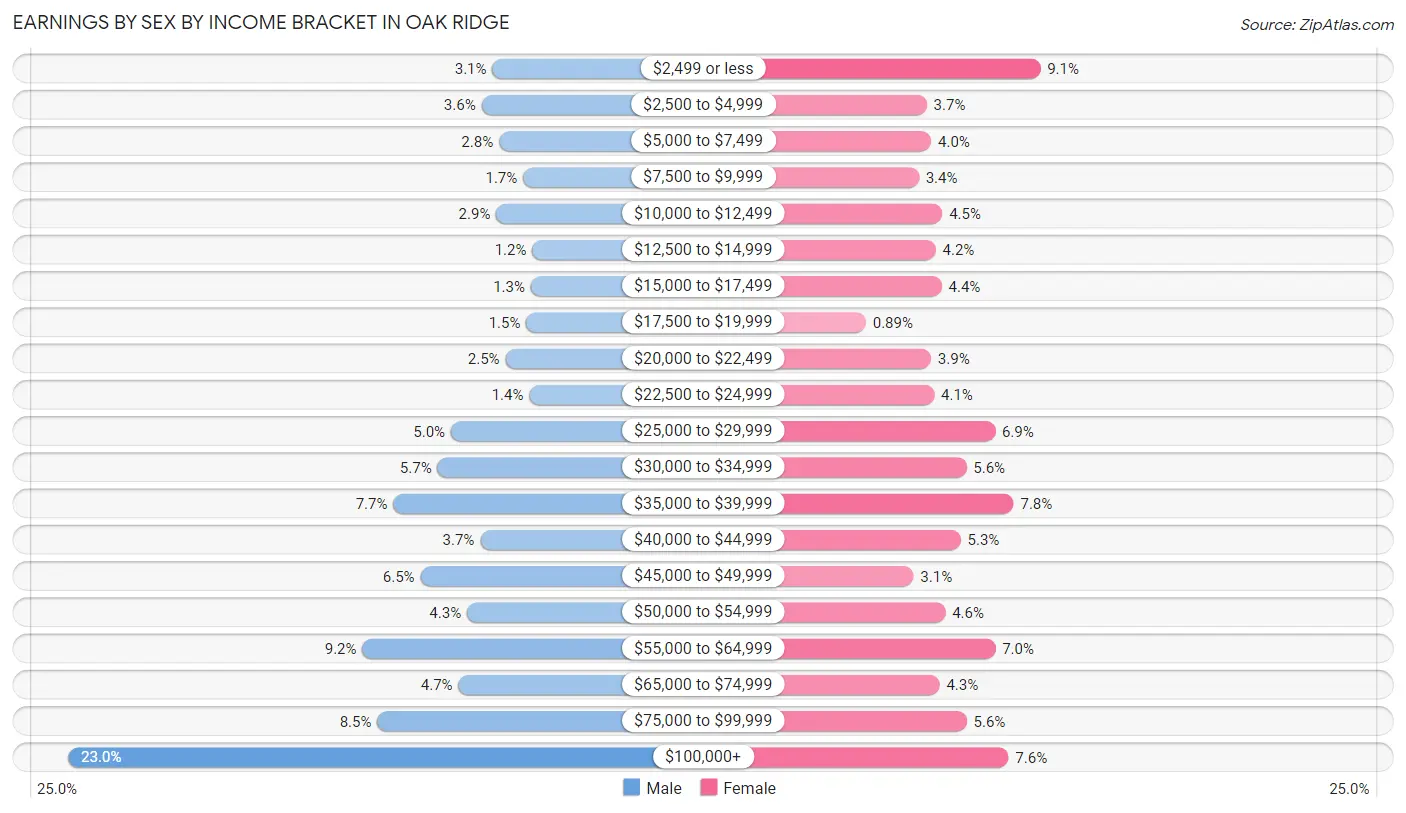
| Income | Male | Female |
| $2,499 or less | 244 (3.1%) | 642 (9.1%) |
| $2,500 to $4,999 | 284 (3.6%) | 265 (3.7%) |
| $5,000 to $7,499 | 219 (2.8%) | 280 (4.0%) |
| $7,500 to $9,999 | 130 (1.7%) | 239 (3.4%) |
| $10,000 to $12,499 | 230 (2.9%) | 317 (4.5%) |
| $12,500 to $14,999 | 96 (1.2%) | 295 (4.2%) |
| $15,000 to $17,499 | 102 (1.3%) | 315 (4.4%) |
| $17,500 to $19,999 | 118 (1.5%) | 63 (0.9%) |
| $20,000 to $22,499 | 196 (2.5%) | 279 (3.9%) |
| $22,500 to $24,999 | 107 (1.4%) | 290 (4.1%) |
| $25,000 to $29,999 | 397 (5.0%) | 492 (6.9%) |
| $30,000 to $34,999 | 447 (5.7%) | 397 (5.6%) |
| $35,000 to $39,999 | 610 (7.7%) | 554 (7.8%) |
| $40,000 to $44,999 | 289 (3.7%) | 378 (5.3%) |
| $45,000 to $49,999 | 510 (6.5%) | 221 (3.1%) |
| $50,000 to $54,999 | 338 (4.3%) | 327 (4.6%) |
| $55,000 to $64,999 | 724 (9.2%) | 493 (7.0%) |
| $65,000 to $74,999 | 369 (4.7%) | 308 (4.3%) |
| $75,000 to $99,999 | 669 (8.5%) | 398 (5.6%) |
| $100,000+ | 1,812 (23.0%) | 537 (7.6%) |
| Total | 7,891 (100.0%) | 7,090 (100.0%) |
Earnings by Sex by Educational Attainment in Oak Ridge
Average earnings in Oak Ridge are $53,542 for men and $35,814 for women, a difference of 33.1%. Men with an educational attainment of graduate degree enjoy the highest average annual earnings of $87,407, while those with less than high school education earn the least with $37,671. Women with an educational attainment of graduate degree earn the most with the average annual earnings of $58,750, while those with college or associate's degree education have the smallest earnings of $28,672.
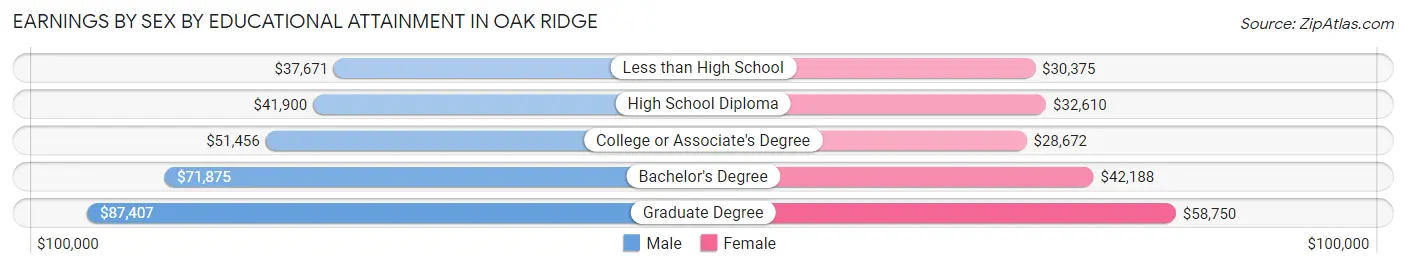
| Educational Attainment | Male Income | Female Income |
| Less than High School | $37,671 | $30,375 |
| High School Diploma | $41,900 | $32,610 |
| College or Associate's Degree | $51,456 | $28,672 |
| Bachelor's Degree | $71,875 | $42,188 |
| Graduate Degree | $87,407 | $58,750 |
| Total | $53,542 | $35,814 |
Family Income in Oak Ridge
Family Income Brackets in Oak Ridge
According to the Oak Ridge family income data, there are 1,611 families falling into the $50,000 to $74,999 income range, which is the most common income bracket and makes up 20.0% of all families. Conversely, the $10,000 to $14,999 income bracket is the least frequent group with only 89 families (1.1%) belonging to this category.
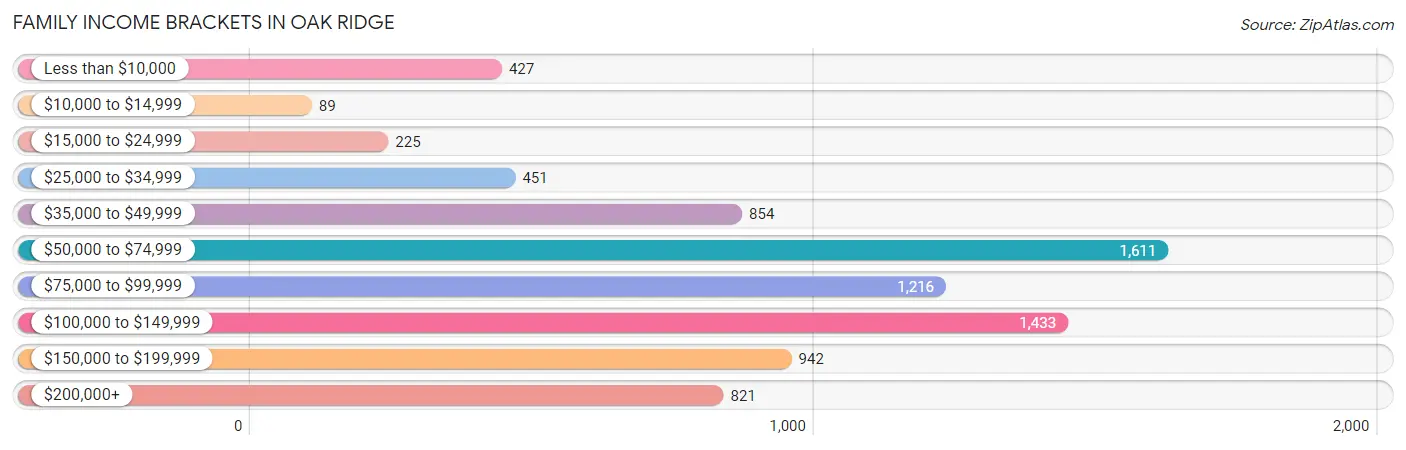
| Income Bracket | # Families | % Families |
| Less than $10,000 | 427 | 5.3% |
| $10,000 to $14,999 | 89 | 1.1% |
| $15,000 to $24,999 | 225 | 2.8% |
| $25,000 to $34,999 | 451 | 5.6% |
| $35,000 to $49,999 | 854 | 10.6% |
| $50,000 to $74,999 | 1,611 | 20.0% |
| $75,000 to $99,999 | 1,216 | 15.1% |
| $100,000 to $149,999 | 1,433 | 17.8% |
| $150,000 to $199,999 | 942 | 11.7% |
| $200,000+ | 821 | 10.2% |
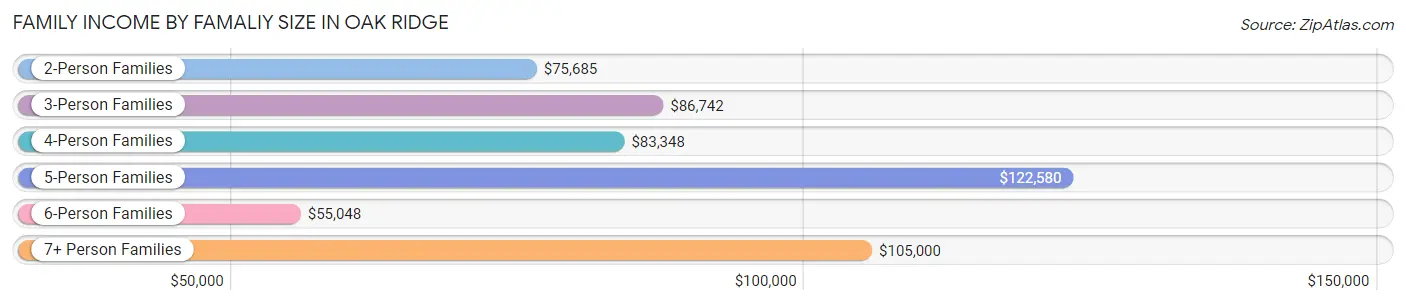
Family Income by Famaliy Size in Oak Ridge
5-person families (699 | 8.7%) account for the highest median family income in Oak Ridge with $122,580 per family, while 2-person families (3,890 | 48.3%) have the highest median income of $37,842 per family member.
| Income Bracket | # Families | Median Income |
| 2-Person Families | 3,890 (48.3%) | $75,685 |
| 3-Person Families | 1,844 (22.9%) | $86,742 |
| 4-Person Families | 1,369 (17.0%) | $83,348 |
| 5-Person Families | 699 (8.7%) | $122,580 |
| 6-Person Families | 167 (2.1%) | $55,048 |
| 7+ Person Families | 84 (1.0%) | $105,000 |
| Total | 8,053 (100.0%) | $81,784 |
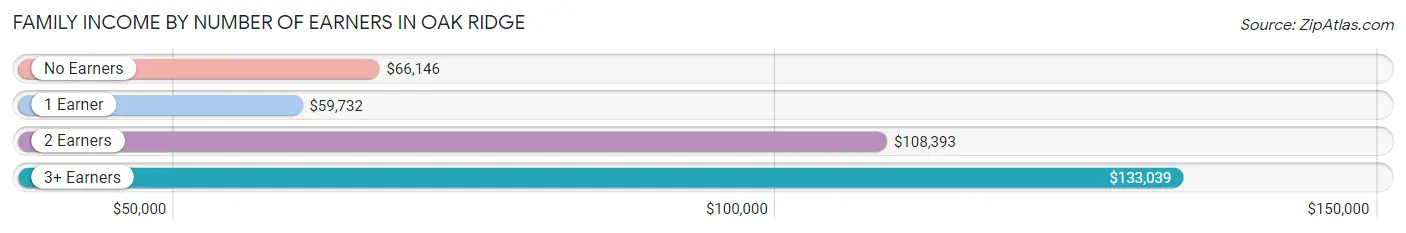
Family Income by Number of Earners in Oak Ridge
The median family income in Oak Ridge is $81,784, with families comprising 3+ earners (585) having the highest median family income of $133,039, while families with 1 earner (2,851) have the lowest median family income of $59,732, accounting for 7.3% and 35.4% of families, respectively.
| Number of Earners | # Families | Median Income |
| No Earners | 1,431 (17.8%) | $66,146 |
| 1 Earner | 2,851 (35.4%) | $59,732 |
| 2 Earners | 3,186 (39.6%) | $108,393 |
| 3+ Earners | 585 (7.3%) | $133,039 |
| Total | 8,053 (100.0%) | $81,784 |
Household Income in Oak Ridge
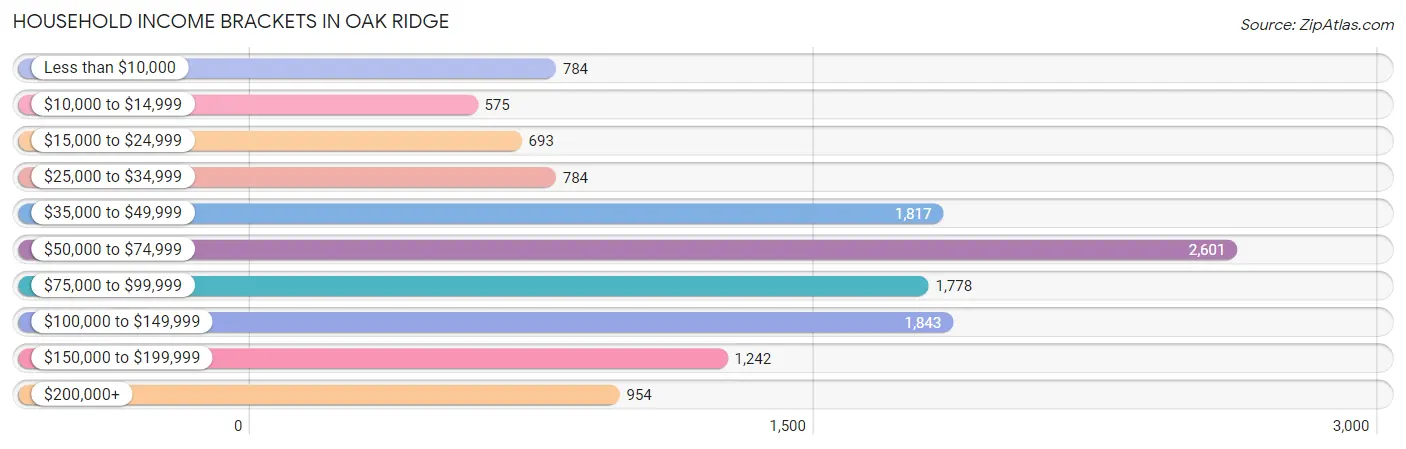
Household Income Brackets in Oak Ridge
With 2,601 households falling in the category, the $50,000 to $74,999 income range is the most frequent in Oak Ridge, accounting for 19.9% of all households. In contrast, only 575 households (4.4%) fall into the $10,000 to $14,999 income bracket, making it the least populous group.
| Income Bracket | # Households | % Households |
| Less than $10,000 | 784 | 6.0% |
| $10,000 to $14,999 | 575 | 4.4% |
| $15,000 to $24,999 | 693 | 5.3% |
| $25,000 to $34,999 | 784 | 6.0% |
| $35,000 to $49,999 | 1,817 | 13.9% |
| $50,000 to $74,999 | 2,601 | 19.9% |
| $75,000 to $99,999 | 1,778 | 13.6% |
| $100,000 to $149,999 | 1,843 | 14.1% |
| $150,000 to $199,999 | 1,242 | 9.5% |
| $200,000+ | 954 | 7.3% |
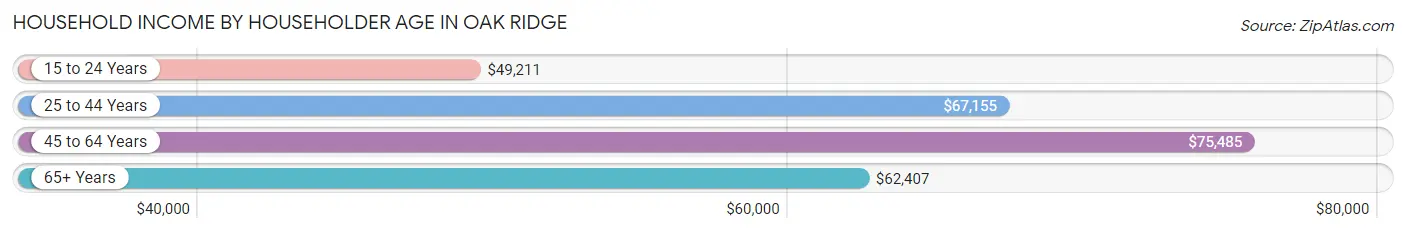
Household Income by Householder Age in Oak Ridge
The median household income in Oak Ridge is $67,152, with the highest median household income of $75,485 found in the 45 to 64 years age bracket for the primary householder. A total of 4,710 households (36.0%) fall into this category. Meanwhile, the 15 to 24 years age bracket for the primary householder has the lowest median household income of $49,211, with 428 households (3.3%) in this group.
| Income Bracket | # Households | Median Income |
| 15 to 24 Years | 428 (3.3%) | $49,211 |
| 25 to 44 Years | 3,992 (30.5%) | $67,155 |
| 45 to 64 Years | 4,710 (36.0%) | $75,485 |
| 65+ Years | 3,941 (30.1%) | $62,407 |
| Total | 13,071 (100.0%) | $67,152 |
Poverty in Oak Ridge
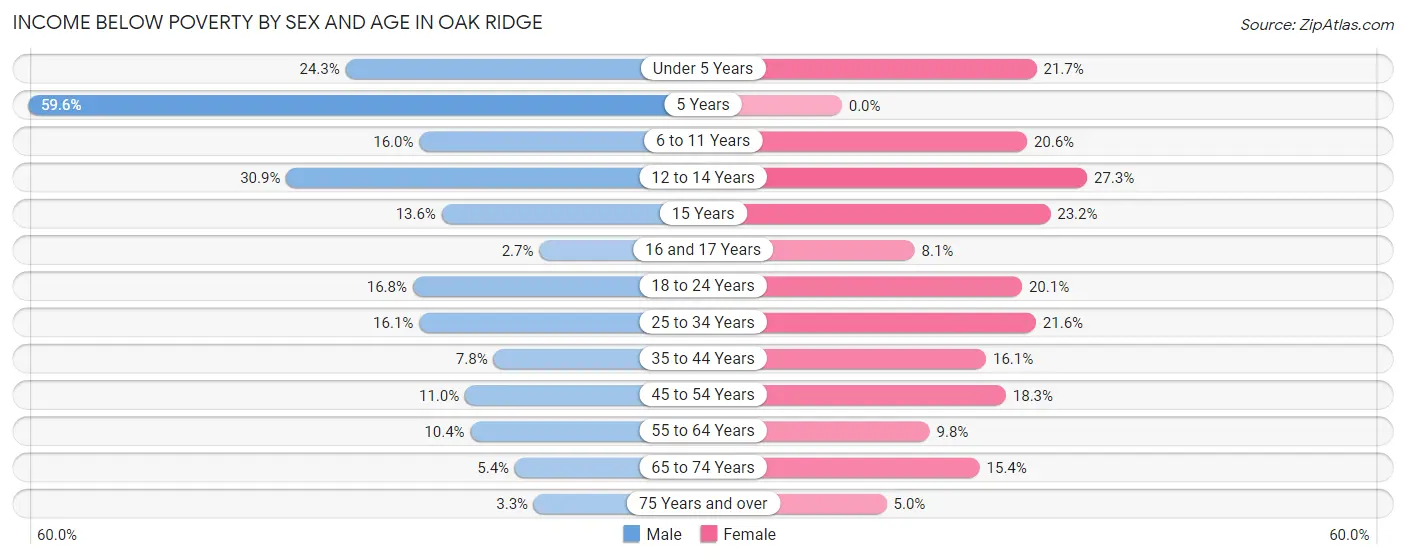
Income Below Poverty by Sex and Age in Oak Ridge
With 13.1% poverty level for males and 16.2% for females among the residents of Oak Ridge, 5 year old males and 12 to 14 year old females are the most vulnerable to poverty, with 127 males (59.6%) and 207 females (27.3%) in their respective age groups living below the poverty level.
| Age Bracket | Male | Female |
| Under 5 Years | 188 (24.3%) | 123 (21.7%) |
| 5 Years | 127 (59.6%) | 0 (0.0%) |
| 6 to 11 Years | 204 (16.0%) | 261 (20.6%) |
| 12 to 14 Years | 208 (30.9%) | 207 (27.3%) |
| 15 Years | 42 (13.6%) | 49 (23.2%) |
| 16 and 17 Years | 14 (2.7%) | 46 (8.1%) |
| 18 to 24 Years | 163 (16.8%) | 231 (20.1%) |
| 25 to 34 Years | 378 (16.1%) | 357 (21.6%) |
| 35 to 44 Years | 130 (7.8%) | 333 (16.1%) |
| 45 to 54 Years | 200 (11.0%) | 377 (18.3%) |
| 55 to 64 Years | 210 (10.3%) | 211 (9.8%) |
| 65 to 74 Years | 85 (5.4%) | 298 (15.3%) |
| 75 Years and over | 30 (3.3%) | 61 (5.0%) |
| Total | 1,979 (13.1%) | 2,554 (16.2%) |
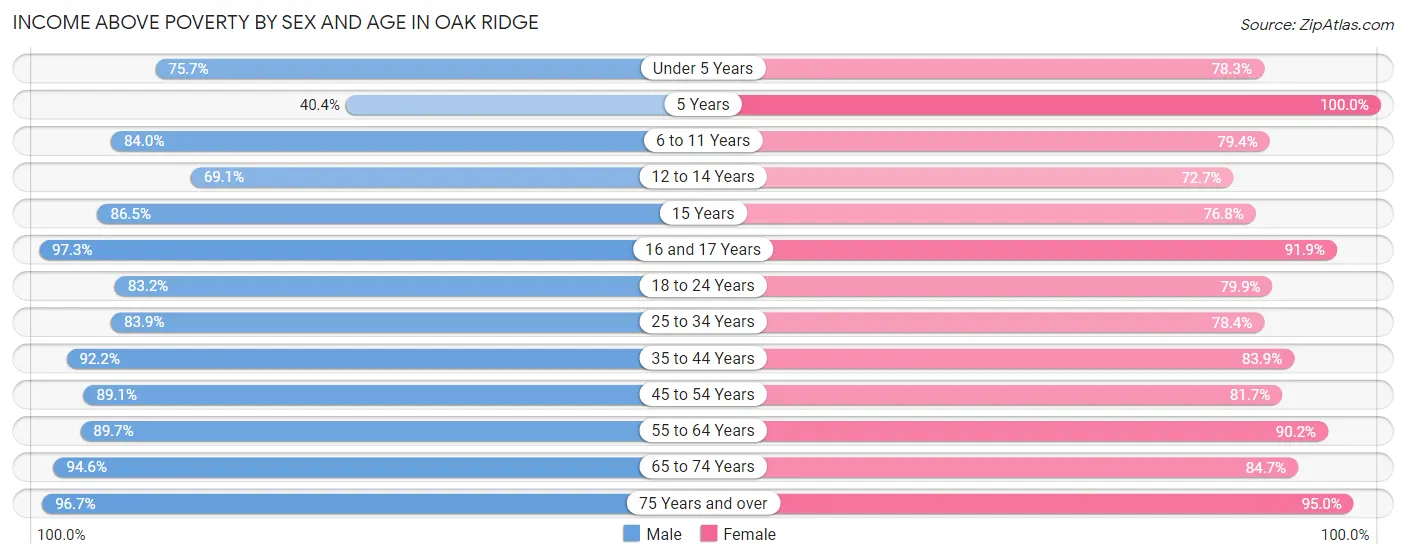
Income Above Poverty by Sex and Age in Oak Ridge
According to the poverty statistics in Oak Ridge, males aged 16 and 17 years and females aged 5 years are the age groups that are most secure financially, with 97.3% of males and 100.0% of females in these age groups living above the poverty line.
| Age Bracket | Male | Female |
| Under 5 Years | 587 (75.7%) | 444 (78.3%) |
| 5 Years | 86 (40.4%) | 152 (100.0%) |
| 6 to 11 Years | 1,068 (84.0%) | 1,005 (79.4%) |
| 12 to 14 Years | 466 (69.1%) | 551 (72.7%) |
| 15 Years | 268 (86.5%) | 162 (76.8%) |
| 16 and 17 Years | 508 (97.3%) | 521 (91.9%) |
| 18 to 24 Years | 809 (83.2%) | 920 (79.9%) |
| 25 to 34 Years | 1,976 (83.9%) | 1,294 (78.4%) |
| 35 to 44 Years | 1,542 (92.2%) | 1,739 (83.9%) |
| 45 to 54 Years | 1,626 (89.0%) | 1,686 (81.7%) |
| 55 to 64 Years | 1,819 (89.6%) | 1,947 (90.2%) |
| 65 to 74 Years | 1,493 (94.6%) | 1,644 (84.7%) |
| 75 Years and over | 886 (96.7%) | 1,161 (95.0%) |
| Total | 13,134 (86.9%) | 13,226 (83.8%) |
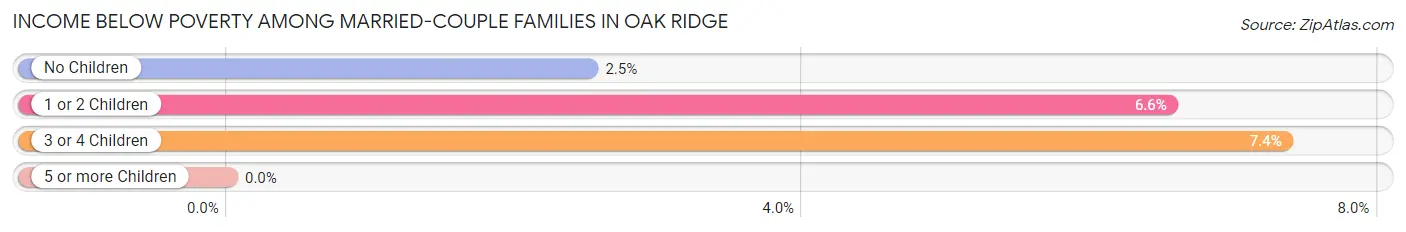
Income Below Poverty Among Married-Couple Families in Oak Ridge
The poverty statistics for married-couple families in Oak Ridge show that 4.3% or 254 of the total 5,951 families live below the poverty line. Families with 3 or 4 children have the highest poverty rate of 7.3%, comprising of 36 families. On the other hand, families with 5 or more children have the lowest poverty rate of 0.0%, which includes 0 families.
| Children | Above Poverty | Below Poverty |
| No Children | 3,266 (97.5%) | 84 (2.5%) |
| 1 or 2 Children | 1,911 (93.4%) | 134 (6.6%) |
| 3 or 4 Children | 454 (92.6%) | 36 (7.3%) |
| 5 or more Children | 66 (100.0%) | 0 (0.0%) |
| Total | 5,697 (95.7%) | 254 (4.3%) |
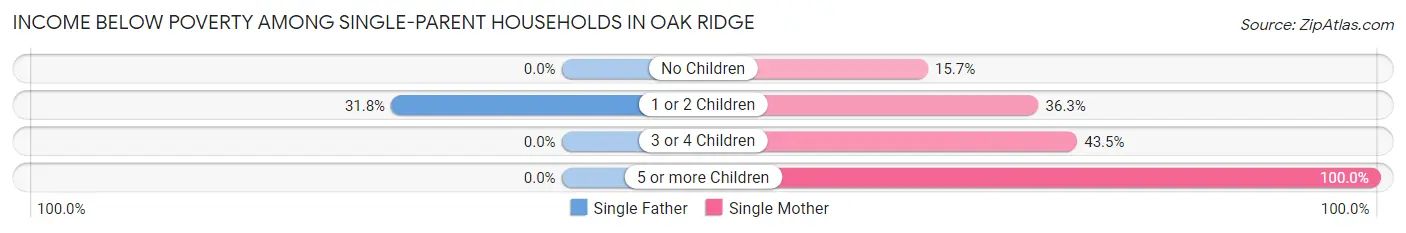
Income Below Poverty Among Single-Parent Households in Oak Ridge
According to the poverty data in Oak Ridge, 14.1% or 74 single-father households and 31.0% or 488 single-mother households are living below the poverty line. Among single-father households, those with 1 or 2 children have the highest poverty rate, with 74 households (31.8%) experiencing poverty. Likewise, among single-mother households, those with 5 or more children have the highest poverty rate, with 6 households (100.0%) falling below the poverty line.
| Children | Single Father | Single Mother |
| No Children | 0 (0.0%) | 79 (15.7%) |
| 1 or 2 Children | 74 (31.8%) | 309 (36.3%) |
| 3 or 4 Children | 0 (0.0%) | 94 (43.5%) |
| 5 or more Children | 0 (0.0%) | 6 (100.0%) |
| Total | 74 (14.1%) | 488 (31.0%) |
Income Below Poverty Among Married-Couple vs Single-Parent Households in Oak Ridge
The poverty data for Oak Ridge shows that 254 of the married-couple family households (4.3%) and 562 of the single-parent households (26.7%) are living below the poverty level. Within the married-couple family households, those with 3 or 4 children have the highest poverty rate, with 36 households (7.3%) falling below the poverty line. Among the single-parent households, those with 5 or more children have the highest poverty rate, with 6 household (100.0%) living below poverty.
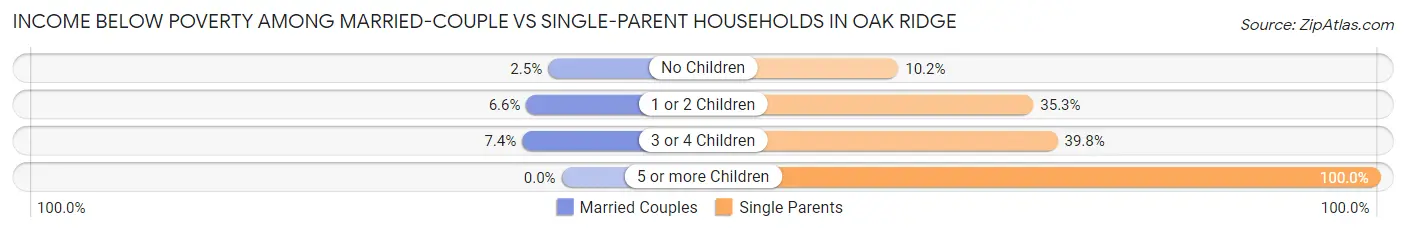
| Children | Married-Couple Families | Single-Parent Households |
| No Children | 84 (2.5%) | 79 (10.2%) |
| 1 or 2 Children | 134 (6.6%) | 383 (35.3%) |
| 3 or 4 Children | 36 (7.3%) | 94 (39.8%) |
| 5 or more Children | 0 (0.0%) | 6 (100.0%) |
| Total | 254 (4.3%) | 562 (26.7%) |
Employment Characteristics in Oak Ridge
Employment by Class of Employer in Oak Ridge
Among the 13,225 employed individuals in Oak Ridge, private company employees (9,059 | 68.5%), not-for-profit organizations (1,384 | 10.5%), and federal government employees (942 | 7.1%) make up the most common classes of employment.
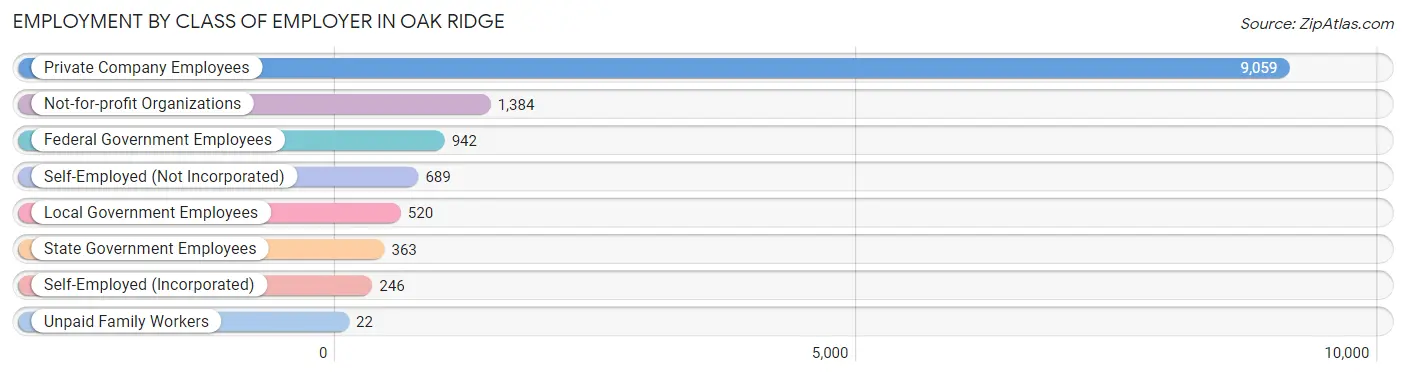
| Employer Class | # Employees | % Employees |
| Private Company Employees | 9,059 | 68.5% |
| Self-Employed (Incorporated) | 246 | 1.9% |
| Self-Employed (Not Incorporated) | 689 | 5.2% |
| Not-for-profit Organizations | 1,384 | 10.5% |
| Local Government Employees | 520 | 3.9% |
| State Government Employees | 363 | 2.7% |
| Federal Government Employees | 942 | 7.1% |
| Unpaid Family Workers | 22 | 0.2% |
| Total | 13,225 | 100.0% |
Employment Status by Age in Oak Ridge
According to the labor force statistics for Oak Ridge, out of the total population over 16 years of age (24,960), 56.8% or 14,177 individuals are in the labor force, with 5.6% or 794 of them unemployed. The age group with the highest labor force participation rate is 30 to 34 years, with 86.6% or 1,753 individuals in the labor force. Within the labor force, the 16 to 19 years age range has the highest percentage of unemployed individuals, with 16.4% or 101 of them being unemployed.
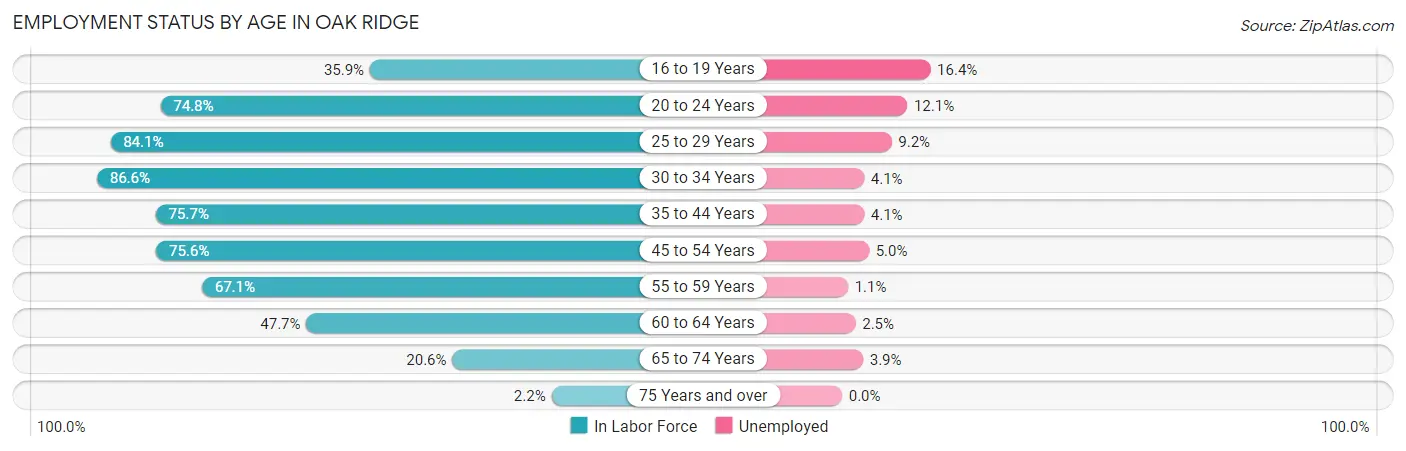
| Age Bracket | In Labor Force | Unemployed |
| 16 to 19 Years | 613 (35.9%) | 101 (16.4%) |
| 20 to 24 Years | 1,126 (74.8%) | 136 (12.1%) |
| 25 to 29 Years | 1,666 (84.1%) | 153 (9.2%) |
| 30 to 34 Years | 1,753 (86.6%) | 72 (4.1%) |
| 35 to 44 Years | 2,852 (75.7%) | 117 (4.1%) |
| 45 to 54 Years | 2,955 (75.6%) | 148 (5.0%) |
| 55 to 59 Years | 1,419 (67.1%) | 16 (1.1%) |
| 60 to 64 Years | 1,000 (47.7%) | 25 (2.5%) |
| 65 to 74 Years | 741 (20.6%) | 29 (3.9%) |
| 75 Years and over | 50 (2.2%) | 0 (0.0%) |
| Total | 14,177 (56.8%) | 794 (5.6%) |
Employment Status by Educational Attainment in Oak Ridge
According to labor force statistics for Oak Ridge, 73.3% of individuals (11,650) out of the total population between 25 and 64 years of age (15,894) are in the labor force, with 4.5% or 524 of them being unemployed. The group with the highest labor force participation rate are those with the educational attainment of bachelor's degree or higher, with 81.2% or 4,484 individuals in the labor force. Within the labor force, individuals with college / associate degree education have the highest percentage of unemployment, with 7.3% or 303 of them being unemployed.
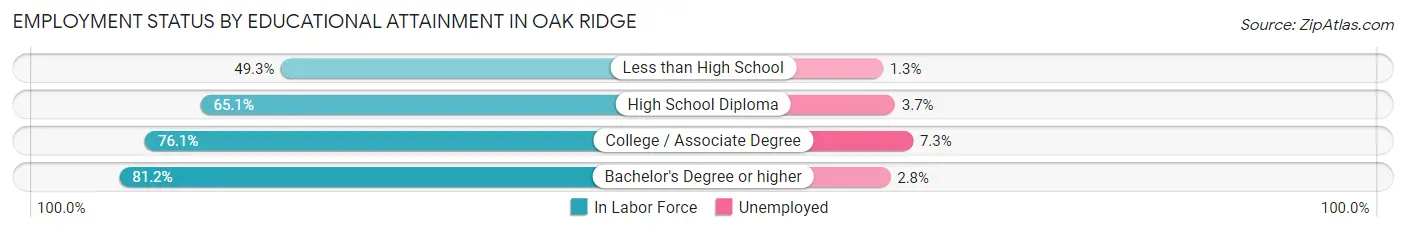
| Educational Attainment | In Labor Force | Unemployed |
| Less than High School | 606 (49.3%) | 16 (1.3%) |
| High School Diploma | 2,398 (65.1%) | 136 (3.7%) |
| College / Associate Degree | 4,154 (76.1%) | 398 (7.3%) |
| Bachelor's Degree or higher | 4,484 (81.2%) | 155 (2.8%) |
| Total | 11,650 (73.3%) | 715 (4.5%) |
Employment Occupations by Sex in Oak Ridge
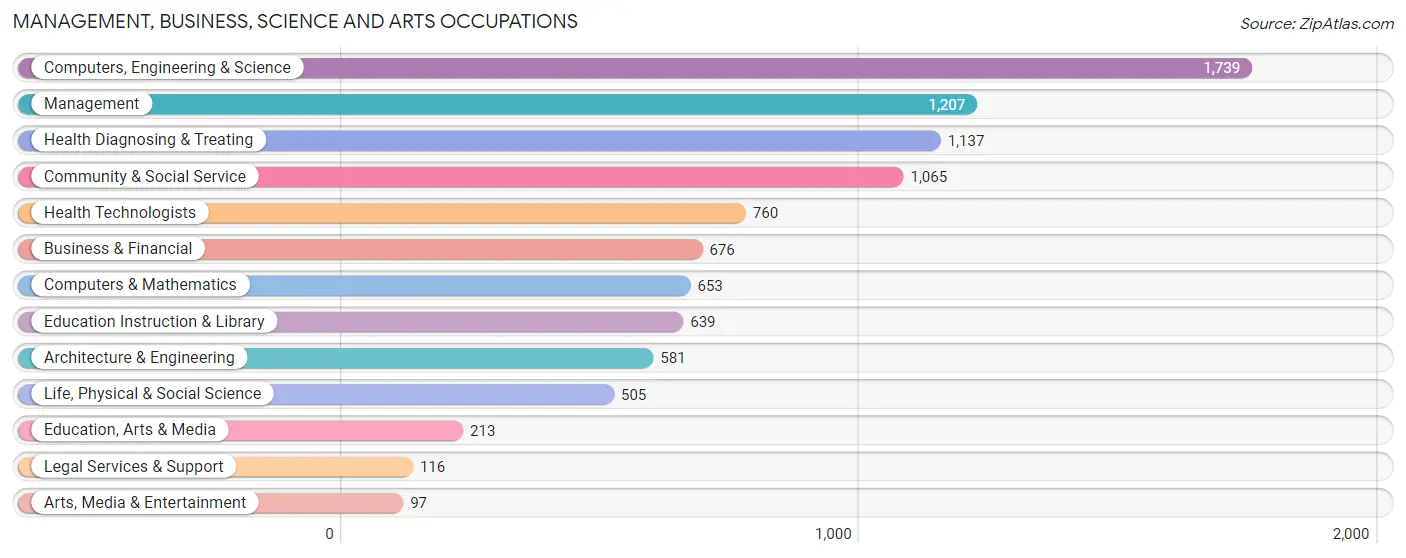
Management, Business, Science and Arts Occupations
The most common Management, Business, Science and Arts occupations in Oak Ridge are Computers, Engineering & Science (1,739 | 13.1%), Management (1,207 | 9.1%), Health Diagnosing & Treating (1,137 | 8.5%), Community & Social Service (1,065 | 8.0%), and Health Technologists (760 | 5.7%).
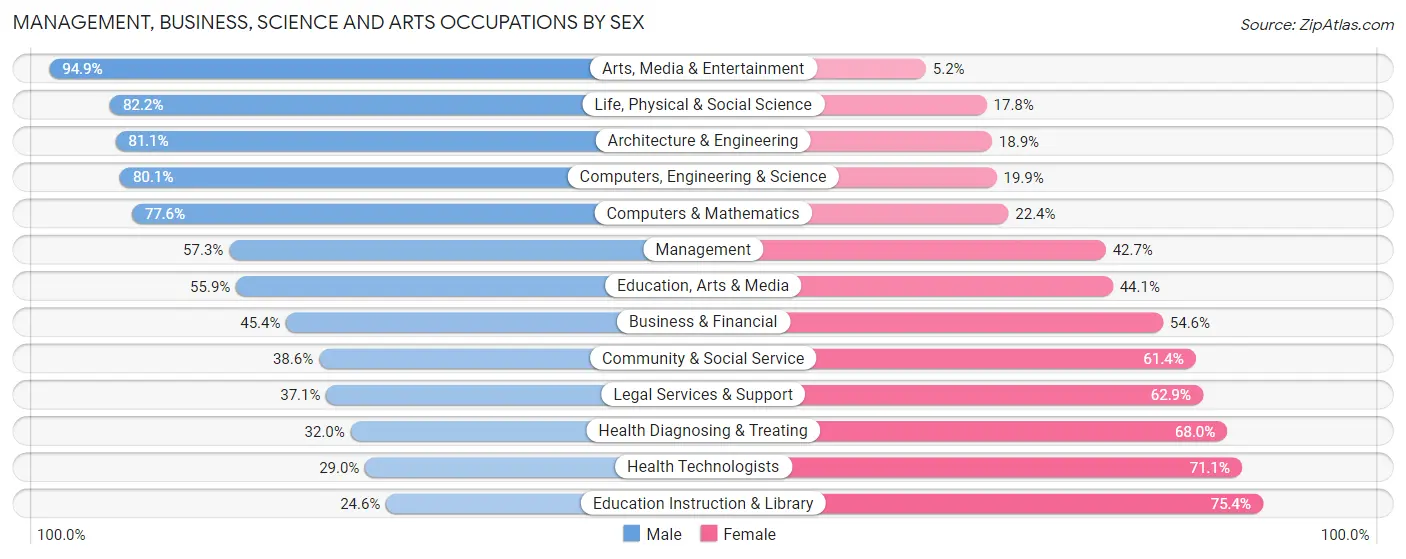
Management, Business, Science and Arts Occupations by Sex
Within the Management, Business, Science and Arts occupations in Oak Ridge, the most male-oriented occupations are Arts, Media & Entertainment (94.9%), Life, Physical & Social Science (82.2%), and Architecture & Engineering (81.1%), while the most female-oriented occupations are Education Instruction & Library (75.4%), Health Technologists (71.1%), and Health Diagnosing & Treating (68.0%).
| Occupation | Male | Female |
| Management | 692 (57.3%) | 515 (42.7%) |
| Business & Financial | 307 (45.4%) | 369 (54.6%) |
| Computers, Engineering & Science | 1,393 (80.1%) | 346 (19.9%) |
| Computers & Mathematics | 507 (77.6%) | 146 (22.4%) |
| Architecture & Engineering | 471 (81.1%) | 110 (18.9%) |
| Life, Physical & Social Science | 415 (82.2%) | 90 (17.8%) |
| Community & Social Service | 411 (38.6%) | 654 (61.4%) |
| Education, Arts & Media | 119 (55.9%) | 94 (44.1%) |
| Legal Services & Support | 43 (37.1%) | 73 (62.9%) |
| Education Instruction & Library | 157 (24.6%) | 482 (75.4%) |
| Arts, Media & Entertainment | 92 (94.9%) | 5 (5.1%) |
| Health Diagnosing & Treating | 364 (32.0%) | 773 (68.0%) |
| Health Technologists | 220 (28.9%) | 540 (71.1%) |
| Total (Category) | 3,167 (54.4%) | 2,657 (45.6%) |
| Total (Overall) | 7,329 (55.0%) | 5,996 (45.0%) |
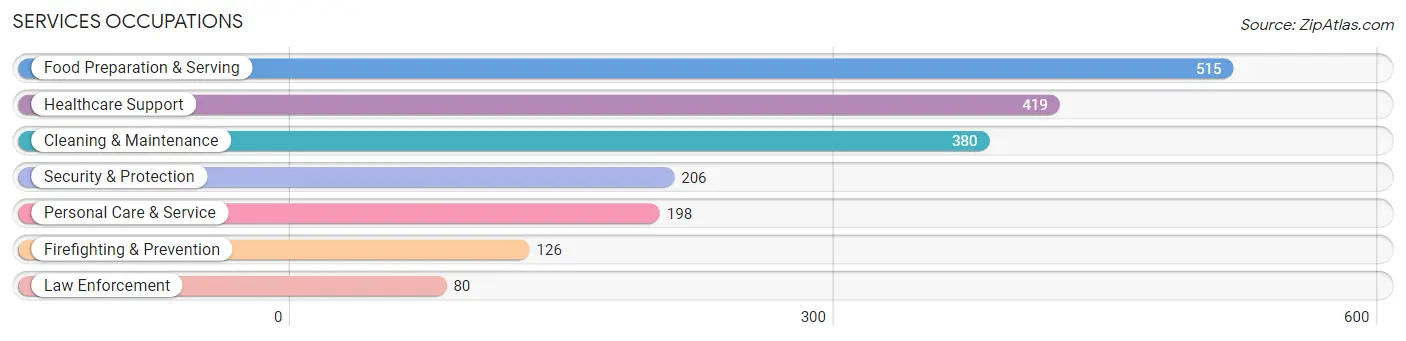
Services Occupations
The most common Services occupations in Oak Ridge are Food Preparation & Serving (515 | 3.9%), Healthcare Support (419 | 3.1%), Cleaning & Maintenance (380 | 2.9%), Security & Protection (206 | 1.5%), and Personal Care & Service (198 | 1.5%).
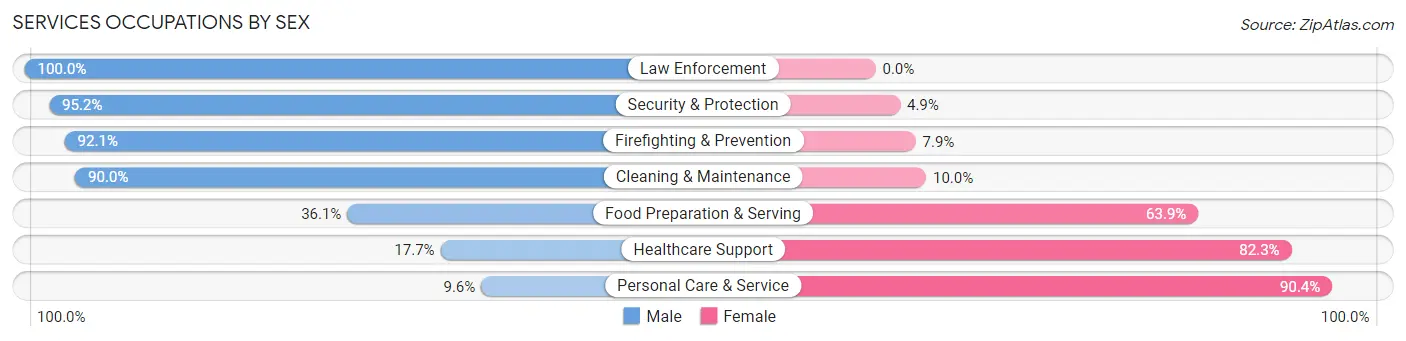
Services Occupations by Sex
Within the Services occupations in Oak Ridge, the most male-oriented occupations are Law Enforcement (100.0%), Security & Protection (95.2%), and Firefighting & Prevention (92.1%), while the most female-oriented occupations are Personal Care & Service (90.4%), Healthcare Support (82.3%), and Food Preparation & Serving (63.9%).
| Occupation | Male | Female |
| Healthcare Support | 74 (17.7%) | 345 (82.3%) |
| Security & Protection | 196 (95.2%) | 10 (4.9%) |
| Firefighting & Prevention | 116 (92.1%) | 10 (7.9%) |
| Law Enforcement | 80 (100.0%) | 0 (0.0%) |
| Food Preparation & Serving | 186 (36.1%) | 329 (63.9%) |
| Cleaning & Maintenance | 342 (90.0%) | 38 (10.0%) |
| Personal Care & Service | 19 (9.6%) | 179 (90.4%) |
| Total (Category) | 817 (47.6%) | 901 (52.4%) |
| Total (Overall) | 7,329 (55.0%) | 5,996 (45.0%) |
Sales and Office Occupations
The most common Sales and Office occupations in Oak Ridge are Office & Administration (1,502 | 11.3%), and Sales & Related (1,155 | 8.7%).

Sales and Office Occupations by Sex

| Occupation | Male | Female |
| Sales & Related | 621 (53.8%) | 534 (46.2%) |
| Office & Administration | 295 (19.6%) | 1,207 (80.4%) |
| Total (Category) | 916 (34.5%) | 1,741 (65.5%) |
| Total (Overall) | 7,329 (55.0%) | 5,996 (45.0%) |
Natural Resources, Construction and Maintenance Occupations
The most common Natural Resources, Construction and Maintenance occupations in Oak Ridge are Construction & Extraction (666 | 5.0%), Installation, Maintenance & Repair (377 | 2.8%), and Farming, Fishing & Forestry (118 | 0.9%).
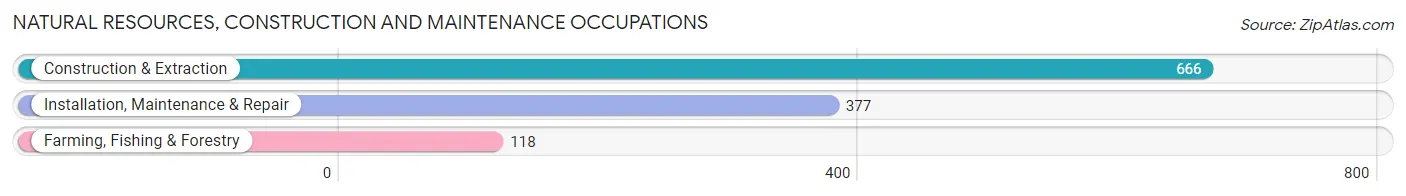
Natural Resources, Construction and Maintenance Occupations by Sex

| Occupation | Male | Female |
| Farming, Fishing & Forestry | 0 (0.0%) | 118 (100.0%) |
| Construction & Extraction | 623 (93.5%) | 43 (6.5%) |
| Installation, Maintenance & Repair | 329 (87.3%) | 48 (12.7%) |
| Total (Category) | 952 (82.0%) | 209 (18.0%) |
| Total (Overall) | 7,329 (55.0%) | 5,996 (45.0%) |
Production, Transportation and Moving Occupations
The most common Production, Transportation and Moving occupations in Oak Ridge are Production (809 | 6.1%), Material Moving (608 | 4.6%), and Transportation (548 | 4.1%).
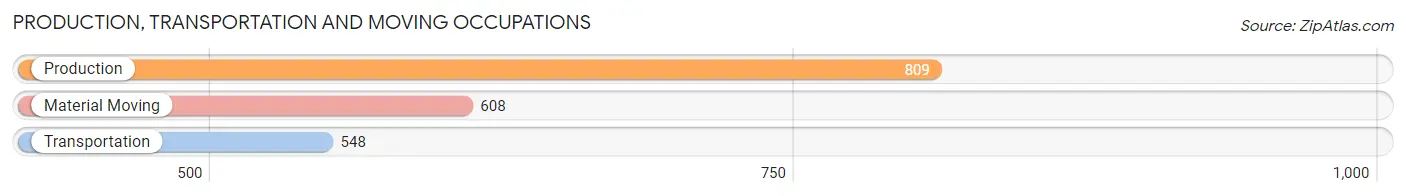
Production, Transportation and Moving Occupations by Sex
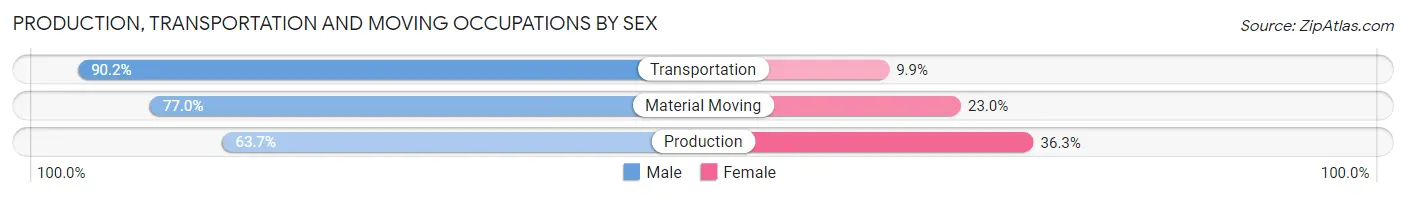
| Occupation | Male | Female |
| Production | 515 (63.7%) | 294 (36.3%) |
| Transportation | 494 (90.1%) | 54 (9.9%) |
| Material Moving | 468 (77.0%) | 140 (23.0%) |
| Total (Category) | 1,477 (75.2%) | 488 (24.8%) |
| Total (Overall) | 7,329 (55.0%) | 5,996 (45.0%) |
Employment Industries by Sex in Oak Ridge
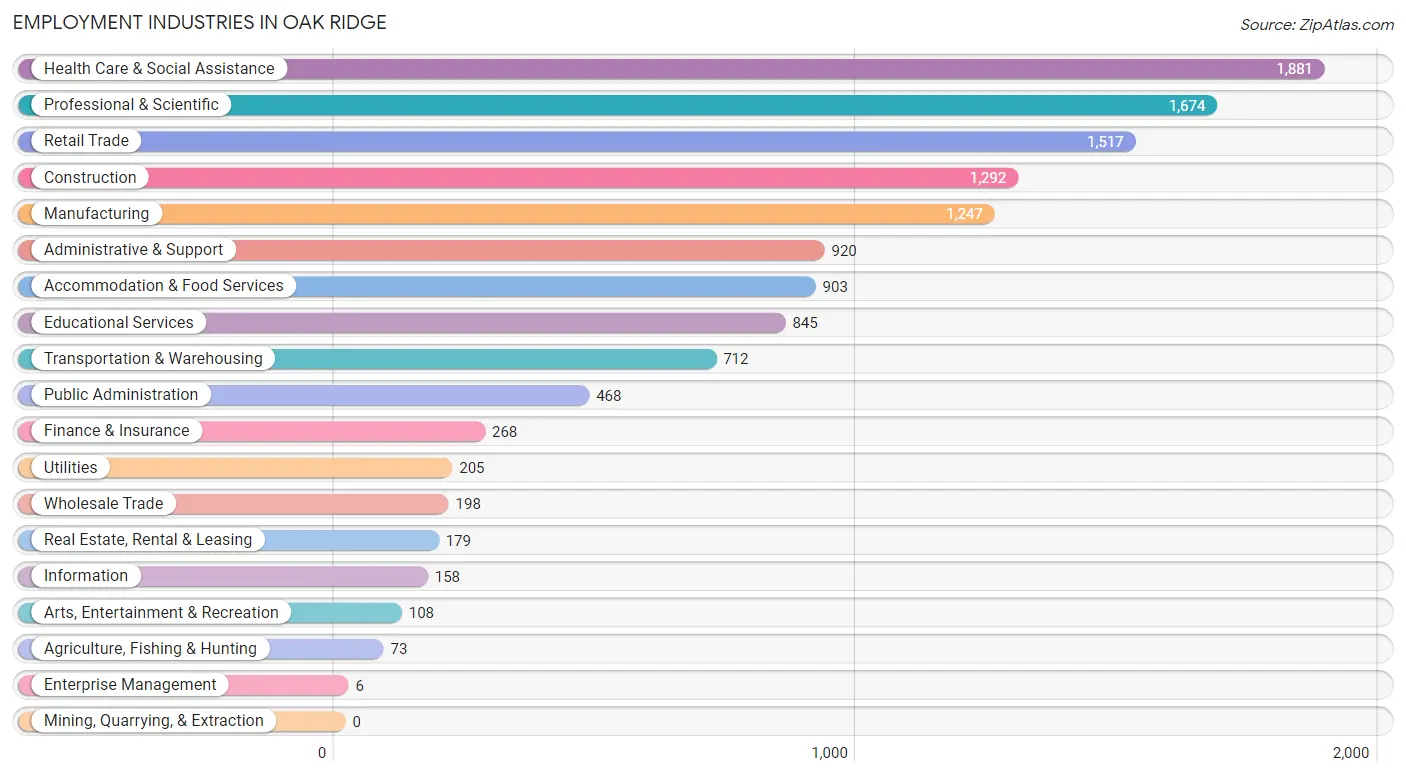
Employment Industries in Oak Ridge
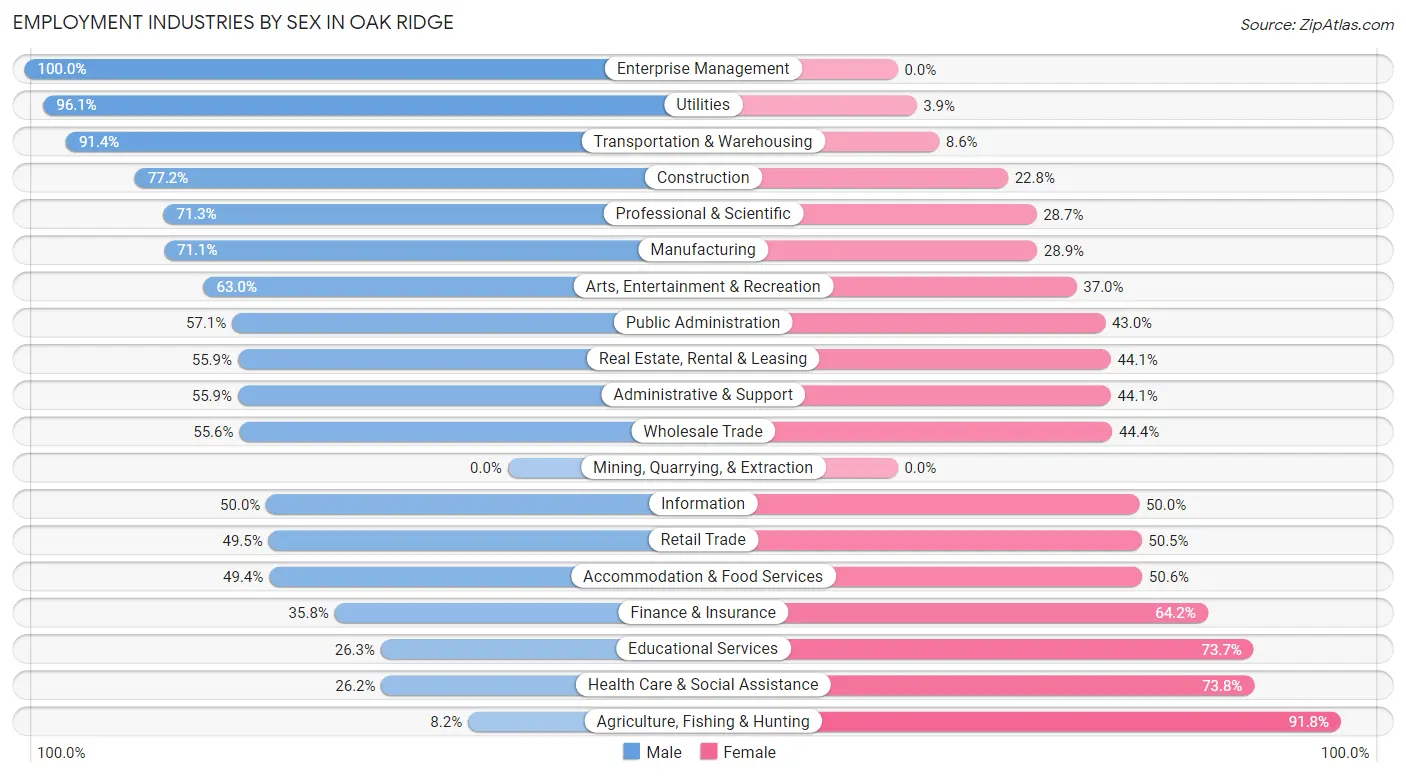
The major employment industries in Oak Ridge include Health Care & Social Assistance (1,881 | 14.1%), Professional & Scientific (1,674 | 12.6%), Retail Trade (1,517 | 11.4%), Construction (1,292 | 9.7%), and Manufacturing (1,247 | 9.4%).
Employment Industries by Sex in Oak Ridge
The Oak Ridge industries that see more men than women are Enterprise Management (100.0%), Utilities (96.1%), and Transportation & Warehousing (91.4%), whereas the industries that tend to have a higher number of women are Agriculture, Fishing & Hunting (91.8%), Health Care & Social Assistance (73.8%), and Educational Services (73.7%).
| Industry | Male | Female |
| Agriculture, Fishing & Hunting | 6 (8.2%) | 67 (91.8%) |
| Mining, Quarrying, & Extraction | 0 (0.0%) | 0 (0.0%) |
| Construction | 997 (77.2%) | 295 (22.8%) |
| Manufacturing | 887 (71.1%) | 360 (28.9%) |
| Wholesale Trade | 110 (55.6%) | 88 (44.4%) |
| Retail Trade | 751 (49.5%) | 766 (50.5%) |
| Transportation & Warehousing | 651 (91.4%) | 61 (8.6%) |
| Utilities | 197 (96.1%) | 8 (3.9%) |
| Information | 79 (50.0%) | 79 (50.0%) |
| Finance & Insurance | 96 (35.8%) | 172 (64.2%) |
| Real Estate, Rental & Leasing | 100 (55.9%) | 79 (44.1%) |
| Professional & Scientific | 1,193 (71.3%) | 481 (28.7%) |
| Enterprise Management | 6 (100.0%) | 0 (0.0%) |
| Administrative & Support | 514 (55.9%) | 406 (44.1%) |
| Educational Services | 222 (26.3%) | 623 (73.7%) |
| Health Care & Social Assistance | 492 (26.2%) | 1,389 (73.8%) |
| Arts, Entertainment & Recreation | 68 (63.0%) | 40 (37.0%) |
| Accommodation & Food Services | 446 (49.4%) | 457 (50.6%) |
| Public Administration | 267 (57.1%) | 201 (42.9%) |
| Total | 7,329 (55.0%) | 5,996 (45.0%) |
Education in Oak Ridge
School Enrollment in Oak Ridge
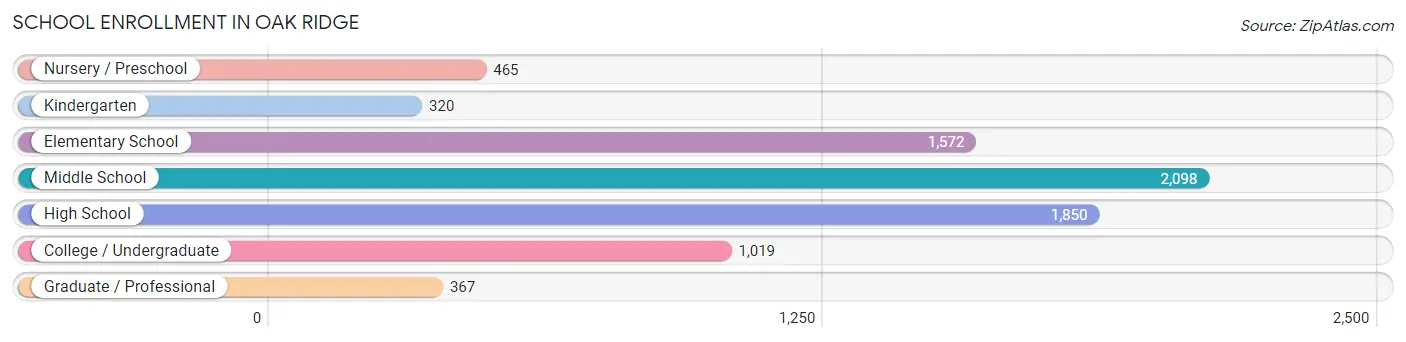
The most common levels of schooling among the 7,691 students in Oak Ridge are middle school (2,098 | 27.3%), high school (1,850 | 24.0%), and elementary school (1,572 | 20.4%).
| School Level | # Students | % Students |
| Nursery / Preschool | 465 | 6.0% |
| Kindergarten | 320 | 4.2% |
| Elementary School | 1,572 | 20.4% |
| Middle School | 2,098 | 27.3% |
| High School | 1,850 | 24.0% |
| College / Undergraduate | 1,019 | 13.3% |
| Graduate / Professional | 367 | 4.8% |
| Total | 7,691 | 100.0% |
School Enrollment by Age by Funding Source in Oak Ridge
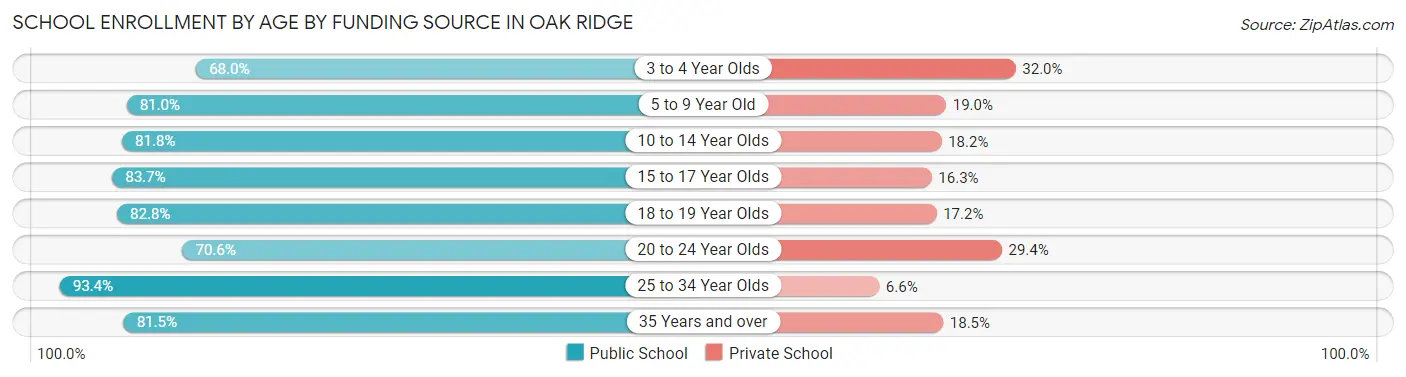
Out of a total of 7,691 students who are enrolled in schools in Oak Ridge, 1,415 (18.4%) attend a private institution, while the remaining 6,276 (81.6%) are enrolled in public schools. The age group of 3 to 4 year olds has the highest likelihood of being enrolled in private schools, with 110 (32.0% in the age bracket) enrolled. Conversely, the age group of 25 to 34 year olds has the lowest likelihood of being enrolled in a private school, with 484 (93.4% in the age bracket) attending a public institution.
| Age Bracket | Public School | Private School |
| 3 to 4 Year Olds | 234 (68.0%) | 110 (32.0%) |
| 5 to 9 Year Old | 1,503 (81.0%) | 353 (19.0%) |
| 10 to 14 Year Olds | 1,914 (81.8%) | 425 (18.2%) |
| 15 to 17 Year Olds | 1,347 (83.7%) | 263 (16.3%) |
| 18 to 19 Year Olds | 264 (82.8%) | 55 (17.2%) |
| 20 to 24 Year Olds | 276 (70.6%) | 115 (29.4%) |
| 25 to 34 Year Olds | 484 (93.4%) | 34 (6.6%) |
| 35 Years and over | 256 (81.5%) | 58 (18.5%) |
| Total | 6,276 (81.6%) | 1,415 (18.4%) |
Educational Attainment by Field of Study in Oak Ridge
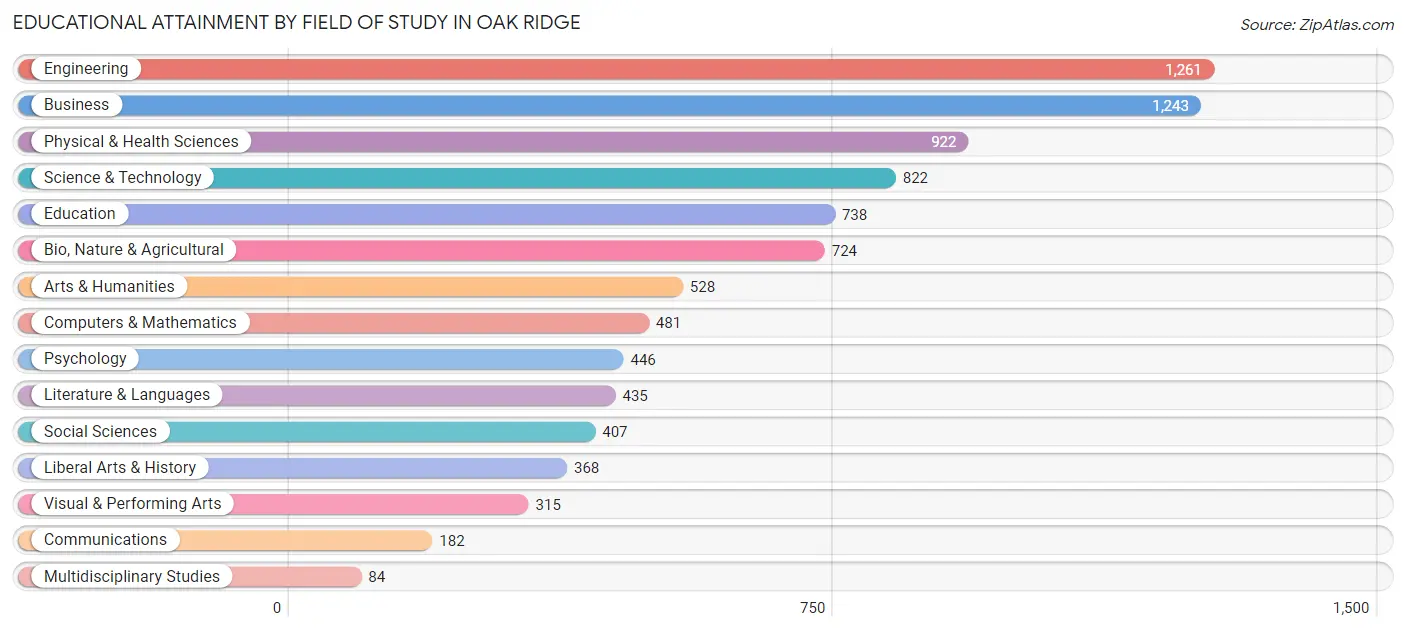
Engineering (1,261 | 14.1%), business (1,243 | 13.9%), physical & health sciences (922 | 10.3%), science & technology (822 | 9.2%), and education (738 | 8.2%) are the most common fields of study among 8,956 individuals in Oak Ridge who have obtained a bachelor's degree or higher.
| Field of Study | # Graduates | % Graduates |
| Computers & Mathematics | 481 | 5.4% |
| Bio, Nature & Agricultural | 724 | 8.1% |
| Physical & Health Sciences | 922 | 10.3% |
| Psychology | 446 | 5.0% |
| Social Sciences | 407 | 4.5% |
| Engineering | 1,261 | 14.1% |
| Multidisciplinary Studies | 84 | 0.9% |
| Science & Technology | 822 | 9.2% |
| Business | 1,243 | 13.9% |
| Education | 738 | 8.2% |
| Literature & Languages | 435 | 4.9% |
| Liberal Arts & History | 368 | 4.1% |
| Visual & Performing Arts | 315 | 3.5% |
| Communications | 182 | 2.0% |
| Arts & Humanities | 528 | 5.9% |
| Total | 8,956 | 100.0% |
Transportation & Commute in Oak Ridge
Vehicle Availability by Sex in Oak Ridge
The most prevalent vehicle ownership categories in Oak Ridge are males with 2 vehicles (2,762, accounting for 38.5%) and females with 2 vehicles (2,373, making up 45.7%).
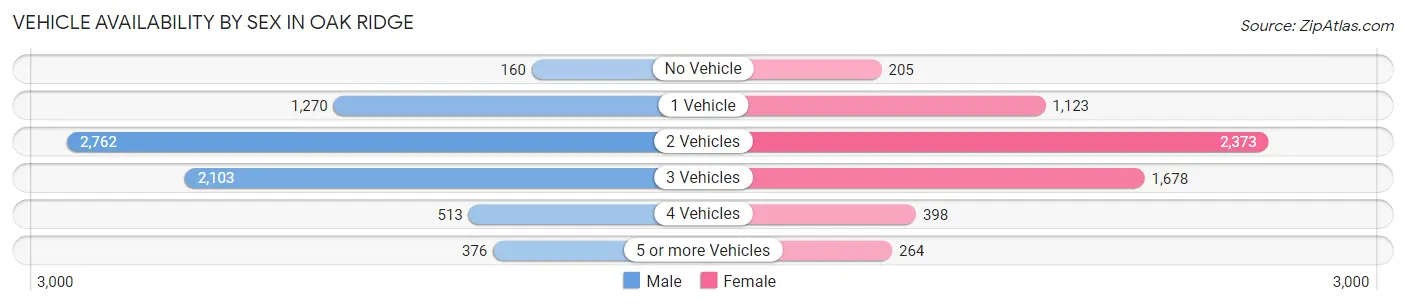
| Vehicles Available | Male | Female |
| No Vehicle | 160 (2.2%) | 205 (3.4%) |
| 1 Vehicle | 1,270 (17.7%) | 1,123 (18.6%) |
| 2 Vehicles | 2,762 (38.5%) | 2,373 (39.3%) |
| 3 Vehicles | 2,103 (29.3%) | 1,678 (27.8%) |
| 4 Vehicles | 513 (7.1%) | 398 (6.6%) |
| 5 or more Vehicles | 376 (5.2%) | 264 (4.4%) |
| Total | 7,184 (100.0%) | 6,041 (100.0%) |
Commute Time in Oak Ridge
The most frequently occuring commute durations in Oak Ridge are 15 to 19 minutes (1,911 commuters, 16.5%), 10 to 14 minutes (1,865 commuters, 16.1%), and 5 to 9 minutes (1,667 commuters, 14.4%).
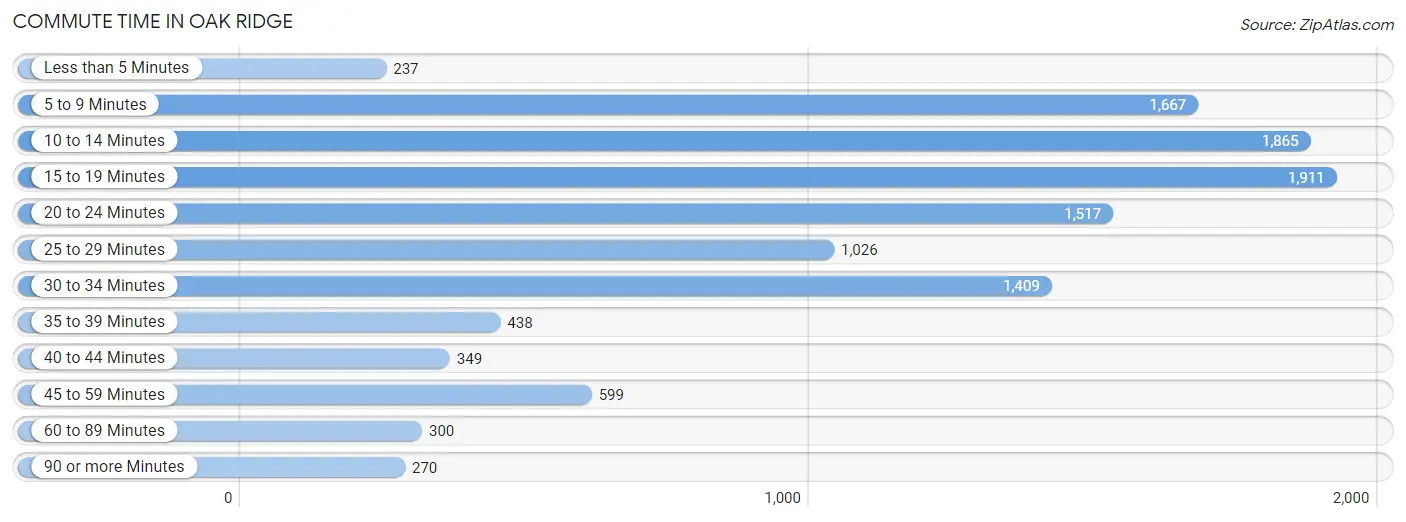
| Commute Time | # Commuters | % Commuters |
| Less than 5 Minutes | 237 | 2.1% |
| 5 to 9 Minutes | 1,667 | 14.4% |
| 10 to 14 Minutes | 1,865 | 16.1% |
| 15 to 19 Minutes | 1,911 | 16.5% |
| 20 to 24 Minutes | 1,517 | 13.1% |
| 25 to 29 Minutes | 1,026 | 8.8% |
| 30 to 34 Minutes | 1,409 | 12.2% |
| 35 to 39 Minutes | 438 | 3.8% |
| 40 to 44 Minutes | 349 | 3.0% |
| 45 to 59 Minutes | 599 | 5.2% |
| 60 to 89 Minutes | 300 | 2.6% |
| 90 or more Minutes | 270 | 2.3% |
Commute Time by Sex in Oak Ridge
The most common commute times in Oak Ridge are 15 to 19 minutes (954 commuters, 14.7%) for males and 15 to 19 minutes (957 commuters, 18.8%) for females.
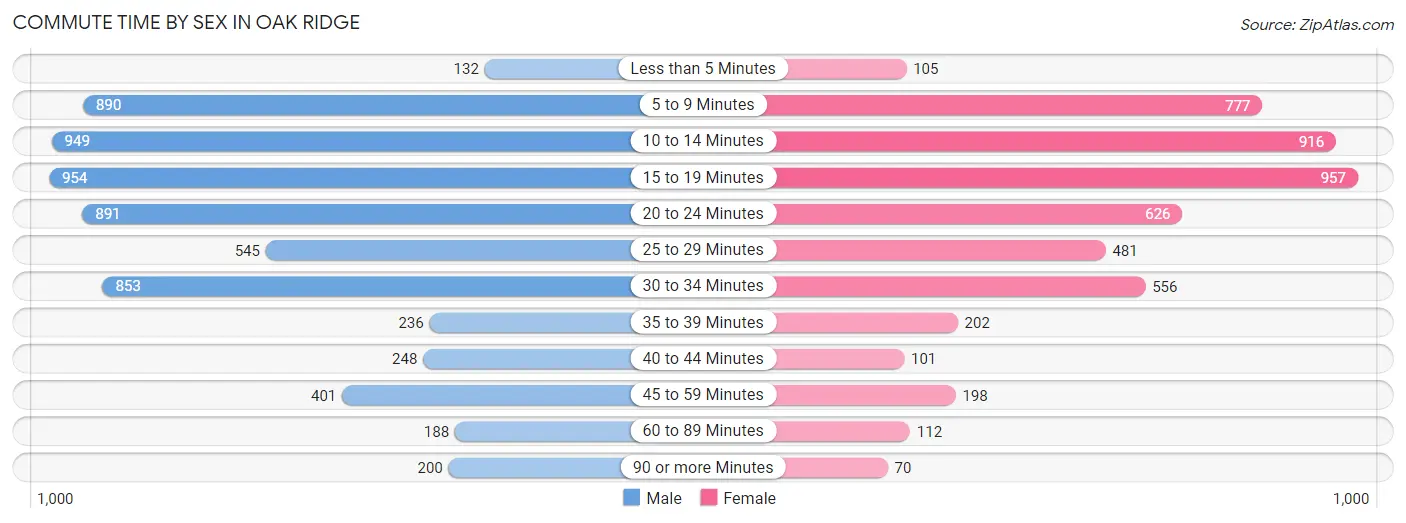
| Commute Time | Male | Female |
| Less than 5 Minutes | 132 (2.0%) | 105 (2.1%) |
| 5 to 9 Minutes | 890 (13.7%) | 777 (15.2%) |
| 10 to 14 Minutes | 949 (14.6%) | 916 (18.0%) |
| 15 to 19 Minutes | 954 (14.7%) | 957 (18.8%) |
| 20 to 24 Minutes | 891 (13.7%) | 626 (12.3%) |
| 25 to 29 Minutes | 545 (8.4%) | 481 (9.4%) |
| 30 to 34 Minutes | 853 (13.2%) | 556 (10.9%) |
| 35 to 39 Minutes | 236 (3.6%) | 202 (4.0%) |
| 40 to 44 Minutes | 248 (3.8%) | 101 (2.0%) |
| 45 to 59 Minutes | 401 (6.2%) | 198 (3.9%) |
| 60 to 89 Minutes | 188 (2.9%) | 112 (2.2%) |
| 90 or more Minutes | 200 (3.1%) | 70 (1.4%) |
Time of Departure to Work by Sex in Oak Ridge
The most frequent times of departure to work in Oak Ridge are 6:00 AM to 6:29 AM (942, 14.5%) for males and 7:00 AM to 7:29 AM (859, 16.8%) for females.
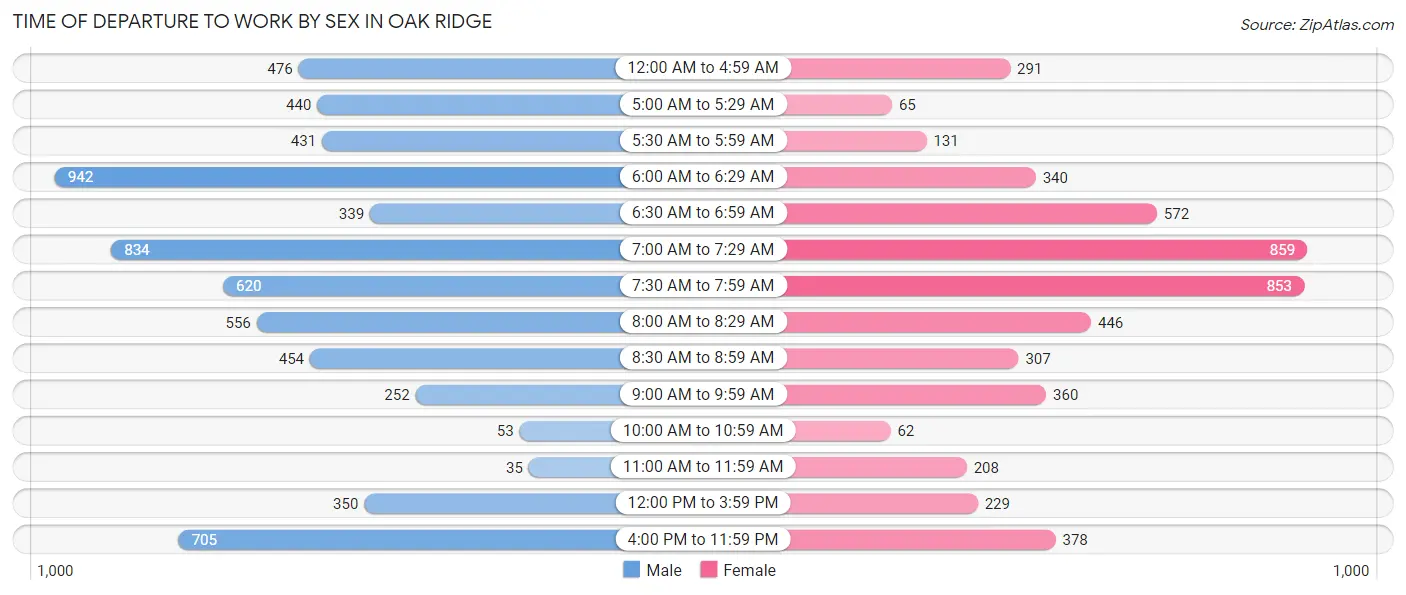
| Time of Departure | Male | Female |
| 12:00 AM to 4:59 AM | 476 (7.3%) | 291 (5.7%) |
| 5:00 AM to 5:29 AM | 440 (6.8%) | 65 (1.3%) |
| 5:30 AM to 5:59 AM | 431 (6.6%) | 131 (2.6%) |
| 6:00 AM to 6:29 AM | 942 (14.5%) | 340 (6.7%) |
| 6:30 AM to 6:59 AM | 339 (5.2%) | 572 (11.2%) |
| 7:00 AM to 7:29 AM | 834 (12.9%) | 859 (16.8%) |
| 7:30 AM to 7:59 AM | 620 (9.6%) | 853 (16.7%) |
| 8:00 AM to 8:29 AM | 556 (8.6%) | 446 (8.7%) |
| 8:30 AM to 8:59 AM | 454 (7.0%) | 307 (6.0%) |
| 9:00 AM to 9:59 AM | 252 (3.9%) | 360 (7.1%) |
| 10:00 AM to 10:59 AM | 53 (0.8%) | 62 (1.2%) |
| 11:00 AM to 11:59 AM | 35 (0.5%) | 208 (4.1%) |
| 12:00 PM to 3:59 PM | 350 (5.4%) | 229 (4.5%) |
| 4:00 PM to 11:59 PM | 705 (10.9%) | 378 (7.4%) |
| Total | 6,487 (100.0%) | 5,101 (100.0%) |
Housing Occupancy in Oak Ridge
Occupancy by Ownership in Oak Ridge
Of the total 13,071 dwellings in Oak Ridge, owner-occupied units account for 8,304 (63.5%), while renter-occupied units make up 4,767 (36.5%).
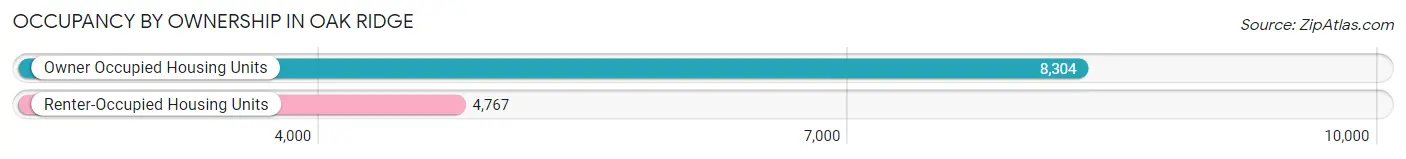
| Occupancy | # Housing Units | % Housing Units |
| Owner Occupied Housing Units | 8,304 | 63.5% |
| Renter-Occupied Housing Units | 4,767 | 36.5% |
| Total Occupied Housing Units | 13,071 | 100.0% |
Occupancy by Household Size in Oak Ridge
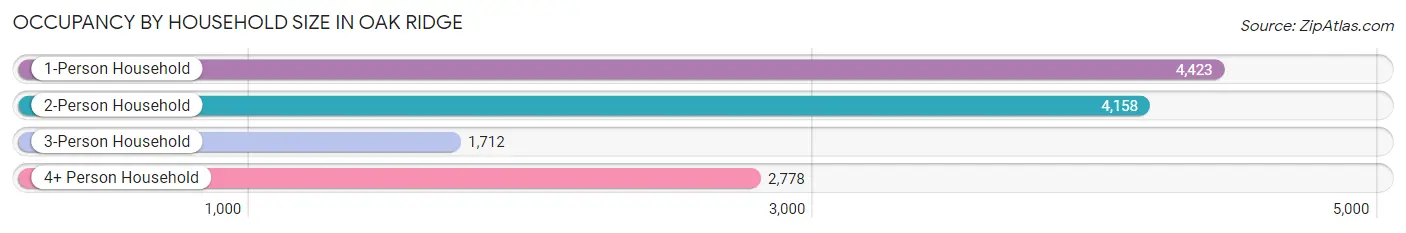
| Household Size | # Housing Units | % Housing Units |
| 1-Person Household | 4,423 | 33.8% |
| 2-Person Household | 4,158 | 31.8% |
| 3-Person Household | 1,712 | 13.1% |
| 4+ Person Household | 2,778 | 21.2% |
| Total Housing Units | 13,071 | 100.0% |
Occupancy by Ownership by Household Size in Oak Ridge
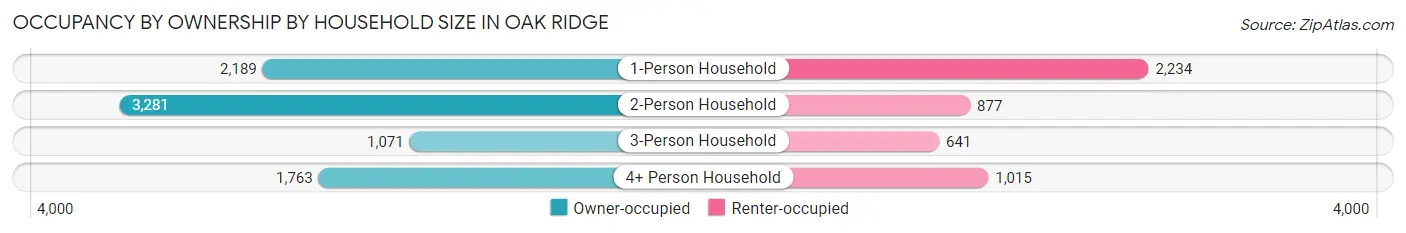
| Household Size | Owner-occupied | Renter-occupied |
| 1-Person Household | 2,189 (49.5%) | 2,234 (50.5%) |
| 2-Person Household | 3,281 (78.9%) | 877 (21.1%) |
| 3-Person Household | 1,071 (62.6%) | 641 (37.4%) |
| 4+ Person Household | 1,763 (63.5%) | 1,015 (36.5%) |
| Total Housing Units | 8,304 (63.5%) | 4,767 (36.5%) |
Occupancy by Educational Attainment in Oak Ridge
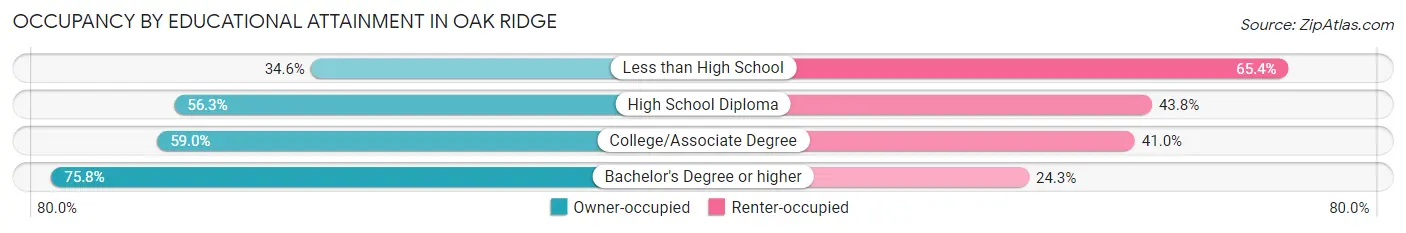
| Household Size | Owner-occupied | Renter-occupied |
| Less than High School | 297 (34.6%) | 561 (65.4%) |
| High School Diploma | 1,390 (56.2%) | 1,081 (43.8%) |
| College/Associate Degree | 2,678 (59.0%) | 1,864 (41.0%) |
| Bachelor's Degree or higher | 3,939 (75.7%) | 1,261 (24.2%) |
Occupancy by Age of Householder in Oak Ridge
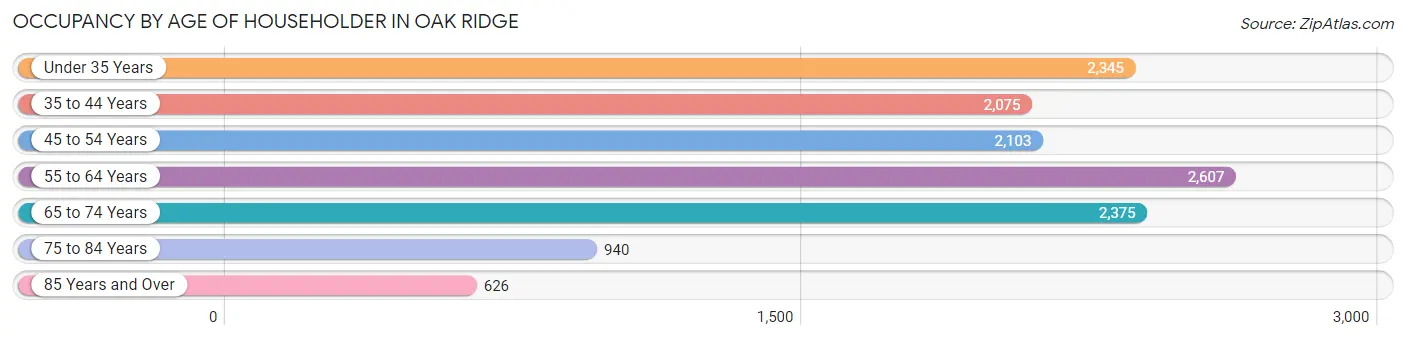
| Age Bracket | # Households | % Households |
| Under 35 Years | 2,345 | 17.9% |
| 35 to 44 Years | 2,075 | 15.9% |
| 45 to 54 Years | 2,103 | 16.1% |
| 55 to 64 Years | 2,607 | 19.9% |
| 65 to 74 Years | 2,375 | 18.2% |
| 75 to 84 Years | 940 | 7.2% |
| 85 Years and Over | 626 | 4.8% |
| Total | 13,071 | 100.0% |
Housing Finances in Oak Ridge
Median Income by Occupancy in Oak Ridge
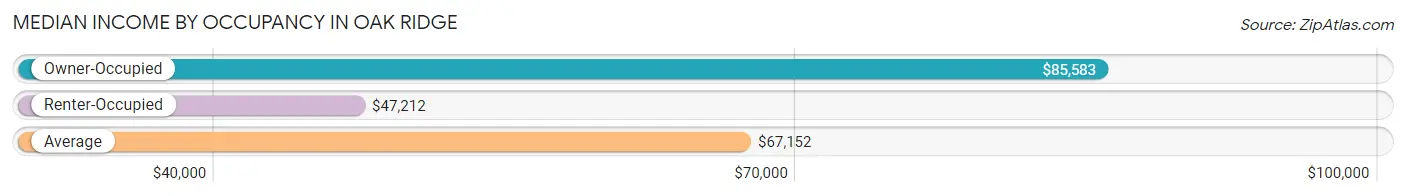
| Occupancy Type | # Households | Median Income |
| Owner-Occupied | 8,304 (63.5%) | $85,583 |
| Renter-Occupied | 4,767 (36.5%) | $47,212 |
| Average | 13,071 (100.0%) | $67,152 |
Occupancy by Householder Income Bracket in Oak Ridge
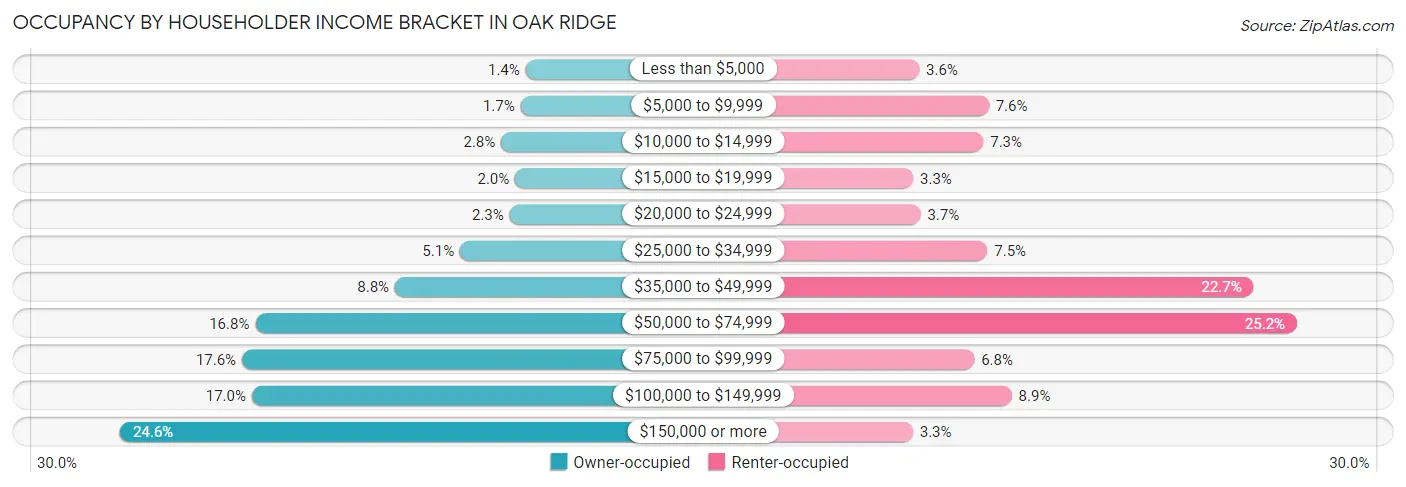
| Income Bracket | Owner-occupied | Renter-occupied |
| Less than $5,000 | 114 (1.4%) | 173 (3.6%) |
| $5,000 to $9,999 | 138 (1.7%) | 363 (7.6%) |
| $10,000 to $14,999 | 230 (2.8%) | 348 (7.3%) |
| $15,000 to $19,999 | 164 (2.0%) | 157 (3.3%) |
| $20,000 to $24,999 | 190 (2.3%) | 177 (3.7%) |
| $25,000 to $34,999 | 425 (5.1%) | 359 (7.5%) |
| $35,000 to $49,999 | 734 (8.8%) | 1,084 (22.7%) |
| $50,000 to $74,999 | 1,397 (16.8%) | 1,202 (25.2%) |
| $75,000 to $99,999 | 1,460 (17.6%) | 323 (6.8%) |
| $100,000 to $149,999 | 1,413 (17.0%) | 425 (8.9%) |
| $150,000 or more | 2,039 (24.5%) | 156 (3.3%) |
| Total | 8,304 (100.0%) | 4,767 (100.0%) |
Monthly Housing Cost Tiers in Oak Ridge
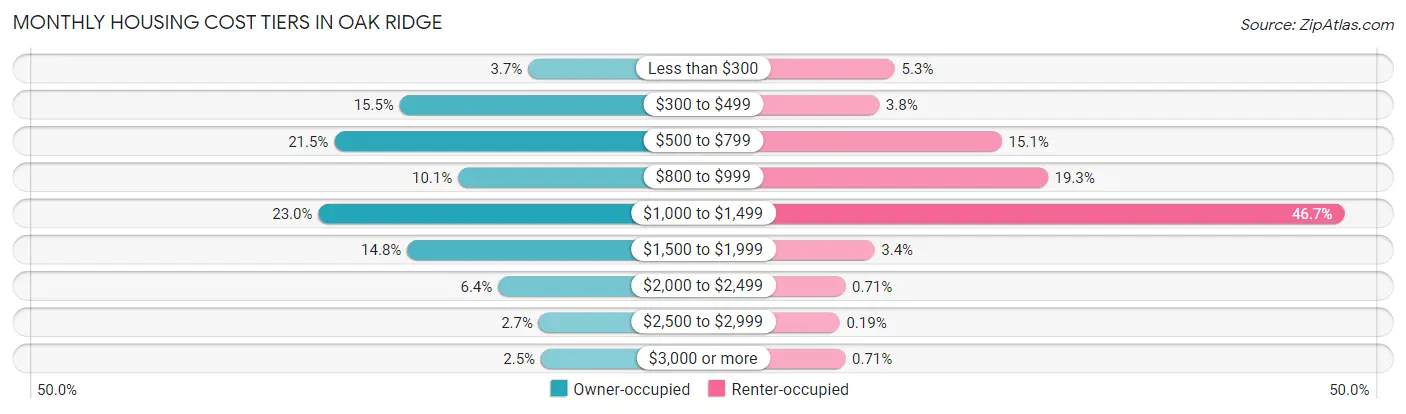
| Monthly Cost | Owner-occupied | Renter-occupied |
| Less than $300 | 303 (3.6%) | 251 (5.3%) |
| $300 to $499 | 1,285 (15.5%) | 182 (3.8%) |
| $500 to $799 | 1,785 (21.5%) | 721 (15.1%) |
| $800 to $999 | 839 (10.1%) | 922 (19.3%) |
| $1,000 to $1,499 | 1,907 (23.0%) | 2,224 (46.7%) |
| $1,500 to $1,999 | 1,227 (14.8%) | 162 (3.4%) |
| $2,000 to $2,499 | 532 (6.4%) | 34 (0.7%) |
| $2,500 to $2,999 | 221 (2.7%) | 9 (0.2%) |
| $3,000 or more | 205 (2.5%) | 34 (0.7%) |
| Total | 8,304 (100.0%) | 4,767 (100.0%) |
Physical Housing Characteristics in Oak Ridge
Housing Structures in Oak Ridge
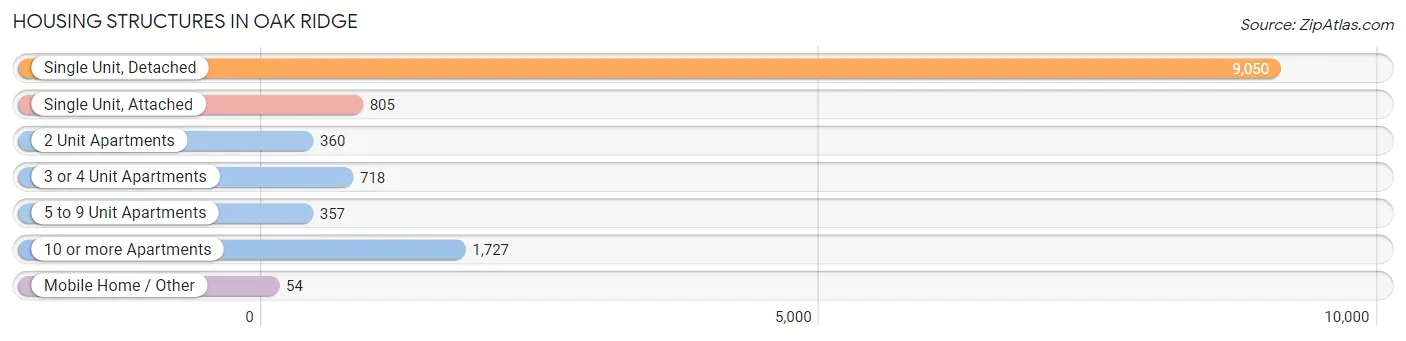
| Structure Type | # Housing Units | % Housing Units |
| Single Unit, Detached | 9,050 | 69.2% |
| Single Unit, Attached | 805 | 6.2% |
| 2 Unit Apartments | 360 | 2.8% |
| 3 or 4 Unit Apartments | 718 | 5.5% |
| 5 to 9 Unit Apartments | 357 | 2.7% |
| 10 or more Apartments | 1,727 | 13.2% |
| Mobile Home / Other | 54 | 0.4% |
| Total | 13,071 | 100.0% |
Housing Structures by Occupancy in Oak Ridge
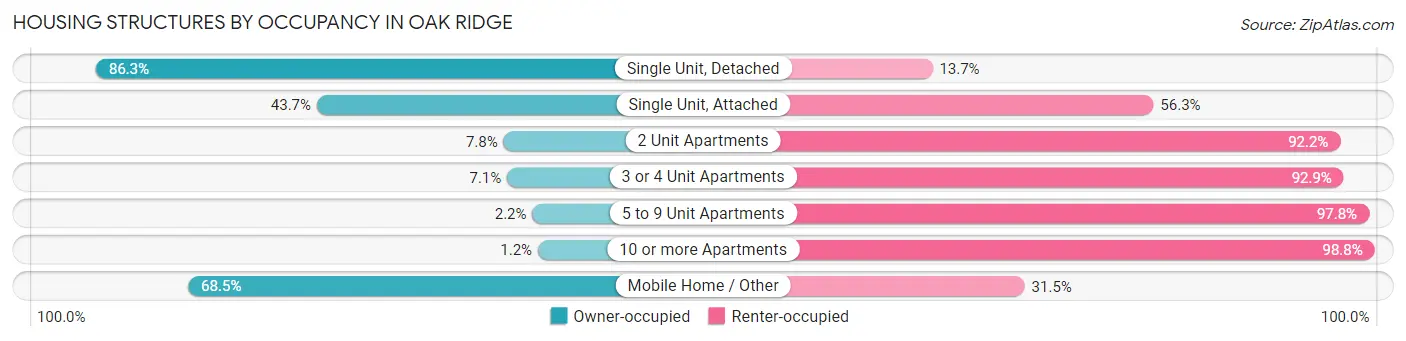
| Structure Type | Owner-occupied | Renter-occupied |
| Single Unit, Detached | 7,808 (86.3%) | 1,242 (13.7%) |
| Single Unit, Attached | 352 (43.7%) | 453 (56.3%) |
| 2 Unit Apartments | 28 (7.8%) | 332 (92.2%) |
| 3 or 4 Unit Apartments | 51 (7.1%) | 667 (92.9%) |
| 5 to 9 Unit Apartments | 8 (2.2%) | 349 (97.8%) |
| 10 or more Apartments | 20 (1.2%) | 1,707 (98.8%) |
| Mobile Home / Other | 37 (68.5%) | 17 (31.5%) |
| Total | 8,304 (63.5%) | 4,767 (36.5%) |
Housing Structures by Number of Rooms in Oak Ridge
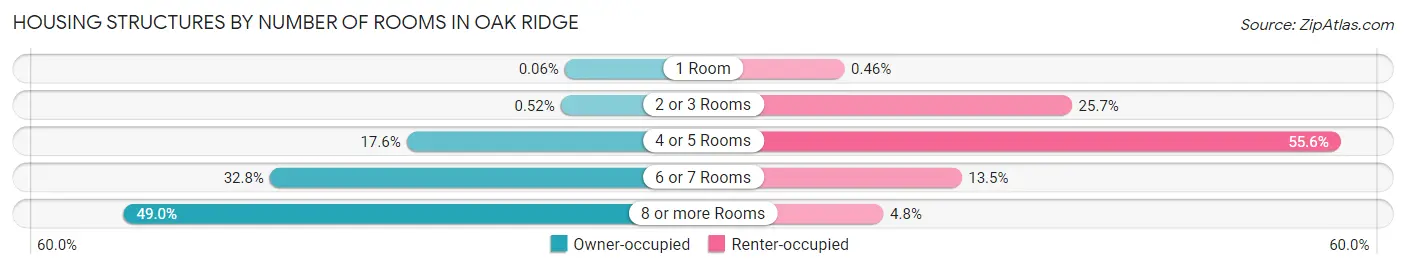
| Number of Rooms | Owner-occupied | Renter-occupied |
| 1 Room | 5 (0.1%) | 22 (0.5%) |
| 2 or 3 Rooms | 43 (0.5%) | 1,226 (25.7%) |
| 4 or 5 Rooms | 1,463 (17.6%) | 2,648 (55.5%) |
| 6 or 7 Rooms | 2,724 (32.8%) | 642 (13.5%) |
| 8 or more Rooms | 4,069 (49.0%) | 229 (4.8%) |
| Total | 8,304 (100.0%) | 4,767 (100.0%) |
Housing Structure by Heating Type in Oak Ridge
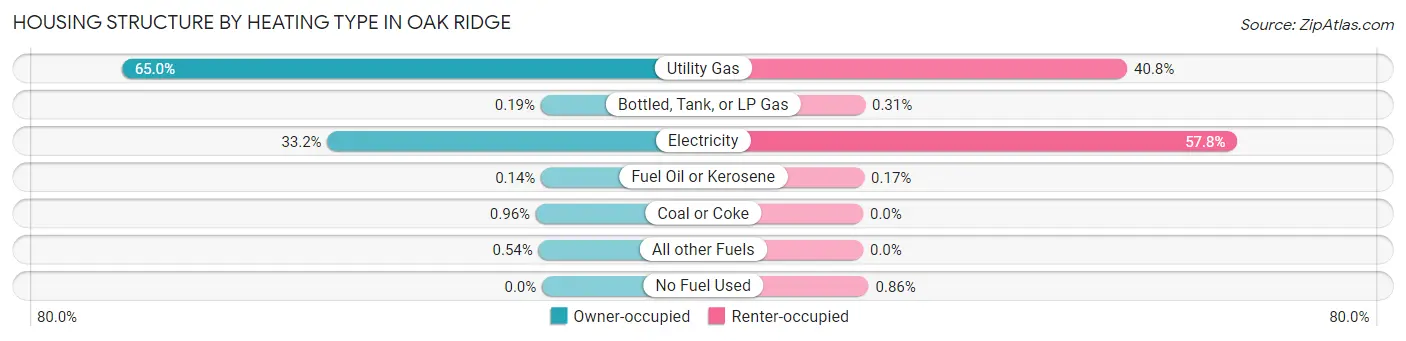
| Heating Type | Owner-occupied | Renter-occupied |
| Utility Gas | 5,396 (65.0%) | 1,946 (40.8%) |
| Bottled, Tank, or LP Gas | 16 (0.2%) | 15 (0.3%) |
| Electricity | 2,755 (33.2%) | 2,757 (57.8%) |
| Fuel Oil or Kerosene | 12 (0.1%) | 8 (0.2%) |
| Coal or Coke | 80 (1.0%) | 0 (0.0%) |
| All other Fuels | 45 (0.5%) | 0 (0.0%) |
| No Fuel Used | 0 (0.0%) | 41 (0.9%) |
| Total | 8,304 (100.0%) | 4,767 (100.0%) |
Household Vehicle Usage in Oak Ridge
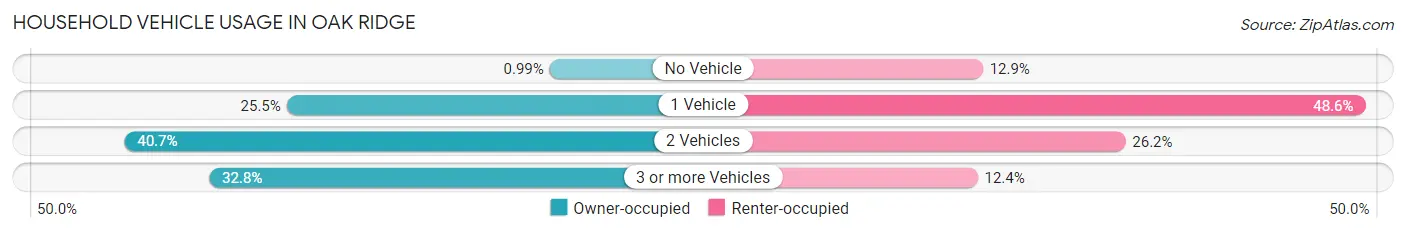
| Vehicles per Household | Owner-occupied | Renter-occupied |
| No Vehicle | 82 (1.0%) | 613 (12.9%) |
| 1 Vehicle | 2,121 (25.5%) | 2,316 (48.6%) |
| 2 Vehicles | 3,379 (40.7%) | 1,248 (26.2%) |
| 3 or more Vehicles | 2,722 (32.8%) | 590 (12.4%) |
| Total | 8,304 (100.0%) | 4,767 (100.0%) |
Real Estate & Mortgages in Oak Ridge
Real Estate and Mortgage Overview in Oak Ridge
| Characteristic | Without Mortgage | With Mortgage |
| Housing Units | 3,758 | 4,546 |
| Median Property Value | $202,600 | $220,400 |
| Median Household Income | $75,609 | $1,286 |
| Monthly Housing Costs | $542 | $205 |
| Real Estate Taxes | $1,964 | $76 |
Property Value by Mortgage Status in Oak Ridge
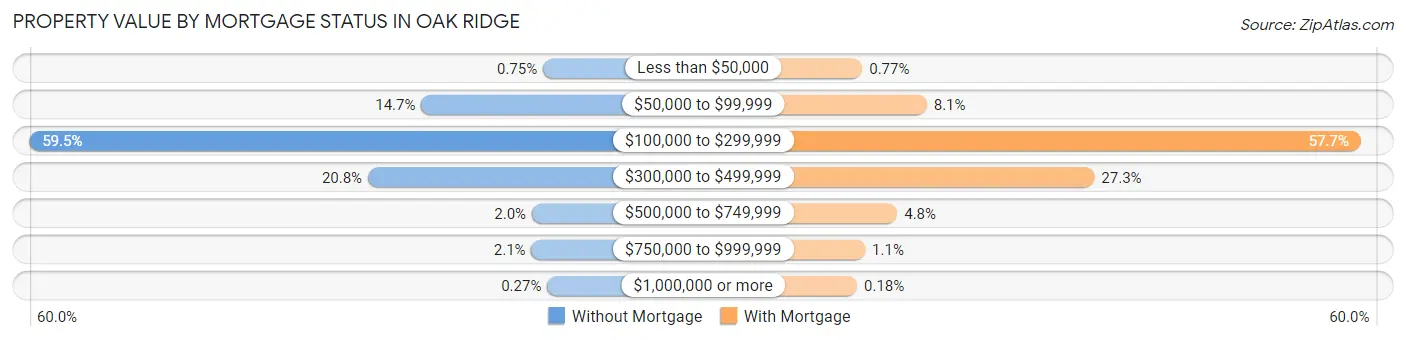
| Property Value | Without Mortgage | With Mortgage |
| Less than $50,000 | 28 (0.7%) | 35 (0.8%) |
| $50,000 to $99,999 | 551 (14.7%) | 370 (8.1%) |
| $100,000 to $299,999 | 2,235 (59.5%) | 2,625 (57.7%) |
| $300,000 to $499,999 | 780 (20.8%) | 1,241 (27.3%) |
| $500,000 to $749,999 | 76 (2.0%) | 217 (4.8%) |
| $750,000 to $999,999 | 78 (2.1%) | 50 (1.1%) |
| $1,000,000 or more | 10 (0.3%) | 8 (0.2%) |
| Total | 3,758 (100.0%) | 4,546 (100.0%) |
Household Income by Mortgage Status in Oak Ridge
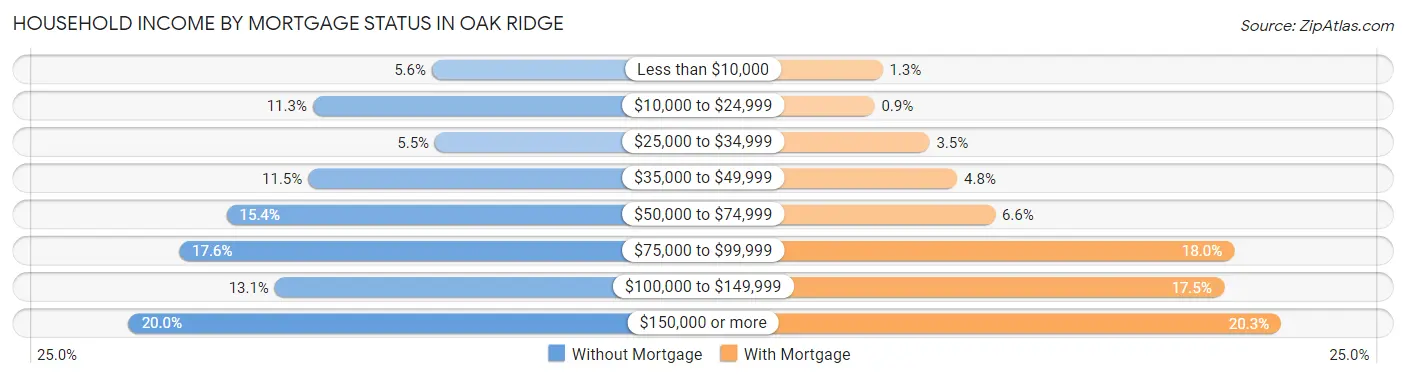
| Household Income | Without Mortgage | With Mortgage |
| Less than $10,000 | 211 (5.6%) | 58 (1.3%) |
| $10,000 to $24,999 | 424 (11.3%) | 41 (0.9%) |
| $25,000 to $34,999 | 205 (5.5%) | 160 (3.5%) |
| $35,000 to $49,999 | 432 (11.5%) | 220 (4.8%) |
| $50,000 to $74,999 | 578 (15.4%) | 302 (6.6%) |
| $75,000 to $99,999 | 663 (17.6%) | 819 (18.0%) |
| $100,000 to $149,999 | 492 (13.1%) | 797 (17.5%) |
| $150,000 or more | 753 (20.0%) | 921 (20.3%) |
| Total | 3,758 (100.0%) | 4,546 (100.0%) |
Property Value to Household Income Ratio in Oak Ridge
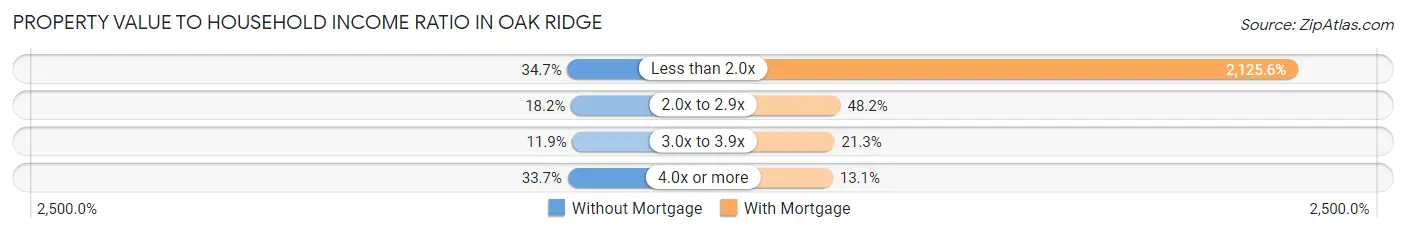
| Value-to-Income Ratio | Without Mortgage | With Mortgage |
| Less than 2.0x | 1,304 (34.7%) | 96,630 (2,125.6%) |
| 2.0x to 2.9x | 683 (18.2%) | 2,189 (48.1%) |
| 3.0x to 3.9x | 446 (11.9%) | 967 (21.3%) |
| 4.0x or more | 1,268 (33.7%) | 595 (13.1%) |
| Total | 3,758 (100.0%) | 4,546 (100.0%) |
Real Estate Taxes by Mortgage Status in Oak Ridge

| Property Taxes | Without Mortgage | With Mortgage |
| Less than $800 | 445 (11.8%) | 0 (0.0%) |
| $800 to $1,499 | 790 (21.0%) | 438 (9.6%) |
| $800 to $1,499 | 2,402 (63.9%) | 1,337 (29.4%) |
| Total | 3,758 (100.0%) | 4,546 (100.0%) |
Health & Disability in Oak Ridge
Health Insurance Coverage by Age in Oak Ridge
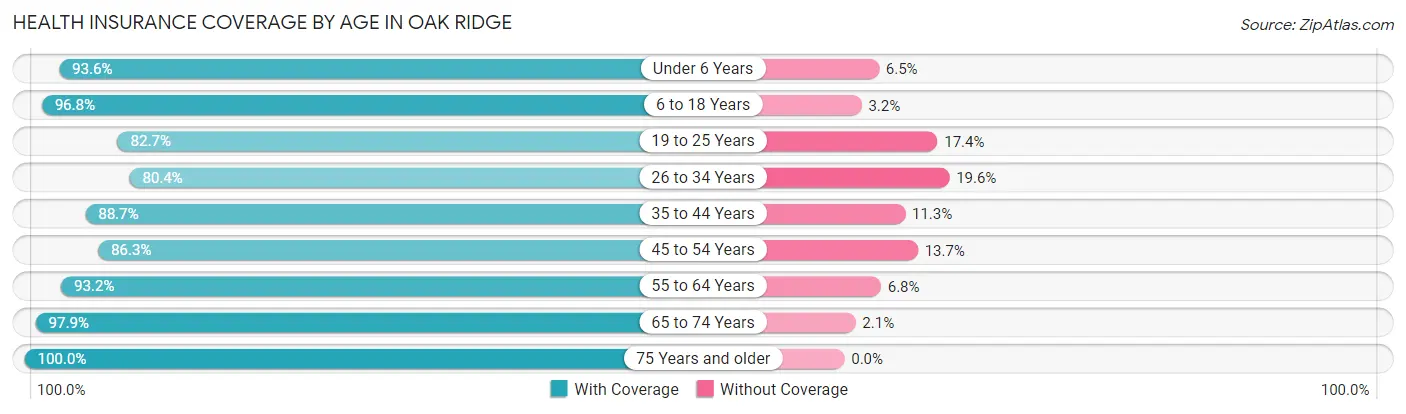
| Age Bracket | With Coverage | Without Coverage |
| Under 6 Years | 1,725 (93.5%) | 119 (6.5%) |
| 6 to 18 Years | 5,874 (96.8%) | 194 (3.2%) |
| 19 to 25 Years | 1,886 (82.7%) | 396 (17.3%) |
| 26 to 34 Years | 2,846 (80.4%) | 692 (19.6%) |
| 35 to 44 Years | 3,320 (88.7%) | 424 (11.3%) |
| 45 to 54 Years | 3,353 (86.3%) | 532 (13.7%) |
| 55 to 64 Years | 3,902 (93.2%) | 285 (6.8%) |
| 65 to 74 Years | 3,447 (97.9%) | 73 (2.1%) |
| 75 Years and older | 2,138 (100.0%) | 0 (0.0%) |
| Total | 28,491 (91.3%) | 2,715 (8.7%) |
Health Insurance Coverage by Citizenship Status in Oak Ridge
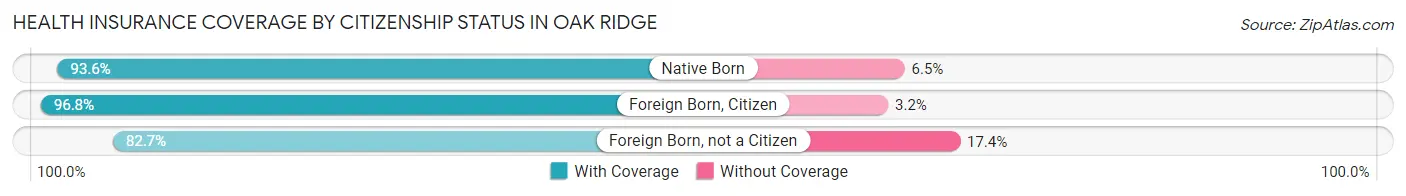
| Citizenship Status | With Coverage | Without Coverage |
| Native Born | 1,725 (93.5%) | 119 (6.5%) |
| Foreign Born, Citizen | 5,874 (96.8%) | 194 (3.2%) |
| Foreign Born, not a Citizen | 1,886 (82.7%) | 396 (17.3%) |
Health Insurance Coverage by Household Income in Oak Ridge
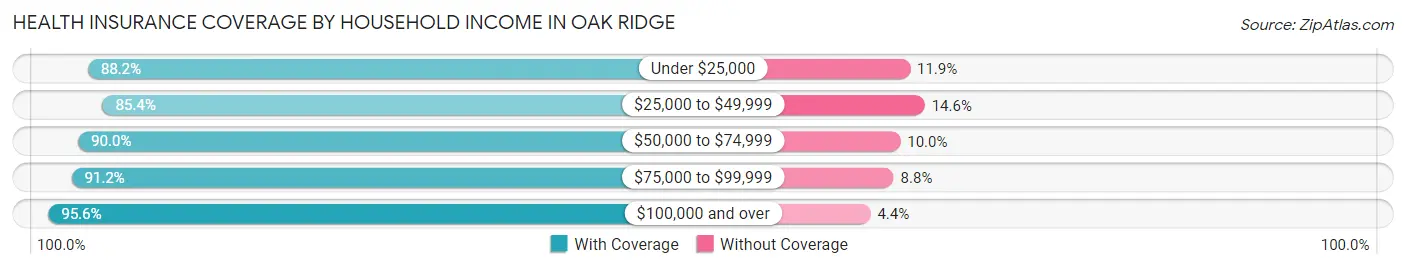
| Household Income | With Coverage | Without Coverage |
| Under $25,000 | 2,902 (88.1%) | 390 (11.8%) |
| $25,000 to $49,999 | 4,698 (85.4%) | 803 (14.6%) |
| $50,000 to $74,999 | 5,403 (90.0%) | 602 (10.0%) |
| $75,000 to $99,999 | 4,156 (91.2%) | 400 (8.8%) |
| $100,000 and over | 11,182 (95.6%) | 520 (4.4%) |
Public vs Private Health Insurance Coverage by Age in Oak Ridge
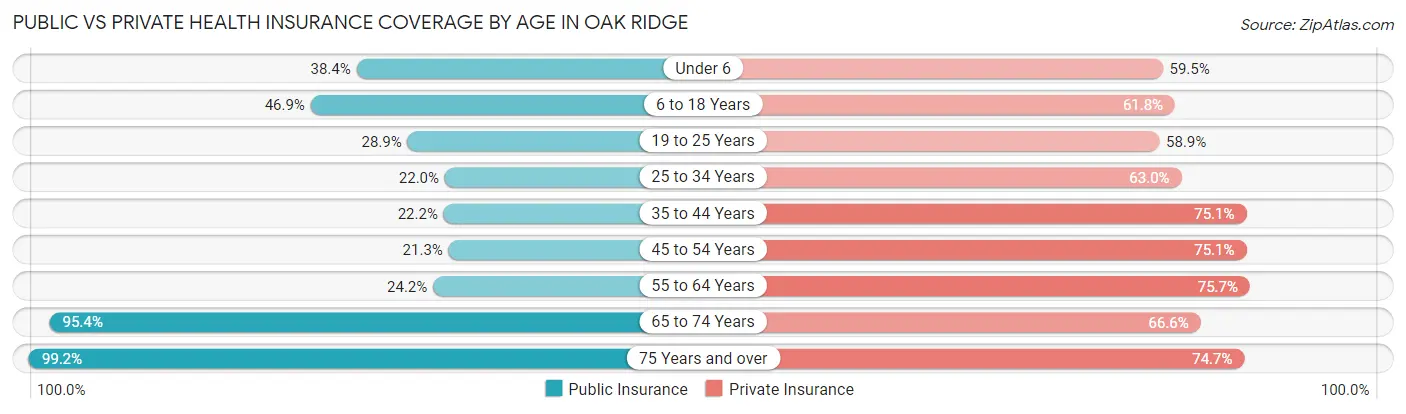
| Age Bracket | Public Insurance | Private Insurance |
| Under 6 | 708 (38.4%) | 1,098 (59.5%) |
| 6 to 18 Years | 2,846 (46.9%) | 3,752 (61.8%) |
| 19 to 25 Years | 660 (28.9%) | 1,344 (58.9%) |
| 25 to 34 Years | 778 (22.0%) | 2,230 (63.0%) |
| 35 to 44 Years | 831 (22.2%) | 2,811 (75.1%) |
| 45 to 54 Years | 827 (21.3%) | 2,917 (75.1%) |
| 55 to 64 Years | 1,012 (24.2%) | 3,171 (75.7%) |
| 65 to 74 Years | 3,357 (95.4%) | 2,344 (66.6%) |
| 75 Years and over | 2,121 (99.2%) | 1,597 (74.7%) |
| Total | 13,140 (42.1%) | 21,264 (68.1%) |
Disability Status by Sex by Age in Oak Ridge
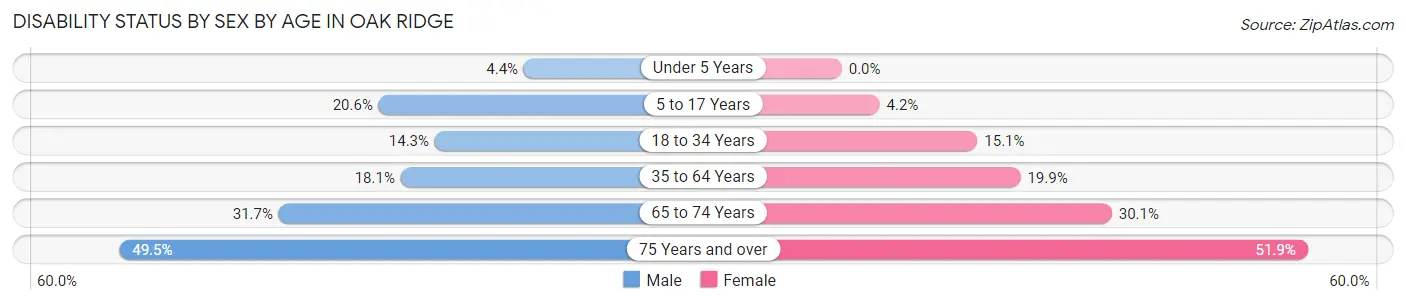
| Age Bracket | Male | Female |
| Under 5 Years | 34 (4.4%) | 0 (0.0%) |
| 5 to 17 Years | 627 (20.6%) | 132 (4.2%) |
| 18 to 34 Years | 476 (14.3%) | 414 (15.1%) |
| 35 to 64 Years | 1,000 (18.1%) | 1,252 (19.9%) |
| 65 to 74 Years | 500 (31.7%) | 584 (30.1%) |
| 75 Years and over | 453 (49.4%) | 634 (51.9%) |
Disability Class by Sex by Age in Oak Ridge
Disability Class: Hearing Difficulty
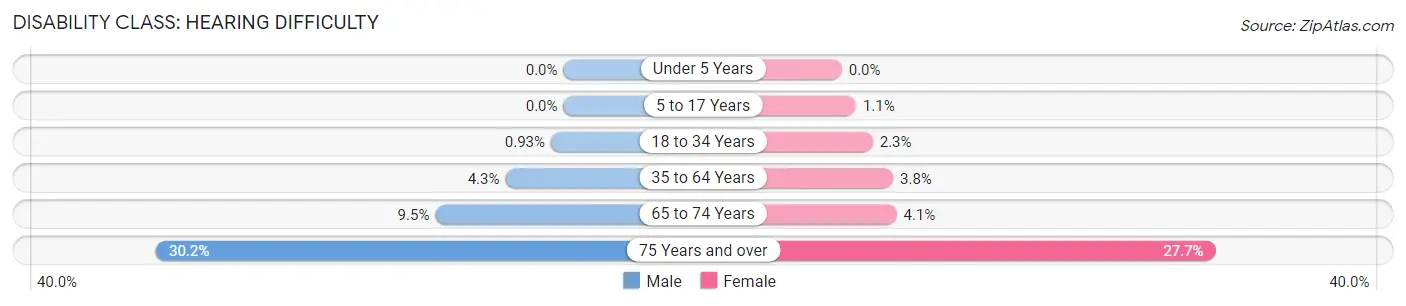
| Age Bracket | Male | Female |
| Under 5 Years | 0 (0.0%) | 0 (0.0%) |
| 5 to 17 Years | 0 (0.0%) | 33 (1.1%) |
| 18 to 34 Years | 31 (0.9%) | 63 (2.3%) |
| 35 to 64 Years | 238 (4.3%) | 240 (3.8%) |
| 65 to 74 Years | 150 (9.5%) | 79 (4.1%) |
| 75 Years and over | 277 (30.2%) | 339 (27.7%) |
Disability Class: Vision Difficulty
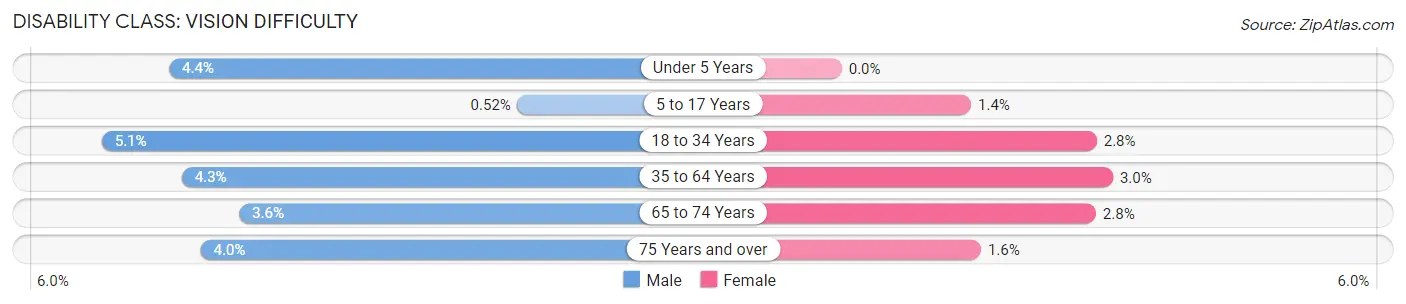
| Age Bracket | Male | Female |
| Under 5 Years | 34 (4.4%) | 0 (0.0%) |
| 5 to 17 Years | 16 (0.5%) | 45 (1.4%) |
| 18 to 34 Years | 171 (5.1%) | 78 (2.8%) |
| 35 to 64 Years | 235 (4.3%) | 190 (3.0%) |
| 65 to 74 Years | 57 (3.6%) | 55 (2.8%) |
| 75 Years and over | 37 (4.0%) | 19 (1.5%) |
Disability Class: Cognitive Difficulty
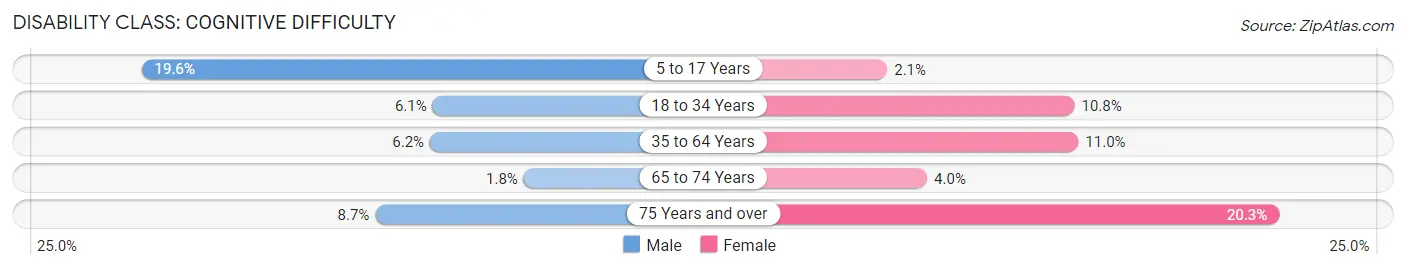
| Age Bracket | Male | Female |
| 5 to 17 Years | 597 (19.6%) | 66 (2.1%) |
| 18 to 34 Years | 202 (6.1%) | 296 (10.8%) |
| 35 to 64 Years | 342 (6.2%) | 691 (11.0%) |
| 65 to 74 Years | 29 (1.8%) | 77 (4.0%) |
| 75 Years and over | 80 (8.7%) | 248 (20.3%) |
Disability Class: Ambulatory Difficulty
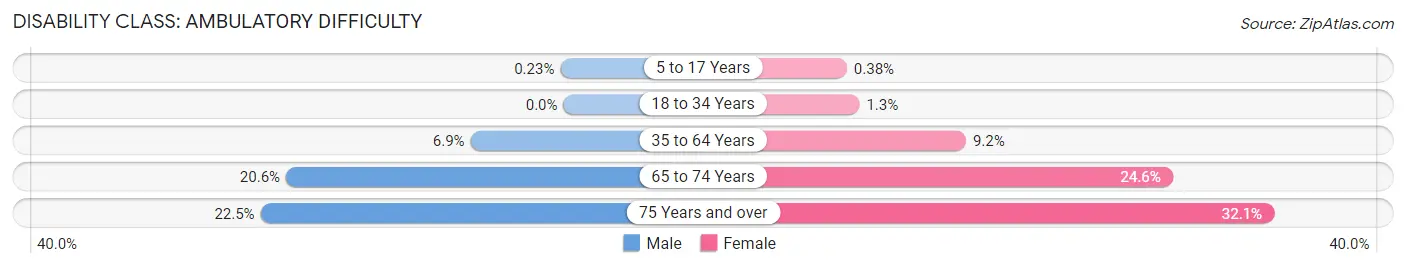
| Age Bracket | Male | Female |
| 5 to 17 Years | 7 (0.2%) | 12 (0.4%) |
| 18 to 34 Years | 0 (0.0%) | 36 (1.3%) |
| 35 to 64 Years | 381 (6.9%) | 580 (9.2%) |
| 65 to 74 Years | 325 (20.6%) | 477 (24.6%) |
| 75 Years and over | 206 (22.5%) | 392 (32.1%) |
Disability Class: Self-Care Difficulty
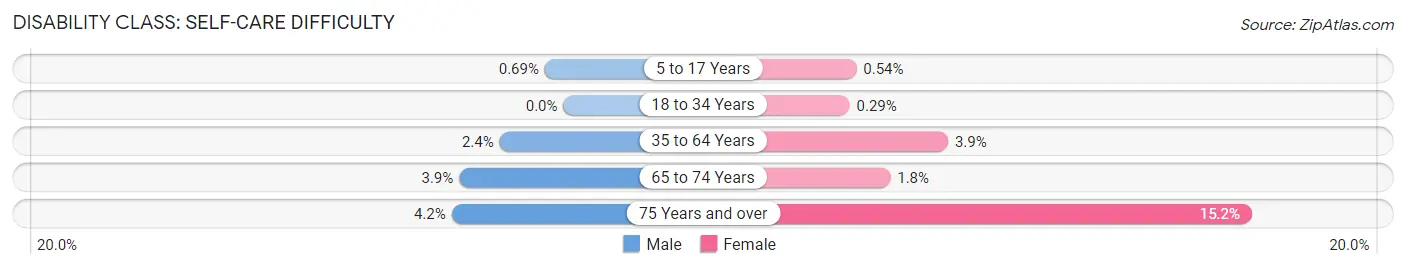
| Age Bracket | Male | Female |
| 5 to 17 Years | 21 (0.7%) | 17 (0.5%) |
| 18 to 34 Years | 0 (0.0%) | 8 (0.3%) |
| 35 to 64 Years | 131 (2.4%) | 248 (3.9%) |
| 65 to 74 Years | 61 (3.9%) | 35 (1.8%) |
| 75 Years and over | 38 (4.2%) | 186 (15.2%) |
Technology Access in Oak Ridge
Computing Device Access in Oak Ridge
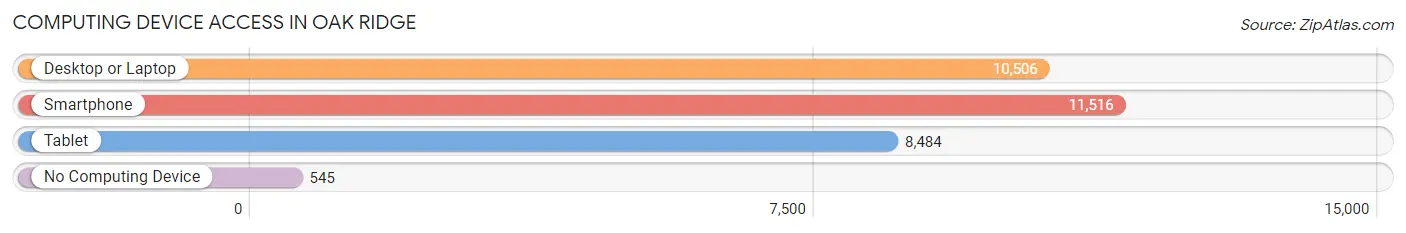
| Device Type | # Households | % Households |
| Desktop or Laptop | 10,506 | 80.4% |
| Smartphone | 11,516 | 88.1% |
| Tablet | 8,484 | 64.9% |
| No Computing Device | 545 | 4.2% |
| Total | 13,071 | 100.0% |
Internet Access in Oak Ridge
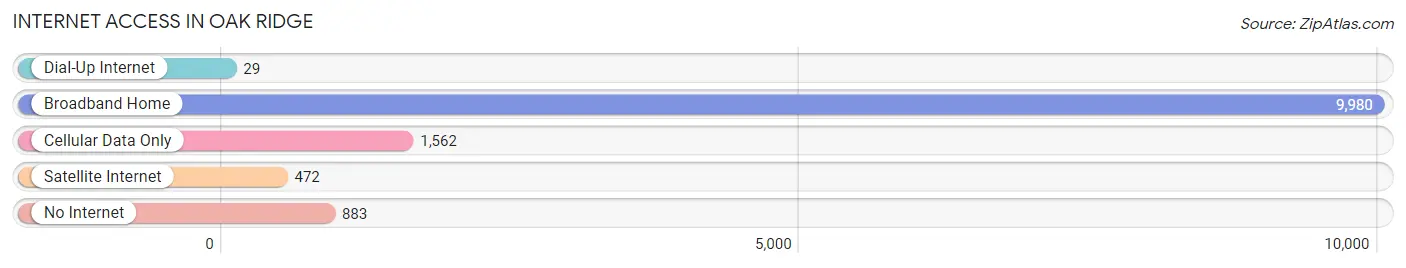
| Internet Type | # Households | % Households |
| Dial-Up Internet | 29 | 0.2% |
| Broadband Home | 9,980 | 76.3% |
| Cellular Data Only | 1,562 | 11.9% |
| Satellite Internet | 472 | 3.6% |
| No Internet | 883 | 6.8% |
| Total | 13,071 | 100.0% |
Oak Ridge Summary
Oak Ridge, Tennessee is a city located in Anderson and Roane counties in the eastern part of the state. It is part of the Knoxville metropolitan area and is located about 25 miles west of Knoxville. The city was established in 1942 as part of the Manhattan Project, a top-secret U.S. government program to develop the atomic bomb. The city was built to house the workers and their families who were involved in the project. Today, Oak Ridge is a vibrant city with a population of about 29,000 people.
Geography
Oak Ridge is located in the Appalachian Mountains in eastern Tennessee. The city is situated in a valley between two ridges, the Cumberland Plateau to the west and the Great Smoky Mountains to the east. The city is located at the confluence of the Clinch and Tennessee Rivers. The city is surrounded by several lakes, including Melton Hill Lake, Watts Bar Lake, and Fort Loudoun Lake. The city is also home to several parks, including Haw Ridge Park, which offers hiking and biking trails, and the Oak Ridge Greenway, which is a paved trail that runs through the city.
Economy
Oak Ridge is home to several major employers, including the Oak Ridge National Laboratory, the Y-12 National Security Complex, and the East Tennessee Technology Park. The city is also home to several smaller businesses, including manufacturing, retail, and service industries. The city is also home to several educational institutions, including the University of Tennessee, Roane State Community College, and the Oak Ridge Institute of Technology.
Demographics
As of the 2010 census, Oak Ridge had a population of 29,330 people. The racial makeup of the city was 87.3% White, 8.2% African American, 0.3% Native American, 1.7% Asian, 0.1% Pacific Islander, 0.7% from other races, and 1.9% from two or more races. Hispanic or Latino of any race were 2.3% of the population.
The median income for a household in the city was $50,945, and the median income for a family was $62,917. The per capita income for the city was $27,845. About 8.2% of families and 10.7% of the population were below the poverty line, including 15.2% of those under age 18 and 8.2% of those age 65 or over.
Conclusion
Oak Ridge, Tennessee is a vibrant city with a rich history and a diverse population. The city is home to several major employers, including the Oak Ridge National Laboratory, the Y-12 National Security Complex, and the East Tennessee Technology Park. The city is also home to several educational institutions, including the University of Tennessee, Roane State Community College, and the Oak Ridge Institute of Technology. The city has a median income of $50,945 and a per capita income of $27,845. Oak Ridge is a great place to live, work, and play.
Common Questions
What is the Total Population of Oak Ridge?
Total Population of Oak Ridge is 31,535.
What is the Total Male Population of Oak Ridge?
Total Male Population of Oak Ridge is 15,267.
What is the Total Female Population of Oak Ridge?
Total Female Population of Oak Ridge is 16,268.
What is the Ratio of Males per 100 Females in Oak Ridge?
There are 93.85 Males per 100 Females in Oak Ridge.
What is the Ratio of Females per 100 Males in Oak Ridge?
There are 106.56 Females per 100 Males in Oak Ridge.
What is the Median Population Age in Oak Ridge?
Median Population Age in Oak Ridge is 39.9 Years.
What is the Average Family Size in Oak Ridge
Average Family Size in Oak Ridge is 3.0 People.
What is the Average Household Size in Oak Ridge
Average Household Size in Oak Ridge is 2.4 People.
What is Per Capita Income in Oak Ridge?
Per Capita income in Oak Ridge is $36,915.
What is the Median Family Income in Oak Ridge?
Median Family Income in Oak Ridge is $81,784.
What is the Median Household income in Oak Ridge?
Median Household Income in Oak Ridge is $67,152.
What is Income or Wage Gap in Oak Ridge?
Income or Wage Gap in Oak Ridge is 37.7%.
Women in Oak Ridge earn 62.3 cents for every dollar earned by a man.
What is Family Income Deficit in Oak Ridge?
Family Income Deficit in Oak Ridge is $9,773.
Families that are below poverty line in Oak Ridge earn $9,773 less on average than the poverty threshold level.
What is Inequality or Gini Index in Oak Ridge?
Inequality or Gini Index in Oak Ridge is 0.43.
How Large is the Labor Force in Oak Ridge?
There are 14,177 People in the Labor Forcein in Oak Ridge.
What is the Percentage of People in the Labor Force in Oak Ridge?
56.8% of People are in the Labor Force in Oak Ridge.
What is the Unemployment Rate in Oak Ridge?
Unemployment Rate in Oak Ridge is 5.6%.