Ridgetop, TN
Ridgetop Map
Ridgetop Overview
2,376
TOTAL POPULATION
1,060
MALE POPULATION
1,316
FEMALE POPULATION
80.55
MALES / 100 FEMALES
124.15
FEMALES / 100 MALES
38.0
MEDIAN AGE
3.3
AVG FAMILY SIZE
2.7
AVG HOUSEHOLD SIZE
$37,893
PER CAPITA INCOME
$76,413
AVG FAMILY INCOME
$66,964
AVG HOUSEHOLD INCOME
44.3%
WAGE / INCOME GAP [ % ]
55.7¢/ $1
WAGE / INCOME GAP [ $ ]
0.43
INEQUALITY / GINI INDEX
1,077
LABOR FORCE [ PEOPLE ]
62.1%
PERCENT IN LABOR FORCE
5.8%
UNEMPLOYMENT RATE
Ridgetop Area Codes
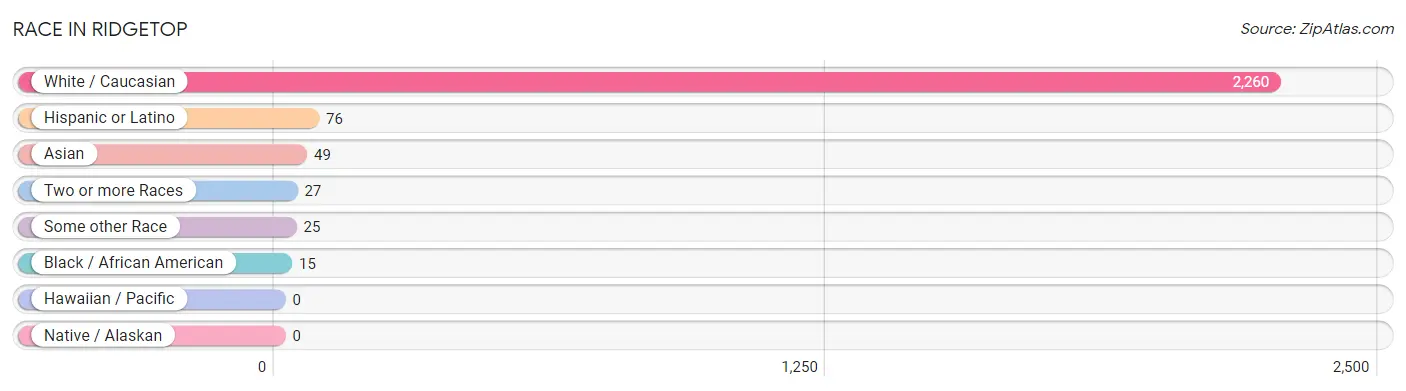
Race in Ridgetop
The most populous races in Ridgetop are White / Caucasian (2,260 | 95.1%), Hispanic or Latino (76 | 3.2%), and Asian (49 | 2.1%).
| Race | # Population | % Population |
| Asian | 49 | 2.1% |
| Black / African American | 15 | 0.6% |
| Hawaiian / Pacific | 0 | 0.0% |
| Hispanic or Latino | 76 | 3.2% |
| Native / Alaskan | 0 | 0.0% |
| White / Caucasian | 2,260 | 95.1% |
| Two or more Races | 27 | 1.1% |
| Some other Race | 25 | 1.1% |
| Total | 2,376 | 100.0% |
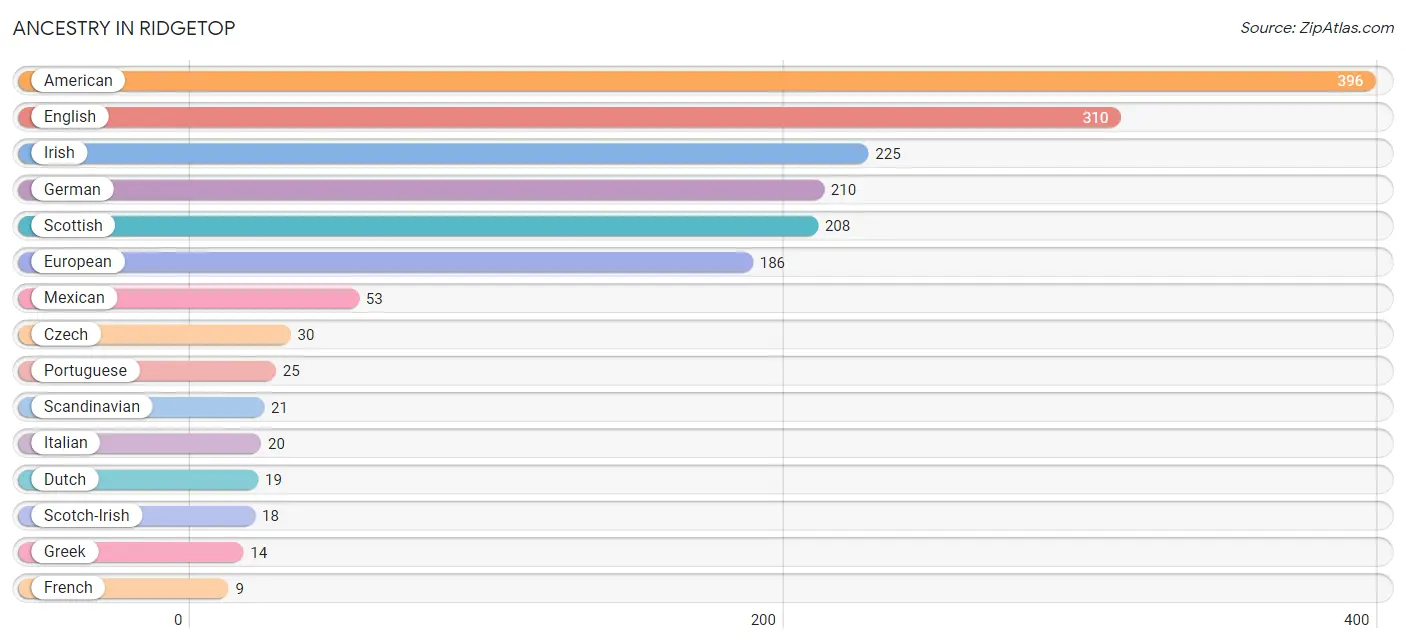
Ancestry in Ridgetop
The most populous ancestries reported in Ridgetop are American (396 | 16.7%), English (310 | 13.1%), Irish (225 | 9.5%), German (210 | 8.8%), and Scottish (208 | 8.7%), together accounting for 56.8% of all Ridgetop residents.
| Ancestry | # Population | % Population |
| American | 396 | 16.7% |
| Arab | 6 | 0.3% |
| Brazilian | 7 | 0.3% |
| British | 5 | 0.2% |
| Burmese | 5 | 0.2% |
| Cherokee | 4 | 0.2% |
| Colombian | 7 | 0.3% |
| Czech | 30 | 1.3% |
| Danish | 7 | 0.3% |
| Dutch | 19 | 0.8% |
| English | 310 | 13.1% |
| European | 186 | 7.8% |
| French | 9 | 0.4% |
| French Canadian | 7 | 0.3% |
| German | 210 | 8.8% |
| Greek | 14 | 0.6% |
| Iranian | 9 | 0.4% |
| Irish | 225 | 9.5% |
| Italian | 20 | 0.8% |
| Jordanian | 6 | 0.3% |
| Korean | 7 | 0.3% |
| Mexican | 53 | 2.2% |
| Native Hawaiian | 5 | 0.2% |
| Northern European | 6 | 0.3% |
| Norwegian | 6 | 0.3% |
| Portuguese | 25 | 1.1% |
| Puerto Rican | 7 | 0.3% |
| Scandinavian | 21 | 0.9% |
| Scotch-Irish | 18 | 0.8% |
| Scottish | 208 | 8.7% |
| Slovak | 6 | 0.3% |
| South American | 7 | 0.3% |
| Swedish | 4 | 0.2% |
| Welsh | 9 | 0.4% | View All 34 Rows |
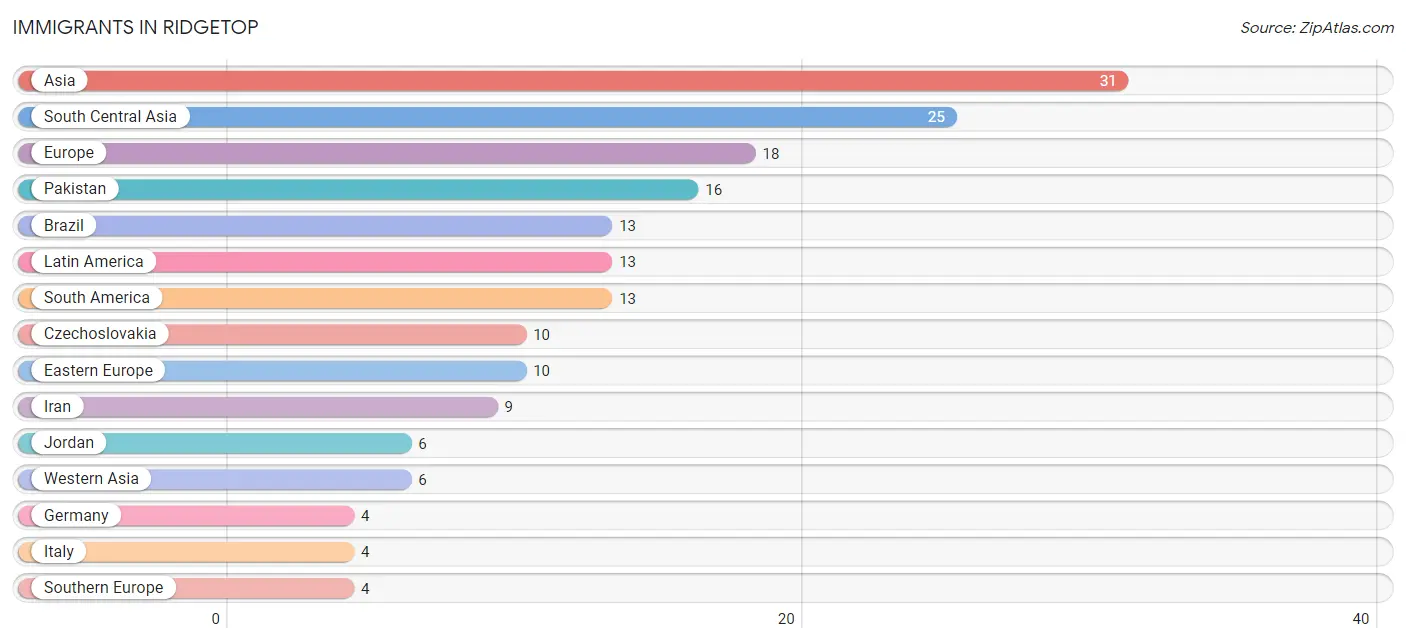
Immigrants in Ridgetop
The most numerous immigrant groups reported in Ridgetop came from Asia (31 | 1.3%), South Central Asia (25 | 1.1%), Europe (18 | 0.8%), Pakistan (16 | 0.7%), and Brazil (13 | 0.5%), together accounting for 4.3% of all Ridgetop residents.
| Immigration Origin | # Population | % Population |
| Asia | 31 | 1.3% |
| Brazil | 13 | 0.5% |
| Czechoslovakia | 10 | 0.4% |
| Eastern Europe | 10 | 0.4% |
| Europe | 18 | 0.8% |
| Germany | 4 | 0.2% |
| Iran | 9 | 0.4% |
| Italy | 4 | 0.2% |
| Jordan | 6 | 0.3% |
| Latin America | 13 | 0.5% |
| Pakistan | 16 | 0.7% |
| South America | 13 | 0.5% |
| South Central Asia | 25 | 1.1% |
| Southern Europe | 4 | 0.2% |
| Western Asia | 6 | 0.3% |
| Western Europe | 4 | 0.2% | View All 16 Rows |
Sex and Age in Ridgetop
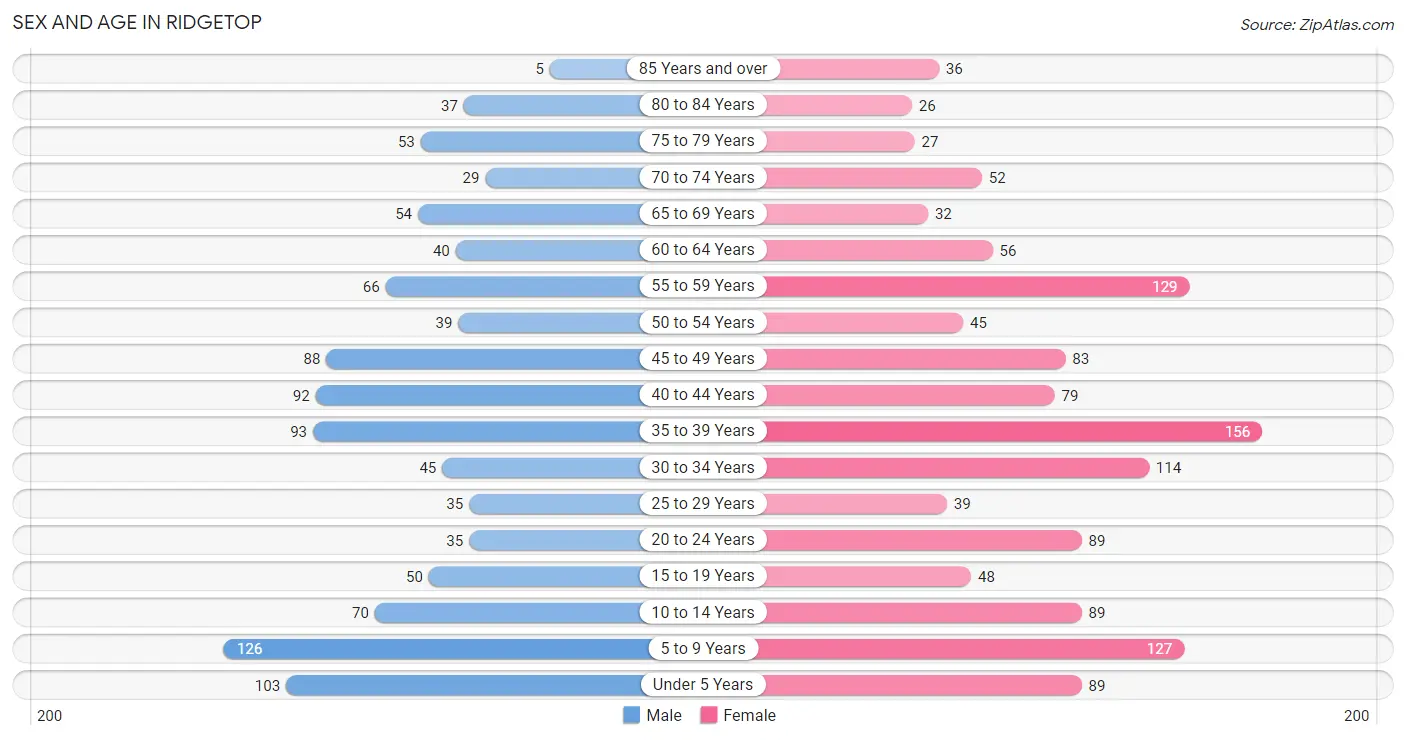
Sex and Age in Ridgetop
The most populous age groups in Ridgetop are 5 to 9 Years (126 | 11.9%) for men and 35 to 39 Years (156 | 11.8%) for women.
| Age Bracket | Male | Female |
| Under 5 Years | 103 (9.7%) | 89 (6.8%) |
| 5 to 9 Years | 126 (11.9%) | 127 (9.7%) |
| 10 to 14 Years | 70 (6.6%) | 89 (6.8%) |
| 15 to 19 Years | 50 (4.7%) | 48 (3.6%) |
| 20 to 24 Years | 35 (3.3%) | 89 (6.8%) |
| 25 to 29 Years | 35 (3.3%) | 39 (3.0%) |
| 30 to 34 Years | 45 (4.3%) | 114 (8.7%) |
| 35 to 39 Years | 93 (8.8%) | 156 (11.8%) |
| 40 to 44 Years | 92 (8.7%) | 79 (6.0%) |
| 45 to 49 Years | 88 (8.3%) | 83 (6.3%) |
| 50 to 54 Years | 39 (3.7%) | 45 (3.4%) |
| 55 to 59 Years | 66 (6.2%) | 129 (9.8%) |
| 60 to 64 Years | 40 (3.8%) | 56 (4.3%) |
| 65 to 69 Years | 54 (5.1%) | 32 (2.4%) |
| 70 to 74 Years | 29 (2.7%) | 52 (4.0%) |
| 75 to 79 Years | 53 (5.0%) | 27 (2.1%) |
| 80 to 84 Years | 37 (3.5%) | 26 (2.0%) |
| 85 Years and over | 5 (0.5%) | 36 (2.7%) |
| Total | 1,060 (100.0%) | 1,316 (100.0%) |
Families and Households in Ridgetop
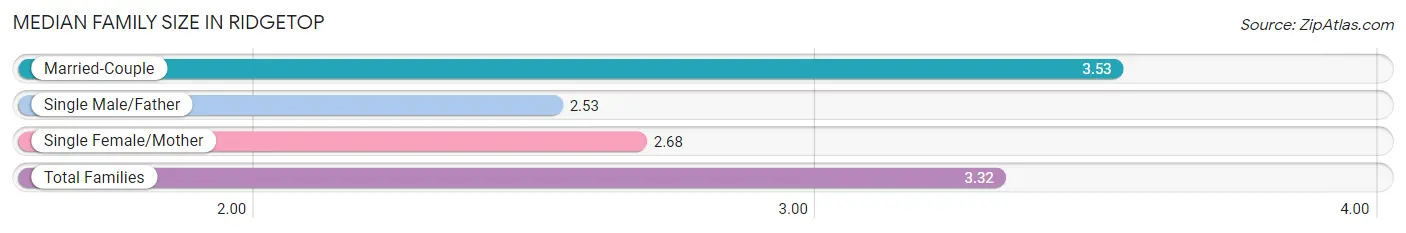
Median Family Size in Ridgetop
The median family size in Ridgetop is 3.32 persons per family, with married-couple families (466 | 76.1%) accounting for the largest median family size of 3.53 persons per family. On the other hand, single male/father families (38 | 6.2%) represent the smallest median family size with 2.53 persons per family.
| Family Type | # Families | Family Size |
| Married-Couple | 466 (76.1%) | 3.53 |
| Single Male/Father | 38 (6.2%) | 2.53 |
| Single Female/Mother | 108 (17.6%) | 2.68 |
| Total Families | 612 (100.0%) | 3.32 |
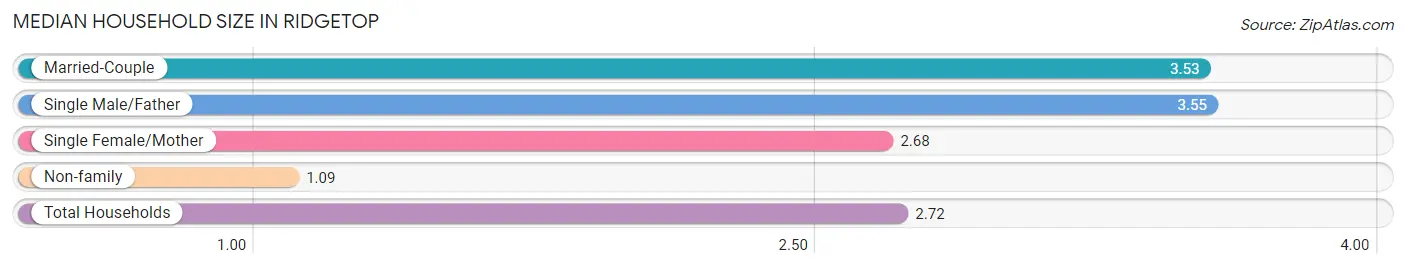
Median Household Size in Ridgetop
The median household size in Ridgetop is 2.72 persons per household, with single male/father households (38 | 4.4%) accounting for the largest median household size of 3.55 persons per household. non-family households (247 | 28.7%) represent the smallest median household size with 1.09 persons per household.
| Household Type | # Households | Household Size |
| Married-Couple | 466 (54.2%) | 3.53 |
| Single Male/Father | 38 (4.4%) | 3.55 |
| Single Female/Mother | 108 (12.6%) | 2.68 |
| Non-family | 247 (28.7%) | 1.09 |
| Total Households | 859 (100.0%) | 2.72 |
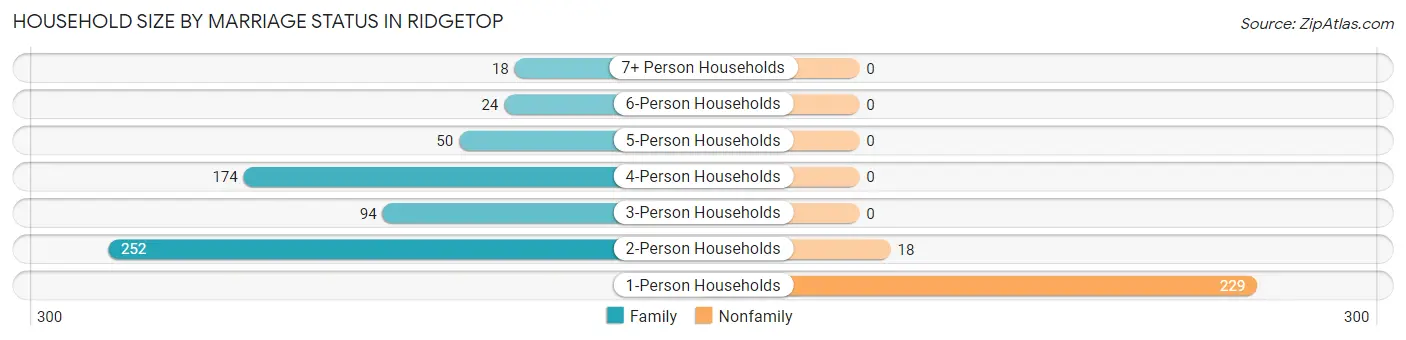
Household Size by Marriage Status in Ridgetop
Out of a total of 859 households in Ridgetop, 612 (71.3%) are family households, while 247 (28.7%) are nonfamily households. The most numerous type of family households are 2-person households, comprising 252, and the most common type of nonfamily households are 1-person households, comprising 229.
| Household Size | Family Households | Nonfamily Households |
| 1-Person Households | - | 229 (26.7%) |
| 2-Person Households | 252 (29.3%) | 18 (2.1%) |
| 3-Person Households | 94 (10.9%) | 0 (0.0%) |
| 4-Person Households | 174 (20.3%) | 0 (0.0%) |
| 5-Person Households | 50 (5.8%) | 0 (0.0%) |
| 6-Person Households | 24 (2.8%) | 0 (0.0%) |
| 7+ Person Households | 18 (2.1%) | 0 (0.0%) |
| Total | 612 (71.3%) | 247 (28.7%) |
Female Fertility in Ridgetop
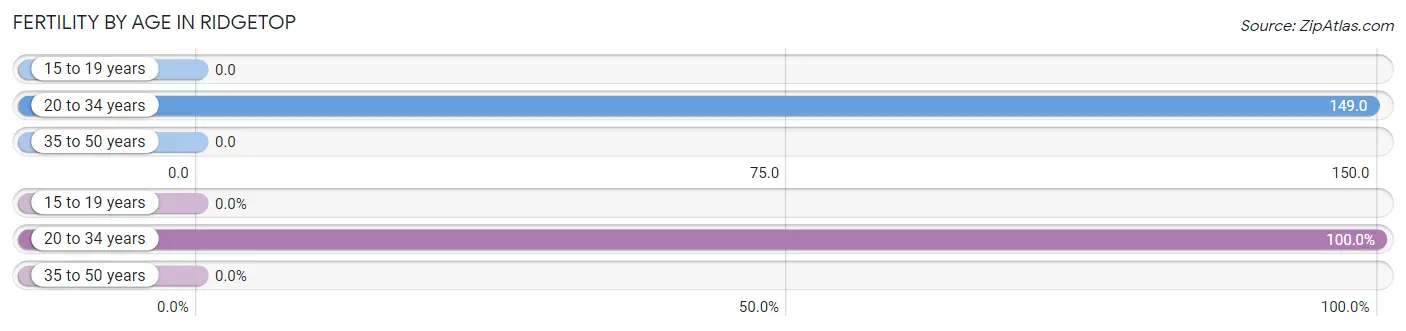
Fertility by Age in Ridgetop
Average fertility rate in Ridgetop is 58.0 births per 1,000 women. Women in the age bracket of 20 to 34 years have the highest fertility rate with 149.0 births per 1,000 women. Women in the age bracket of 20 to 34 years acount for 100.0% of all women with births.
| Age Bracket | Women with Births | Births / 1,000 Women |
| 15 to 19 years | 0 (0.0%) | 0.0 |
| 20 to 34 years | 36 (100.0%) | 149.0 |
| 35 to 50 years | 0 (0.0%) | 0.0 |
| Total | 36 (100.0%) | 58.0 |
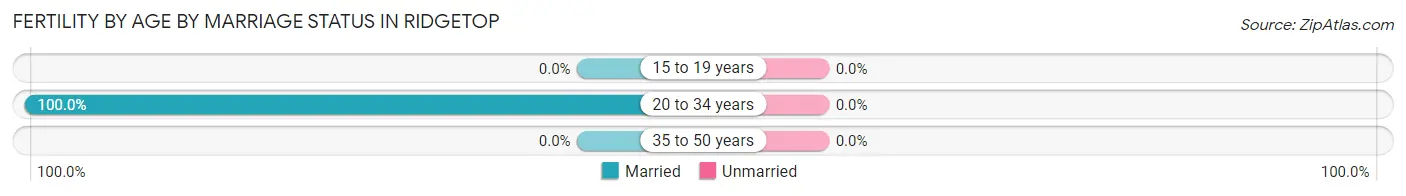
Fertility by Age by Marriage Status in Ridgetop
| Age Bracket | Married | Unmarried |
| 15 to 19 years | 0 (0.0%) | 0 (0.0%) |
| 20 to 34 years | 36 (100.0%) | 0 (0.0%) |
| 35 to 50 years | 0 (0.0%) | 0 (0.0%) |
| Total | 36 (100.0%) | 0 (0.0%) |
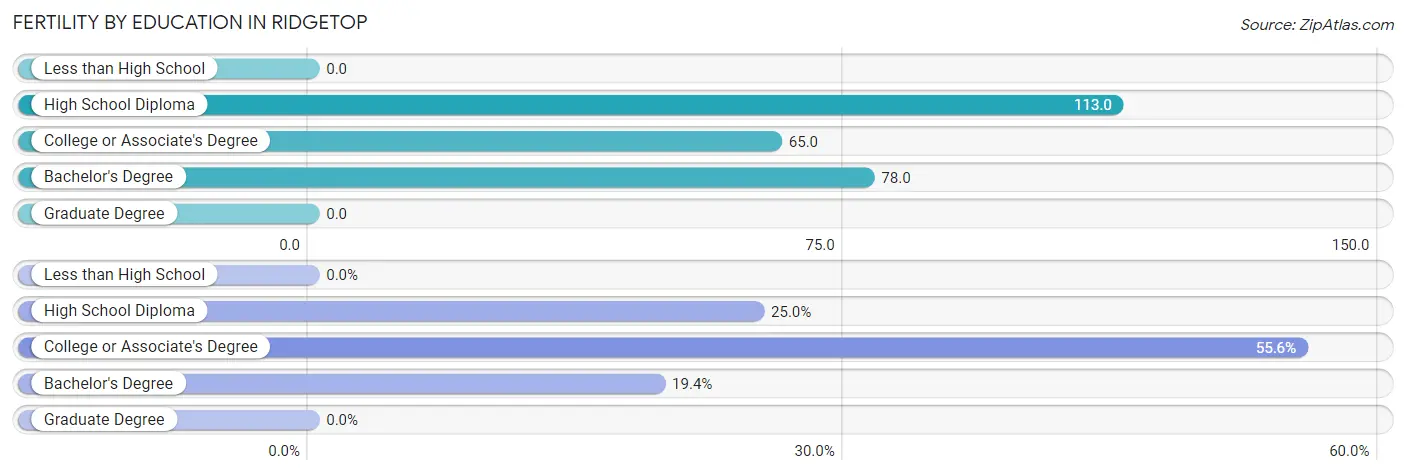
Fertility by Education in Ridgetop
| Educational Attainment | Women with Births | Births / 1,000 Women |
| Less than High School | 0 (0.0%) | 0.0 |
| High School Diploma | 9 (25.0%) | 113.0 |
| College or Associate's Degree | 20 (55.6%) | 65.0 |
| Bachelor's Degree | 7 (19.4%) | 78.0 |
| Graduate Degree | 0 (0.0%) | 0.0 |
| Total | 36 (100.0%) | 58.0 |
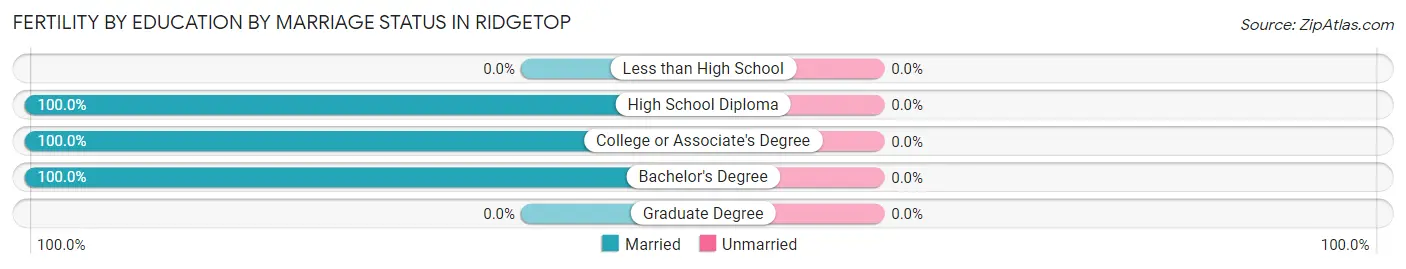
Fertility by Education by Marriage Status in Ridgetop
| Educational Attainment | Married | Unmarried |
| Less than High School | 0 (0.0%) | 0 (0.0%) |
| High School Diploma | 9 (100.0%) | 0 (0.0%) |
| College or Associate's Degree | 20 (100.0%) | 0 (0.0%) |
| Bachelor's Degree | 7 (100.0%) | 0 (0.0%) |
| Graduate Degree | 0 (0.0%) | 0 (0.0%) |
| Total | 36 (100.0%) | 0 (0.0%) |
Income in Ridgetop
Income Overview in Ridgetop
Per Capita Income in Ridgetop is $37,893, while median incomes of families and households are $76,413 and $66,964 respectively.
| Characteristic | Number | Measure |
| Per Capita Income | 2,376 | $37,893 |
| Median Family Income | 612 | $76,413 |
| Mean Family Income | 612 | $102,739 |
| Median Household Income | 859 | $66,964 |
| Mean Household Income | 859 | $90,147 |
| Income Deficit | 612 | $0 |
| Wage / Income Gap (%) | 2,376 | 44.25% |
| Wage / Income Gap ($) | 2,376 | 55.75¢ per $1 |
| Gini / Inequality Index | 2,376 | 0.43 |
Earnings by Sex in Ridgetop
Average Earnings in Ridgetop are $48,465, $51,571 for men and $28,750 for women, a difference of 44.3%.
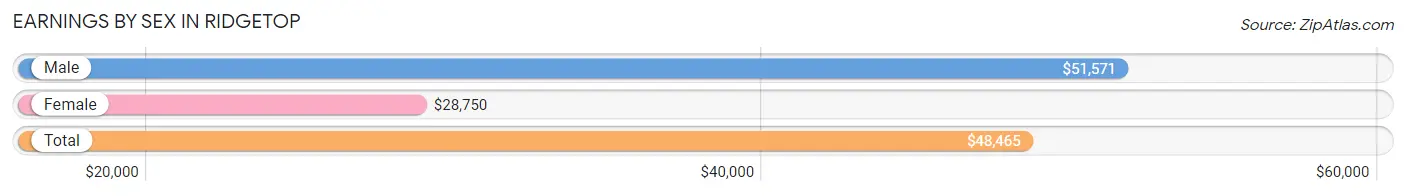
| Sex | Number | Average Earnings |
| Male | 561 (50.0%) | $51,571 |
| Female | 561 (50.0%) | $28,750 |
| Total | 1,122 (100.0%) | $48,465 |
Earnings by Sex by Income Bracket in Ridgetop
The most common earnings brackets in Ridgetop are $100,000+ for men (107 | 19.1%) and $75,000 to $99,999 for women (80 | 14.3%).
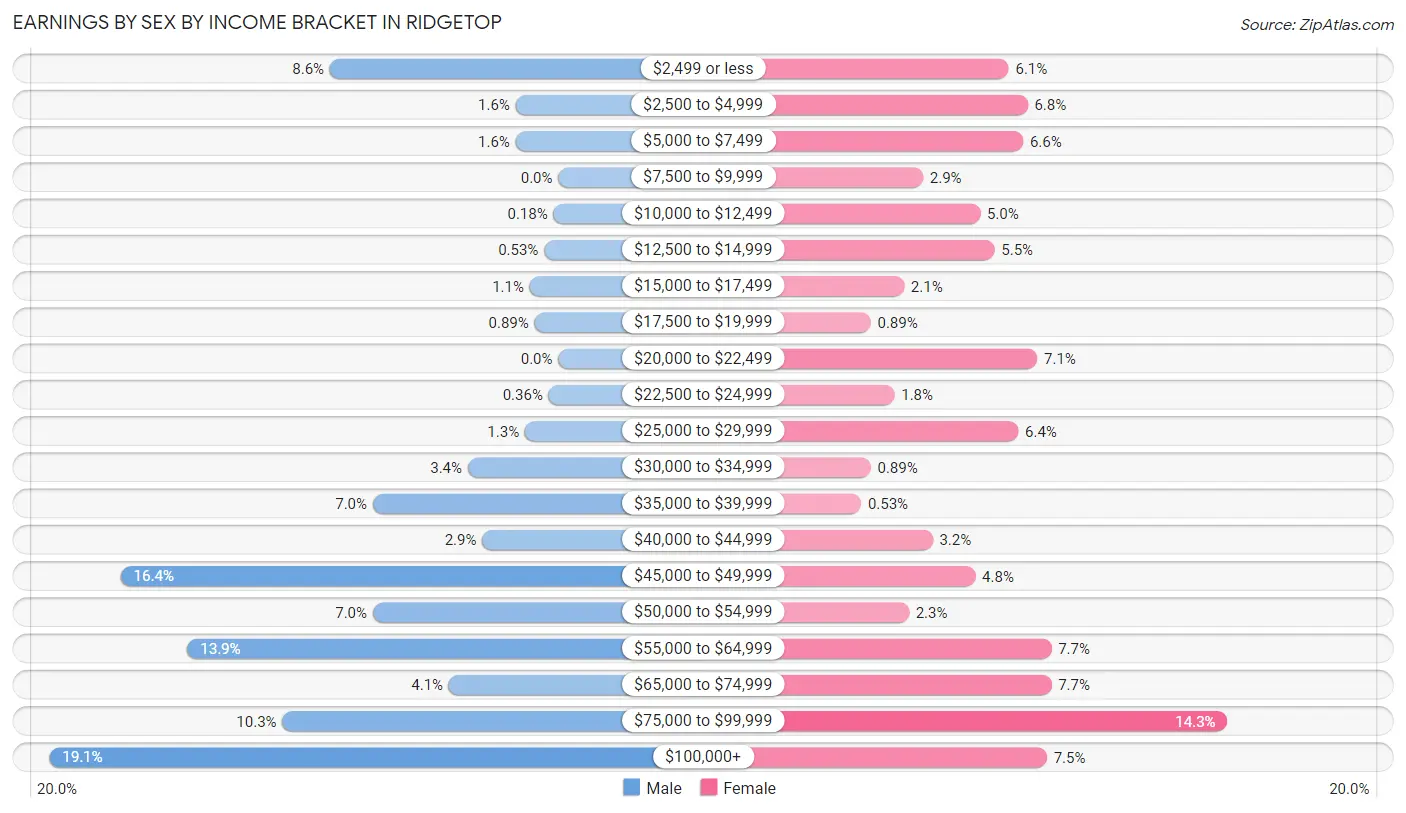
| Income | Male | Female |
| $2,499 or less | 48 (8.6%) | 34 (6.1%) |
| $2,500 to $4,999 | 9 (1.6%) | 38 (6.8%) |
| $5,000 to $7,499 | 9 (1.6%) | 37 (6.6%) |
| $7,500 to $9,999 | 0 (0.0%) | 16 (2.9%) |
| $10,000 to $12,499 | 1 (0.2%) | 28 (5.0%) |
| $12,500 to $14,999 | 3 (0.5%) | 31 (5.5%) |
| $15,000 to $17,499 | 6 (1.1%) | 12 (2.1%) |
| $17,500 to $19,999 | 5 (0.9%) | 5 (0.9%) |
| $20,000 to $22,499 | 0 (0.0%) | 40 (7.1%) |
| $22,500 to $24,999 | 2 (0.4%) | 10 (1.8%) |
| $25,000 to $29,999 | 7 (1.3%) | 36 (6.4%) |
| $30,000 to $34,999 | 19 (3.4%) | 5 (0.9%) |
| $35,000 to $39,999 | 39 (7.0%) | 3 (0.5%) |
| $40,000 to $44,999 | 16 (2.9%) | 18 (3.2%) |
| $45,000 to $49,999 | 92 (16.4%) | 27 (4.8%) |
| $50,000 to $54,999 | 39 (7.0%) | 13 (2.3%) |
| $55,000 to $64,999 | 78 (13.9%) | 43 (7.7%) |
| $65,000 to $74,999 | 23 (4.1%) | 43 (7.7%) |
| $75,000 to $99,999 | 58 (10.3%) | 80 (14.3%) |
| $100,000+ | 107 (19.1%) | 42 (7.5%) |
| Total | 561 (100.0%) | 561 (100.0%) |
Earnings by Sex by Educational Attainment in Ridgetop
Average earnings in Ridgetop are $57,656 for men and $45,350 for women, a difference of 21.3%. Men with an educational attainment of graduate degree enjoy the highest average annual earnings of $188,427, while those with less than high school education earn the least with $38,750. Women with an educational attainment of graduate degree earn the most with the average annual earnings of $77,500, while those with college or associate's degree education have the smallest earnings of $41,458.
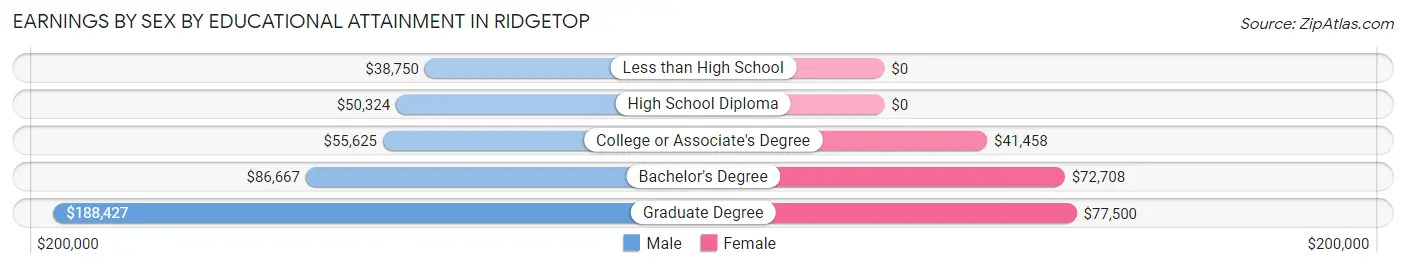
| Educational Attainment | Male Income | Female Income |
| Less than High School | $38,750 | $0 |
| High School Diploma | $50,324 | $0 |
| College or Associate's Degree | $55,625 | $41,458 |
| Bachelor's Degree | $86,667 | $72,708 |
| Graduate Degree | $188,427 | $77,500 |
| Total | $57,656 | $45,350 |
Family Income in Ridgetop
Family Income Brackets in Ridgetop
According to the Ridgetop family income data, there are 189 families falling into the $50,000 to $74,999 income range, which is the most common income bracket and makes up 30.9% of all families.
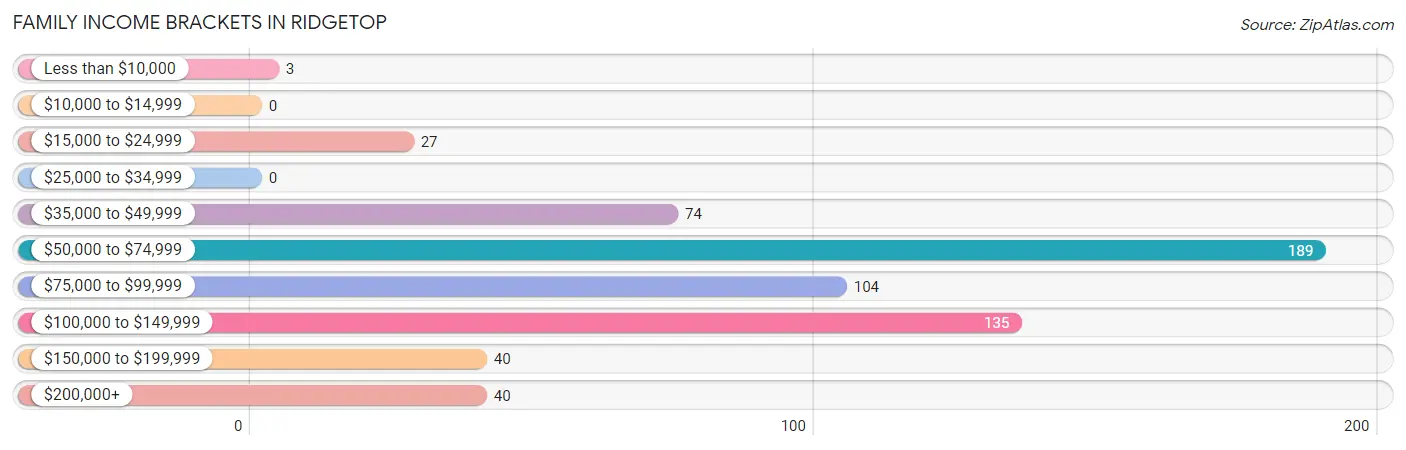
| Income Bracket | # Families | % Families |
| Less than $10,000 | 3 | 0.5% |
| $10,000 to $14,999 | 0 | 0.0% |
| $15,000 to $24,999 | 27 | 4.4% |
| $25,000 to $34,999 | 0 | 0.0% |
| $35,000 to $49,999 | 74 | 12.1% |
| $50,000 to $74,999 | 189 | 30.9% |
| $75,000 to $99,999 | 104 | 17.0% |
| $100,000 to $149,999 | 135 | 22.1% |
| $150,000 to $199,999 | 40 | 6.5% |
| $200,000+ | 40 | 6.5% |
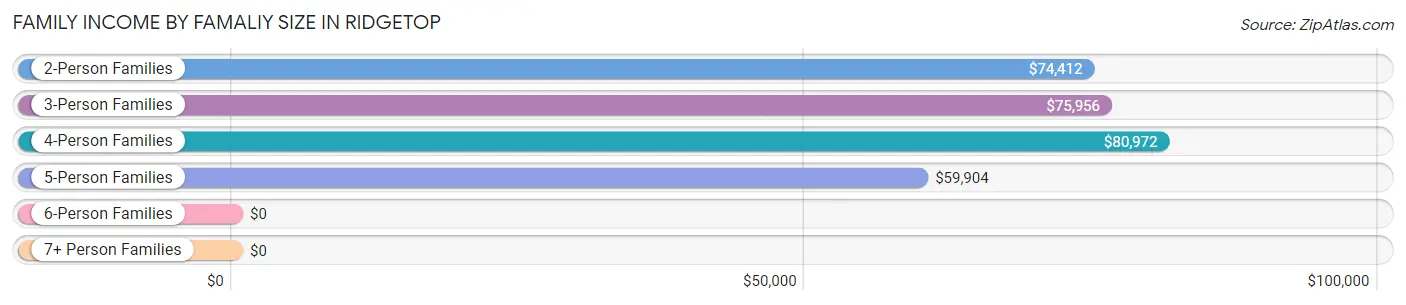
Family Income by Famaliy Size in Ridgetop
4-person families (147 | 24.0%) account for the highest median family income in Ridgetop with $80,972 per family, while 2-person families (252 | 41.2%) have the highest median income of $37,206 per family member.
| Income Bracket | # Families | Median Income |
| 2-Person Families | 252 (41.2%) | $74,412 |
| 3-Person Families | 121 (19.8%) | $75,956 |
| 4-Person Families | 147 (24.0%) | $80,972 |
| 5-Person Families | 50 (8.2%) | $59,904 |
| 6-Person Families | 27 (4.4%) | $0 |
| 7+ Person Families | 15 (2.5%) | $0 |
| Total | 612 (100.0%) | $76,413 |
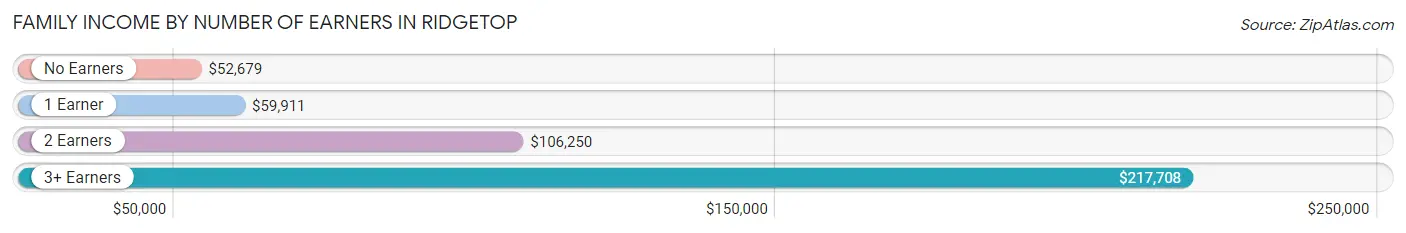
Family Income by Number of Earners in Ridgetop
The median family income in Ridgetop is $76,413, with families comprising 3+ earners (34) having the highest median family income of $217,708, while families with no earners (67) have the lowest median family income of $52,679, accounting for 5.6% and 11.0% of families, respectively.
| Number of Earners | # Families | Median Income |
| No Earners | 67 (11.0%) | $52,679 |
| 1 Earner | 253 (41.3%) | $59,911 |
| 2 Earners | 258 (42.2%) | $106,250 |
| 3+ Earners | 34 (5.6%) | $217,708 |
| Total | 612 (100.0%) | $76,413 |
Household Income in Ridgetop
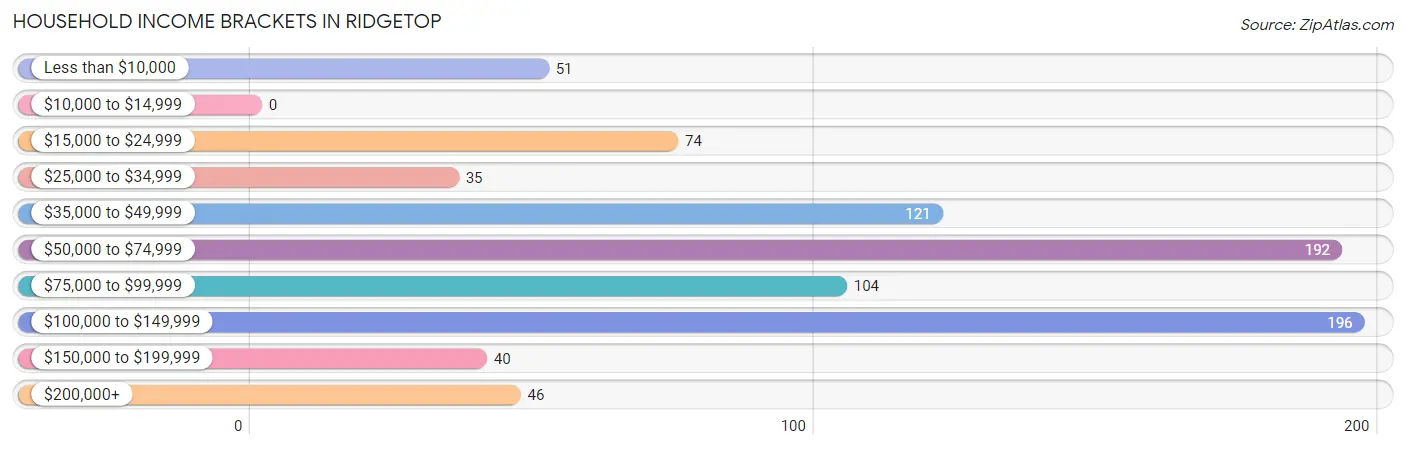
Household Income Brackets in Ridgetop
With 196 households falling in the category, the $100,000 to $149,999 income range is the most frequent in Ridgetop, accounting for 22.8% of all households.
| Income Bracket | # Households | % Households |
| Less than $10,000 | 51 | 5.9% |
| $10,000 to $14,999 | 0 | 0.0% |
| $15,000 to $24,999 | 74 | 8.6% |
| $25,000 to $34,999 | 35 | 4.1% |
| $35,000 to $49,999 | 121 | 14.1% |
| $50,000 to $74,999 | 192 | 22.4% |
| $75,000 to $99,999 | 104 | 12.1% |
| $100,000 to $149,999 | 196 | 22.8% |
| $150,000 to $199,999 | 40 | 4.7% |
| $200,000+ | 46 | 5.4% |
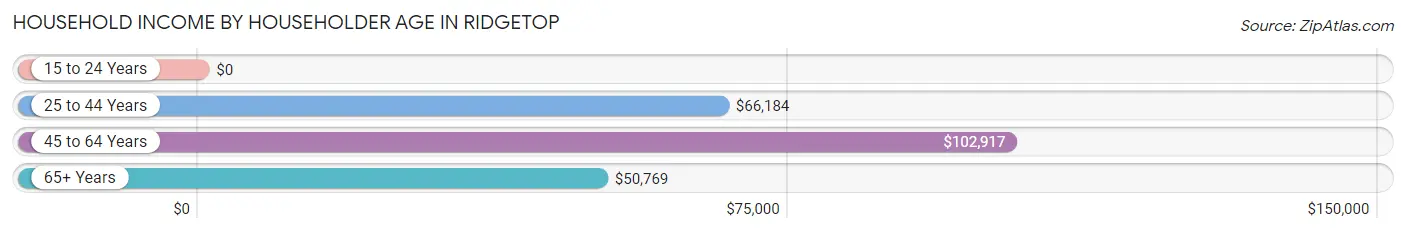
Household Income by Householder Age in Ridgetop
The median household income in Ridgetop is $66,964, with the highest median household income of $102,917 found in the 45 to 64 years age bracket for the primary householder. A total of 282 households (32.8%) fall into this category. Meanwhile, the 15 to 24 years age bracket for the primary householder has the lowest median household income of $0, with 9 households (1.1%) in this group.
| Income Bracket | # Households | Median Income |
| 15 to 24 Years | 9 (1.1%) | $0 |
| 25 to 44 Years | 358 (41.7%) | $66,184 |
| 45 to 64 Years | 282 (32.8%) | $102,917 |
| 65+ Years | 210 (24.4%) | $50,769 |
| Total | 859 (100.0%) | $66,964 |
Poverty in Ridgetop
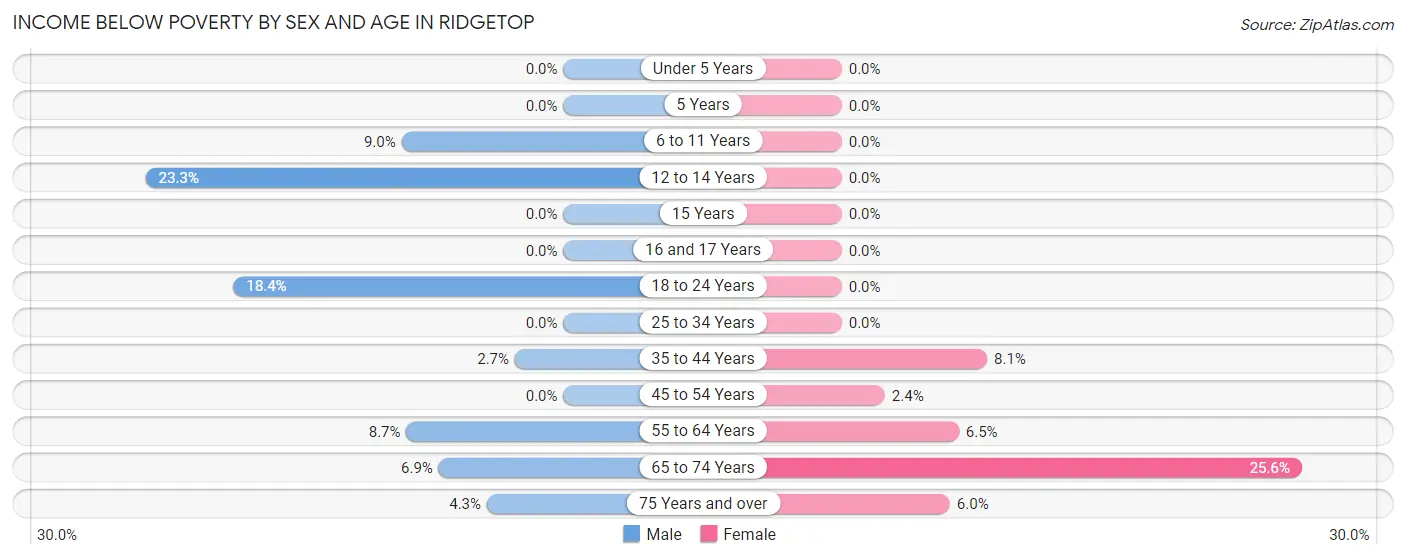
Income Below Poverty by Sex and Age in Ridgetop
With 5.0% poverty level for males and 4.6% for females among the residents of Ridgetop, 12 to 14 year old males and 65 to 74 year old females are the most vulnerable to poverty, with 10 males (23.3%) and 21 females (25.6%) in their respective age groups living below the poverty level.
| Age Bracket | Male | Female |
| Under 5 Years | 0 (0.0%) | 0 (0.0%) |
| 5 Years | 0 (0.0%) | 0 (0.0%) |
| 6 to 11 Years | 10 (9.0%) | 0 (0.0%) |
| 12 to 14 Years | 10 (23.3%) | 0 (0.0%) |
| 15 Years | 0 (0.0%) | 0 (0.0%) |
| 16 and 17 Years | 0 (0.0%) | 0 (0.0%) |
| 18 to 24 Years | 9 (18.4%) | 0 (0.0%) |
| 25 to 34 Years | 0 (0.0%) | 0 (0.0%) |
| 35 to 44 Years | 5 (2.7%) | 19 (8.1%) |
| 45 to 54 Years | 0 (0.0%) | 3 (2.4%) |
| 55 to 64 Years | 9 (8.7%) | 12 (6.5%) |
| 65 to 74 Years | 5 (6.9%) | 21 (25.6%) |
| 75 Years and over | 4 (4.3%) | 5 (6.0%) |
| Total | 52 (5.0%) | 60 (4.6%) |
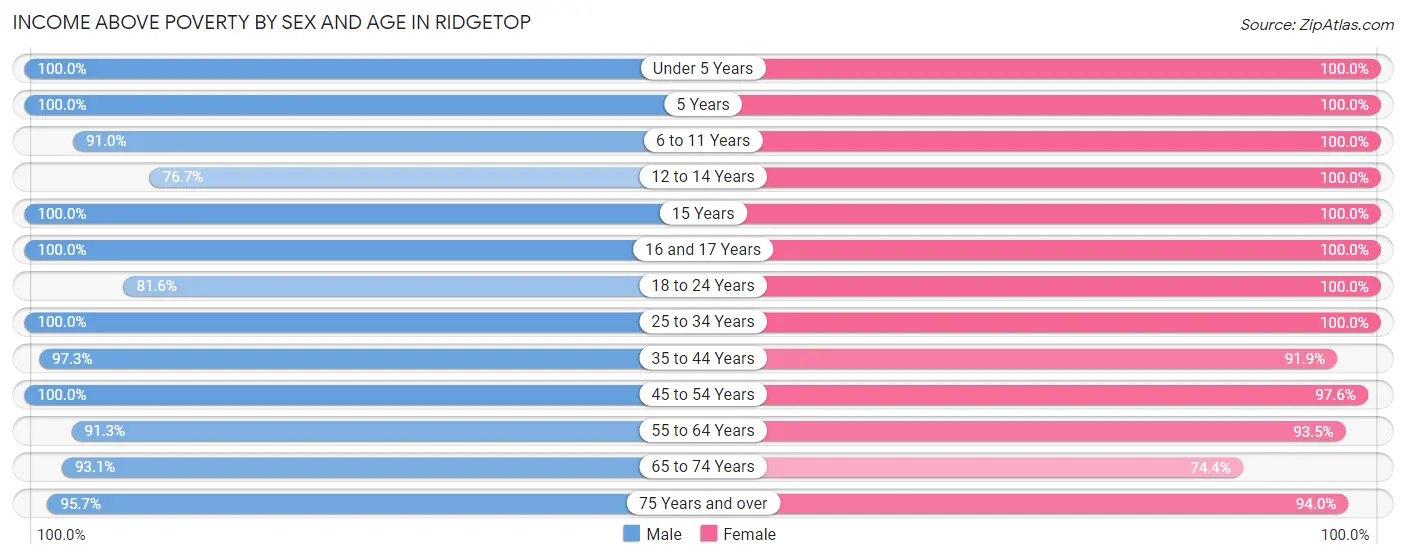
Income Above Poverty by Sex and Age in Ridgetop
According to the poverty statistics in Ridgetop, males aged under 5 years and females aged under 5 years are the age groups that are most secure financially, with 100.0% of males and 100.0% of females in these age groups living above the poverty line.
| Age Bracket | Male | Female |
| Under 5 Years | 103 (100.0%) | 89 (100.0%) |
| 5 Years | 42 (100.0%) | 48 (100.0%) |
| 6 to 11 Years | 101 (91.0%) | 113 (100.0%) |
| 12 to 14 Years | 33 (76.7%) | 55 (100.0%) |
| 15 Years | 21 (100.0%) | 17 (100.0%) |
| 16 and 17 Years | 15 (100.0%) | 20 (100.0%) |
| 18 to 24 Years | 40 (81.6%) | 100 (100.0%) |
| 25 to 34 Years | 80 (100.0%) | 153 (100.0%) |
| 35 to 44 Years | 180 (97.3%) | 216 (91.9%) |
| 45 to 54 Years | 120 (100.0%) | 122 (97.6%) |
| 55 to 64 Years | 94 (91.3%) | 172 (93.5%) |
| 65 to 74 Years | 67 (93.1%) | 61 (74.4%) |
| 75 Years and over | 90 (95.7%) | 78 (94.0%) |
| Total | 986 (95.0%) | 1,244 (95.4%) |
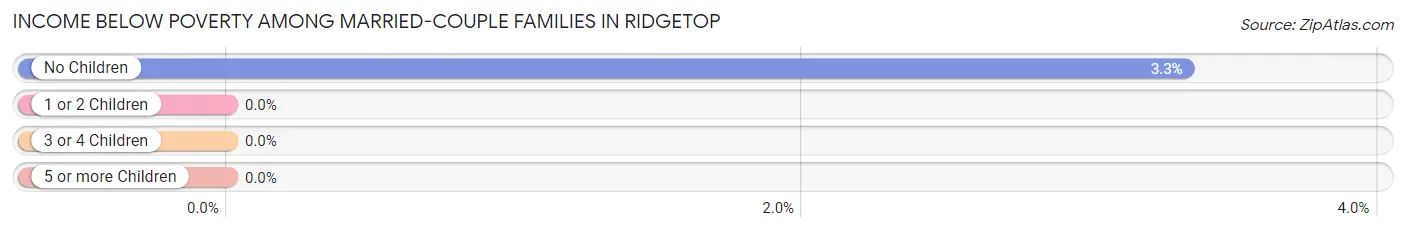
Income Below Poverty Among Married-Couple Families in Ridgetop
The poverty statistics for married-couple families in Ridgetop show that 1.5% or 7 of the total 466 families live below the poverty line. Families with no children have the highest poverty rate of 3.3%, comprising of 7 families. On the other hand, families with 1 or 2 children have the lowest poverty rate of 0.0%, which includes 0 families.
| Children | Above Poverty | Below Poverty |
| No Children | 203 (96.7%) | 7 (3.3%) |
| 1 or 2 Children | 196 (100.0%) | 0 (0.0%) |
| 3 or 4 Children | 60 (100.0%) | 0 (0.0%) |
| 5 or more Children | 0 (0.0%) | 0 (0.0%) |
| Total | 459 (98.5%) | 7 (1.5%) |
Income Below Poverty Among Single-Parent Households in Ridgetop
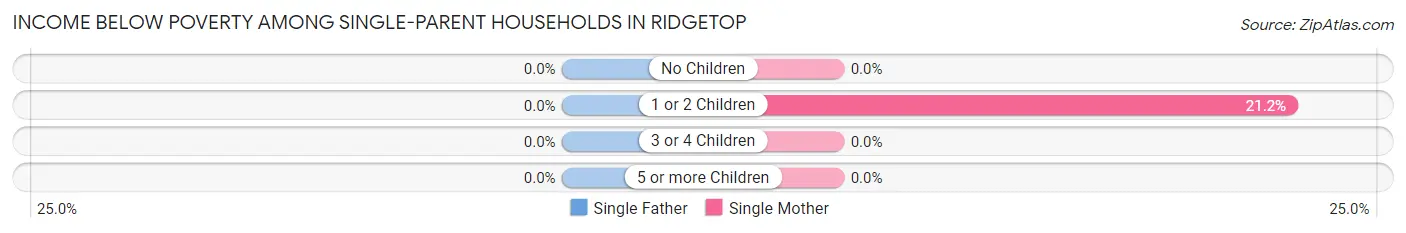
| Children | Single Father | Single Mother |
| No Children | 0 (0.0%) | 0 (0.0%) |
| 1 or 2 Children | 0 (0.0%) | 11 (21.1%) |
| 3 or 4 Children | 0 (0.0%) | 0 (0.0%) |
| 5 or more Children | 0 (0.0%) | 0 (0.0%) |
| Total | 0 (0.0%) | 11 (10.2%) |
Income Below Poverty Among Married-Couple vs Single-Parent Households in Ridgetop
The poverty data for Ridgetop shows that 7 of the married-couple family households (1.5%) and 11 of the single-parent households (7.5%) are living below the poverty level. Within the married-couple family households, those with no children have the highest poverty rate, with 7 households (3.3%) falling below the poverty line. Among the single-parent households, those with 1 or 2 children have the highest poverty rate, with 11 household (13.9%) living below poverty.
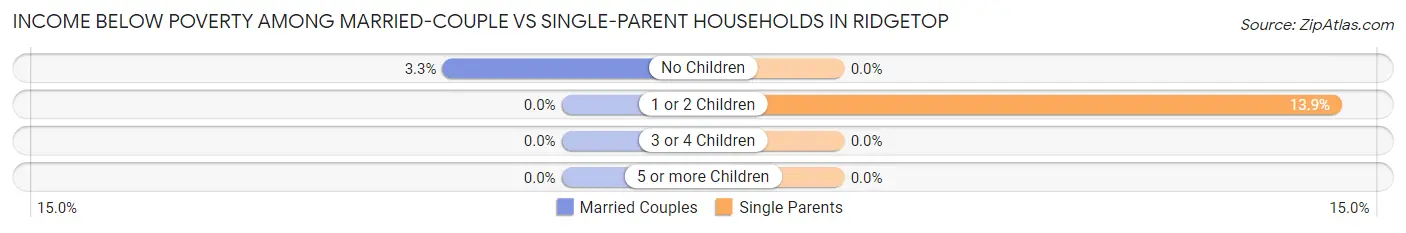
| Children | Married-Couple Families | Single-Parent Households |
| No Children | 7 (3.3%) | 0 (0.0%) |
| 1 or 2 Children | 0 (0.0%) | 11 (13.9%) |
| 3 or 4 Children | 0 (0.0%) | 0 (0.0%) |
| 5 or more Children | 0 (0.0%) | 0 (0.0%) |
| Total | 7 (1.5%) | 11 (7.5%) |
Employment Characteristics in Ridgetop
Employment by Class of Employer in Ridgetop
Among the 970 employed individuals in Ridgetop, private company employees (685 | 70.6%), self-employed (not incorporated) (100 | 10.3%), and not-for-profit organizations (44 | 4.5%) make up the most common classes of employment.
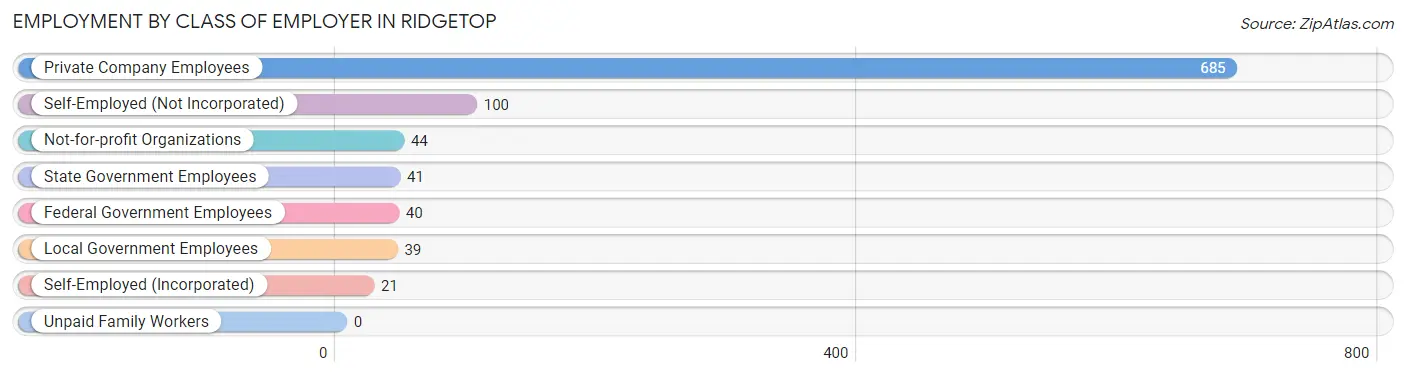
| Employer Class | # Employees | % Employees |
| Private Company Employees | 685 | 70.6% |
| Self-Employed (Incorporated) | 21 | 2.2% |
| Self-Employed (Not Incorporated) | 100 | 10.3% |
| Not-for-profit Organizations | 44 | 4.5% |
| Local Government Employees | 39 | 4.0% |
| State Government Employees | 41 | 4.2% |
| Federal Government Employees | 40 | 4.1% |
| Unpaid Family Workers | 0 | 0.0% |
| Total | 970 | 100.0% |
Employment Status by Age in Ridgetop
According to the labor force statistics for Ridgetop, out of the total population over 16 years of age (1,734), 62.1% or 1,077 individuals are in the labor force, with 5.8% or 62 of them unemployed. The age group with the highest labor force participation rate is 35 to 44 years, with 95.0% or 399 individuals in the labor force. Within the labor force, the 16 to 19 years age range has the highest percentage of unemployed individuals, with 85.7% or 6 of them being unemployed.
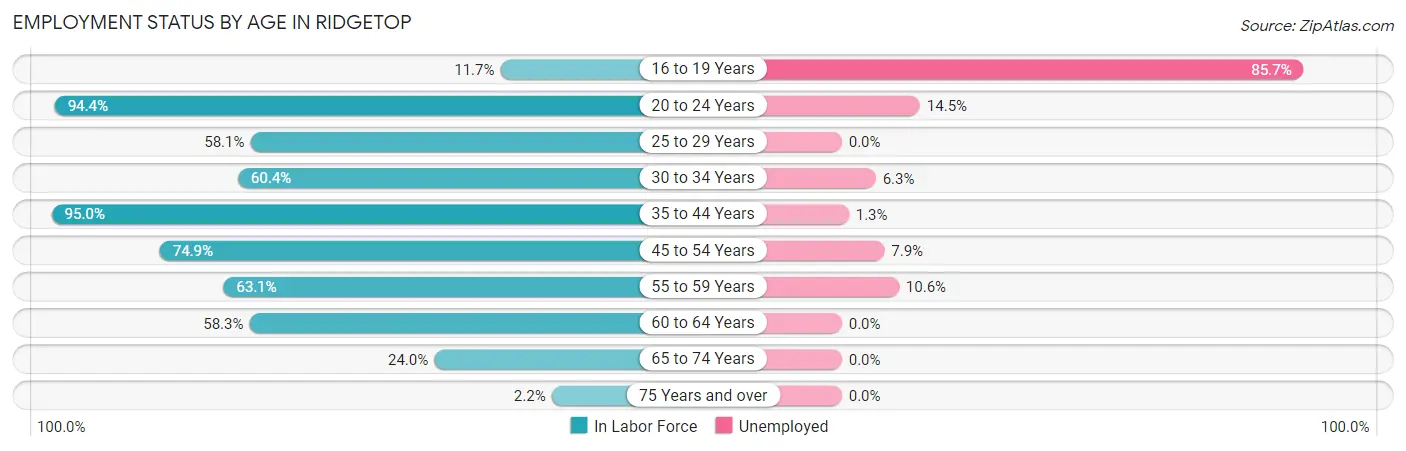
| Age Bracket | In Labor Force | Unemployed |
| 16 to 19 Years | 7 (11.7%) | 6 (85.7%) |
| 20 to 24 Years | 117 (94.4%) | 17 (14.5%) |
| 25 to 29 Years | 43 (58.1%) | 0 (0.0%) |
| 30 to 34 Years | 96 (60.4%) | 6 (6.3%) |
| 35 to 44 Years | 399 (95.0%) | 5 (1.3%) |
| 45 to 54 Years | 191 (74.9%) | 15 (7.9%) |
| 55 to 59 Years | 123 (63.1%) | 13 (10.6%) |
| 60 to 64 Years | 56 (58.3%) | 0 (0.0%) |
| 65 to 74 Years | 40 (24.0%) | 0 (0.0%) |
| 75 Years and over | 4 (2.2%) | 0 (0.0%) |
| Total | 1,077 (62.1%) | 62 (5.8%) |
Employment Status by Educational Attainment in Ridgetop
According to labor force statistics for Ridgetop, 75.7% of individuals (908) out of the total population between 25 and 64 years of age (1,199) are in the labor force, with 4.3% or 39 of them being unemployed. The group with the highest labor force participation rate are those with the educational attainment of bachelor's degree or higher, with 85.9% or 299 individuals in the labor force. Within the labor force, individuals with high school diploma education have the highest percentage of unemployment, with 6.5% or 13 of them being unemployed.
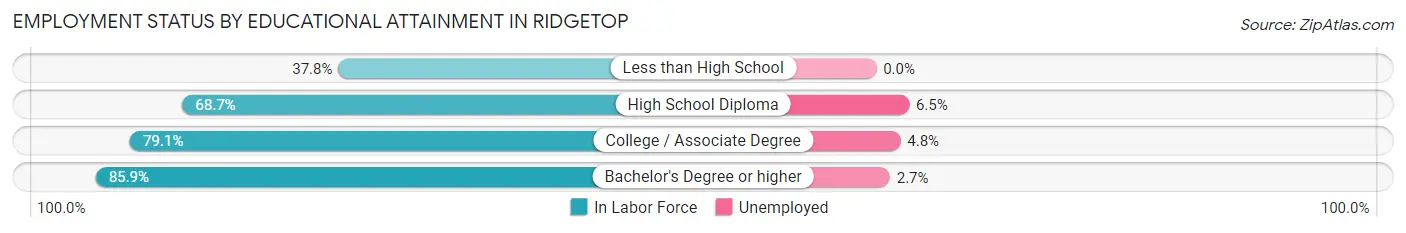
| Educational Attainment | In Labor Force | Unemployed |
| Less than High School | 31 (37.8%) | 0 (0.0%) |
| High School Diploma | 200 (68.7%) | 19 (6.5%) |
| College / Associate Degree | 378 (79.1%) | 23 (4.8%) |
| Bachelor's Degree or higher | 299 (85.9%) | 9 (2.7%) |
| Total | 908 (75.7%) | 52 (4.3%) |
Employment Occupations by Sex in Ridgetop
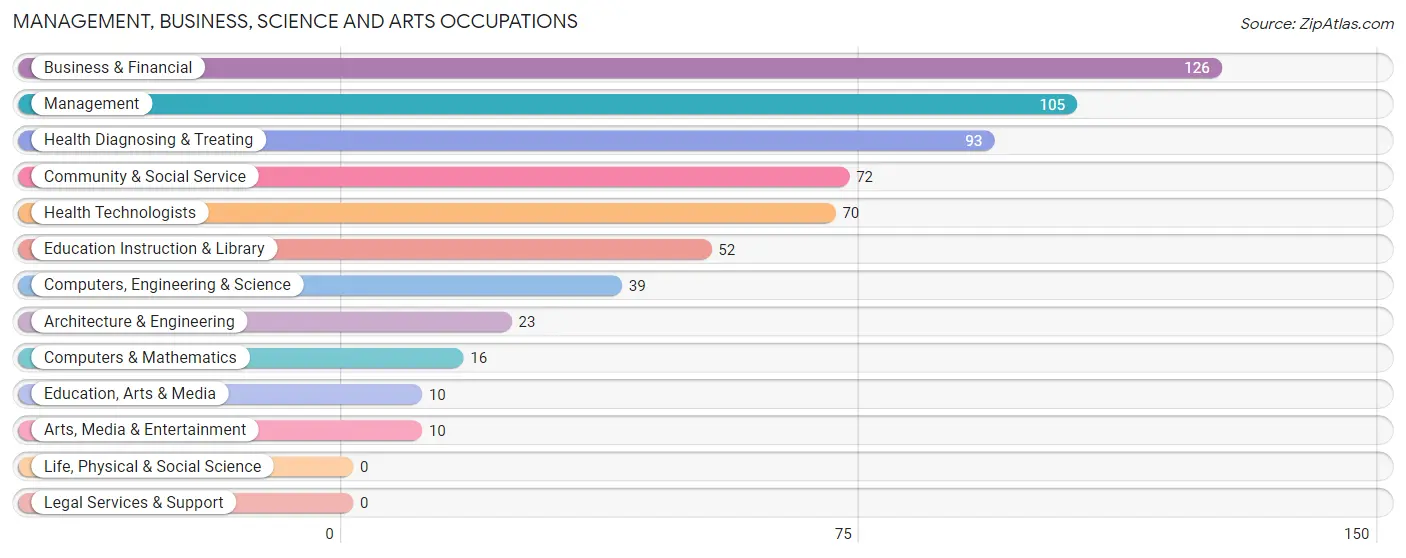
Management, Business, Science and Arts Occupations
The most common Management, Business, Science and Arts occupations in Ridgetop are Business & Financial (126 | 12.4%), Management (105 | 10.4%), Health Diagnosing & Treating (93 | 9.2%), Community & Social Service (72 | 7.1%), and Health Technologists (70 | 6.9%).
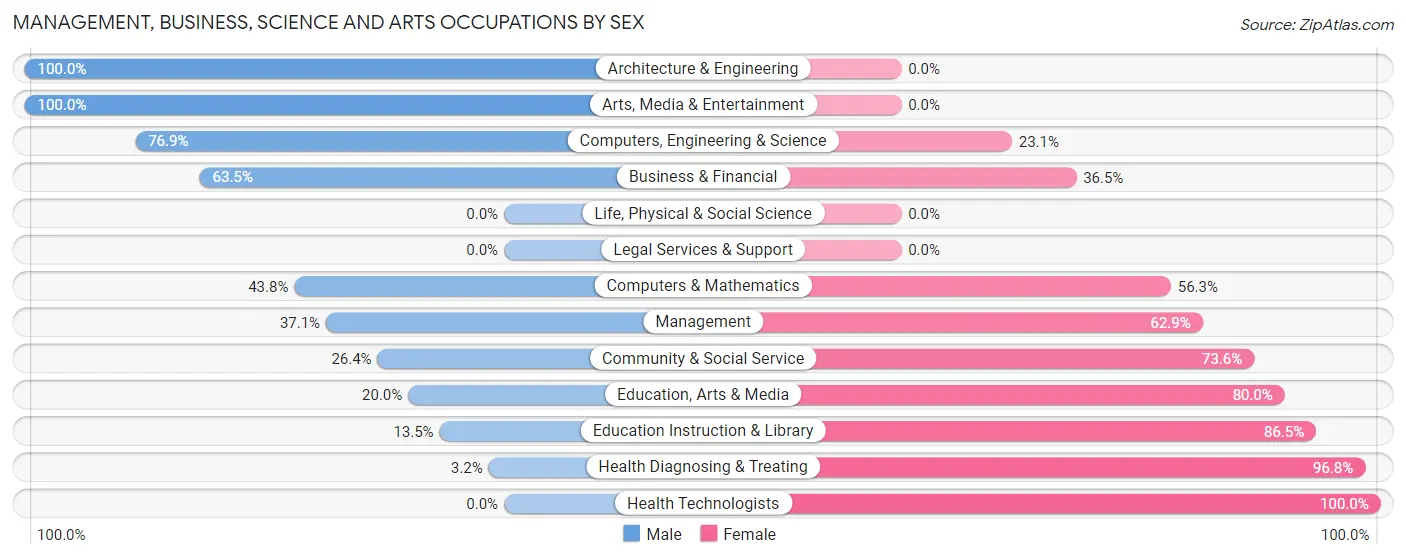
Management, Business, Science and Arts Occupations by Sex
Within the Management, Business, Science and Arts occupations in Ridgetop, the most male-oriented occupations are Architecture & Engineering (100.0%), Arts, Media & Entertainment (100.0%), and Computers, Engineering & Science (76.9%), while the most female-oriented occupations are Health Technologists (100.0%), Health Diagnosing & Treating (96.8%), and Education Instruction & Library (86.5%).
| Occupation | Male | Female |
| Management | 39 (37.1%) | 66 (62.9%) |
| Business & Financial | 80 (63.5%) | 46 (36.5%) |
| Computers, Engineering & Science | 30 (76.9%) | 9 (23.1%) |
| Computers & Mathematics | 7 (43.8%) | 9 (56.2%) |
| Architecture & Engineering | 23 (100.0%) | 0 (0.0%) |
| Life, Physical & Social Science | 0 (0.0%) | 0 (0.0%) |
| Community & Social Service | 19 (26.4%) | 53 (73.6%) |
| Education, Arts & Media | 2 (20.0%) | 8 (80.0%) |
| Legal Services & Support | 0 (0.0%) | 0 (0.0%) |
| Education Instruction & Library | 7 (13.5%) | 45 (86.5%) |
| Arts, Media & Entertainment | 10 (100.0%) | 0 (0.0%) |
| Health Diagnosing & Treating | 3 (3.2%) | 90 (96.8%) |
| Health Technologists | 0 (0.0%) | 70 (100.0%) |
| Total (Category) | 171 (39.3%) | 264 (60.7%) |
| Total (Overall) | 512 (50.5%) | 502 (49.5%) |
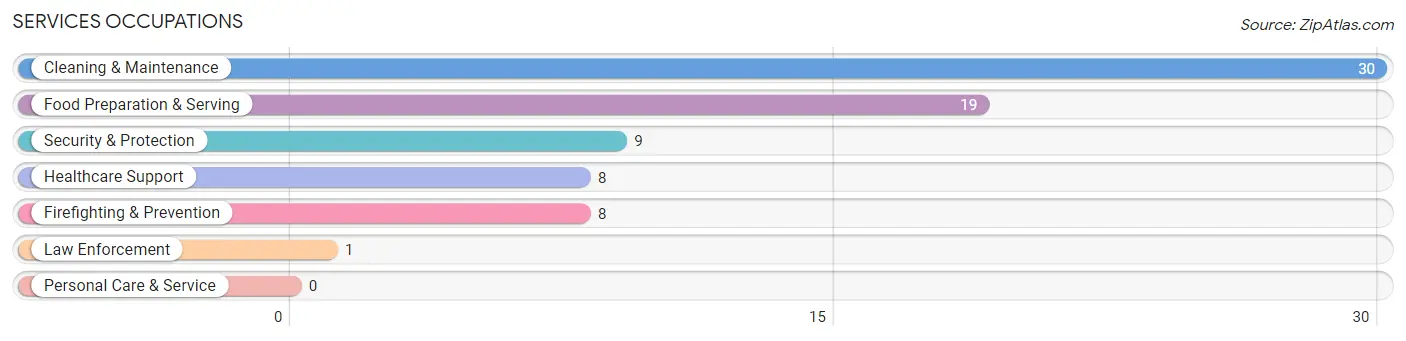
Services Occupations
The most common Services occupations in Ridgetop are Cleaning & Maintenance (30 | 3.0%), Food Preparation & Serving (19 | 1.9%), Security & Protection (9 | 0.9%), Healthcare Support (8 | 0.8%), and Firefighting & Prevention (8 | 0.8%).
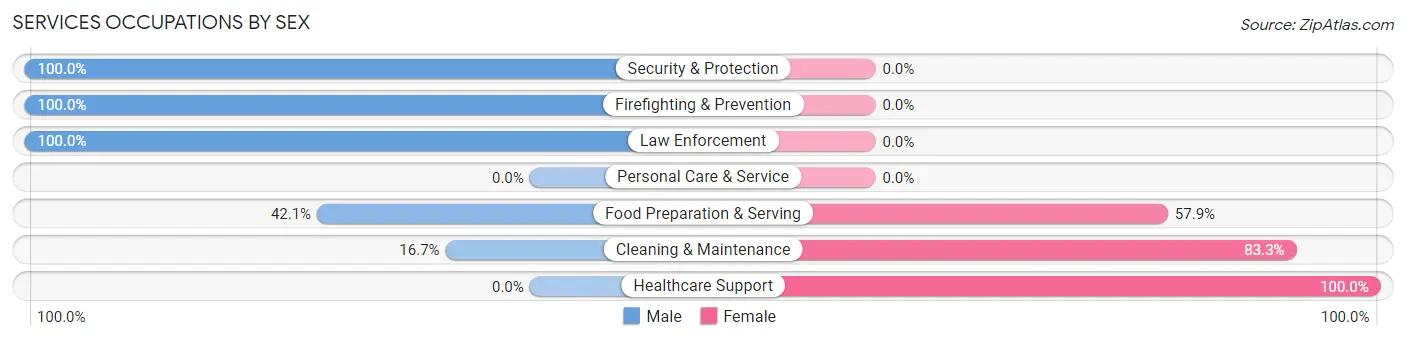
Services Occupations by Sex
Within the Services occupations in Ridgetop, the most male-oriented occupations are Security & Protection (100.0%), Firefighting & Prevention (100.0%), and Law Enforcement (100.0%), while the most female-oriented occupations are Healthcare Support (100.0%), Cleaning & Maintenance (83.3%), and Food Preparation & Serving (57.9%).
| Occupation | Male | Female |
| Healthcare Support | 0 (0.0%) | 8 (100.0%) |
| Security & Protection | 9 (100.0%) | 0 (0.0%) |
| Firefighting & Prevention | 8 (100.0%) | 0 (0.0%) |
| Law Enforcement | 1 (100.0%) | 0 (0.0%) |
| Food Preparation & Serving | 8 (42.1%) | 11 (57.9%) |
| Cleaning & Maintenance | 5 (16.7%) | 25 (83.3%) |
| Personal Care & Service | 0 (0.0%) | 0 (0.0%) |
| Total (Category) | 22 (33.3%) | 44 (66.7%) |
| Total (Overall) | 512 (50.5%) | 502 (49.5%) |
Sales and Office Occupations
The most common Sales and Office occupations in Ridgetop are Office & Administration (162 | 16.0%), and Sales & Related (53 | 5.2%).
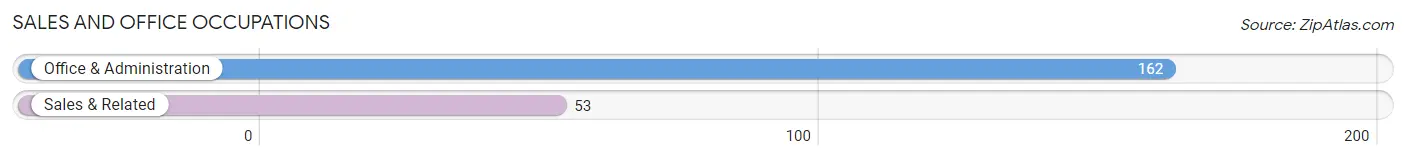
Sales and Office Occupations by Sex

| Occupation | Male | Female |
| Sales & Related | 39 (73.6%) | 14 (26.4%) |
| Office & Administration | 40 (24.7%) | 122 (75.3%) |
| Total (Category) | 79 (36.7%) | 136 (63.3%) |
| Total (Overall) | 512 (50.5%) | 502 (49.5%) |
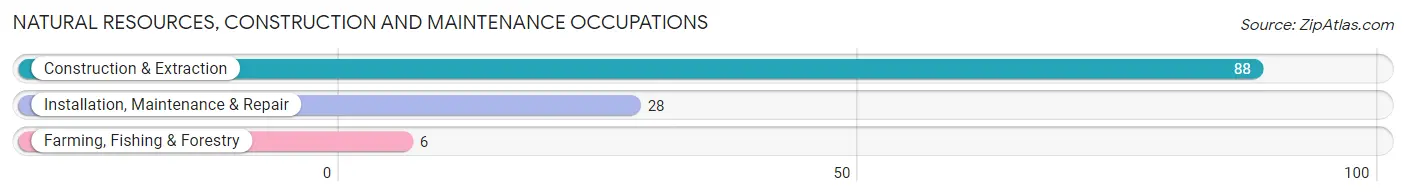
Natural Resources, Construction and Maintenance Occupations
The most common Natural Resources, Construction and Maintenance occupations in Ridgetop are Construction & Extraction (88 | 8.7%), Installation, Maintenance & Repair (28 | 2.8%), and Farming, Fishing & Forestry (6 | 0.6%).
Natural Resources, Construction and Maintenance Occupations by Sex
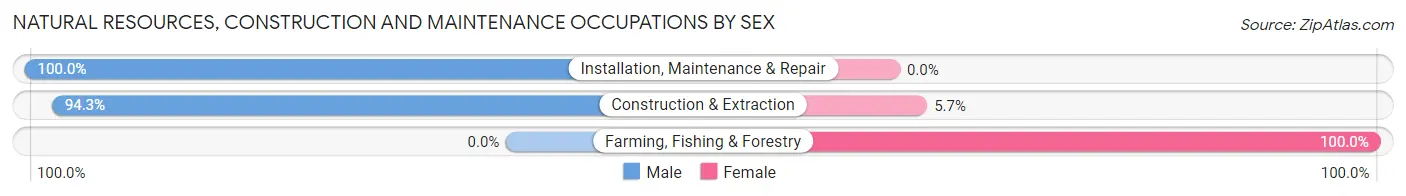
| Occupation | Male | Female |
| Farming, Fishing & Forestry | 0 (0.0%) | 6 (100.0%) |
| Construction & Extraction | 83 (94.3%) | 5 (5.7%) |
| Installation, Maintenance & Repair | 28 (100.0%) | 0 (0.0%) |
| Total (Category) | 111 (91.0%) | 11 (9.0%) |
| Total (Overall) | 512 (50.5%) | 502 (49.5%) |
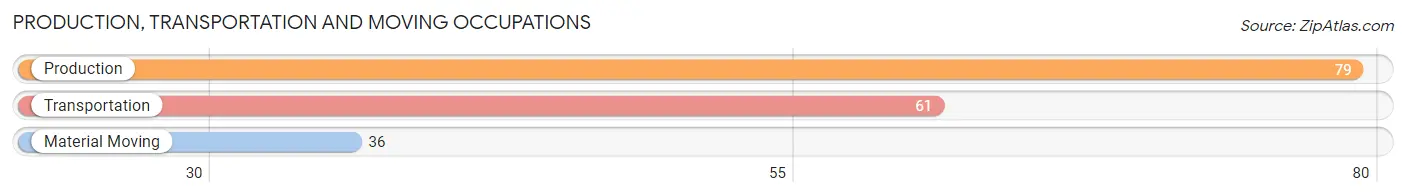
Production, Transportation and Moving Occupations
The most common Production, Transportation and Moving occupations in Ridgetop are Production (79 | 7.8%), Transportation (61 | 6.0%), and Material Moving (36 | 3.5%).
Production, Transportation and Moving Occupations by Sex
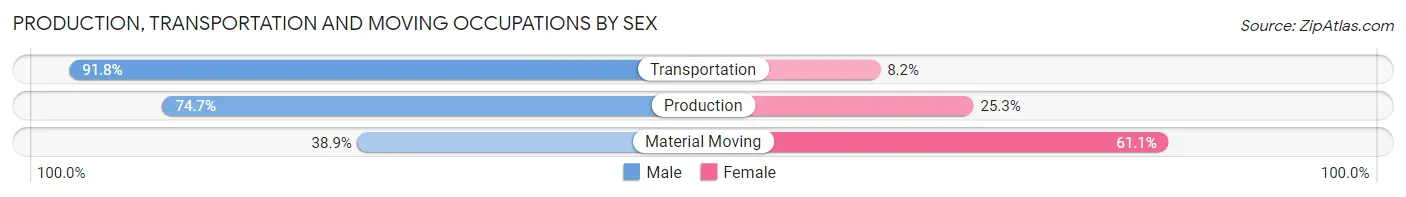
| Occupation | Male | Female |
| Production | 59 (74.7%) | 20 (25.3%) |
| Transportation | 56 (91.8%) | 5 (8.2%) |
| Material Moving | 14 (38.9%) | 22 (61.1%) |
| Total (Category) | 129 (73.3%) | 47 (26.7%) |
| Total (Overall) | 512 (50.5%) | 502 (49.5%) |
Employment Industries by Sex in Ridgetop
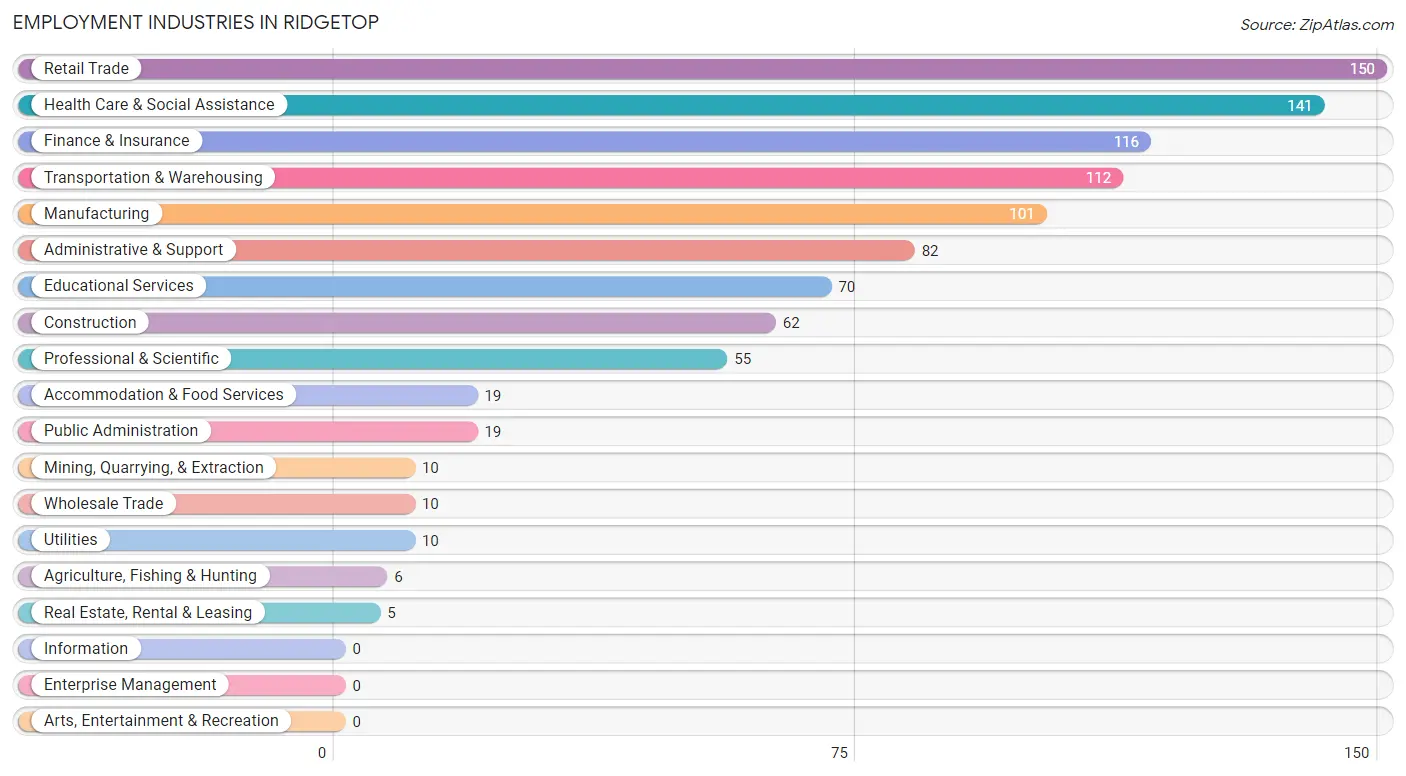
Employment Industries in Ridgetop
The major employment industries in Ridgetop include Retail Trade (150 | 14.8%), Health Care & Social Assistance (141 | 13.9%), Finance & Insurance (116 | 11.4%), Transportation & Warehousing (112 | 11.1%), and Manufacturing (101 | 10.0%).
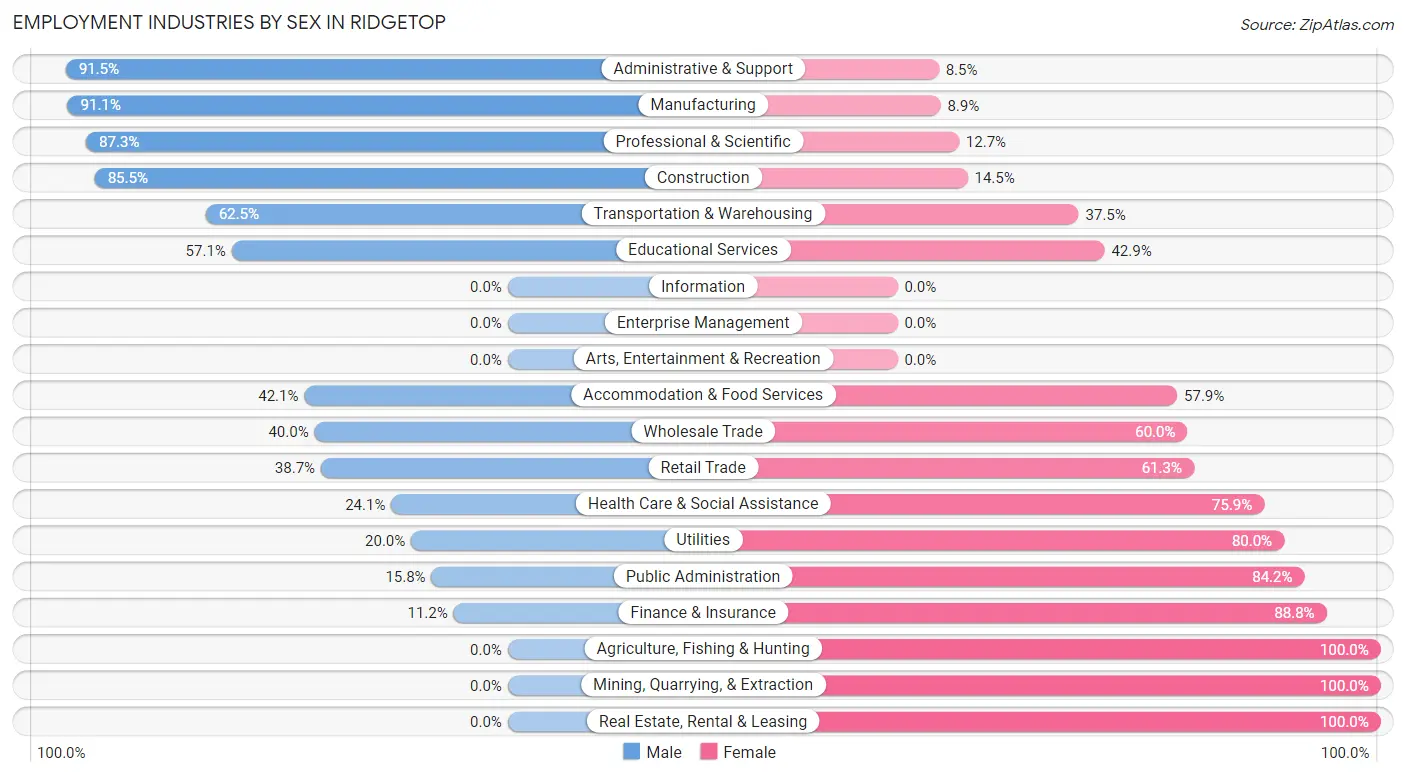
Employment Industries by Sex in Ridgetop
The Ridgetop industries that see more men than women are Administrative & Support (91.5%), Manufacturing (91.1%), and Professional & Scientific (87.3%), whereas the industries that tend to have a higher number of women are Agriculture, Fishing & Hunting (100.0%), Mining, Quarrying, & Extraction (100.0%), and Real Estate, Rental & Leasing (100.0%).
| Industry | Male | Female |
| Agriculture, Fishing & Hunting | 0 (0.0%) | 6 (100.0%) |
| Mining, Quarrying, & Extraction | 0 (0.0%) | 10 (100.0%) |
| Construction | 53 (85.5%) | 9 (14.5%) |
| Manufacturing | 92 (91.1%) | 9 (8.9%) |
| Wholesale Trade | 4 (40.0%) | 6 (60.0%) |
| Retail Trade | 58 (38.7%) | 92 (61.3%) |
| Transportation & Warehousing | 70 (62.5%) | 42 (37.5%) |
| Utilities | 2 (20.0%) | 8 (80.0%) |
| Information | 0 (0.0%) | 0 (0.0%) |
| Finance & Insurance | 13 (11.2%) | 103 (88.8%) |
| Real Estate, Rental & Leasing | 0 (0.0%) | 5 (100.0%) |
| Professional & Scientific | 48 (87.3%) | 7 (12.7%) |
| Enterprise Management | 0 (0.0%) | 0 (0.0%) |
| Administrative & Support | 75 (91.5%) | 7 (8.5%) |
| Educational Services | 40 (57.1%) | 30 (42.9%) |
| Health Care & Social Assistance | 34 (24.1%) | 107 (75.9%) |
| Arts, Entertainment & Recreation | 0 (0.0%) | 0 (0.0%) |
| Accommodation & Food Services | 8 (42.1%) | 11 (57.9%) |
| Public Administration | 3 (15.8%) | 16 (84.2%) |
| Total | 512 (50.5%) | 502 (49.5%) |
Education in Ridgetop
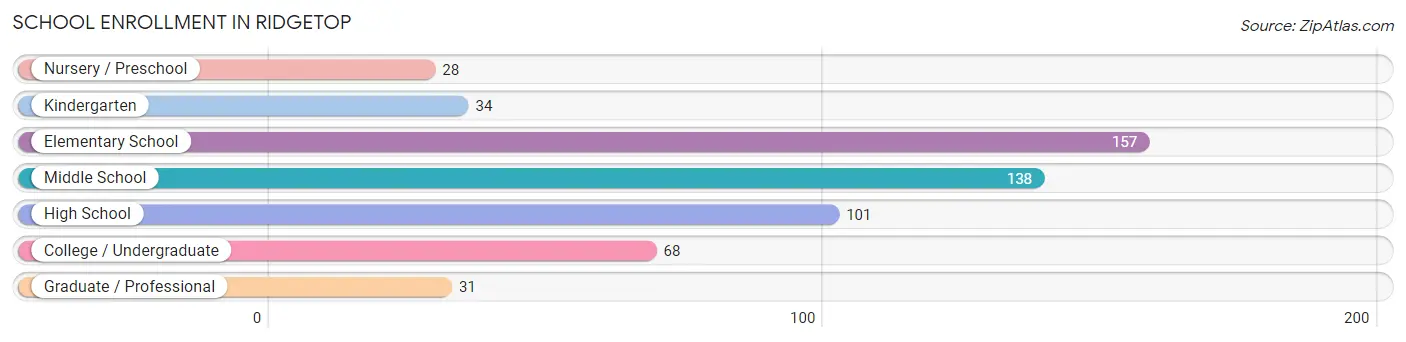
School Enrollment in Ridgetop
The most common levels of schooling among the 557 students in Ridgetop are elementary school (157 | 28.2%), middle school (138 | 24.8%), and high school (101 | 18.1%).
| School Level | # Students | % Students |
| Nursery / Preschool | 28 | 5.0% |
| Kindergarten | 34 | 6.1% |
| Elementary School | 157 | 28.2% |
| Middle School | 138 | 24.8% |
| High School | 101 | 18.1% |
| College / Undergraduate | 68 | 12.2% |
| Graduate / Professional | 31 | 5.6% |
| Total | 557 | 100.0% |
School Enrollment by Age by Funding Source in Ridgetop
Out of a total of 557 students who are enrolled in schools in Ridgetop, 103 (18.5%) attend a private institution, while the remaining 454 (81.5%) are enrolled in public schools. The age group of 25 to 34 year olds has the highest likelihood of being enrolled in private schools, with 20 (100.0% in the age bracket) enrolled. Conversely, the age group of 3 to 4 year olds has the lowest likelihood of being enrolled in a private school, with 8 (100.0% in the age bracket) attending a public institution.
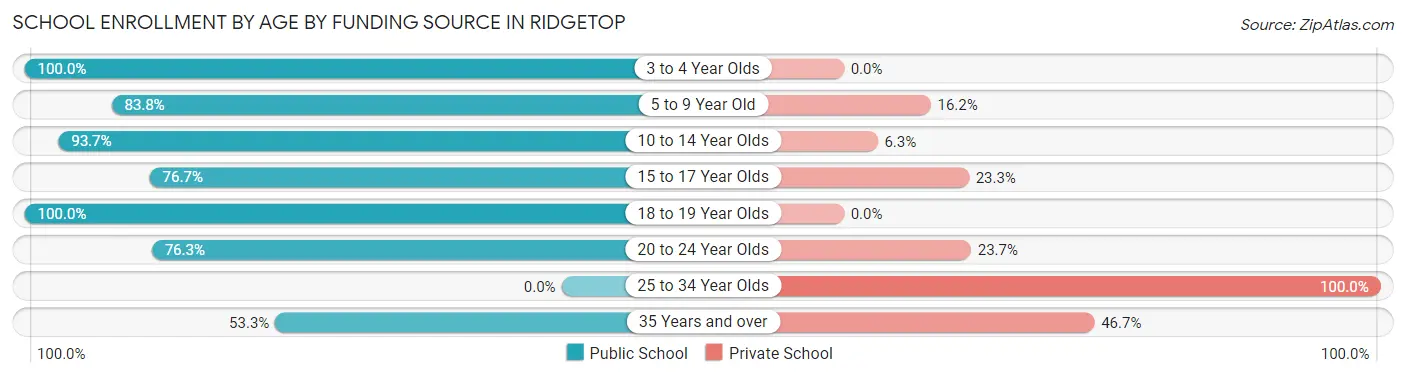
| Age Bracket | Public School | Private School |
| 3 to 4 Year Olds | 8 (100.0%) | 0 (0.0%) |
| 5 to 9 Year Old | 171 (83.8%) | 33 (16.2%) |
| 10 to 14 Year Olds | 149 (93.7%) | 10 (6.3%) |
| 15 to 17 Year Olds | 56 (76.7%) | 17 (23.3%) |
| 18 to 19 Year Olds | 25 (100.0%) | 0 (0.0%) |
| 20 to 24 Year Olds | 29 (76.3%) | 9 (23.7%) |
| 25 to 34 Year Olds | 0 (0.0%) | 20 (100.0%) |
| 35 Years and over | 16 (53.3%) | 14 (46.7%) |
| Total | 454 (81.5%) | 103 (18.5%) |
Educational Attainment by Field of Study in Ridgetop
Science & technology (101 | 23.2%), business (80 | 18.3%), engineering (51 | 11.7%), computers & mathematics (37 | 8.5%), and education (25 | 5.7%) are the most common fields of study among 436 individuals in Ridgetop who have obtained a bachelor's degree or higher.
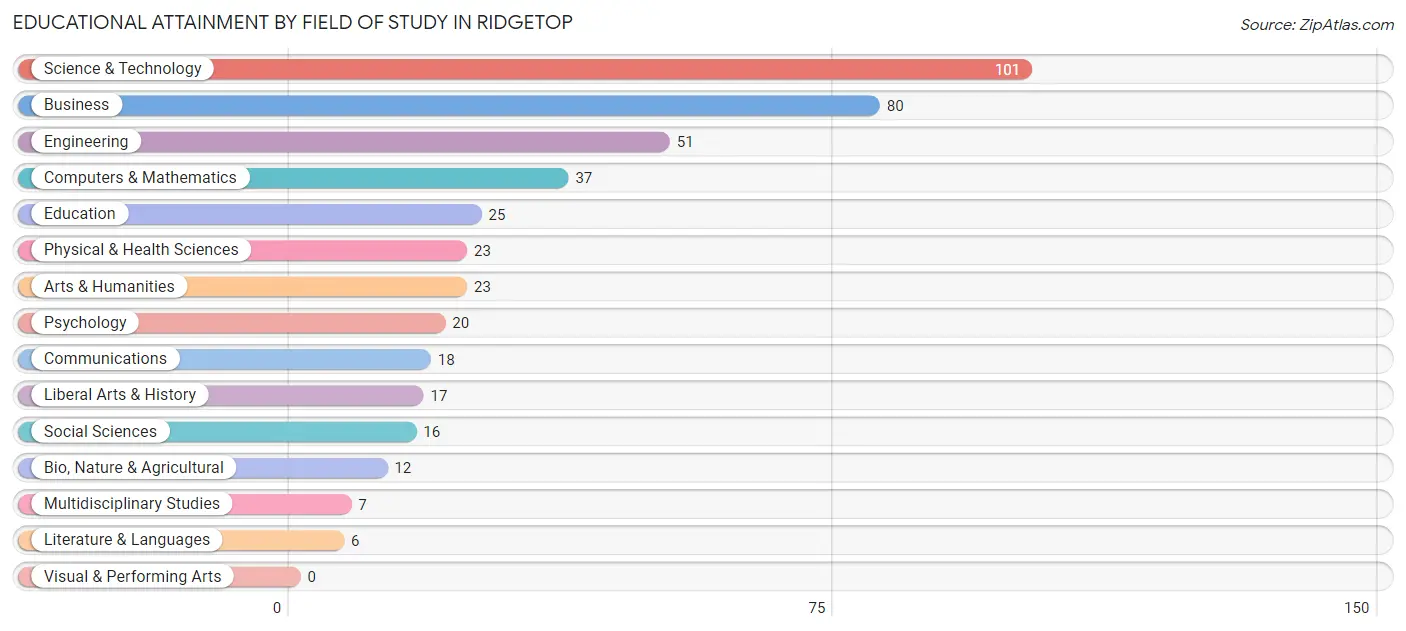
| Field of Study | # Graduates | % Graduates |
| Computers & Mathematics | 37 | 8.5% |
| Bio, Nature & Agricultural | 12 | 2.8% |
| Physical & Health Sciences | 23 | 5.3% |
| Psychology | 20 | 4.6% |
| Social Sciences | 16 | 3.7% |
| Engineering | 51 | 11.7% |
| Multidisciplinary Studies | 7 | 1.6% |
| Science & Technology | 101 | 23.2% |
| Business | 80 | 18.3% |
| Education | 25 | 5.7% |
| Literature & Languages | 6 | 1.4% |
| Liberal Arts & History | 17 | 3.9% |
| Visual & Performing Arts | 0 | 0.0% |
| Communications | 18 | 4.1% |
| Arts & Humanities | 23 | 5.3% |
| Total | 436 | 100.0% |
Transportation & Commute in Ridgetop
Vehicle Availability by Sex in Ridgetop
The most prevalent vehicle ownership categories in Ridgetop are males with 2 vehicles (232, accounting for 45.3%) and females with 2 vehicles (172, making up 50.7%).
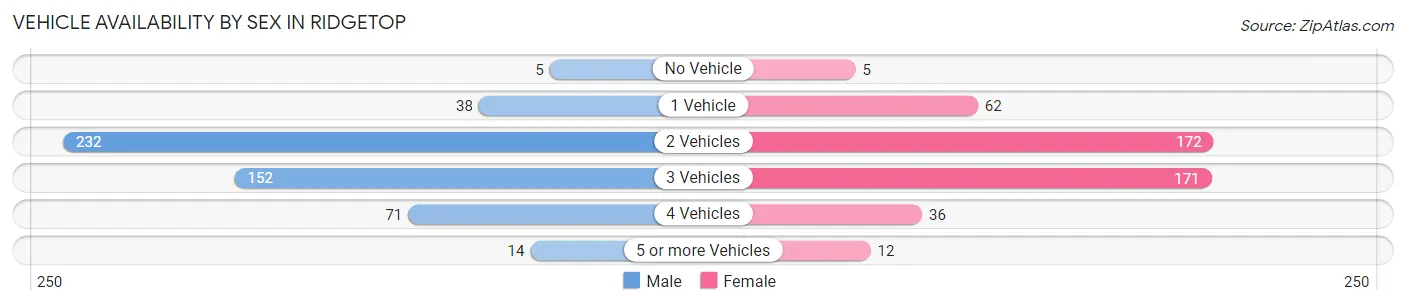
| Vehicles Available | Male | Female |
| No Vehicle | 5 (1.0%) | 5 (1.1%) |
| 1 Vehicle | 38 (7.4%) | 62 (13.5%) |
| 2 Vehicles | 232 (45.3%) | 172 (37.6%) |
| 3 Vehicles | 152 (29.7%) | 171 (37.3%) |
| 4 Vehicles | 71 (13.9%) | 36 (7.9%) |
| 5 or more Vehicles | 14 (2.7%) | 12 (2.6%) |
| Total | 512 (100.0%) | 458 (100.0%) |
Commute Time in Ridgetop
The most frequently occuring commute durations in Ridgetop are 30 to 34 minutes (205 commuters, 24.1%), 20 to 24 minutes (174 commuters, 20.4%), and 45 to 59 minutes (96 commuters, 11.3%).
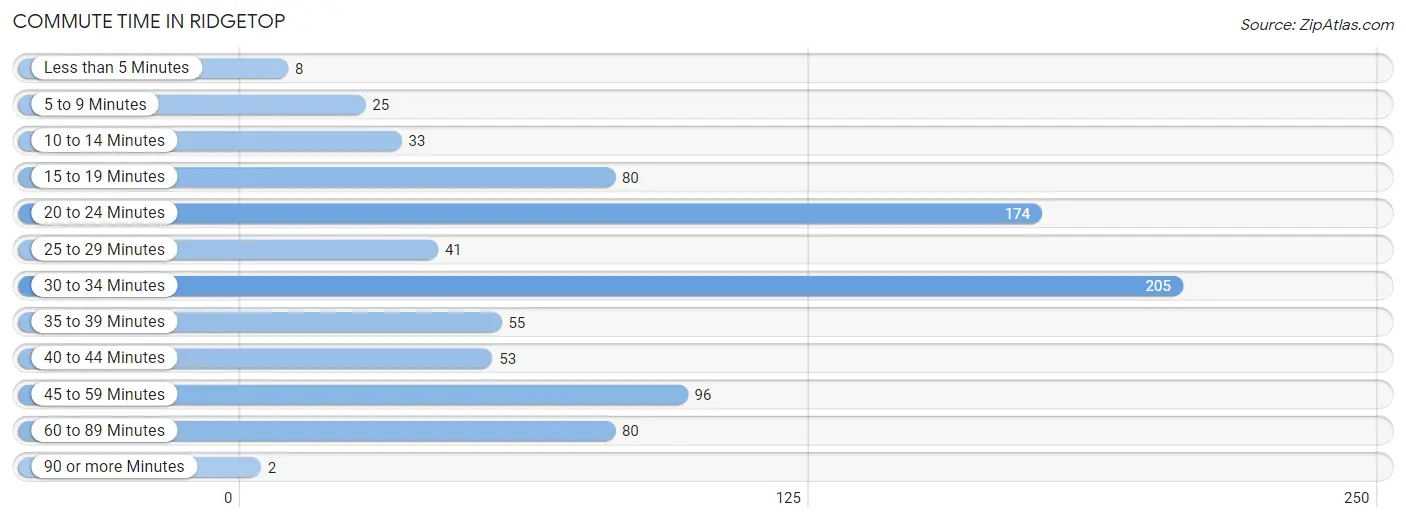
| Commute Time | # Commuters | % Commuters |
| Less than 5 Minutes | 8 | 0.9% |
| 5 to 9 Minutes | 25 | 2.9% |
| 10 to 14 Minutes | 33 | 3.9% |
| 15 to 19 Minutes | 80 | 9.4% |
| 20 to 24 Minutes | 174 | 20.4% |
| 25 to 29 Minutes | 41 | 4.8% |
| 30 to 34 Minutes | 205 | 24.1% |
| 35 to 39 Minutes | 55 | 6.5% |
| 40 to 44 Minutes | 53 | 6.2% |
| 45 to 59 Minutes | 96 | 11.3% |
| 60 to 89 Minutes | 80 | 9.4% |
| 90 or more Minutes | 2 | 0.2% |
Commute Time by Sex in Ridgetop
The most common commute times in Ridgetop are 20 to 24 minutes (124 commuters, 27.9%) for males and 30 to 34 minutes (91 commuters, 22.3%) for females.
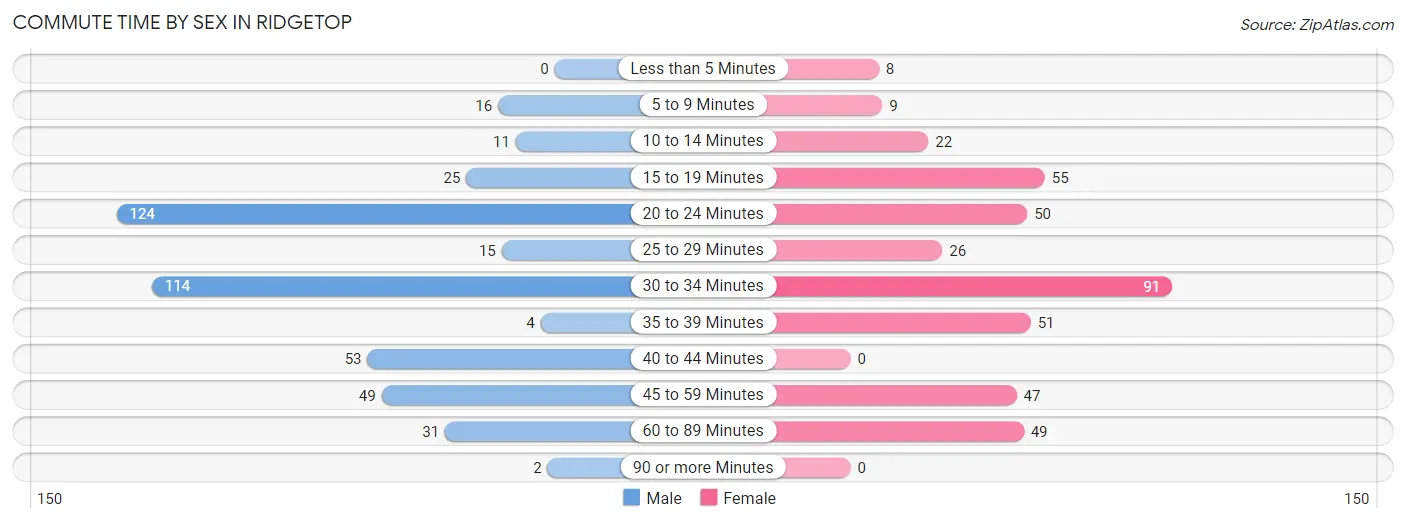
| Commute Time | Male | Female |
| Less than 5 Minutes | 0 (0.0%) | 8 (2.0%) |
| 5 to 9 Minutes | 16 (3.6%) | 9 (2.2%) |
| 10 to 14 Minutes | 11 (2.5%) | 22 (5.4%) |
| 15 to 19 Minutes | 25 (5.6%) | 55 (13.5%) |
| 20 to 24 Minutes | 124 (27.9%) | 50 (12.2%) |
| 25 to 29 Minutes | 15 (3.4%) | 26 (6.4%) |
| 30 to 34 Minutes | 114 (25.7%) | 91 (22.3%) |
| 35 to 39 Minutes | 4 (0.9%) | 51 (12.5%) |
| 40 to 44 Minutes | 53 (11.9%) | 0 (0.0%) |
| 45 to 59 Minutes | 49 (11.0%) | 47 (11.5%) |
| 60 to 89 Minutes | 31 (7.0%) | 49 (12.0%) |
| 90 or more Minutes | 2 (0.4%) | 0 (0.0%) |
Time of Departure to Work by Sex in Ridgetop
The most frequent times of departure to work in Ridgetop are 5:00 AM to 5:29 AM (81, 18.2%) for males and 7:00 AM to 7:29 AM (69, 16.9%) for females.
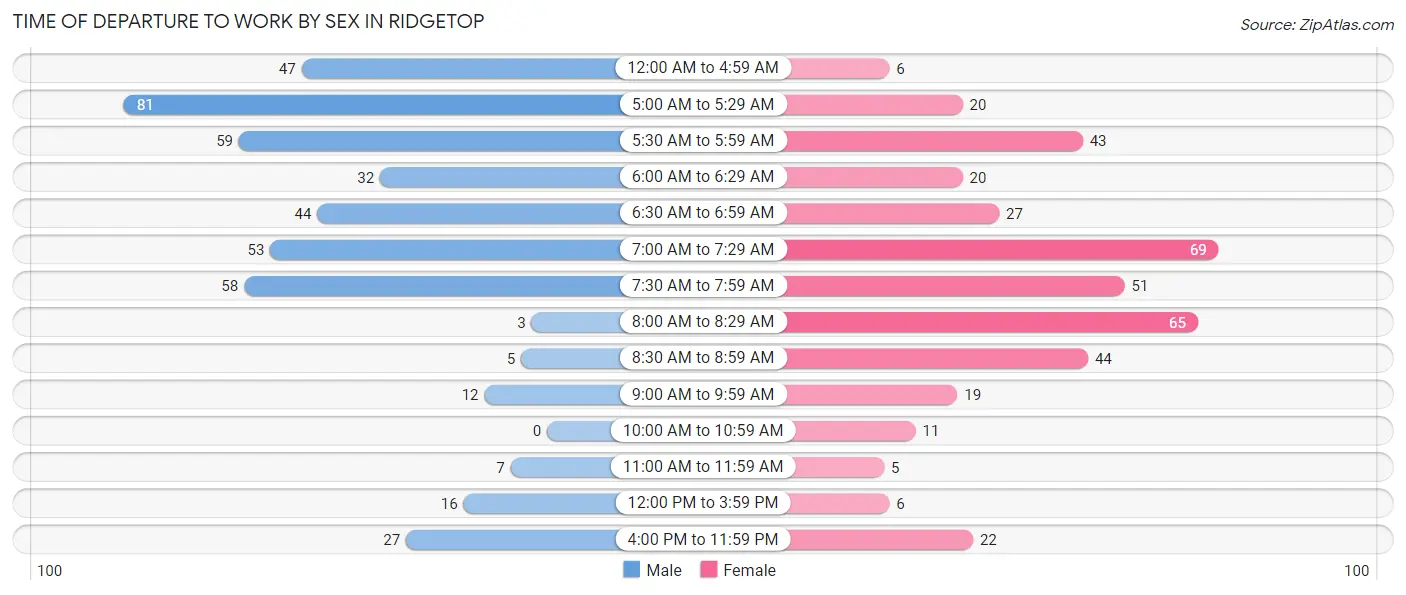
| Time of Departure | Male | Female |
| 12:00 AM to 4:59 AM | 47 (10.6%) | 6 (1.5%) |
| 5:00 AM to 5:29 AM | 81 (18.2%) | 20 (4.9%) |
| 5:30 AM to 5:59 AM | 59 (13.3%) | 43 (10.5%) |
| 6:00 AM to 6:29 AM | 32 (7.2%) | 20 (4.9%) |
| 6:30 AM to 6:59 AM | 44 (9.9%) | 27 (6.6%) |
| 7:00 AM to 7:29 AM | 53 (11.9%) | 69 (16.9%) |
| 7:30 AM to 7:59 AM | 58 (13.1%) | 51 (12.5%) |
| 8:00 AM to 8:29 AM | 3 (0.7%) | 65 (15.9%) |
| 8:30 AM to 8:59 AM | 5 (1.1%) | 44 (10.8%) |
| 9:00 AM to 9:59 AM | 12 (2.7%) | 19 (4.7%) |
| 10:00 AM to 10:59 AM | 0 (0.0%) | 11 (2.7%) |
| 11:00 AM to 11:59 AM | 7 (1.6%) | 5 (1.2%) |
| 12:00 PM to 3:59 PM | 16 (3.6%) | 6 (1.5%) |
| 4:00 PM to 11:59 PM | 27 (6.1%) | 22 (5.4%) |
| Total | 444 (100.0%) | 408 (100.0%) |
Housing Occupancy in Ridgetop
Occupancy by Ownership in Ridgetop
Of the total 859 dwellings in Ridgetop, owner-occupied units account for 710 (82.7%), while renter-occupied units make up 149 (17.3%).
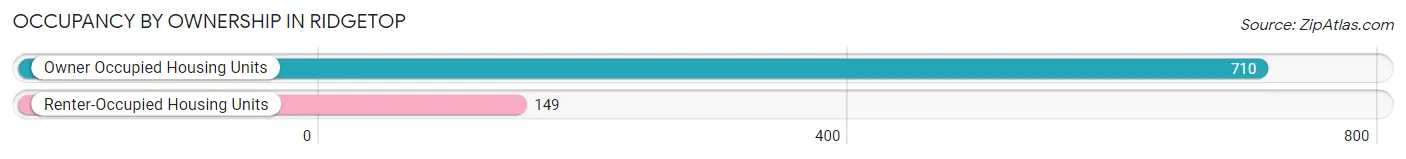
| Occupancy | # Housing Units | % Housing Units |
| Owner Occupied Housing Units | 710 | 82.7% |
| Renter-Occupied Housing Units | 149 | 17.3% |
| Total Occupied Housing Units | 859 | 100.0% |
Occupancy by Household Size in Ridgetop
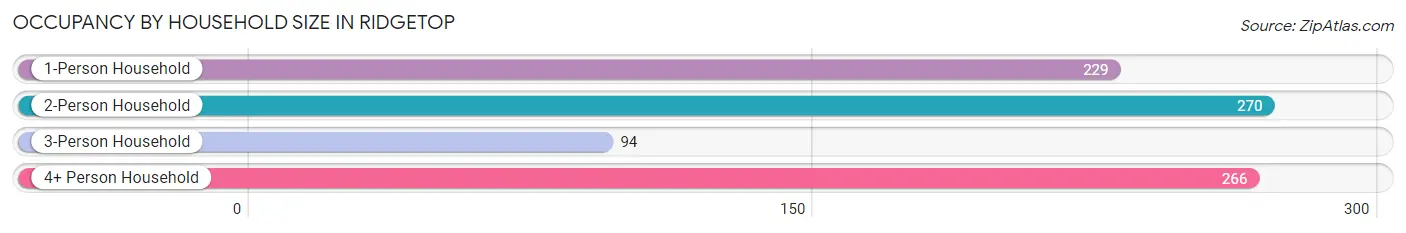
| Household Size | # Housing Units | % Housing Units |
| 1-Person Household | 229 | 26.7% |
| 2-Person Household | 270 | 31.4% |
| 3-Person Household | 94 | 10.9% |
| 4+ Person Household | 266 | 31.0% |
| Total Housing Units | 859 | 100.0% |
Occupancy by Ownership by Household Size in Ridgetop
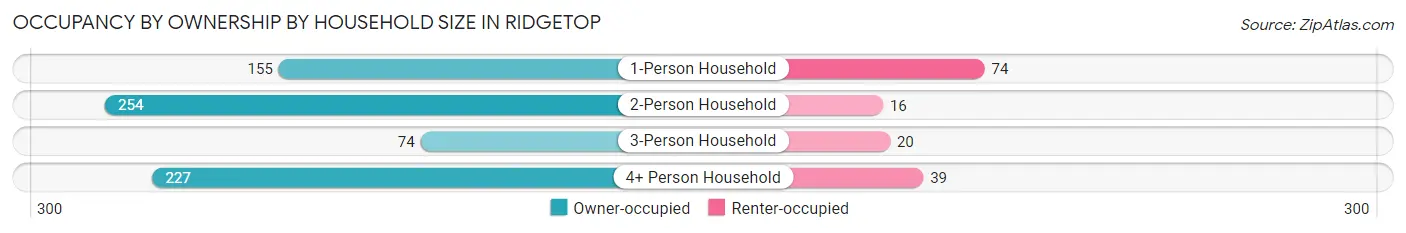
| Household Size | Owner-occupied | Renter-occupied |
| 1-Person Household | 155 (67.7%) | 74 (32.3%) |
| 2-Person Household | 254 (94.1%) | 16 (5.9%) |
| 3-Person Household | 74 (78.7%) | 20 (21.3%) |
| 4+ Person Household | 227 (85.3%) | 39 (14.7%) |
| Total Housing Units | 710 (82.7%) | 149 (17.3%) |
Occupancy by Educational Attainment in Ridgetop
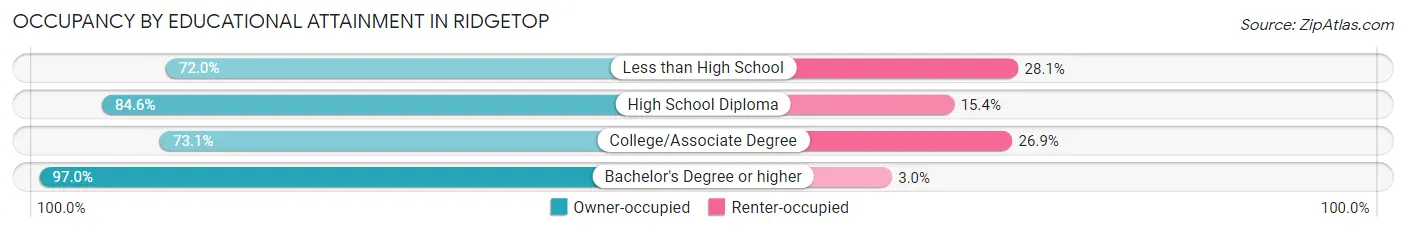
| Household Size | Owner-occupied | Renter-occupied |
| Less than High School | 59 (72.0%) | 23 (28.1%) |
| High School Diploma | 198 (84.6%) | 36 (15.4%) |
| College/Associate Degree | 226 (73.1%) | 83 (26.9%) |
| Bachelor's Degree or higher | 227 (97.0%) | 7 (3.0%) |
Occupancy by Age of Householder in Ridgetop
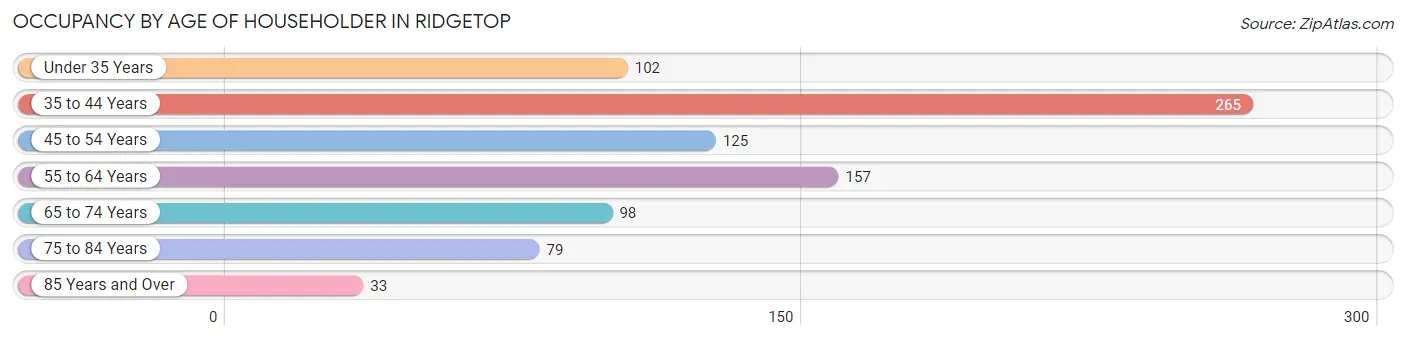
| Age Bracket | # Households | % Households |
| Under 35 Years | 102 | 11.9% |
| 35 to 44 Years | 265 | 30.8% |
| 45 to 54 Years | 125 | 14.5% |
| 55 to 64 Years | 157 | 18.3% |
| 65 to 74 Years | 98 | 11.4% |
| 75 to 84 Years | 79 | 9.2% |
| 85 Years and Over | 33 | 3.8% |
| Total | 859 | 100.0% |
Housing Finances in Ridgetop
Median Income by Occupancy in Ridgetop
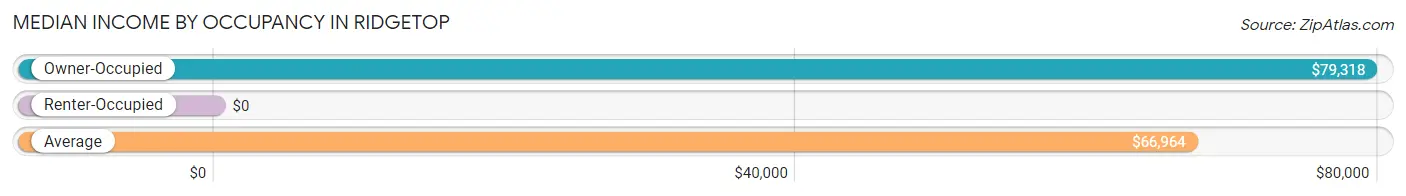
| Occupancy Type | # Households | Median Income |
| Owner-Occupied | 710 (82.7%) | $79,318 |
| Renter-Occupied | 149 (17.3%) | $0 |
| Average | 859 (100.0%) | $66,964 |
Occupancy by Householder Income Bracket in Ridgetop
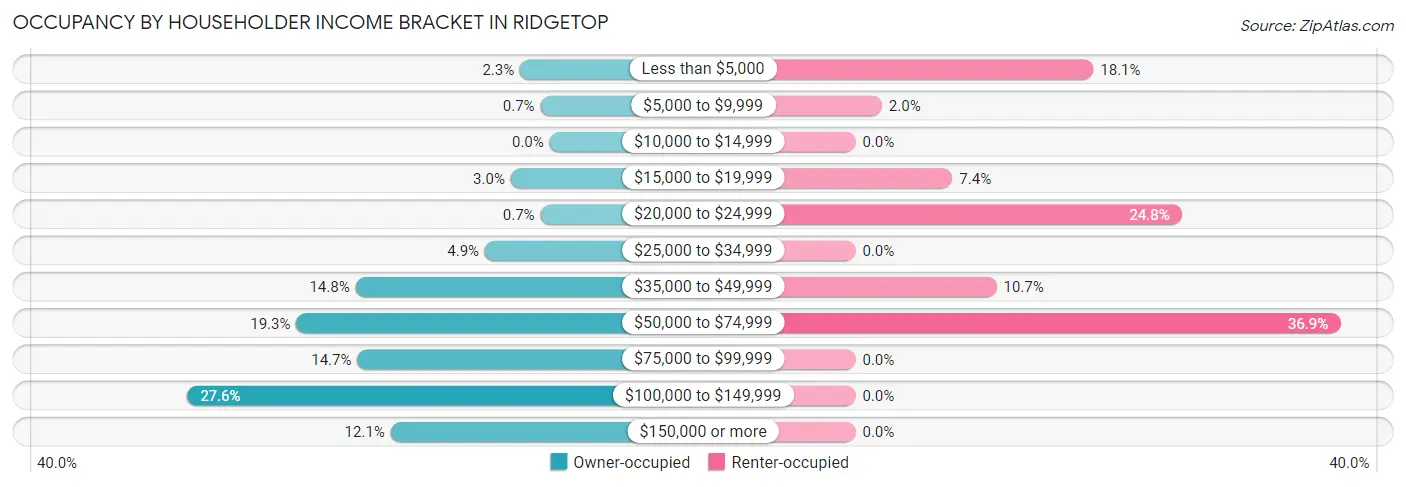
| Income Bracket | Owner-occupied | Renter-occupied |
| Less than $5,000 | 16 (2.2%) | 27 (18.1%) |
| $5,000 to $9,999 | 5 (0.7%) | 3 (2.0%) |
| $10,000 to $14,999 | 0 (0.0%) | 0 (0.0%) |
| $15,000 to $19,999 | 21 (3.0%) | 11 (7.4%) |
| $20,000 to $24,999 | 5 (0.7%) | 37 (24.8%) |
| $25,000 to $34,999 | 35 (4.9%) | 0 (0.0%) |
| $35,000 to $49,999 | 105 (14.8%) | 16 (10.7%) |
| $50,000 to $74,999 | 137 (19.3%) | 55 (36.9%) |
| $75,000 to $99,999 | 104 (14.6%) | 0 (0.0%) |
| $100,000 to $149,999 | 196 (27.6%) | 0 (0.0%) |
| $150,000 or more | 86 (12.1%) | 0 (0.0%) |
| Total | 710 (100.0%) | 149 (100.0%) |
Monthly Housing Cost Tiers in Ridgetop
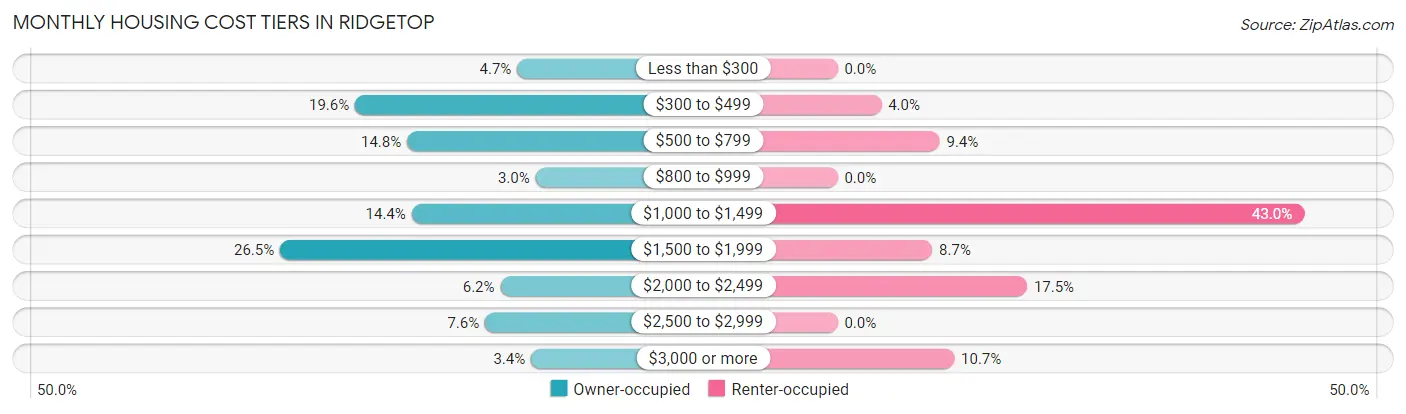
| Monthly Cost | Owner-occupied | Renter-occupied |
| Less than $300 | 33 (4.6%) | 0 (0.0%) |
| $300 to $499 | 139 (19.6%) | 6 (4.0%) |
| $500 to $799 | 105 (14.8%) | 14 (9.4%) |
| $800 to $999 | 21 (3.0%) | 0 (0.0%) |
| $1,000 to $1,499 | 102 (14.4%) | 64 (42.9%) |
| $1,500 to $1,999 | 188 (26.5%) | 13 (8.7%) |
| $2,000 to $2,499 | 44 (6.2%) | 26 (17.4%) |
| $2,500 to $2,999 | 54 (7.6%) | 0 (0.0%) |
| $3,000 or more | 24 (3.4%) | 16 (10.7%) |
| Total | 710 (100.0%) | 149 (100.0%) |
Physical Housing Characteristics in Ridgetop
Housing Structures in Ridgetop
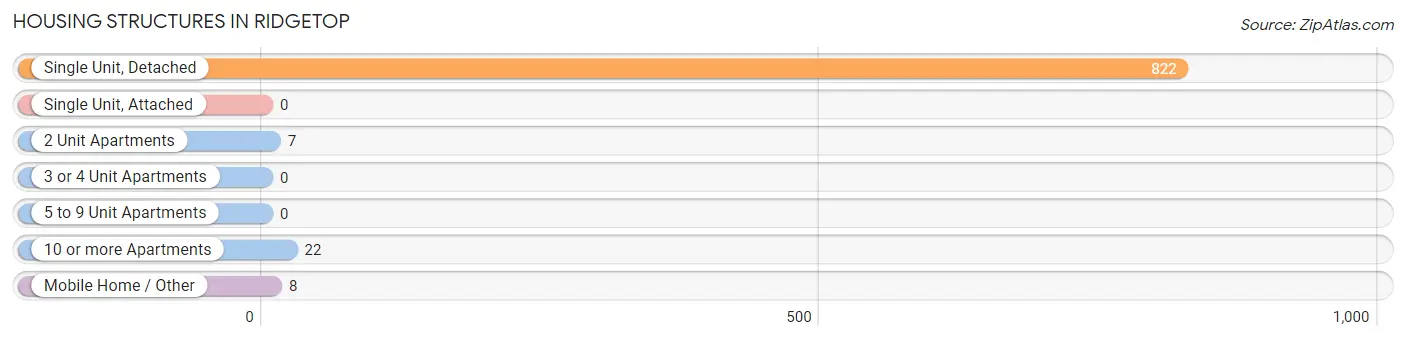
| Structure Type | # Housing Units | % Housing Units |
| Single Unit, Detached | 822 | 95.7% |
| Single Unit, Attached | 0 | 0.0% |
| 2 Unit Apartments | 7 | 0.8% |
| 3 or 4 Unit Apartments | 0 | 0.0% |
| 5 to 9 Unit Apartments | 0 | 0.0% |
| 10 or more Apartments | 22 | 2.6% |
| Mobile Home / Other | 8 | 0.9% |
| Total | 859 | 100.0% |
Housing Structures by Occupancy in Ridgetop
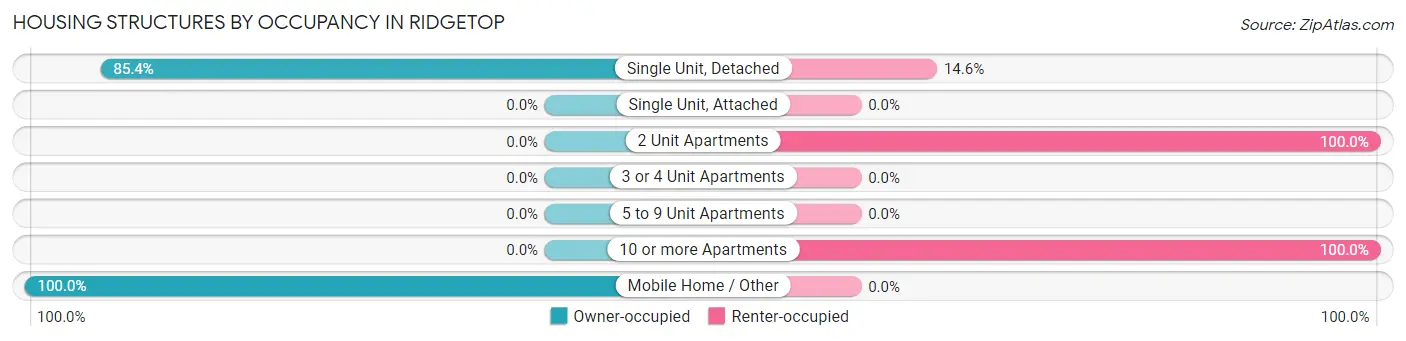
| Structure Type | Owner-occupied | Renter-occupied |
| Single Unit, Detached | 702 (85.4%) | 120 (14.6%) |
| Single Unit, Attached | 0 (0.0%) | 0 (0.0%) |
| 2 Unit Apartments | 0 (0.0%) | 7 (100.0%) |
| 3 or 4 Unit Apartments | 0 (0.0%) | 0 (0.0%) |
| 5 to 9 Unit Apartments | 0 (0.0%) | 0 (0.0%) |
| 10 or more Apartments | 0 (0.0%) | 22 (100.0%) |
| Mobile Home / Other | 8 (100.0%) | 0 (0.0%) |
| Total | 710 (82.7%) | 149 (17.3%) |
Housing Structures by Number of Rooms in Ridgetop
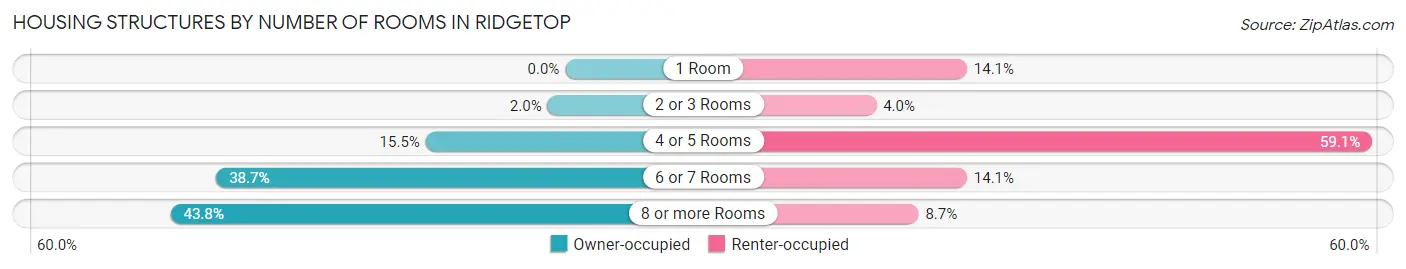
| Number of Rooms | Owner-occupied | Renter-occupied |
| 1 Room | 0 (0.0%) | 21 (14.1%) |
| 2 or 3 Rooms | 14 (2.0%) | 6 (4.0%) |
| 4 or 5 Rooms | 110 (15.5%) | 88 (59.1%) |
| 6 or 7 Rooms | 275 (38.7%) | 21 (14.1%) |
| 8 or more Rooms | 311 (43.8%) | 13 (8.7%) |
| Total | 710 (100.0%) | 149 (100.0%) |
Housing Structure by Heating Type in Ridgetop
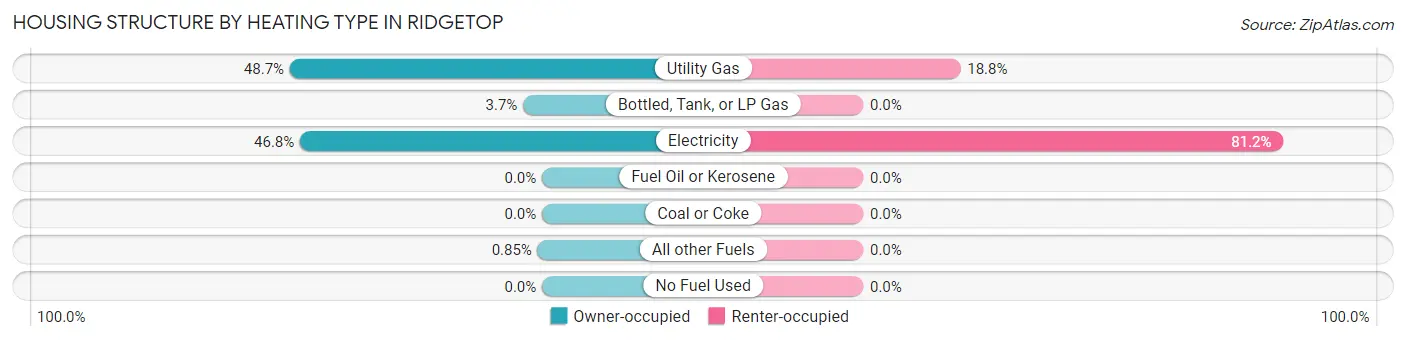
| Heating Type | Owner-occupied | Renter-occupied |
| Utility Gas | 346 (48.7%) | 28 (18.8%) |
| Bottled, Tank, or LP Gas | 26 (3.7%) | 0 (0.0%) |
| Electricity | 332 (46.8%) | 121 (81.2%) |
| Fuel Oil or Kerosene | 0 (0.0%) | 0 (0.0%) |
| Coal or Coke | 0 (0.0%) | 0 (0.0%) |
| All other Fuels | 6 (0.9%) | 0 (0.0%) |
| No Fuel Used | 0 (0.0%) | 0 (0.0%) |
| Total | 710 (100.0%) | 149 (100.0%) |
Household Vehicle Usage in Ridgetop
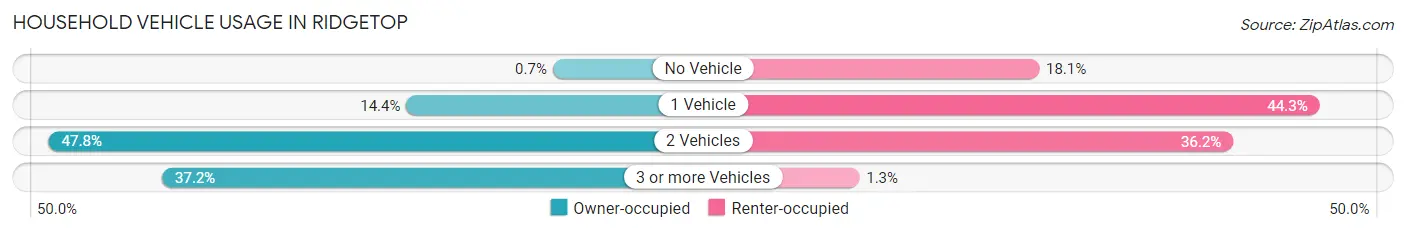
| Vehicles per Household | Owner-occupied | Renter-occupied |
| No Vehicle | 5 (0.7%) | 27 (18.1%) |
| 1 Vehicle | 102 (14.4%) | 66 (44.3%) |
| 2 Vehicles | 339 (47.7%) | 54 (36.2%) |
| 3 or more Vehicles | 264 (37.2%) | 2 (1.3%) |
| Total | 710 (100.0%) | 149 (100.0%) |
Real Estate & Mortgages in Ridgetop
Real Estate and Mortgage Overview in Ridgetop
| Characteristic | Without Mortgage | With Mortgage |
| Housing Units | 261 | 449 |
| Median Property Value | $222,500 | $303,300 |
| Median Household Income | $54,250 | $78 |
| Monthly Housing Costs | $435 | $24 |
| Real Estate Taxes | $1,407 | $4 |
Property Value by Mortgage Status in Ridgetop
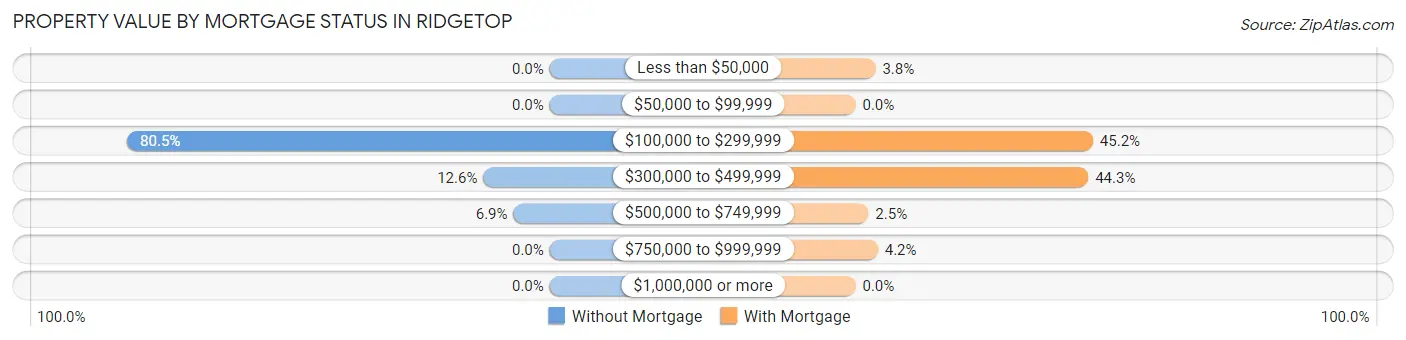
| Property Value | Without Mortgage | With Mortgage |
| Less than $50,000 | 0 (0.0%) | 17 (3.8%) |
| $50,000 to $99,999 | 0 (0.0%) | 0 (0.0%) |
| $100,000 to $299,999 | 210 (80.5%) | 203 (45.2%) |
| $300,000 to $499,999 | 33 (12.6%) | 199 (44.3%) |
| $500,000 to $749,999 | 18 (6.9%) | 11 (2.5%) |
| $750,000 to $999,999 | 0 (0.0%) | 19 (4.2%) |
| $1,000,000 or more | 0 (0.0%) | 0 (0.0%) |
| Total | 261 (100.0%) | 449 (100.0%) |
Household Income by Mortgage Status in Ridgetop

| Household Income | Without Mortgage | With Mortgage |
| Less than $10,000 | 9 (3.5%) | 13 (2.9%) |
| $10,000 to $24,999 | 26 (10.0%) | 12 (2.7%) |
| $25,000 to $34,999 | 32 (12.3%) | 0 (0.0%) |
| $35,000 to $49,999 | 40 (15.3%) | 3 (0.7%) |
| $50,000 to $74,999 | 51 (19.5%) | 65 (14.5%) |
| $75,000 to $99,999 | 47 (18.0%) | 86 (19.2%) |
| $100,000 to $149,999 | 48 (18.4%) | 57 (12.7%) |
| $150,000 or more | 8 (3.1%) | 148 (33.0%) |
| Total | 261 (100.0%) | 449 (100.0%) |
Property Value to Household Income Ratio in Ridgetop
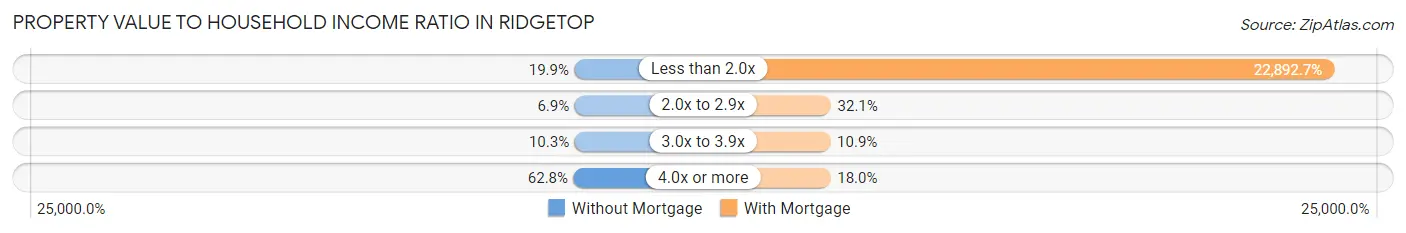
| Value-to-Income Ratio | Without Mortgage | With Mortgage |
| Less than 2.0x | 52 (19.9%) | 102,788 (22,892.7%) |
| 2.0x to 2.9x | 18 (6.9%) | 144 (32.1%) |
| 3.0x to 3.9x | 27 (10.3%) | 49 (10.9%) |
| 4.0x or more | 164 (62.8%) | 81 (18.0%) |
| Total | 261 (100.0%) | 449 (100.0%) |
Real Estate Taxes by Mortgage Status in Ridgetop
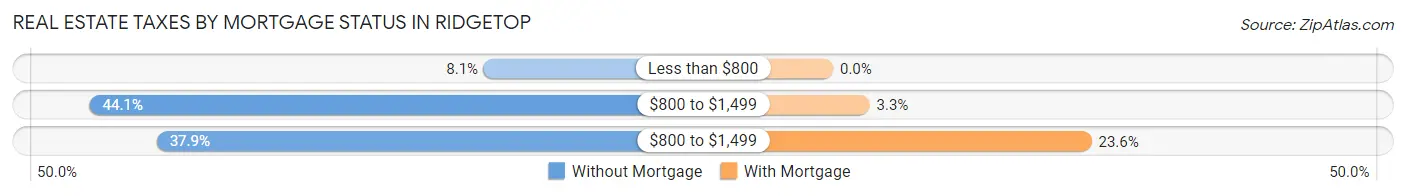
| Property Taxes | Without Mortgage | With Mortgage |
| Less than $800 | 21 (8.1%) | 0 (0.0%) |
| $800 to $1,499 | 115 (44.1%) | 15 (3.3%) |
| $800 to $1,499 | 99 (37.9%) | 106 (23.6%) |
| Total | 261 (100.0%) | 449 (100.0%) |
Health & Disability in Ridgetop
Health Insurance Coverage by Age in Ridgetop
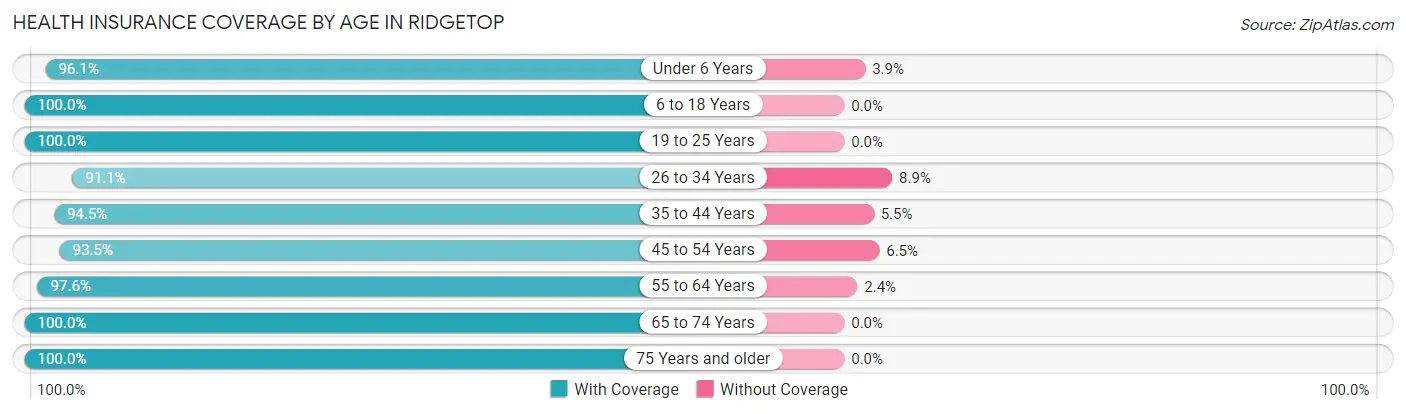
| Age Bracket | With Coverage | Without Coverage |
| Under 6 Years | 271 (96.1%) | 11 (3.9%) |
| 6 to 18 Years | 415 (100.0%) | 0 (0.0%) |
| 19 to 25 Years | 149 (100.0%) | 0 (0.0%) |
| 26 to 34 Years | 194 (91.1%) | 19 (8.9%) |
| 35 to 44 Years | 397 (94.5%) | 23 (5.5%) |
| 45 to 54 Years | 229 (93.5%) | 16 (6.5%) |
| 55 to 64 Years | 280 (97.6%) | 7 (2.4%) |
| 65 to 74 Years | 154 (100.0%) | 0 (0.0%) |
| 75 Years and older | 177 (100.0%) | 0 (0.0%) |
| Total | 2,266 (96.8%) | 76 (3.3%) |
Health Insurance Coverage by Citizenship Status in Ridgetop
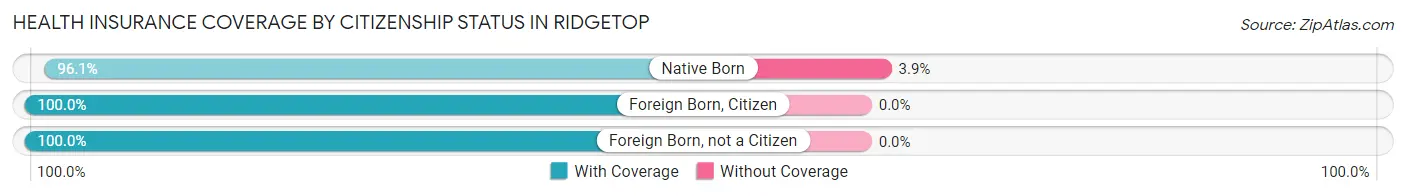
| Citizenship Status | With Coverage | Without Coverage |
| Native Born | 271 (96.1%) | 11 (3.9%) |
| Foreign Born, Citizen | 415 (100.0%) | 0 (0.0%) |
| Foreign Born, not a Citizen | 149 (100.0%) | 0 (0.0%) |
Health Insurance Coverage by Household Income in Ridgetop
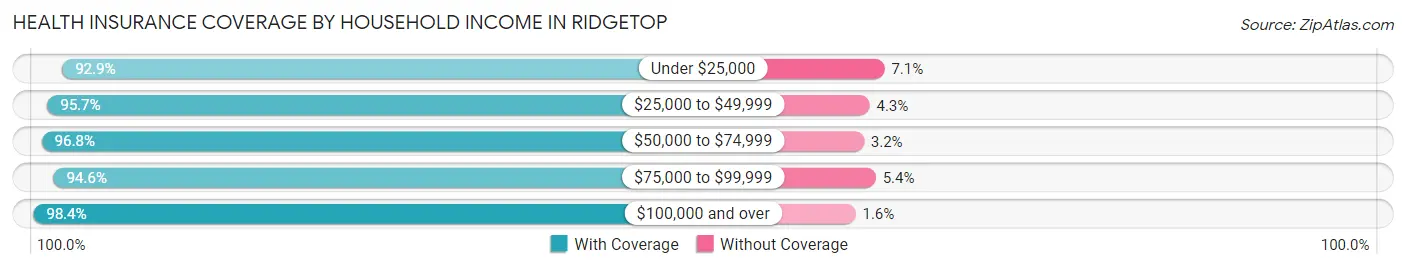
| Household Income | With Coverage | Without Coverage |
| Under $25,000 | 158 (92.9%) | 12 (7.1%) |
| $25,000 to $49,999 | 292 (95.7%) | 13 (4.3%) |
| $50,000 to $74,999 | 576 (96.8%) | 19 (3.2%) |
| $75,000 to $99,999 | 279 (94.6%) | 16 (5.4%) |
| $100,000 and over | 957 (98.4%) | 16 (1.6%) |
Public vs Private Health Insurance Coverage by Age in Ridgetop
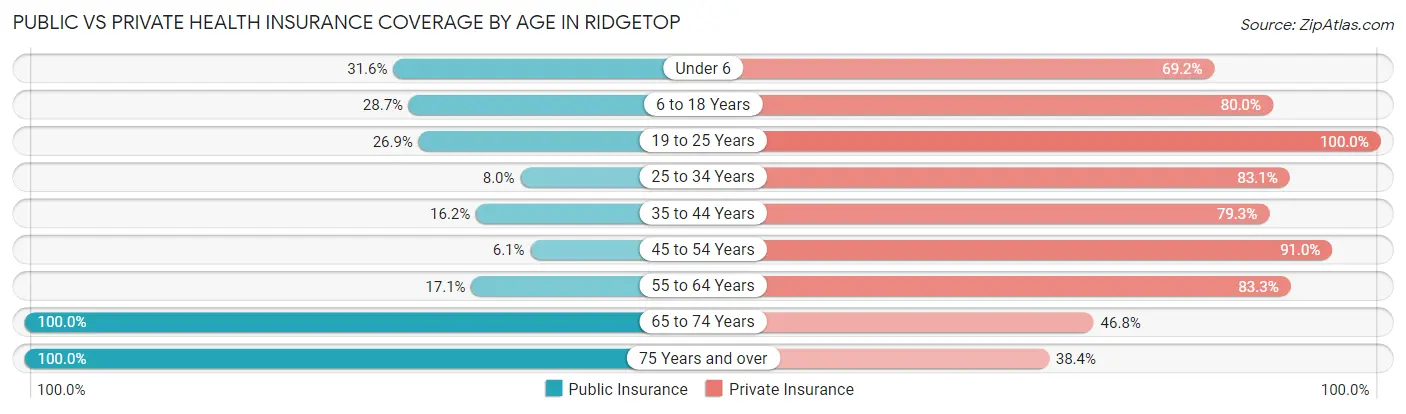
| Age Bracket | Public Insurance | Private Insurance |
| Under 6 | 89 (31.6%) | 195 (69.2%) |
| 6 to 18 Years | 119 (28.7%) | 332 (80.0%) |
| 19 to 25 Years | 40 (26.9%) | 149 (100.0%) |
| 25 to 34 Years | 17 (8.0%) | 177 (83.1%) |
| 35 to 44 Years | 68 (16.2%) | 333 (79.3%) |
| 45 to 54 Years | 15 (6.1%) | 223 (91.0%) |
| 55 to 64 Years | 49 (17.1%) | 239 (83.3%) |
| 65 to 74 Years | 154 (100.0%) | 72 (46.8%) |
| 75 Years and over | 177 (100.0%) | 68 (38.4%) |
| Total | 728 (31.1%) | 1,788 (76.3%) |
Disability Status by Sex by Age in Ridgetop
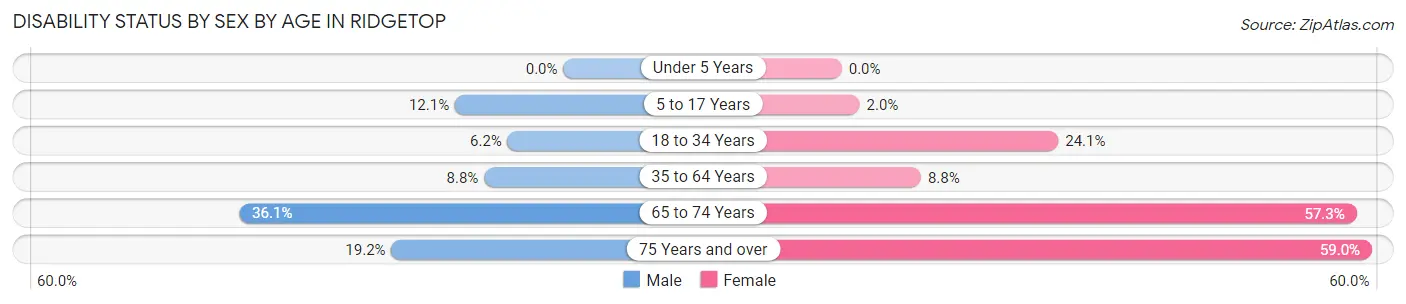
| Age Bracket | Male | Female |
| Under 5 Years | 0 (0.0%) | 0 (0.0%) |
| 5 to 17 Years | 28 (12.1%) | 5 (2.0%) |
| 18 to 34 Years | 8 (6.2%) | 61 (24.1%) |
| 35 to 64 Years | 36 (8.8%) | 48 (8.8%) |
| 65 to 74 Years | 26 (36.1%) | 47 (57.3%) |
| 75 Years and over | 18 (19.2%) | 49 (59.0%) |
Disability Class by Sex by Age in Ridgetop
Disability Class: Hearing Difficulty
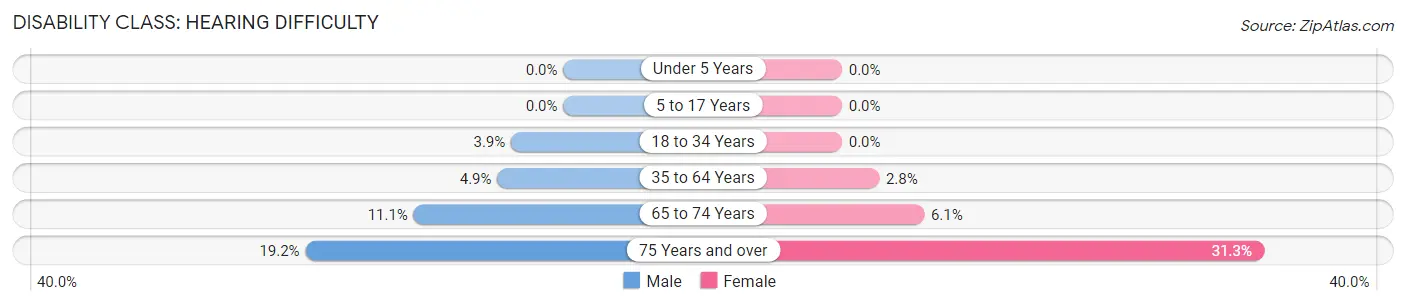
| Age Bracket | Male | Female |
| Under 5 Years | 0 (0.0%) | 0 (0.0%) |
| 5 to 17 Years | 0 (0.0%) | 0 (0.0%) |
| 18 to 34 Years | 5 (3.9%) | 0 (0.0%) |
| 35 to 64 Years | 20 (4.9%) | 15 (2.8%) |
| 65 to 74 Years | 8 (11.1%) | 5 (6.1%) |
| 75 Years and over | 18 (19.2%) | 26 (31.3%) |
Disability Class: Vision Difficulty
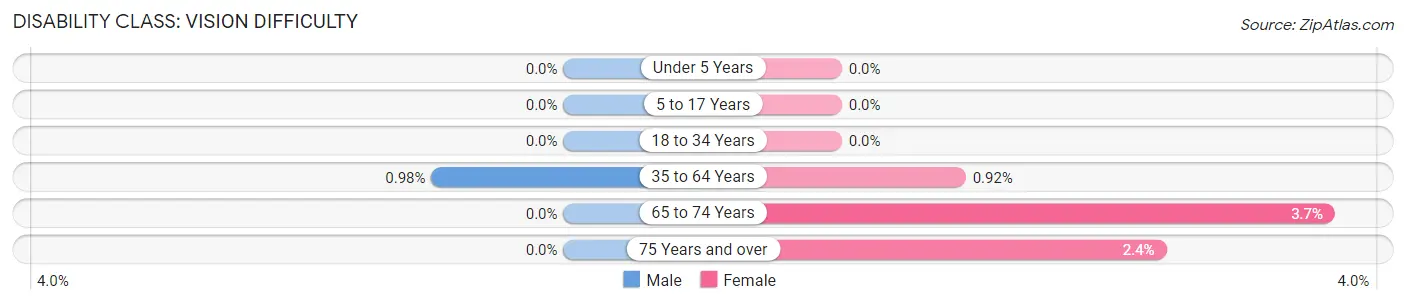
| Age Bracket | Male | Female |
| Under 5 Years | 0 (0.0%) | 0 (0.0%) |
| 5 to 17 Years | 0 (0.0%) | 0 (0.0%) |
| 18 to 34 Years | 0 (0.0%) | 0 (0.0%) |
| 35 to 64 Years | 4 (1.0%) | 5 (0.9%) |
| 65 to 74 Years | 0 (0.0%) | 3 (3.7%) |
| 75 Years and over | 0 (0.0%) | 2 (2.4%) |
Disability Class: Cognitive Difficulty
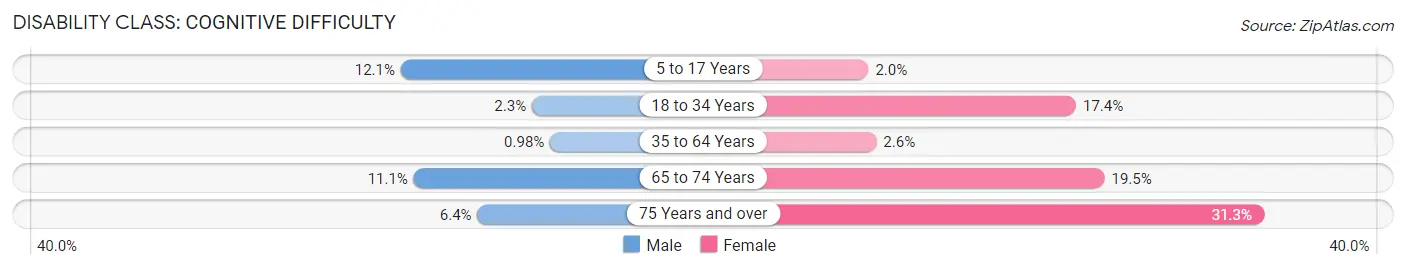
| Age Bracket | Male | Female |
| 5 to 17 Years | 28 (12.1%) | 5 (2.0%) |
| 18 to 34 Years | 3 (2.3%) | 44 (17.4%) |
| 35 to 64 Years | 4 (1.0%) | 14 (2.6%) |
| 65 to 74 Years | 8 (11.1%) | 16 (19.5%) |
| 75 Years and over | 6 (6.4%) | 26 (31.3%) |
Disability Class: Ambulatory Difficulty
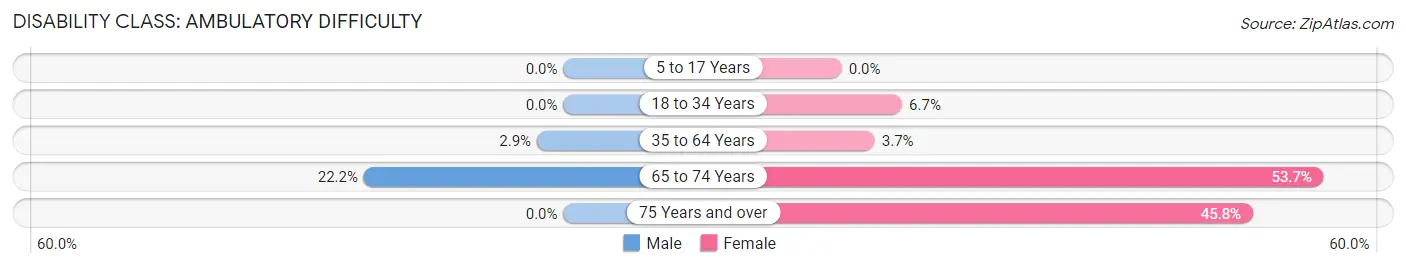
| Age Bracket | Male | Female |
| 5 to 17 Years | 0 (0.0%) | 0 (0.0%) |
| 18 to 34 Years | 0 (0.0%) | 17 (6.7%) |
| 35 to 64 Years | 12 (2.9%) | 20 (3.7%) |
| 65 to 74 Years | 16 (22.2%) | 44 (53.7%) |
| 75 Years and over | 0 (0.0%) | 38 (45.8%) |
Disability Class: Self-Care Difficulty
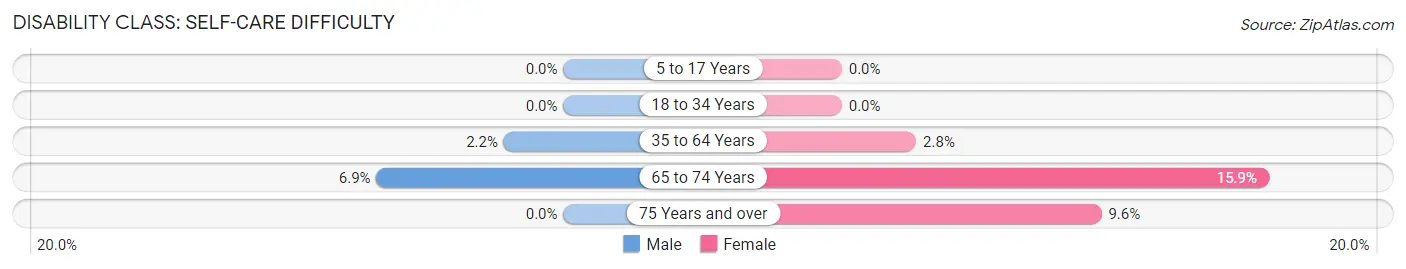
| Age Bracket | Male | Female |
| 5 to 17 Years | 0 (0.0%) | 0 (0.0%) |
| 18 to 34 Years | 0 (0.0%) | 0 (0.0%) |
| 35 to 64 Years | 9 (2.2%) | 15 (2.8%) |
| 65 to 74 Years | 5 (6.9%) | 13 (15.9%) |
| 75 Years and over | 0 (0.0%) | 8 (9.6%) |
Technology Access in Ridgetop
Computing Device Access in Ridgetop
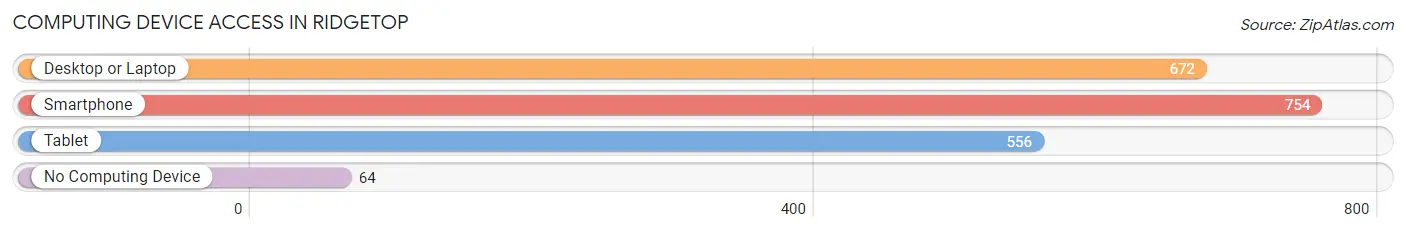
| Device Type | # Households | % Households |
| Desktop or Laptop | 672 | 78.2% |
| Smartphone | 754 | 87.8% |
| Tablet | 556 | 64.7% |
| No Computing Device | 64 | 7.4% |
| Total | 859 | 100.0% |
Internet Access in Ridgetop
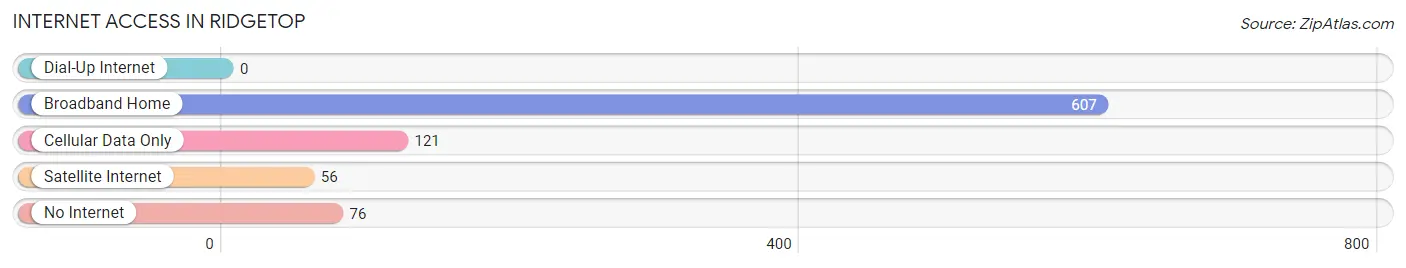
| Internet Type | # Households | % Households |
| Dial-Up Internet | 0 | 0.0% |
| Broadband Home | 607 | 70.7% |
| Cellular Data Only | 121 | 14.1% |
| Satellite Internet | 56 | 6.5% |
| No Internet | 76 | 8.8% |
| Total | 859 | 100.0% |
Ridgetop Summary
Ridgetop is a small town located in Robertson County, Tennessee. It is situated about 20 miles north of Nashville and is part of the Nashville metropolitan area. The town has a population of approximately 2,000 people and is known for its rural charm and small-town atmosphere.
Geography
Ridgetop is located in the rolling hills of Robertson County, Tennessee. The town is situated on the western edge of the Nashville metropolitan area and is bordered by the towns of White House, Springfield, and Greenbrier. The town is situated at an elevation of 890 feet above sea level and is located in the Central Time Zone. The town is located in the Cumberland Plateau region of Tennessee and is surrounded by lush forests and rolling hills.
The town is located along the banks of the Stones River, which is a tributary of the Cumberland River. The Stones River is a popular destination for fishing, canoeing, and kayaking. The town is also home to several parks, including Ridgetop Park, which features a playground, picnic area, and walking trails.
Economy
Ridgetop is a small town with a population of approximately 2,000 people. The town is home to several small businesses, including a grocery store, a hardware store, and a few restaurants. The town is also home to a few manufacturing companies, including a furniture manufacturer and a plastics manufacturer.
The town is also home to several farms, which produce a variety of crops, including corn, soybeans, and hay. The town is also home to several wineries, which produce a variety of wines.
Demographics
Ridgetop is a predominantly white town, with approximately 95% of the population being white. The town is also home to a small African American population, which makes up approximately 4% of the population. The town is also home to a small Hispanic population, which makes up approximately 1% of the population.
The median household income in Ridgetop is approximately $45,000, which is slightly lower than the median household income for the state of Tennessee. The town has a poverty rate of approximately 10%, which is slightly higher than the poverty rate for the state of Tennessee.
Conclusion
Ridgetop is a small town located in Robertson County, Tennessee. The town is situated on the western edge of the Nashville metropolitan area and is known for its rural charm and small-town atmosphere. The town is home to several small businesses, farms, and wineries, and has a population of approximately 2,000 people. The town is predominantly white, with a small African American and Hispanic population. The median household income in Ridgetop is approximately $45,000, and the town has a poverty rate of approximately 10%.
Common Questions
What is the Total Population of Ridgetop?
Total Population of Ridgetop is 2,376.
What is the Total Male Population of Ridgetop?
Total Male Population of Ridgetop is 1,060.
What is the Total Female Population of Ridgetop?
Total Female Population of Ridgetop is 1,316.
What is the Ratio of Males per 100 Females in Ridgetop?
There are 80.55 Males per 100 Females in Ridgetop.
What is the Ratio of Females per 100 Males in Ridgetop?
There are 124.15 Females per 100 Males in Ridgetop.
What is the Median Population Age in Ridgetop?
Median Population Age in Ridgetop is 38.0 Years.
What is the Average Family Size in Ridgetop
Average Family Size in Ridgetop is 3.3 People.
What is the Average Household Size in Ridgetop
Average Household Size in Ridgetop is 2.7 People.
What is Per Capita Income in Ridgetop?
Per Capita income in Ridgetop is $37,893.
What is the Median Family Income in Ridgetop?
Median Family Income in Ridgetop is $76,413.
What is the Median Household income in Ridgetop?
Median Household Income in Ridgetop is $66,964.
What is Income or Wage Gap in Ridgetop?
Income or Wage Gap in Ridgetop is 44.3%.
Women in Ridgetop earn 55.7 cents for every dollar earned by a man.
What is Inequality or Gini Index in Ridgetop?
Inequality or Gini Index in Ridgetop is 0.43.
How Large is the Labor Force in Ridgetop?
There are 1,077 People in the Labor Forcein in Ridgetop.
What is the Percentage of People in the Labor Force in Ridgetop?
62.1% of People are in the Labor Force in Ridgetop.
What is the Unemployment Rate in Ridgetop?
Unemployment Rate in Ridgetop is 5.8%.