Cities with the Highest Percentage of Population Employed in Law Enforcement in Tennessee
RELATED REPORTS & OPTIONS
Law Enforcement
Tennessee
Compare Cities
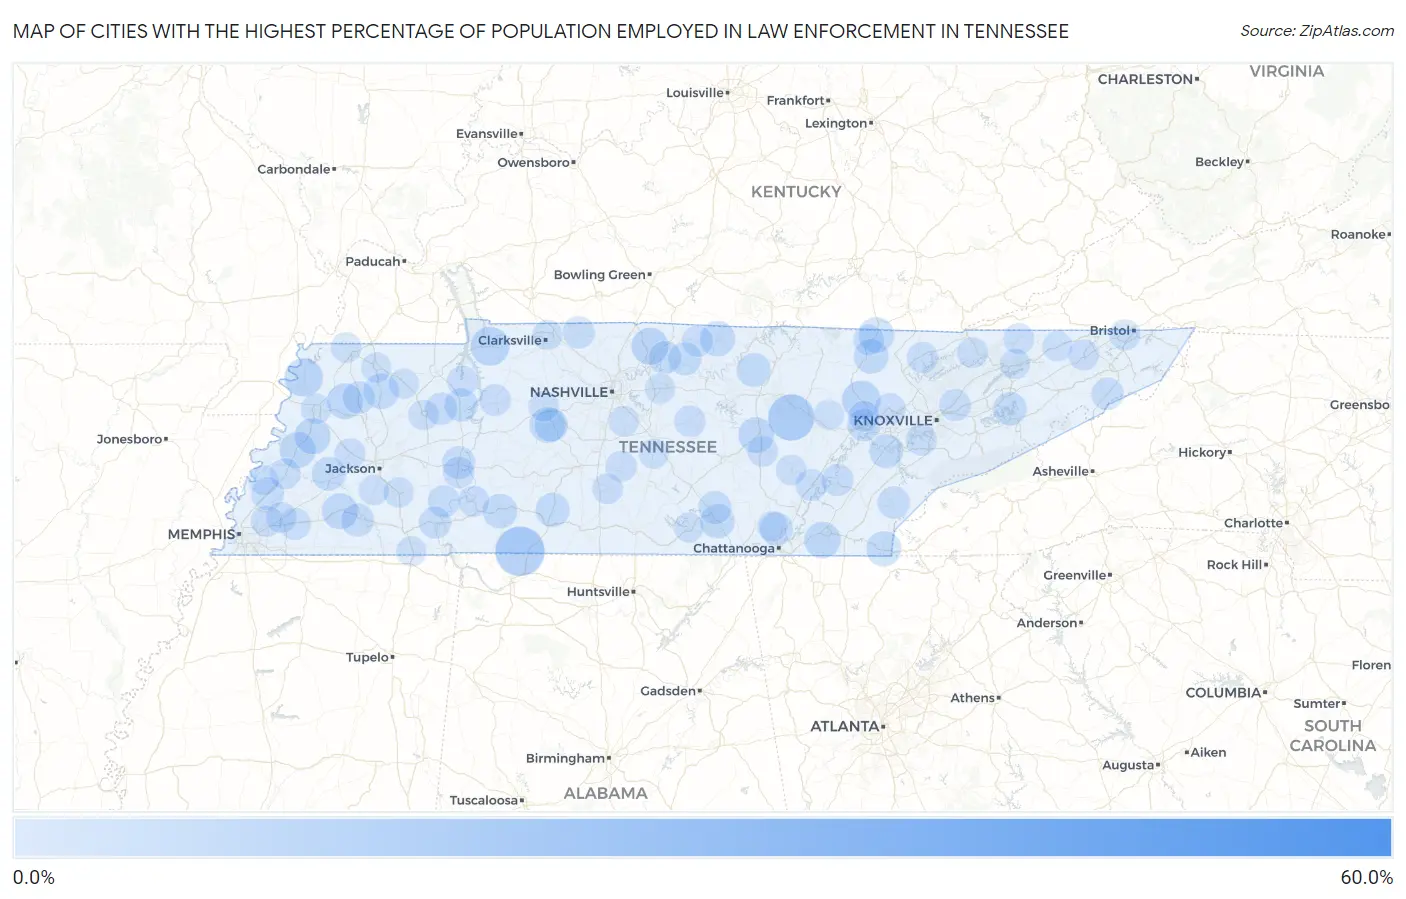
Map of Cities with the Highest Percentage of Population Employed in Law Enforcement in Tennessee
0.0%
60.0%
Cities with the Highest Percentage of Population Employed in Law Enforcement in Tennessee
| City | % Employed | vs State | vs National | |
| 1. | Pocahontas | 57.7% | 1.00%(+56.7)#1 | 0.96%(+56.7)#9 |
| 2. | Luray | 38.9% | 1.00%(+37.9)#2 | 0.96%(+38.0)#29 |
| 3. | Palmersville | 20.0% | 1.00%(+19.0)#3 | 0.96%(+19.0)#128 |
| 4. | Oak Grove Cdp Sumner County | 17.6% | 1.00%(+16.6)#4 | 0.96%(+16.6)#157 |
| 5. | Iron City | 16.7% | 1.00%(+15.7)#5 | 0.96%(+15.7)#175 |
| 6. | Chewalla | 16.3% | 1.00%(+15.3)#6 | 0.96%(+15.4)#184 |
| 7. | Pleasant Hill | 14.2% | 1.00%(+13.2)#7 | 0.96%(+13.2)#233 |
| 8. | Dover | 8.3% | 1.00%(+7.35)#8 | 0.96%(+7.38)#675 |
| 9. | Wartburg | 8.2% | 1.00%(+7.25)#9 | 0.96%(+7.28)#697 |
| 10. | Ridgely | 7.9% | 1.00%(+6.92)#10 | 0.96%(+6.96)#745 |
| 11. | Graball | 7.0% | 1.00%(+6.05)#11 | 0.96%(+6.08)#929 |
| 12. | Butler | 6.9% | 1.00%(+5.93)#12 | 0.96%(+5.97)#955 |
| 13. | South Cleveland | 6.6% | 1.00%(+5.57)#13 | 0.96%(+5.61)#1,052 |
| 14. | Ripley | 6.3% | 1.00%(+5.31)#14 | 0.96%(+5.34)#1,124 |
| 15. | Gates | 6.3% | 1.00%(+5.28)#15 | 0.96%(+5.32)#1,135 |
| 16. | Whiteville | 6.2% | 1.00%(+5.19)#16 | 0.96%(+5.22)#1,163 |
| 17. | Yorkville | 6.1% | 1.00%(+5.10)#17 | 0.96%(+5.13)#1,186 |
| 18. | Doyle | 6.0% | 1.00%(+5.03)#18 | 0.96%(+5.07)#1,206 |
| 19. | Lyles | 6.0% | 1.00%(+4.98)#19 | 0.96%(+5.02)#1,220 |
| 20. | Greenfield | 5.9% | 1.00%(+4.93)#20 | 0.96%(+4.96)#1,248 |
| 21. | Winfield | 5.9% | 1.00%(+4.86)#21 | 0.96%(+4.90)#1,270 |
| 22. | Randolph | 5.8% | 1.00%(+4.77)#22 | 0.96%(+4.81)#1,301 |
| 23. | Red Boiling Springs | 5.7% | 1.00%(+4.73)#23 | 0.96%(+4.76)#1,315 |
| 24. | Walnut Grove Cdp Sumner County | 5.6% | 1.00%(+4.63)#24 | 0.96%(+4.66)#1,357 |
| 25. | Ducktown | 5.4% | 1.00%(+4.39)#25 | 0.96%(+4.42)#1,460 |
| 26. | Huntsville | 5.3% | 1.00%(+4.33)#26 | 0.96%(+4.36)#1,488 |
| 27. | Waynesboro | 5.1% | 1.00%(+4.14)#27 | 0.96%(+4.17)#1,565 |
| 28. | Monteagle | 5.0% | 1.00%(+3.99)#28 | 0.96%(+4.03)#1,638 |
| 29. | Briceville | 4.9% | 1.00%(+3.86)#29 | 0.96%(+3.89)#1,700 |
| 30. | Ethridge | 4.8% | 1.00%(+3.85)#30 | 0.96%(+3.88)#1,705 |
| 31. | Brownsville | 4.8% | 1.00%(+3.84)#31 | 0.96%(+3.87)#1,710 |
| 32. | Loudon | 4.8% | 1.00%(+3.83)#32 | 0.96%(+3.87)#1,714 |
| 33. | Dodson Branch | 4.8% | 1.00%(+3.79)#33 | 0.96%(+3.83)#1,735 |
| 34. | Baneberry | 4.3% | 1.00%(+3.35)#34 | 0.96%(+3.39)#2,003 |
| 35. | Camden | 4.3% | 1.00%(+3.32)#35 | 0.96%(+3.36)#2,023 |
| 36. | Fairmount | 4.2% | 1.00%(+3.24)#36 | 0.96%(+3.27)#2,084 |
| 37. | Bon Aqua Junction | 4.2% | 1.00%(+3.21)#37 | 0.96%(+3.24)#2,105 |
| 38. | Hartsville Trousdale County | 4.1% | 1.00%(+3.14)#38 | 0.96%(+3.18)#2,161 |
| 39. | Bolivar | 4.1% | 1.00%(+3.08)#39 | 0.96%(+3.12)#2,219 |
| 40. | Pelham | 4.0% | 1.00%(+3.02)#40 | 0.96%(+3.06)#2,251 |
| 41. | Parsons | 3.8% | 1.00%(+2.82)#41 | 0.96%(+2.85)#2,429 |
| 42. | Harriman | 3.8% | 1.00%(+2.79)#42 | 0.96%(+2.82)#2,464 |
| 43. | Atoka | 3.8% | 1.00%(+2.78)#43 | 0.96%(+2.81)#2,478 |
| 44. | Castalian Springs | 3.8% | 1.00%(+2.76)#44 | 0.96%(+2.79)#2,490 |
| 45. | Strawberry Plains | 3.7% | 1.00%(+2.68)#45 | 0.96%(+2.72)#2,558 |
| 46. | Rutherford | 3.5% | 1.00%(+2.47)#46 | 0.96%(+2.51)#2,747 |
| 47. | Tellico Plains | 3.5% | 1.00%(+2.47)#47 | 0.96%(+2.50)#2,752 |
| 48. | Erwin | 3.4% | 1.00%(+2.40)#48 | 0.96%(+2.44)#2,812 |
| 49. | Hollow Rock | 3.4% | 1.00%(+2.40)#49 | 0.96%(+2.43)#2,813 |
| 50. | Saltillo | 3.3% | 1.00%(+2.34)#50 | 0.96%(+2.37)#2,878 |
| 51. | Crump | 3.2% | 1.00%(+2.23)#51 | 0.96%(+2.26)#3,002 |
| 52. | Decatur | 3.2% | 1.00%(+2.23)#52 | 0.96%(+2.26)#3,003 |
| 53. | Adams | 3.2% | 1.00%(+2.22)#53 | 0.96%(+2.25)#3,024 |
| 54. | Mascot | 3.2% | 1.00%(+2.16)#54 | 0.96%(+2.19)#3,116 |
| 55. | Oakland | 3.1% | 1.00%(+2.07)#55 | 0.96%(+2.11)#3,216 |
| 56. | Waverly | 3.0% | 1.00%(+2.01)#56 | 0.96%(+2.05)#3,306 |
| 57. | Dayton | 2.9% | 1.00%(+1.92)#57 | 0.96%(+1.95)#3,464 |
| 58. | Decaturville | 2.8% | 1.00%(+1.83)#58 | 0.96%(+1.87)#3,590 |
| 59. | Auburntown | 2.8% | 1.00%(+1.81)#59 | 0.96%(+1.85)#3,636 |
| 60. | Louisville | 2.8% | 1.00%(+1.78)#60 | 0.96%(+1.82)#3,668 |
| 61. | Bartlett | 2.6% | 1.00%(+1.63)#61 | 0.96%(+1.67)#3,933 |
| 62. | Oliver Springs | 2.6% | 1.00%(+1.62)#62 | 0.96%(+1.66)#3,946 |
| 63. | Lafayette | 2.6% | 1.00%(+1.60)#63 | 0.96%(+1.63)#3,988 |
| 64. | Fincastle | 2.6% | 1.00%(+1.57)#64 | 0.96%(+1.61)#4,034 |
| 65. | Covington | 2.5% | 1.00%(+1.47)#65 | 0.96%(+1.50)#4,257 |
| 66. | Clifton | 2.5% | 1.00%(+1.47)#66 | 0.96%(+1.50)#4,258 |
| 67. | Big Sandy | 2.4% | 1.00%(+1.43)#67 | 0.96%(+1.47)#4,332 |
| 68. | Chapel Hill | 2.4% | 1.00%(+1.41)#68 | 0.96%(+1.44)#4,382 |
| 69. | Bells | 2.4% | 1.00%(+1.40)#69 | 0.96%(+1.44)#4,399 |
| 70. | Powell | 2.4% | 1.00%(+1.39)#70 | 0.96%(+1.43)#4,417 |
| 71. | Walnut Hill | 2.4% | 1.00%(+1.36)#71 | 0.96%(+1.39)#4,493 |
| 72. | Fall Branch | 2.3% | 1.00%(+1.33)#72 | 0.96%(+1.36)#4,548 |
| 73. | Sneedville | 2.3% | 1.00%(+1.31)#73 | 0.96%(+1.35)#4,585 |
| 74. | Oakdale | 2.3% | 1.00%(+1.28)#74 | 0.96%(+1.31)#4,675 |
| 75. | Lewisburg | 2.3% | 1.00%(+1.26)#75 | 0.96%(+1.30)#4,698 |
| 76. | Spencer | 2.3% | 1.00%(+1.26)#76 | 0.96%(+1.29)#4,718 |
| 77. | Arlington | 2.2% | 1.00%(+1.24)#77 | 0.96%(+1.27)#4,759 |
| 78. | New Tazewell | 2.2% | 1.00%(+1.22)#78 | 0.96%(+1.25)#4,808 |
| 79. | Oneida | 2.2% | 1.00%(+1.22)#79 | 0.96%(+1.25)#4,819 |
| 80. | Dickson | 2.2% | 1.00%(+1.16)#80 | 0.96%(+1.19)#4,943 |
| 81. | Nolensville | 2.1% | 1.00%(+1.10)#81 | 0.96%(+1.14)#5,061 |
| 82. | Woodland Mills | 2.1% | 1.00%(+1.09)#82 | 0.96%(+1.12)#5,100 |
| 83. | Pikeville | 2.1% | 1.00%(+1.09)#83 | 0.96%(+1.12)#5,115 |
| 84. | Huntingdon | 2.1% | 1.00%(+1.08)#84 | 0.96%(+1.12)#5,116 |
| 85. | Dyersburg | 2.0% | 1.00%(+1.01)#85 | 0.96%(+1.05)#5,311 |
| 86. | Henderson | 2.0% | 1.00%(+0.975)#86 | 0.96%(+1.01)#5,418 |
| 87. | Medon | 2.0% | 1.00%(+0.965)#87 | 0.96%(+0.998)#5,445 |
| 88. | Lebanon | 1.9% | 1.00%(+0.921)#88 | 0.96%(+0.954)#5,574 |
| 89. | Gleason | 1.9% | 1.00%(+0.906)#89 | 0.96%(+0.939)#5,610 |
| 90. | Gilt Edge | 1.9% | 1.00%(+0.898)#90 | 0.96%(+0.931)#5,629 |
| 91. | Fairfield Glade | 1.9% | 1.00%(+0.868)#91 | 0.96%(+0.902)#5,715 |
| 92. | Hampton | 1.8% | 1.00%(+0.834)#92 | 0.96%(+0.868)#5,809 |
| 93. | Guys | 1.8% | 1.00%(+0.833)#93 | 0.96%(+0.867)#5,814 |
| 94. | Mooresburg | 1.8% | 1.00%(+0.808)#94 | 0.96%(+0.841)#5,890 |
| 95. | Surgoinsville | 1.8% | 1.00%(+0.806)#95 | 0.96%(+0.839)#5,894 |
| 96. | Martin | 1.8% | 1.00%(+0.792)#96 | 0.96%(+0.826)#5,933 |
| 97. | Winchester | 1.8% | 1.00%(+0.776)#97 | 0.96%(+0.810)#6,003 |
| 98. | Christiana | 1.8% | 1.00%(+0.771)#98 | 0.96%(+0.805)#6,021 |
| 99. | Clarksville | 1.8% | 1.00%(+0.770)#99 | 0.96%(+0.803)#6,030 |
| 100. | Lone Oak | 1.8% | 1.00%(+0.764)#100 | 0.96%(+0.797)#6,056 |
Common Questions
What are the Top 10 Cities with the Highest Percentage of Population Employed in Law Enforcement in Tennessee?
Top 10 Cities with the Highest Percentage of Population Employed in Law Enforcement in Tennessee are:
#1
16.7%
#2
14.2%
#3
8.3%
#4
8.2%
#5
7.9%
#6
7.0%
#7
6.6%
#8
6.3%
#9
6.3%
#10
6.2%
What city has the Highest Percentage of Population Employed in Law Enforcement in Tennessee?
Iron City has the Highest Percentage of Population Employed in Law Enforcement in Tennessee with 16.7%.
What is the Percentage of Population Employed in Law Enforcement in the State of Tennessee?
Percentage of Population Employed in Law Enforcement in Tennessee is 1.00%.
What is the Percentage of Population Employed in Law Enforcement in the United States?
Percentage of Population Employed in Law Enforcement in the United States is 0.96%.