Cities with the Most Immigrants from Northern Africa in Tennessee
RELATED REPORTS & OPTIONS
Northern Africa
Tennessee
Compare Cities
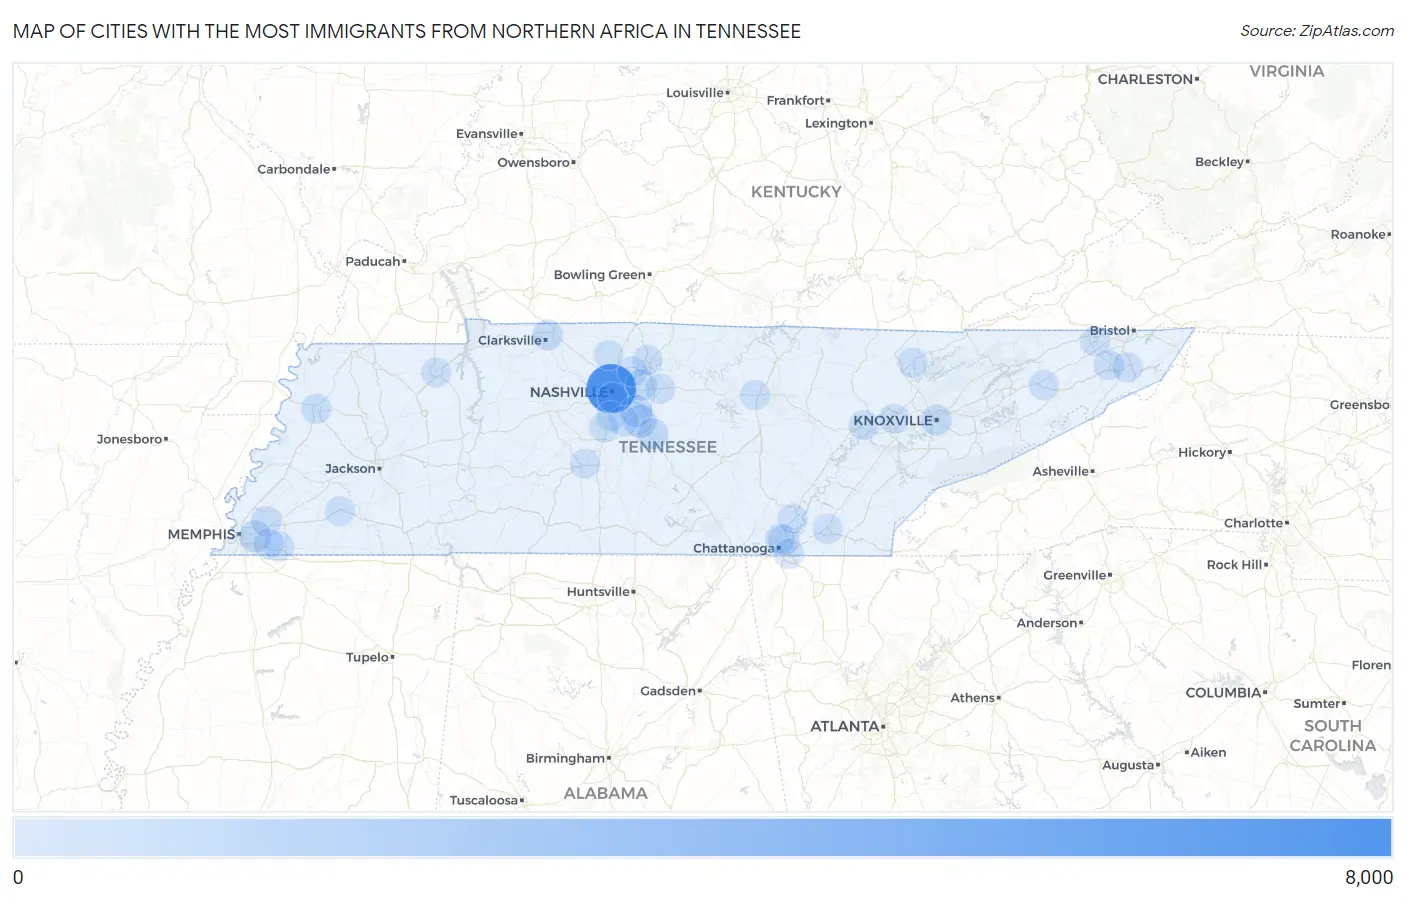
Map of Cities with the Most Immigrants from Northern Africa in Tennessee
0
8,000
Cities with the Most Immigrants from Northern Africa in Tennessee
| City | Northern Africa | vs State | vs National | |
| 1. | Nashville | 7,828 | 14,472(54.09%)#1 | 421,832(1.86%)#4 |
| 2. | Smyrna | 984 | 14,472(6.80%)#2 | 421,832(0.23%)#41 |
| 3. | La Vergne | 717 | 14,472(4.95%)#3 | 421,832(0.17%)#68 |
| 4. | Memphis | 684 | 14,472(4.73%)#4 | 421,832(0.16%)#74 |
| 5. | Murfreesboro | 572 | 14,472(3.95%)#5 | 421,832(0.14%)#98 |
| 6. | Mount Juliet | 514 | 14,472(3.55%)#6 | 421,832(0.12%)#112 |
| 7. | Knoxville | 291 | 14,472(2.01%)#7 | 421,832(0.07%)#240 |
| 8. | Clarksville | 260 | 14,472(1.80%)#8 | 421,832(0.06%)#266 |
| 9. | Chattanooga | 240 | 14,472(1.66%)#9 | 421,832(0.06%)#289 |
| 10. | Collierville | 176 | 14,472(1.22%)#10 | 421,832(0.04%)#424 |
| 11. | Bartlett | 143 | 14,472(0.99%)#11 | 421,832(0.03%)#516 |
| 12. | Gallatin | 143 | 14,472(0.99%)#12 | 421,832(0.03%)#517 |
| 13. | Johnson City | 97 | 14,472(0.67%)#13 | 421,832(0.02%)#708 |
| 14. | Dyersburg | 80 | 14,472(0.55%)#14 | 421,832(0.02%)#810 |
| 15. | Germantown | 78 | 14,472(0.54%)#15 | 421,832(0.02%)#822 |
| 16. | Brentwood | 65 | 14,472(0.45%)#16 | 421,832(0.02%)#947 |
| 17. | Lebanon | 61 | 14,472(0.42%)#17 | 421,832(0.01%)#993 |
| 18. | Kingsport | 57 | 14,472(0.39%)#18 | 421,832(0.01%)#1,039 |
| 19. | Hendersonville | 46 | 14,472(0.32%)#19 | 421,832(0.01%)#1,186 |
| 20. | Red Bank | 42 | 14,472(0.29%)#20 | 421,832(0.01%)#1,267 |
| 21. | Cleveland | 41 | 14,472(0.28%)#21 | 421,832(0.01%)#1,282 |
| 22. | Nolensville | 41 | 14,472(0.28%)#22 | 421,832(0.01%)#1,287 |
| 23. | Cookeville | 37 | 14,472(0.26%)#23 | 421,832(0.01%)#1,353 |
| 24. | Elizabethton | 37 | 14,472(0.26%)#24 | 421,832(0.01%)#1,358 |
| 25. | Oak Ridge | 27 | 14,472(0.19%)#25 | 421,832(0.01%)#1,603 |
| 26. | Columbia | 25 | 14,472(0.17%)#26 | 421,832(0.01%)#1,653 |
| 27. | Franklin | 17 | 14,472(0.12%)#27 | 421,832(0.00%)#1,924 |
| 28. | East Ridge | 17 | 14,472(0.12%)#28 | 421,832(0.00%)#1,940 |
| 29. | Paris | 16 | 14,472(0.11%)#29 | 421,832(0.00%)#2,010 |
| 30. | Mosheim | 16 | 14,472(0.11%)#30 | 421,832(0.00%)#2,036 |
| 31. | Greenbrier | 14 | 14,472(0.10%)#31 | 421,832(0.00%)#2,133 |
| 32. | Whiteville | 13 | 14,472(0.09%)#32 | 421,832(0.00%)#2,191 |
| 33. | Soddy Daisy | 11 | 14,472(0.08%)#33 | 421,832(0.00%)#2,288 |
| 34. | La Follette | 7 | 14,472(0.05%)#34 | 421,832(0.00%)#2,553 |
| 35. | Berry Hill | 3 | 14,472(0.02%)#35 | 421,832(0.00%)#2,807 |
| 36. | Harriman | 1 | 14,472(0.01%)#36 | 421,832(0.00%)#2,903 |
Common Questions
What are the Top 10 Cities with the Most Immigrants from Northern Africa in Tennessee?
Top 10 Cities with the Most Immigrants from Northern Africa in Tennessee are:
#1
7,828
#2
984
#3
717
#4
684
#5
572
#6
514
#7
291
#8
260
#9
240
#10
176
What city has the Most Immigrants from Northern Africa in Tennessee?
Nashville has the Most Immigrants from Northern Africa in Tennessee with 7,828.
What is the Total Immigrants from Northern Africa in the State of Tennessee?
Total Immigrants from Northern Africa in Tennessee is 14,472.
What is the Total Immigrants from Northern Africa in the United States?
Total Immigrants from Northern Africa in the United States is 421,832.