Cities with the Lowest Unemployment Rate Amomg Seniors Over the Age of 65 in Tennessee
RELATED REPORTS & OPTIONS
Lowest Unemployment | Senior > 65
Tennessee
Compare Cities
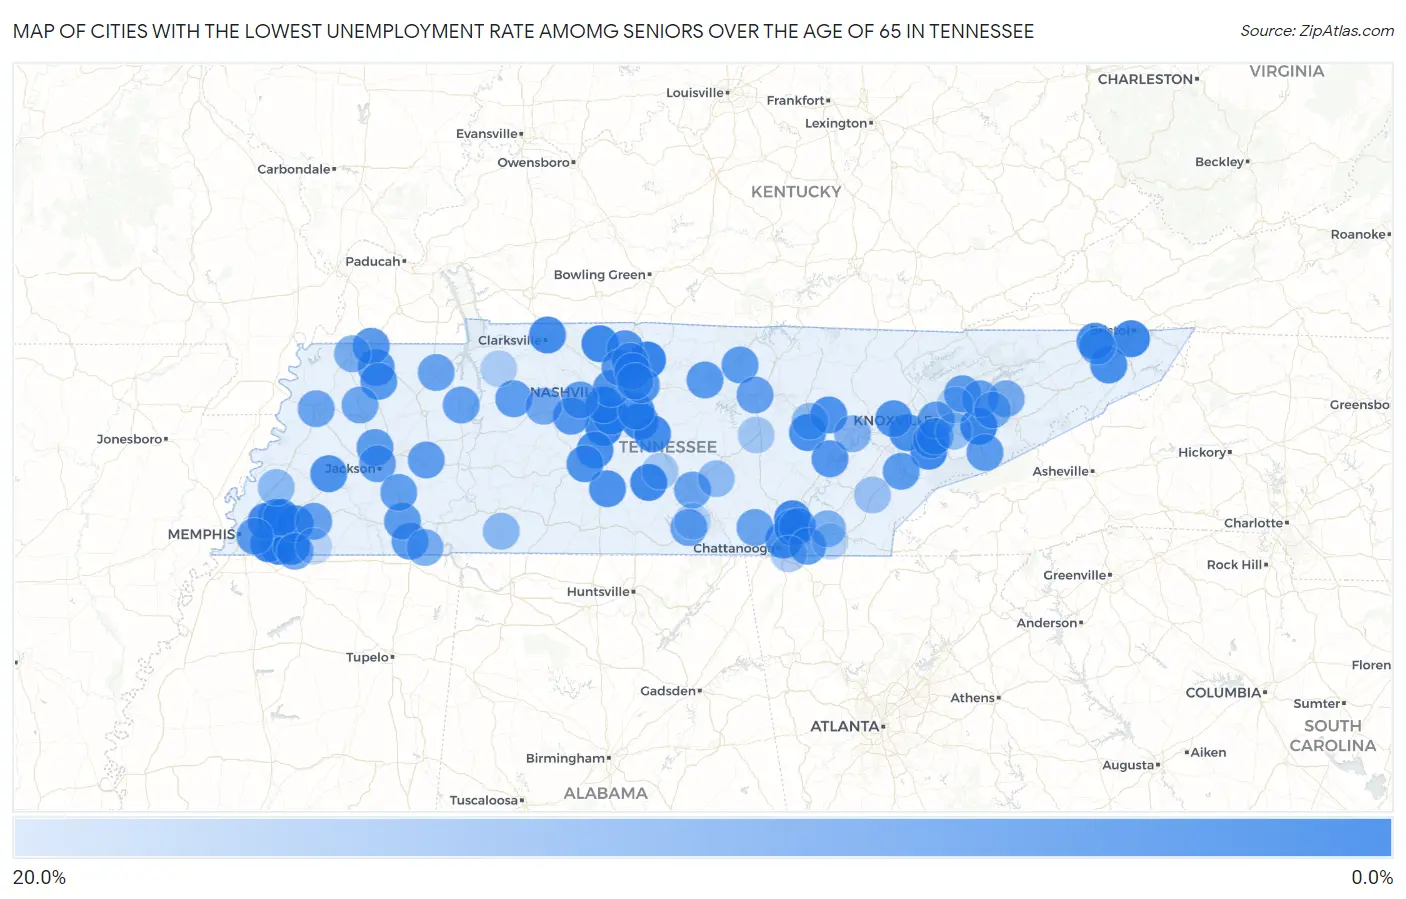
Map of Cities with the Lowest Unemployment Rate Amomg Seniors Over the Age of 65 in Tennessee
20.0%
0.0%
Cities with the Lowest Unemployment Rate Amomg Seniors Over the Age of 65 in Tennessee
| City | Senior Unemployment | vs State | vs National | |
| 1. | Collierville | 0.40% | 3.1%(-2.70)#1 | 3.9%(-3.50)#28 |
| 2. | Gallatin | 0.50% | 3.1%(-2.60)#2 | 3.9%(-3.40)#54 |
| 3. | Franklin | 0.60% | 3.1%(-2.50)#3 | 3.9%(-3.30)#75 |
| 4. | Smyrna | 0.80% | 3.1%(-2.30)#4 | 3.9%(-3.10)#134 |
| 5. | Sevierville | 0.80% | 3.1%(-2.30)#5 | 3.9%(-3.10)#146 |
| 6. | Maryville | 1.1% | 3.1%(-2.00)#6 | 3.9%(-2.80)#253 |
| 7. | Bristol | 1.2% | 3.1%(-1.90)#7 | 3.9%(-2.70)#296 |
| 8. | Brentwood | 1.3% | 3.1%(-1.80)#8 | 3.9%(-2.60)#340 |
| 9. | Springfield | 1.3% | 3.1%(-1.80)#9 | 3.9%(-2.60)#365 |
| 10. | Soddy Daisy | 1.4% | 3.1%(-1.70)#10 | 3.9%(-2.50)#416 |
| 11. | Forest Hills | 1.4% | 3.1%(-1.70)#11 | 3.9%(-2.50)#431 |
| 12. | Shelbyville | 1.5% | 3.1%(-1.60)#12 | 3.9%(-2.40)#463 |
| 13. | Germantown | 1.6% | 3.1%(-1.50)#13 | 3.9%(-2.30)#496 |
| 14. | Lakeland | 1.6% | 3.1%(-1.50)#14 | 3.9%(-2.30)#525 |
| 15. | Piperton | 1.7% | 3.1%(-1.40)#15 | 3.9%(-2.20)#602 |
| 16. | Biltmore | 2.0% | 3.1%(-1.10)#16 | 3.9%(-1.90)#791 |
| 17. | Clarksville | 2.1% | 3.1%(-1.000)#17 | 3.9%(-1.80)#796 |
| 18. | Bartlett | 2.2% | 3.1%(-0.900)#18 | 3.9%(-1.70)#871 |
| 19. | Chattanooga | 2.3% | 3.1%(-0.800)#19 | 3.9%(-1.60)#932 |
| 20. | Murfreesboro | 2.4% | 3.1%(-0.700)#20 | 3.9%(-1.50)#998 |
| 21. | Oakland | 2.4% | 3.1%(-0.700)#21 | 3.9%(-1.50)#1,063 |
| 22. | Johnson City | 2.5% | 3.1%(-0.600)#22 | 3.9%(-1.40)#1,087 |
| 23. | Lake Tansi | 2.6% | 3.1%(-0.500)#23 | 3.9%(-1.30)#1,208 |
| 24. | Farragut | 2.8% | 3.1%(-0.300)#24 | 3.9%(-1.10)#1,326 |
| 25. | Middle Valley | 2.8% | 3.1%(-0.300)#25 | 3.9%(-1.10)#1,339 |
| 26. | Kingsport | 2.9% | 3.1%(-0.200)#26 | 3.9%(-1.00)#1,388 |
| 27. | Spring Hill | 2.9% | 3.1%(-0.200)#27 | 3.9%(-1.00)#1,389 |
| 28. | Fairfield Glade | 3.0% | 3.1%(-0.100)#28 | 3.9%(-0.900)#1,503 |
| 29. | Lewisburg | 3.1% | 3.1%(=0.000)#29 | 3.9%(-0.800)#1,571 |
| 30. | Brownsville | 3.1% | 3.1%(=0.000)#30 | 3.9%(-0.800)#1,579 |
| 31. | La Vergne | 3.4% | 3.1%(+0.300)#31 | 3.9%(-0.500)#1,798 |
| 32. | Lynchburg | 3.4% | 3.1%(+0.300)#32 | 3.9%(-0.500)#1,833 |
| 33. | Arlington | 3.5% | 3.1%(+0.400)#33 | 3.9%(-0.400)#1,894 |
| 34. | Alcoa | 3.5% | 3.1%(+0.400)#34 | 3.9%(-0.400)#1,903 |
| 35. | Columbia | 3.6% | 3.1%(+0.500)#35 | 3.9%(-0.300)#1,948 |
| 36. | Oak Ridge | 3.6% | 3.1%(+0.500)#36 | 3.9%(-0.300)#1,950 |
| 37. | Nashville | 3.7% | 3.1%(+0.600)#37 | 3.9%(-0.200)#2,000 |
| 38. | White House | 3.7% | 3.1%(+0.600)#38 | 3.9%(-0.200)#2,033 |
| 39. | Mount Juliet | 3.9% | 3.1%(+0.800)#39 | 3.9%(=0.000)#2,166 |
| 40. | Martin | 4.0% | 3.1%(+0.900)#40 | 3.9%(+0.100)#2,279 |
| 41. | Fairview | 4.2% | 3.1%(+1.10)#41 | 3.9%(+0.300)#2,430 |
| 42. | Goodlettsville | 4.3% | 3.1%(+1.20)#42 | 3.9%(+0.400)#2,495 |
| 43. | Spring City | 4.3% | 3.1%(+1.20)#43 | 3.9%(+0.400)#2,523 |
| 44. | South Fulton | 4.4% | 3.1%(+1.30)#44 | 3.9%(+0.500)#2,598 |
| 45. | Sharon | 4.6% | 3.1%(+1.50)#45 | 3.9%(+0.700)#2,766 |
| 46. | South Carthage | 4.8% | 3.1%(+1.70)#46 | 3.9%(+0.900)#2,887 |
| 47. | Memphis | 4.9% | 3.1%(+1.80)#47 | 3.9%(+1.00)#2,896 |
| 48. | Knoxville | 4.9% | 3.1%(+1.80)#48 | 3.9%(+1.00)#2,899 |
| 49. | Gatlinburg | 4.9% | 3.1%(+1.80)#49 | 3.9%(+1.00)#2,939 |
| 50. | Pegram | 4.9% | 3.1%(+1.80)#50 | 3.9%(+1.00)#2,947 |
| 51. | Mcewen | 4.9% | 3.1%(+1.80)#51 | 3.9%(+1.00)#2,949 |
| 52. | Vonore | 4.9% | 3.1%(+1.80)#52 | 3.9%(+1.00)#2,951 |
| 53. | Gainesboro | 4.9% | 3.1%(+1.80)#53 | 3.9%(+1.00)#2,954 |
| 54. | Three Way | 5.0% | 3.1%(+1.90)#54 | 3.9%(+1.10)#3,011 |
| 55. | Blaine | 5.1% | 3.1%(+2.00)#55 | 3.9%(+1.20)#3,075 |
| 56. | Lakesite | 5.1% | 3.1%(+2.00)#56 | 3.9%(+1.20)#3,079 |
| 57. | Eastview | 5.1% | 3.1%(+2.00)#57 | 3.9%(+1.20)#3,090 |
| 58. | Collegedale | 5.2% | 3.1%(+2.10)#58 | 3.9%(+1.30)#3,119 |
| 59. | Bethel Springs | 5.2% | 3.1%(+2.10)#59 | 3.9%(+1.30)#3,144 |
| 60. | Valley Forge | 5.3% | 3.1%(+2.20)#60 | 3.9%(+1.40)#3,222 |
| 61. | Shackle Island | 5.5% | 3.1%(+2.40)#61 | 3.9%(+1.60)#3,310 |
| 62. | Hendersonville | 5.6% | 3.1%(+2.50)#62 | 3.9%(+1.70)#3,337 |
| 63. | Lexington | 5.6% | 3.1%(+2.50)#63 | 3.9%(+1.70)#3,361 |
| 64. | Jackson | 5.8% | 3.1%(+2.70)#64 | 3.9%(+1.90)#3,444 |
| 65. | Henderson | 5.9% | 3.1%(+2.80)#65 | 3.9%(+2.00)#3,516 |
| 66. | Camden | 6.0% | 3.1%(+2.90)#66 | 3.9%(+2.10)#3,575 |
| 67. | Cookeville | 6.1% | 3.1%(+3.00)#67 | 3.9%(+2.20)#3,601 |
| 68. | Green Hill | 6.2% | 3.1%(+3.10)#68 | 3.9%(+2.30)#3,668 |
| 69. | Somerville | 6.4% | 3.1%(+3.30)#69 | 3.9%(+2.50)#3,790 |
| 70. | New Market | 6.4% | 3.1%(+3.30)#70 | 3.9%(+2.50)#3,794 |
| 71. | Manchester | 6.5% | 3.1%(+3.40)#71 | 3.9%(+2.60)#3,835 |
| 72. | Winchester | 6.5% | 3.1%(+3.40)#72 | 3.9%(+2.60)#3,838 |
| 73. | Paris | 6.6% | 3.1%(+3.50)#73 | 3.9%(+2.70)#3,882 |
| 74. | Whitwell | 6.8% | 3.1%(+3.70)#74 | 3.9%(+2.90)#4,002 |
| 75. | Dyersburg | 7.0% | 3.1%(+3.90)#75 | 3.9%(+3.10)#4,061 |
| 76. | Dyer | 7.1% | 3.1%(+4.00)#76 | 3.9%(+3.20)#4,109 |
| 77. | Dickson | 7.8% | 3.1%(+4.70)#77 | 3.9%(+3.90)#4,365 |
| 78. | Rossville | 7.8% | 3.1%(+4.70)#78 | 3.9%(+3.90)#4,392 |
| 79. | Colonial Heights | 8.0% | 3.1%(+4.90)#79 | 3.9%(+4.10)#4,460 |
| 80. | White Pine | 8.1% | 3.1%(+5.00)#80 | 3.9%(+4.20)#4,486 |
| 81. | Michie | 8.6% | 3.1%(+5.50)#81 | 3.9%(+4.70)#4,681 |
| 82. | Union City | 8.7% | 3.1%(+5.60)#82 | 3.9%(+4.80)#4,693 |
| 83. | Dandridge | 9.0% | 3.1%(+5.90)#83 | 3.9%(+5.10)#4,780 |
| 84. | Cleveland | 9.3% | 3.1%(+6.20)#84 | 3.9%(+5.40)#4,877 |
| 85. | Rockford | 9.6% | 3.1%(+6.50)#85 | 3.9%(+5.70)#5,001 |
| 86. | Rockwood | 9.8% | 3.1%(+6.70)#86 | 3.9%(+5.90)#5,045 |
| 87. | Collinwood | 11.0% | 3.1%(+7.90)#87 | 3.9%(+7.10)#5,330 |
| 88. | Crossville | 11.1% | 3.1%(+8.00)#88 | 3.9%(+7.20)#5,345 |
| 89. | Brighton | 11.3% | 3.1%(+8.20)#89 | 3.9%(+7.40)#5,408 |
| 90. | Viola | 11.7% | 3.1%(+8.60)#90 | 3.9%(+7.80)#5,495 |
| 91. | Seymour | 12.5% | 3.1%(+9.40)#91 | 3.9%(+8.60)#5,620 |
| 92. | Englewood | 12.9% | 3.1%(+9.80)#92 | 3.9%(+9.00)#5,690 |
| 93. | East Ridge | 13.9% | 3.1%(+10.8)#93 | 3.9%(+10.00)#5,828 |
| 94. | Bell Buckle | 14.2% | 3.1%(+11.1)#94 | 3.9%(+10.3)#5,882 |
| 95. | Doyle | 14.2% | 3.1%(+11.1)#95 | 3.9%(+10.3)#5,883 |
| 96. | Mascot | 15.2% | 3.1%(+12.1)#96 | 3.9%(+11.3)#5,989 |
| 97. | Tennessee Ridge | 15.2% | 3.1%(+12.1)#97 | 3.9%(+11.3)#5,990 |
| 98. | Decherd | 15.7% | 3.1%(+12.6)#98 | 3.9%(+11.8)#6,043 |
| 99. | Wildwood Lake | 16.6% | 3.1%(+13.5)#99 | 3.9%(+12.7)#6,132 |
| 100. | Moscow | 16.6% | 3.1%(+13.5)#100 | 3.9%(+12.7)#6,146 |
Common Questions
What are the Top 10 Cities with the Lowest Unemployment Rate Amomg Seniors Over the Age of 65 in Tennessee?
Top 10 Cities with the Lowest Unemployment Rate Amomg Seniors Over the Age of 65 in Tennessee are:
#1
0.40%
#2
0.50%
#3
0.60%
#4
0.80%
#5
0.80%
#6
1.1%
#7
1.2%
#8
1.3%
#9
1.3%
#10
1.4%
What city has the Lowest Unemployment Rate Amomg Seniors Over the Age of 65 in Tennessee?
Collierville has the Lowest Unemployment Rate Amomg Seniors Over the Age of 65 in Tennessee with 0.40%.
What is the Unemployment Rate Amomg Seniors Over the Age of 65 in the State of Tennessee?
Unemployment Rate Amomg Seniors Over the Age of 65 in Tennessee is 3.1%.
What is the Unemployment Rate Amomg Seniors Over the Age of 65 in the United States?
Unemployment Rate Amomg Seniors Over the Age of 65 in the United States is 3.9%.