Progress, PA
Progress Map
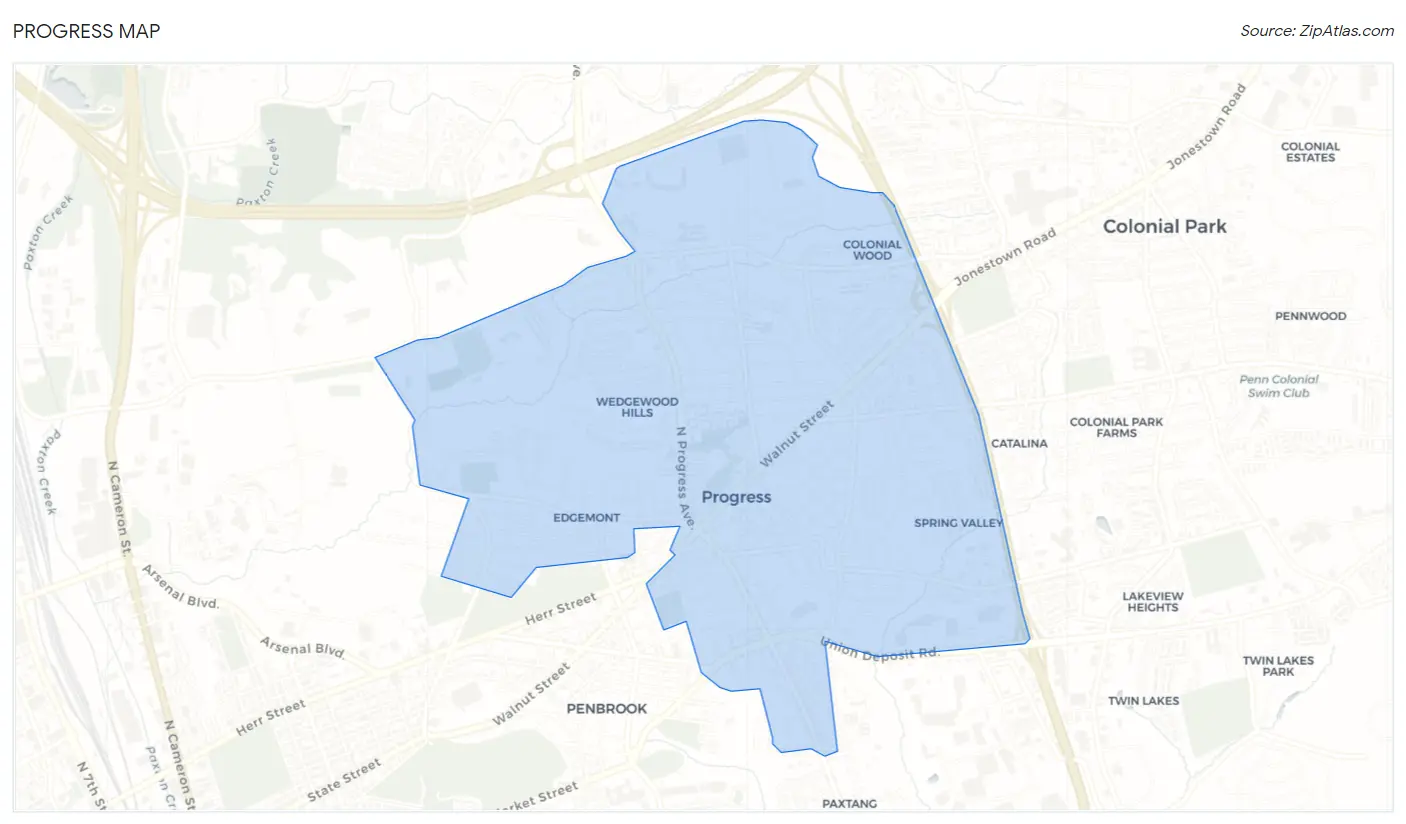
Progress Overview
11,364
TOTAL POPULATION
5,337
MALE POPULATION
6,027
FEMALE POPULATION
88.55
MALES / 100 FEMALES
112.93
FEMALES / 100 MALES
37.2
MEDIAN AGE
3.1
AVG FAMILY SIZE
2.4
AVG HOUSEHOLD SIZE
$33,814
PER CAPITA INCOME
$82,083
AVG FAMILY INCOME
$73,989
AVG HOUSEHOLD INCOME
25.0%
WAGE / INCOME GAP [ % ]
75.0¢/ $1
WAGE / INCOME GAP [ $ ]
0.34
INEQUALITY / GINI INDEX
6,568
LABOR FORCE [ PEOPLE ]
73.6%
PERCENT IN LABOR FORCE
2.2%
UNEMPLOYMENT RATE
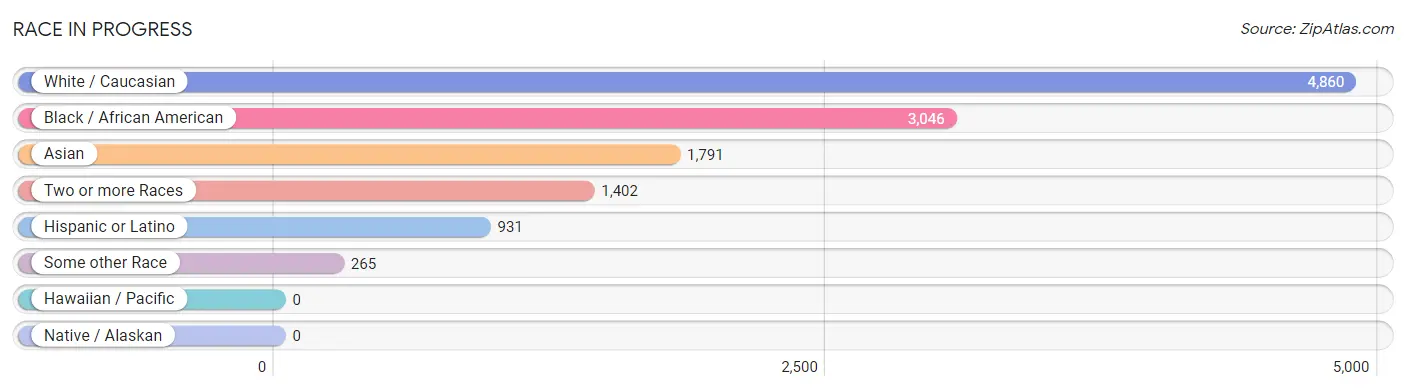
Race in Progress
The most populous races in Progress are White / Caucasian (4,860 | 42.8%), Black / African American (3,046 | 26.8%), and Asian (1,791 | 15.8%).
| Race | # Population | % Population |
| Asian | 1,791 | 15.8% |
| Black / African American | 3,046 | 26.8% |
| Hawaiian / Pacific | 0 | 0.0% |
| Hispanic or Latino | 931 | 8.2% |
| Native / Alaskan | 0 | 0.0% |
| White / Caucasian | 4,860 | 42.8% |
| Two or more Races | 1,402 | 12.3% |
| Some other Race | 265 | 2.3% |
| Total | 11,364 | 100.0% |
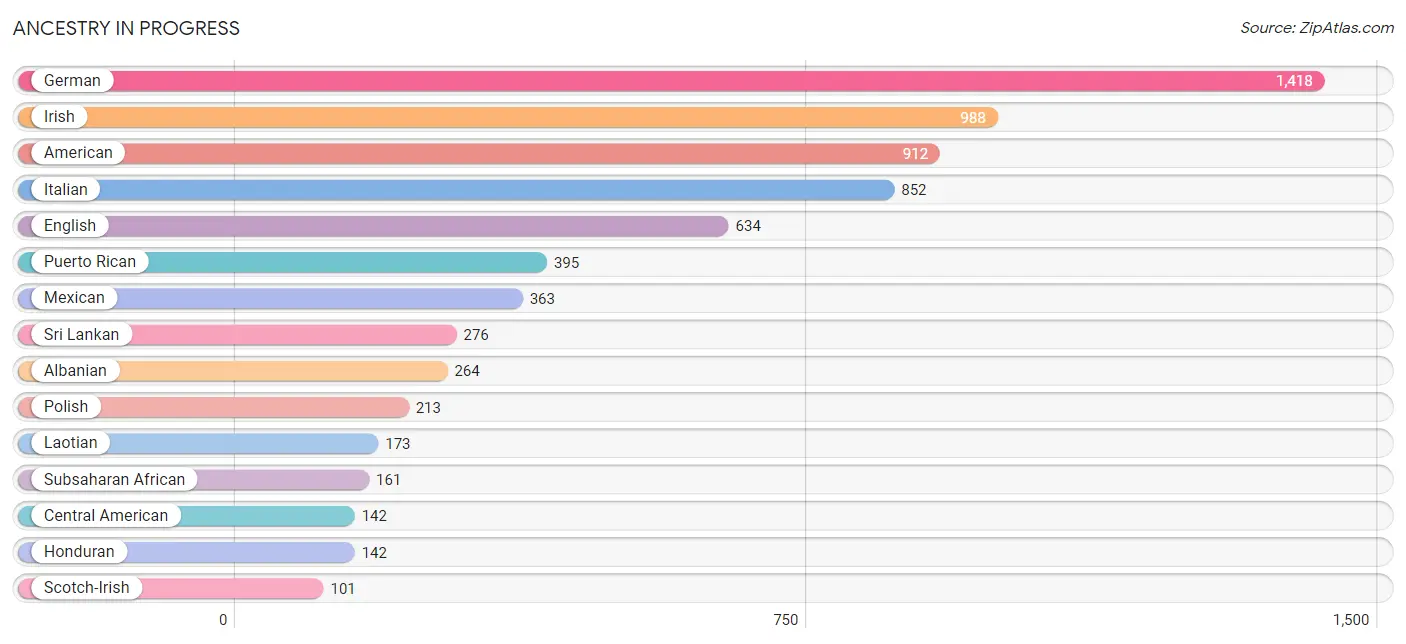
Ancestry in Progress
The most populous ancestries reported in Progress are German (1,418 | 12.5%), Irish (988 | 8.7%), American (912 | 8.0%), Italian (852 | 7.5%), and English (634 | 5.6%), together accounting for 42.3% of all Progress residents.
| Ancestry | # Population | % Population |
| African | 70 | 0.6% |
| Albanian | 264 | 2.3% |
| American | 912 | 8.0% |
| British | 58 | 0.5% |
| Burmese | 17 | 0.2% |
| Canadian | 9 | 0.1% |
| Central American | 142 | 1.3% |
| Cherokee | 9 | 0.1% |
| Croatian | 8 | 0.1% |
| Danish | 46 | 0.4% |
| Dominican | 17 | 0.2% |
| Dutch | 74 | 0.6% |
| Eastern European | 42 | 0.4% |
| English | 634 | 5.6% |
| European | 71 | 0.6% |
| French | 52 | 0.5% |
| German | 1,418 | 12.5% |
| Greek | 76 | 0.7% |
| Honduran | 142 | 1.3% |
| Hungarian | 18 | 0.2% |
| Indian (Asian) | 44 | 0.4% |
| Irish | 988 | 8.7% |
| Italian | 852 | 7.5% |
| Jamaican | 49 | 0.4% |
| Kenyan | 49 | 0.4% |
| Korean | 17 | 0.2% |
| Laotian | 173 | 1.5% |
| Lithuanian | 1 | 0.0% |
| Mexican | 363 | 3.2% |
| Norwegian | 7 | 0.1% |
| Pennsylvania German | 70 | 0.6% |
| Peruvian | 14 | 0.1% |
| Polish | 213 | 1.9% |
| Portuguese | 96 | 0.8% |
| Puerto Rican | 395 | 3.5% |
| Russian | 26 | 0.2% |
| Scotch-Irish | 101 | 0.9% |
| Scottish | 82 | 0.7% |
| Serbian | 7 | 0.1% |
| Slovak | 6 | 0.1% |
| Slovene | 8 | 0.1% |
| South American | 14 | 0.1% |
| Sri Lankan | 276 | 2.4% |
| Subsaharan African | 161 | 1.4% |
| Swedish | 22 | 0.2% |
| Swiss | 24 | 0.2% |
| Thai | 27 | 0.2% |
| Trinidadian and Tobagonian | 17 | 0.2% |
| Ukrainian | 9 | 0.1% |
| Welsh | 19 | 0.2% | View All 50 Rows |
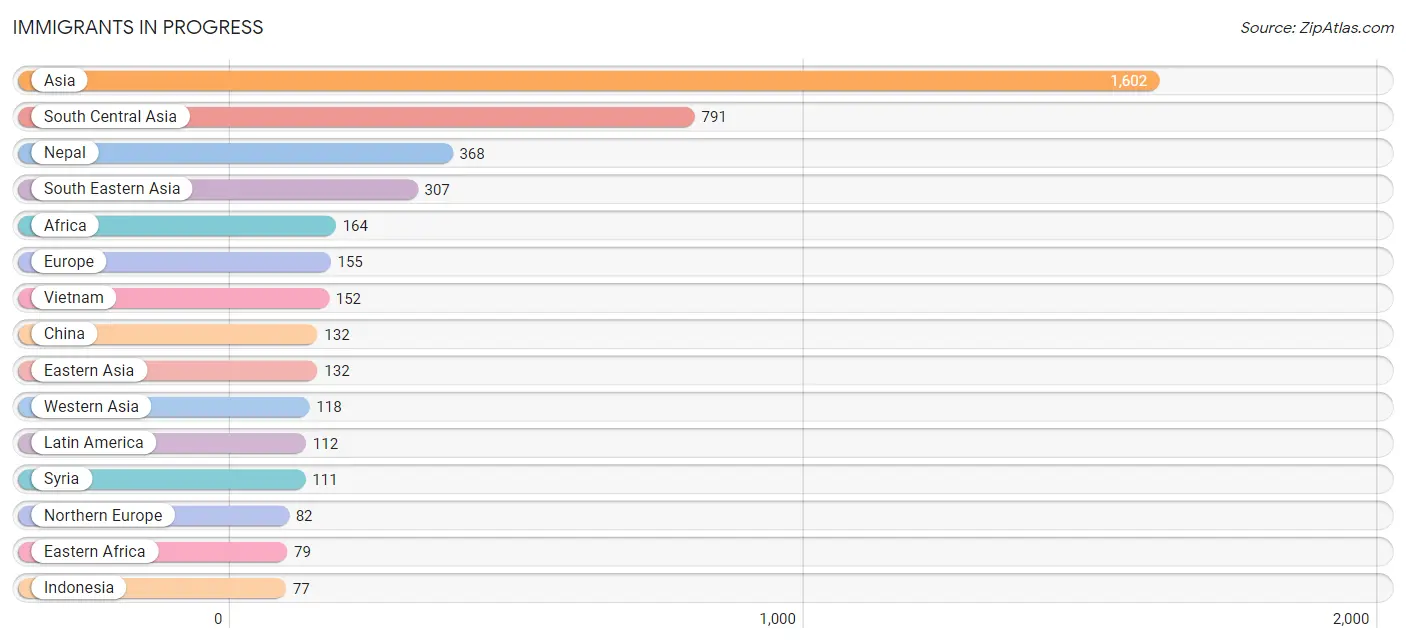
Immigrants in Progress
The most numerous immigrant groups reported in Progress came from Asia (1,602 | 14.1%), South Central Asia (791 | 7.0%), Nepal (368 | 3.2%), South Eastern Asia (307 | 2.7%), and Africa (164 | 1.4%), together accounting for 28.4% of all Progress residents.
| Immigration Origin | # Population | % Population |
| Africa | 164 | 1.4% |
| Asia | 1,602 | 14.1% |
| Caribbean | 44 | 0.4% |
| China | 132 | 1.2% |
| Eastern Africa | 79 | 0.7% |
| Eastern Asia | 132 | 1.2% |
| Eastern Europe | 19 | 0.2% |
| Europe | 155 | 1.4% |
| Germany | 15 | 0.1% |
| Greece | 9 | 0.1% |
| Haiti | 44 | 0.4% |
| India | 15 | 0.1% |
| Indonesia | 77 | 0.7% |
| Italy | 16 | 0.1% |
| Kenya | 49 | 0.4% |
| Latin America | 112 | 1.0% |
| Liberia | 43 | 0.4% |
| Malaysia | 61 | 0.5% |
| Middle Africa | 21 | 0.2% |
| Nepal | 368 | 3.2% |
| Netherlands | 14 | 0.1% |
| Northern Europe | 82 | 0.7% |
| Pakistan | 36 | 0.3% |
| Peru | 14 | 0.1% |
| Philippines | 17 | 0.2% |
| Russia | 19 | 0.2% |
| Sierra Leone | 21 | 0.2% |
| South America | 68 | 0.6% |
| South Central Asia | 791 | 7.0% |
| South Eastern Asia | 307 | 2.7% |
| Southern Europe | 25 | 0.2% |
| Syria | 111 | 1.0% |
| Uganda | 30 | 0.3% |
| Venezuela | 54 | 0.5% |
| Vietnam | 152 | 1.3% |
| Western Africa | 64 | 0.6% |
| Western Asia | 118 | 1.0% |
| Western Europe | 29 | 0.3% |
| Zaire | 21 | 0.2% | View All 39 Rows |
Sex and Age in Progress
Sex and Age in Progress
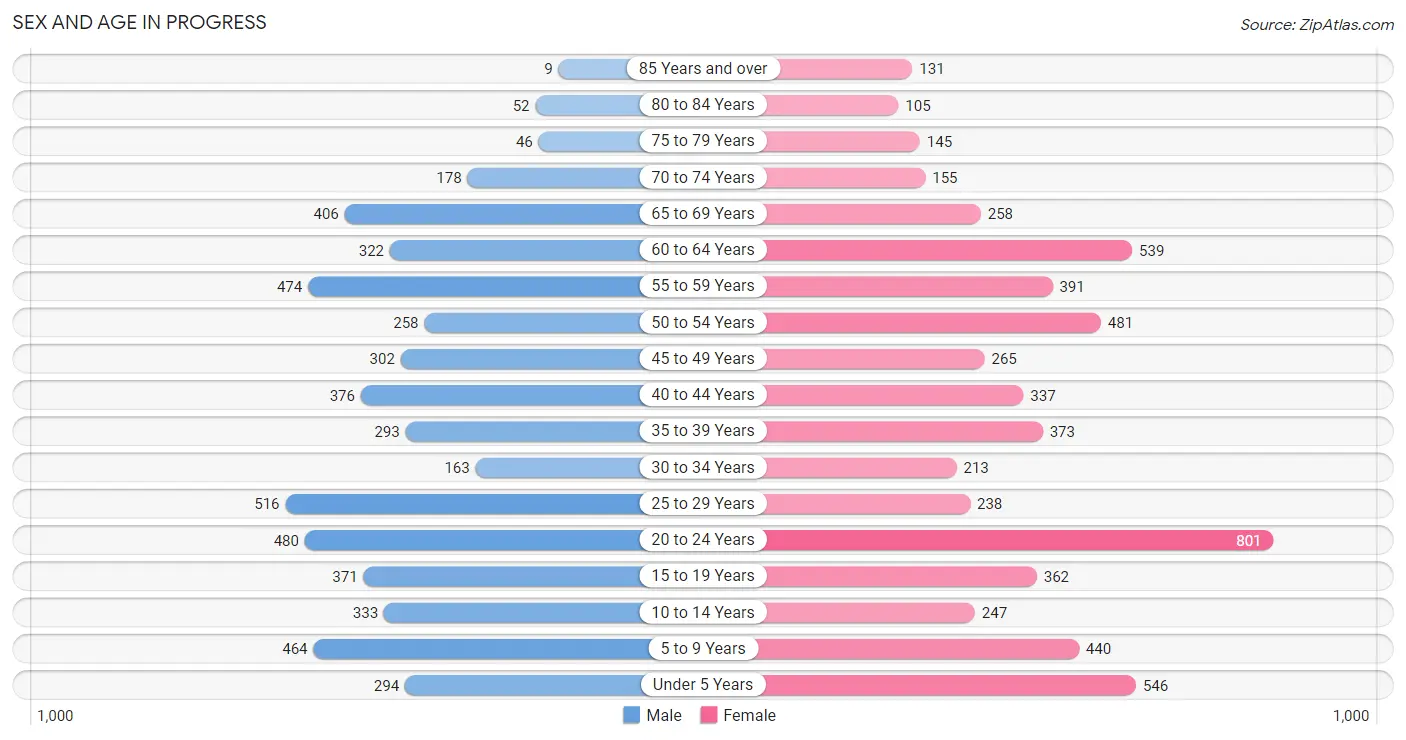
The most populous age groups in Progress are 25 to 29 Years (516 | 9.7%) for men and 20 to 24 Years (801 | 13.3%) for women.
| Age Bracket | Male | Female |
| Under 5 Years | 294 (5.5%) | 546 (9.1%) |
| 5 to 9 Years | 464 (8.7%) | 440 (7.3%) |
| 10 to 14 Years | 333 (6.2%) | 247 (4.1%) |
| 15 to 19 Years | 371 (7.0%) | 362 (6.0%) |
| 20 to 24 Years | 480 (9.0%) | 801 (13.3%) |
| 25 to 29 Years | 516 (9.7%) | 238 (4.0%) |
| 30 to 34 Years | 163 (3.0%) | 213 (3.5%) |
| 35 to 39 Years | 293 (5.5%) | 373 (6.2%) |
| 40 to 44 Years | 376 (7.0%) | 337 (5.6%) |
| 45 to 49 Years | 302 (5.7%) | 265 (4.4%) |
| 50 to 54 Years | 258 (4.8%) | 481 (8.0%) |
| 55 to 59 Years | 474 (8.9%) | 391 (6.5%) |
| 60 to 64 Years | 322 (6.0%) | 539 (8.9%) |
| 65 to 69 Years | 406 (7.6%) | 258 (4.3%) |
| 70 to 74 Years | 178 (3.3%) | 155 (2.6%) |
| 75 to 79 Years | 46 (0.9%) | 145 (2.4%) |
| 80 to 84 Years | 52 (1.0%) | 105 (1.7%) |
| 85 Years and over | 9 (0.2%) | 131 (2.2%) |
| Total | 5,337 (100.0%) | 6,027 (100.0%) |
Families and Households in Progress
Median Family Size in Progress
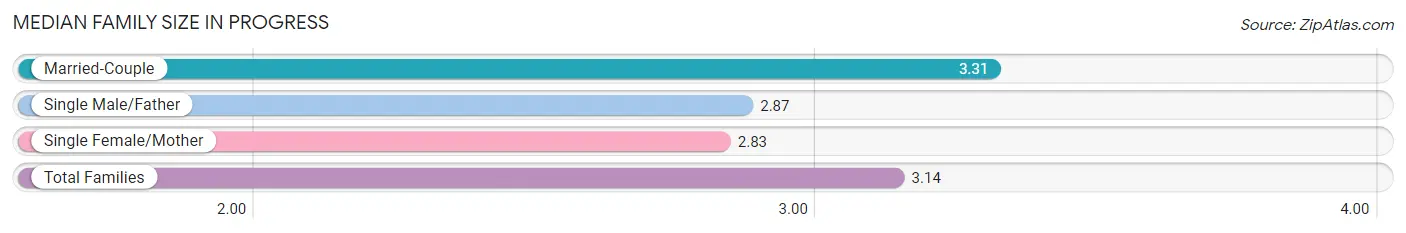
The median family size in Progress is 3.14 persons per family, with married-couple families (1,761 | 63.3%) accounting for the largest median family size of 3.31 persons per family. On the other hand, single female/mother families (744 | 26.7%) represent the smallest median family size with 2.83 persons per family.
| Family Type | # Families | Family Size |
| Married-Couple | 1,761 (63.3%) | 3.31 |
| Single Male/Father | 277 (10.0%) | 2.87 |
| Single Female/Mother | 744 (26.7%) | 2.83 |
| Total Families | 2,782 (100.0%) | 3.14 |
Median Household Size in Progress
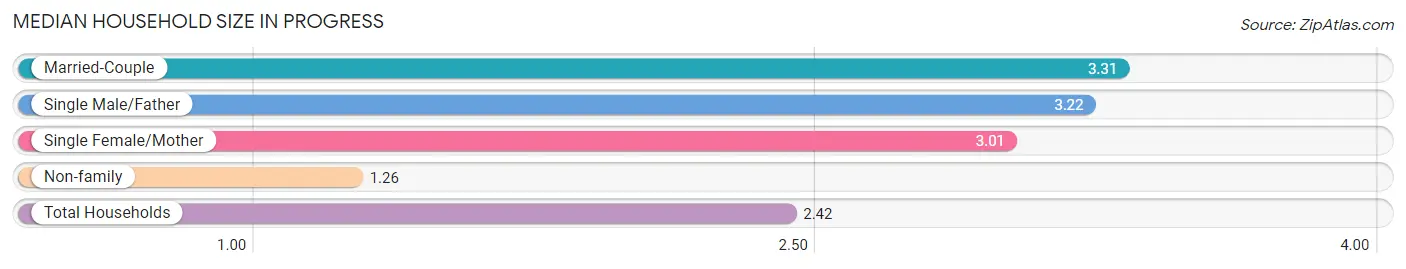
The median household size in Progress is 2.42 persons per household, with married-couple households (1,761 | 37.6%) accounting for the largest median household size of 3.31 persons per household. non-family households (1,898 | 40.6%) represent the smallest median household size with 1.26 persons per household.
| Household Type | # Households | Household Size |
| Married-Couple | 1,761 (37.6%) | 3.31 |
| Single Male/Father | 277 (5.9%) | 3.22 |
| Single Female/Mother | 744 (15.9%) | 3.01 |
| Non-family | 1,898 (40.6%) | 1.26 |
| Total Households | 4,680 (100.0%) | 2.42 |
Household Size by Marriage Status in Progress
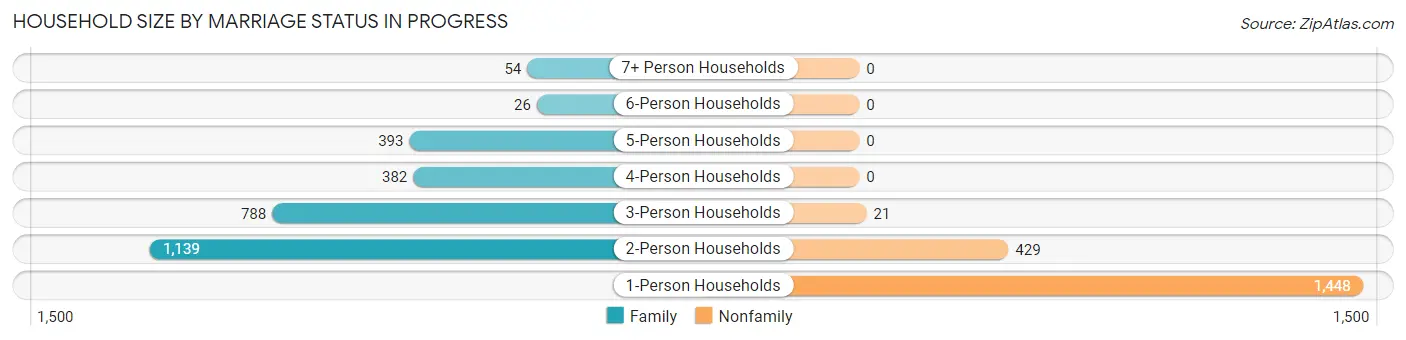
Out of a total of 4,680 households in Progress, 2,782 (59.4%) are family households, while 1,898 (40.6%) are nonfamily households. The most numerous type of family households are 2-person households, comprising 1,139, and the most common type of nonfamily households are 1-person households, comprising 1,448.
| Household Size | Family Households | Nonfamily Households |
| 1-Person Households | - | 1,448 (30.9%) |
| 2-Person Households | 1,139 (24.3%) | 429 (9.2%) |
| 3-Person Households | 788 (16.8%) | 21 (0.4%) |
| 4-Person Households | 382 (8.2%) | 0 (0.0%) |
| 5-Person Households | 393 (8.4%) | 0 (0.0%) |
| 6-Person Households | 26 (0.6%) | 0 (0.0%) |
| 7+ Person Households | 54 (1.1%) | 0 (0.0%) |
| Total | 2,782 (59.4%) | 1,898 (40.6%) |
Female Fertility in Progress
Fertility by Age in Progress
Average fertility rate in Progress is 61.0 births per 1,000 women. Women in the age bracket of 20 to 34 years have the highest fertility rate with 74.0 births per 1,000 women. Women in the age bracket of 20 to 34 years acount for 55.7% of all women with births.
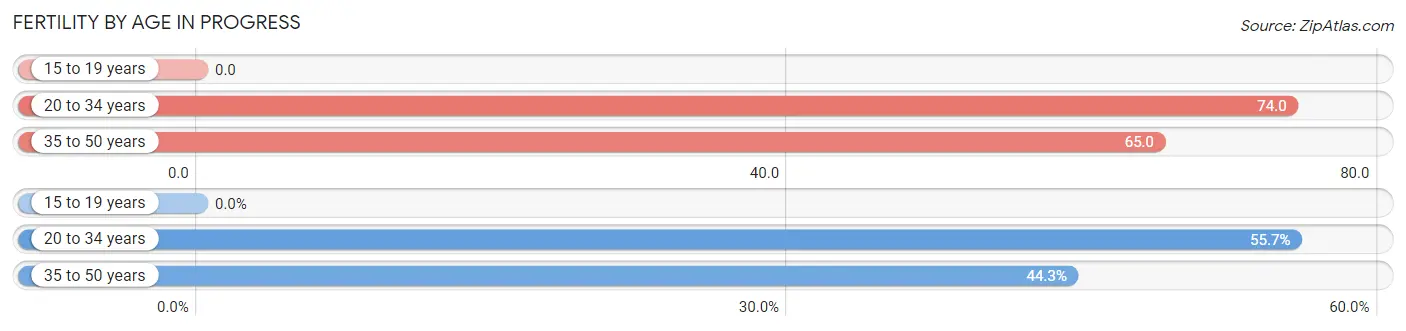
| Age Bracket | Women with Births | Births / 1,000 Women |
| 15 to 19 years | 0 (0.0%) | 0.0 |
| 20 to 34 years | 93 (55.7%) | 74.0 |
| 35 to 50 years | 74 (44.3%) | 65.0 |
| Total | 167 (100.0%) | 61.0 |
Fertility by Age by Marriage Status in Progress
40.7% of women with births (167) in Progress are married. The highest percentage of unmarried women with births falls into 20 to 34 years age bracket with 100.0% of them unmarried at the time of birth, while the lowest percentage of unmarried women with births belong to 35 to 50 years age bracket with 8.1% of them unmarried.
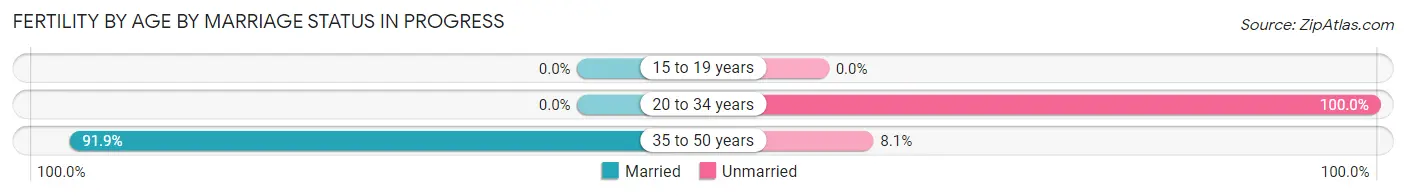
| Age Bracket | Married | Unmarried |
| 15 to 19 years | 0 (0.0%) | 0 (0.0%) |
| 20 to 34 years | 0 (0.0%) | 93 (100.0%) |
| 35 to 50 years | 68 (91.9%) | 6 (8.1%) |
| Total | 68 (40.7%) | 99 (59.3%) |
Fertility by Education in Progress
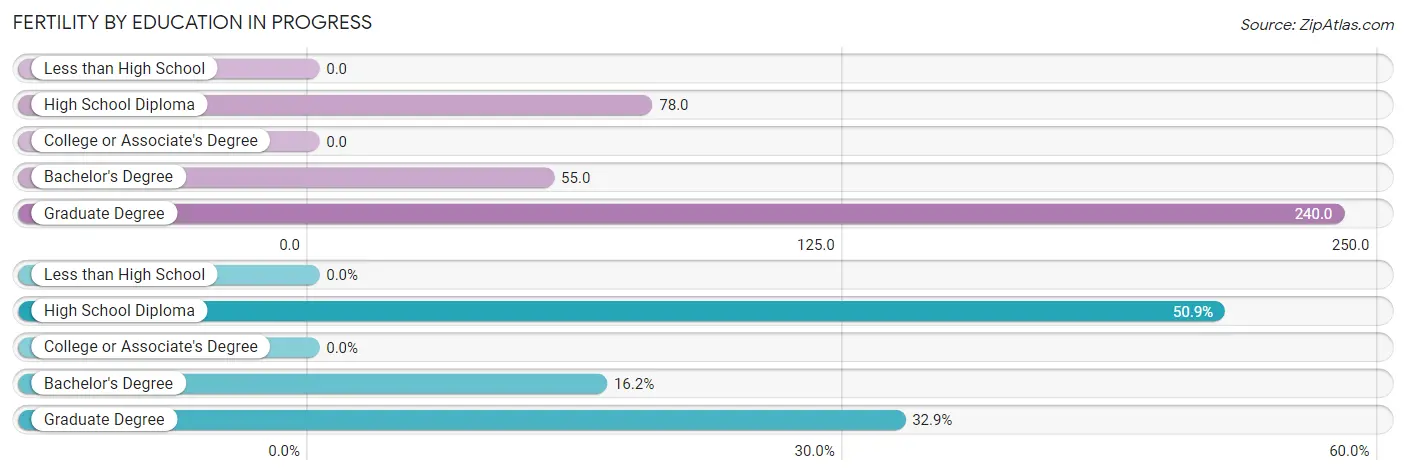
| Educational Attainment | Women with Births | Births / 1,000 Women |
| Less than High School | 0 (0.0%) | 0.0 |
| High School Diploma | 85 (50.9%) | 78.0 |
| College or Associate's Degree | 0 (0.0%) | 0.0 |
| Bachelor's Degree | 27 (16.2%) | 55.0 |
| Graduate Degree | 55 (32.9%) | 240.0 |
| Total | 167 (100.0%) | 61.0 |
Fertility by Education by Marriage Status in Progress
59.3% of women with births in Progress are unmarried. Women with the educational attainment of graduate degree are most likely to be married with 89.1% of them married at childbirth, while women with the educational attainment of high school diploma are least likely to be married with 100.0% of them unmarried at childbirth.
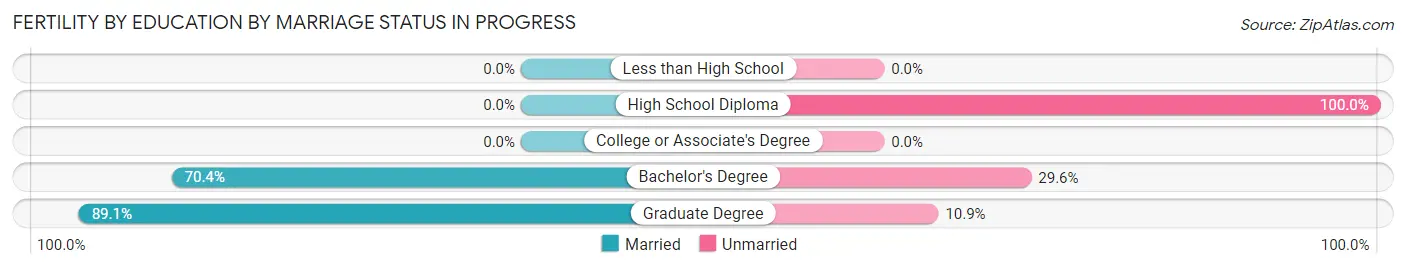
| Educational Attainment | Married | Unmarried |
| Less than High School | 0 (0.0%) | 0 (0.0%) |
| High School Diploma | 0 (0.0%) | 85 (100.0%) |
| College or Associate's Degree | 0 (0.0%) | 0 (0.0%) |
| Bachelor's Degree | 19 (70.4%) | 8 (29.6%) |
| Graduate Degree | 49 (89.1%) | 6 (10.9%) |
| Total | 68 (40.7%) | 99 (59.3%) |
Income in Progress
Income Overview in Progress
Per Capita Income in Progress is $33,814, while median incomes of families and households are $82,083 and $73,989 respectively.
| Characteristic | Number | Measure |
| Per Capita Income | 11,364 | $33,814 |
| Median Family Income | 2,782 | $82,083 |
| Mean Family Income | 2,782 | $95,724 |
| Median Household Income | 4,680 | $73,989 |
| Mean Household Income | 4,680 | $83,274 |
| Income Deficit | 2,782 | $0 |
| Wage / Income Gap (%) | 11,364 | 25.04% |
| Wage / Income Gap ($) | 11,364 | 74.96¢ per $1 |
| Gini / Inequality Index | 11,364 | 0.34 |
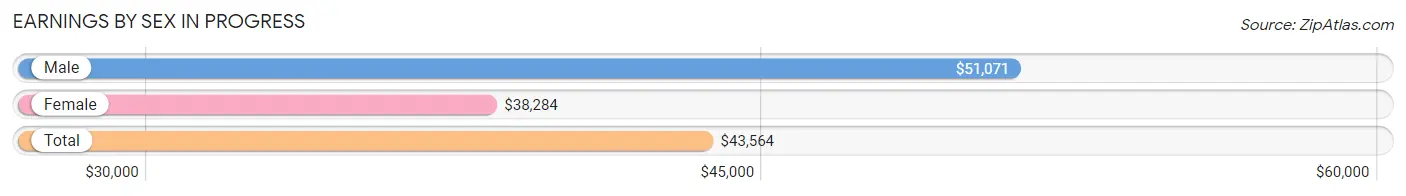
Earnings by Sex in Progress
Average Earnings in Progress are $43,564, $51,071 for men and $38,284 for women, a difference of 25.0%.
| Sex | Number | Average Earnings |
| Male | 3,460 (50.9%) | $51,071 |
| Female | 3,333 (49.1%) | $38,284 |
| Total | 6,793 (100.0%) | $43,564 |
Earnings by Sex by Income Bracket in Progress
The most common earnings brackets in Progress are $55,000 to $64,999 for men (698 | 20.2%) and $75,000 to $99,999 for women (438 | 13.1%).
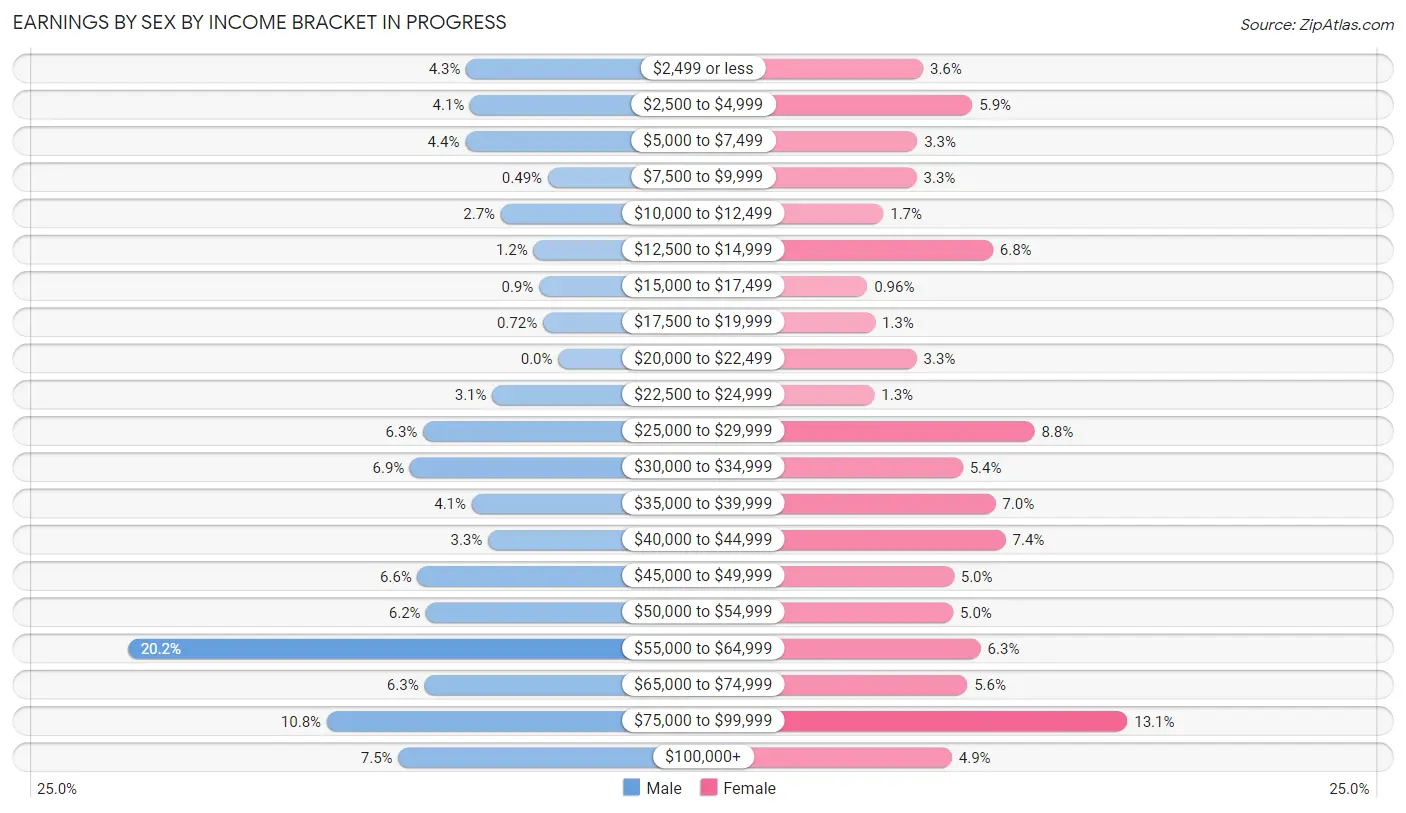
| Income | Male | Female |
| $2,499 or less | 149 (4.3%) | 119 (3.6%) |
| $2,500 to $4,999 | 143 (4.1%) | 196 (5.9%) |
| $5,000 to $7,499 | 151 (4.4%) | 110 (3.3%) |
| $7,500 to $9,999 | 17 (0.5%) | 109 (3.3%) |
| $10,000 to $12,499 | 93 (2.7%) | 57 (1.7%) |
| $12,500 to $14,999 | 40 (1.2%) | 228 (6.8%) |
| $15,000 to $17,499 | 31 (0.9%) | 32 (1.0%) |
| $17,500 to $19,999 | 25 (0.7%) | 44 (1.3%) |
| $20,000 to $22,499 | 0 (0.0%) | 109 (3.3%) |
| $22,500 to $24,999 | 107 (3.1%) | 43 (1.3%) |
| $25,000 to $29,999 | 219 (6.3%) | 293 (8.8%) |
| $30,000 to $34,999 | 240 (6.9%) | 181 (5.4%) |
| $35,000 to $39,999 | 140 (4.1%) | 232 (7.0%) |
| $40,000 to $44,999 | 114 (3.3%) | 248 (7.4%) |
| $45,000 to $49,999 | 228 (6.6%) | 167 (5.0%) |
| $50,000 to $54,999 | 214 (6.2%) | 166 (5.0%) |
| $55,000 to $64,999 | 698 (20.2%) | 209 (6.3%) |
| $65,000 to $74,999 | 217 (6.3%) | 188 (5.6%) |
| $75,000 to $99,999 | 375 (10.8%) | 438 (13.1%) |
| $100,000+ | 259 (7.5%) | 164 (4.9%) |
| Total | 3,460 (100.0%) | 3,333 (100.0%) |
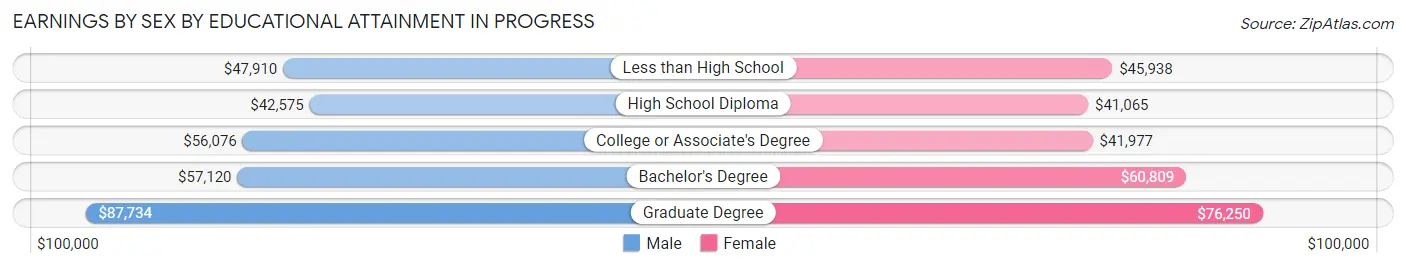
Earnings by Sex by Educational Attainment in Progress
Average earnings in Progress are $54,799 for men and $46,559 for women, a difference of 15.0%. Men with an educational attainment of graduate degree enjoy the highest average annual earnings of $87,734, while those with high school diploma education earn the least with $42,575. Women with an educational attainment of graduate degree earn the most with the average annual earnings of $76,250, while those with high school diploma education have the smallest earnings of $41,065.
| Educational Attainment | Male Income | Female Income |
| Less than High School | $47,910 | $45,938 |
| High School Diploma | $42,575 | $41,065 |
| College or Associate's Degree | $56,076 | $41,977 |
| Bachelor's Degree | $57,120 | $60,809 |
| Graduate Degree | $87,734 | $76,250 |
| Total | $54,799 | $46,559 |
Family Income in Progress
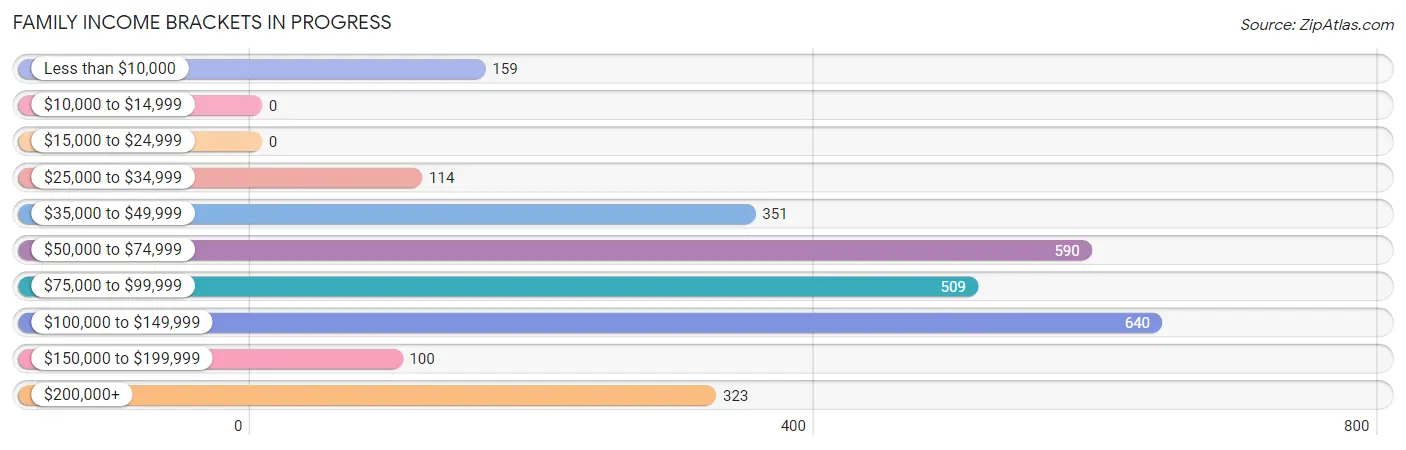
Family Income Brackets in Progress
According to the Progress family income data, there are 640 families falling into the $100,000 to $149,999 income range, which is the most common income bracket and makes up 23.0% of all families.
| Income Bracket | # Families | % Families |
| Less than $10,000 | 159 | 5.7% |
| $10,000 to $14,999 | 0 | 0.0% |
| $15,000 to $24,999 | 0 | 0.0% |
| $25,000 to $34,999 | 114 | 4.1% |
| $35,000 to $49,999 | 351 | 12.6% |
| $50,000 to $74,999 | 590 | 21.2% |
| $75,000 to $99,999 | 509 | 18.3% |
| $100,000 to $149,999 | 640 | 23.0% |
| $150,000 to $199,999 | 100 | 3.6% |
| $200,000+ | 323 | 11.6% |
Family Income by Famaliy Size in Progress
2-person families (1,261 | 45.3%) account for the highest median family income in Progress with $90,819 per family, while 2-person families (1,261 | 45.3%) have the highest median income of $45,410 per family member.
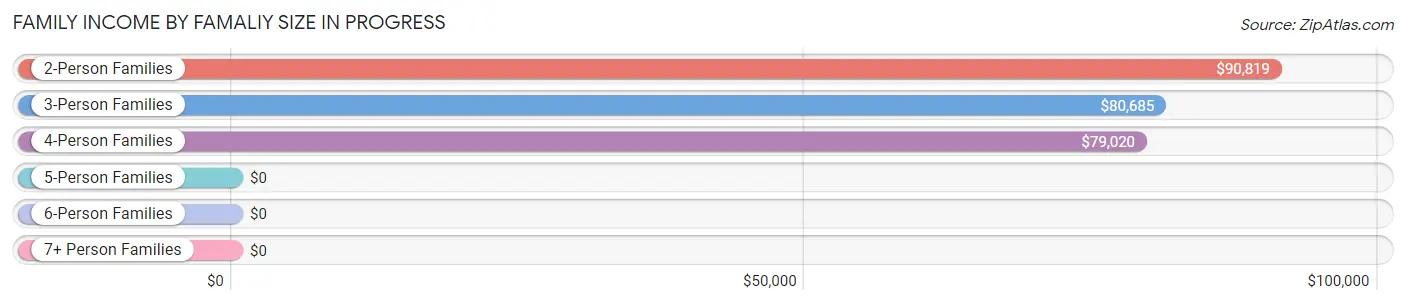
| Income Bracket | # Families | Median Income |
| 2-Person Families | 1,261 (45.3%) | $90,819 |
| 3-Person Families | 672 (24.2%) | $80,685 |
| 4-Person Families | 461 (16.6%) | $79,020 |
| 5-Person Families | 308 (11.1%) | $0 |
| 6-Person Families | 26 (0.9%) | $0 |
| 7+ Person Families | 54 (1.9%) | $0 |
| Total | 2,782 (100.0%) | $82,083 |
Family Income by Number of Earners in Progress
The median family income in Progress is $82,083, with families comprising 3+ earners (267) having the highest median family income of $114,336, while families with no earners (226) have the lowest median family income of $37,750, accounting for 9.6% and 8.1% of families, respectively.
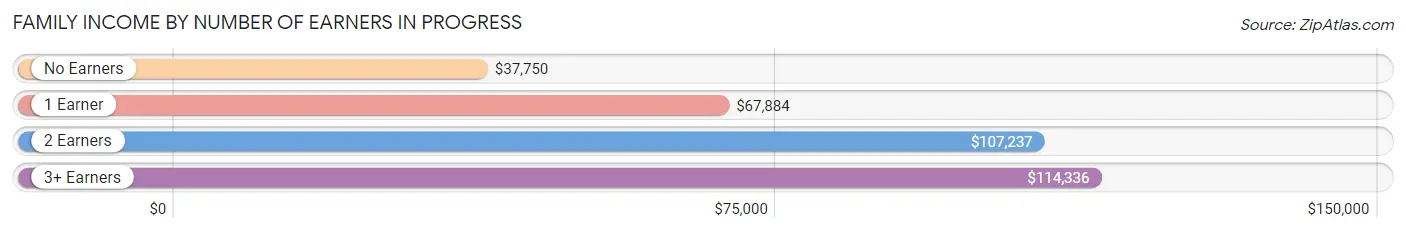
| Number of Earners | # Families | Median Income |
| No Earners | 226 (8.1%) | $37,750 |
| 1 Earner | 781 (28.1%) | $67,884 |
| 2 Earners | 1,508 (54.2%) | $107,237 |
| 3+ Earners | 267 (9.6%) | $114,336 |
| Total | 2,782 (100.0%) | $82,083 |
Household Income in Progress
Household Income Brackets in Progress
With 1,044 households falling in the category, the $50,000 to $74,999 income range is the most frequent in Progress, accounting for 22.3% of all households. In contrast, only 33 households (0.7%) fall into the $10,000 to $14,999 income bracket, making it the least populous group.
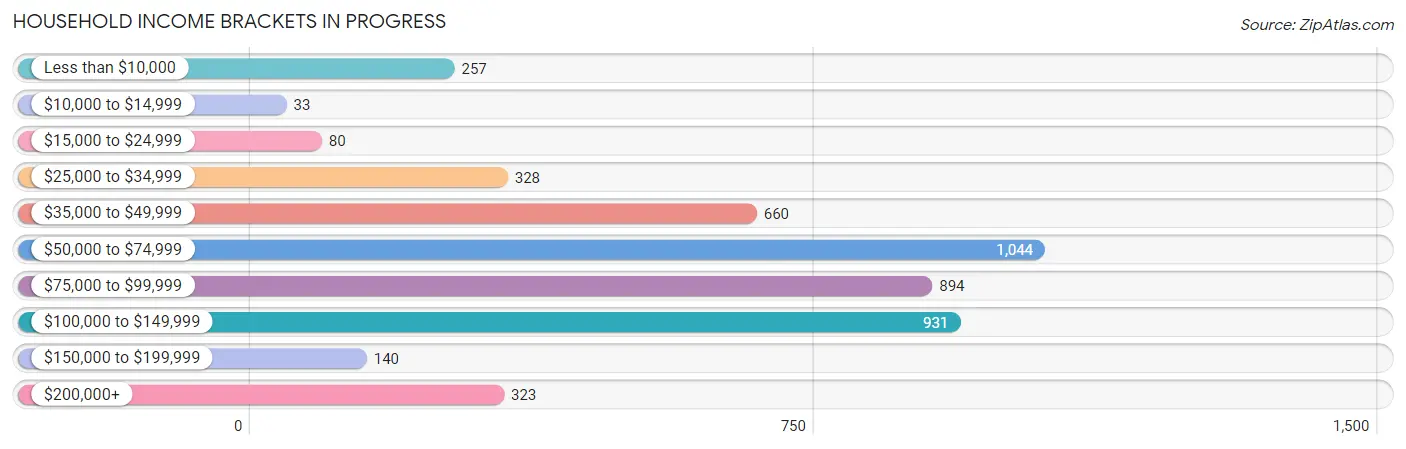
| Income Bracket | # Households | % Households |
| Less than $10,000 | 257 | 5.5% |
| $10,000 to $14,999 | 33 | 0.7% |
| $15,000 to $24,999 | 80 | 1.7% |
| $25,000 to $34,999 | 328 | 7.0% |
| $35,000 to $49,999 | 660 | 14.1% |
| $50,000 to $74,999 | 1,044 | 22.3% |
| $75,000 to $99,999 | 894 | 19.1% |
| $100,000 to $149,999 | 931 | 19.9% |
| $150,000 to $199,999 | 140 | 3.0% |
| $200,000+ | 323 | 6.9% |
Household Income by Householder Age in Progress
The median household income in Progress is $73,989, with the highest median household income of $83,155 found in the 45 to 64 years age bracket for the primary householder. A total of 1,990 households (42.5%) fall into this category. Meanwhile, the 65+ years age bracket for the primary householder has the lowest median household income of $58,409, with 912 households (19.5%) in this group.
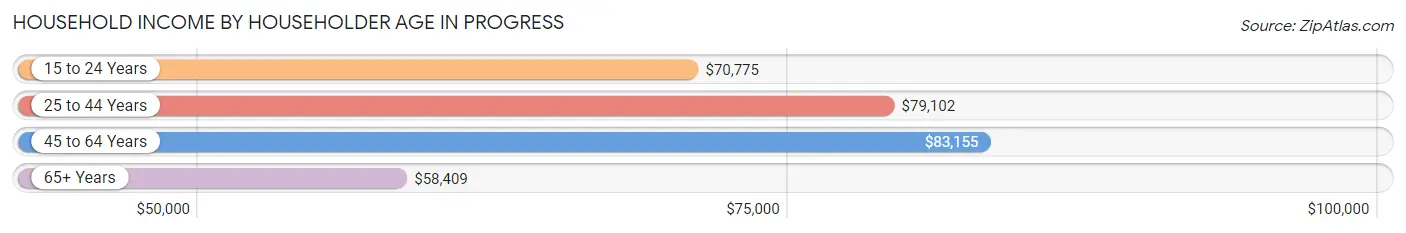
| Income Bracket | # Households | Median Income |
| 15 to 24 Years | 370 (7.9%) | $70,775 |
| 25 to 44 Years | 1,408 (30.1%) | $79,102 |
| 45 to 64 Years | 1,990 (42.5%) | $83,155 |
| 65+ Years | 912 (19.5%) | $58,409 |
| Total | 4,680 (100.0%) | $73,989 |
Poverty in Progress
Income Below Poverty by Sex and Age in Progress
With 6.0% poverty level for males and 10.7% for females among the residents of Progress, 12 to 14 year old males and 18 to 24 year old females are the most vulnerable to poverty, with 52 males (17.4%) and 276 females (32.4%) in their respective age groups living below the poverty level.
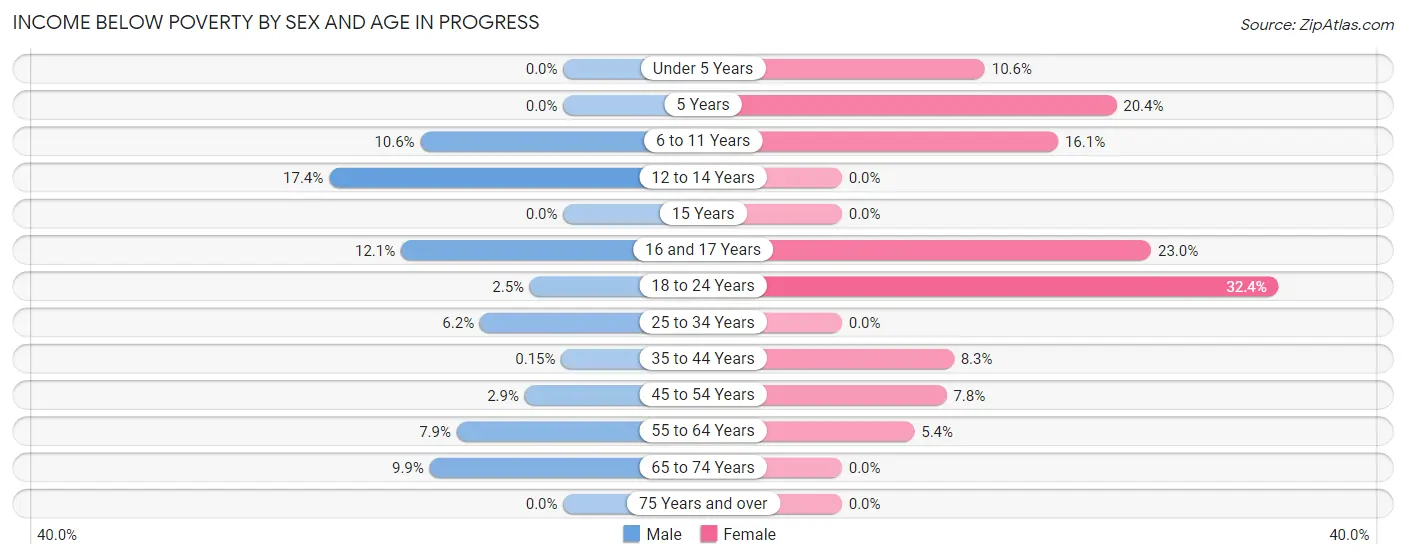
| Age Bracket | Male | Female |
| Under 5 Years | 0 (0.0%) | 58 (10.6%) |
| 5 Years | 0 (0.0%) | 32 (20.4%) |
| 6 to 11 Years | 52 (10.6%) | 69 (16.1%) |
| 12 to 14 Years | 52 (17.4%) | 0 (0.0%) |
| 15 Years | 0 (0.0%) | 0 (0.0%) |
| 16 and 17 Years | 20 (12.0%) | 45 (23.0%) |
| 18 to 24 Years | 17 (2.5%) | 276 (32.4%) |
| 25 to 34 Years | 42 (6.2%) | 0 (0.0%) |
| 35 to 44 Years | 1 (0.2%) | 59 (8.3%) |
| 45 to 54 Years | 16 (2.9%) | 58 (7.8%) |
| 55 to 64 Years | 63 (7.9%) | 50 (5.4%) |
| 65 to 74 Years | 58 (9.9%) | 0 (0.0%) |
| 75 Years and over | 0 (0.0%) | 0 (0.0%) |
| Total | 321 (6.0%) | 647 (10.7%) |
Income Above Poverty by Sex and Age in Progress
According to the poverty statistics in Progress, males aged under 5 years and females aged 12 to 14 years are the age groups that are most secure financially, with 100.0% of males and 100.0% of females in these age groups living above the poverty line.
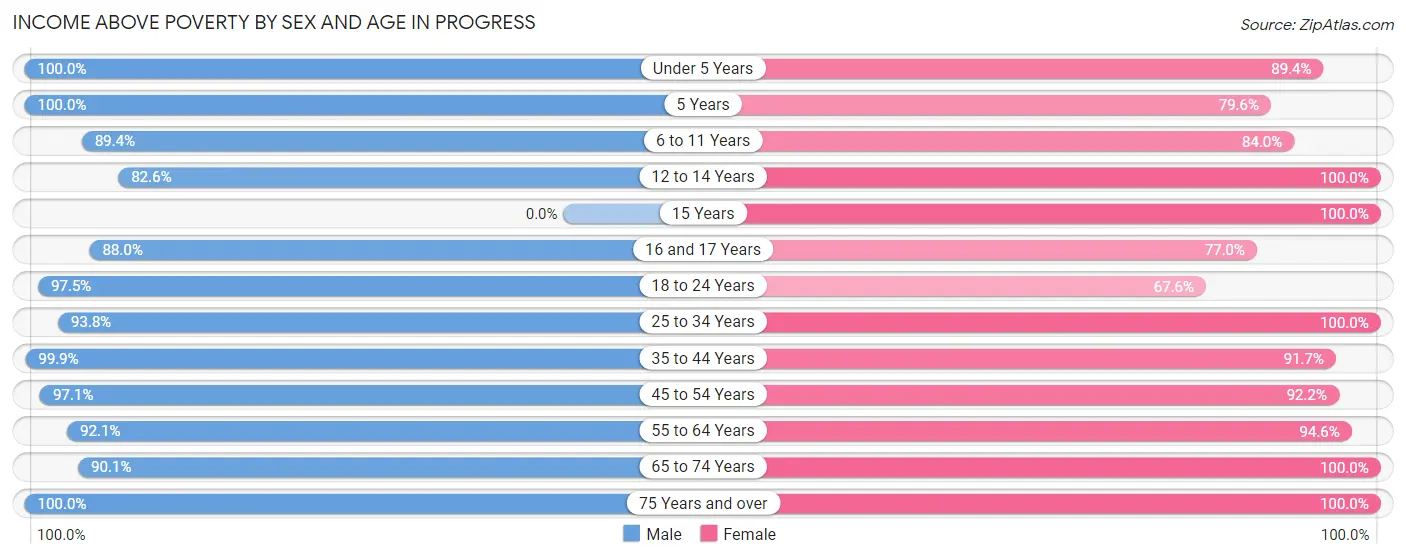
| Age Bracket | Male | Female |
| Under 5 Years | 294 (100.0%) | 488 (89.4%) |
| 5 Years | 8 (100.0%) | 125 (79.6%) |
| 6 to 11 Years | 438 (89.4%) | 361 (84.0%) |
| 12 to 14 Years | 247 (82.6%) | 100 (100.0%) |
| 15 Years | 0 (0.0%) | 116 (100.0%) |
| 16 and 17 Years | 146 (87.9%) | 151 (77.0%) |
| 18 to 24 Years | 668 (97.5%) | 575 (67.6%) |
| 25 to 34 Years | 637 (93.8%) | 451 (100.0%) |
| 35 to 44 Years | 668 (99.9%) | 651 (91.7%) |
| 45 to 54 Years | 544 (97.1%) | 688 (92.2%) |
| 55 to 64 Years | 733 (92.1%) | 880 (94.6%) |
| 65 to 74 Years | 526 (90.1%) | 413 (100.0%) |
| 75 Years and over | 107 (100.0%) | 381 (100.0%) |
| Total | 5,016 (94.0%) | 5,380 (89.3%) |
Income Below Poverty Among Married-Couple Families in Progress
The poverty statistics for married-couple families in Progress show that 2.7% or 48 of the total 1,761 families live below the poverty line. Families with 3 or 4 children have the highest poverty rate of 12.8%, comprising of 26 families. On the other hand, families with 1 or 2 children have the lowest poverty rate of 0.0%, which includes 0 families.
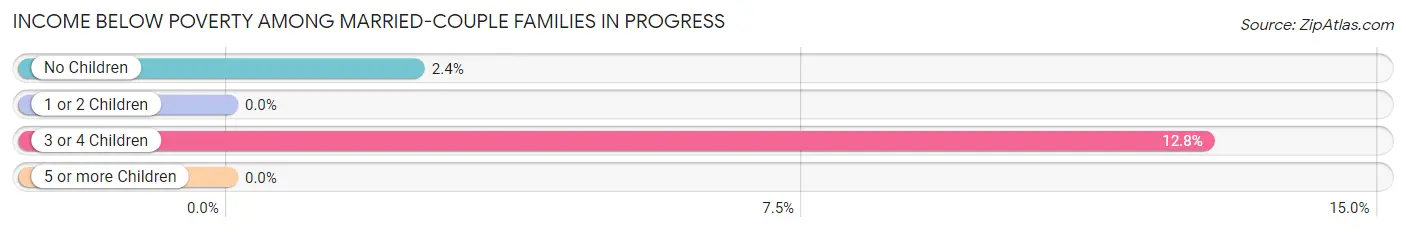
| Children | Above Poverty | Below Poverty |
| No Children | 878 (97.6%) | 22 (2.4%) |
| 1 or 2 Children | 635 (100.0%) | 0 (0.0%) |
| 3 or 4 Children | 178 (87.3%) | 26 (12.8%) |
| 5 or more Children | 22 (100.0%) | 0 (0.0%) |
| Total | 1,713 (97.3%) | 48 (2.7%) |
Income Below Poverty Among Single-Parent Households in Progress
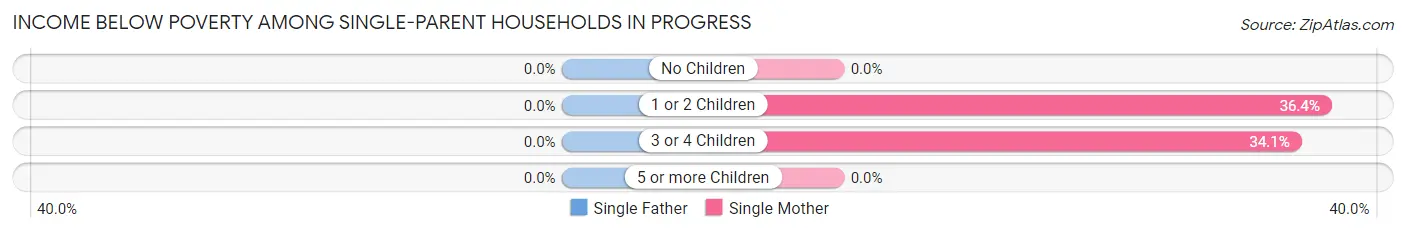
| Children | Single Father | Single Mother |
| No Children | 0 (0.0%) | 0 (0.0%) |
| 1 or 2 Children | 0 (0.0%) | 92 (36.4%) |
| 3 or 4 Children | 0 (0.0%) | 44 (34.1%) |
| 5 or more Children | 0 (0.0%) | 0 (0.0%) |
| Total | 0 (0.0%) | 136 (18.3%) |
Income Below Poverty Among Married-Couple vs Single-Parent Households in Progress
The poverty data for Progress shows that 48 of the married-couple family households (2.7%) and 136 of the single-parent households (13.3%) are living below the poverty level. Within the married-couple family households, those with 3 or 4 children have the highest poverty rate, with 26 households (12.8%) falling below the poverty line. Among the single-parent households, those with 3 or 4 children have the highest poverty rate, with 44 household (34.1%) living below poverty.
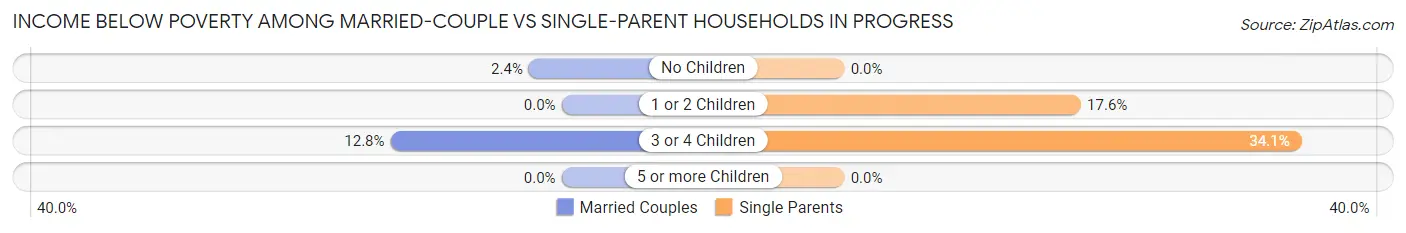
| Children | Married-Couple Families | Single-Parent Households |
| No Children | 22 (2.4%) | 0 (0.0%) |
| 1 or 2 Children | 0 (0.0%) | 92 (17.6%) |
| 3 or 4 Children | 26 (12.8%) | 44 (34.1%) |
| 5 or more Children | 0 (0.0%) | 0 (0.0%) |
| Total | 48 (2.7%) | 136 (13.3%) |
Employment Characteristics in Progress
Employment by Class of Employer in Progress
Among the 6,309 employed individuals in Progress, private company employees (4,518 | 71.6%), not-for-profit organizations (525 | 8.3%), and state government employees (518 | 8.2%) make up the most common classes of employment.
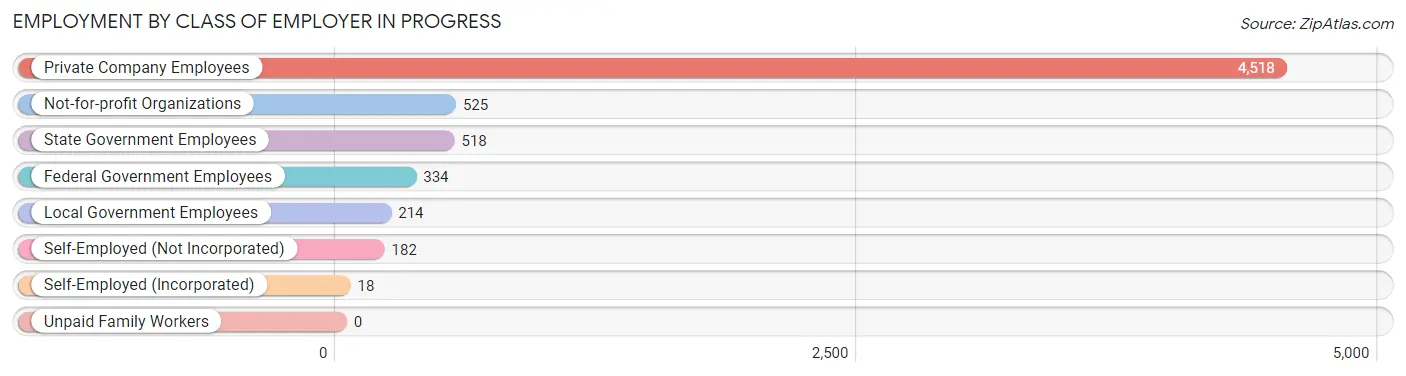
| Employer Class | # Employees | % Employees |
| Private Company Employees | 4,518 | 71.6% |
| Self-Employed (Incorporated) | 18 | 0.3% |
| Self-Employed (Not Incorporated) | 182 | 2.9% |
| Not-for-profit Organizations | 525 | 8.3% |
| Local Government Employees | 214 | 3.4% |
| State Government Employees | 518 | 8.2% |
| Federal Government Employees | 334 | 5.3% |
| Unpaid Family Workers | 0 | 0.0% |
| Total | 6,309 | 100.0% |
Employment Status by Age in Progress
According to the labor force statistics for Progress, out of the total population over 16 years of age (8,924), 73.6% or 6,568 individuals are in the labor force, with 2.2% or 144 of them unemployed. The age group with the highest labor force participation rate is 35 to 44 years, with 90.9% or 1,254 individuals in the labor force. Within the labor force, the 35 to 44 years age range has the highest percentage of unemployed individuals, with 6.7% or 84 of them being unemployed.
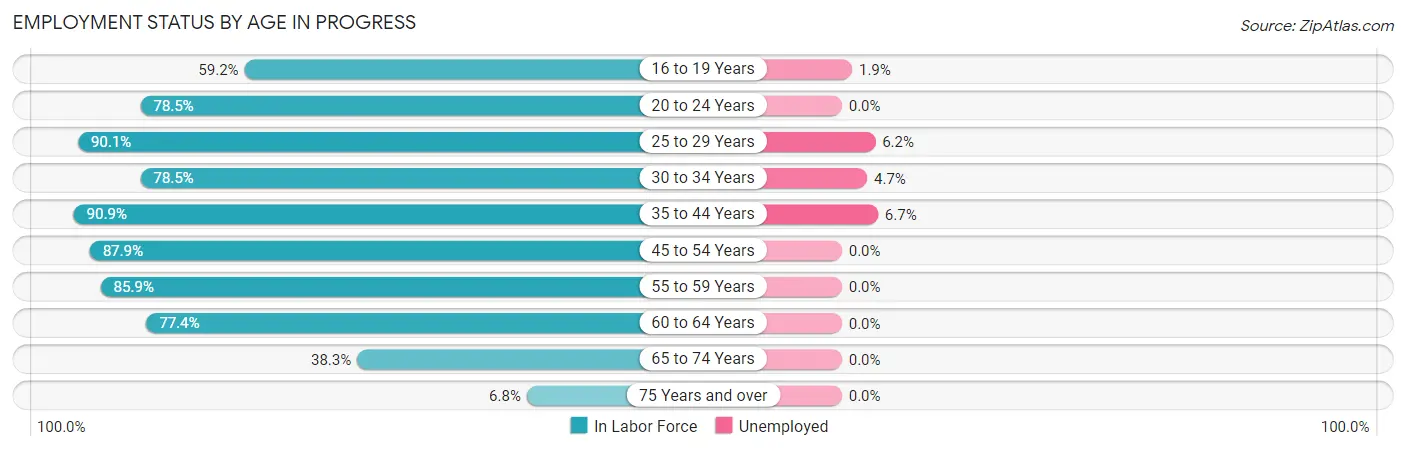
| Age Bracket | In Labor Force | Unemployed |
| 16 to 19 Years | 365 (59.2%) | 7 (1.9%) |
| 20 to 24 Years | 1,006 (78.5%) | 0 (0.0%) |
| 25 to 29 Years | 679 (90.1%) | 42 (6.2%) |
| 30 to 34 Years | 295 (78.5%) | 14 (4.7%) |
| 35 to 44 Years | 1,254 (90.9%) | 84 (6.7%) |
| 45 to 54 Years | 1,148 (87.9%) | 0 (0.0%) |
| 55 to 59 Years | 743 (85.9%) | 0 (0.0%) |
| 60 to 64 Years | 666 (77.4%) | 0 (0.0%) |
| 65 to 74 Years | 382 (38.3%) | 0 (0.0%) |
| 75 Years and over | 33 (6.8%) | 0 (0.0%) |
| Total | 6,568 (73.6%) | 144 (2.2%) |
Employment Status by Educational Attainment in Progress
According to labor force statistics for Progress, 86.4% of individuals (4,787) out of the total population between 25 and 64 years of age (5,541) are in the labor force, with 2.9% or 139 of them being unemployed. The group with the highest labor force participation rate are those with the educational attainment of bachelor's degree or higher, with 90.6% or 1,782 individuals in the labor force. Within the labor force, individuals with bachelor's degree or higher education have the highest percentage of unemployment, with 4.8% or 86 of them being unemployed.
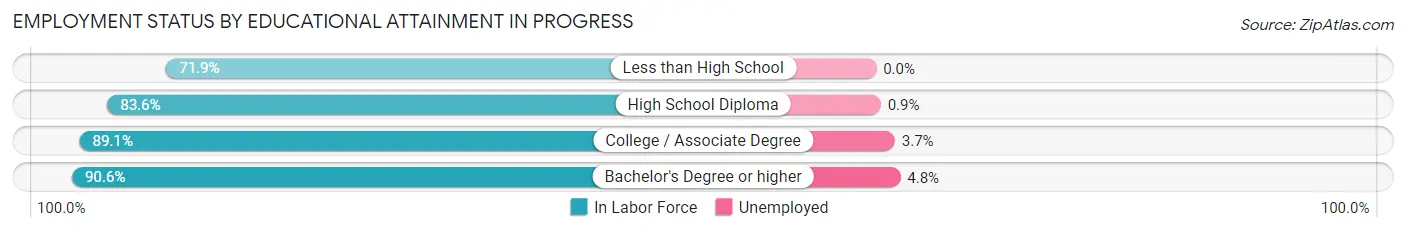
| Educational Attainment | In Labor Force | Unemployed |
| Less than High School | 338 (71.9%) | 0 (0.0%) |
| High School Diploma | 1,531 (83.6%) | 16 (0.9%) |
| College / Associate Degree | 1,134 (89.1%) | 47 (3.7%) |
| Bachelor's Degree or higher | 1,782 (90.6%) | 94 (4.8%) |
| Total | 4,787 (86.4%) | 161 (2.9%) |
Employment Occupations by Sex in Progress
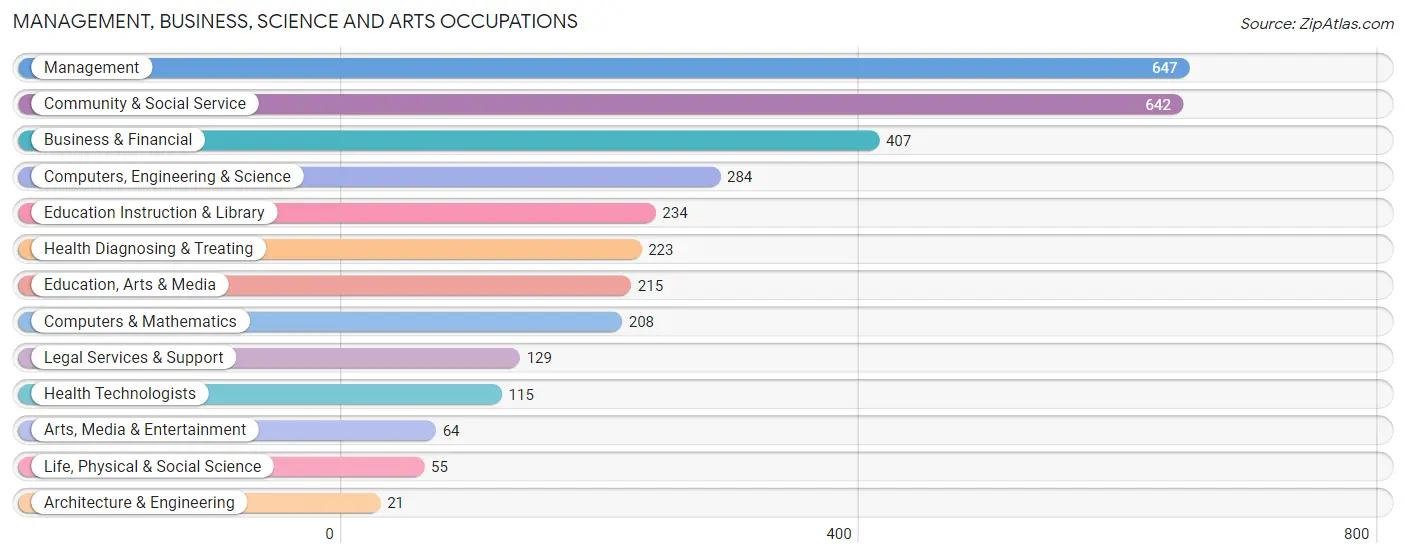
Management, Business, Science and Arts Occupations
The most common Management, Business, Science and Arts occupations in Progress are Management (647 | 10.1%), Community & Social Service (642 | 10.0%), Business & Financial (407 | 6.4%), Computers, Engineering & Science (284 | 4.4%), and Education Instruction & Library (234 | 3.7%).
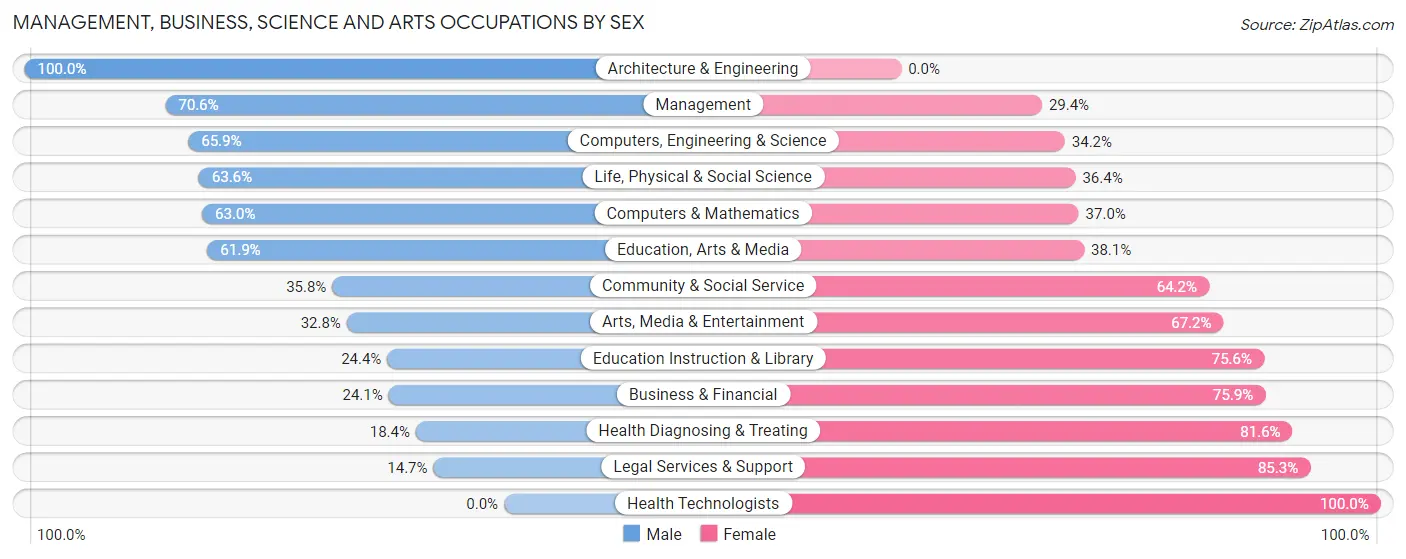
Management, Business, Science and Arts Occupations by Sex
Within the Management, Business, Science and Arts occupations in Progress, the most male-oriented occupations are Architecture & Engineering (100.0%), Management (70.6%), and Computers, Engineering & Science (65.8%), while the most female-oriented occupations are Health Technologists (100.0%), Legal Services & Support (85.3%), and Health Diagnosing & Treating (81.6%).
| Occupation | Male | Female |
| Management | 457 (70.6%) | 190 (29.4%) |
| Business & Financial | 98 (24.1%) | 309 (75.9%) |
| Computers, Engineering & Science | 187 (65.8%) | 97 (34.2%) |
| Computers & Mathematics | 131 (63.0%) | 77 (37.0%) |
| Architecture & Engineering | 21 (100.0%) | 0 (0.0%) |
| Life, Physical & Social Science | 35 (63.6%) | 20 (36.4%) |
| Community & Social Service | 230 (35.8%) | 412 (64.2%) |
| Education, Arts & Media | 133 (61.9%) | 82 (38.1%) |
| Legal Services & Support | 19 (14.7%) | 110 (85.3%) |
| Education Instruction & Library | 57 (24.4%) | 177 (75.6%) |
| Arts, Media & Entertainment | 21 (32.8%) | 43 (67.2%) |
| Health Diagnosing & Treating | 41 (18.4%) | 182 (81.6%) |
| Health Technologists | 0 (0.0%) | 115 (100.0%) |
| Total (Category) | 1,013 (46.0%) | 1,190 (54.0%) |
| Total (Overall) | 3,301 (51.6%) | 3,091 (48.4%) |
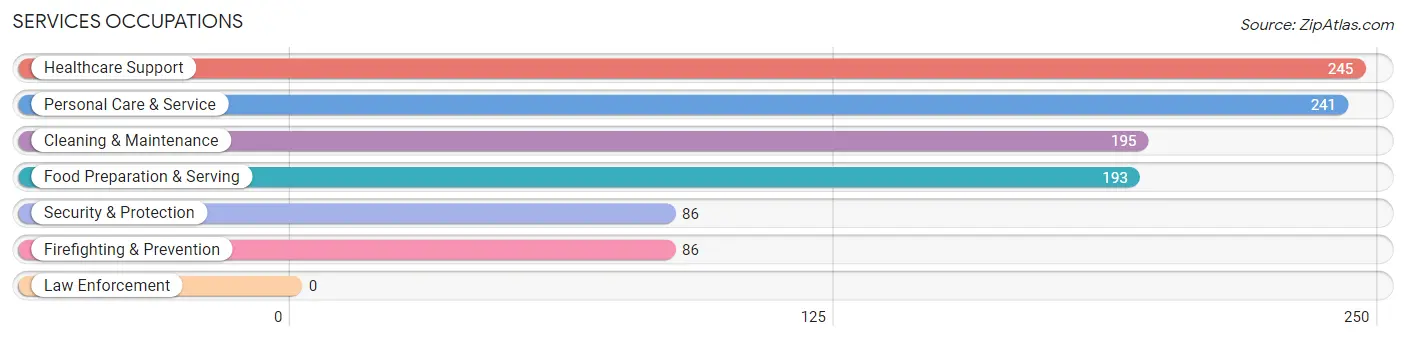
Services Occupations
The most common Services occupations in Progress are Healthcare Support (245 | 3.8%), Personal Care & Service (241 | 3.8%), Cleaning & Maintenance (195 | 3.0%), Food Preparation & Serving (193 | 3.0%), and Security & Protection (86 | 1.3%).
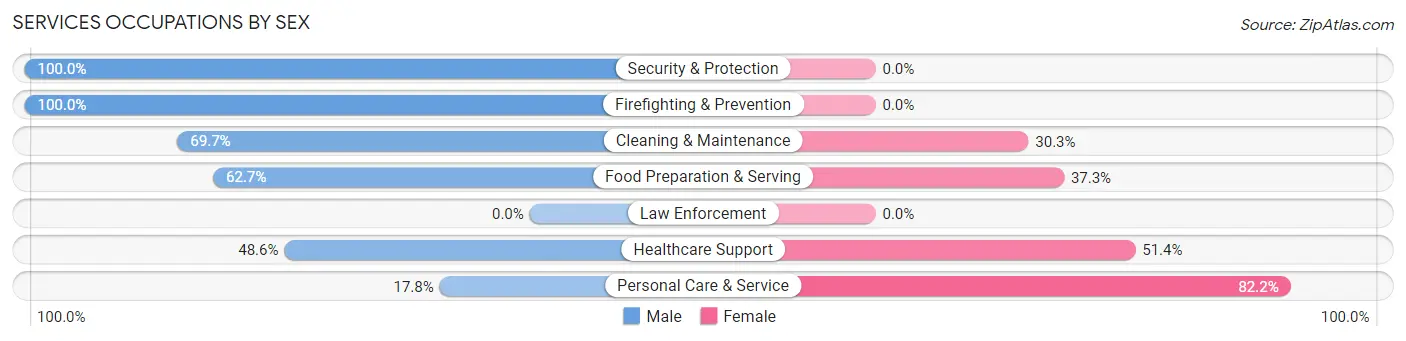
Services Occupations by Sex
Within the Services occupations in Progress, the most male-oriented occupations are Security & Protection (100.0%), Firefighting & Prevention (100.0%), and Cleaning & Maintenance (69.7%), while the most female-oriented occupations are Personal Care & Service (82.2%), Healthcare Support (51.4%), and Food Preparation & Serving (37.3%).
| Occupation | Male | Female |
| Healthcare Support | 119 (48.6%) | 126 (51.4%) |
| Security & Protection | 86 (100.0%) | 0 (0.0%) |
| Firefighting & Prevention | 86 (100.0%) | 0 (0.0%) |
| Law Enforcement | 0 (0.0%) | 0 (0.0%) |
| Food Preparation & Serving | 121 (62.7%) | 72 (37.3%) |
| Cleaning & Maintenance | 136 (69.7%) | 59 (30.3%) |
| Personal Care & Service | 43 (17.8%) | 198 (82.2%) |
| Total (Category) | 505 (52.6%) | 455 (47.4%) |
| Total (Overall) | 3,301 (51.6%) | 3,091 (48.4%) |
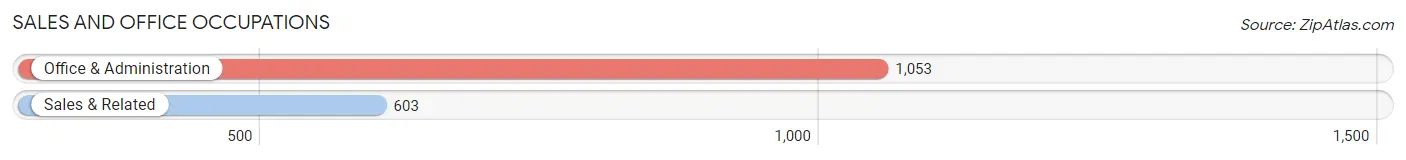
Sales and Office Occupations
The most common Sales and Office occupations in Progress are Office & Administration (1,053 | 16.5%), and Sales & Related (603 | 9.4%).
Sales and Office Occupations by Sex
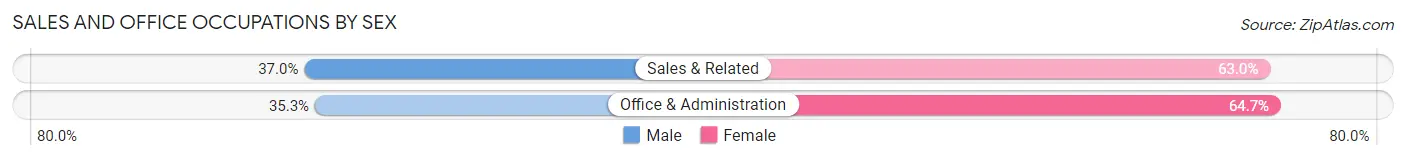
| Occupation | Male | Female |
| Sales & Related | 223 (37.0%) | 380 (63.0%) |
| Office & Administration | 372 (35.3%) | 681 (64.7%) |
| Total (Category) | 595 (35.9%) | 1,061 (64.1%) |
| Total (Overall) | 3,301 (51.6%) | 3,091 (48.4%) |
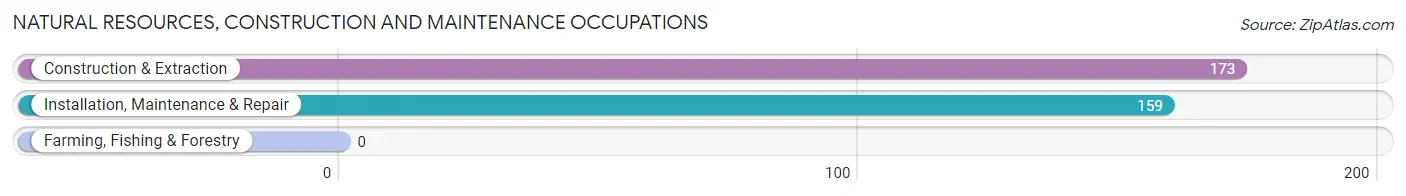
Natural Resources, Construction and Maintenance Occupations
The most common Natural Resources, Construction and Maintenance occupations in Progress are Construction & Extraction (173 | 2.7%), and Installation, Maintenance & Repair (159 | 2.5%).
Natural Resources, Construction and Maintenance Occupations by Sex
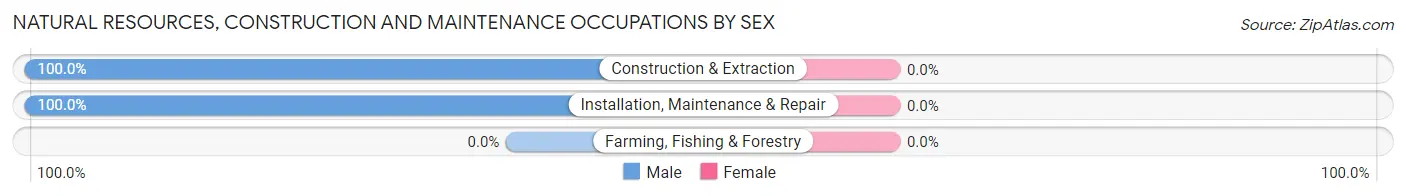
| Occupation | Male | Female |
| Farming, Fishing & Forestry | 0 (0.0%) | 0 (0.0%) |
| Construction & Extraction | 173 (100.0%) | 0 (0.0%) |
| Installation, Maintenance & Repair | 159 (100.0%) | 0 (0.0%) |
| Total (Category) | 332 (100.0%) | 0 (0.0%) |
| Total (Overall) | 3,301 (51.6%) | 3,091 (48.4%) |
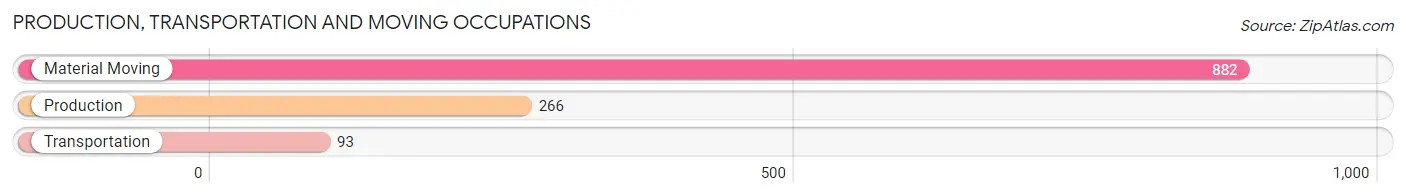
Production, Transportation and Moving Occupations
The most common Production, Transportation and Moving occupations in Progress are Material Moving (882 | 13.8%), Production (266 | 4.2%), and Transportation (93 | 1.5%).
Production, Transportation and Moving Occupations by Sex
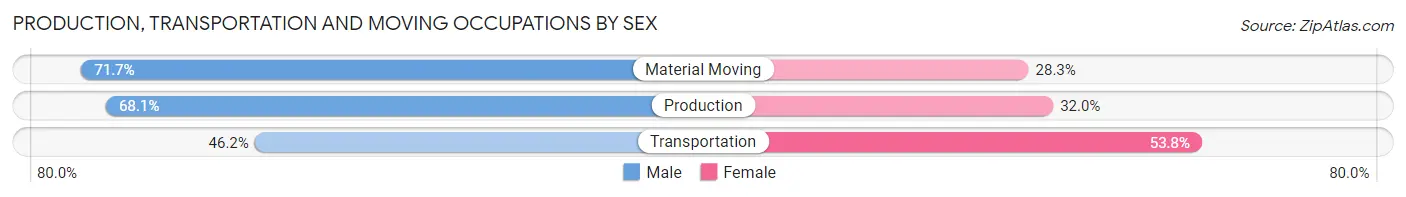
| Occupation | Male | Female |
| Production | 181 (68.0%) | 85 (32.0%) |
| Transportation | 43 (46.2%) | 50 (53.8%) |
| Material Moving | 632 (71.7%) | 250 (28.3%) |
| Total (Category) | 856 (69.0%) | 385 (31.0%) |
| Total (Overall) | 3,301 (51.6%) | 3,091 (48.4%) |
Employment Industries by Sex in Progress
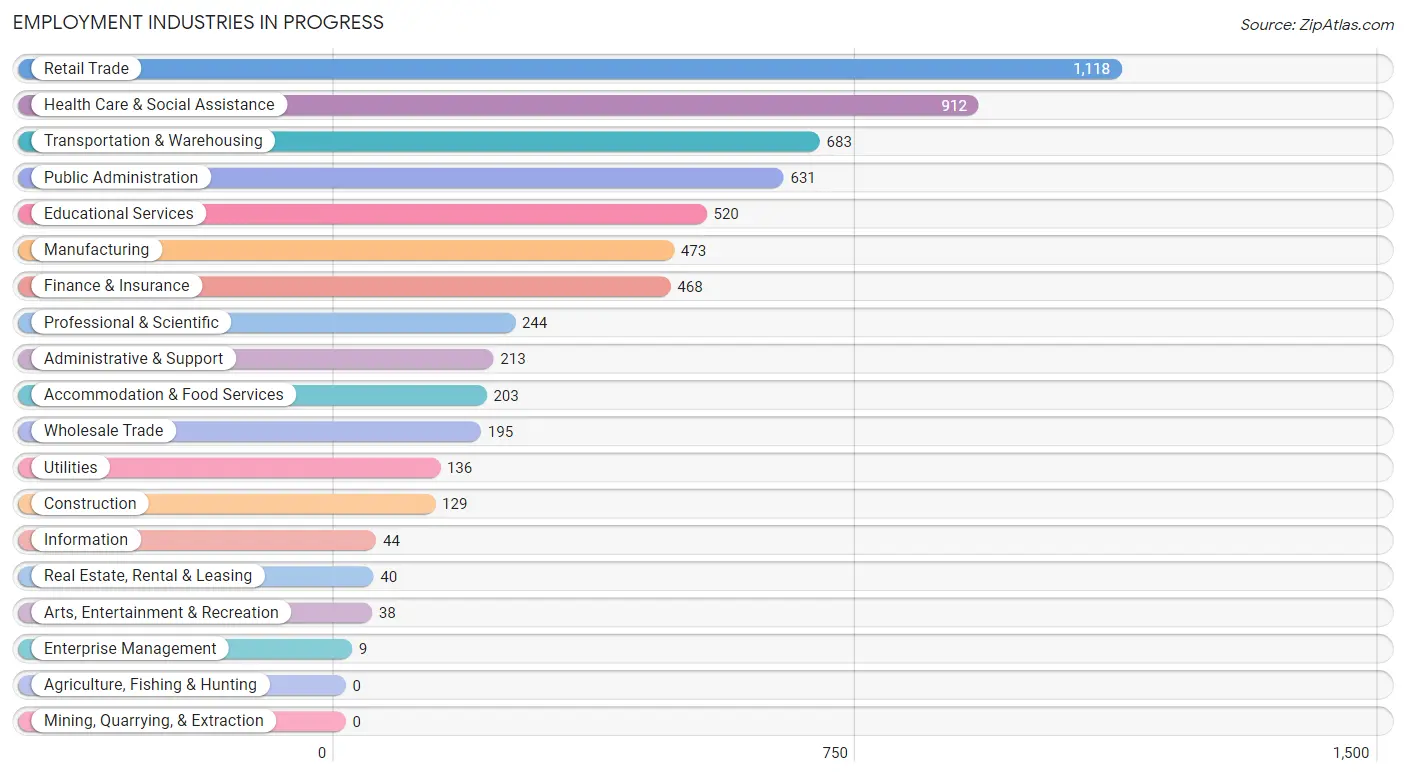
Employment Industries in Progress
The major employment industries in Progress include Retail Trade (1,118 | 17.5%), Health Care & Social Assistance (912 | 14.3%), Transportation & Warehousing (683 | 10.7%), Public Administration (631 | 9.9%), and Educational Services (520 | 8.1%).
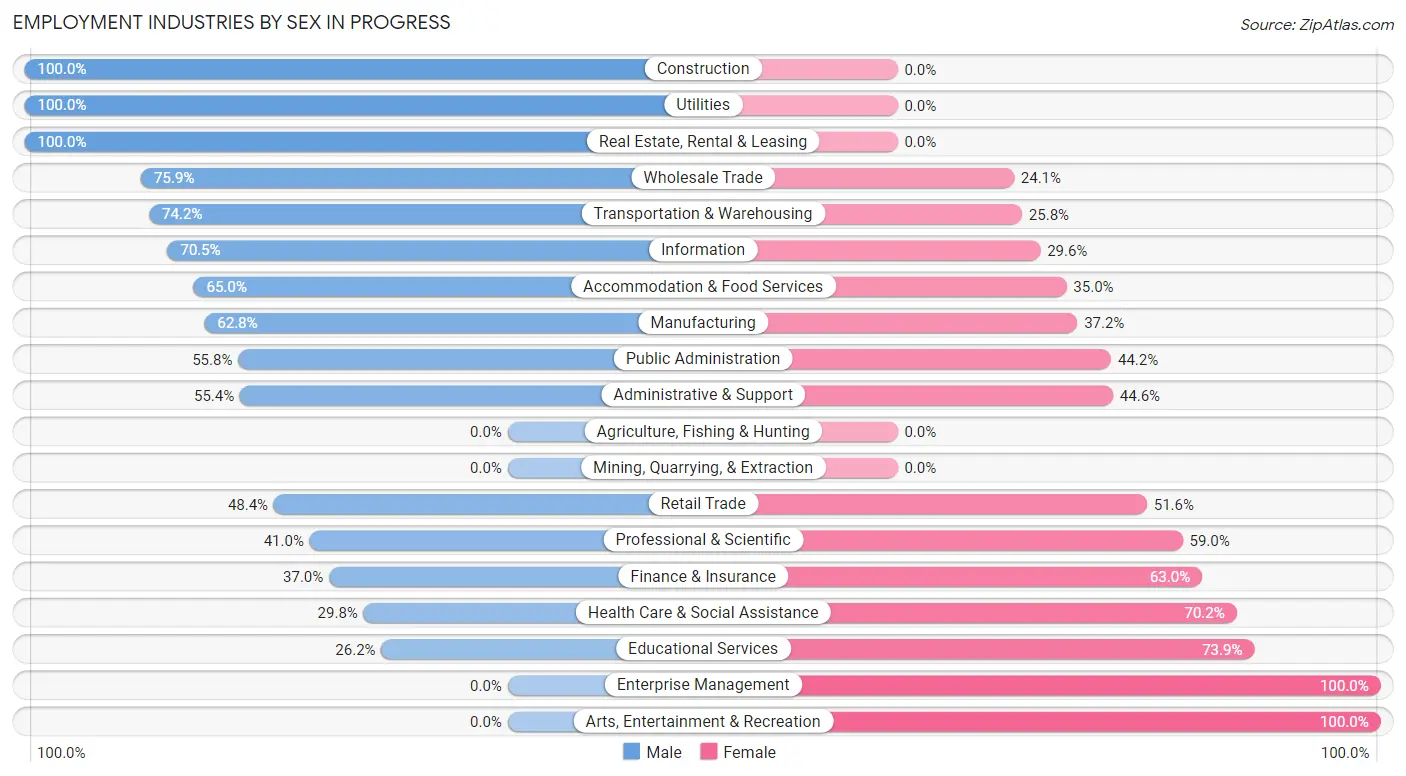
Employment Industries by Sex in Progress
The Progress industries that see more men than women are Construction (100.0%), Utilities (100.0%), and Real Estate, Rental & Leasing (100.0%), whereas the industries that tend to have a higher number of women are Enterprise Management (100.0%), Arts, Entertainment & Recreation (100.0%), and Educational Services (73.9%).
| Industry | Male | Female |
| Agriculture, Fishing & Hunting | 0 (0.0%) | 0 (0.0%) |
| Mining, Quarrying, & Extraction | 0 (0.0%) | 0 (0.0%) |
| Construction | 129 (100.0%) | 0 (0.0%) |
| Manufacturing | 297 (62.8%) | 176 (37.2%) |
| Wholesale Trade | 148 (75.9%) | 47 (24.1%) |
| Retail Trade | 541 (48.4%) | 577 (51.6%) |
| Transportation & Warehousing | 507 (74.2%) | 176 (25.8%) |
| Utilities | 136 (100.0%) | 0 (0.0%) |
| Information | 31 (70.5%) | 13 (29.5%) |
| Finance & Insurance | 173 (37.0%) | 295 (63.0%) |
| Real Estate, Rental & Leasing | 40 (100.0%) | 0 (0.0%) |
| Professional & Scientific | 100 (41.0%) | 144 (59.0%) |
| Enterprise Management | 0 (0.0%) | 9 (100.0%) |
| Administrative & Support | 118 (55.4%) | 95 (44.6%) |
| Educational Services | 136 (26.2%) | 384 (73.9%) |
| Health Care & Social Assistance | 272 (29.8%) | 640 (70.2%) |
| Arts, Entertainment & Recreation | 0 (0.0%) | 38 (100.0%) |
| Accommodation & Food Services | 132 (65.0%) | 71 (35.0%) |
| Public Administration | 352 (55.8%) | 279 (44.2%) |
| Total | 3,301 (51.6%) | 3,091 (48.4%) |
Education in Progress
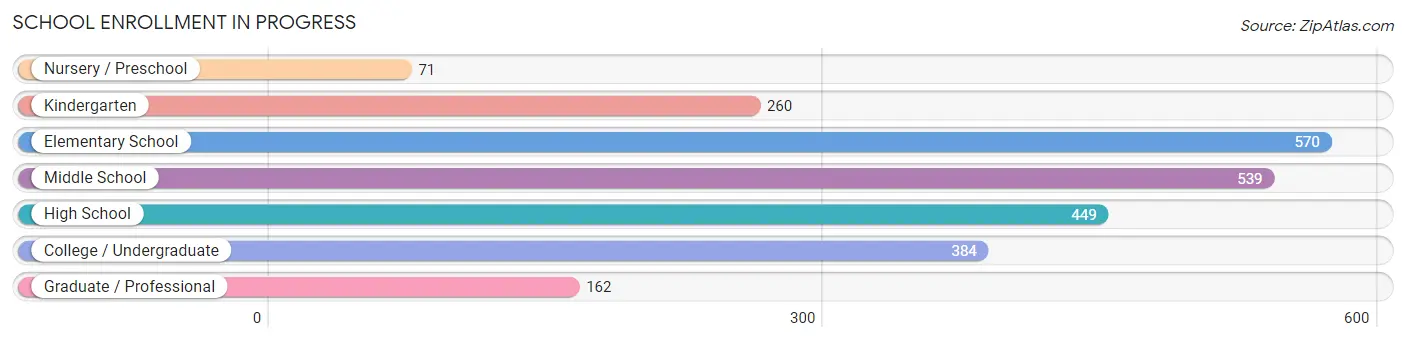
School Enrollment in Progress
The most common levels of schooling among the 2,435 students in Progress are elementary school (570 | 23.4%), middle school (539 | 22.1%), and high school (449 | 18.4%).
| School Level | # Students | % Students |
| Nursery / Preschool | 71 | 2.9% |
| Kindergarten | 260 | 10.7% |
| Elementary School | 570 | 23.4% |
| Middle School | 539 | 22.1% |
| High School | 449 | 18.4% |
| College / Undergraduate | 384 | 15.8% |
| Graduate / Professional | 162 | 6.7% |
| Total | 2,435 | 100.0% |
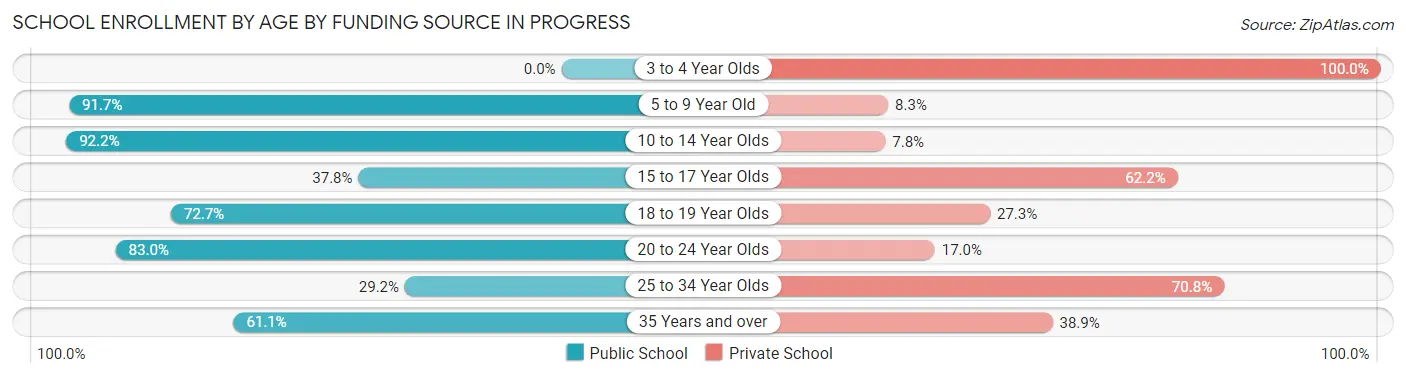
School Enrollment by Age by Funding Source in Progress
Out of a total of 2,435 students who are enrolled in schools in Progress, 548 (22.5%) attend a private institution, while the remaining 1,887 (77.5%) are enrolled in public schools. The age group of 3 to 4 year olds has the highest likelihood of being enrolled in private schools, with 20 (100.0% in the age bracket) enrolled. Conversely, the age group of 10 to 14 year olds has the lowest likelihood of being enrolled in a private school, with 535 (92.2% in the age bracket) attending a public institution.
| Age Bracket | Public School | Private School |
| 3 to 4 Year Olds | 0 (0.0%) | 20 (100.0%) |
| 5 to 9 Year Old | 808 (91.7%) | 73 (8.3%) |
| 10 to 14 Year Olds | 535 (92.2%) | 45 (7.8%) |
| 15 to 17 Year Olds | 143 (37.8%) | 235 (62.2%) |
| 18 to 19 Year Olds | 56 (72.7%) | 21 (27.3%) |
| 20 to 24 Year Olds | 181 (83.0%) | 37 (17.0%) |
| 25 to 34 Year Olds | 7 (29.2%) | 17 (70.8%) |
| 35 Years and over | 157 (61.1%) | 100 (38.9%) |
| Total | 1,887 (77.5%) | 548 (22.5%) |
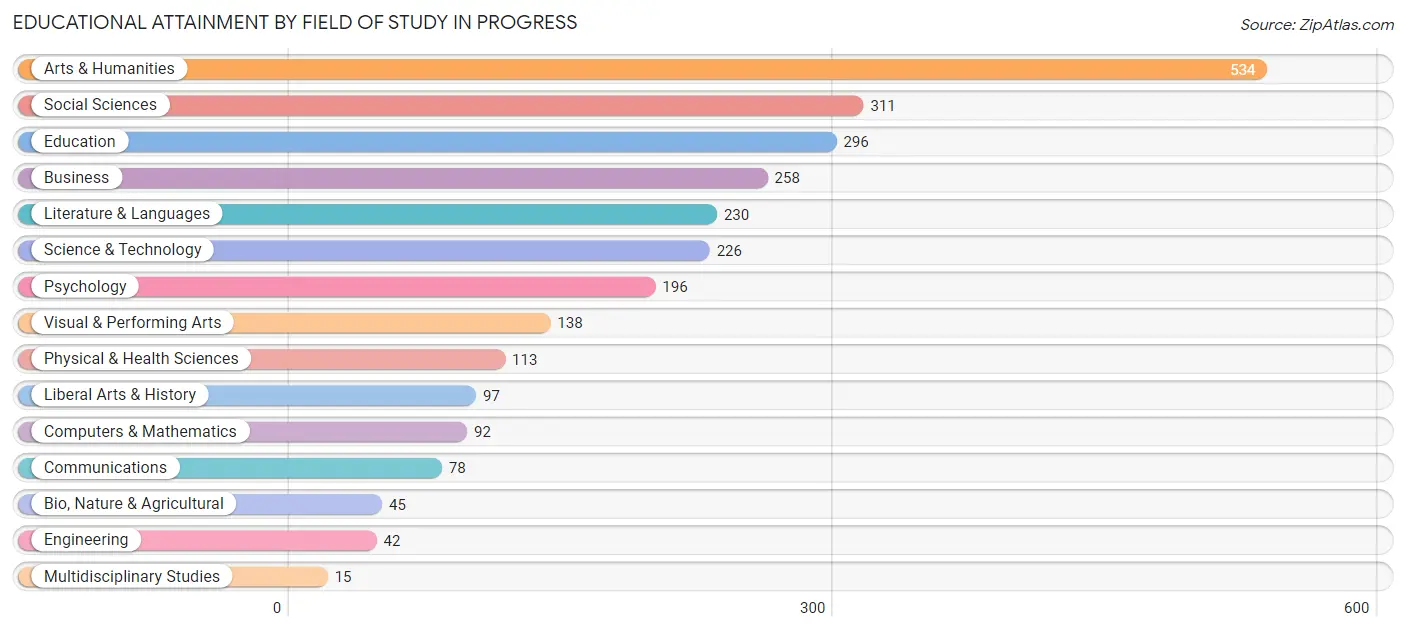
Educational Attainment by Field of Study in Progress
Arts & humanities (534 | 20.0%), social sciences (311 | 11.6%), education (296 | 11.1%), business (258 | 9.7%), and literature & languages (230 | 8.6%) are the most common fields of study among 2,671 individuals in Progress who have obtained a bachelor's degree or higher.
| Field of Study | # Graduates | % Graduates |
| Computers & Mathematics | 92 | 3.4% |
| Bio, Nature & Agricultural | 45 | 1.7% |
| Physical & Health Sciences | 113 | 4.2% |
| Psychology | 196 | 7.3% |
| Social Sciences | 311 | 11.6% |
| Engineering | 42 | 1.6% |
| Multidisciplinary Studies | 15 | 0.6% |
| Science & Technology | 226 | 8.5% |
| Business | 258 | 9.7% |
| Education | 296 | 11.1% |
| Literature & Languages | 230 | 8.6% |
| Liberal Arts & History | 97 | 3.6% |
| Visual & Performing Arts | 138 | 5.2% |
| Communications | 78 | 2.9% |
| Arts & Humanities | 534 | 20.0% |
| Total | 2,671 | 100.0% |
Transportation & Commute in Progress
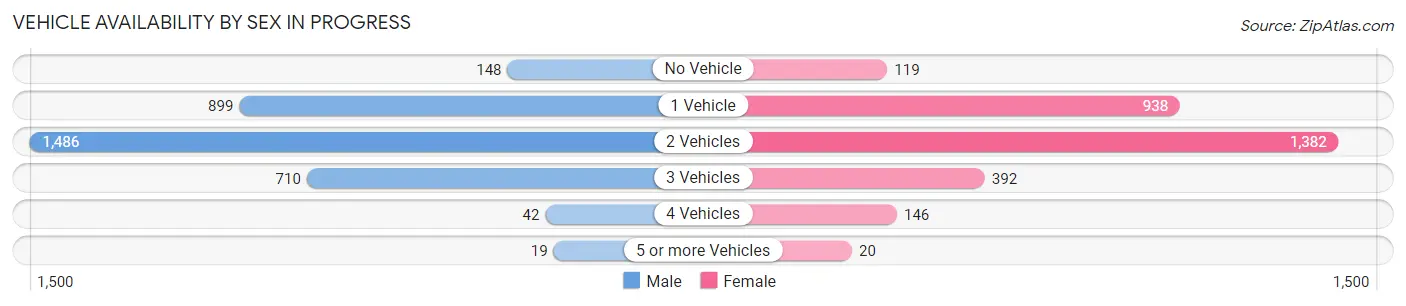
Vehicle Availability by Sex in Progress
The most prevalent vehicle ownership categories in Progress are males with 2 vehicles (1,486, accounting for 45.0%) and females with 2 vehicles (1,382, making up 49.6%).
| Vehicles Available | Male | Female |
| No Vehicle | 148 (4.5%) | 119 (4.0%) |
| 1 Vehicle | 899 (27.2%) | 938 (31.3%) |
| 2 Vehicles | 1,486 (45.0%) | 1,382 (46.1%) |
| 3 Vehicles | 710 (21.5%) | 392 (13.1%) |
| 4 Vehicles | 42 (1.3%) | 146 (4.9%) |
| 5 or more Vehicles | 19 (0.6%) | 20 (0.7%) |
| Total | 3,304 (100.0%) | 2,997 (100.0%) |
Commute Time in Progress
The most frequently occuring commute durations in Progress are 15 to 19 minutes (1,451 commuters, 26.0%), 10 to 14 minutes (1,025 commuters, 18.3%), and 30 to 34 minutes (709 commuters, 12.7%).
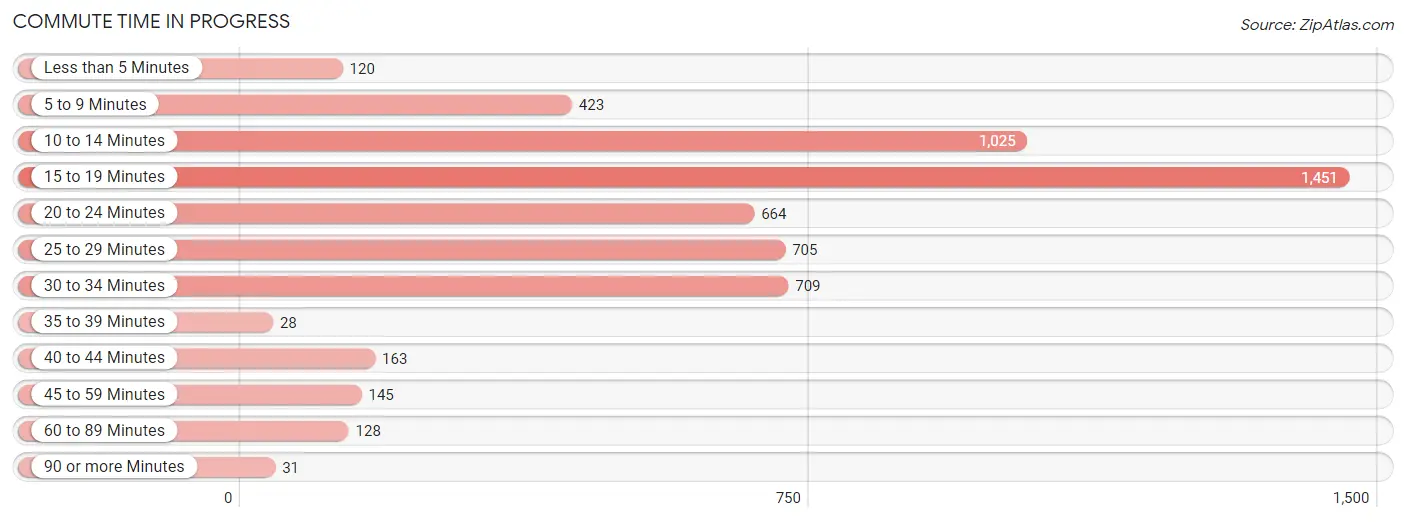
| Commute Time | # Commuters | % Commuters |
| Less than 5 Minutes | 120 | 2.1% |
| 5 to 9 Minutes | 423 | 7.6% |
| 10 to 14 Minutes | 1,025 | 18.3% |
| 15 to 19 Minutes | 1,451 | 26.0% |
| 20 to 24 Minutes | 664 | 11.9% |
| 25 to 29 Minutes | 705 | 12.6% |
| 30 to 34 Minutes | 709 | 12.7% |
| 35 to 39 Minutes | 28 | 0.5% |
| 40 to 44 Minutes | 163 | 2.9% |
| 45 to 59 Minutes | 145 | 2.6% |
| 60 to 89 Minutes | 128 | 2.3% |
| 90 or more Minutes | 31 | 0.5% |
Commute Time by Sex in Progress
The most common commute times in Progress are 15 to 19 minutes (706 commuters, 23.5%) for males and 15 to 19 minutes (745 commuters, 28.7%) for females.
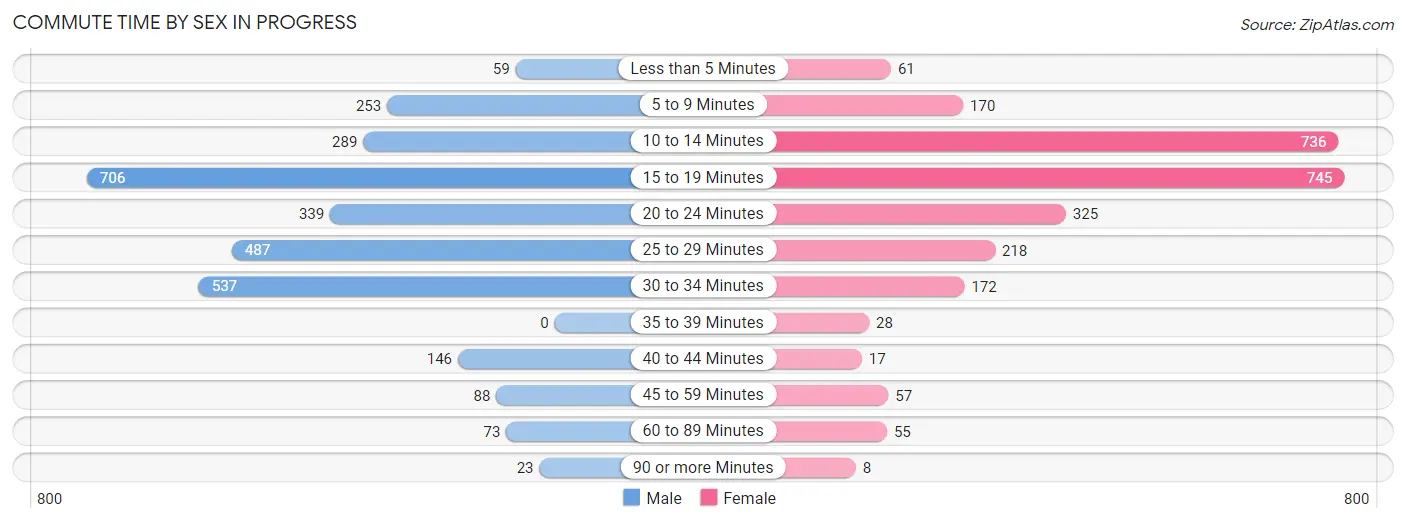
| Commute Time | Male | Female |
| Less than 5 Minutes | 59 (2.0%) | 61 (2.4%) |
| 5 to 9 Minutes | 253 (8.4%) | 170 (6.6%) |
| 10 to 14 Minutes | 289 (9.6%) | 736 (28.4%) |
| 15 to 19 Minutes | 706 (23.5%) | 745 (28.7%) |
| 20 to 24 Minutes | 339 (11.3%) | 325 (12.5%) |
| 25 to 29 Minutes | 487 (16.2%) | 218 (8.4%) |
| 30 to 34 Minutes | 537 (17.9%) | 172 (6.6%) |
| 35 to 39 Minutes | 0 (0.0%) | 28 (1.1%) |
| 40 to 44 Minutes | 146 (4.9%) | 17 (0.7%) |
| 45 to 59 Minutes | 88 (2.9%) | 57 (2.2%) |
| 60 to 89 Minutes | 73 (2.4%) | 55 (2.1%) |
| 90 or more Minutes | 23 (0.8%) | 8 (0.3%) |
Time of Departure to Work by Sex in Progress
The most frequent times of departure to work in Progress are 6:30 AM to 6:59 AM (484, 16.1%) for males and 7:00 AM to 7:29 AM (494, 19.1%) for females.
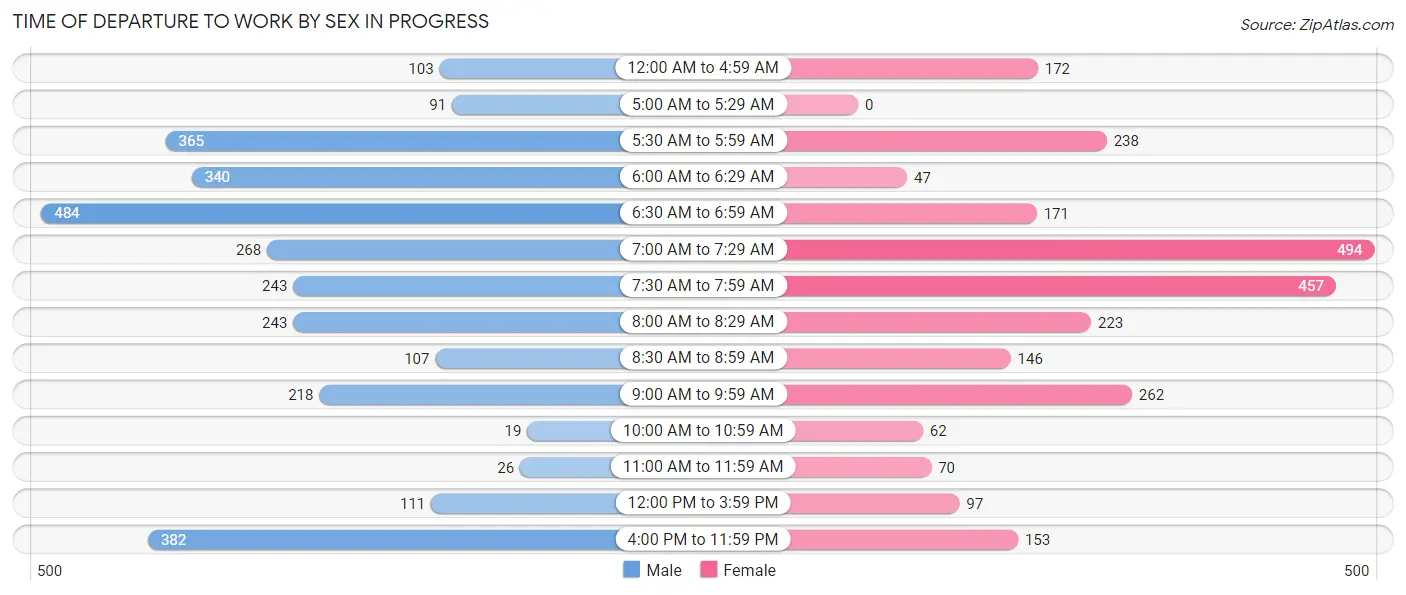
| Time of Departure | Male | Female |
| 12:00 AM to 4:59 AM | 103 (3.4%) | 172 (6.6%) |
| 5:00 AM to 5:29 AM | 91 (3.0%) | 0 (0.0%) |
| 5:30 AM to 5:59 AM | 365 (12.2%) | 238 (9.2%) |
| 6:00 AM to 6:29 AM | 340 (11.3%) | 47 (1.8%) |
| 6:30 AM to 6:59 AM | 484 (16.1%) | 171 (6.6%) |
| 7:00 AM to 7:29 AM | 268 (8.9%) | 494 (19.1%) |
| 7:30 AM to 7:59 AM | 243 (8.1%) | 457 (17.6%) |
| 8:00 AM to 8:29 AM | 243 (8.1%) | 223 (8.6%) |
| 8:30 AM to 8:59 AM | 107 (3.6%) | 146 (5.6%) |
| 9:00 AM to 9:59 AM | 218 (7.3%) | 262 (10.1%) |
| 10:00 AM to 10:59 AM | 19 (0.6%) | 62 (2.4%) |
| 11:00 AM to 11:59 AM | 26 (0.9%) | 70 (2.7%) |
| 12:00 PM to 3:59 PM | 111 (3.7%) | 97 (3.7%) |
| 4:00 PM to 11:59 PM | 382 (12.7%) | 153 (5.9%) |
| Total | 3,000 (100.0%) | 2,592 (100.0%) |
Housing Occupancy in Progress
Occupancy by Ownership in Progress
Of the total 4,680 dwellings in Progress, owner-occupied units account for 2,840 (60.7%), while renter-occupied units make up 1,840 (39.3%).
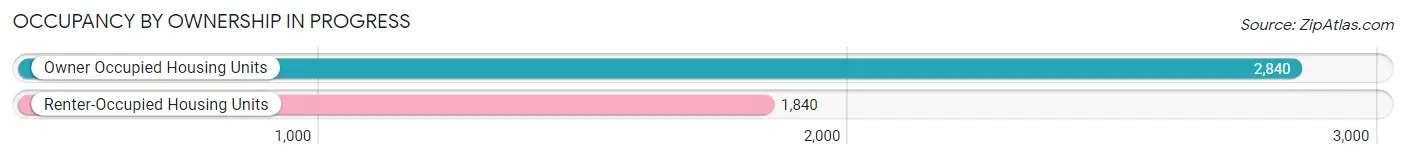
| Occupancy | # Housing Units | % Housing Units |
| Owner Occupied Housing Units | 2,840 | 60.7% |
| Renter-Occupied Housing Units | 1,840 | 39.3% |
| Total Occupied Housing Units | 4,680 | 100.0% |
Occupancy by Household Size in Progress
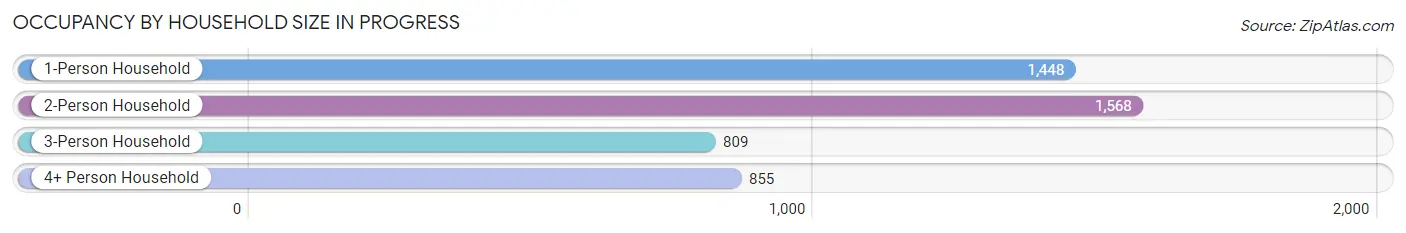
| Household Size | # Housing Units | % Housing Units |
| 1-Person Household | 1,448 | 30.9% |
| 2-Person Household | 1,568 | 33.5% |
| 3-Person Household | 809 | 17.3% |
| 4+ Person Household | 855 | 18.3% |
| Total Housing Units | 4,680 | 100.0% |
Occupancy by Ownership by Household Size in Progress
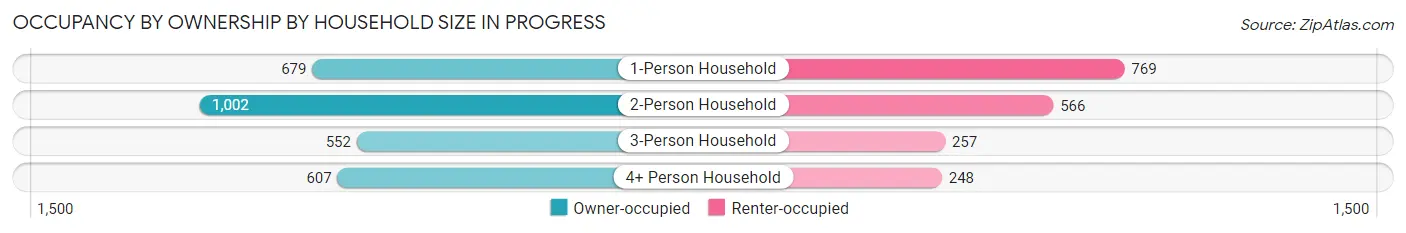
| Household Size | Owner-occupied | Renter-occupied |
| 1-Person Household | 679 (46.9%) | 769 (53.1%) |
| 2-Person Household | 1,002 (63.9%) | 566 (36.1%) |
| 3-Person Household | 552 (68.2%) | 257 (31.8%) |
| 4+ Person Household | 607 (71.0%) | 248 (29.0%) |
| Total Housing Units | 2,840 (60.7%) | 1,840 (39.3%) |
Occupancy by Educational Attainment in Progress
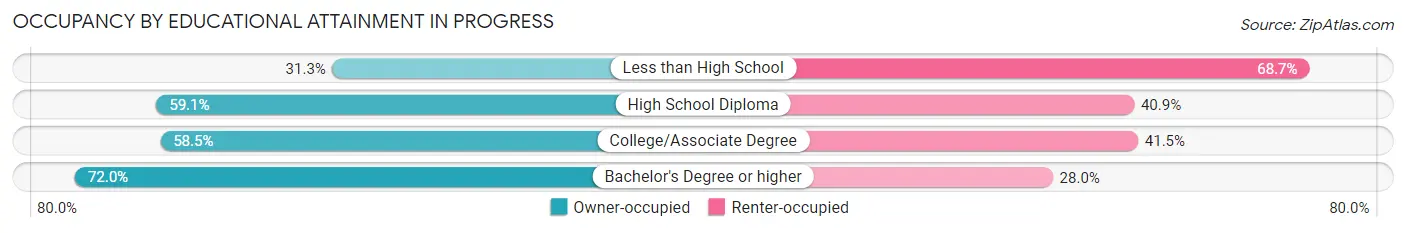
| Household Size | Owner-occupied | Renter-occupied |
| Less than High School | 154 (31.3%) | 338 (68.7%) |
| High School Diploma | 895 (59.1%) | 619 (40.9%) |
| College/Associate Degree | 582 (58.5%) | 413 (41.5%) |
| Bachelor's Degree or higher | 1,209 (72.0%) | 470 (28.0%) |
Occupancy by Age of Householder in Progress
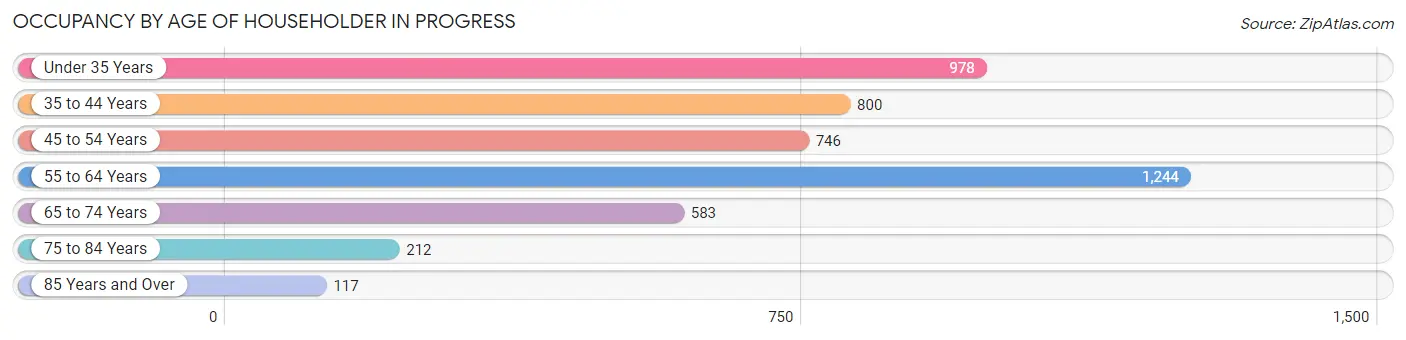
| Age Bracket | # Households | % Households |
| Under 35 Years | 978 | 20.9% |
| 35 to 44 Years | 800 | 17.1% |
| 45 to 54 Years | 746 | 15.9% |
| 55 to 64 Years | 1,244 | 26.6% |
| 65 to 74 Years | 583 | 12.5% |
| 75 to 84 Years | 212 | 4.5% |
| 85 Years and Over | 117 | 2.5% |
| Total | 4,680 | 100.0% |
Housing Finances in Progress
Median Income by Occupancy in Progress
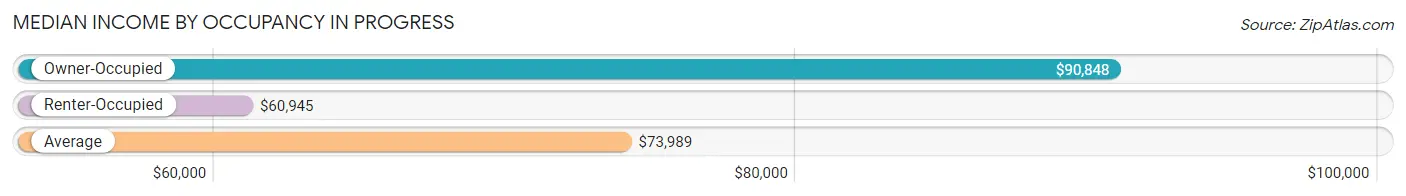
| Occupancy Type | # Households | Median Income |
| Owner-Occupied | 2,840 (60.7%) | $90,848 |
| Renter-Occupied | 1,840 (39.3%) | $60,945 |
| Average | 4,680 (100.0%) | $73,989 |
Occupancy by Householder Income Bracket in Progress
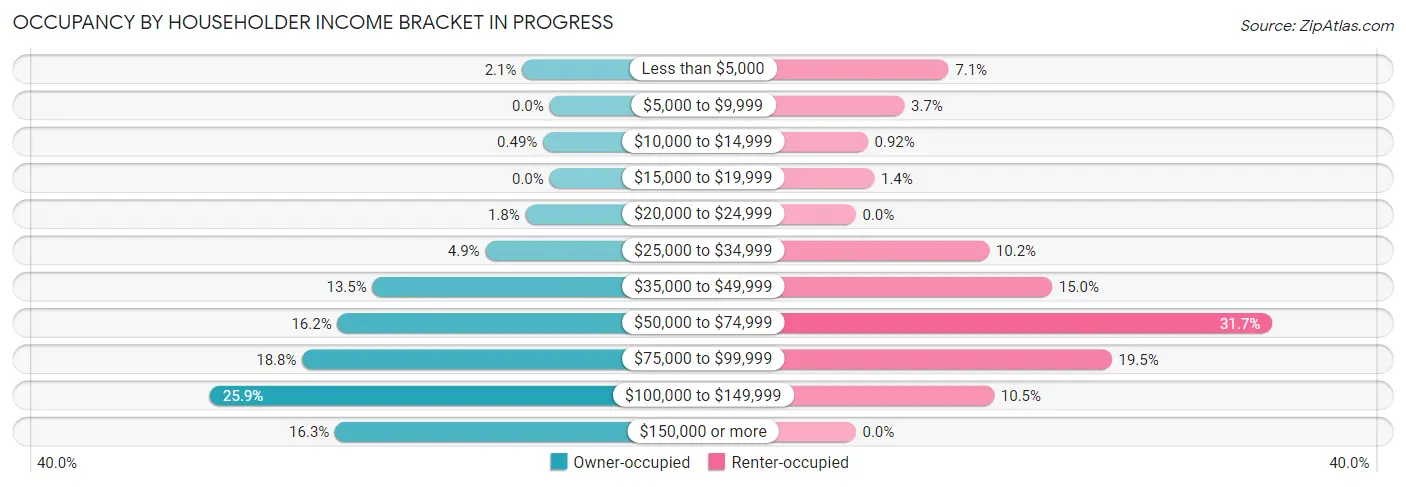
| Income Bracket | Owner-occupied | Renter-occupied |
| Less than $5,000 | 59 (2.1%) | 130 (7.1%) |
| $5,000 to $9,999 | 0 (0.0%) | 68 (3.7%) |
| $10,000 to $14,999 | 14 (0.5%) | 17 (0.9%) |
| $15,000 to $19,999 | 0 (0.0%) | 26 (1.4%) |
| $20,000 to $24,999 | 52 (1.8%) | 0 (0.0%) |
| $25,000 to $34,999 | 139 (4.9%) | 187 (10.2%) |
| $35,000 to $49,999 | 383 (13.5%) | 275 (14.9%) |
| $50,000 to $74,999 | 459 (16.2%) | 584 (31.7%) |
| $75,000 to $99,999 | 535 (18.8%) | 359 (19.5%) |
| $100,000 to $149,999 | 735 (25.9%) | 194 (10.5%) |
| $150,000 or more | 464 (16.3%) | 0 (0.0%) |
| Total | 2,840 (100.0%) | 1,840 (100.0%) |
Monthly Housing Cost Tiers in Progress
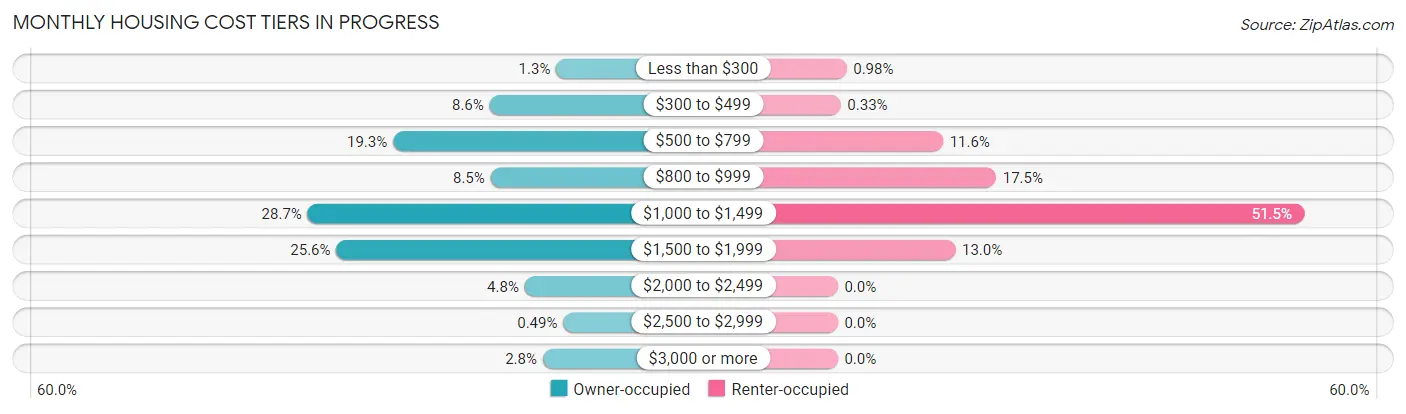
| Monthly Cost | Owner-occupied | Renter-occupied |
| Less than $300 | 36 (1.3%) | 18 (1.0%) |
| $300 to $499 | 245 (8.6%) | 6 (0.3%) |
| $500 to $799 | 548 (19.3%) | 214 (11.6%) |
| $800 to $999 | 242 (8.5%) | 322 (17.5%) |
| $1,000 to $1,499 | 816 (28.7%) | 948 (51.5%) |
| $1,500 to $1,999 | 726 (25.6%) | 239 (13.0%) |
| $2,000 to $2,499 | 135 (4.8%) | 0 (0.0%) |
| $2,500 to $2,999 | 14 (0.5%) | 0 (0.0%) |
| $3,000 or more | 78 (2.8%) | 0 (0.0%) |
| Total | 2,840 (100.0%) | 1,840 (100.0%) |
Physical Housing Characteristics in Progress
Housing Structures in Progress
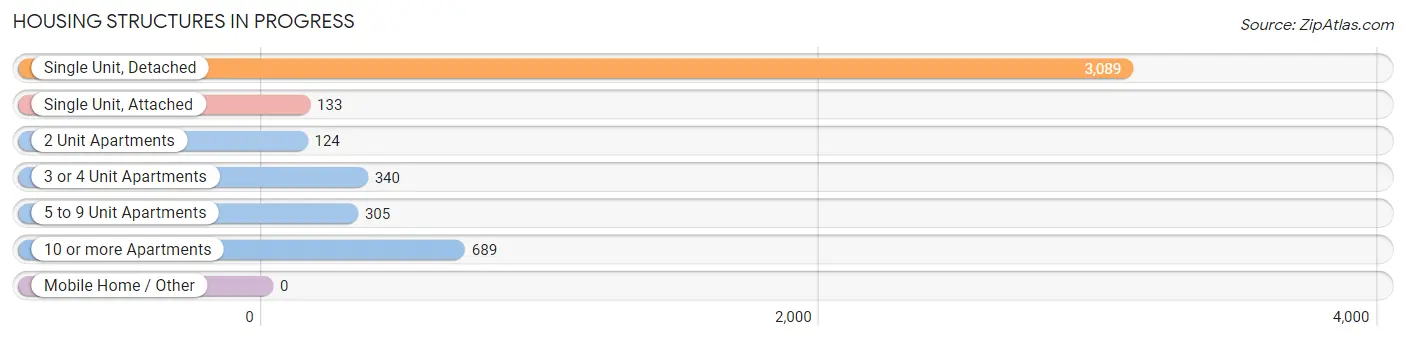
| Structure Type | # Housing Units | % Housing Units |
| Single Unit, Detached | 3,089 | 66.0% |
| Single Unit, Attached | 133 | 2.8% |
| 2 Unit Apartments | 124 | 2.6% |
| 3 or 4 Unit Apartments | 340 | 7.3% |
| 5 to 9 Unit Apartments | 305 | 6.5% |
| 10 or more Apartments | 689 | 14.7% |
| Mobile Home / Other | 0 | 0.0% |
| Total | 4,680 | 100.0% |
Housing Structures by Occupancy in Progress
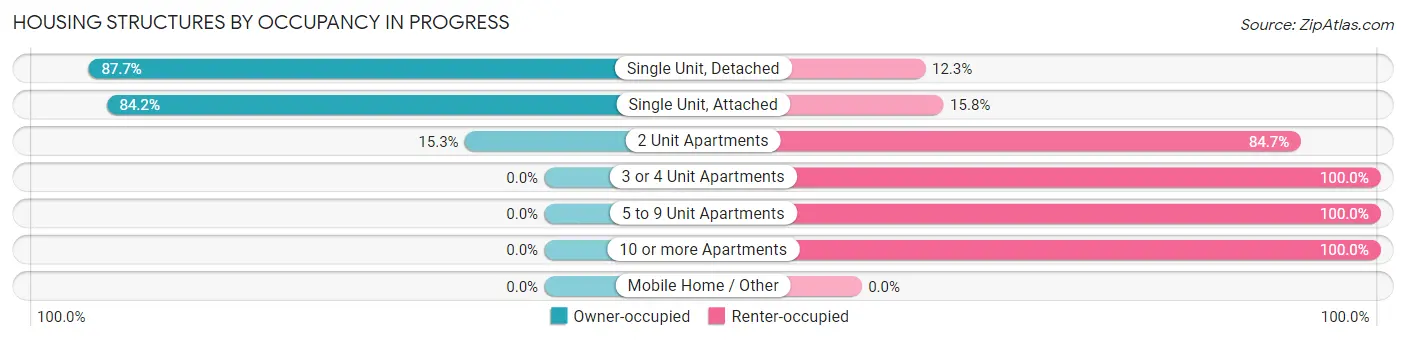
| Structure Type | Owner-occupied | Renter-occupied |
| Single Unit, Detached | 2,709 (87.7%) | 380 (12.3%) |
| Single Unit, Attached | 112 (84.2%) | 21 (15.8%) |
| 2 Unit Apartments | 19 (15.3%) | 105 (84.7%) |
| 3 or 4 Unit Apartments | 0 (0.0%) | 340 (100.0%) |
| 5 to 9 Unit Apartments | 0 (0.0%) | 305 (100.0%) |
| 10 or more Apartments | 0 (0.0%) | 689 (100.0%) |
| Mobile Home / Other | 0 (0.0%) | 0 (0.0%) |
| Total | 2,840 (60.7%) | 1,840 (39.3%) |
Housing Structures by Number of Rooms in Progress
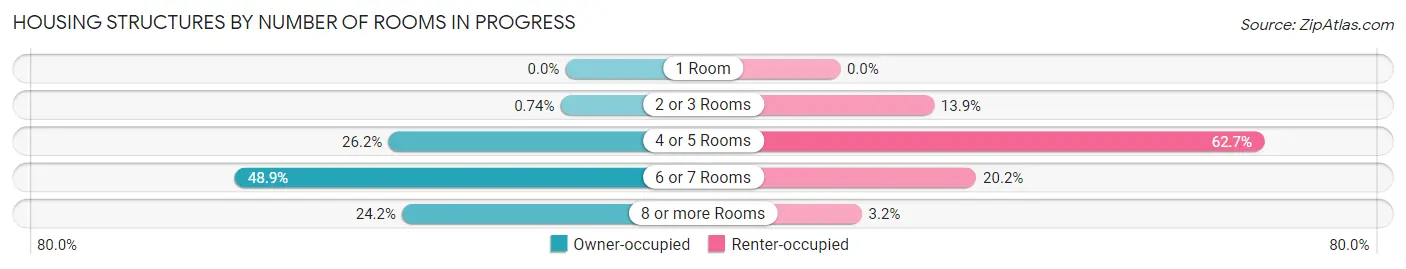
| Number of Rooms | Owner-occupied | Renter-occupied |
| 1 Room | 0 (0.0%) | 0 (0.0%) |
| 2 or 3 Rooms | 21 (0.7%) | 256 (13.9%) |
| 4 or 5 Rooms | 744 (26.2%) | 1,154 (62.7%) |
| 6 or 7 Rooms | 1,388 (48.9%) | 371 (20.2%) |
| 8 or more Rooms | 687 (24.2%) | 59 (3.2%) |
| Total | 2,840 (100.0%) | 1,840 (100.0%) |
Housing Structure by Heating Type in Progress
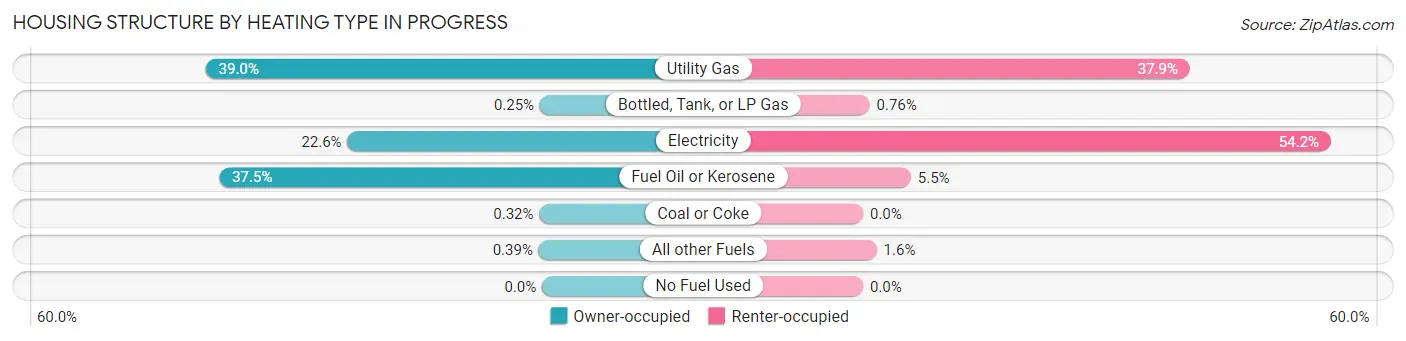
| Heating Type | Owner-occupied | Renter-occupied |
| Utility Gas | 1,108 (39.0%) | 697 (37.9%) |
| Bottled, Tank, or LP Gas | 7 (0.3%) | 14 (0.8%) |
| Electricity | 641 (22.6%) | 998 (54.2%) |
| Fuel Oil or Kerosene | 1,064 (37.5%) | 102 (5.5%) |
| Coal or Coke | 9 (0.3%) | 0 (0.0%) |
| All other Fuels | 11 (0.4%) | 29 (1.6%) |
| No Fuel Used | 0 (0.0%) | 0 (0.0%) |
| Total | 2,840 (100.0%) | 1,840 (100.0%) |
Household Vehicle Usage in Progress
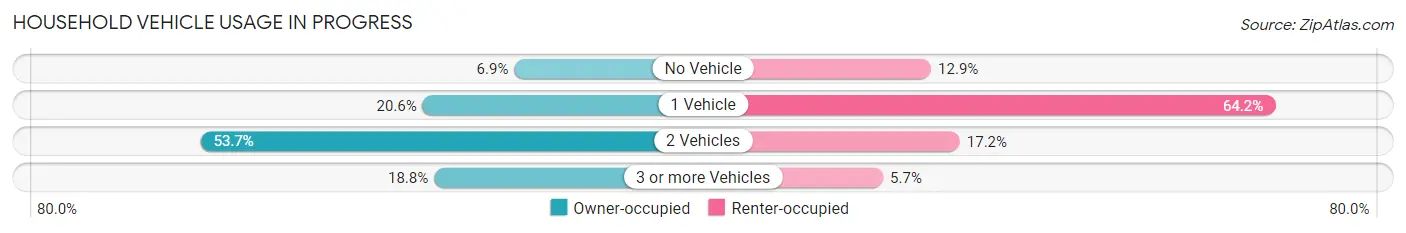
| Vehicles per Household | Owner-occupied | Renter-occupied |
| No Vehicle | 195 (6.9%) | 237 (12.9%) |
| 1 Vehicle | 584 (20.6%) | 1,182 (64.2%) |
| 2 Vehicles | 1,526 (53.7%) | 316 (17.2%) |
| 3 or more Vehicles | 535 (18.8%) | 105 (5.7%) |
| Total | 2,840 (100.0%) | 1,840 (100.0%) |
Real Estate & Mortgages in Progress
Real Estate and Mortgage Overview in Progress
| Characteristic | Without Mortgage | With Mortgage |
| Housing Units | 885 | 1,955 |
| Median Property Value | $171,700 | $174,300 |
| Median Household Income | $69,250 | $394 |
| Monthly Housing Costs | $601 | $78 |
| Real Estate Taxes | $2,763 | $13 |
Property Value by Mortgage Status in Progress
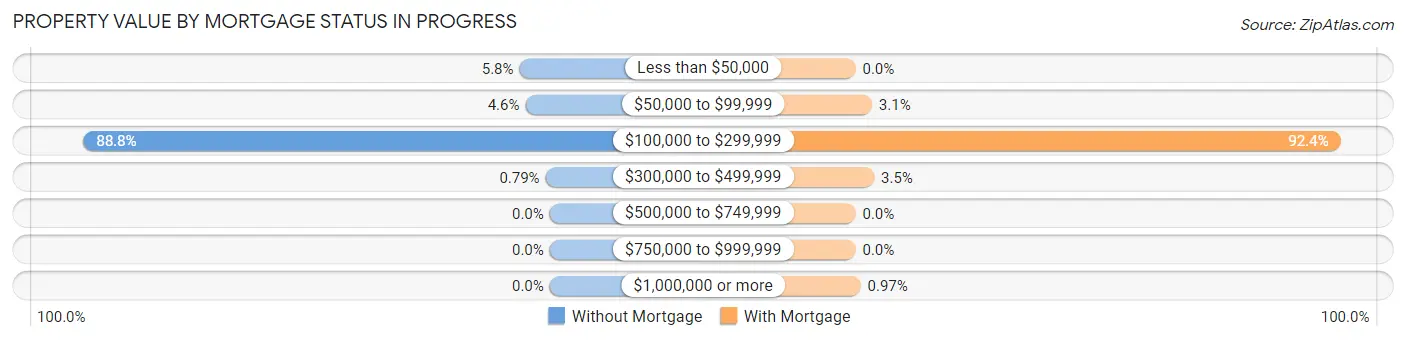
| Property Value | Without Mortgage | With Mortgage |
| Less than $50,000 | 51 (5.8%) | 0 (0.0%) |
| $50,000 to $99,999 | 41 (4.6%) | 61 (3.1%) |
| $100,000 to $299,999 | 786 (88.8%) | 1,806 (92.4%) |
| $300,000 to $499,999 | 7 (0.8%) | 69 (3.5%) |
| $500,000 to $749,999 | 0 (0.0%) | 0 (0.0%) |
| $750,000 to $999,999 | 0 (0.0%) | 0 (0.0%) |
| $1,000,000 or more | 0 (0.0%) | 19 (1.0%) |
| Total | 885 (100.0%) | 1,955 (100.0%) |
Household Income by Mortgage Status in Progress
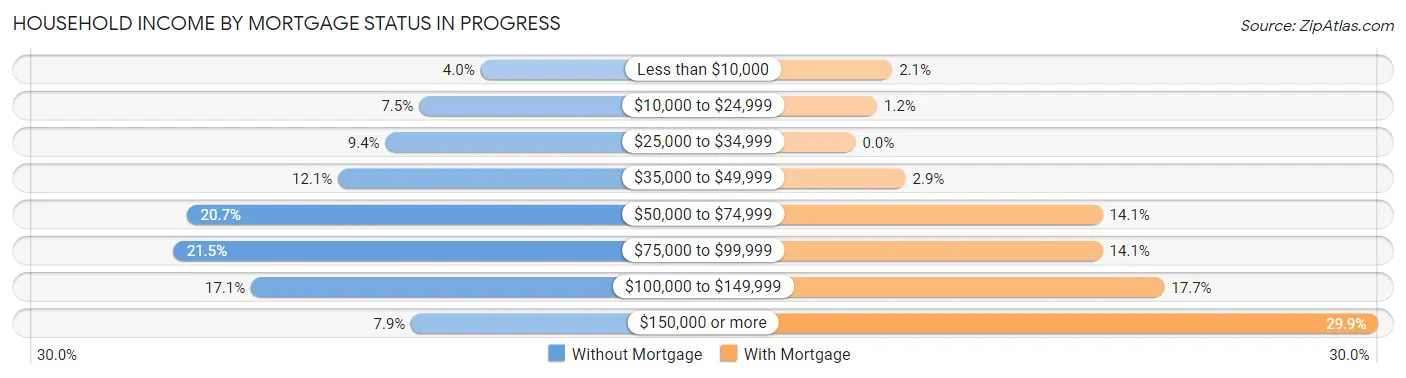
| Household Income | Without Mortgage | With Mortgage |
| Less than $10,000 | 35 (4.0%) | 41 (2.1%) |
| $10,000 to $24,999 | 66 (7.5%) | 24 (1.2%) |
| $25,000 to $34,999 | 83 (9.4%) | 0 (0.0%) |
| $35,000 to $49,999 | 107 (12.1%) | 56 (2.9%) |
| $50,000 to $74,999 | 183 (20.7%) | 276 (14.1%) |
| $75,000 to $99,999 | 190 (21.5%) | 276 (14.1%) |
| $100,000 to $149,999 | 151 (17.1%) | 345 (17.6%) |
| $150,000 or more | 70 (7.9%) | 584 (29.9%) |
| Total | 885 (100.0%) | 1,955 (100.0%) |
Property Value to Household Income Ratio in Progress
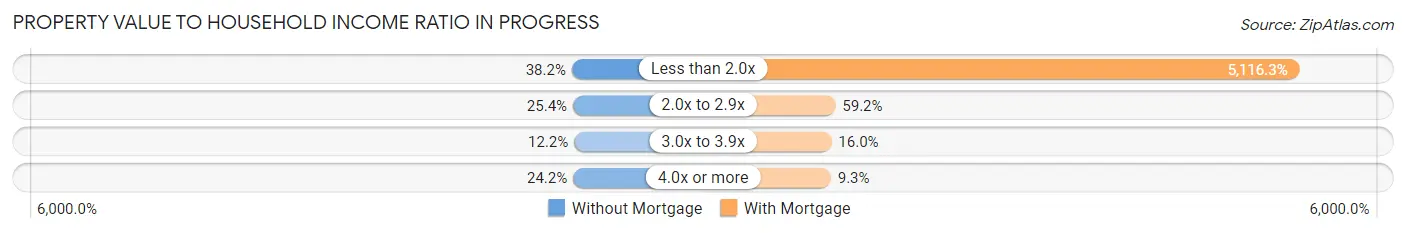
| Value-to-Income Ratio | Without Mortgage | With Mortgage |
| Less than 2.0x | 338 (38.2%) | 100,024 (5,116.3%) |
| 2.0x to 2.9x | 225 (25.4%) | 1,157 (59.2%) |
| 3.0x to 3.9x | 108 (12.2%) | 313 (16.0%) |
| 4.0x or more | 214 (24.2%) | 181 (9.3%) |
| Total | 885 (100.0%) | 1,955 (100.0%) |
Real Estate Taxes by Mortgage Status in Progress
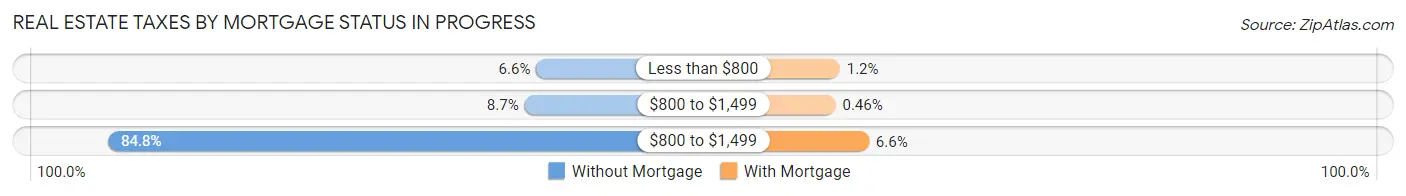
| Property Taxes | Without Mortgage | With Mortgage |
| Less than $800 | 58 (6.6%) | 24 (1.2%) |
| $800 to $1,499 | 77 (8.7%) | 9 (0.5%) |
| $800 to $1,499 | 750 (84.8%) | 128 (6.6%) |
| Total | 885 (100.0%) | 1,955 (100.0%) |
Health & Disability in Progress
Health Insurance Coverage by Age in Progress
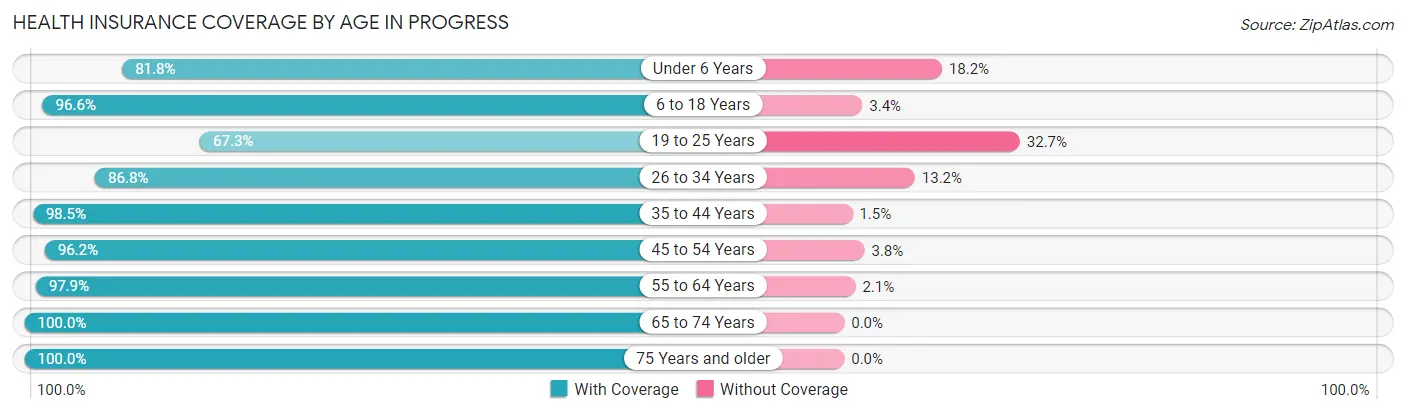
| Age Bracket | With Coverage | Without Coverage |
| Under 6 Years | 822 (81.8%) | 183 (18.2%) |
| 6 to 18 Years | 1,778 (96.6%) | 62 (3.4%) |
| 19 to 25 Years | 1,064 (67.3%) | 518 (32.7%) |
| 26 to 34 Years | 904 (86.8%) | 137 (13.2%) |
| 35 to 44 Years | 1,358 (98.5%) | 21 (1.5%) |
| 45 to 54 Years | 1,226 (96.2%) | 48 (3.8%) |
| 55 to 64 Years | 1,690 (97.9%) | 36 (2.1%) |
| 65 to 74 Years | 997 (100.0%) | 0 (0.0%) |
| 75 Years and older | 488 (100.0%) | 0 (0.0%) |
| Total | 10,327 (91.1%) | 1,005 (8.9%) |
Health Insurance Coverage by Citizenship Status in Progress
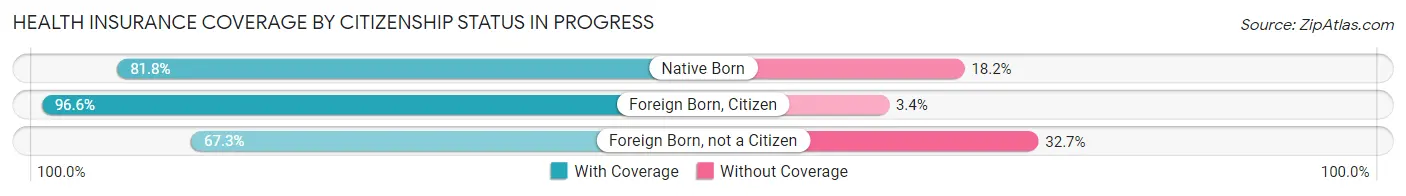
| Citizenship Status | With Coverage | Without Coverage |
| Native Born | 822 (81.8%) | 183 (18.2%) |
| Foreign Born, Citizen | 1,778 (96.6%) | 62 (3.4%) |
| Foreign Born, not a Citizen | 1,064 (67.3%) | 518 (32.7%) |
Health Insurance Coverage by Household Income in Progress
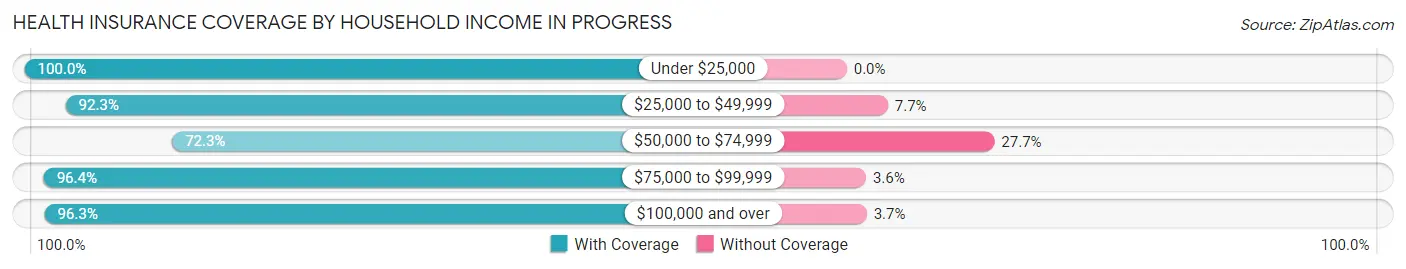
| Household Income | With Coverage | Without Coverage |
| Under $25,000 | 609 (100.0%) | 0 (0.0%) |
| $25,000 to $49,999 | 1,932 (92.3%) | 161 (7.7%) |
| $50,000 to $74,999 | 1,590 (72.3%) | 608 (27.7%) |
| $75,000 to $99,999 | 2,310 (96.4%) | 86 (3.6%) |
| $100,000 and over | 3,870 (96.3%) | 150 (3.7%) |
Public vs Private Health Insurance Coverage by Age in Progress
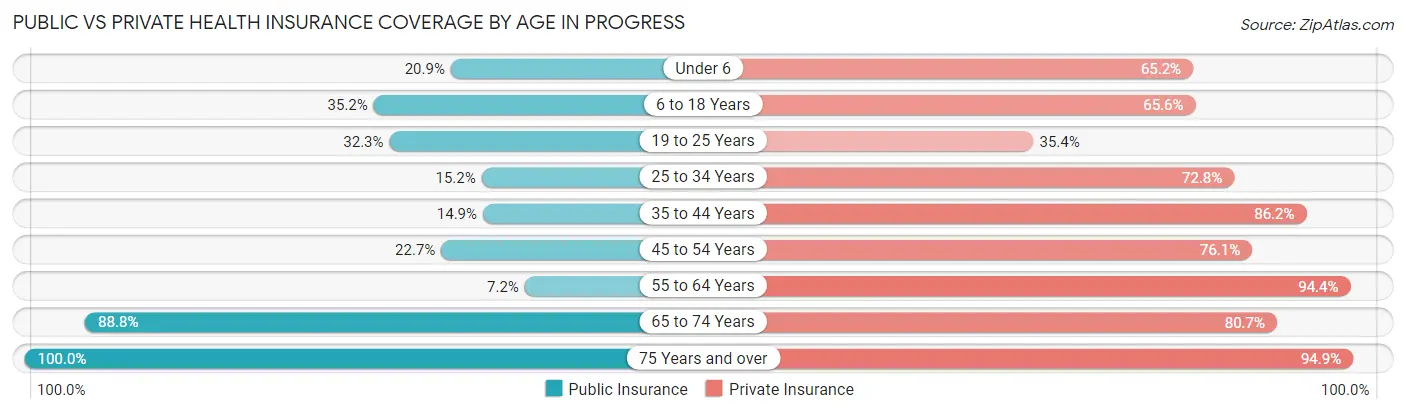
| Age Bracket | Public Insurance | Private Insurance |
| Under 6 | 210 (20.9%) | 655 (65.2%) |
| 6 to 18 Years | 648 (35.2%) | 1,207 (65.6%) |
| 19 to 25 Years | 511 (32.3%) | 560 (35.4%) |
| 25 to 34 Years | 158 (15.2%) | 758 (72.8%) |
| 35 to 44 Years | 206 (14.9%) | 1,189 (86.2%) |
| 45 to 54 Years | 289 (22.7%) | 970 (76.1%) |
| 55 to 64 Years | 124 (7.2%) | 1,629 (94.4%) |
| 65 to 74 Years | 885 (88.8%) | 805 (80.7%) |
| 75 Years and over | 488 (100.0%) | 463 (94.9%) |
| Total | 3,519 (31.0%) | 8,236 (72.7%) |
Disability Status by Sex by Age in Progress
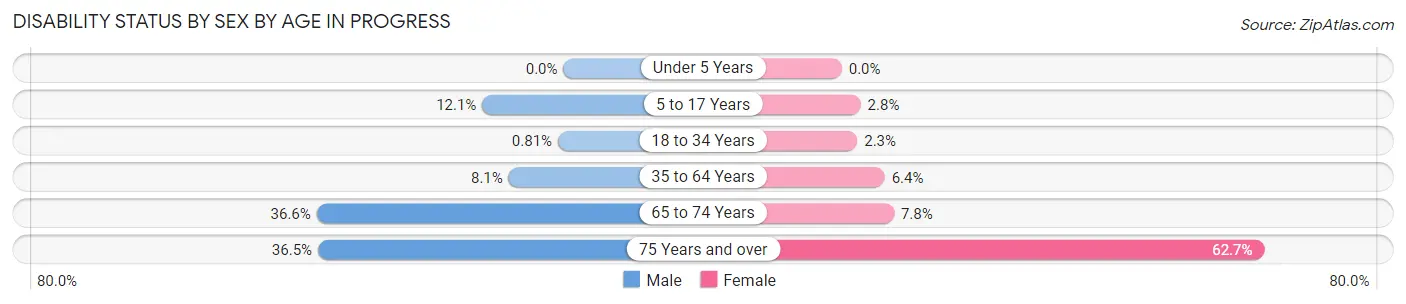
| Age Bracket | Male | Female |
| Under 5 Years | 0 (0.0%) | 0 (0.0%) |
| 5 to 17 Years | 116 (12.0%) | 28 (2.8%) |
| 18 to 34 Years | 11 (0.8%) | 30 (2.3%) |
| 35 to 64 Years | 162 (8.1%) | 152 (6.4%) |
| 65 to 74 Years | 214 (36.6%) | 32 (7.7%) |
| 75 Years and over | 39 (36.4%) | 239 (62.7%) |
Disability Class by Sex by Age in Progress
Disability Class: Hearing Difficulty
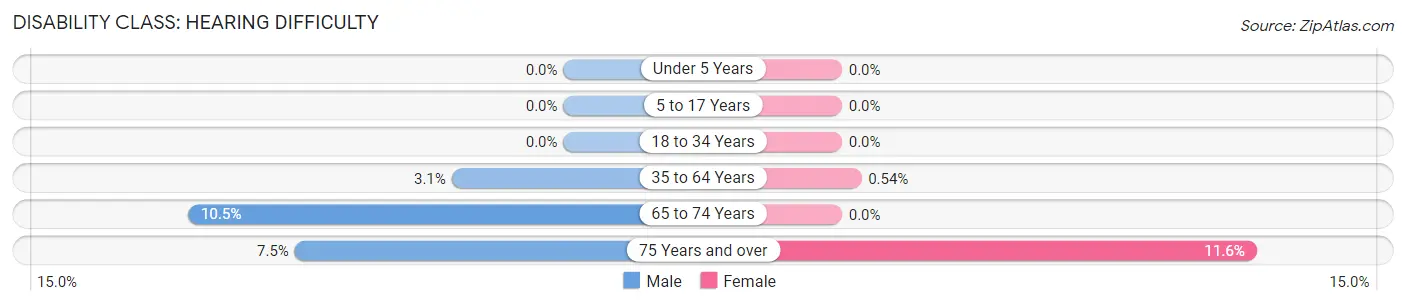
| Age Bracket | Male | Female |
| Under 5 Years | 0 (0.0%) | 0 (0.0%) |
| 5 to 17 Years | 0 (0.0%) | 0 (0.0%) |
| 18 to 34 Years | 0 (0.0%) | 0 (0.0%) |
| 35 to 64 Years | 62 (3.1%) | 13 (0.5%) |
| 65 to 74 Years | 61 (10.4%) | 0 (0.0%) |
| 75 Years and over | 8 (7.5%) | 44 (11.6%) |
Disability Class: Vision Difficulty
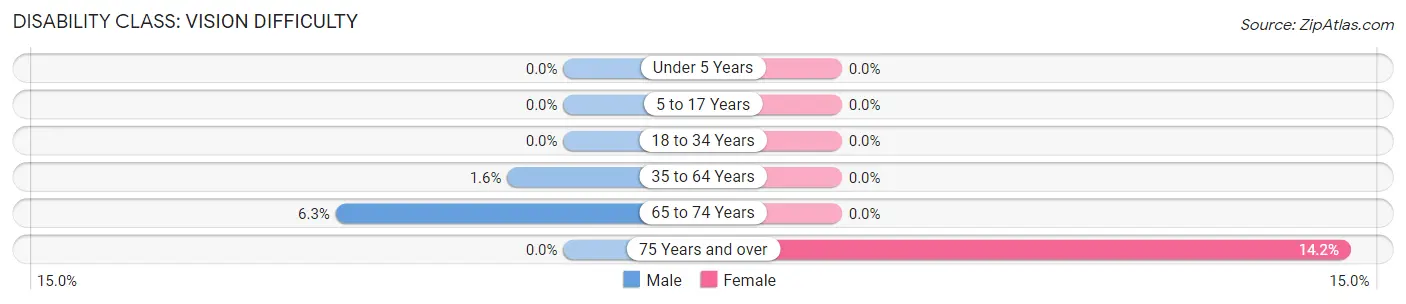
| Age Bracket | Male | Female |
| Under 5 Years | 0 (0.0%) | 0 (0.0%) |
| 5 to 17 Years | 0 (0.0%) | 0 (0.0%) |
| 18 to 34 Years | 0 (0.0%) | 0 (0.0%) |
| 35 to 64 Years | 31 (1.6%) | 0 (0.0%) |
| 65 to 74 Years | 37 (6.3%) | 0 (0.0%) |
| 75 Years and over | 0 (0.0%) | 54 (14.2%) |
Disability Class: Cognitive Difficulty
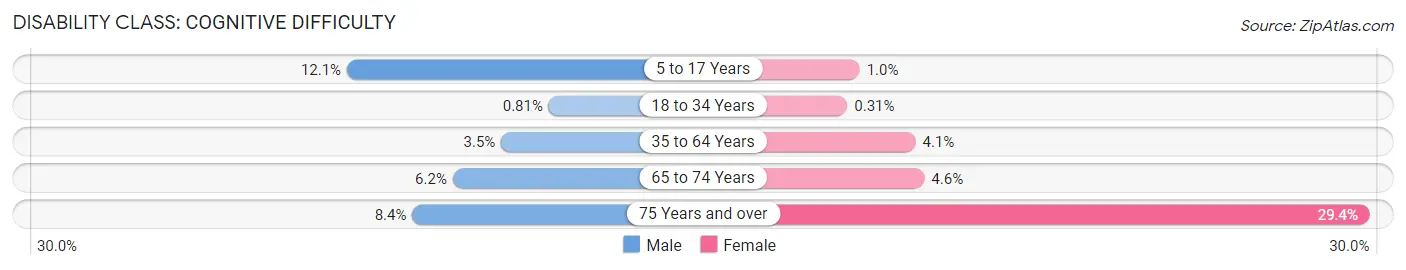
| Age Bracket | Male | Female |
| 5 to 17 Years | 116 (12.0%) | 10 (1.0%) |
| 18 to 34 Years | 11 (0.8%) | 4 (0.3%) |
| 35 to 64 Years | 69 (3.5%) | 98 (4.1%) |
| 65 to 74 Years | 36 (6.2%) | 19 (4.6%) |
| 75 Years and over | 9 (8.4%) | 112 (29.4%) |
Disability Class: Ambulatory Difficulty
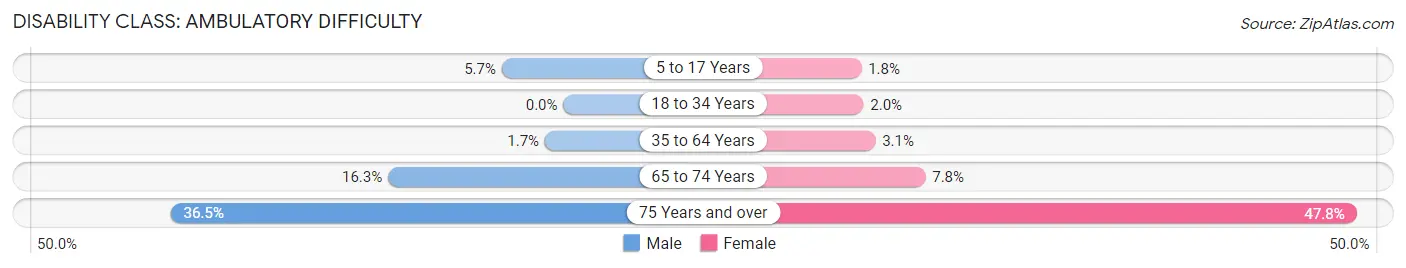
| Age Bracket | Male | Female |
| 5 to 17 Years | 55 (5.7%) | 18 (1.8%) |
| 18 to 34 Years | 0 (0.0%) | 26 (2.0%) |
| 35 to 64 Years | 34 (1.7%) | 74 (3.1%) |
| 65 to 74 Years | 95 (16.3%) | 32 (7.7%) |
| 75 Years and over | 39 (36.4%) | 182 (47.8%) |
Disability Class: Self-Care Difficulty
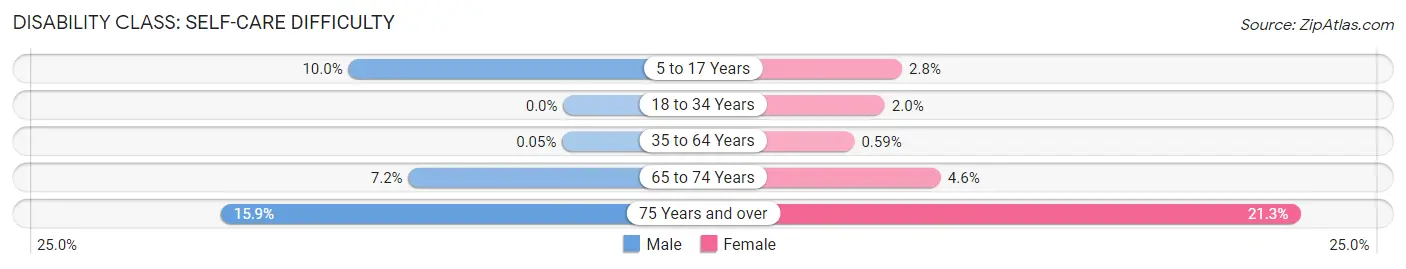
| Age Bracket | Male | Female |
| 5 to 17 Years | 96 (10.0%) | 28 (2.8%) |
| 18 to 34 Years | 0 (0.0%) | 26 (2.0%) |
| 35 to 64 Years | 1 (0.1%) | 14 (0.6%) |
| 65 to 74 Years | 42 (7.2%) | 19 (4.6%) |
| 75 Years and over | 17 (15.9%) | 81 (21.3%) |
Technology Access in Progress
Computing Device Access in Progress
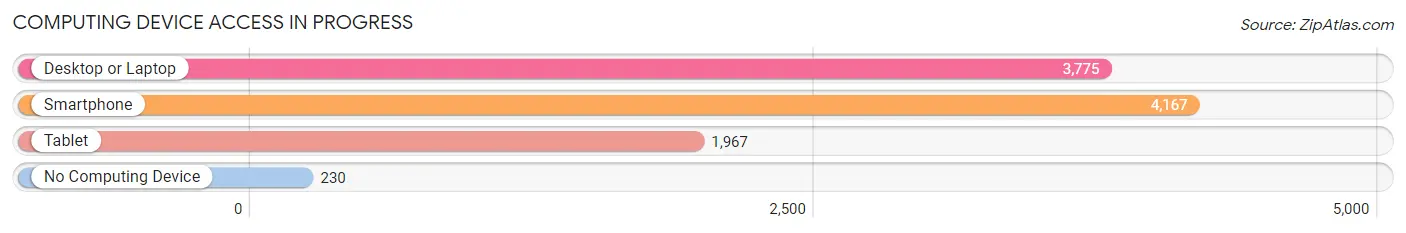
| Device Type | # Households | % Households |
| Desktop or Laptop | 3,775 | 80.7% |
| Smartphone | 4,167 | 89.0% |
| Tablet | 1,967 | 42.0% |
| No Computing Device | 230 | 4.9% |
| Total | 4,680 | 100.0% |
Internet Access in Progress
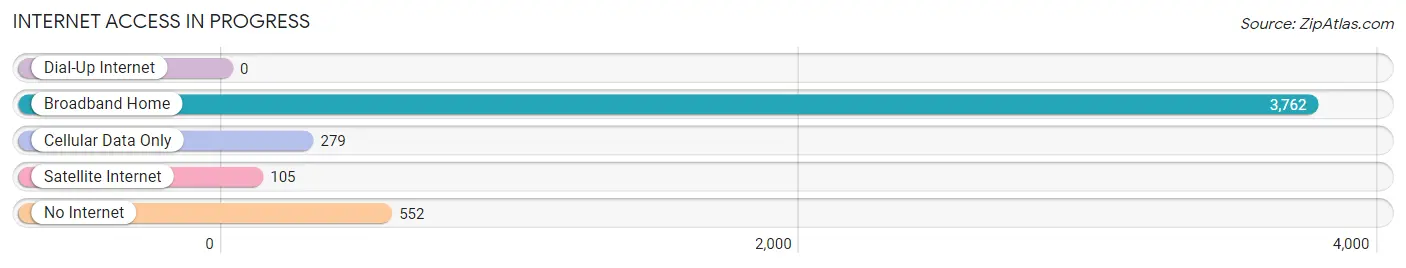
| Internet Type | # Households | % Households |
| Dial-Up Internet | 0 | 0.0% |
| Broadband Home | 3,762 | 80.4% |
| Cellular Data Only | 279 | 6.0% |
| Satellite Internet | 105 | 2.2% |
| No Internet | 552 | 11.8% |
| Total | 4,680 | 100.0% |
Progress Summary
Pennsylvania is a state located in the Northeastern and Mid-Atlantic regions of the United States. It is the 33rd most populous state in the country, with a population of 12,801,989 as of 2019. Pennsylvania is bordered by New York, New Jersey, Delaware, Maryland, West Virginia, and Ohio. The state has a diverse geography, with the Appalachian Mountains in the west, the Great Lakes in the north, and the Atlantic Ocean in the east.
History
The history of Pennsylvania dates back to the 16th century, when the area was first explored by Europeans. The first permanent European settlement in the area was established by William Penn in 1681. Penn was granted a charter by King Charles II of England to establish a colony in the area. Penn named the colony Pennsylvania, after his father, Admiral William Penn.
Pennsylvania was one of the original thirteen colonies that declared independence from Great Britain in 1776. During the Revolutionary War, Pennsylvania was a major center of activity, with the Battle of Brandywine and the Battle of Germantown both taking place in the state. After the war, Pennsylvania became the second state to ratify the United States Constitution in 1787.
Geography
Pennsylvania is located in the Northeastern and Mid-Atlantic regions of the United States. It is bordered by New York, New Jersey, Delaware, Maryland, West Virginia, and Ohio. The state has a total area of 46,055 square miles, making it the 33rd largest state in the country.
Pennsylvania has a diverse geography, with the Appalachian Mountains in the west, the Great Lakes in the north, and the Atlantic Ocean in the east. The state is home to numerous rivers, including the Susquehanna, Delaware, and Allegheny. The state also has numerous lakes, including Lake Erie, Lake Wallenpaupack, and Lake Nockamixon.
Economy
The economy of Pennsylvania is diverse and includes a variety of industries. The state is a major producer of coal, natural gas, and oil. It is also a major producer of steel, aluminum, and other metals. Pennsylvania is home to numerous manufacturing companies, including Hershey, PPG Industries, and Armstrong World Industries.
The state is also a major agricultural producer, with dairy, poultry, and livestock being the main products. Pennsylvania is also home to numerous technology companies, including Oracle, IBM, and GlaxoSmithKline.
Demographics
As of 2019, the population of Pennsylvania was estimated to be 12,801,989. The state has a population density of 282 people per square mile, making it the sixth most densely populated state in the country.
The largest racial group in Pennsylvania is White, making up 81.2% of the population. The second largest racial group is Black or African American, making up 11.7% of the population. Other racial groups include Asian (3.7%), Hispanic or Latino (4.2%), and Native American (0.4%).
The median household income in Pennsylvania is $60,821, and the median home value is $179,400. The state has a poverty rate of 12.3%, and the unemployment rate is 4.2%.
Common Questions
What is the Total Population of Progress?
Total Population of Progress is 11,364.
What is the Total Male Population of Progress?
Total Male Population of Progress is 5,337.
What is the Total Female Population of Progress?
Total Female Population of Progress is 6,027.
What is the Ratio of Males per 100 Females in Progress?
There are 88.55 Males per 100 Females in Progress.
What is the Ratio of Females per 100 Males in Progress?
There are 112.93 Females per 100 Males in Progress.
What is the Median Population Age in Progress?
Median Population Age in Progress is 37.2 Years.
What is the Average Family Size in Progress
Average Family Size in Progress is 3.1 People.
What is the Average Household Size in Progress
Average Household Size in Progress is 2.4 People.
What is Per Capita Income in Progress?
Per Capita income in Progress is $33,814.
What is the Median Family Income in Progress?
Median Family Income in Progress is $82,083.
What is the Median Household income in Progress?
Median Household Income in Progress is $73,989.
What is Income or Wage Gap in Progress?
Income or Wage Gap in Progress is 25.0%.
Women in Progress earn 75.0 cents for every dollar earned by a man.
What is Inequality or Gini Index in Progress?
Inequality or Gini Index in Progress is 0.34.
How Large is the Labor Force in Progress?
There are 6,568 People in the Labor Forcein in Progress.
What is the Percentage of People in the Labor Force in Progress?
73.6% of People are in the Labor Force in Progress.
What is the Unemployment Rate in Progress?
Unemployment Rate in Progress is 2.2%.